project and production management module 6 product and process selection prof arun kanda & prof...
TRANSCRIPT
Project and Production Management
Module 6
Product and Process Selection
Prof Arun Kanda & Prof S.G. Deshmukh, Department of Mechanical Engineering,Indian Institute of Technology, Delhi
module 6: Product and Process Selection
Back to main index exit continue
MODULE 6: Product and Process Selection
1. Introducing New Products and Services
2. Economic Evaluation of Products and Services
3. Product Mix Decisions
4. Product and Process Selection
5. Illustrative Examples
6. Self Evaluation Quiz
7. Problems for Practice
8. Further exploration
module 6: Product and Process Selection
Back to main index exit
1. Introducing new Products and Services
module 6: Product and Process Selection
Back to main index exit back to module contents
SOURCES OF IDEAS FOR NEW PRODUCTS &
SERVICESCustomer need Marketing departmentProduction departmentDesign and DevelopmentVendors and subcontractorsTop managementNew technologiesChanging life styles
module 6: Product and Process Selection
Back to main index exit back to module contents
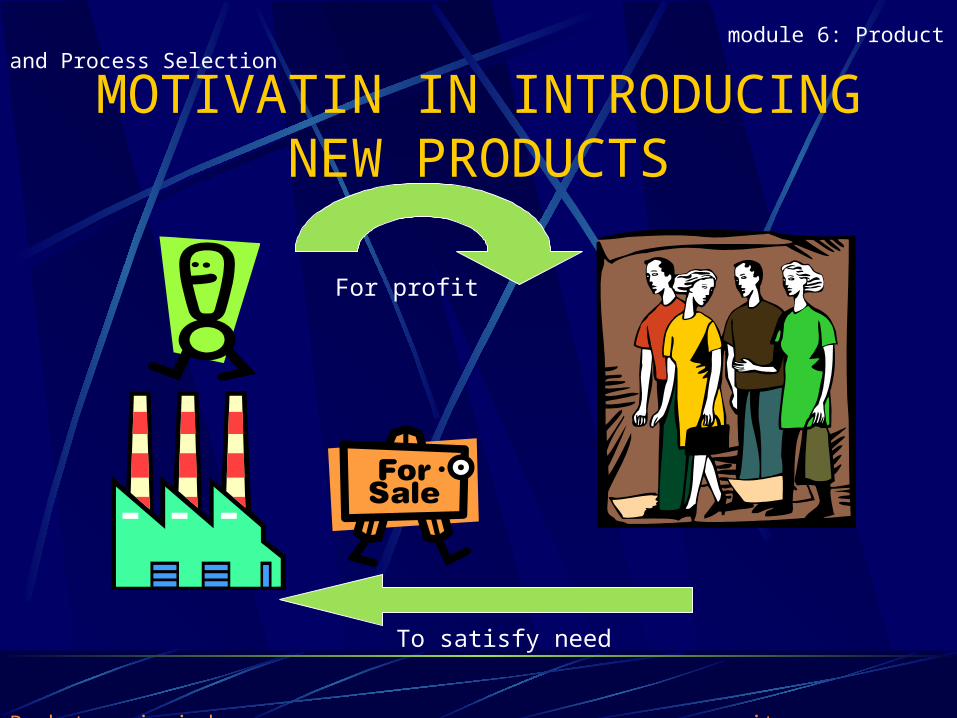
MOTIVATIN IN INTRODUCING NEW PRODUCTS
To satisfy need
For profit
module 6: Product and Process Selection
Back to main index exit back to module contents
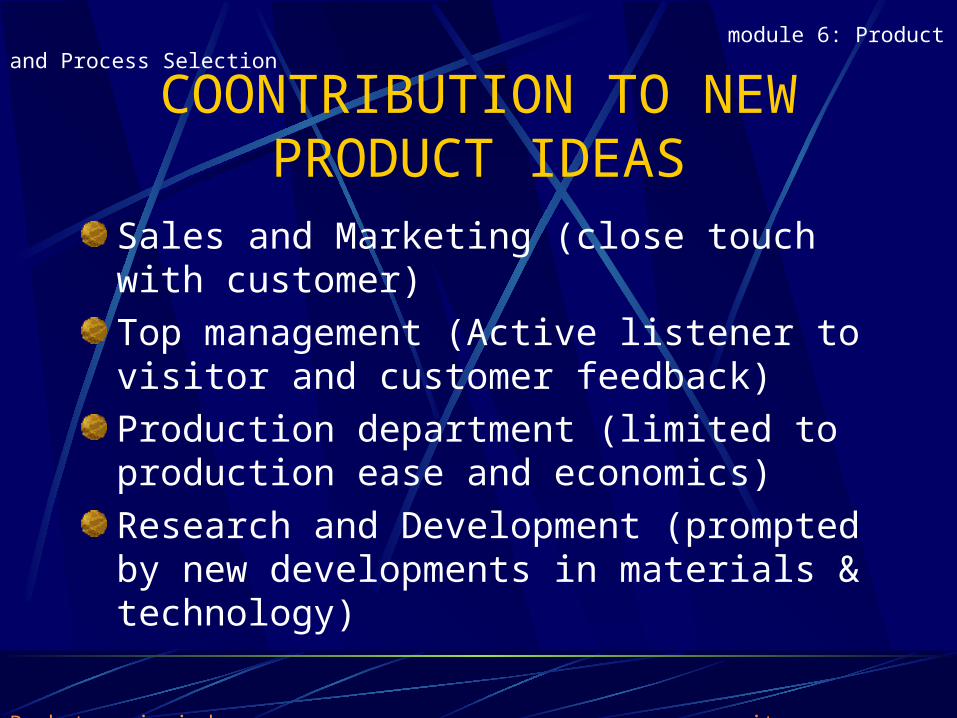
COONTRIBUTION TO NEW PRODUCT IDEAS
Sales and Marketing (close touch with customer)
Top management (Active listener to visitor and customer feedback)
Production department (limited to production ease and economics)
Research and Development (prompted by new developments in materials & technology)
module 6: Product and Process Selection
Back to main index exit back to module contents
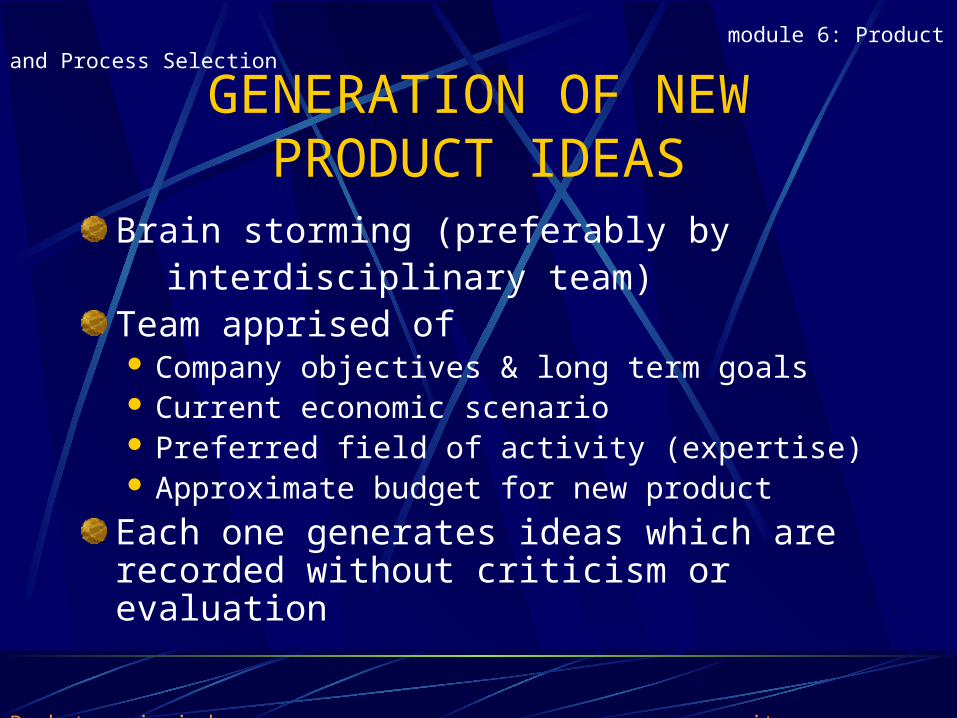
GENERATION OF NEW PRODUCT IDEAS
Brain storming (preferably by interdisciplinary team)
Team apprised of Company objectives & long term goals Current economic scenario Preferred field of activity (expertise) Approximate budget for new product
Each one generates ideas which are recorded without criticism or evaluation
module 6: Product and Process Selection
Back to main index exit back to module contents
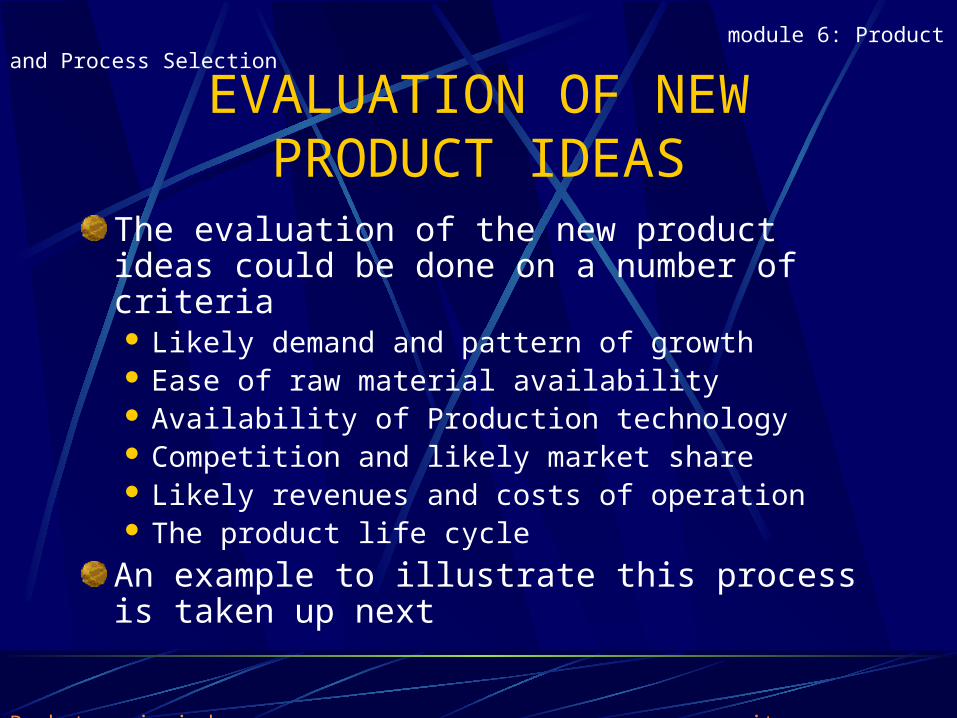
EVALUATION OF NEW PRODUCT IDEAS
The evaluation of the new product ideas could be done on a number of criteria Likely demand and pattern of growth Ease of raw material availability Availability of Production technology Competition and likely market share Likely revenues and costs of operation The product life cycle
An example to illustrate this process is taken up next
module 6: Product and Process Selection
Back to main index exit back to module contents
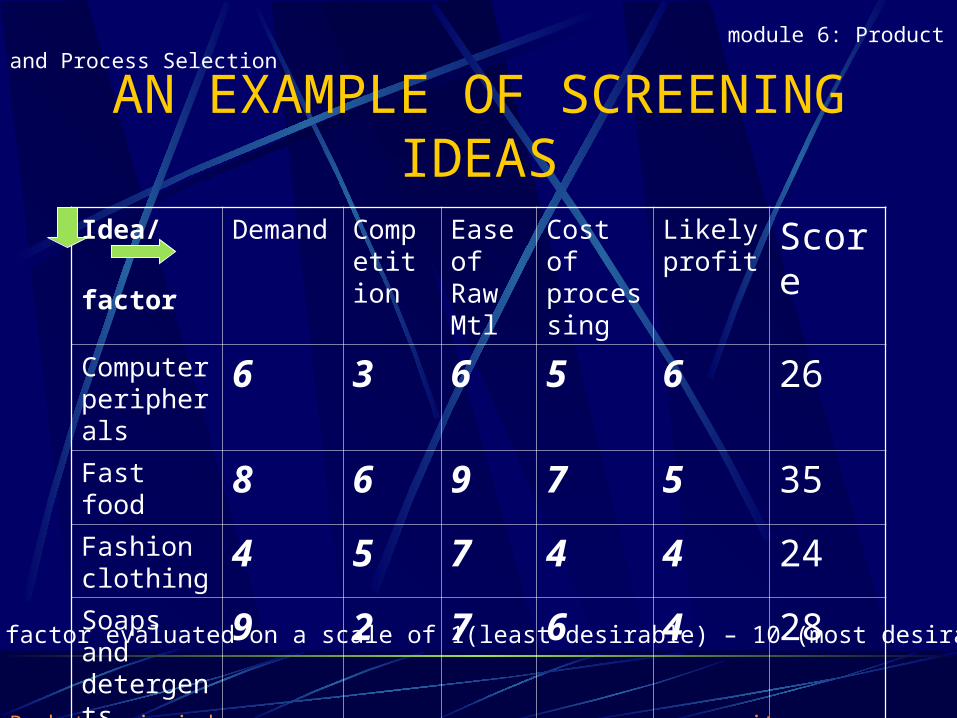
AN EXAMPLE OF SCREENING IDEAS
Idea/
factor
Demand Competition
Ease of Raw Mtl
Cost of processing
Likely profit
Score
Computer peripherals
6 3 6 5 6 26
Fast food 8 6 9 7 5 35
Fashion clothing
4 5 7 4 4 24
Soaps and detergents
9 2 7 6 4 28Each factor evaluated on a scale of 1(least desirable) – 10 (most desirable)
module 6: Product and Process Selection
Back to main index exit back to module contents
CUSTOMER NEEDS AND DESIRES
Desires Natural, as hunger,
shelter, love and security
Generated by exposure to circumstances and temptations
(as in advertisements on media, TV,neighbour)
Needs When a desire becomes
strong enough and warrants fulfilment, it becomes a need.
Customer demand is based on real or artificially generated needs
Needs are constantly changing
module 6: Product and Process Selection
Back to main index exit back to module contents
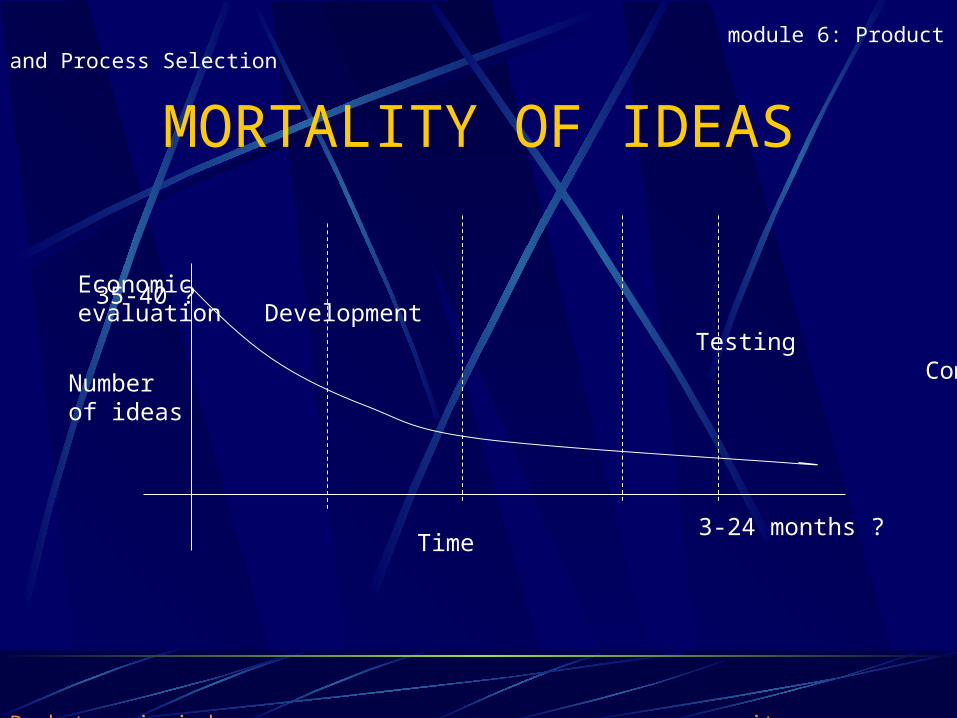
MORTALITY OF IDEAS
Screening Economic evaluation Development Testing Commercialization Number
of ideas
Time
35-40 ?
3-24 months ?
module 6: Product and Process Selection
Back to main index exit back to module contents
PRODUCT POLICY
Minimum price, whatever the quality
Maximum quality, whatever the cost
Safety/reliability
Precision and prestige
Satisfactory balance between quality & price
Versatility
module 6: Product and Process Selection
Back to main index exit back to module contents
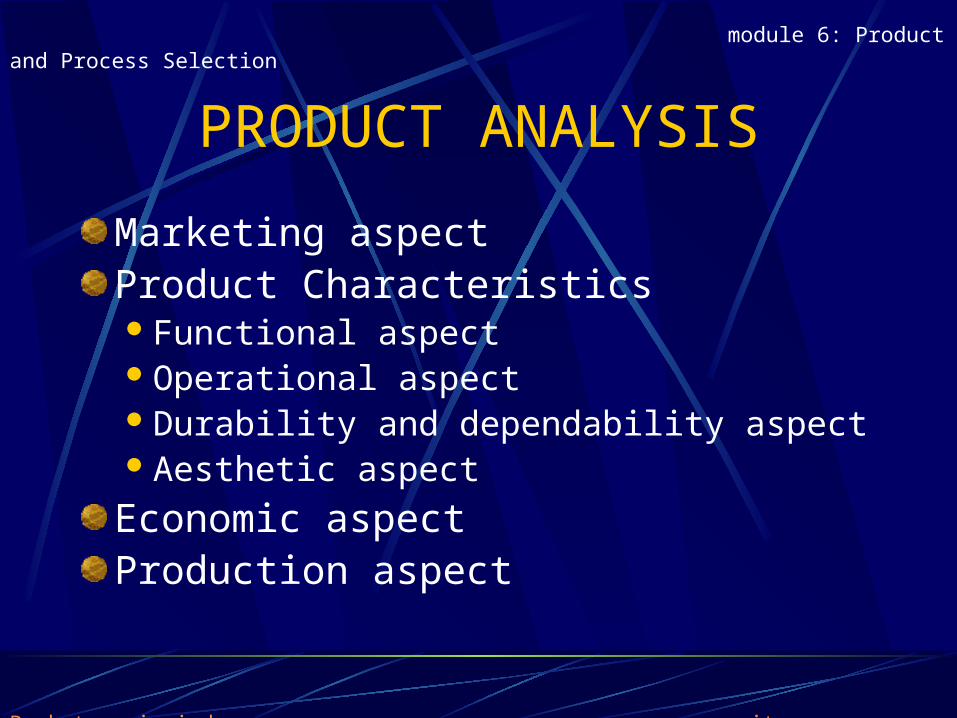
PRODUCT ANALYSIS
Marketing aspectProduct CharacteristicsFunctional aspectOperational aspectDurability and dependability aspectAesthetic aspect
Economic aspect Production aspect
module 6: Product and Process Selection
Back to main index exit back to module contents

MARKETING ASPECT
Who is the customer?
What are his needs?
How to reach him?Market ResearchForecastingAdvertising
module 6: Product and Process Selection
Back to main index exit back to module contents
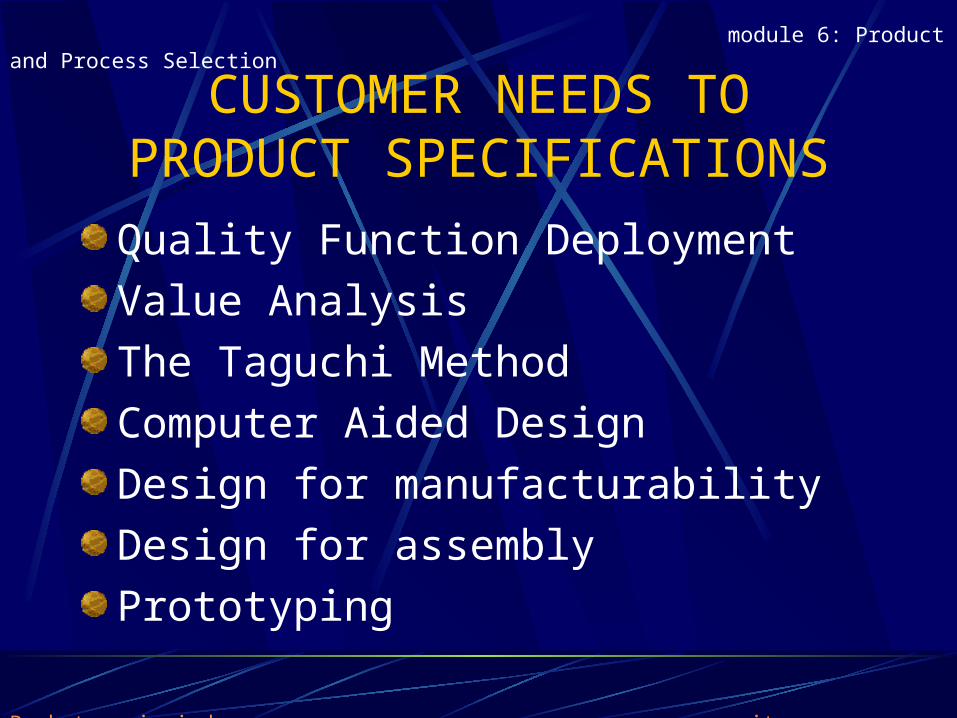
CUSTOMER NEEDS TO PRODUCT SPECIFICATIONS
Quality Function Deployment
Value Analysis
The Taguchi Method
Computer Aided Design
Design for manufacturability
Design for assembly
Prototyping
module 6: Product and Process Selection
Back to main index exit back to module contents
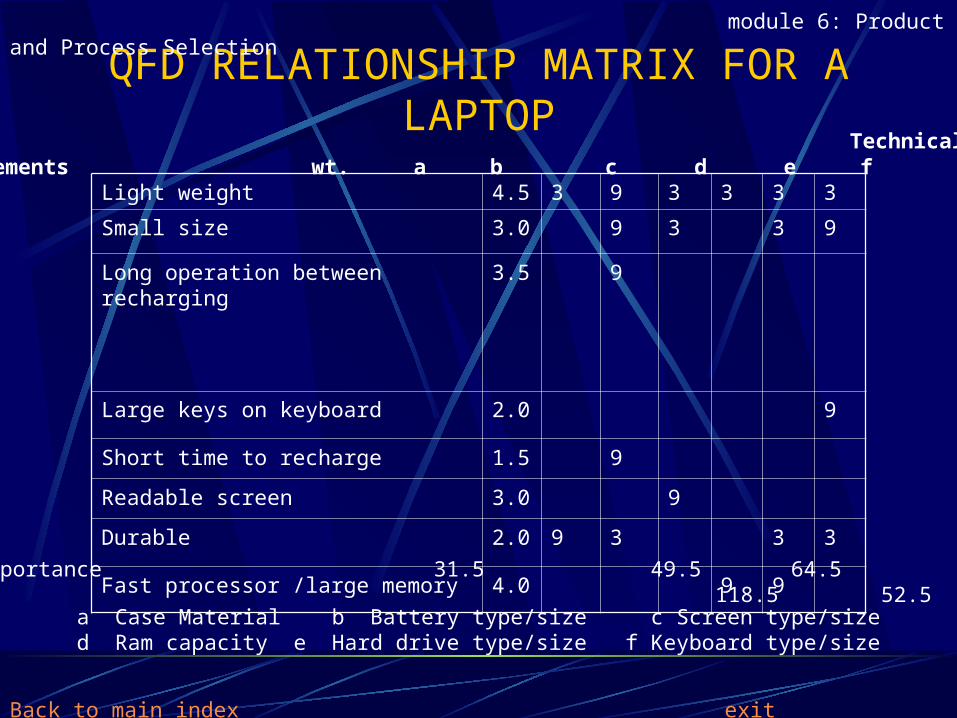
QFD RELATIONSHIP MATRIX FOR A LAPTOP
Light weight 4.5 3 9 3 3 3 3
Small size 3.0 9 3 3 9
Long operation between recharging
3.5 9
Large keys on keyboard 2.0 9
Short time to recharge 1.5 9
Readable screen 3.0 9
Durable 2.0 9 3 3 3
Fast processor /large memory 4.0 9 9
Technical Attributes Customer Requirements wt. a b c d e f
a Case Material b Battery type/size c Screen type/sized Ram capacity e Hard drive type/size f Keyboard type/size
Attribute Importance 31.5 49.5 64.5 118.5 52.5 64.5
module 6: Product and Process Selection
Back to main index exit back to module contents
HOUSE OF QUALITY
module 6: Product and Process Selection
Back to main index exit back to module contents
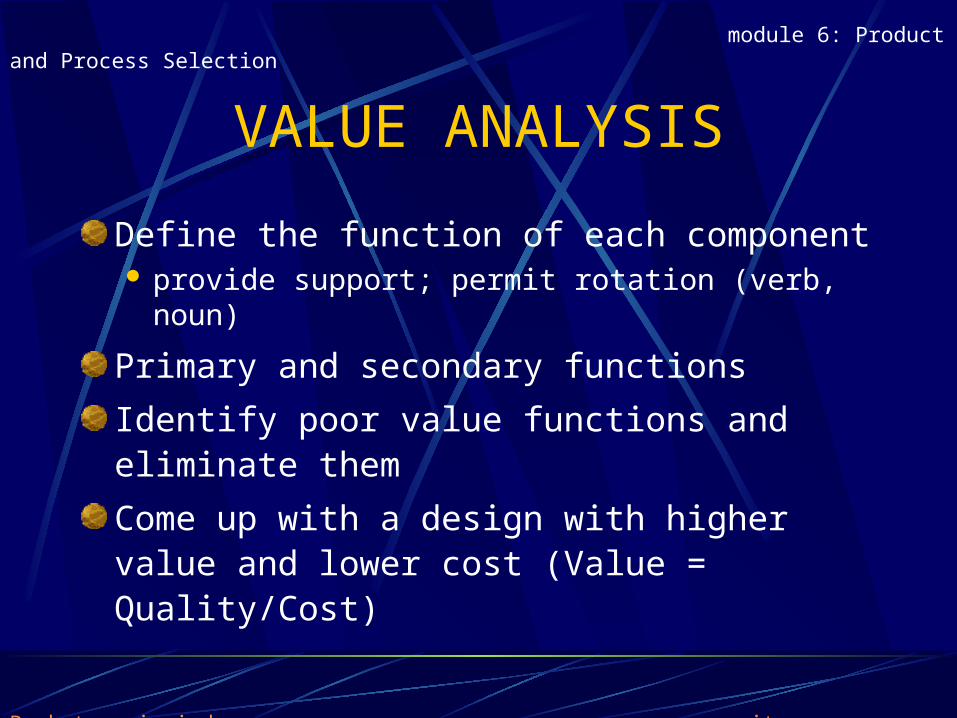
VALUE ANALYSIS
Define the function of each component provide support; permit rotation (verb, noun)
Primary and secondary functions
Identify poor value functions and eliminate them
Come up with a design with higher value and lower cost (Value = Quality/Cost)
module 6: Product and Process Selection
Back to main index exit back to module contents
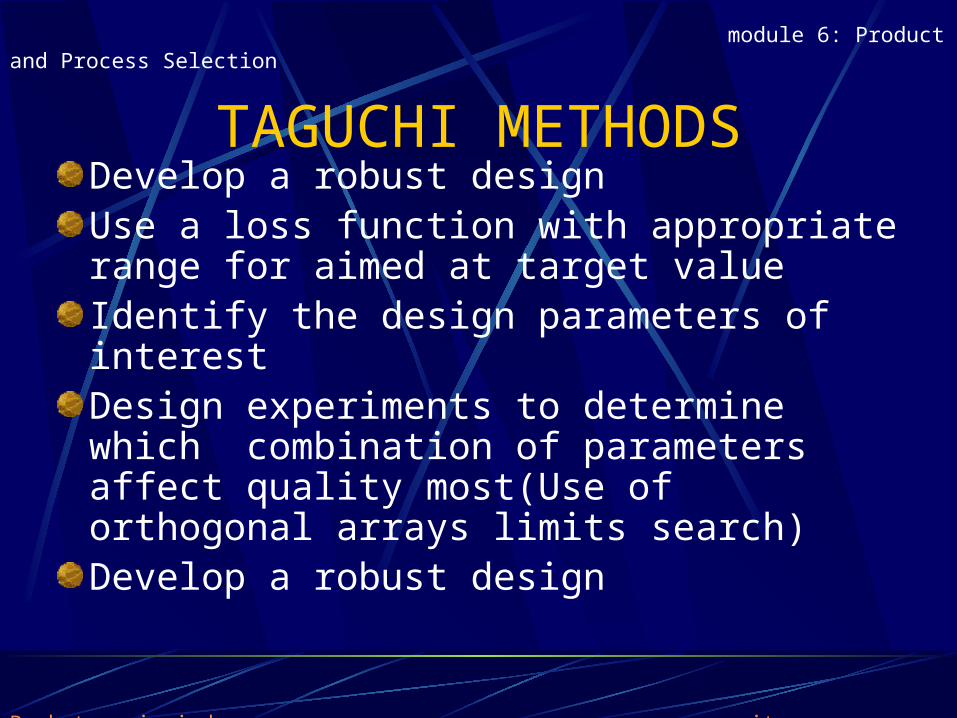
TAGUCHI METHODSDevelop a robust designUse a loss function with appropriate range for aimed at target valueIdentify the design parameters of interestDesign experiments to determine which combination of parameters affect quality most(Use of orthogonal arrays limits search)Develop a robust design
module 6: Product and Process Selection
Back to main index exit back to module contents
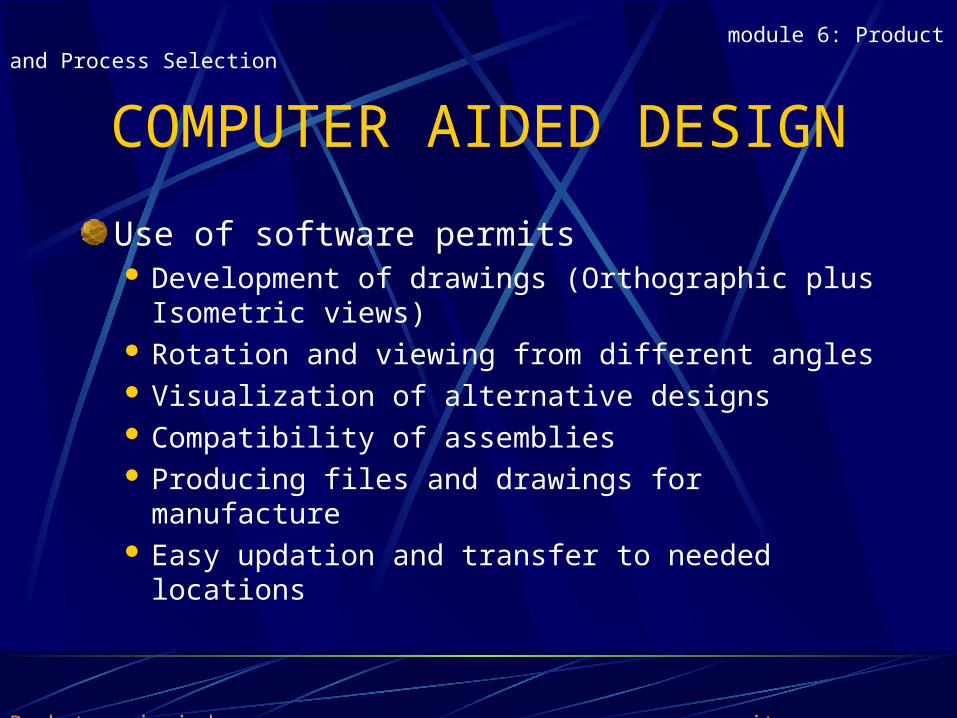
COMPUTER AIDED DESIGN
Use of software permits Development of drawings (Orthographic plus
Isometric views) Rotation and viewing from different angles Visualization of alternative designs Compatibility of assemblies Producing files and drawings for manufacture Easy updation and transfer to needed locations
module 6: Product and Process Selection
Back to main index exit back to module contents
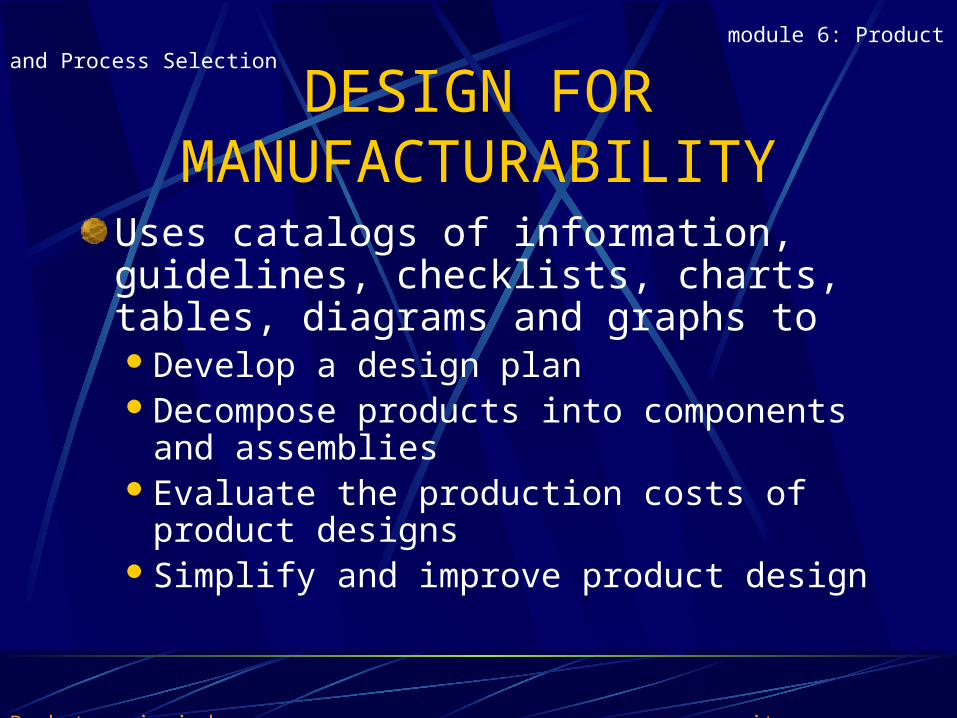
DESIGN FOR MANUFACTURABILITY
Uses catalogs of information, guidelines, checklists, charts, tables, diagrams and graphs to Develop a design planDecompose products into components and
assembliesEvaluate the production costs of product
designsSimplify and improve product design
module 6: Product and Process Selection
Back to main index exit back to module contents
DESIGN FOR ASSEMBLY
The methodology focuses mainly on `Machining Handling Assembly Design dimensions Clearances Shape OrientationDFM/A developed by Geoffry Boothroyd and Peter Dewhurst. Design for Service DFS is a recent concept
module 6: Product and Process Selection
Back to main index exit back to module contents
PROTOTYPING
A prototype provides a feel for the final product.
With increasing competition, it is imperative to reduce cost & lead times
Rapid prototyping machines produce the 3-D part by generating and joining slices
Stereolithography is a commonly used technology for this purpose.
module 6: Product and Process Selection
Back to main index exit back to module contents
SUMMARY
The product life cycleIdea generation and screeningMarketing aspectProduct Features Function, Operation,Quality, Durability,
Dependability, Aesthetics, Production aspect
Tools for a Product Designer QFD, Value Analysis, Taguchi, CAD, DMF, DFA,
Prototyping
module 6: Product and Process Selection
Back to main index exit back to module contents
2. Economic Evaluation of New Products and Services
module 6: Product and Process Selection
Back to main index exit back to module contents
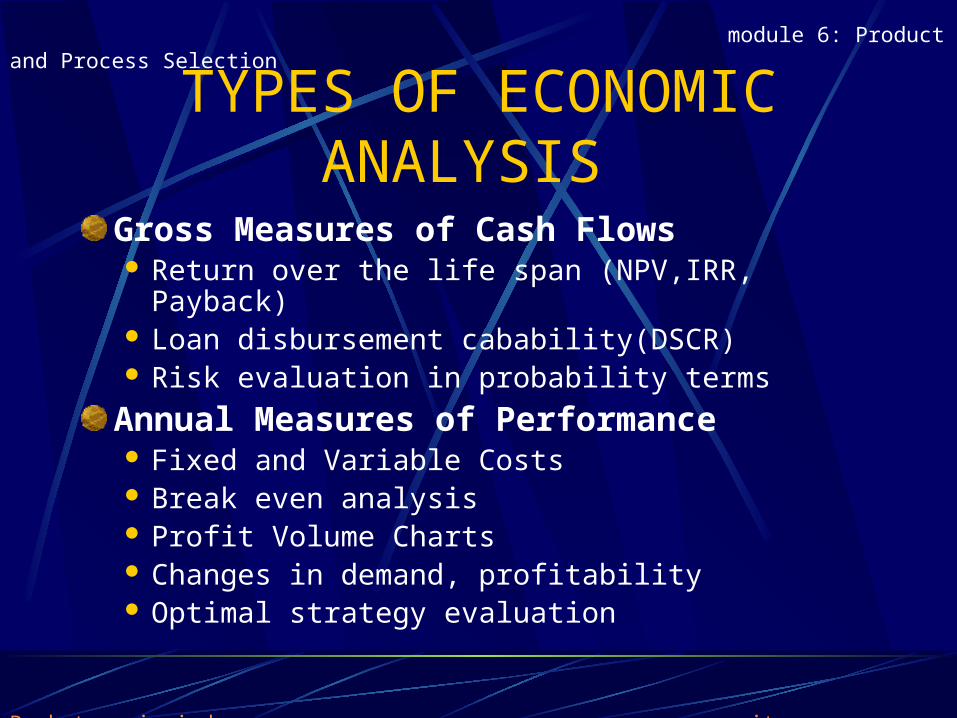
TYPES OF ECONOMIC ANALYSIS
Gross Measures of Cash Flows Return over the life span (NPV,IRR, Payback) Loan disbursement cabability(DSCR) Risk evaluation in probability terms
Annual Measures of Performance Fixed and Variable Costs Break even analysis Profit Volume Charts Changes in demand, profitability Optimal strategy evaluation
module 6: Product and Process Selection
Back to main index exit back to module contents
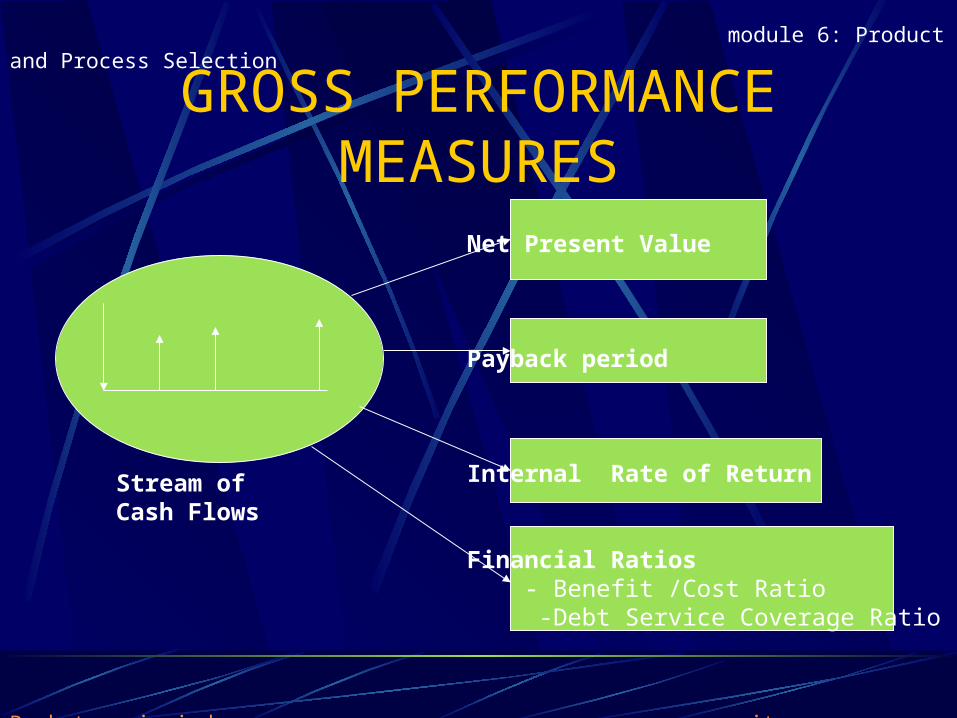
GROSS PERFORMANCE MEASURES
Net Present Value
Payback period
Internal Rate of Return
Financial Ratios - Benefit /Cost Ratio -Debt Service Coverage Ratio
Stream of Cash Flows
module 6: Product and Process Selection
Back to main index exit back to module contents
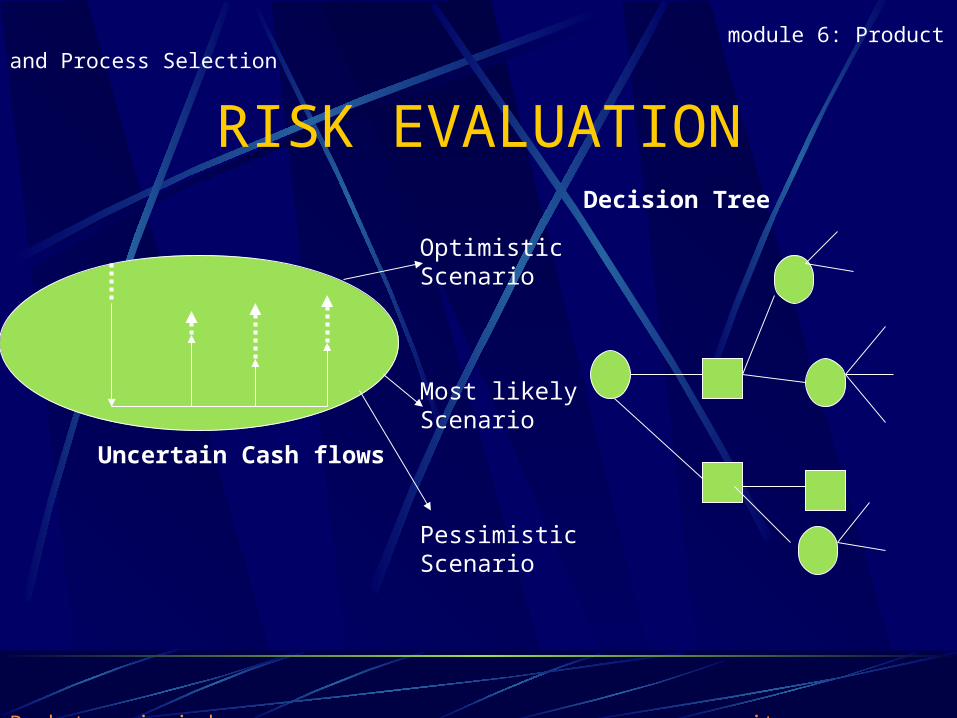
RISK EVALUATION
OptimisticScenario
Most likelyScenario
PessimisticScenario
Uncertain Cash flows
Decision Tree
module 6: Product and Process Selection
Back to main index exit back to module contents
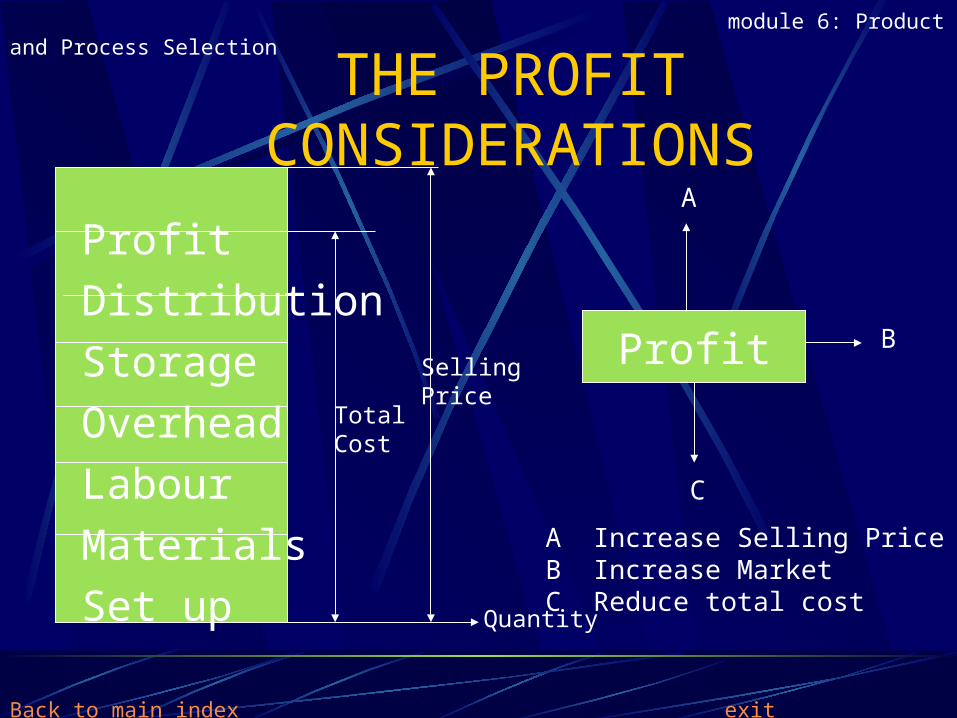
THE PROFIT CONSIDERATIONS
Profit
Distribution
Storage
Overhead
Labour
Materials
Set up
TotalCost
Selling Price
Quantity
Profit
A
B
C
A Increase Selling PriceB Increase MarketC Reduce total cost
module 6: Product and Process Selection
Back to main index exit back to module contents
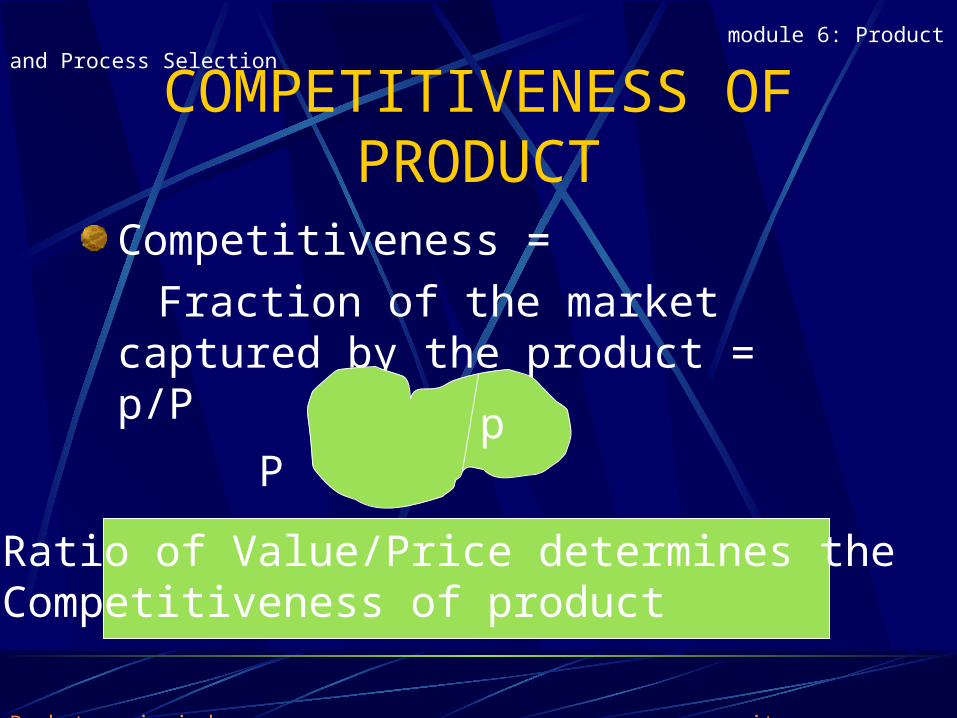
COMPETITIVENESS OF PRODUCT
Competitiveness =
Fraction of the market captured by the product = p/P
pP
Ratio of Value/Price determines the Competitiveness of product
module 6: Product and Process Selection
Back to main index exit back to module contents
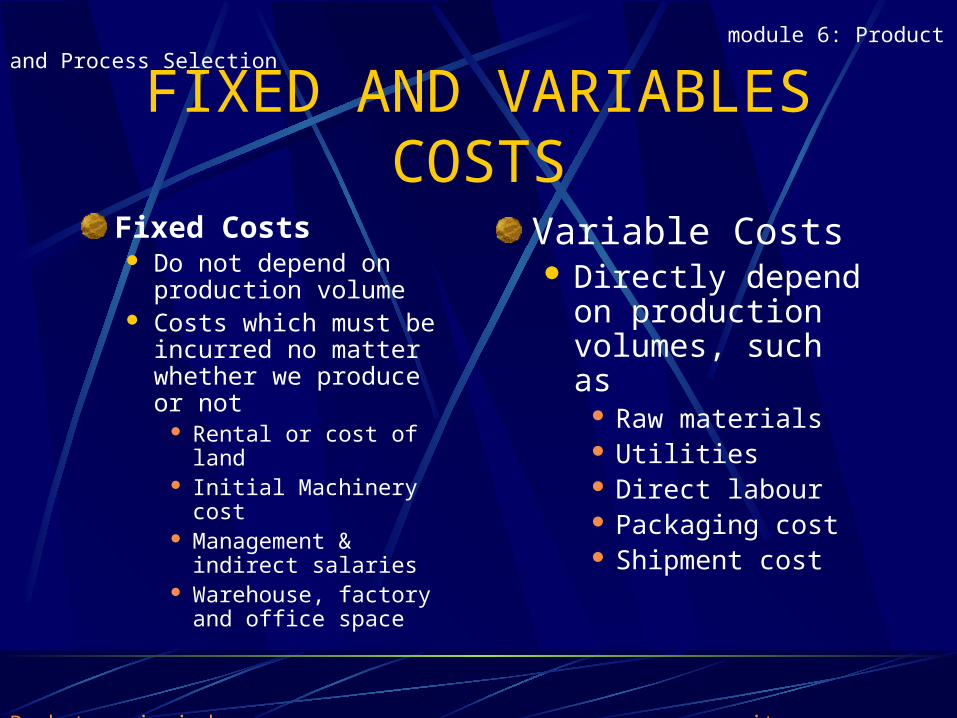
FIXED AND VARIABLES COSTS
Fixed Costs Do not depend on
production volume Costs which must be
incurred no matter whether we produce or not
Rental or cost of land Initial Machinery cost Management & indirect
salaries Warehouse, factory and
office space
Variable Costs Directly depend on
production volumes, such as
Raw materials Utilities Direct labour Packaging cost Shipment cost
module 6: Product and Process Selection
Back to main index exit back to module contents
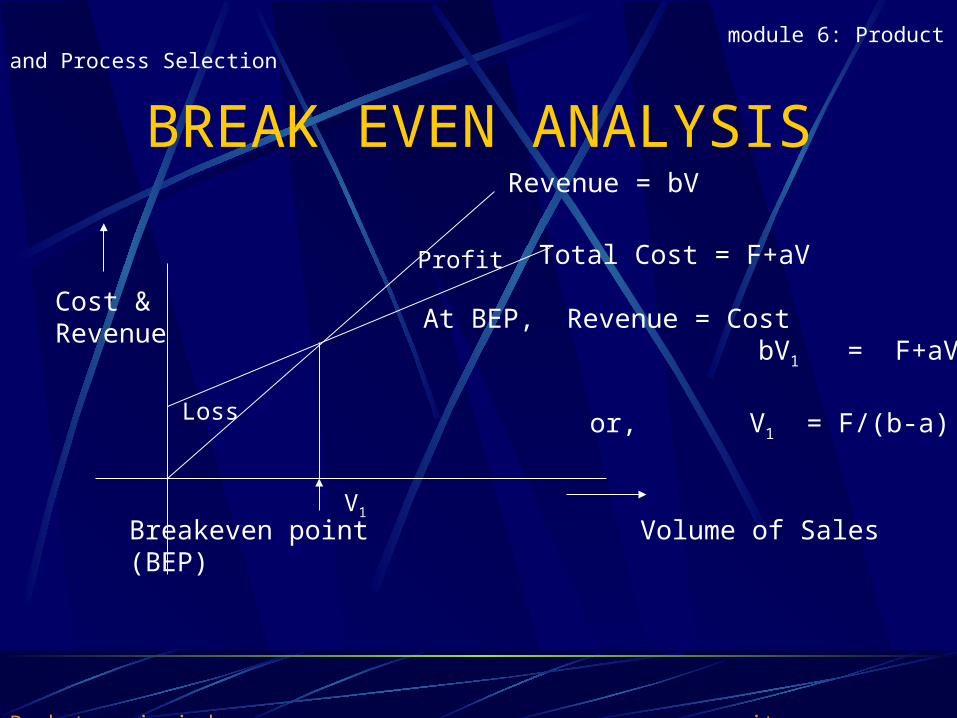
BREAK EVEN ANALYSISRevenue = bV
Total Cost = F+aV
Loss
Profit
Breakeven point Volume of Sales(BEP)
V1
Cost &Revenue At BEP, Revenue = Cost
bV1 = F+aV1
or, V1 = F/(b-a)
module 6: Product and Process Selection
Back to main index exit back to module contents
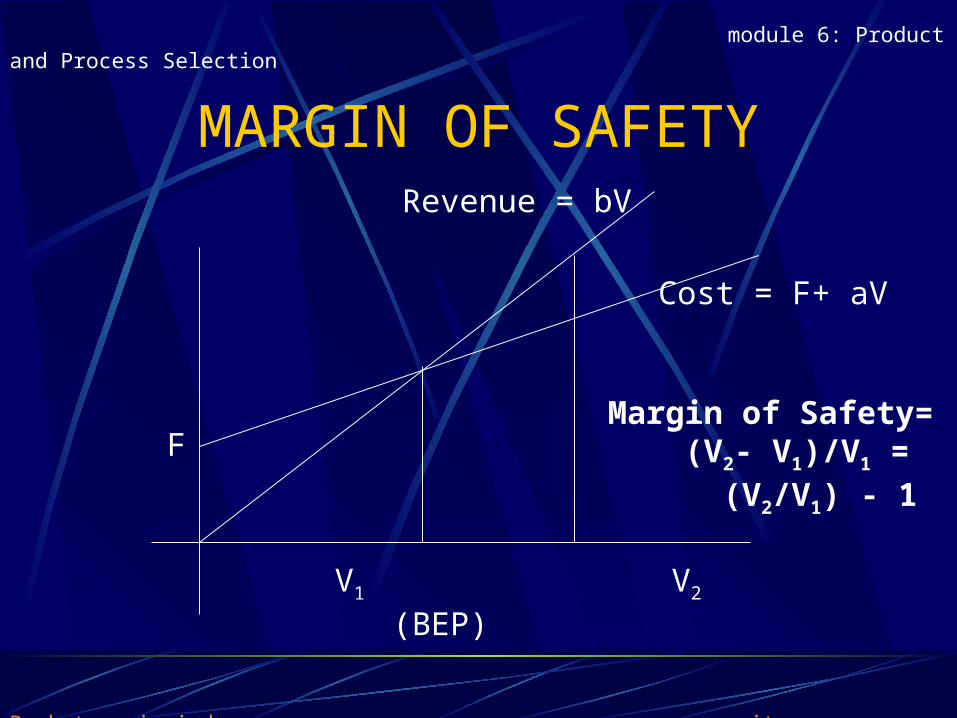
MARGIN OF SAFETY
V1 V2
F
Revenue = bV
Cost = F+ aV
(BEP)
Margin of Safety= (V2- V1)/V1 = (V2/V1) - 1
module 6: Product and Process Selection
Back to main index exit back to module contents
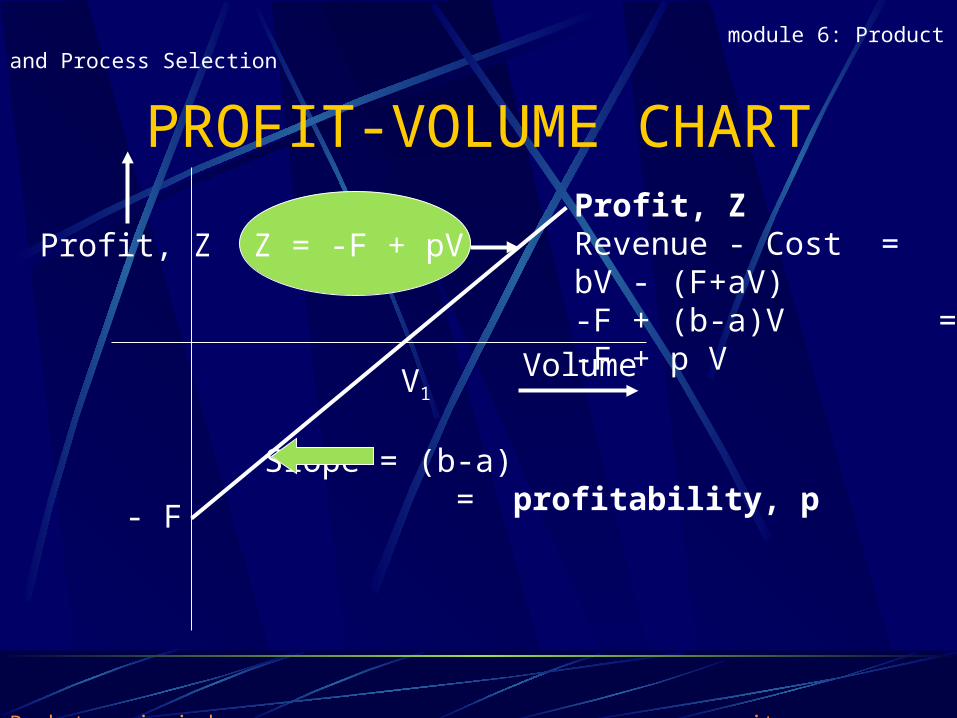
PROFIT-VOLUME CHART
V1
Slope = (b-a) = profitability, p
Profit, Z =Revenue - Cost =bV - (F+aV) -F + (b-a)V =-F + p V
Z = -F + pV
Volume
Profit, Z
- F
module 6: Product and Process Selection
Back to main index exit back to module contents
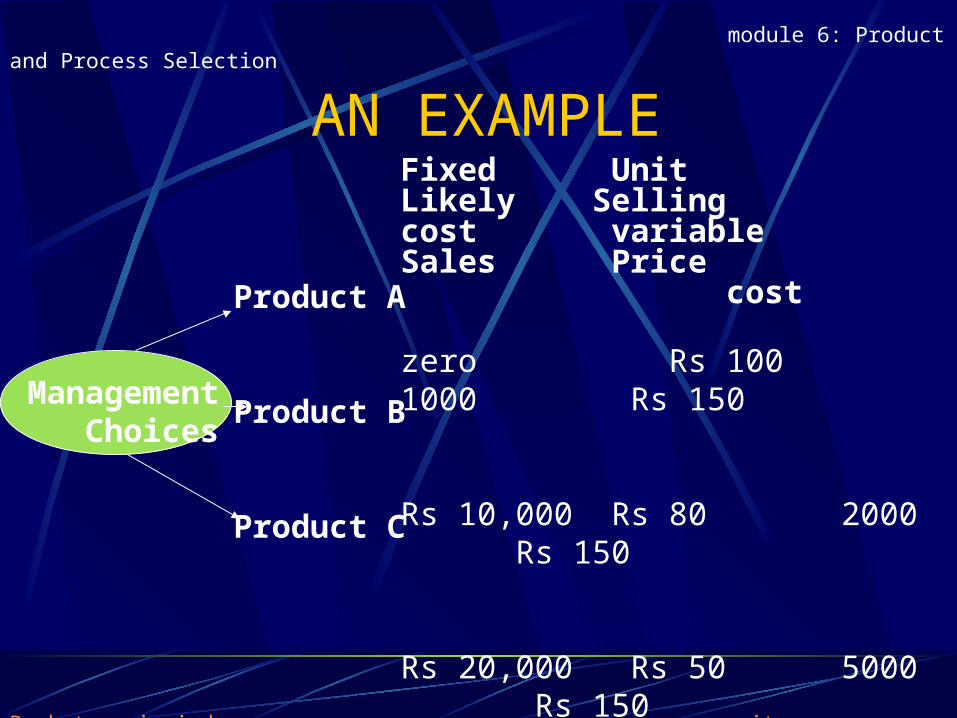
AN EXAMPLE
Management Choices
Product A
Product B
Product C
Fixed Unit Likely Sellingcost variable Sales Price cost
zero Rs 100 1000 Rs 150
Rs 10,000 Rs 80 2000 Rs 150
Rs 20,000 Rs 50 5000 Rs 150
module 6: Product and Process Selection
Back to main index exit back to module contents
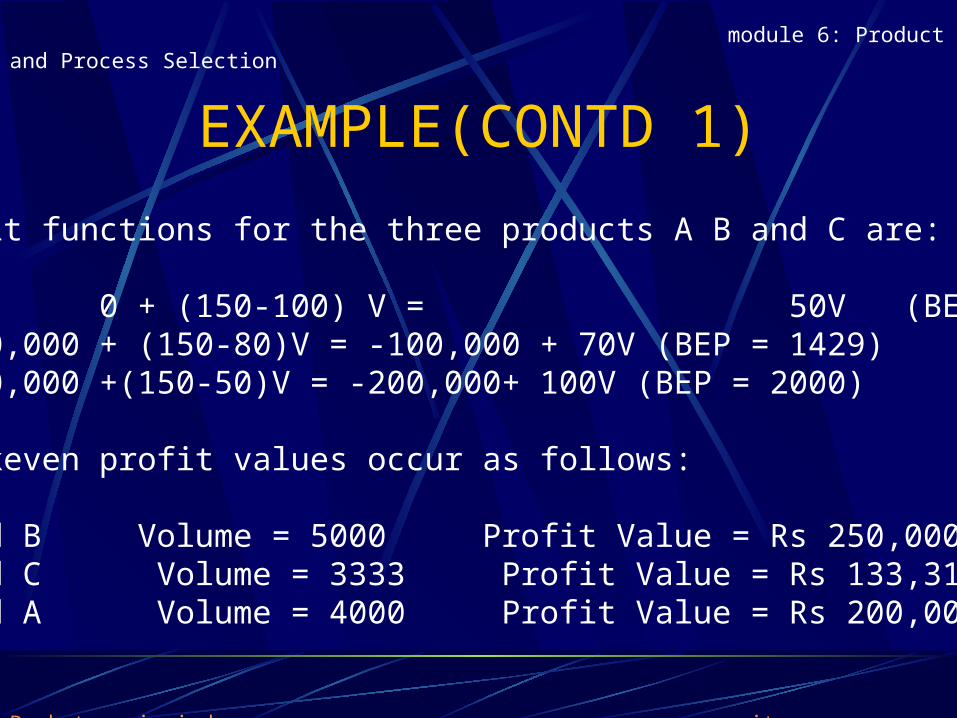
EXAMPLE(CONTD 1)
The Profit functions for the three products A B and C are:
ZA= 0 + (150-100) V = 50V (BEP = zero)ZB = -100,000 + (150-80)V = -100,000 + 70V (BEP = 1429)ZC = -200,000 +(150-50)V = -200,000+ 100V (BEP = 2000)
The breakeven profit values occur as follows:
For A and B Volume = 5000 Profit Value = Rs 250,000For B and C Volume = 3333 Profit Value = Rs 133,310For C and A Volume = 4000 Profit Value = Rs 200,000
module 6: Product and Process Selection
Back to main index exit back to module contents
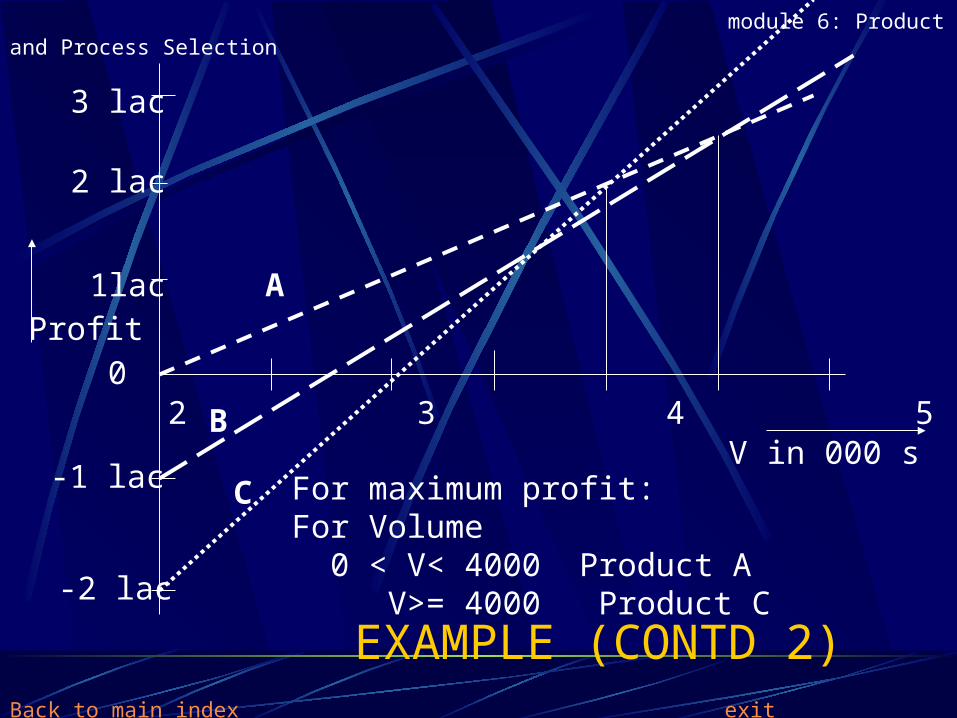
EXAMPLE (CONTD 2)
1 2 3 4 5 6V in 000 s
-1 lac
-2 lac
0
1lac
2 lac
3 lac
For maximum profit:For Volume 0 < V< 4000 Product A V>= 4000 Product C
A
B
C
Profit
module 6: Product and Process Selection
Back to main index exit back to module contents
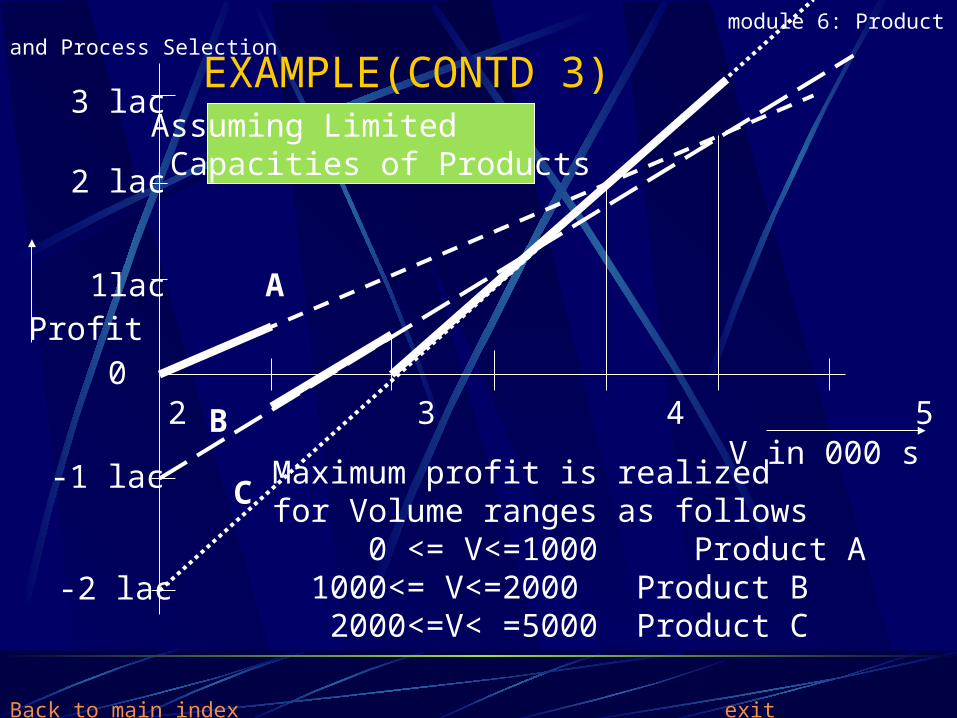
EXAMPLE(CONTD 3)
1 2 3 4 5 6V in 000 s
-1 lac
-2 lac
0
1lac
2 lac
3 lac
Maximum profit is realizedfor Volume ranges as follows 0 <= V<=1000 Product A 1000<= V<=2000 Product B 2000<=V< =5000 Product C
A
B
C
Profit
Assuming Limited Capacities of Products
module 6: Product and Process Selection
Back to main index exit back to module contents
MODULAR DESIGN
Products are typically designed and manufactured in modules. This results in Low cost of production Greater product variety at low cost Greater satisfaction for assembly workers A greater choice of subcontractors and vendors for
product manufacture Control of product reliability and cost
module 6: Product and Process Selection
Back to main index exit back to module contents
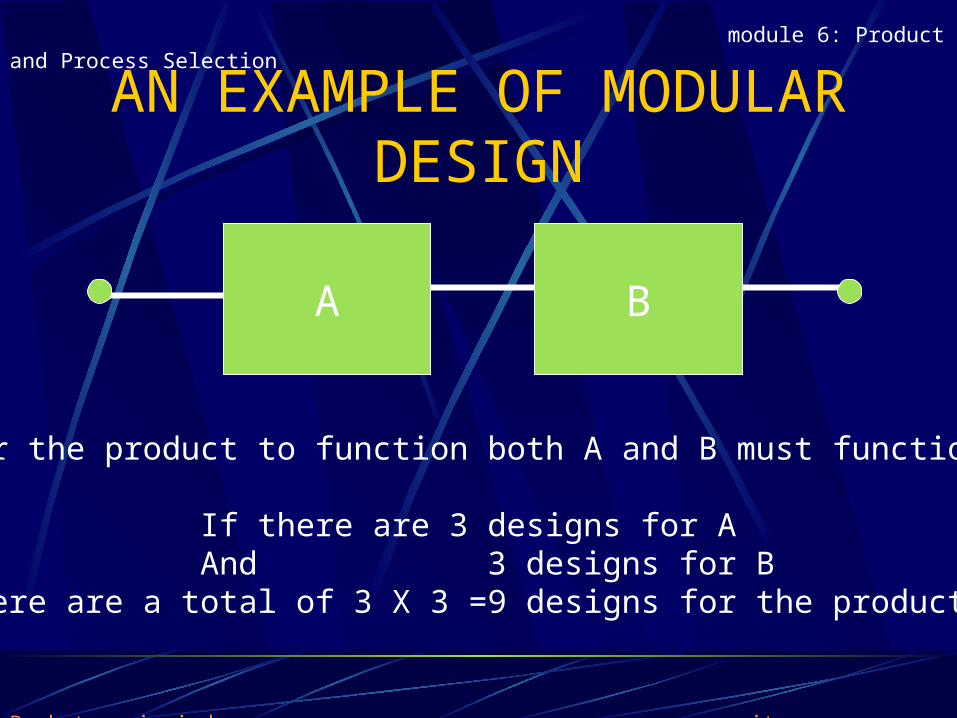
AN EXAMPLE OF MODULAR DESIGN
A B
For the product to function both A and B must function
If there are 3 designs for A And 3 designs for BThere are a total of 3 X 3 =9 designs for the product
module 6: Product and Process Selection
Back to main index exit back to module contents
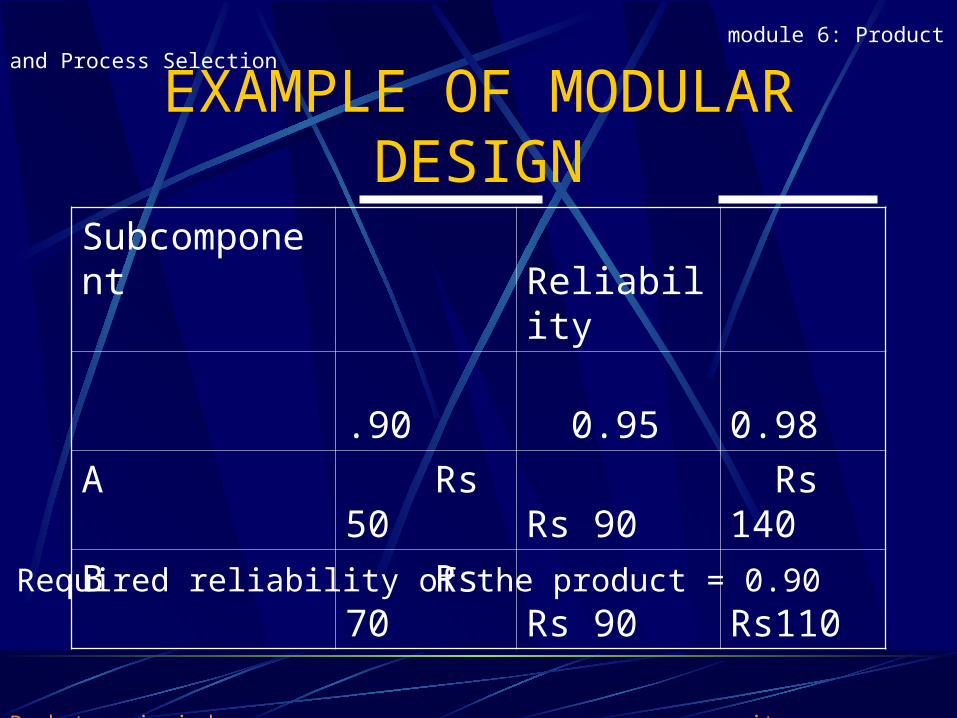
EXAMPLE OF MODULAR DESIGN
Subcomponent
Reliability
.90 0.95
0.98
A Rs 50 Rs 90 Rs 140
B Rs 70 Rs 90 Rs110Required reliability of the product = 0.90
module 6: Product and Process Selection
Back to main index exit back to module contents
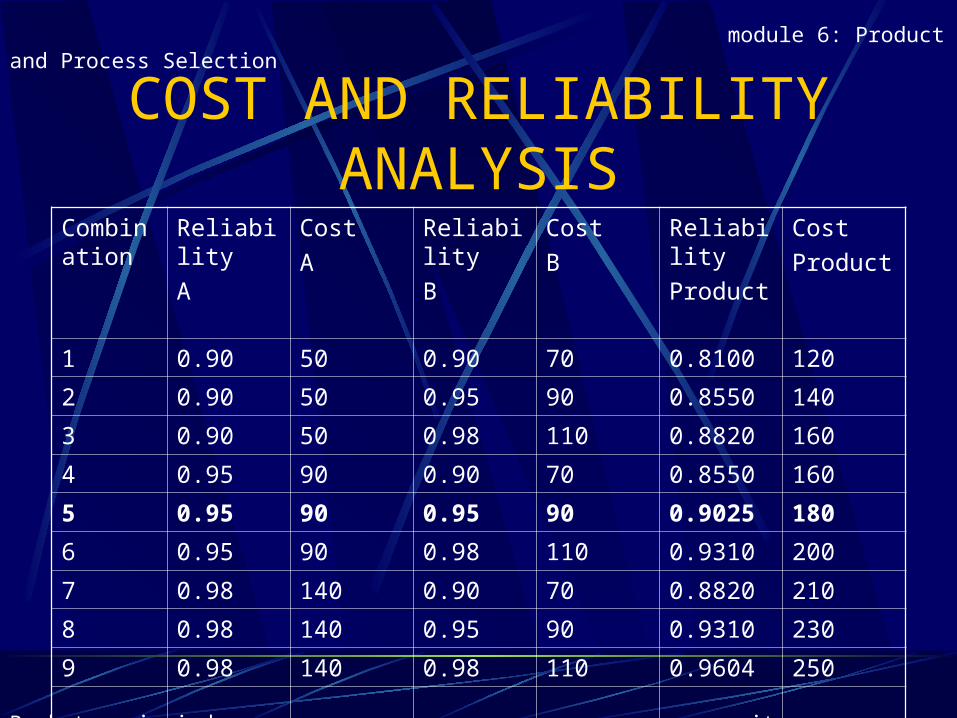
COST AND RELIABILITY ANALYSIS
Combination
Reliability
A
Cost
A
Reliability
B
Cost
B
Reliability
Product
Cost
Product
1 0.90 50 0.90 70 0.8100 120
2 0.90 50 0.95 90 0.8550 140
3 0.90 50 0.98 110 0.8820 160
4 0.95 90 0.90 70 0.8550 160
5 0.95 90 0.95 90 0.9025 180
6 0.95 90 0.98 110 0.9310 200
7 0.98 140 0.90 70 0.8820 210
8 0.98 140 0.95 90 0.9310 230
9 0.98 140 0.98 110 0.9604 250
module 6: Product and Process Selection
Back to main index exit back to module contents
SUMMARY
Financial Evaluation of Products is generally carried out in two phases Gross measures of evaluation eg. NPV,IRR,
Payback, Risk, Financial Ratios Annual cost analysis eg Breakeven analysis, Profit
volume Charts, Profitability, Demand.
P-V charts could be used to determine the optimal strategy when choices are available. Modular Design helps to improve variety, lower costs and greater job satisfaction to workers.
module 6: Product and Process Selection
Back to main index exit back to module contents
3. Product Mix Decisions
module 6: Product and Process Selection
Back to main index exit back to module contents
WHY INTRODUCE VARIETY?
It may seem that choosing the most profitable product in large quantities would maximize profits. This need not be so due to Demand constraints Commitment to produce multiple products To absorb the risk of producing only one product To expand the customer base Utilization of resources
module 6: Product and Process Selection
Back to main index exit back to module contents
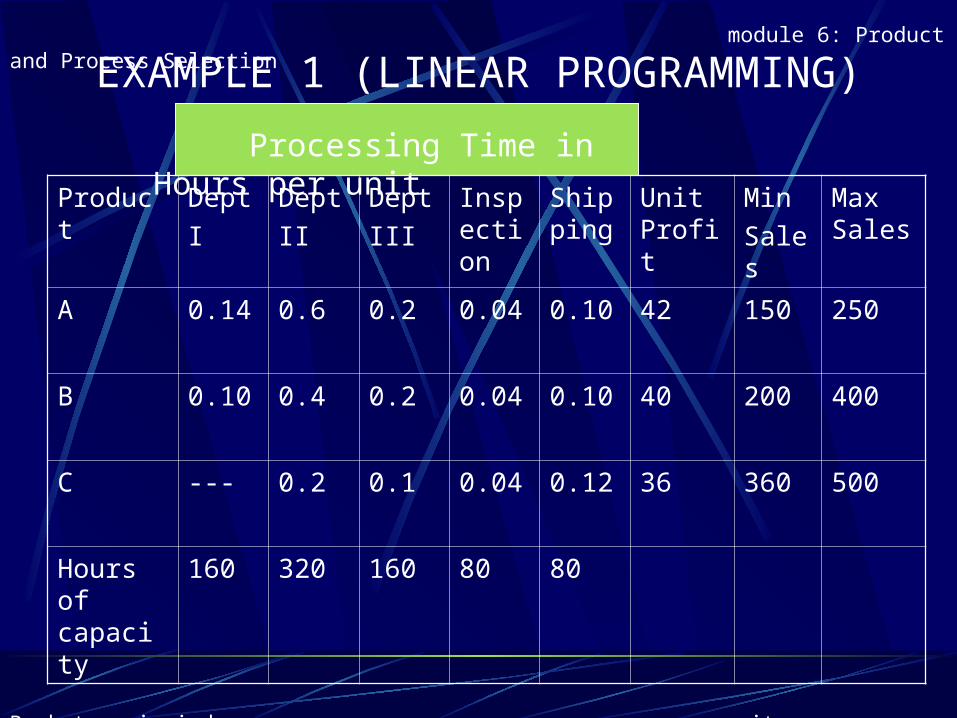
Product Dept
I
Dept
II
Dept
III
Inspection
Shipping
Unit Profit
Min
Sales
Max Sales
A 0.14 0.6 0.2 0.04 0.10 42 150 250
B 0.10 0.4 0.2 0.04 0.10 40 200 400
C --- 0.2 0.1 0.04 0.12 36 360 500
Hours of capacity
160 320 160 80 80
Processing Time in Hours per unit
EXAMPLE 1 (LINEAR PROGRAMMING) module 6: Product and Process Selection
Back to main index exit back to module contents
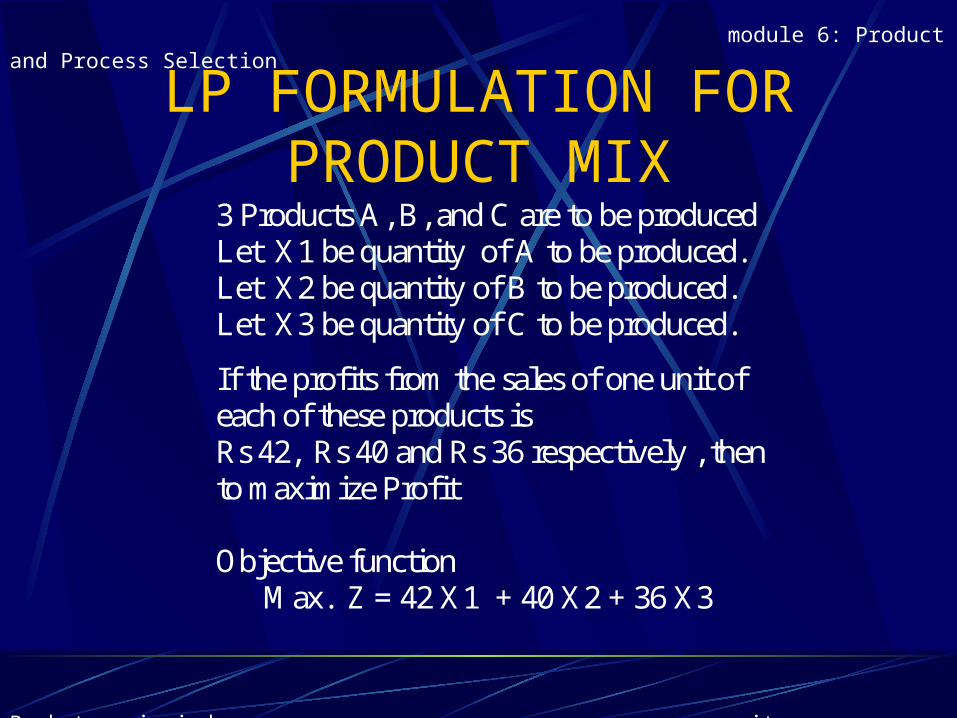
LP FORMULATION FOR PRODUCT MIX
3 Products A, B, and C are to be produced Let X1 be quantity of A to be produced. Let X2 be quantity of B to be produced. Let X3 be quantity of C to be produced.
If the profits from the sales of one unit of each of these products is Rs 42, Rs 40 and Rs 36 respectively , then to maximize Profit Objective function Max. Z = 42 X1 + 40 X2 + 36 X3
module 6: Product and Process Selection
Back to main index exit back to module contents
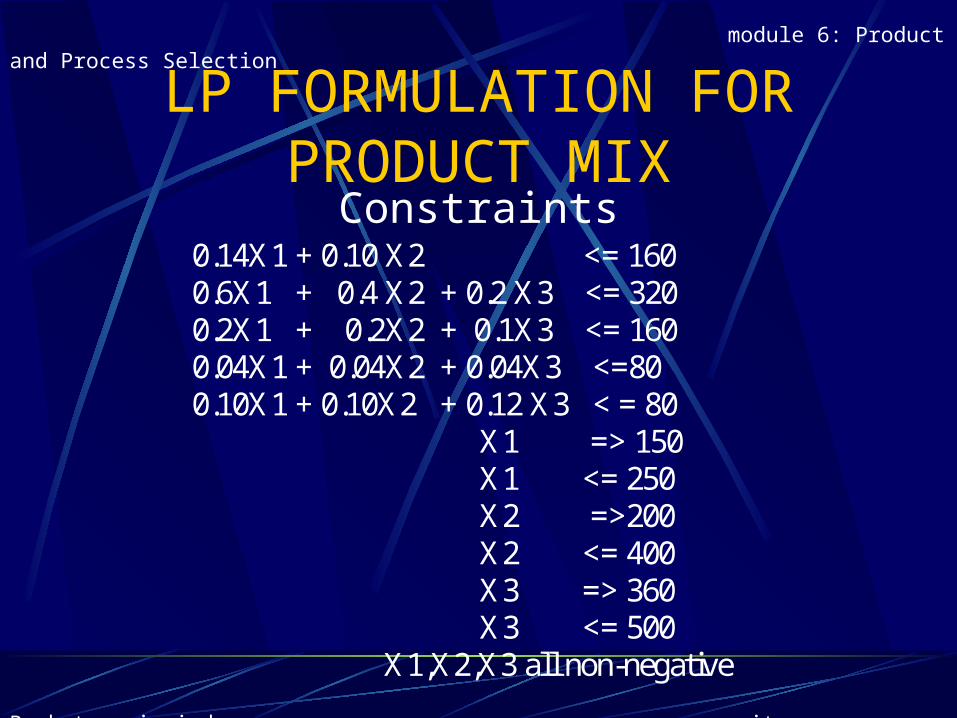
LP FORMULATION FOR PRODUCT MIX
0.14X1 + 0.10 X2 <= 160 0.6X1 + 0.4 X2 + 0.2 X3 <= 320 0.2X1 + 0.2X2 + 0.1X3 <= 160 0.04X1 + 0.04X2 + 0.04X3 <=80 0.10X1 + 0.10X2 + 0.12 X3 < = 80 X1 => 150 X1 <= 250 X2 =>200 X2 <= 400 X3 => 360 X3 <= 500 X1,X2,X3 all non-negative
Constraints
module 6: Product and Process Selection
Back to main index exit back to module contents
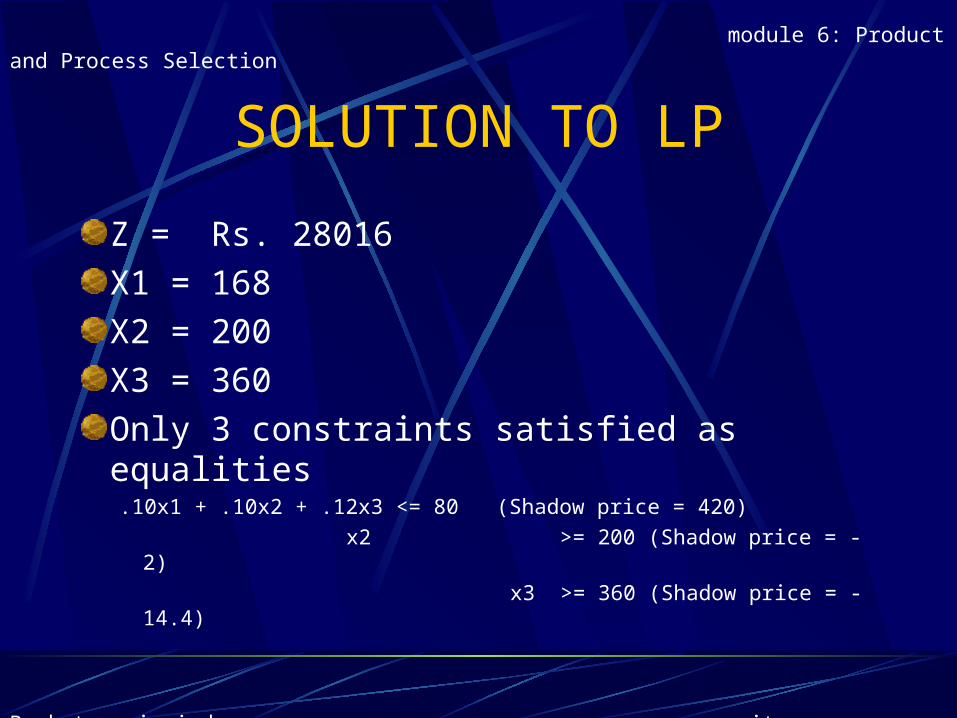
SOLUTION TO LP
Z = Rs. 28016
X1 = 168
X2 = 200
X3 = 360
Only 3 constraints satisfied as equalities.10x1 + .10x2 + .12x3 <= 80 (Shadow price = 420)
x2 >= 200 (Shadow price = -2)
x3 >= 360 (Shadow price = -14.4)
module 6: Product and Process Selection
Back to main index exit back to module contents
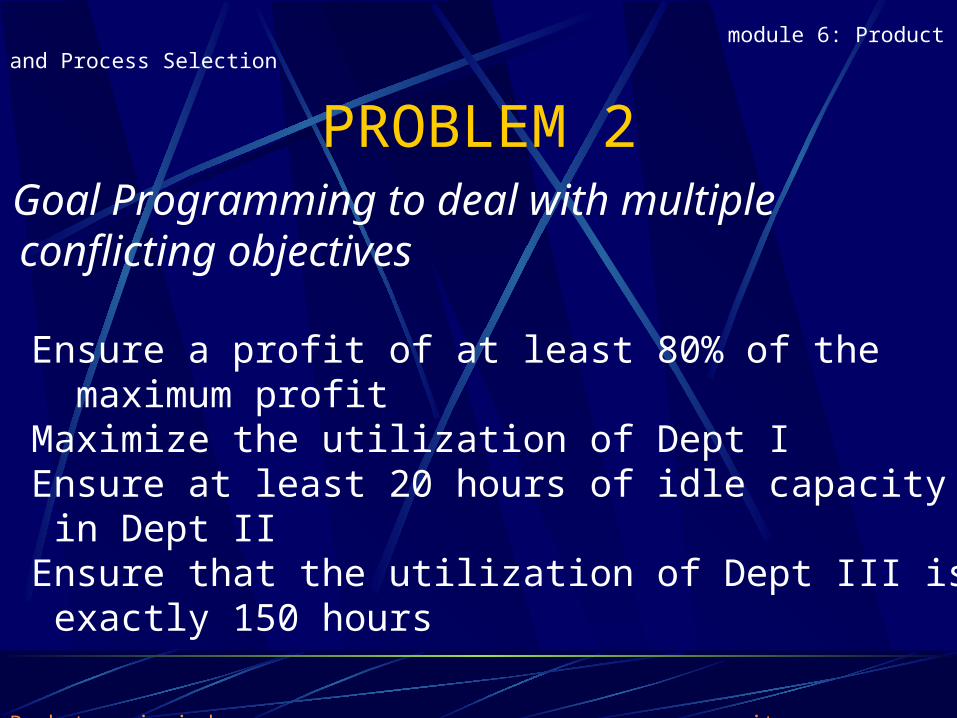
PROBLEM 2• Goal Programming to deal with multiple conflicting objectives
1. Ensure a profit of at least 80% of the maximum profit2. Maximize the utilization of Dept I3. Ensure at least 20 hours of idle capacity in Dept II4. Ensure that the utilization of Dept III is exactly 150 hours
module 6: Product and Process Selection
Back to main index exit back to module contents
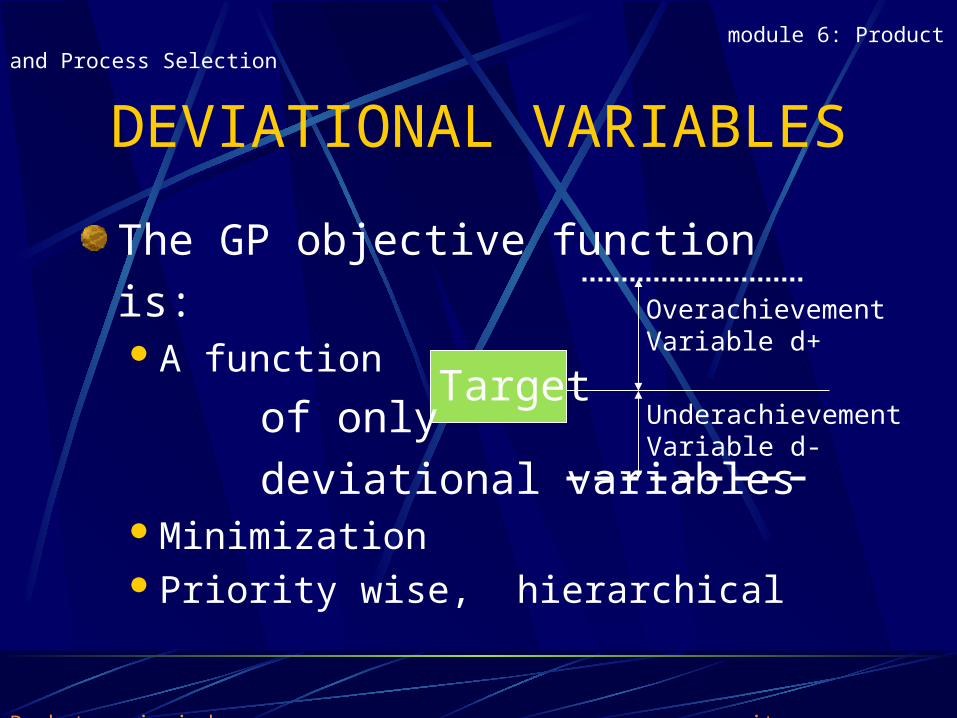
DEVIATIONAL VARIABLES
The GP objective function
is: A function
of only
deviational variablesMinimizationPriority wise, hierarchical
Target
OverachievementVariable d+
Underachievement Variable d-
module 6: Product and Process Selection
Back to main index exit back to module contents
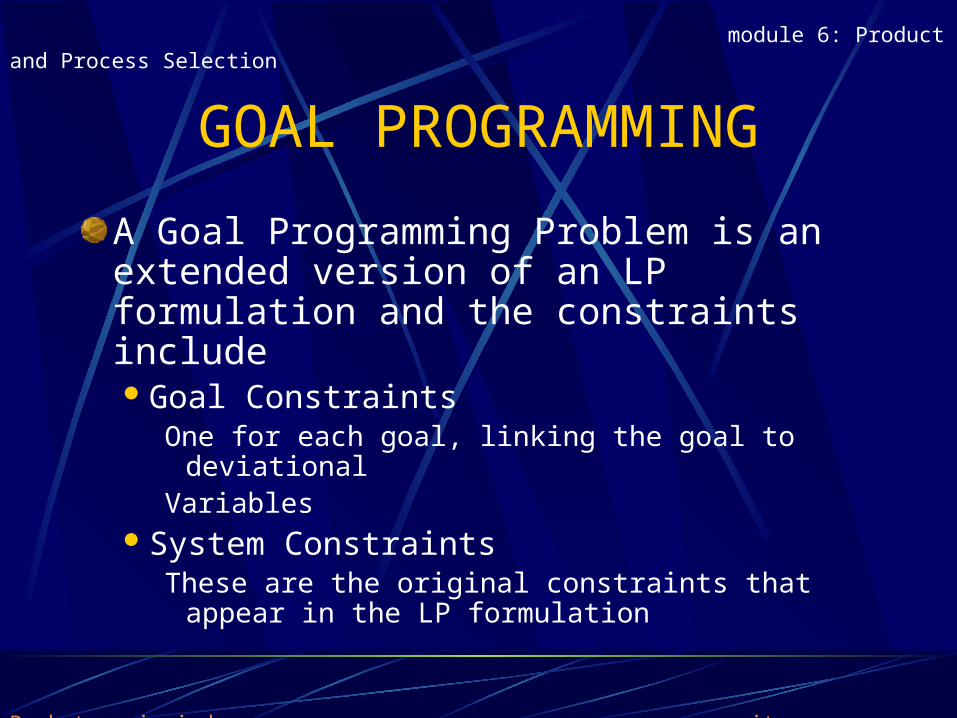
GOAL PROGRAMMING
A Goal Programming Problem is an extended version of an LP formulation and the constraints includeGoal Constraints
One for each goal, linking the goal to deviationalVariables
System ConstraintsThese are the original constraints that appear in
the LP formulation
module 6: Product and Process Selection
Back to main index exit back to module contents
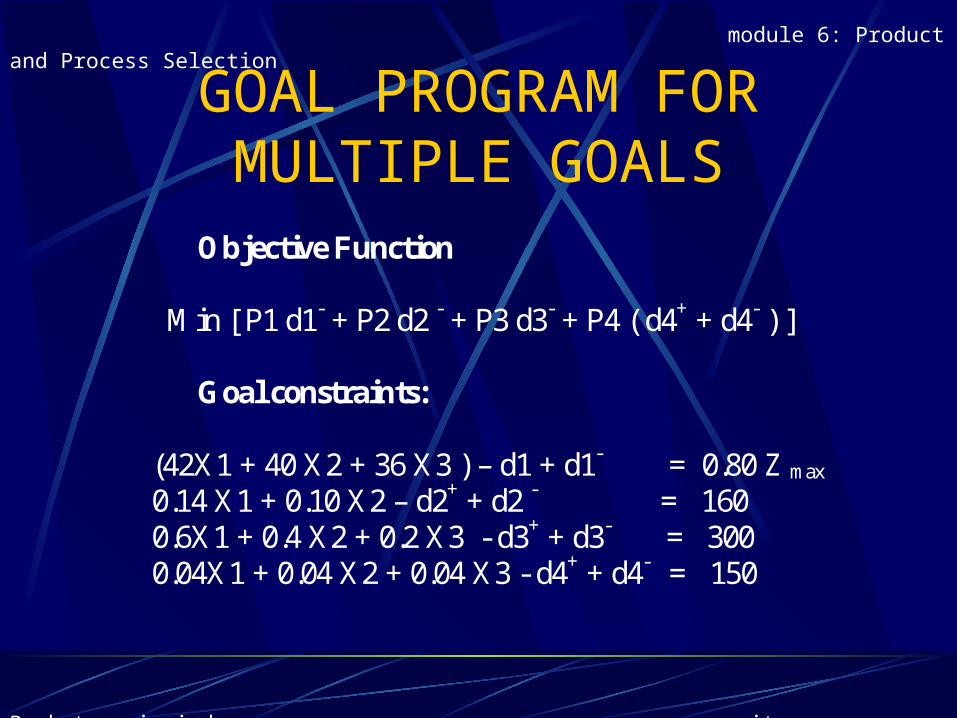
GOAL PROGRAM FOR MULTIPLE GOALS
Objective Function Min [ P1 d1- + P2 d2 - + P3 d3- + P4 ( d4+ + d4- ) ]
Goal constraints:
(42X1 + 40 X2 + 36 X3 ) – d1 + d1- = 0.80 Z max
0.14 X1 + 0.10 X2 – d2+ + d2 - = 160 0.6X1 + 0.4 X2 + 0.2 X3 - d3+ + d3- = 300 0.04X1 + 0.04 X2 + 0.04 X3 - d4+ + d4- = 150
module 6: Product and Process Selection
Back to main index exit back to module contents
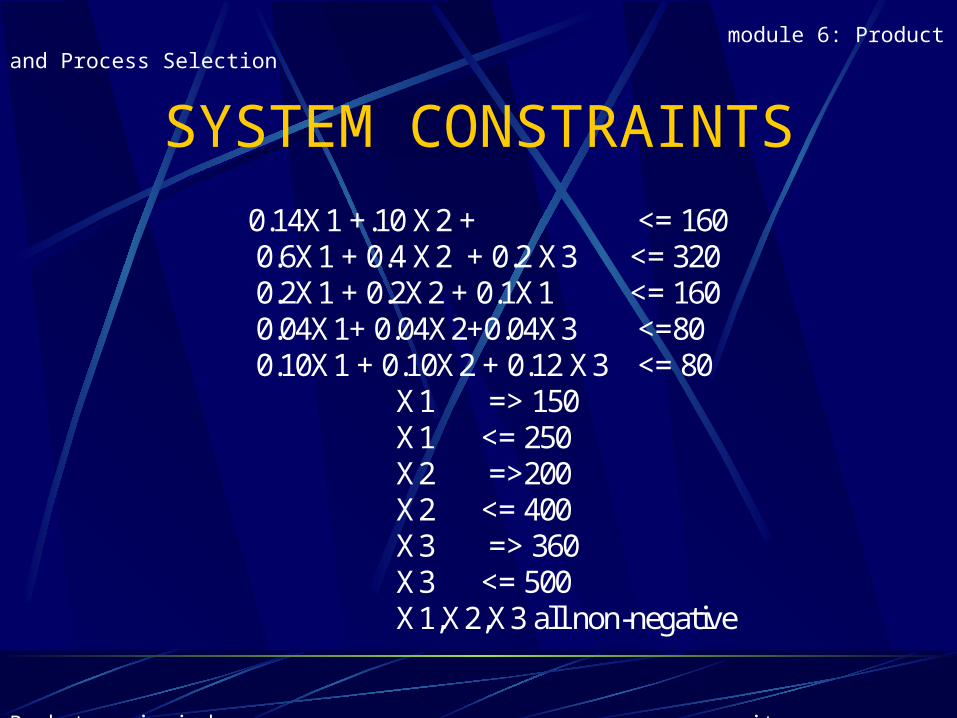
SYSTEM CONSTRAINTS 0.14X1 +.10 X2 + <= 160 0.6X1 + 0.4 X2 + 0.2 X3 <= 320 0.2X1 + 0.2X2 + 0.1X1 <= 160 0.04X1+ 0.04X2+0.04X3 <=80 0.10X1 + 0.10X2 + 0.12 X3 <= 80 X1 => 150 X1 <= 250 X2 =>200 X2 <= 400 X3 => 360 X3 <= 500 X1,X2,X3 all non-negative
module 6: Product and Process Selection
Back to main index exit back to module contents
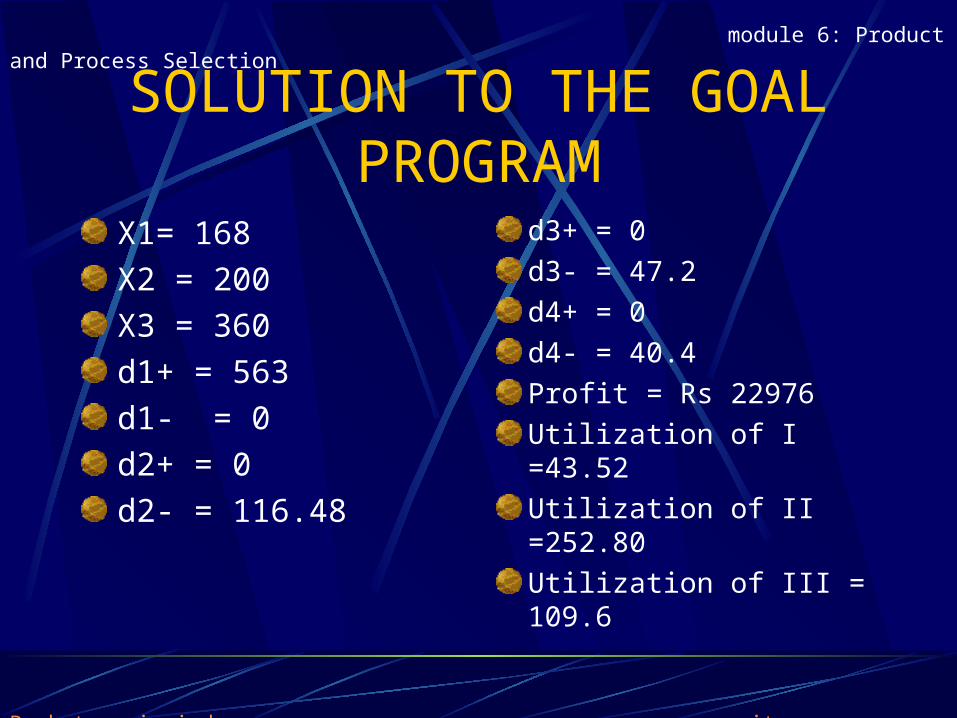
SOLUTION TO THE GOAL PROGRAM
X1= 168
X2 = 200
X3 = 360
d1+ = 563
d1- = 0
d2+ = 0
d2- = 116.48
d3+ = 0
d3- = 47.2
d4+ = 0
d4- = 40.4
Profit = Rs 22976
Utilization of I =43.52
Utilization of II =252.80
Utilization of III = 109.6
module 6: Product and Process Selection
Back to main index exit back to module contents
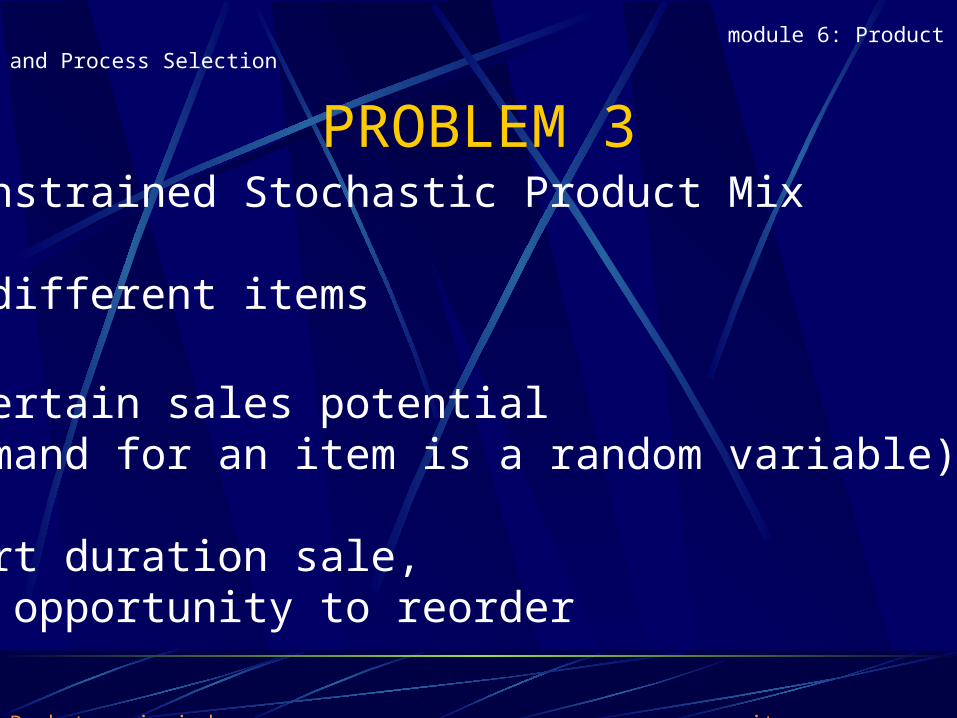
PROBLEM 3Unconstrained Stochastic Product Mix
• n different items
•Uncertain sales potential (demand for an item is a random variable)
•Short duration sale, no opportunity to reorder
module 6: Product and Process Selection
Back to main index exit back to module contents
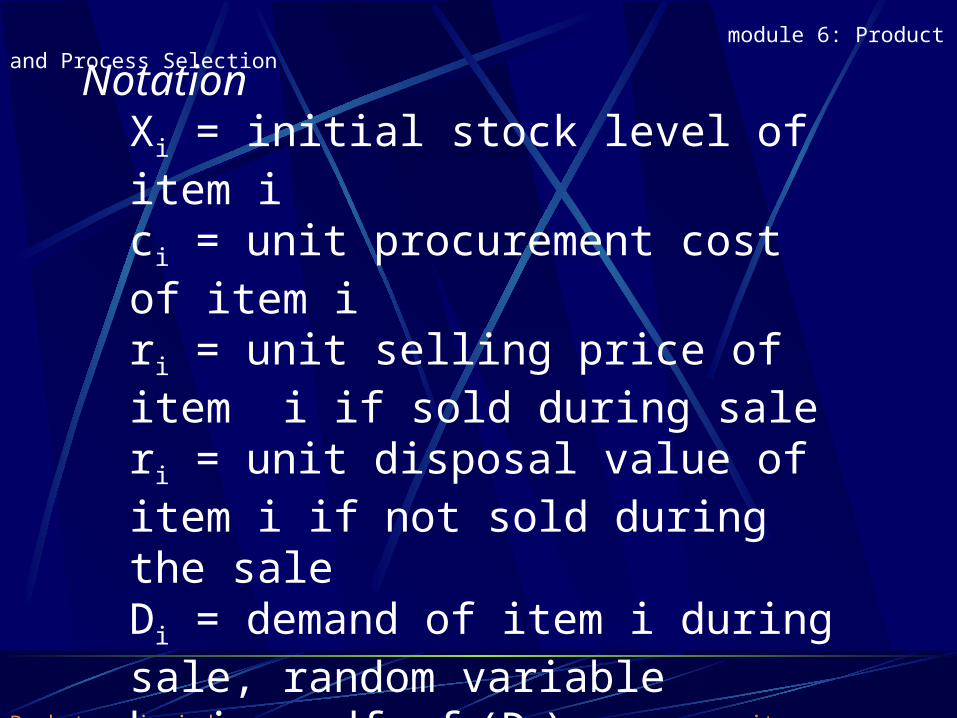
NotationXi = initial stock level of item ici = unit procurement cost of item iri = unit selling price of item i if sold during saleri = unit disposal value of item i if not sold during the saleDi = demand of item i during sale, random variable having pdf fi(Di) Z = Contribution to profit and overhead from the sale
module 6: Product and Process Selection
Back to main index exit back to module contents
ANALYSIS
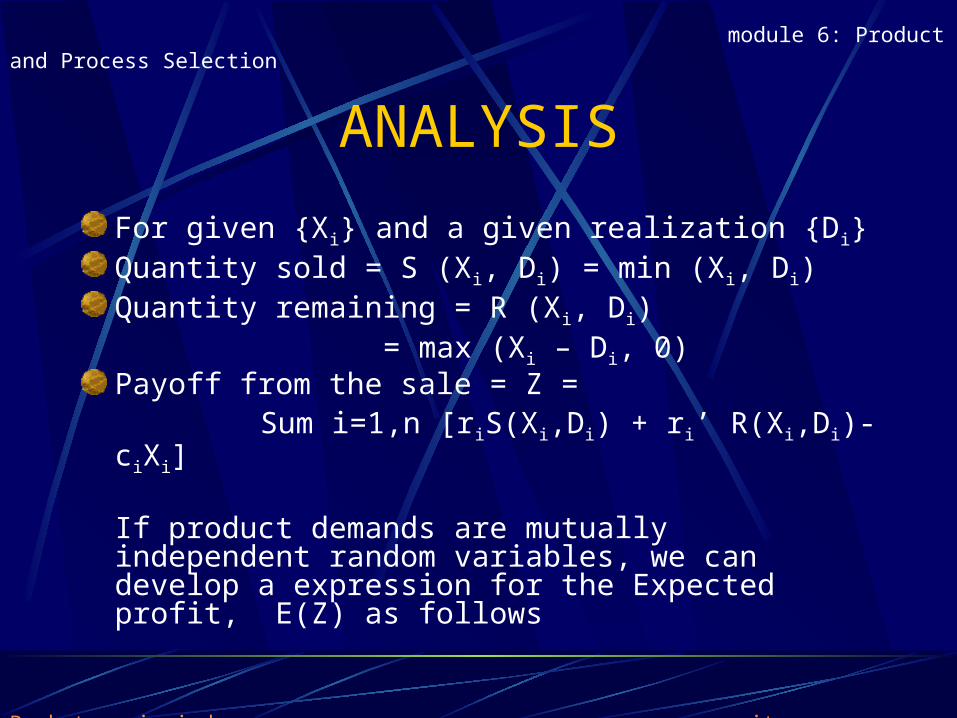
For given {Xi} and a given realization {Di}Quantity sold = S (Xi, Di) = min (Xi, Di)Quantity remaining = R (Xi, Di)
= max (Xi – Di, 0)Payoff from the sale = Z =
Sum i=1,n [riS(Xi,Di) + ri’ R(Xi,Di)- ciXi]
If product demands are mutually independent random variables, we can develop a expression for the Expected profit, E(Z) as follows
module 6: Product and Process Selection
Back to main index exit back to module contents
ANALYSIS(2)
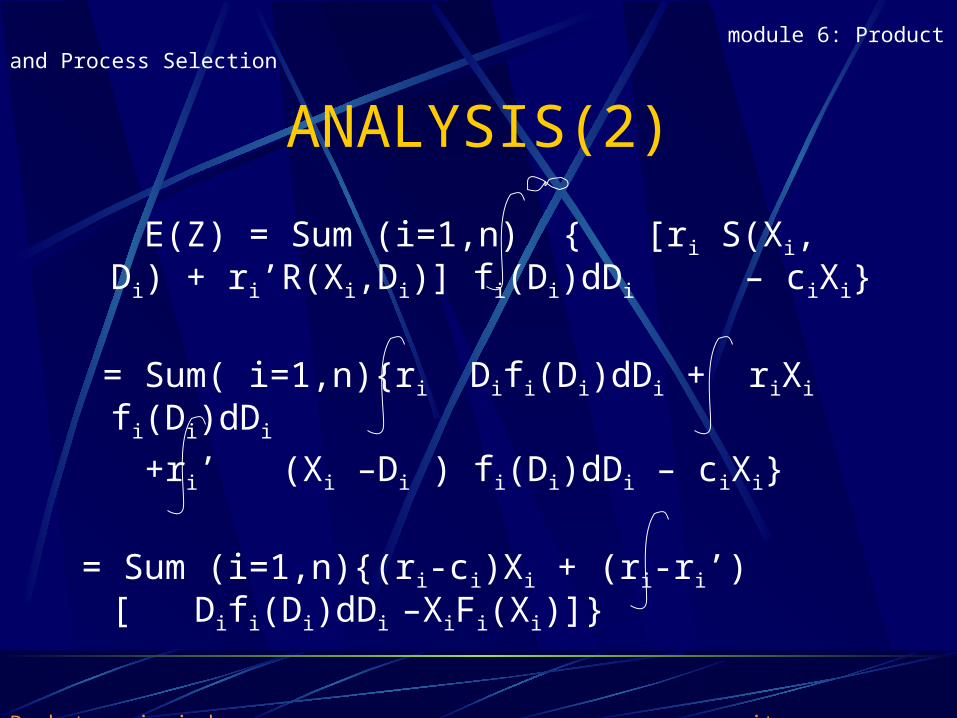
E(Z) = Sum (i=1,n) { [ri S(Xi, Di) + ri’R(Xi,Di)] fi(Di)dDi – ciXi}
= Sum( i=1,n){ri Difi(Di)dDi + riXi fi(Di)dDi
+ri’ (Xi –Di ) fi(Di)dDi – ciXi}
= Sum (i=1,n){(ri-ci)Xi + (ri-ri’)[ Difi(Di)dDi –XiFi(Xi)]}
module 6: Product and Process Selection
Back to main index exit back to module contents
ANALYSIS (3)
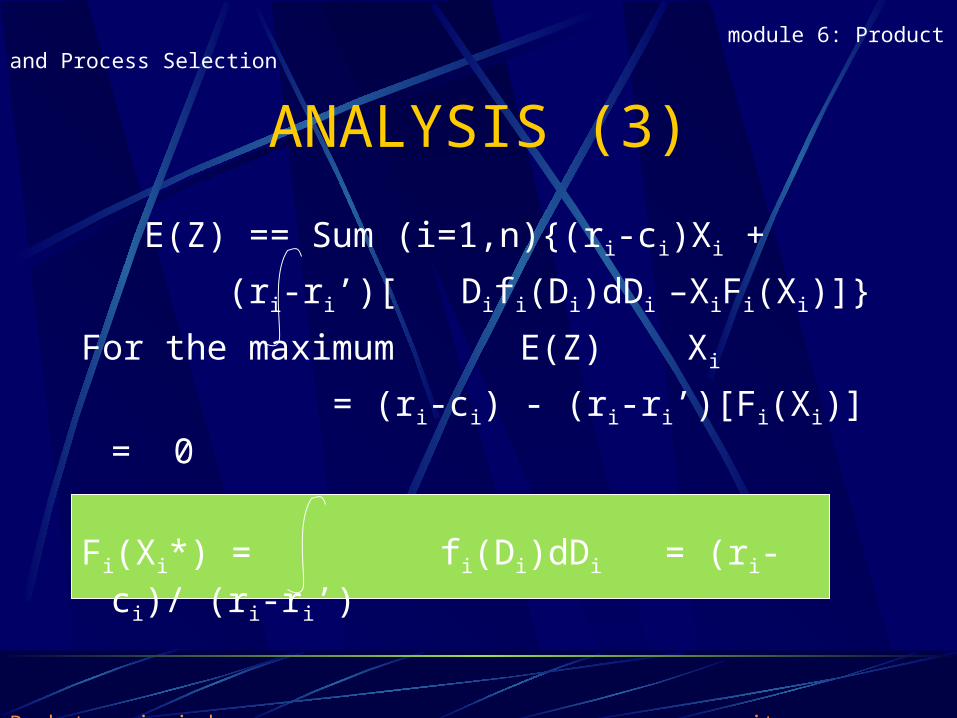
E(Z) == Sum (i=1,n){(ri-ci)Xi +
(ri-ri’)[ Difi(Di)dDi –XiFi(Xi)]}
For the maximum E(Z) Xi
= (ri-ci) - (ri-ri’)[Fi(Xi)] = 0
Fi(Xi*) = fi(Di)dDi = (ri- ci)/ (ri-ri’)
module 6: Product and Process Selection
Back to main index exit back to module contents
STOCHASTIC PRODUCT MIX
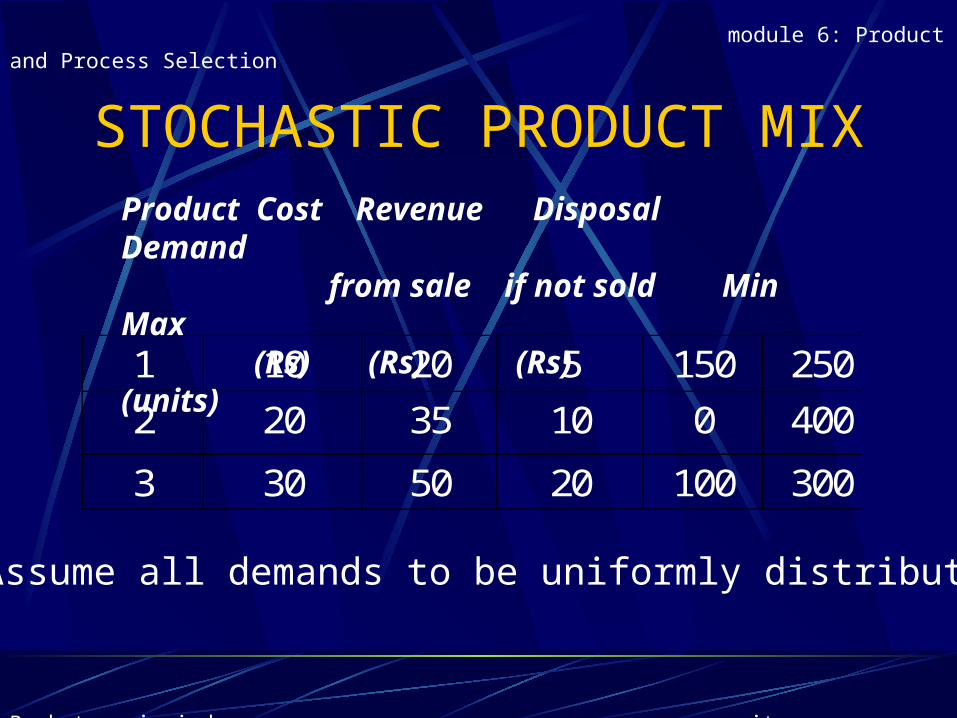
1 10 20 5 150 250
2 20 35 10 0 400
3 30 50 20 100 300
Product Cost Revenue Disposal Demand from sale if not sold Min Max (Rs) (Rs) (Rs) (units)
Assume all demands to be uniformly distributed
module 6: Product and Process Selection
Back to main index exit back to module contents
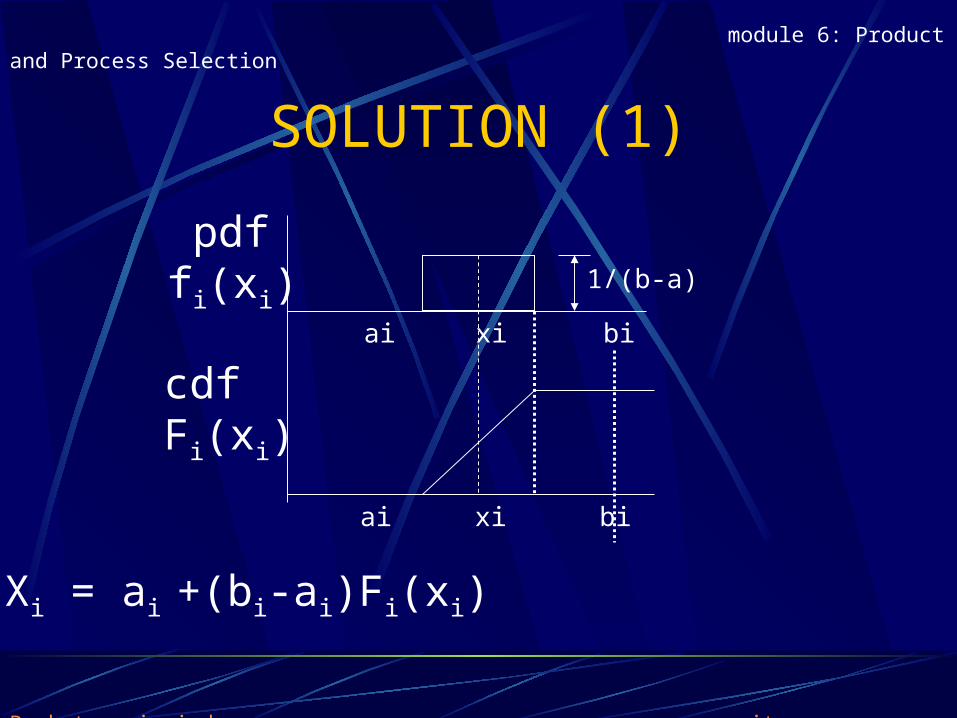
SOLUTION (1)
Xi = ai +(bi-ai)Fi(xi)
cdfFi(xi)
pdffi(xi)
ai xi bi
ai bi
1/(b-a)
xi
module 6: Product and Process Selection
Back to main index exit back to module contents
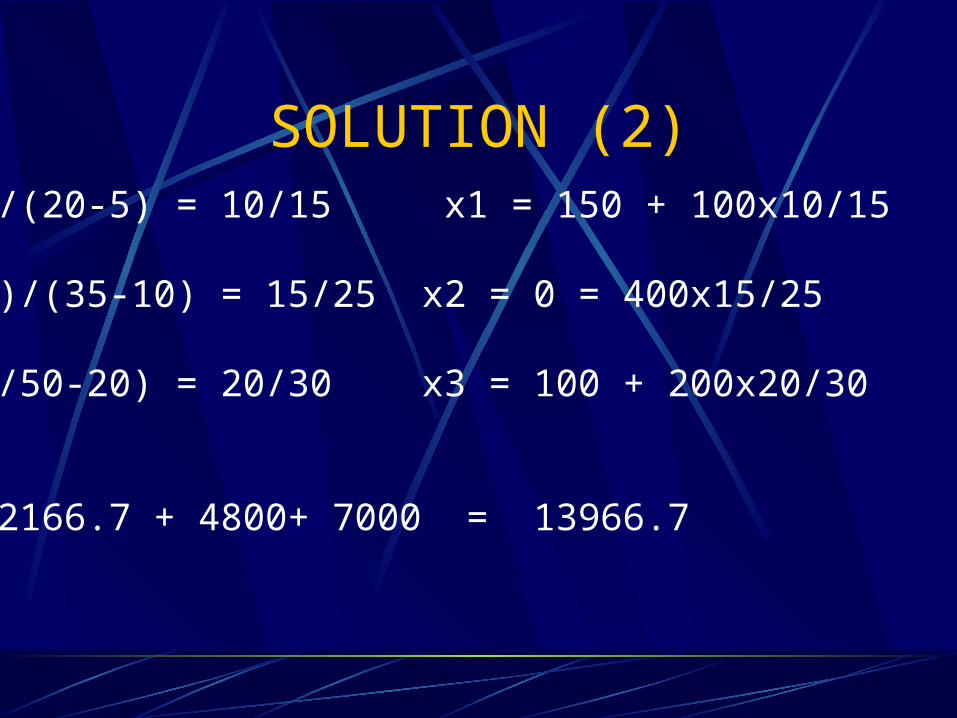
SOLUTION (2)F1(x1) = (20-10)/(20-5) = 10/15 x1 = 150 + 100x10/15 = 216.67F2 (x2) = (35-20)/(35-10) = 15/25 x2 = 0 = 400x15/25 = 240F3 (x3) = (50-30/50-20) = 20/30 x3 = 100 + 200x20/30 = 233.37
Investment = 2166.7 + 4800+ 7000 = 13966.7
SUMMARY
The motivation and considerations behind product mix considered
Some commonly used formulations of Product Mix illustrated with examples Linear Programming Formulation Goal Programming Formulation for
accommodating multiple goals Stochastic product mix for perishable items and
short term sale
module 6: Product and Process Selection
Back to main index exit back to module contents
4. Product and Process Selection
module 6: Product and Process Selection
Back to main index exit back to module contents
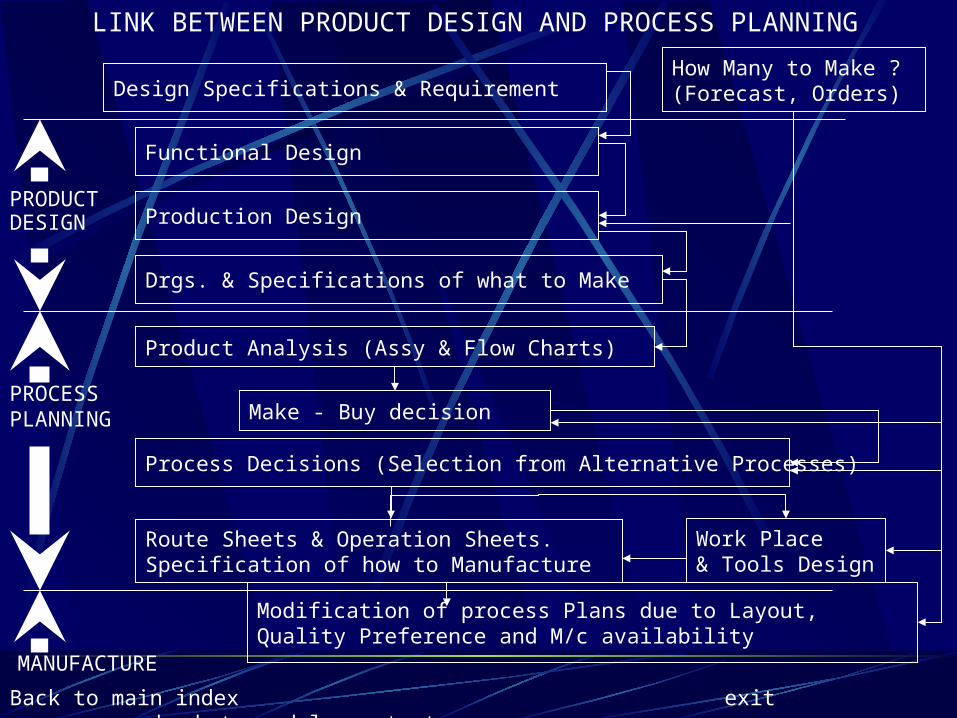
LINK BETWEEN PRODUCT DESIGN AND PROCESS PLANNING
Design Specifications & Requirement
Functional Design
Production Design
Drgs. & Specifications of what to Make
Product Analysis (Assy & Flow Charts)
Make - Buy decision
Process Decisions (Selection from Alternative Processes)
Route Sheets & Operation Sheets. Specification of how to Manufacture
Modification of process Plans due to Layout, Quality Preference and M/c availability
How Many to Make ?(Forecast, Orders)
Work Place& Tools Design
PRODUCTDESIGN
PROCESS PLANNING
MANUFACTURE
Back to main index exit back to module contents
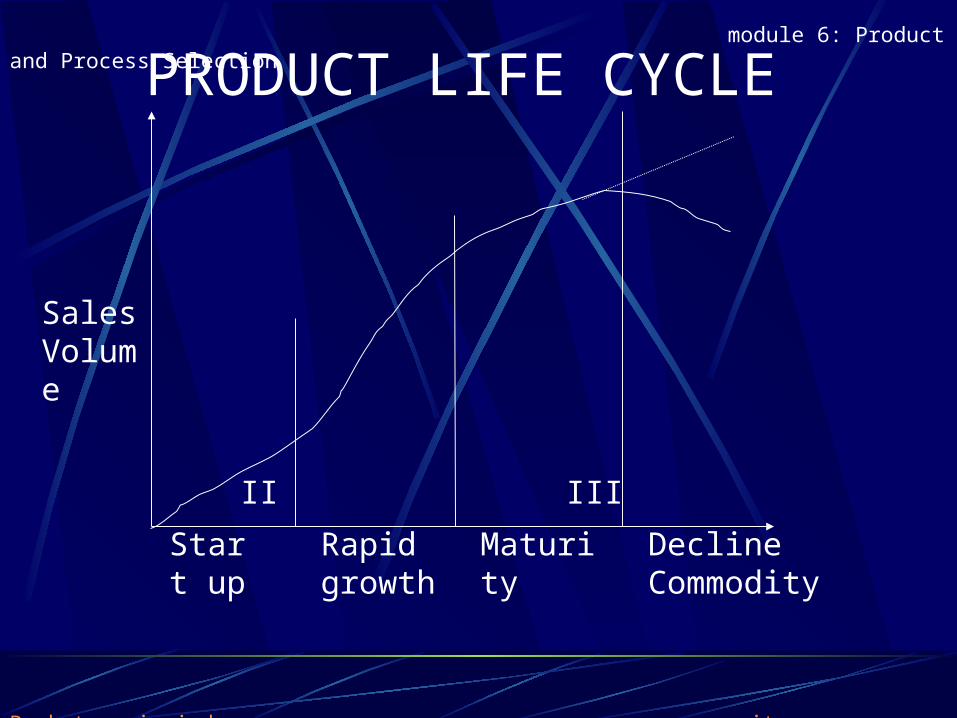
Start up
Rapid growth
Maturity Decline Commodity
Sales Volume
PRODUCT LIFE CYCLE
I II III IV Stages
module 6: Product and Process Selection
Back to main index exit back to module contents
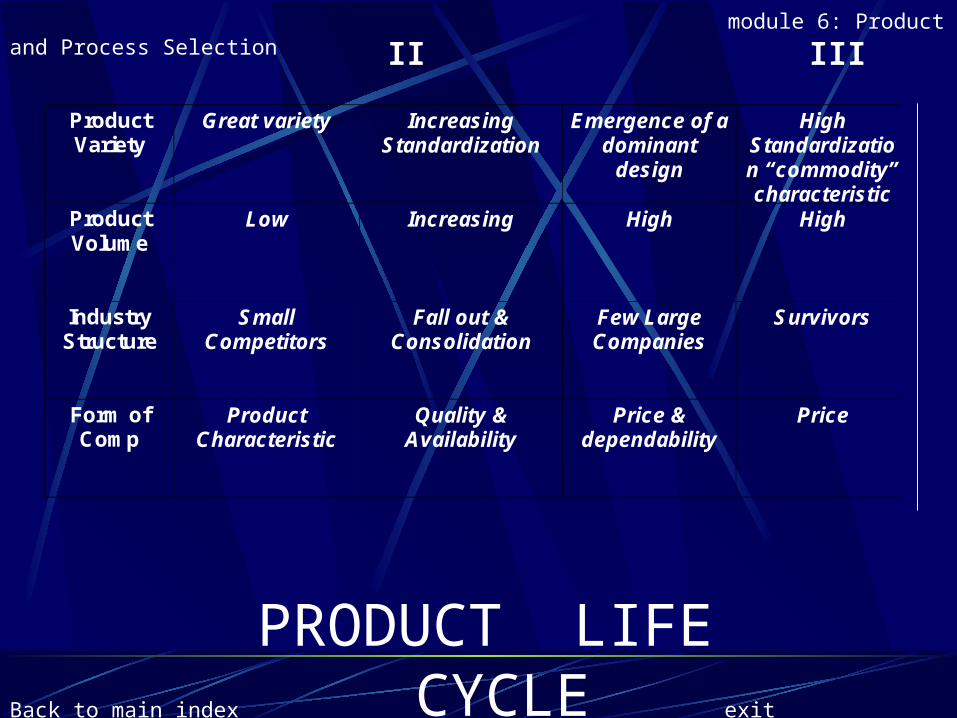
Product Variety
Great variety Increasing Standardization
Emergence of a dominant
design
High Standardization “commodity” characteristic
Product Volume
Low Increasing High High
Industry Structure
Small Competitors
Fall out & Consolidation
Few Large Companies
Survivors
Form of Comp
Product Characteristic
Quality & Availability
Price & dependability
Price
PRODUCT LIFE CYCLE
I II III IV module 6: Product and Process Selection
Back to main index exit back to module contents
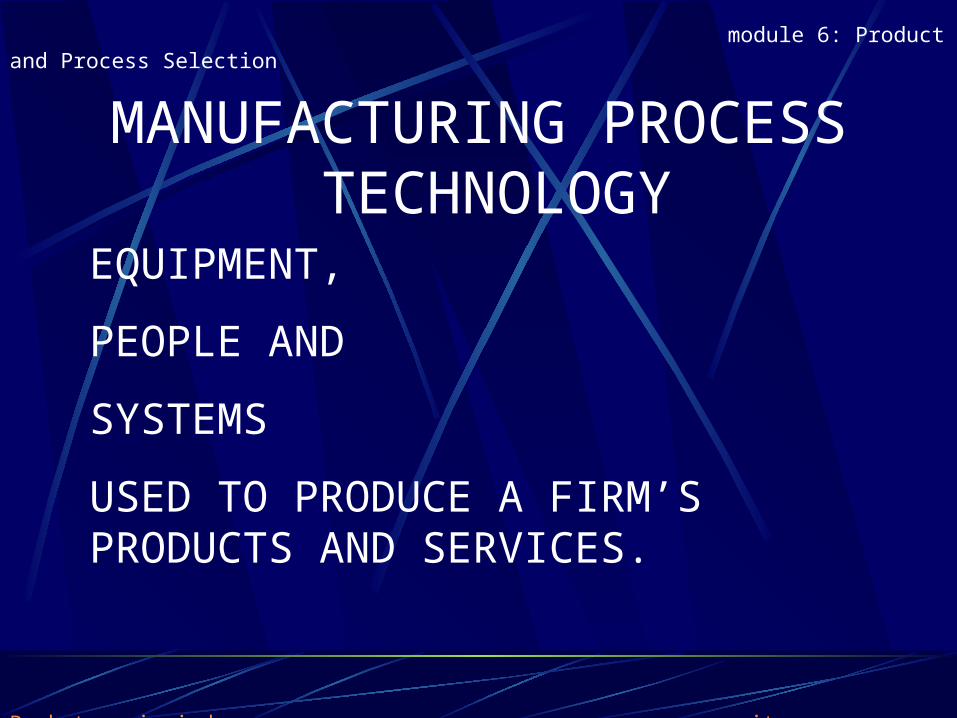
MANUFACTURING PROCESS TECHNOLOGY
EQUIPMENT,
PEOPLE AND
SYSTEMS
USED TO PRODUCE A FIRM’S PRODUCTS AND SERVICES.
module 6: Product and Process Selection
Back to main index exit back to module contents
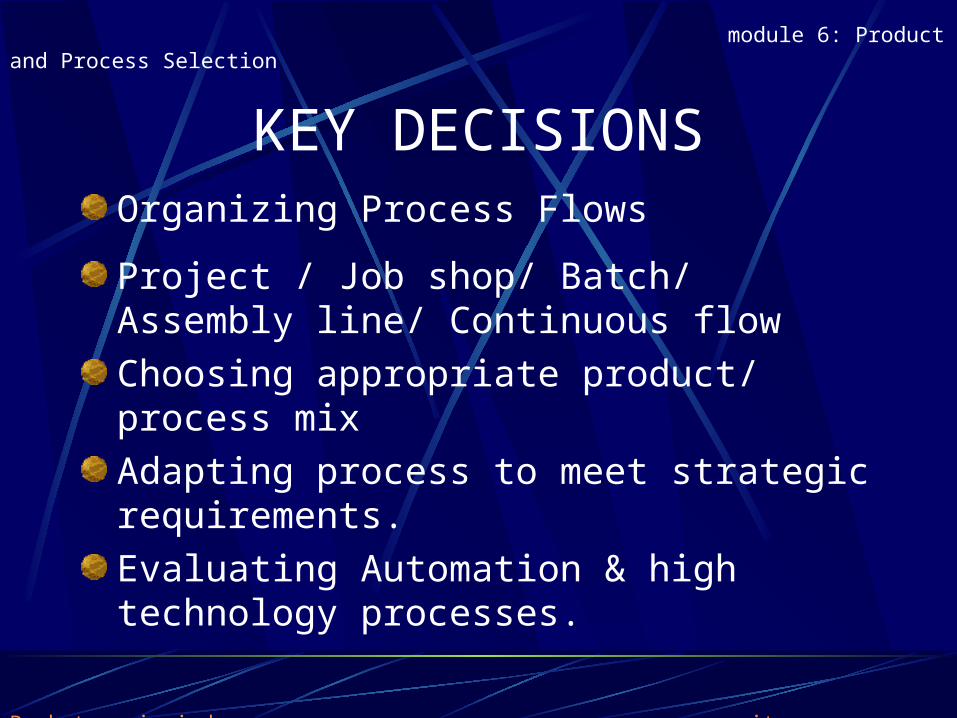
KEY DECISIONSOrganizing Process Flows
Project / Job shop/ Batch/ Assembly line/ Continuous flow
Choosing appropriate product/ process mix
Adapting process to meet strategic requirements.
Evaluating Automation & high technology processes.
module 6: Product and Process Selection
Back to main index exit back to module contents
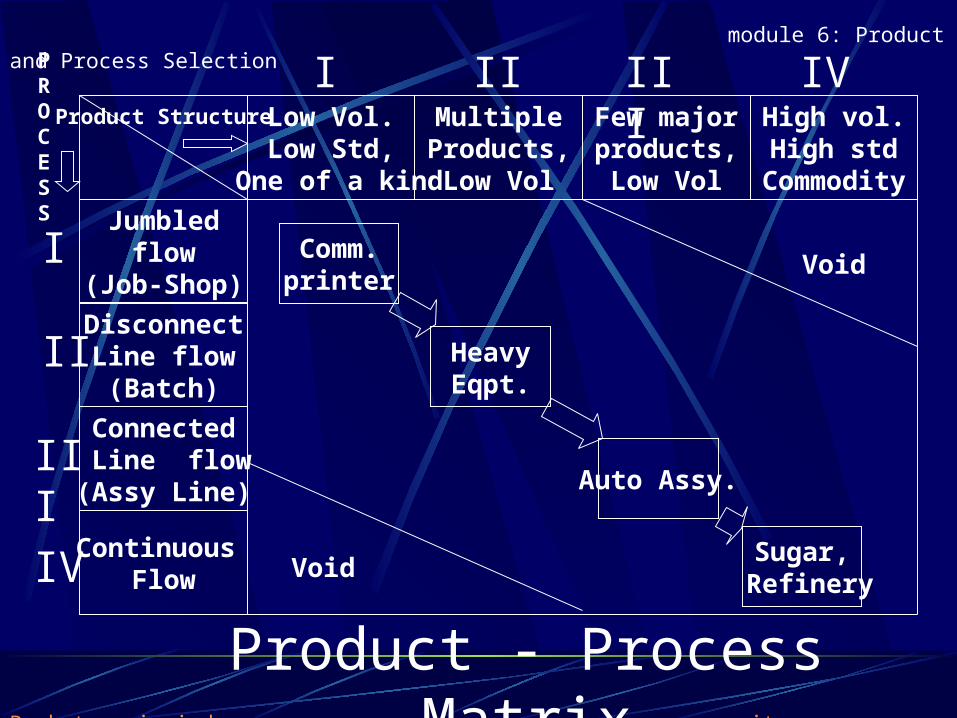
Product Structure Low Vol.Low Std,
One of a kind
MultipleProducts,Low Vol
Few majorproducts,Low Vol
High vol.High std
Commodity
Jumbledflow
(Job-Shop)
DisconnectLine flow(Batch)
Connected Line flow(Assy Line)
Continuous Flow
Comm.printer
HeavyEqpt.
Auto Assy.
Sugar, Refinery
Void
Void
I II III IV
I
II
III
IV
PROCESS
Product - Process Matrix
module 6: Product and Process Selection
Back to main index exit back to module contents
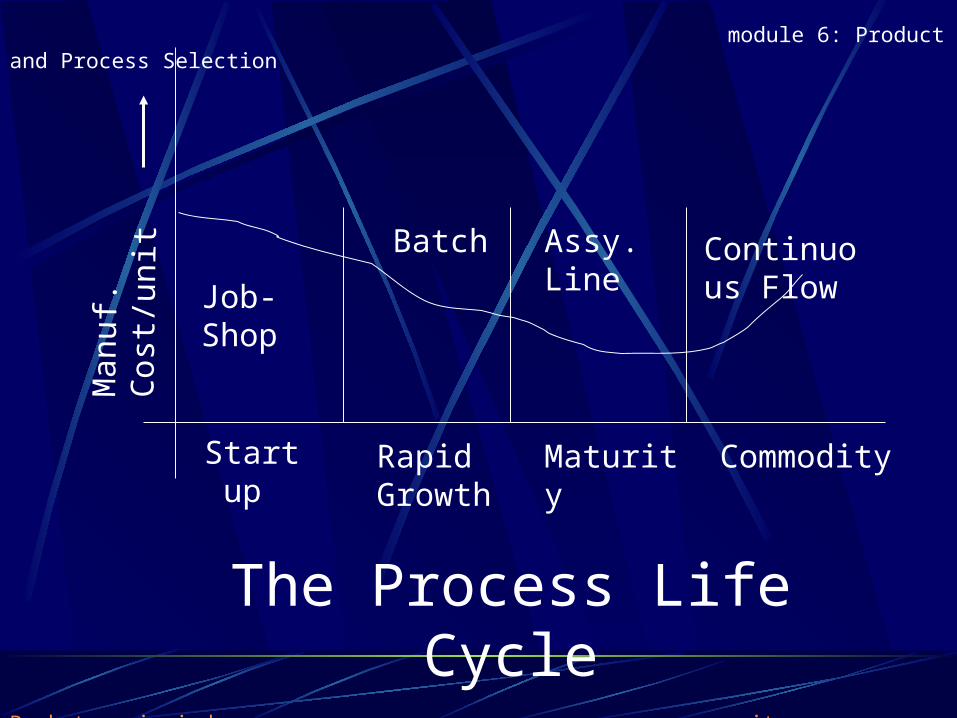
Job-Shop
Batch Assy. Line
Continuous Flow
Man
uf.
Cos
t/un
it
Rapid Growth
Maturity Commodity
The Process Life Cycle
Start up
module 6: Product and Process Selection
Back to main index exit back to module contents
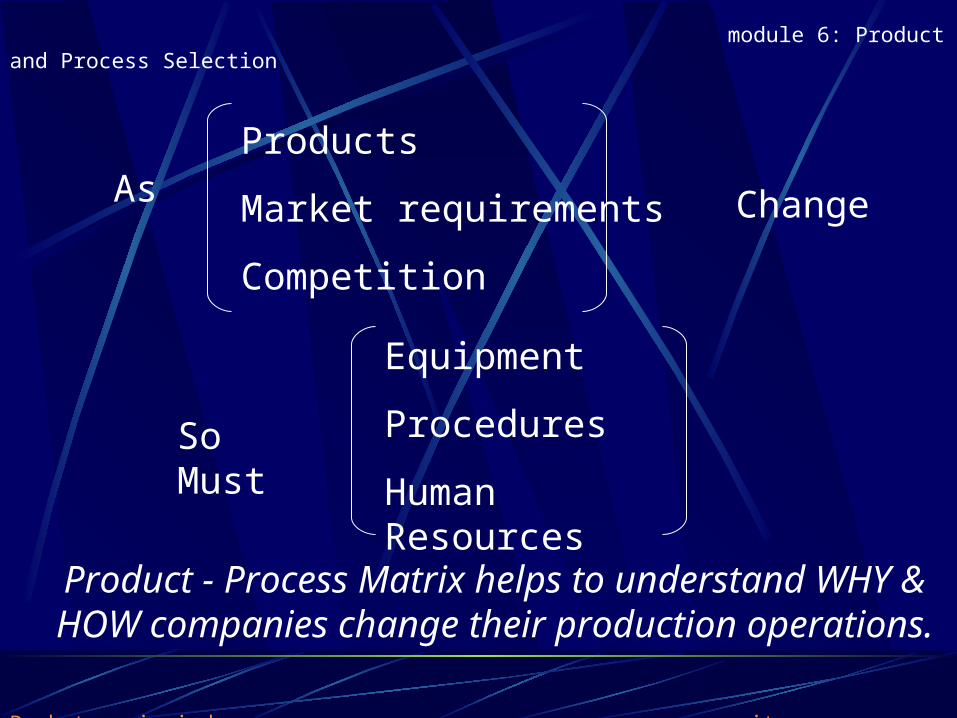
AsProducts
Market requirements
Competition
Change
So Must
Equipment
Procedures
Human Resources
Product - Process Matrix helps to understand WHY & HOW companies change their production operations.
module 6: Product and Process Selection
Back to main index exit back to module contents
DESIGN OF SERVICES AND SERVICE PROCESSES
SERVICE Design similar to PRODUCT DESIGN
except
Certain services may not require engineering testing components analysis prototype building
module 6: Product and Process Selection
Back to main index exit back to module contents
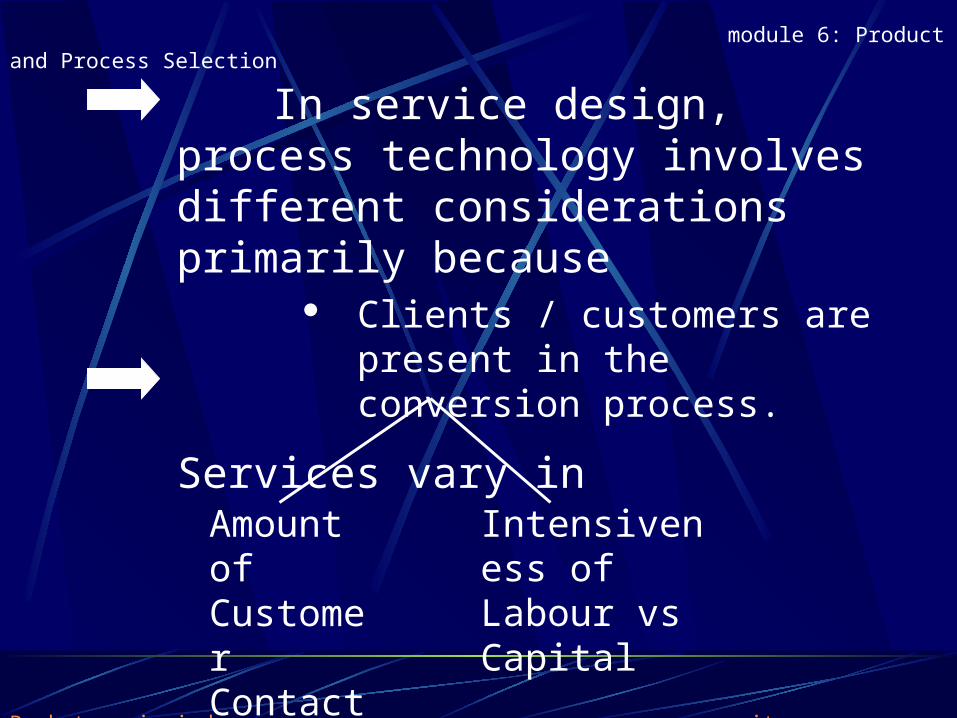
In service design, process technology involves different considerations primarily because
Clients / customers are present in the conversion process.
Services vary in
Amount of Customer Contact
Intensiveness of Labour vs Capital
module 6: Product and Process Selection
Back to main index exit back to module contents
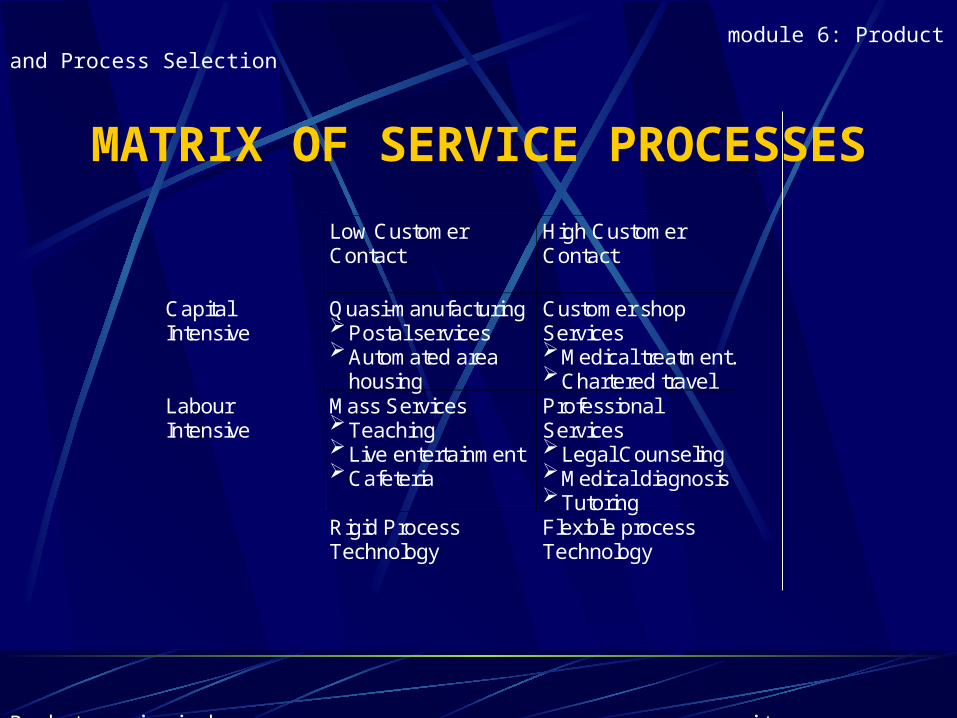
MATRIX OF SERVICE PROCESSES
Low Customer Contact
High Customer Contact
Capital Intensive
Quasi-manufacturing Postal services Automated area
housing
Customer shop Services Medical treatment. Chartered travel
Labour Intensive
Mass Services Teaching Live entertainment Cafeteria
Professional Services Legal Counseling Medical diagnosis Tutoring
Rigid Process Technology
Flexible process Technology
module 6: Product and Process Selection
Back to main index exit back to module contents
AUTOMATION
Automated banking
Electronic grocery scanners
Office automation
module 6: Product and Process Selection
Back to main index exit back to module contents
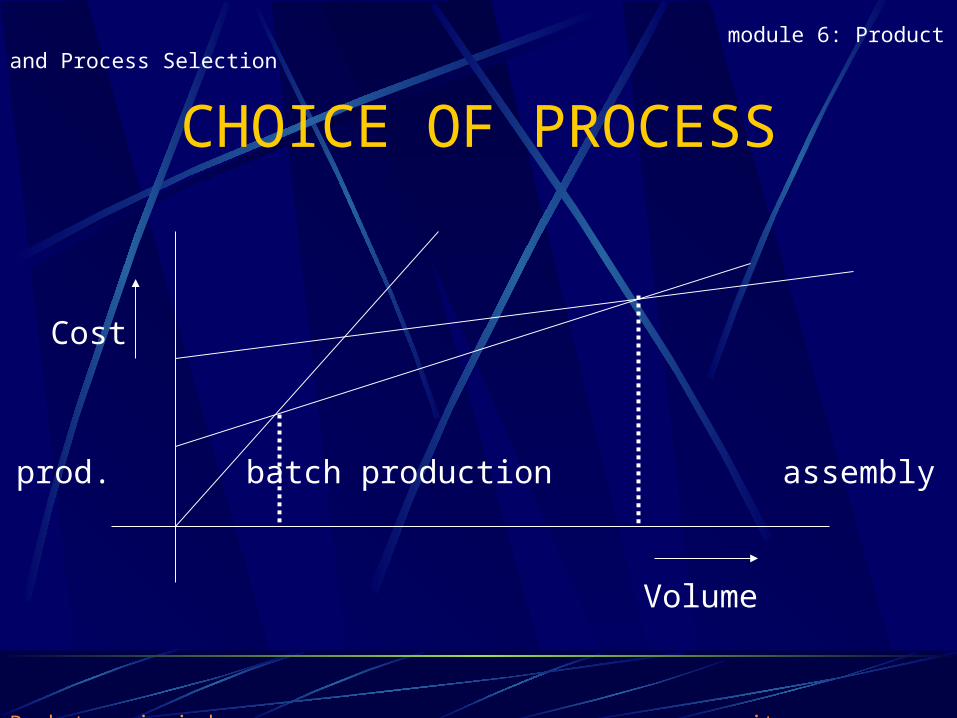
CHOICE OF PROCESS
Volume
Cost
Job prod. batch production assembly line
module 6: Product and Process Selection
Back to main index exit back to module contents
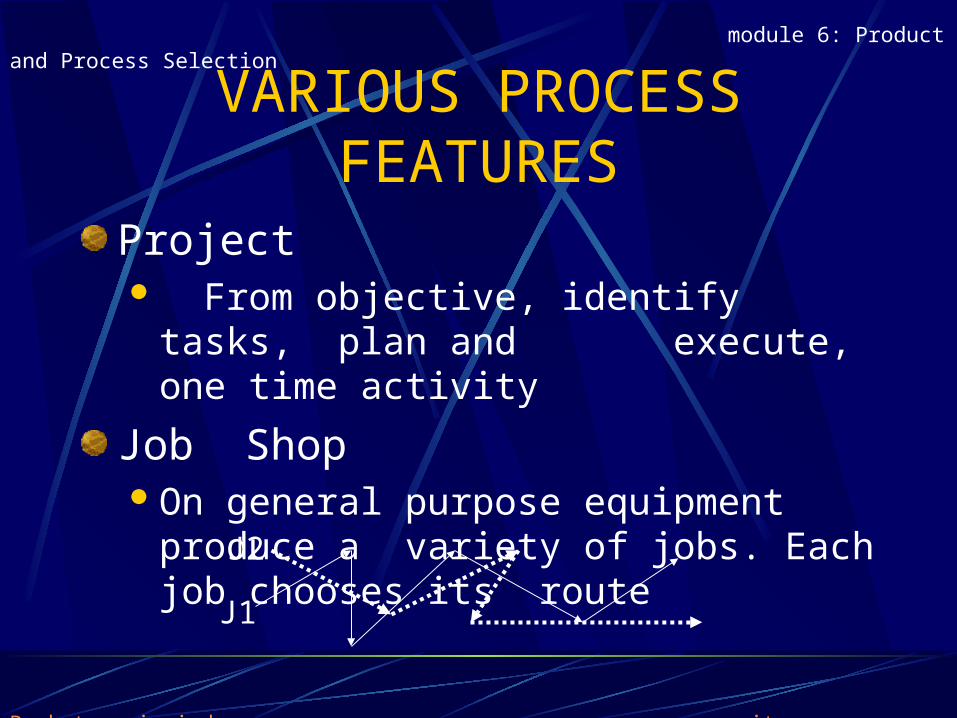
VARIOUS PROCESS FEATURES
Project From objective, identify tasks, plan and
execute, one time activity
Job Shop On general purpose equipment produce a
variety of jobs. Each job chooses its route
J1
J2
module 6: Product and Process Selection
Back to main index exit back to module contents
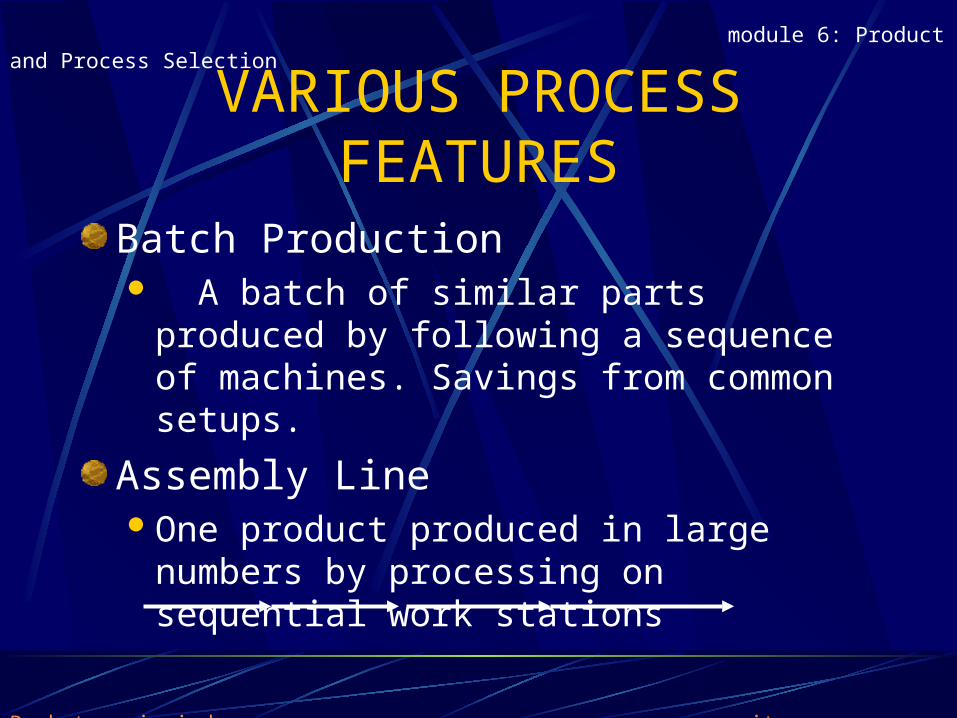
VARIOUS PROCESS FEATURES
Batch Production A batch of similar parts produced by
following a sequence of machines. Savings from common setups.
Assembly Line One product produced in large numbers by
processing on sequential work stations
module 6: Product and Process Selection
Back to main index exit back to module contents
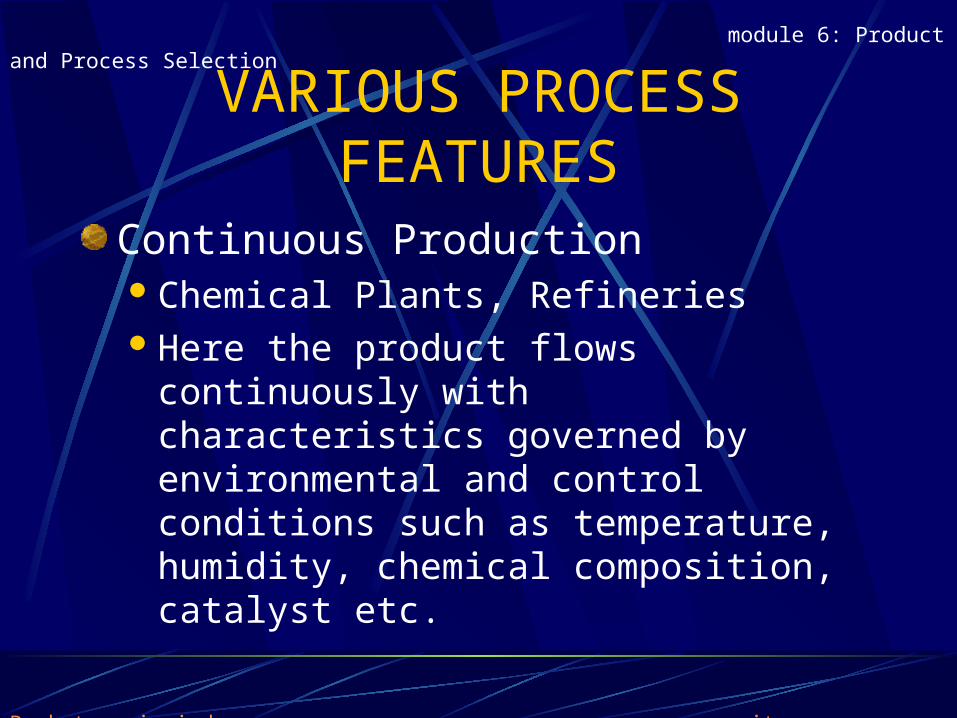
VARIOUS PROCESS FEATURES
Continuous ProductionChemical Plants, RefineriesHere the product flows continuously with
characteristics governed by environmental and control conditions such as temperature, humidity, chemical composition, catalyst etc.
module 6: Product and Process Selection
Back to main index exit back to module contents
SUMMARY
The Product undergoes varying requirements during its lifecycle
Different processes serve different needs
Product- Process Matrix captures the relationship
Process life cycle gives how processes mature
Service matrix for categories of service
module 6: Product and Process Selection
Back to main index exit back to module contents
SUMMARY (CONTD)
Features of different processing modesProjectsJob ProductionBatch ProductionAssembly LinesContinuous Production
Economic Selection of Optimal Process
module 6: Product and Process Selection
Back to main index exit back to module contents