program analysis & evaluation 1 © 2006 july 13, 2015 11/18/98 2:13 pm research sponsors robert...
Post on 22-Dec-2015
213 views
TRANSCRIPT
April 19, 202311/18/98 2:13 PM
Program Analysis & Evaluation
1© 2006
Research SponsorsRobert Flowe, Gary BlissOSD Program Analysis and Evaluation, Resource Analysis
Capabilities Based Cost AnalysisCapabilities Based Cost Analysis Adapting to a New ParadigmAdapting to a New Paradigm
Overview of an OSD-Sponsored Research Project*Overview of an OSD-Sponsored Research Project* Principal Researchers
Dr. Maureen Brown, Mr. Sean HamelUniversity of North Carolina School of Government
Dr. David Zubrow, Mr. Bill Anderson, Mr. Jim McCurley
Software Engineering Institute
Mr. Robert Jones, Ms. Elizabeth Koza,
Mr. John Wilke, Mr. Paul HardinTechnomics, Inc.
Dr. David UsechakOSEC
Supporting Co-SponsorsOffice of the Under Secretary of Defense (Acquisition Technology & Logistics)
Air Force Cost Analysis Agency
Office of the Deputy Assistant Secretary of the Army for Cost and Economics
*The views expressed in this presentation are those of the author, and should not be construed as representing the views of the Department of Defense, or its components

April 19, 202311/18/98 2:13 PM
Program Analysis & Evaluation
2© 2006
AGENDA
• Background Capabilities & Portfolio Management (C/PM) Issues Interdependence and Outcomes Hypothesis
• Risk Indicators – Software Engineering Institute Interdependence and Acquisition Risk
• Interdependence – University of North Carolina Programmatic Interdependence and Cost/Schedule Breaches
• Architectural Parametric Modeling – Technomics Constructive Interdependence and Development Resource
Demands
• Next Steps

April 19, 202311/18/98 2:13 PM
Program Analysis & Evaluation
3© 2006
Three “Domains” of Interdependence
Programmatic - Acquisition and management practices
Constructive – Technical construction activities
Operational – Mission, goals, objectives, and their fulfillment
programmatic
operational
constructive
April 19, 202311/18/98 2:13 PM
Program Analysis & Evaluation
4© 2006
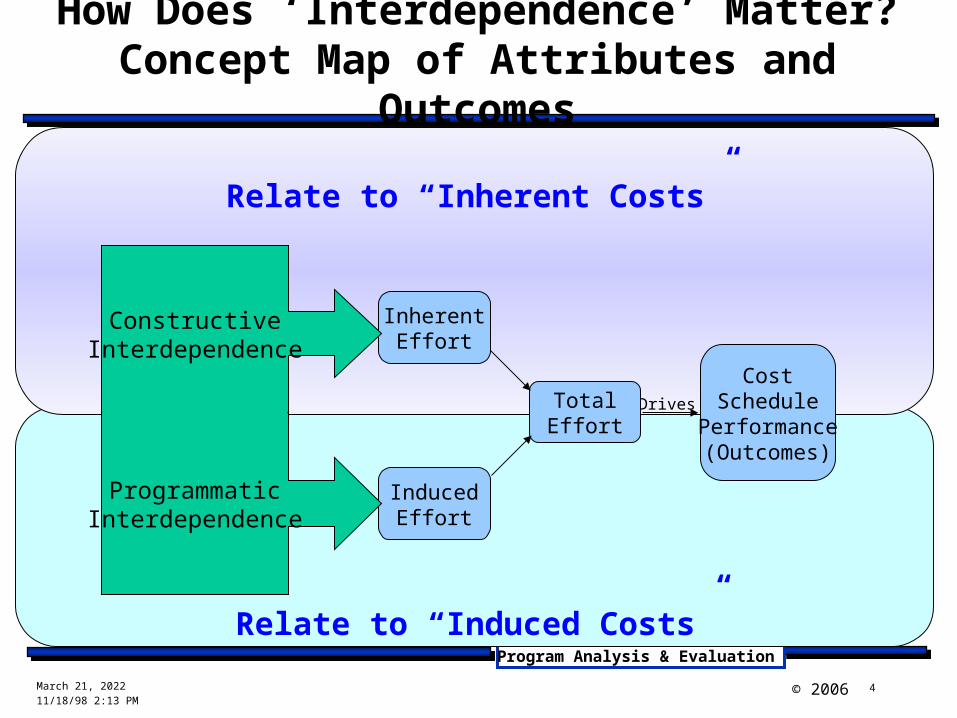
Relate to “Induced Costs”
Relate to “Inherent Costs”
How Does ‘Interdependence’ Matter?Concept Map of Attributes and Outcomes
CostSchedule
Performance(Outcomes)
DrivesTotalEffort
InherentEffort
InducedEffort
ConstructiveInterdependence
ProgrammaticInterdependence

April 19, 202311/18/98 2:13 PM
Program Analysis & Evaluation
5© 2006
C/PM vs “Big”– Management Issues
• Capability and portfolio management (C/PM) drives cooperative management of entities which are developed and managed separately
• This creates induced costs due to (for example) decentralized management and independent authority
of constituent systems asymmetrical incentives for SoS vs constituent
objects/systems goals and objectives different maturities of the objects/systems
C/PM incurs effects beyond scale alone
April 19, 202311/18/98 2:13 PM
Program Analysis & Evaluation
6© 2006
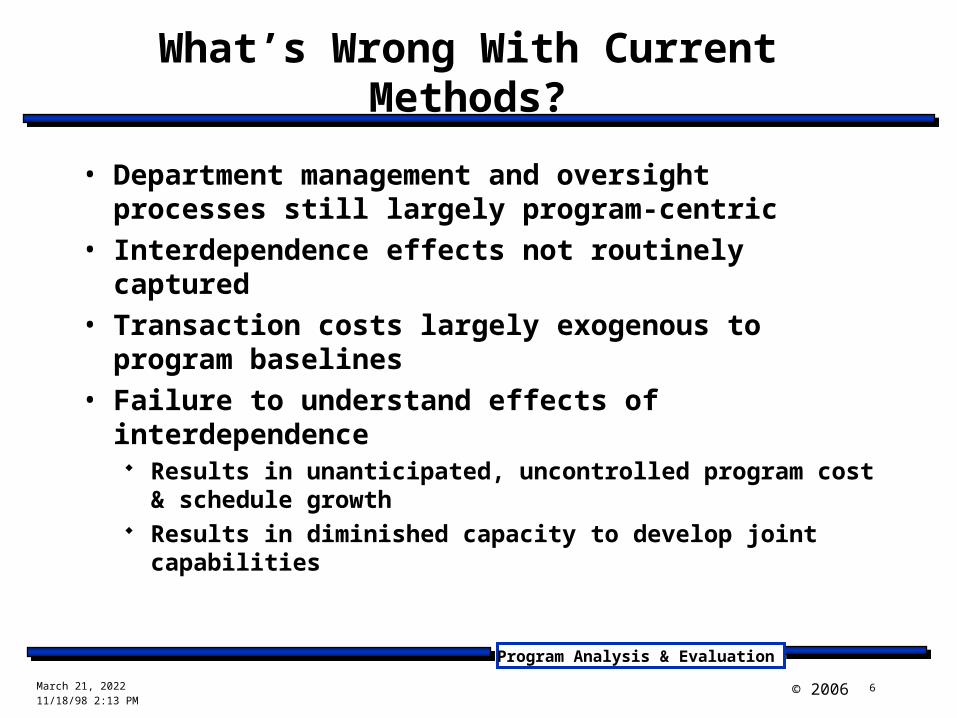
What’s Wrong With Current Methods?
• Department management and oversight processes still largely program-centric
• Interdependence effects not routinely captured• Transaction costs largely exogenous to program
baselines• Failure to understand effects of interdependence
Results in unanticipated, uncontrolled program cost & schedule growth
Results in diminished capacity to develop joint capabilities
April 19, 202311/18/98 2:13 PM
Program Analysis & Evaluation
7© 2006
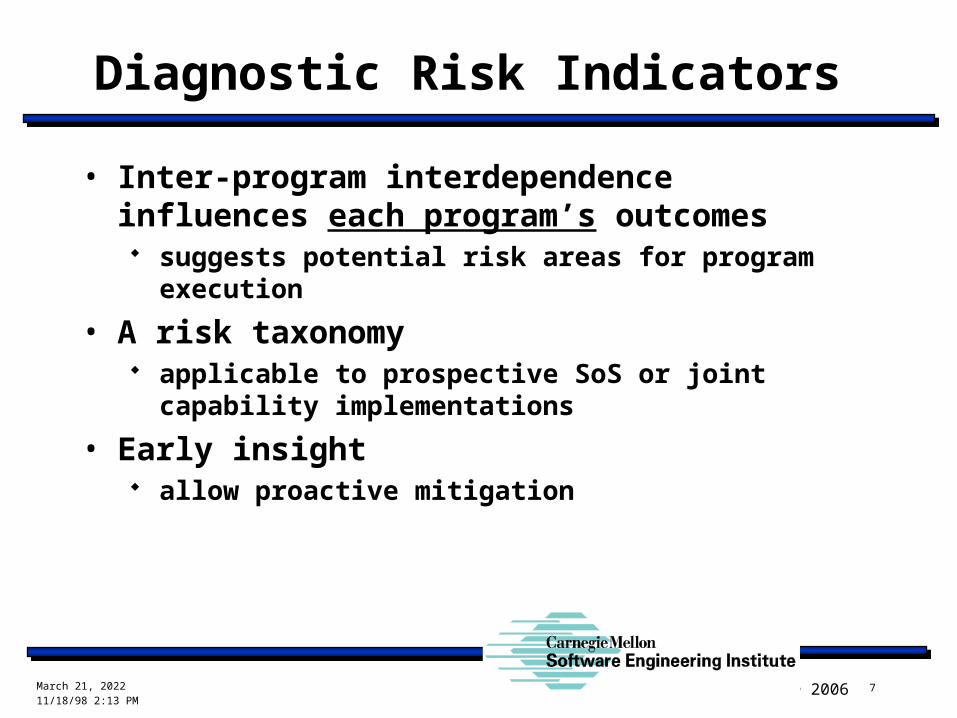
Diagnostic Risk Indicators
• Inter-program interdependence influences each program’s outcomes suggests potential risk areas for program execution
• A risk taxonomy applicable to prospective SoS or joint capability
implementations
• Early insight allow proactive mitigation

April 19, 202311/18/98 2:13 PM
Program Analysis & Evaluation
8© 2006
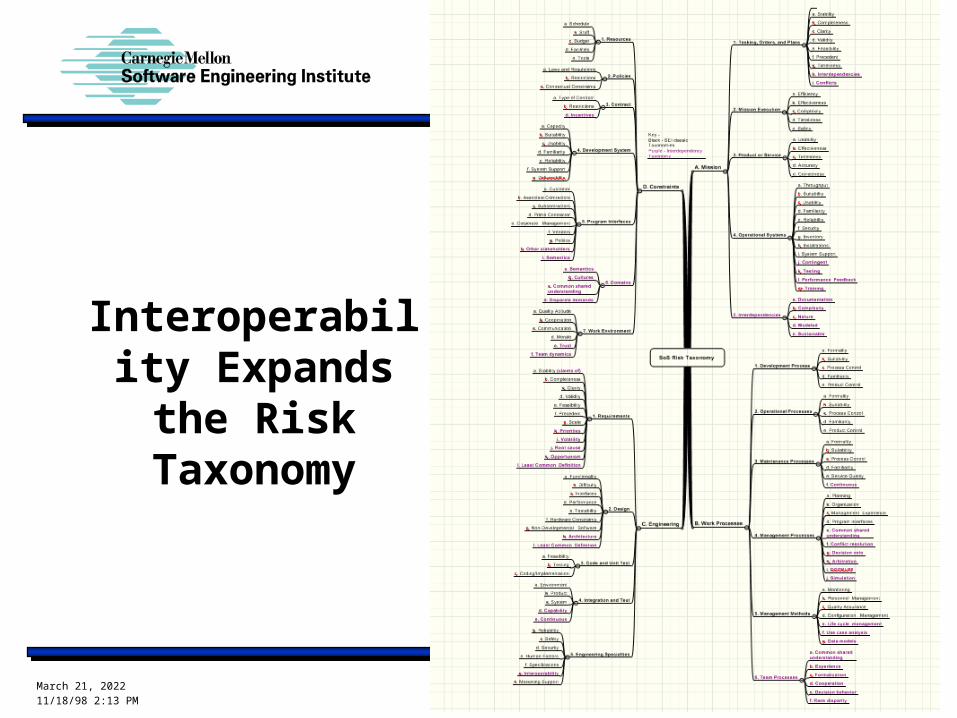
Systems-of-Systems Risk Taxonomy

April 19, 202311/18/98 2:13 PM
Program Analysis & Evaluation
9© 2006
In Systems-of-Systems, the requirement for interoperability expands the Risk Taxonomy
April 19, 202311/18/98 2:13 PM
Program Analysis & Evaluation
10© 2006
Interoperability Expands the
Risk Taxonomy

April 19, 202311/18/98 2:13 PM
Program Analysis & Evaluation
11© 2006
Observations of Joint Capabilities & Interdependence
• No program is an “Island”• Programs share and transfer
resources across programmatic boundaries
• These “resources” include: Capital Materiel Labor Authority Data

April 19, 202311/18/98 2:13 PM
Program Analysis & Evaluation
12© 2006
Observation: Interdependence Correlates to Schedule Slippage
April 19, 202311/18/98 2:13 PM
Program Analysis & Evaluation
13© 2006
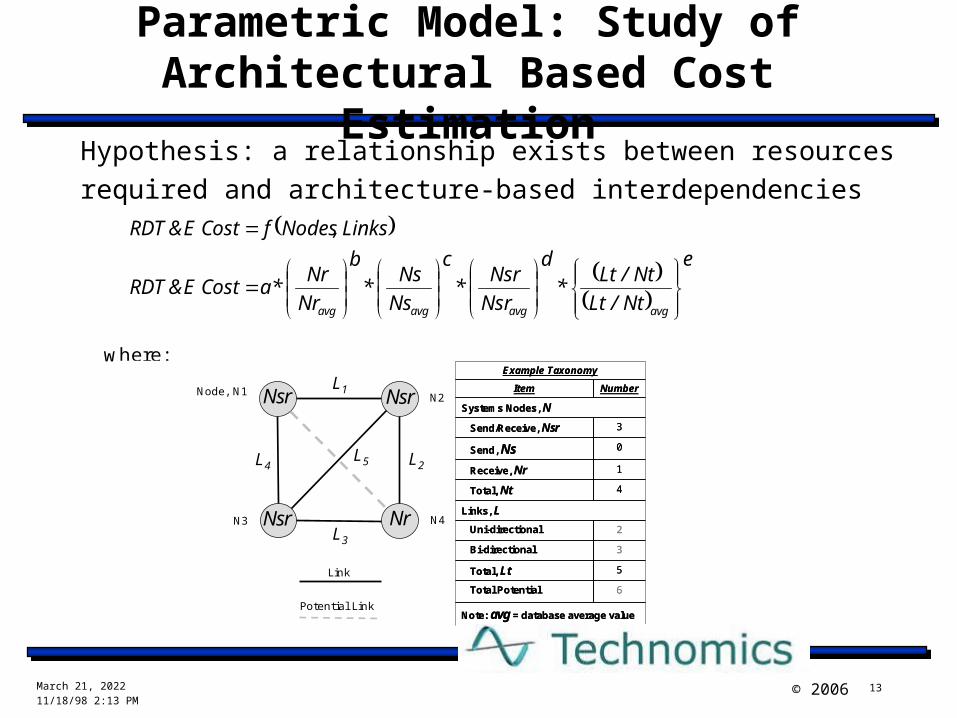
Parametric Model: Study of Architectural Based Cost Estimation
Hypothesis: a relationship exists between resourcesrequired and architecture-based interdependencies
where:
a, b, c, d, and e are the parameters to be estimatedNr = number of receiver Systems NodesNs = number of sender Systems NodesNsr = number of sender and receiver Systems NodesNt = total number of Systems NodesLt = total number of Linksavg = database average value
)4.(Eq
e
Nt/Lt
Nt/Lt*
d
Nsr
Nsr*
c
Ns
Ns*
b
Nr
Nr*aCostE&RDT
Links,NodesfCostE&RDT
avgavgavgavg
Potential Link
Example Taxonomy
Note: avg = database average value
Systems Nodes, N
6Total Potential
5Total, Lt
3Bi-directional
2Uni-directional
Links, L
4Total, Nt
1Receive, Nr
0Send, Ns
3Send/Receive, Nsr
NumberItem
Example Taxonomy
Note: avg = database average value
Systems Nodes, N
6Total Potential
5Total, Lt
3Bi-directional
2Uni-directional
Links, L
4Total, Nt
1Receive, Nr
0Send, Ns
3Send/Receive, Nsr
NumberItemNsr Nsr
Nsr Nr
Node, N1N2
N3 N4
Link
L1
L2
L3
L4L5
April 19, 202311/18/98 2:13 PM
Program Analysis & Evaluation
14© 2006
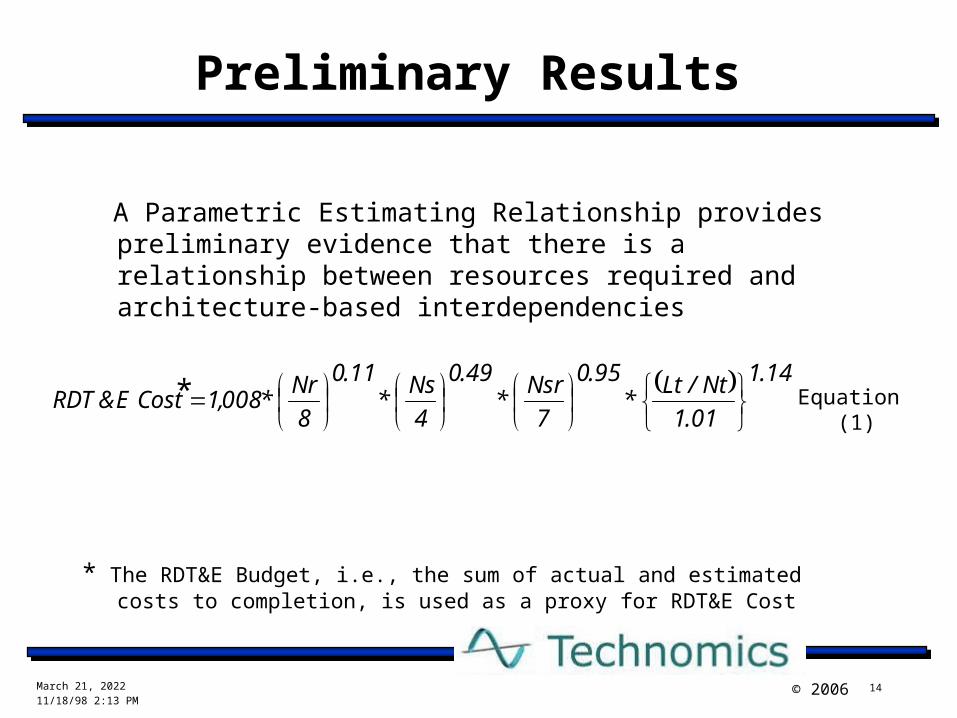
Preliminary Results
A Parametric Estimating Relationship provides preliminary evidence that there is a relationship between resources required and architecture-based interdependencies
* The RDT&E Budget, i.e., the sum of actual and estimated costs to completion, is used as a proxy for RDT&E Cost
14.1
01.1
Nt/Lt*
95.0
7
Nsr*
49.0
4
Ns*
11.0
8
Nr*008,1CostE&RDT
Equation (1)*

April 19, 202311/18/98 2:13 PM
Program Analysis & Evaluation
15© 2006
Parametric Model: Study of Architectural Based Cost Estimation
$0
$200
$400
$600
$800
$1,000
$1,200
$1,400
$1,600
$1,800
$2,000
MDAP 1 MDAP 2 MDAP 3 MDAP 4 MDAP 5 MDAP 6 MDAP 7 MDAP 8
FY2005$M RDT&E Total Budget
RDT&E Cost (Estimate)
RDT&E Total Budget = Actual + EstimatedFor MDAP 1 - 8, Actual / Total = 0.0 to 0.32For MDAP 9 - 10, Actual / Total = 0.17 to 0.57
$0
$5,000
$10,000
$15,000
$20,000
$25,000
$30,000
MDAP 9 MDAP 10
FY2005$M
RDT&ETotal
Budget
RDT&ECost
(Estimate)
Predictions for 2 additional Major Defense Acquisition Programs (MDAPs)
Results: Preliminary analysis using Equation (1) supports the hypothesis that a relationship exists between resources required and architecture-based interdependencies
Next Step: Apply analysis approach to programs using costs instead of budgets

April 19, 202311/18/98 2:13 PM
Program Analysis & Evaluation
16© 2006
Next Steps
• Technical Research Pilot Study
• Model detailed relationships• Develop representation of overall program properties• Validate data gathering & analysis methods
Risk Indicators• Continuing analysis for confirmation of risk indicators
Interdependence Cost and Schedule Consequences• Expand data points and refine Cost Estimating Relationships• Explore portfolio analysis for targets of interest
• Collaborations Continue collaborative work with Services & AT&L Seek collaboration with ASD/NII on DoDAF Develop collaborations with T&E community for test data