profile - ship.edu · profile a historical fact book through ... css/geography (bsed) (obsolete)...
TRANSCRIPT

PROFILE
A Historical Fact Book
through
the 2006-2007 Academic Year
Office of Institutional Research and Planning
A proud member of Pennsylvania’s State System of Higher Education

TABLE OF CONTENTS I. Undergraduate Data
Enrollment
Headcount and Credit Hours Majors
Fall ...........................................................................................................................1 Spring .......................................................................................................................5 Summer ....................................................................................................................9
Certificate Enrollment ...................................................................................................14 Minors
Fall .........................................................................................................................15 Spring .....................................................................................................................17
County ................................................................................................................................19 State ...................................................................................................................................20 Country of Residence .........................................................................................................21 College and Class Level ....................................................................................................22 Residence and Class Level ............................................................................................... 24 Full and Part-Time by Gender, Minority by Gender ....................................................... 25 Age and Gender, Full-Time and Part-Time ...................................................................... 26
Admissions Application and Enrollment ..............................................................................................28 New Freshmen by Major and Ability Indicators ...............................................................29 New Freshmen by Gender, Minority by Gender ...............................................................32 New Transfers by Major, Class Level and Incoming Mean GPA .....................................33 New Transfers by Gender, Minority by Gender ................................................................36 New Transfers by Former Institution .................................................................................37 New Transfers by Class Level, First Semester Mean GPA and Gender ...........................38
Undergraduate GPA’s Cumulative Mean GPA’s by College and Gender .............................................................39 II. Graduate Data
Enrollment
Headcount and Credit Hours Majors
Fall .........................................................................................................................40 Spring .....................................................................................................................42 Summer ..................................................................................................................44
Certificate Enrollment ...................................................................................................47 County ................................................................................................................................48
State ...................................................................................................................................49 Country of Residence .........................................................................................................50 College and Gender ...........................................................................................................51 Full and Part-Time by Gender, Minority by Gender .........................................................52 Age and Gender, Full-Time and Part-Time .......................................................................53
Admissions Application and Enrollment by Gender .............................................................................55

III. Degrees and Alumni
Undergraduate Degrees Conferred ....................................................................................56 Graduate Degrees Conferred .............................................................................................60 Pennsylvania Alumni by County .......................................................................................62 Alumni by State .................................................................................................................63 Living Alumni ....................................................................................................................64
IV. Employees
Job Classification, Full and Part-Time ..............................................................................66 Full Time by Job Classification, Race and Gender ...........................................................67
V. Budget and Finances
Tuition History ...................................................................................................................69 Financial Aid ......................................................................................................................70 Financial Aid Award History .............................................................................................72 Current Unrestricted Funds ................................................................................................74 Current Restricted Funds, Grant Activity ..........................................................................77 Funding Formula Data .......................................................................................................78 Physical Facilities ..............................................................................................................79
VI. Miscellaneous Data
History of the University ...................................................................................................81 Degree Programs ................................................................................................................82
Historical Enrollment .........................................................................................................85 Library Acquisitions and Holdings ....................................................................................87 Information and Computing Technologies ........................................................................88 ROTC .................................................................................................................................90
VII. Charts and Maps
Undergraduate Headcount by College and Major Undergraduate Degrees by College and Major
Undergraduate Headcount by County & State Alumni by County & State Full Time & Part Time Students by Age
Graduate Headcount by Area Graduate Headcount by County Graduate Degrees by Area

I. Undergraduate Data

a/ 1 UNDERGRADUATE HEADCOUNT AND CREDIT HOURS
College of Arts and Sciences Fall '03 Fall '04 Fall '05 Fall '06
Degree Program Head Credit Head Credit Head Credit Head Credit Concentration Count Hours Count Hours Count Hours Count Hours
Art (BA) 67 932 86 1216 74 1017 81 1180 Computer Graphics 14 202 19 268 26 378 23 325Art/Secondary Ed. Certification (BA) ---- ---- 1 15 25 356 36 529
Biology (BS) 90 1273 95 1351 89 1256 89 1251 Biotechnology 23 330 19 273 15 219 12 176 Ecology & Environmental Biology 27 400 31 474 29 428 26 366 Health Professions 102 1462 93 1348 98 1409 90 1306 Health Sciences (TJU) 18 279 19 286 20 291 23 342 Medical Technology 11 156 8 98 5 64 9 131Biology/Secondary Ed. Certification (BS) 17 260 18 283 17 257 14 209 Ecology & Environment ---- ---- ---- ---- ---- ---- 1 16 Environmental Education 6 92 4 56 1 17 2 32Medical Technology (BS) (Obsolete) 1 17 0 0 0 0 0 0
Chemistry (BS) 35 482 31 414 19 248 31 456 Biochemistry 8 120 14 196 15 213 19 268 Health Professions 16 233 17 256 23 342 28 423 Medical Technology 1 14 2 31 2 31 3 47Chemistry/Secondary Ed. Certification (BS) 12 186 6 89 9 136 11 166
Communication Journalism (BA) 0 0 1 15 0 0 0 0 Electronic Media 131 1821 120 1675 101 1460 90 1293 Print Media 95 1405 85 1249 97 1408 87 1254P blic Relations 157 2284 146 2105 145 2123 111 1606 Public Relations 157 2284 146 2105 145 2123 111 1606
Computer Science (BS) 201 2914 139 1934 137 2015 110 1580 Computer Graphics 13 196 18 261 16 240 8 114 Embedded Systems ---- ---- ---- ---- 1 14 1 14 Information Systems (Obsolete) 31 442 31 457 11 163 4 60 Related Discipline ---- ---- 1 18 3 43 2 28 Scientific Programming (Obsolete) 1 14 1 17 0 0 0 0 Software Engineering 28 419 36 521 31 426 25 354 Systems Programming 21 311 23 338 13 186 9 130
Economics (BA) (Obsolete) ---- ---- ---- ---- ---- ---- 3 36Economics (BS) ---- ---- ---- ---- ---- ---- 12 159Economics/Social Studies (BSEd) ---- ---- ---- ---- ---- ---- 3 42
English (BA) 97 1359 91 1269 93 1320 87 1161 Writing 59 835 65 926 65 938 58 829English (BSEd) (Obsolete) 1 15 0 0 0 0 0 0English/Secondary Ed. Certification (BA) 110 1560 100 1469 112 1624 99 1451
French (BA) 5 78 7 105 10 153 6 80French/Secondary Ed. Certification (BA) 3 18 5 66 4 63 9 117Spanish (BA) 19 251 23 284 24 329 17 237Spanish/Secondary Ed. Certification (BA) 15 200 19 298 24 310 21 258
CSS/Geography (BSEd) (Obsolete) 2 28 0 0 0 0 0 0Earth Science (BSEd) 23 327 22 316 18 265 14 213Geography (BA) (Obsolete) Land Use (Obsolete) 1 15 0 0 0 0 0 0 Regional Development & Tourism (Obsolete) 1 15 2 30 0 0 0 0Geography (BS) 1 12 2 30 3 46 3 44 Cartography-Spatial Analysis (Obsolete) 1 10 0 0 0 0 0 0 Geographic Information Systems 10 150 12 174 15 207 17 244 Land Use 10 133 9 120 7 95 11 153 Regional Development & Tourism 7 103 8 124 7 95 2 15

2
College of Arts and Sciences (continued)Fall '03 Fall '04 Fall '05 Fall '06
Degree Program Head Credit Head Credit Head Credit Head Credit Concentration Count Hours Count Hours Count Hours Count Hours
Geoenvironmental Studies (BS) 143 2011 119 1744 110 1580 102 1439Geography/Citizenship (BSEd) (Obsolete) 5 79 5 67 0 0 0 0Geography/Social Studies (BSEd) ---- ---- ---- ---- 7 103 11 160Urban Studies (BA) (Obsolete) 1 9 0 0 0 0 0 0
Health Care Administration (BS) ---- ---- ---- ---- 13 42 30 168
CSS/History (BSEd) (Obsolete) 22 287 7 102 1 15 0 0History/Citizenship (BSEd) (Obsolete) 134 1986 162 2369 0 0 0 0History/Social Studies (BSEd) --- --- --- --- 167 2398 157 2303History (BA) 130 1814 144 2019 136 1938 154 2096 Public History 2 27 11 169 10 147 9 124
Human Communication Studies (BA) ---- ---- ---- ---- ---- ---- 73 1020 African American Communication ---- ---- ---- ---- ---- ---- 1 15 Applied Communication ---- ---- ---- ---- ---- ---- 1 15
Interdisciplinary Arts (BA) 1 15 3 24 2 33 6 94
Mathematics (BA) (Obsolete) 6 84 6 82 3 43 3 40Mathematics (BS) 25 379 17 255 15 230 13 203 Applied Math 8 124 5 64 6 87 12 173 Computer Science 5 75 3 44 7 110 6 93 Secondary Ed. Certification 100 1519 104 1558 92 1376 80 1227 Statistics 12 170 11 160 9 134 9 122
Applied Physics (BS) 47 691 45 678 38 564 46 677Applied Physics (BS) 47 691 45 678 38 564 46 677Physics (BS) 12 184 15 223 14 200 9 139 Nanofabrication ---- ---- ---- ---- ---- ---- 4 59Physics (BSEd) 11 173 11 174 10 148 8 116
CSS/Political Science (BSEd) (Obsolete) 1 13 0 0 0 0 0 0Political Science/Citizenship (BSEd) (Obsolete) 13 196 11 164 1 16 0 0Political Science/Social Studies (BSEd) ---- ---- ---- ---- 10 152 11 168Political Science (BA) 97 1411 110 1627 119 1748 109 1605Public Administration (BS) 28 408 25 329 22 302 19 269
Psychology (BA) 338 4870 325 4663 337 4858 337 4927
Sociology (BA) 69 1021 106 1513 112 1577 117 1670CSS/Sociology (BSEd) (Obsolete) 3 45 0 0 0 0 0 0
Speech Communication (BA) (Obsolete) 108 1585 87 1195 86 1215 0 0 African American Communication (Obsolete) 1 15 2 30 2 27 0 0 Applied Communication (Obsolete) 1 15 2 27 4 54 0 0 Women's Communication (Obsolete) 1 18 0 0 0 0 0 0
Arts & Sciences (General) 8 111 12 163 4 57 0 0
Certification Only Art ---- ---- 1 15 5 54 1 15 Biology 3 17 2 15 1 13 4 48 Earth Science 0 0 1 15 0 0 0 0 English 1 13 1 15 4 60 0 0 French 0 0 0 0 1 18 0 0 History/Citizenship (Obsolete) 4 39 3 33 0 0 0 0 History/Social Studies ---- ---- ---- ---- 2 33 2 30 Mathematics 0 0 2 21 1 15 0 0 Physics 0 0 1 3 0 0 0 0 Spanish 2 6 1 6 1 3 2 21
COLLEGE TOTAL 2833 40763 2789 40021 2756 39535 2643 37731

3
College of BusinessFall '03 Fall '04 Fall '05 Fall '06
Degree Program Head Credit Head Credit Head Credit Head Credit Concentration Count Hours Count Hours Count Hours Count Hours
Accounting (BSBA) 248 3615 226 3253 246 3585 264 3917Information Tech for Business Ed (BSBA) 31 478 25 365 16 239 17 256Information Tech for Business Ed / Secondary Ed. Certification (BSBA) 15 223 14 212 15 232 19 288Management Information Systems (BSBA) 107 1545 108 1539 76 1080 79 1143
Economics (BA) (Obsolete) 5 73 6 85 4 63 0 0Economics (BSBA) (Obsolete) 13 190 18 257 18 267 12 175Economics/Citizenship (BSEd) (Obsolete) 1 15 1 12 0 0 0 0Economics/Social Studies (BSEd) (Obsolete) ---- ---- ---- ---- 2 30 0 0
Finance (BSBA) 155 2277 140 2062 146 2106 149 2229 Personal Financial Planning ---- ---- ---- ---- 5 76 13 192Information Management & Analysis (BSBA) 23 338 19 241 17 241 13 179 Supply Chain Management 15 232 19 264 29 379 35 486
Management (BSBA) 4 61 3 51 1 15 0 0 Entrepreneurship & Corporate ---- ---- ---- ---- 8 116 20 293 General Management 178 2530 176 2531 201 2849 169 2415 Human Resource Management 72 1065 68 961 59 837 58 811 International Management 38 528 32 500 35 524 38 541Marketing (BSBA) 221 3240 252 3710 256 3768 274 4005
Certification Only Business Administration (General) 1 15 0 0 0 0 0 0 Business Education 1 6 0 0 0 0 0 0 Information Tech for Business Ed 6 60 8 93 6 75 11 123
Business Administration (General) 217 3252 249 3668 181 2760 204 3040
Business (General) 9 121 6 81 1 12 1 16
COLLEGE TOTAL 1360 19864 1370 19885 1322 19254 1376 20109

4
College of Education and Human ServicesFall '03 Fall '04 Fall '05 Fall '06
Degree Program Head Credit Head Credit Head Credit Head Credit Concentration Count Hours Count Hours Count Hours Count Hours
Criminal Justice (BS) 5 78 177 2608 273 3902 326 4633 Corrections (Obsolete) 1 15 1 12 0 0 0 0 Generalist (Obsolete) 209 3052 136 1968 66 939 29 425 Juvenile & Adult Corrections (Obsolete) 48 686 23 320 11 137 3 41 Juvenile Justice (Obsolete) 4 48 1 9 1 9 1 9 Law Enforcement (Obsolete) 168 2431 96 1389 61 874 22 327
Exercise Science (BS) ---- ---- 4 61 30 470 56 863
Social Work (BA) (Obsolete) 1 15 0 0 0 0 0 0Social Work (BSW) 156 2192 162 2278 200 2535 194 2568
Elementary Education (BSEd) 698 10482 725 10680 648 9467 557 8193 Environmental Education 21 317 17 253 13 198 11 164 Mathematics 25 377 15 221 6 95 13 201 Sociology 1 15 1 15 0 0 1 15 TESOL 1 15 1 15 1 12 1 15
Certification Only Elementary Education 2 21 3 36 2 30 2 24
Education (General) 8 120 17 253 75 1105 132 1936
COLLEGE TOTAL 1348 19864 1379 20118 1387 19773 1348 19414
TOTAL - Non-Degree 51 353 60 372 41 288 38 227
TOTAL - Office of Undeclared Students 975 14057 981 13916 953 13279 1018 14316
UNDERGRADUATE TOTAL 6567 94901 6579 94312 6459 92129 6423 91797
FTES 6326.7 6287.5 6141.9 6119.8
a/ Please see Section VII for color charts.

5
College of Arts and Sciences
Degree Program Head Credit Head Credit Head Credit Head Credit Concentration Count Hours Count Hours Count Hours Count Hours
Art (BA) 76 1027 81 1078 68 923 76 1039 Computer Graphics 16 231 21 270 20 280 22 313Art/Secondary Ed. Certification (BA) ---- ---- 8 93 27 391 48 717
Biology (BS) 77 1110 84 1251 81 1181 88 1244 Biotechnology 22 335 16 240 14 225 13 195 Ecology & Environmental Biology 22 331 29 416 27 394 25 383 Health Professions 97 1463 91 1327 104 1523 87 1273 Health Sciences (TJU) 14 192 15 225 20 289 18 270 Medical Technology 11 144 7 83 7 85 6 89Biology/Secondary Ed. Certification (BS) 19 292 15 251 16 241 11 165 Ecology and Environment 0 0 0 0 0 0 2 29 Environmental Education 4 68 4 66 2 33 1 20Medical Technology (BS) (Obsolete) 1 17 0 0 0 0 0 0
Chemistry (BS) 34 478 28 394 26 358 36 522 Biochemistry 9 139 10 141 15 216 19 282 Health Professions 14 210 17 246 21 314 23 347 Medical Technology 1 15 2 29 2 24 3 46Chemistry/Secondary Ed. Certification (BS) 5 82 5 79 8 120 9 136
Communication Journalism (BA 1 15 0 0 1 12 2 27 Electronic Media 129 1852 110 1570 101 1440 88 1251 Print Media 84 1268 88 1221 87 1271 84 1217 Public Relations 161 2395 147 2164 145 2120 123 1773
Computer Science (BS) 167 2434 118 1761 104 1534 94 1340 Computer Graphics 13 183 18 271 12 166 9 120 Embedded Systems ---- ---- ---- ---- 2 28 0 0 Information Systems (Obsolete 28 436 28 406 5 83 3 42 Related Discipline ---- ---- 4 39 6 86 1 14 Scientific Programming (Obsolete) 1 12 0 0 0 0 0 0 Software Engineering 28 417 32 445 28 411 23 341 Systems Programming 24 350 24 340 12 165 7 108
Economics (BA) (Obsolete) ---- ---- ---- ---- 5 78 1 15Economics (BS) ---- ---- ---- ---- 4 57 10 146 Business ---- ---- ---- ---- ---- ---- 5 69 Mathematics ---- ---- ---- ---- ---- ---- 1 17 Political Science ---- ---- ---- ---- ---- ---- 1 15 Social Science ---- ---- ---- ---- ---- ---- 1 15Economics/Social Studies Cert. (BSEd) ---- ---- ---- ---- 1 15 2 27
English (BA) 93 1337 92 1309 95 1268 79 1067 Writing 58 820 70 960 70 984 60 857English (BSEd) (Obsolete) 1 15 0 0 0 0 0 0English/Secondary Ed. Certification (BA) 103 1534 100 1468 98 1466 89 1284
French (BA) 6 93 7 111 6 81 8 121French/Secondary Ed. Certification (BA) 3 18 5 75 6 96 7 75Spanish (BA) 22 294 22 264 19 259 15 171Spanish/Secondary Ed. Certification (BA) 16 247 20 264 22 335 19 253
CSS/Geography (BSEd) (Obsolete) 1 15 0 0 0 0 0 0Geography/Social Studies Cert. (BSEd) 6 82 6 88 6 76 7 107Earth Science (BSEd) 24 345 17 254 18 274 14 215Geography (BA) (Obsolete) 1 12 0 0 0 0 0 0 Land Use (Obsolete) 1 14 0 0 0 0 0 0 Regional Development & Tourism (Obsolete 1 16 2 30 0 0 0 0Geography (BS) 2 27 3 43 3 40 0 0 Cartography-Spacial Analysis (Obsolete 1 3 0 0 0 0 0 0 Geographic Information System 11 162 11 162 16 233 18 263
UNDERGRADUATE HEADCOUNT AND CREDIT HOURS
Spring '04 Spring '05 Spring '06 Spring '07

6
College of Arts and Sciences (continued
Degree Program Head Credit Head Credit Head Credit Head Credit Concentration Count Hours Count Hours Count Hours Count Hours
Land Use 9 115 9 122 11 158 12 180 Regional Development & Tourism 9 124 7 96 4 52 0 0Geoenvironmental Studies (BS) 140 1994 122 1688 104 1447 96 1372
Health Care Administration (BS) ---- ---- ---- ---- 13 69 34 189
CSS/History (BSEd) (Obsolete) 18 239 1 12 0 0 0 0History/Social Studies Cert. (BSEd) 135 1968 158 2284 156 2231 138 2002History (BA) 135 1928 134 1880 141 1990 162 2220 Public History 6 82 13 183 10 132 9 99
Interdisciplinary Arts (BA) 2 27 3 39 1 12 5 78
Mathematics (BA) (Obsolete) 4 48 4 65 3 50 1 16Mathematics (BS) 24 344 14 196 14 201 10 147 Applied Math 9 133 7 96 10 171 15 211 Computer Science 5 75 3 47 5 80 7 97 Secondary Ed. Certification 95 1436 90 1370 83 1246 76 1141 Statistics 15 206 10 146 8 122 9 126
Applied Physics (BS) 41 633 36 552 37 564 35 548Physics (BS) 14 217 17 253 12 198 13 206 Nanofabrication ---- ---- 1 19 0 0 4 65Physics (BSEd) 10 156 10 166 9 128 5 73
CSS/Political Science (BSEd) (Obsolete) 1 15 0 0 1 12 0 0Political Science/Social Studies Cert. (BSEd) 10 165 11 174 10 153 10 157Political Science (BA) 95 1382 118 1760 115 1670 123 1823Public Administration (BS) 24 338 20 294 21 294 16 223
Psychology (BA) 313 4519 325 4727 340 4871 344 5035
Sociology (BA) 84 1218 122 1705 118 1697 135 1892CSS/Sociology (BSEd) (Obsolete) 3 45 0 0 0 0 0 0
Speech Communication (BA) (Obsolete 102 1429 83 1151 88 1288 0 0 African-American Communication (Obsolete 1 15 2 24 1 18 0 0 Applied Communication (Obsolete) 2 27 4 57 4 51 0 0 Women's Communication (Obsolete 1 18 0 0 0 0 0 0Human Communication Studies (BA ---- ---- ---- ---- 1 15 79 1131
Arts & Sciences (General) 9 113 9 121 1 13 1 13
Certification Only Art 0 0 3 39 3 48 0 0 Biology 4 39 3 30 1 3 2 30 English 1 15 4 54 3 45 1 3 French 0 0 0 0 1 15 0 0 History 2 10 2 15 1 15 1 15 Mathematics 0 0 2 24 0 0 1 9 Political Science 0 0 0 0 0 0 1 15 Physics 0 0 1 15 0 0 0 0 Spanish 1 3 1 15 2 21 1 15
COLLEGE TOTAL 2732 39606 2706 38853 2662 38255 2604 37151
Spring '04 Spring '05 Spring '06 Spring '07

7
College of Business
Degree Program Head Credit Head Credit Head Credit Head Credit Concentration Count Hours Count Hours Count Hours Count Hours
Accounting (BSBA) 230 3394 215 3164 249 3655 250 3591Information Tech for Business Ed (BSBA 24 366 19 294 16 246 14 209Information Tech for Business Ed/ Secondary Ed. Certification (BSBA) 11 164 13 210 12 185 20 309Management Information Systems (BSBA 113 1593 94 1297 88 1255 83 1183
Economics/Social Studies Cert. (BSEd) (Obsolete) 1 15 1 15 0 0 0 0Economics (BA) (Obsolete) 5 64 4 49 0 0 0 0Economics (BSBA) (Obsolete) 15 207 23 341 18 277 10 137
Finance (BSBA) 152 2204 151 2239 143 2058 159 2338 Personal Financial Planning ---- ---- ---- ---- 11 165 17 262Information Management & Analysis (BSBA 20 285 17 235 19 274 10 135 Supply Chain Managemen 21 308 22 297 29 383 28 380
Management (BSBA) 4 48 3 45 1 18 0 0 Entrepreneurship & Corporate ---- ---- ---- ---- 14 199 24 328 General Management 168 2400 190 2724 189 2747 168 2419 Human Resource Managemen 78 1133 72 1061 59 839 61 884 International Management 35 456 29 436 37 503 31 437Marketing (BSBA) 245 3603 259 3807 257 3727 272 3889
Supply Chain Management (BSBA ---- ---- ---- ---- ---- ---- 3 34 Logistics ---- ---- ---- ---- ---- ---- 2 30
Certification Only Business Education 0 0 1 15 0 0 0 0 Information Tech for Business Ed 6 48 6 84 5 51 6 60
Business Administration (General 178 2624 191 2820 152 2245 168 2463
Business (General) 6 76 4 59 1 12 0 0
COLLEGE TOTAL 1312 18988 1314 19192 1300 18839 1326 19088
Spring '04 Spring '05 Spring '06 Spring '07

8
College of Education and Human Service
Degree Program Head Credit Head Credit Head Credit Head Credit Concentration Count Hours Count Hours Count Hours Count Hours
Criminal Justice (BS) 47 652 190 2798 279 4083 303 4327 Corrections (Obsolete) 1 15 0 0 0 0 0 0 Generalist (Obsolete) 177 2568 110 1601 57 800 25 366 Juvenile & Adult Corrections (Obsolete) 38 553 21 302 6 62 3 38 Juvenile Justice (Obsolete) 3 33 1 6 1 9 1 3 Law Enforcement (Obsolete) 146 2117 84 1229 41 613 14 204
Exercise Science ---- ---- 12 187 34 488 66 966
Social Work (BSW) 160 2213 167 2297 195 2526 186 2496
Elementary Education (BSEd) 668 9990 674 10003 590 8696 528 7670 Environmental Education 22 319 16 237 13 190 9 135 Mathematics 21 319 12 173 11 178 15 225 Sociology 1 18 1 15 1 15 1 15 Special Education 0 0 0 0 0 0 1 15 TESOL 1 18 1 15 1 15 0 0
Certification Only Elementary Education 2 18 3 33 1 15 2 27
Education (General) 4 60 20 304 62 930 113 1650
COLLEGE TOTAL 1291 18893 1312 19200 1292 18620 1267 18137
TOTAL - Non-Degree 57 350 42 268 34 177 52 301
TOTAL - Office of Undeclared Student 737 10664 701 10132 731 10449 771 10990
UNDERGRADUATE TOTAL 6129 88501 6075 87645 6019 86340 6020 85667
FTES 5900.1 5843.0 5756.0 5711.1
Spring '04 Spring '05 Spring '06 Spring '07
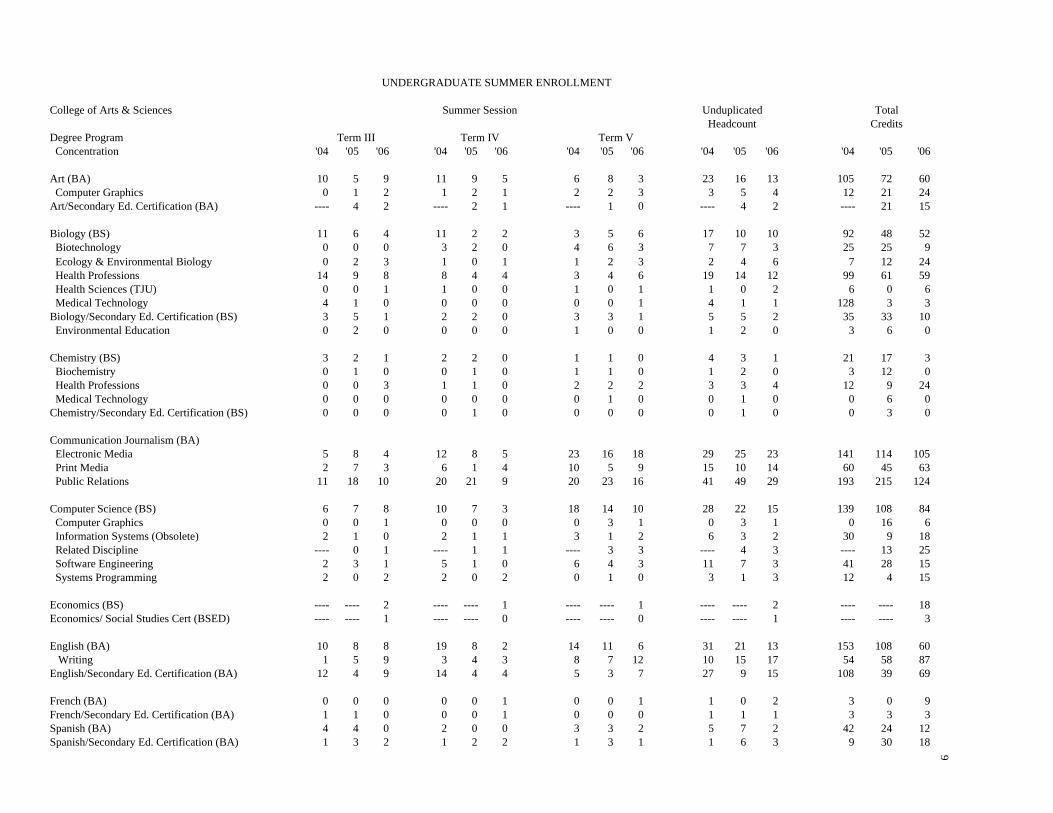
UNDERGRADUATE SUMMER ENROLLMENT
College of Arts & Sciences Summer Session UnduplicatedHeadcount
Degree Program Concentration '04 '05 '06 '04 '05 '06 '04 '05 '06 '04 '05 '06 '04 '05 '06
Art (BA) 10 5 9 11 9 5 6 8 3 23 16 13 105 72 60 Computer Graphics 0 1 2 1 2 1 2 2 3 3 5 4 12 21 24Art/Secondary Ed. Certification (BA) ---- 4 2 ---- 2 1 ---- 1 0 ---- 4 2 ---- 21 15
Biology (BS) 11 6 4 11 2 2 3 5 6 17 10 10 92 48 52 Biotechnology 0 0 0 3 2 0 4 6 3 7 7 3 25 25 9 Ecology & Environmental Biology 0 2 3 1 0 1 1 2 3 2 4 6 7 12 24 Health Professions 14 9 8 8 4 4 3 4 6 19 14 12 99 61 59 Health Sciences (TJU) 0 0 1 1 0 0 1 0 1 1 0 2 6 0 6 Medical Technology 4 1 0 0 0 0 0 0 1 4 1 1 128 3 3Biology/Secondary Ed. Certification (BS) 3 5 1 2 2 0 3 3 1 5 5 2 35 33 10 Environmental Education 0 2 0 0 0 0 1 0 0 1 2 0 3 6 0
Chemistry (BS) 3 2 1 2 2 0 1 1 0 4 3 1 21 17 3 Biochemistry 0 1 0 0 1 0 1 1 0 1 2 0 3 12 0 Health Professions 0 0 3 1 1 0 2 2 2 3 3 4 12 9 24 Medical Technology 0 0 0 0 0 0 0 1 0 0 1 0 0 6 0Chemistry/Secondary Ed. Certification (BS) 0 0 0 0 1 0 0 0 0 0 1 0 0 3 0
Communication Journalism (BA) Electronic Media 5 8 4 12 8 5 23 16 18 29 25 23 141 114 105 Print Media 2 7 3 6 1 4 10 5 9 15 10 14 60 45 63 Public Relations 11 18 10 20 21 9 20 23 16 41 49 29 193 215 124
Computer Science (BS) 6 7 8 10 7 3 18 14 10 28 22 15 139 108 84 Computer Graphics 0 0 1 0 0 0 0 3 1 0 3 1 0 16 6 Information Systems (Obsolete) 2 1 0 2 1 1 3 1 2 6 3 2 30 9 18 Related Discipline ---- 0 1 ---- 1 1 ---- 3 3 ---- 4 3 ---- 13 25 Software Engineering 2 3 1 5 1 0 6 4 3 11 7 3 41 28 15 Systems Programming 2 0 2 2 0 2 0 1 0 3 1 3 12 4 15
Economics (BS) ---- ---- 2 ---- ---- 1 ---- ---- 1 ---- ---- 2 ---- ---- 18Economics/ Social Studies Cert (BSED) ---- ---- 1 ---- ---- 0 ---- ---- 0 ---- ---- 1 ---- ---- 3
English (BA) 10 8 8 19 8 2 14 11 6 31 21 13 153 108 60 Writing 1 5 9 3 4 3 8 7 12 10 15 17 54 58 87English/Secondary Ed. Certification (BA) 12 4 9 14 4 4 5 3 7 27 9 15 108 39 69
French (BA) 0 0 0 0 0 1 0 0 1 1 0 2 3 0 9French/Secondary Ed. Certification (BA) 1 1 0 0 0 1 0 0 0 1 1 1 3 3 3Spanish (BA) 4 4 0 2 0 0 3 3 2 5 7 2 42 24 12Spanish/Secondary Ed. Certification (BA) 1 3 2 1 2 2 1 3 1 1 6 3 9 30 18
9
Term VTerm IVTerm III
TotalCredits

College of Arts & Sciences (continued) Summer Session UnduplicatedHeadcount
Degree Program Concentration '04 '05 '06 '04 '05 '06 '04 '05 '06 '04 '05 '06 '04 '05 '06
Geography/Citizenship (BSEd) (Obsolete) 2 0 0 0 0 0 0 0 0 2 0 0 6 0 0Geography/Social Studies Cert. (BSEd) ---- 0 2 ---- 1 2 ---- 0 0 ---- 1 3 ---- 3 12Earth Science (BSEd) 1 2 2 2 4 2 1 3 0 3 6 3 14 24 12Geography (BA) (Obsolete) Regional Development & Tourism (Obsolete) 0 0 0 0 0 0 0 1 0 0 1 0 0 3 0Geography (BS) 0 0 0 0 0 0 0 0 2 0 0 2 0 0 9 Geographic Information System 2 1 2 2 1 1 1 4 4 2 5 4 19 21 29 Land Use 1 3 0 1 0 0 4 2 2 5 4 2 18 21 9 Regional Development & Tourism 2 2 0 1 1 1 2 2 0 3 4 1 18 15 6Geoenvironmental Studies (BS) 16 11 12 6 11 7 36 35 31 46 44 42 223 231 218
Health Care Administration (BS) 0 0 11 0 0 7 0 0 4 0 0 13 0 0 69
CSS/History (BSEd) (Obsolete) 2 0 0 1 0 0 0 0 0 2 0 0 9 0 0History/Citzenship (BSEd) (Obsolete) 6 0 0 5 0 0 5 0 0 12 0 0 51 0 0History/Social Studies Cert. (BSEd) ---- 6 11 ---- 5 5 ---- 4 6 ---- 11 17 ---- 54 78History (BA) 15 9 13 16 13 8 16 13 7 31 25 21 180 132 117 Public History 0 1 1 1 1 0 1 1 0 2 3 1 6 12 3
Interdisciplinary Arts (BA) 0 1 1 1 1 1 0 1 1 1 1 2 6 18 9
Mathematics (BS) 2 2 1 1 3 1 0 2 1 2 5 2 12 31 12 Applied Math 2 0 2 2 1 1 2 0 1 4 1 3 21 6 12 Computer Science 0 1 0 0 3 0 0 3 0 0 4 0 0 26 0 Secondary Ed. Certification 9 5 6 5 5 3 9 4 4 16 9 8 75 70 48 Statistics 2 0 1 2 0 1 2 1 0 3 1 2 24 3 9
Medical Technology (BS) 0 0 2 0 0 0 0 0 0 0 0 2 0 0 60
Applied Physics (BS) 4 0 0 4 1 0 3 1 2 7 1 2 45 6 8Physics (BS) 0 1 0 0 2 2 1 4 0 1 5 2 3 24 6 Nanofabrication ---- 1 0 ---- 1 0 ---- 2 0 ---- 2 0 ---- 9 0Physics (BSEd) 2 0 1 1 0 0 2 1 0 3 1 1 18 4 6
Political Science (BA) 8 11 8 4 16 11 8 20 3 15 29 15 60 177 81Political Science/Citizenship (BSEd) (Obsolete) 1 0 0 1 0 0 0 0 0 2 0 0 9 0 0Political Science/Social Studies Cert. (BSEd) ---- 2 1 ---- 0 1 ---- 2 1 ---- 3 2 ---- 12 12Public Administration (BS) 1 4 5 2 3 7 3 7 2 5 10 9 20 55 54
10Term III Term IV Term V
TotalCredits

College of Arts & Sciences (continued) Summer Session UnduplicatedHeadcount
Degree Program Concentration '04 '05 '06 '04 '05 '06 '04 '05 '06 '04 '05 '06 '04 '05 '06
Psychology (BA) 34 37 43 35 31 35 24 28 38 68 64 84 337 363 431
Sociology (BA) 12 14 16 13 13 9 13 18 24 26 28 34 162 173 192
Speech Communication (BA) (Obsolete) 4 10 0 11 11 0 11 14 0 21 27 0 94 129 0 Applied Communication (Obsolete) 0 1 0 1 0 0 0 1 0 1 2 0 3 9 0 African American Communication (Obsolete) 0 0 0 0 1 0 0 0 0 0 1 0 0 3 0Human Communication Studies (BA) ---- ---- 5 ---- ---- 12 ---- ---- 25 ---- ---- 32 ---- ---- 163 African American Communication ---- ---- 1 ---- ---- 0 ---- ---- 1 ---- ---- 1 ---- ---- 9 Applied Communication ---- ---- ---- ---- ---- ---- ---- ---- 1 ---- ---- 1 ---- ---- 4
Arts & Sciences (General) 3 2 0 2 1 0 4 1 0 5 3 0 35 13 0
Certification Only Art 0 1 1 0 0 0 0 0 0 0 1 1 0 6 3 Biology 0 1 1 0 1 0 1 1 0 1 2 1 3 9 3 English 0 3 0 0 0 0 0 0 0 0 3 0 0 9 0 History/Citizenship (Obsolete) 0 0 1 0 0 0 0 0 0 0 0 1 0 0 3 Spanish 1 0 0 1 0 0 0 0 0 1 0 0 6 0 0
COLLEGE TOTAL 236 239 245 258 217 170 288 309 281 589 568 523 3013 2834 2710
11
Total
Term III Term IV Term VCredits

12
College of Business Summer Session UnduplicatedHeadcount
Degree Program Concentration '04 '05 '06 '04 '05 '06 '04 '05 '06 '04 '05 '06 '04 '05 '06
Accounting (BSBA) 37 20 31 33 41 25 40 30 45 71 70 70 361 301 359Information Technology for Bus. Ed. (BSBA) 2 1 2 2 2 4 1 4 2 4 5 6 21 26 31Information Technology for Bus Ed./ Secondary Ed. Certification (BSBA) 2 3 0 2 1 0 1 0 3 5 4 3 21 12 8Management Information Systems (BSBA) 18 7 10 15 15 6 20 15 13 37 25 23 186 122 92
Economics (BA) (Obsolete) 1 1 0 1 1 0 1 0 0 2 1 0 15 6 0Economics (BSBA) (Obsolete) 4 3 2 2 6 5 6 3 1 7 9 6 43 38 28
Finance (BSBA) 27 12 14 15 14 10 27 11 25 51 33 39 232 109 178 Personal Financial Planning ---- 0 1 ---- 0 1 ---- 2 2 ---- 2 2 --- 4 13Information Management & Analysis (BSBA) 4 3 4 5 2 3 2 4 5 9 6 9 39 23 43 Supply Chain Management 2 5 3 1 5 5 3 1 9 4 8 12 25 43 61
Management (BSBA) 2 1 0 2 0 0 2 1 0 3 1 0 24 6 0 Entrepreneurship and Corporate 0 0 2 0 0 2 0 0 1 0 0 4 0 0 18 General Management 36 25 21 20 23 14 30 25 27 57 53 46 280 254 223 Human Resource Management 14 7 11 14 14 5 16 13 11 35 27 17 160 115 100 International Management 7 2 0 4 8 5 4 4 5 11 11 9 54 43 34Marketing (BSBA) 25 21 33 26 40 45 45 28 45 71 72 95 310 291 396
Business (General) 2 0 0 1 0 0 0 0 0 2 0 0 9 0 0Business Administration (General) 7 8 7 8 7 4 8 5 6 18 13 15 75 73 55
Certification OnlyBusiness Education 1 0 0 0 0 0 0 0 0 1 0 0 3 0 0Info Tech for Business Ed 4 1 3 2 1 5 4 0 2 7 2 7 42 9 42
COLLEGE TOTAL 195 120 144 153 180 139 210 146 202 395 342 363 1900 1475 1681
Term IV Term VCredits
Term III
Total

College of Education and Human Services Summer Session UnduplicatedHeadcount
Degree Program Concentration '04 '05 '06 '04 '05 '06 '04 '05 '06 '04 '05 '06 '04 '05 '06
Criminal Justice (BS) 7 22 58 10 16 38 18 44 39 23 57 92 153 444 609 Generalist (Obsolete) 10 6 8 10 9 6 27 27 3 35 35 14 240 243 75 Juvenile & Adult Corrections (Obsolete) 3 2 2 4 0 2 9 3 0 11 5 2 75 39 12 Law Enforcement (Obsolete) 19 5 7 12 6 6 22 17 6 34 20 13 231 135 99
Social Work (BSW) 32 21 53 10 28 46 7 41 41 42 59 88 181 294 495
Exercise Science (BS) 0 3 4 0 1 2 0 1 4 0 5 10 0 16 66
Elementary Education (BSEd) 92 102 71 56 50 45 26 26 16 127 140 103 603 705 504 Environmental Education 3 2 4 3 0 0 0 0 1 5 2 5 21 6 18 Mathematics 1 0 3 0 0 0 0 1 0 1 1 3 3 3 9 TESOL 1 0 0 0 0 0 0 0 0 1 0 0 3 0 0
Education (General) 1 1 5 0 2 2 1 0 2 2 2 6 9 9 30
Certification Only Elementary Education 1 1 0 2 0 0 1 0 0 2 1 0 12 3 0
COLLEGE TOTAL 170 165 215 107 112 147 111 160 112 283 327 336 1531 1897 1917
TOTAL - Non-Degree 61 52 46 74 60 32 34 40 36 135 126 94 586 526 396
TOTAL - Office of Undeclared Students 20 32 28 30 30 23 228 249 271 260 287 298 1464 1635 1733
UNDERGRADUATE TOTAL 682 608 678 622 599 511 871 904 902 1662 1650 1614 8494 8367 8437
FTES 566.3 557.8 562.5
Term III Term IV Term VCredits
13
Total
14
Fall '03 Fall '04 Fall '05 Fall '06
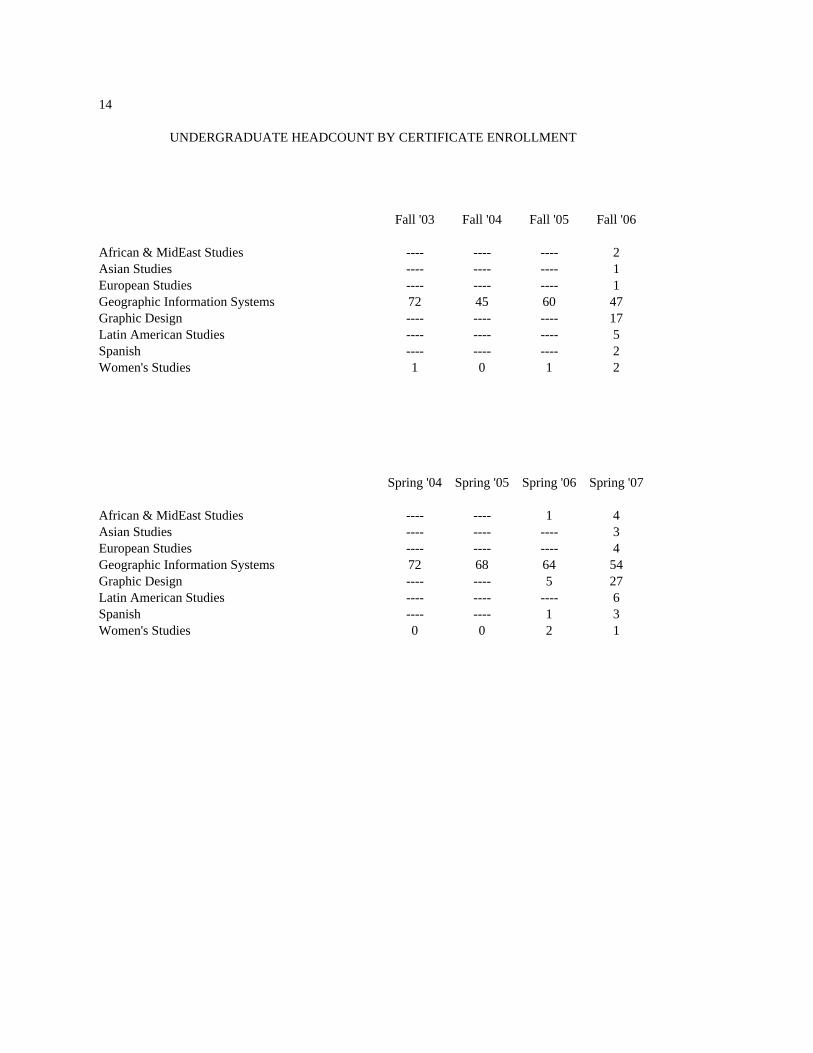
African & MidEast Studies ---- ---- ---- 2Asian Studies ---- ---- ---- 1European Studies ---- ---- ---- 1Geographic Information Systems 72 45 60 47Graphic Design ---- ---- ---- 17Latin American Studies ---- ---- ---- 5Spanish ---- ---- ---- 2Women's Studies 1 0 1 2
Spring '04 Spring '05 Spring '06 Spring '07
UNDERGRADUATE HEADCOUNT BY CERTIFICATE ENROLLMENT
African & MidEast Studies ---- ---- 1 4Asian Studies ---- ---- ---- 3European Studies ---- ---- ---- 4Geographic Information Systems 72 68 64 54Graphic Design ---- ---- 5 27Latin American Studies ---- ---- ---- 6Spanish ---- ---- 1 3Women's Studies 0 0 2 1

a/ 15 UNDERGRADUATE HEADCOUNT BY MINOR
College of Arts and Sciences Fall '02 Fall '03 Fall '04 Fall '05 Fall '06
Anthropology 32 31 33 24 25
Art 24 32 34 37 22
Biochemistry -- -- -- -- 3
Biology 12 16 17 20 43
Chemistry 2 1 1 1 1
Communication Journalism 40 33 25 20 21
Computer Science 6 5 5 2 2
English 38 63 54 40 42
Ethnic Studies 6 18 19 10 7
French 10 16 16 7 7
Geography/Earth Science 12 13 8 15 13
German Studies 6 10 12 16 16
Gerontology 19 19 12 14 36
History 24 20 31 32 28
Human Communication Studies -- -- -- -- 17
International Studies 14 14 35 49 48
Mathematics 32 34 37 30 19
Music 15 13 11 27 23
Philosophy 6 13 13 23 20
Physics 0 2 0 0 1
Political Science 16 26 32 20 21
Psychology 130 133 84 54 17
Public Administration 8 5 5 4 5
Sociology 12 18 25 29 28
Spanish 54 64 62 63 69

16
College of Arts and Sciences (cont) Fall '02 Fall '03 Fall '04 Fall '05 Fall '06
Speech 31 24 26 26 2
Technical/Professional -- -- 6 7 6
Theatre 24 18 20 19 19
Women's Studies 14 22 20 19 14
COLLEGE TOTAL 587 663 643 608 575
College of Business
Business 20 42 49 34 28
Economics (Obsolete) 26 21 27 11 6
COLLEGE TOTAL 46 63 76 45 34
College of Education and Human Services
Coaching 67 77 57 53 44
Criminal Justice 1 0 0 0 0
Early Childhood 106 139 138 146 137
Reading 176 188 165 149 142
COLLEGE TOTAL 350 404 360 348 323
MINOR TOTAL 983 1130 1079 1001 932
a/ Does not include second minors.

a/ 17
College of Arts and Sciences Spring '03 Spring '04 Spring '05 Spring '06 Spring '07
Anthropology 0 37 31 30 28
Art 28 38 41 30 23
Biochemistry --- --- --- 3 3
Biology 15 19 18 36 53
Chemistry 1 1 1 2 2
Communication Journalism 31 32 29 21 18
Computer Science 9 7 3 2 1
English 56 77 62 42 39
Ethnic Studies 31 20 17 10 10
French 12 18 13 10 7
Geography/Earth Science 11 15 11 15 15
German Studies 8 14 12 21 20
Gerontology 31 16 14 23 39
History 36 30 41 38 26
Human Communication Studies --- --- --- --- 22
International Studies 0 27 45 54 58
Mathematics 34 45 42 36 23
Music 18 15 17 21 19
Philosophy 0 14 16 24 20
Physics 1 5 1 0 3
Political Science 25 33 38 24 32
Psychology 154 134 89 50 27
Public Administration 7 6 7 7 4
Sociology 52 22 26 33 32
Spanish 73 69 77 83 72
UNDERGRADUATE HEADCOUNT BY MINOR

18
College of Arts and Sciences (cont) Spring '03 Spring '04 Spring '05 Spring '06 Spring '07
Speech 27 26 27 30 0
Technical/Professional --- 1 7 10 9
Theatre 24 25 18 17 18
Women's Studies 15 26 18 17 14
COLLEGE TOTAL 699 772 721 689 637
College of Business
Business 0 52 51 43 36
Business Education 29 0 0 0 0
Economics (Obsolete) 28 29 23 11 10
COLLEGE TOTAL 57 81 74 54 46
College of Education and Human Services
Coaching 80 67 63 54 53
Criminal Justice 0 1 0 0 0
Early Childhood 132 143 155 165 132
Reading 208 194 182 172 151
COLLEGE TOTAL 420 405 400 391 336
MINOR TOTAL 1176 1258 1195 1134 1019
a/ Does not include second minors.

19
UNDERGRADUATE HEADCOUNT BY COUNTY, FALL '06
County Headcount Δ County Headcount Δ
Adams 279 +65 Lancaster 321 +2Allegheny 45 +8 Lawrence 1 0Armstrong 2 +1 Lebanon 103 -4Beaver 3 0 Lehigh 111 -5Bedford 76 0 Luzerne 52 -4
Berks 210 +7 Lycoming 52 -5Blair 47 +2 McKean 1 +1Bradford 26 0 Mercer 3 -1Bucks 292 -59 Mifflin 58 +1Butler 7 -3 Monroe 45 0
Cambria 68 +6 Montgomery 330 -31Cameron 0 0 Montour 9 0Carbon 9 -5 Northampton 96 -13Centre 19 +3 Northumberland 64 +9Chester 353 -38 Perry 81 +3
Clarion 0 0 Philadelphia 161 -2Clearfield 6 -2 Pike 13 +1Clinton 4 -2 Potter 0 0Columbia 22 +5 Schuylkill 89 -6Crawford 3 0 Snyder 13 -7
Cumberland 906 -28 Somerset 42 0Dauphin 299 +30 Sullivan 1 0Delaware 208 -3 Susquehanna 13 -4Elk 1 -1 Tioga 4 -2Erie 2 0 Union 35 -1
Fayette 6 -1 Venango 4 +1Forest 0 0 Warren 3 0Franklin 781 +68 Washington 6 -1Fulton 32 -10 Wayne 19 -5Greene 2 0 Westmoreland 22 -2
Huntingdon 60 -1 Wyoming 9 +4Indiana 4 +1 York 468 0Jefferson 1 -1Juniata 30 +2Lackawanna 28 +7 PA TOTAL 6060 -20
where Δ indicates change from Fall 2005 values Please see Section VII for color map.

20a/
Head- Head-State count Δ State count Δ
Alabama 0 0 Montana 1 -1Alaska 0 -1 Nebraska 0 0Arizona 0 0 Nevada 0 0Arkansas 0 0 New Hampshire 0 0California 2 +2 New Jersey 67 -5
Colorado 2 +1 New Mexico 0 0Connecticut 1 0 New York 13 +3Delaware 15 +4 North Carolina 1 0District of Columbia 4 0 North Dakota 0 0Florida 2 -1 Ohio 3 +1
Georgia 1 0 Oklahoma 0 -1Hawaii 0 -1 Oregon 0 0Idaho 0 0 Pennsylvania 6060 -22Illinois 1 +1 Rhode Isalnd 0 0Indiana 0 -2 South Carolina 0 0
Iowa 1 +1 South Dakota 0 0Kansas 1 +1 Tennessee 0 0Kentucky 0 0 Texas 2 +1Louisiana 0 0 Utah 0 0Maine 1 -1 Vermont 1 -1
Maryland 191 -16 Virginia 23 -2Massachusetts 2 +1 Washington 0 0Michigan 1 0 West Virginia 5 +1Minnesota 0 0 Wisconsin 0 0Mississippi 0 0 Wyoming 0 0Missouri 0 0
Unknown, within U.S. 6 +1
U.S. TOTAL 6407 -36
where Δ indicates change from Fall 2005 valuesa/ Reflects current legal addresses self-reported by students.See map in Section VII
UNDERGRADUATE HEADCOUNT BY STATE, FALL '06

21a/
Head- Head-Country count Country count
Canada 1 Morocco 1China 1 Nigeria 1El Salvador 1 Nepal 1
Ethiopia 1 Russia 1France 1 Sri Lanka 1India 1 Taiwan 1
Kenya 2Korea, Republic of 1Moldova 1
Total Non-U.S. 16
Total U.S. 6407
UNDERGRADUATE TOT 6423
a/ Reflects current legal addresses self-reported by students.
UNDERGRADUATE HEADCOUNT BY COUNTRY OF RESIDENCY, FALL '06

22UNDERGRADUATE HEADCOUNT BY COLLEGE AND CLASS LEVEL
College and Class Level Fall '02 Fall '03 Fall '04 Fall '05 Fall '06
Arts and Sciences Freshman 699 730 690 671 639 Sophomore 732 687 703 725 661 Junior 709 727 721 695 734 Senior 598 689 663 650 599
TOTAL 2738 2833 2777 2741 2633
Business Freshman 320 376 354 342 356 Sophomore 370 318 342 329 356 Junior 344 339 338 334 350 Senior 314 327 328 311 303
TOTAL 1348 1360 1362 1316 1365
Education & Human Services Freshman 269 252 273 306 308 Sophomore 314 336 314 315 330 Junior 349 360 379 357 331 Senior 353 400 410 407 377
TOTAL 1285 1348 1376 1385 1346
Office of Undeclared Students Freshman 774 721 766 715 791 Sophomore 209 249 209 230 208 Junior 6 5 6 7 16 Senior 0 0 0 1 3
TOTAL 989 975 981 953 1018
Total Freshman 2062 2079 2083 2034 2094 Sophomore 1625 1590 1568 1599 1555 Junior 1408 1431 1444 1393 1431 Senior 1265 1416 1401 1369 1282 Non-Degree 53 51 83 64 61
UNDERGRADUATE TOTAL 6413 6567 6579 6459 6423

23UNDERGRADUATE HEADCOUNT BY COLLEGE
0
500
1000
1500
2000
2500
3000
Fall '02 Fall '03 Fall '04 Fall '05 Fall '06
HEA
DC
OU
NT
Arts and Sciences Ed. & Human ServicesOffice of Undeclared Students BusinessNon-Degree

24
UNDERGRADUATE HEADCOUNT BY RESIDENCE AND CLASS LEVEL
Fall '02 Fall '03 Fall '04 Fall '05 Fall '06
Residence HallFreshmen 1608 1602 1580 1576 1583Sophomore 678 618 547 581 560Junior 234 277 274 257 266Senior 115 134 146 165 133Non-Degree 0 1 2 2 1
TOTAL 2635 2632 2549 2581 2543
Off-CampusFreshmen 506 457 503 458 511Sophomore 948 972 1021 1018 995Junior 1174 1154 1170 1136 1165Senior 1150 1282 1255 1204 1149Non-Degree 0 70 81 62 60
TOTAL 3778 3935 4030 3878 3880
UNDERGRADUATE TOTAL 6413 6567 6579 6459 6423
0500
10001500200025003000350040004500
2002 2003 2004 2005 2006
Residence HallOff-Campus
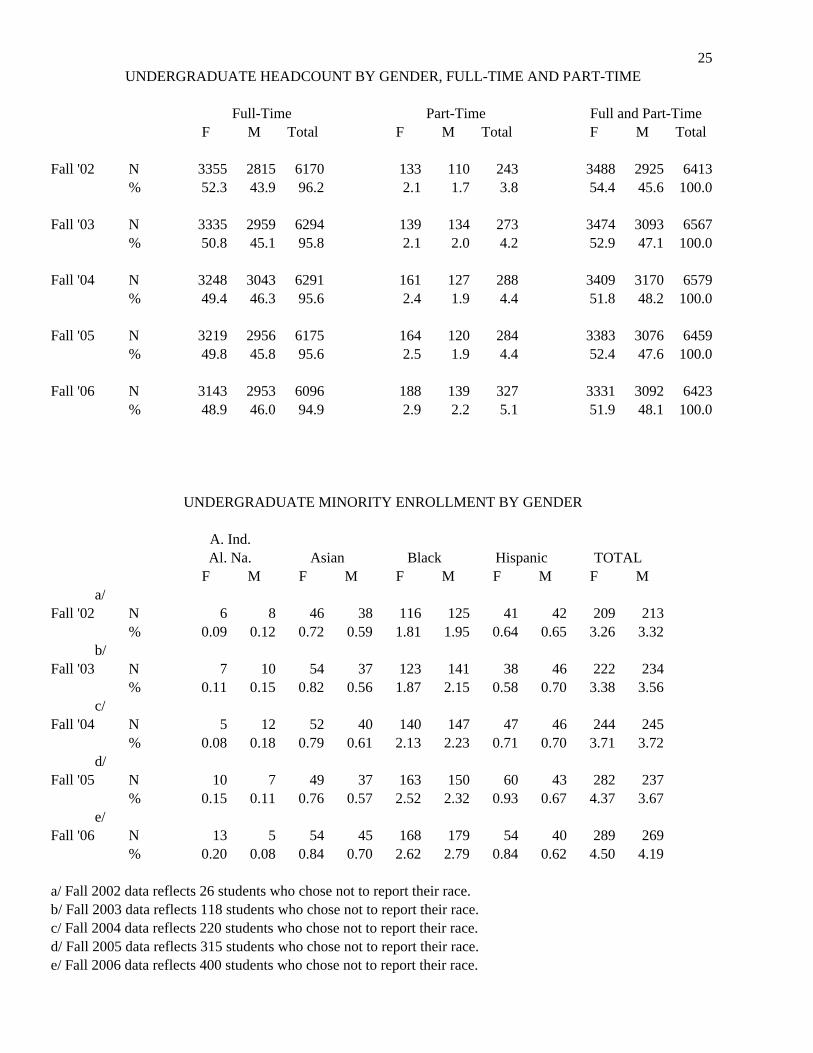
25UNDERGRADUATE HEADCOUNT BY GENDER, FULL-TIME AND PART-TIME
Full-Time Part-Time Full and Part-TimeF M Total F M Total F M Total
Fall '02 N 3355 2815 6170 133 110 243 3488 2925 6413% 52.3 43.9 96.2 2.1 1.7 3.8 54.4 45.6 100.0
Fall '03 N 3335 2959 6294 139 134 273 3474 3093 6567% 50.8 45.1 95.8 2.1 2.0 4.2 52.9 47.1 100.0
Fall '04 N 3248 3043 6291 161 127 288 3409 3170 6579% 49.4 46.3 95.6 2.4 1.9 4.4 51.8 48.2 100.0
Fall '05 N 3219 2956 6175 164 120 284 3383 3076 6459% 49.8 45.8 95.6 2.5 1.9 4.4 52.4 47.6 100.0
Fall '06 N 3143 2953 6096 188 139 327 3331 3092 6423% 48.9 46.0 94.9 2.9 2.2 5.1 51.9 48.1 100.0
UNDERGRADUATE MINORITY ENROLLMENT BY GENDER
A. Ind.Al. Na. Asian Black Hispanic TOTAL
F M F M F M F M F M a/Fall '02 N 6 8 46 38 116 125 41 42 209 213
% 0.09 0.12 0.72 0.59 1.81 1.95 0.64 0.65 3.26 3.32 b/Fall '03 N 7 10 54 37 123 141 38 46 222 234
% 0.11 0.15 0.82 0.56 1.87 2.15 0.58 0.70 3.38 3.56 c/Fall '04 N 5 12 52 40 140 147 47 46 244 245
% 0.08 0.18 0.79 0.61 2.13 2.23 0.71 0.70 3.71 3.72 d/Fall '05 N 10 7 49 37 163 150 60 43 282 237
% 0.15 0.11 0.76 0.57 2.52 2.32 0.93 0.67 4.37 3.67 e/Fall '06 N 13 5 54 45 168 179 54 40 289 269
% 0.20 0.08 0.84 0.70 2.62 2.79 0.84 0.62 4.50 4.19
a/ Fall 2002 data reflects 26 students who chose not to report their race.b/ Fall 2003 data reflects 118 students who chose not to report their race.c/ Fall 2004 data reflects 220 students who chose not to report their race.d/ Fall 2005 data reflects 315 students who chose not to report their race.e/ Fall 2006 data reflects 400 students who chose not to report their race.

26
a/
Part- Full- Part- Full- Part- Full- Part- Full-Time Time Total Time Time Total Time Time Total Time Time Total
Traditional Students
Under 18 M 6 37 43 3 30 33 3 33 36 7 32 39F 4 79 83 4 75 79 2 89 91 3 52 55Total 10 116 126 7 105 112 5 122 127 10 84 94
18 - 19 M 9 1248 1257 8 1243 1251 3 1194 1197 8 1196 1204F 7 1423 1430 8 1379 1387 7 1374 1381 13 1410 1423Total 16 2671 2687 16 2622 2638 10 2568 2578 21 2606 2627
20 - 21 M 22 1122 1144 18 1170 1188 18 1192 1210 16 1177 1193F 23 1401 1424 34 1397 1431 37 1313 1350 27 1283 1310Total 45 2523 2568 52 2567 2619 55 2505 2560 43 2460 2503
22 - 24 M 47 438 485 43 479 522 49 437 486 56 443 499F 35 333 368 36 298 334 36 320 356 42 278 320Total 82 771 853 79 777 856 85 757 842 98 721 819
Total Traditional StudentsM 84 2845 2929 72 2922 2994 73 2856 2929 87 2848 2935F 69 3236 3305 82 3149 3231 82 3096 3178 85 3023 3108Total 153 6081 6234 154 6071 6225 155 5952 6107 172 5871 6043
Non-Traditional Students
25 - 29 M 26 70 96 18 80 98 14 61 75 20 69 89F 20 47 67 21 49 70 23 66 89 32 68 100Total 46 117 163 39 129 168 37 127 164 52 137 189
30 - 34 M 10 20 30 12 17 29 13 16 29 10 20 30F 8 21 29 21 15 36 18 24 42 16 23 39Total 18 41 59 33 32 65 31 40 71 26 43 69
35 - 39 M 6 10 16 9 8 17 6 7 13 8 8 16F 16 10 26 13 14 27 11 14 25 13 12 25Total 22 20 42 22 22 44 17 21 38 21 20 41
40 - 49 M 6 14 20 9 14 23 10 14 24 12 7 19F 17 17 34 15 17 32 20 16 36 26 16 42Total 23 31 54 24 31 55 30 30 60 38 23 61
Over 50 M 2 0 2 7 2 9 4 2 6 2 1 3F 9 4 13 9 4 13 10 3 13 16 1 17Total 11 4 15 16 6 22 14 5 19 18 2 20
Total Non-Traditional Students
M 50 114 164 55 121 176 47 100 147 52 105 157F 70 99 169 79 99 178 82 123 205 103 120 223Total 120 213 333 134 220 354 129 223 352 155 225 380
a/ Please see Section VII for color charts.
UNDERGRADUATE HEADCOUNT BY AGE AND GENDER, FULL-TIME AND PART-TIME
Fall '03 Fall '05 Fall '06Fall '04

27
Part- Full- Part- Full- Part- Full- Part- Full-Time Time Total Time Time Total Time Time Total Time Time Total
Traditional Students
Under 18 M 2 3 5 1 1 2 3 3 6 8 3 11F 3 5 8 3 5 8 3 10 13 4 4 8Total 5 8 13 4 6 10 6 13 19 12 7 19
18 - 19 M 13 1031 1044 12 973 985 7 963 970 13 986 999F 14 1225 1239 11 1169 1180 17 1169 1186 13 1203 1216Total 27 2256 2283 23 2142 2165 24 2132 2156 26 2189 2215
20 - 21 M 23 1135 1158 19 1193 1212 25 1197 1222 15 1130 1145F 40 1406 1446 29 1370 1399 31 1343 1374 36 1291 1327Total 63 2541 2604 48 2563 2611 56 2540 2596 51 2421 2472
22 - 24 M 35 459 494 58 496 554 48 459 507 56 490 546F 39 364 403 35 377 412 41 365 406 49 343 392Total 74 823 897 93 873 966 89 824 913 105 833 938
Total Traditional StudentsM 73 2628 2701 90 2663 2753 83 2622 2705 92 2609 2701F 96 3000 3096 78 2921 2999 92 2887 2979 102 2841 2943Total 169 5628 5797 168 5584 5752 175 5509 5684 194 5450 5644
Non-Traditional Students
25 - 29 M 24 74 98 14 67 81 13 63 76 22 72 94F 15 43 58 24 46 70 28 56 84 26 72 98Total 39 117 156 38 113 151 41 119 160 48 144 192
30 - 34 M 15 20 35 12 24 36 11 18 29 6 20 26F 9 21 30 12 20 32 13 23 36 16 19 35Total 24 41 65 24 44 68 24 41 65 22 39 61
35 - 39 M 5 7 12 7 2 9 7 7 14 6 9 15F 18 11 29 11 9 20 13 12 25 11 12 23Total 23 18 41 18 11 29 20 19 39 17 21 38
40 - 49 M 8 11 19 10 17 27 9 8 17 11 7 18F 13 19 32 15 15 30 22 12 34 33 13 46Total 21 30 51 25 32 57 31 20 51 44 20 64
Over 50 M 3 1 4 2 1 3 5 0 5 3 2 5F 11 4 15 10 5 15 11 4 15 16 0 16Total 14 5 19 12 6 18 16 4 20 19 2 21
Total Non-Traditional Students
M 55 113 168 45 111 156 45 96 141 48 110 158F 66 98 164 72 95 167 87 107 194 102 116 218Total 121 211 332 117 206 323 132 203 335 150 226 376
Source: Fall and Spring Enrollment and Compliance Reports.
Spring '04 Spring '06 Spring '07Spring '05
28 a/
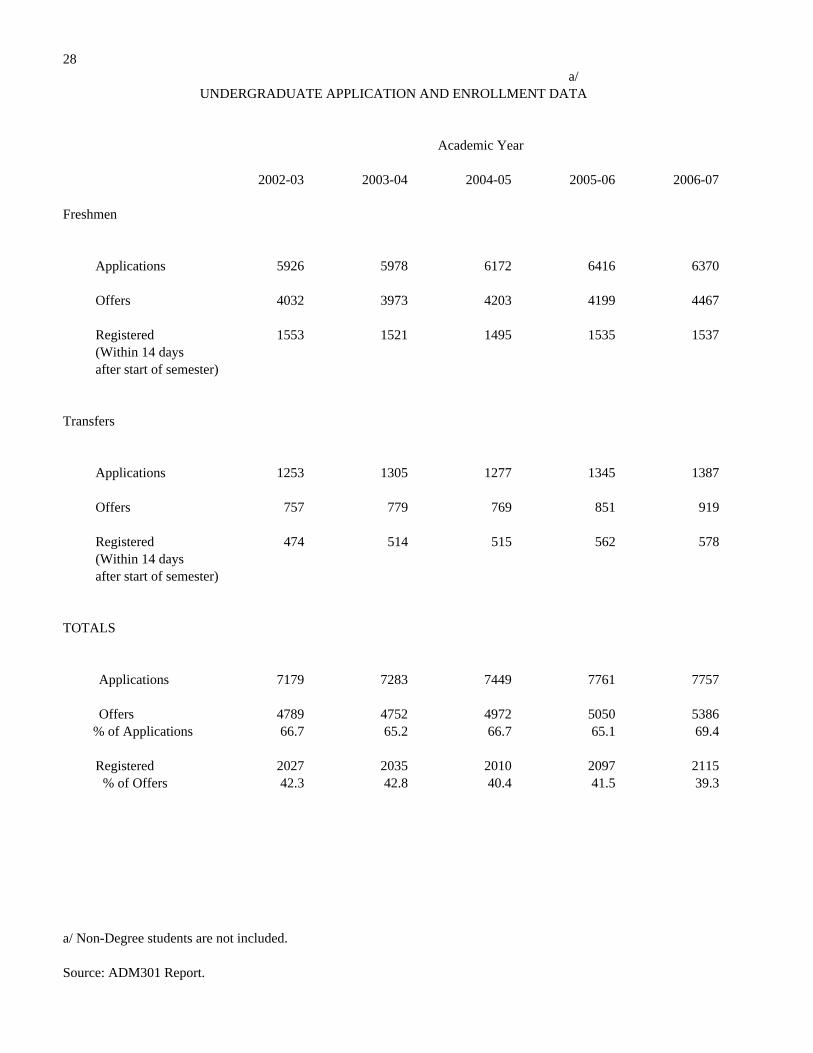
UNDERGRADUATE APPLICATION AND ENROLLMENT DATA
Academic Year
2002-03 2003-04 2004-05 2005-06 2006-07
Freshmen
Applications 5926 5978 6172 6416 6370
Offers 4032 3973 4203 4199 4467
Registered 1553 1521 1495 1535 1537(Within 14 daysafter start of semester)
Transfers
Applications 1253 1305 1277 1345 1387
Offers 757 779 769 851 919
Registered 474 514 515 562 578(Within 14 daysafter start of semester)
TOTALS
Applications 7179 7283 7449 7761 7757
Offers 4789 4752 4972 5050 5386 % of Applications 66.7 65.2 66.7 65.1 69.4
Registered 2027 2035 2010 2097 2115% of Offers 42.3 42.8 40.4 41.5 39.3
a/ Non-Degree students are not included.
Source: ADM301 Report.

29a/
NEW FRESHMEN BY MAJOR AND ABILITY INDICATORS, 2006-2007 ACADEMIC YEAR
College of Arts & Sciences
Degree Program Total Mean Mean Mean Concentration Headcount Centile SAT Math SAT Verbal
Art (BA) 19 39 505 535 Computer Graphics 4 23 513 508Art/Secondary Ed. Certification (BA) 7 24 507 520
Biology (BS) 17 24 548 566 Biotechnology 2 5 660 690 Ecology & Environmental 2 39 445 610 Health Professions 26 26 567 524 Health Sciences (TJU) 12 27 530 508 Medical Technology 2 26 530 650Biology/Secondary Ed. Certification (BS) 1 4 540 570 Ecology & Environmental 1 27 580 620
Chemistry (BS) 11 28 535 495 Biochemistry 5 24 552 506 Health Professions 9 26 589 539 Medical Technology 1 1 690 680Chemistry/Secondary Ed. Certification (BS) 3 22 610 487
Communication Journalism (BA) Electronic Media 14 34 539 557 Print Media 15 38 455 529 Public Relations 13 33 520 547
Computer Science (BS) 41 39 571 537 Computer Graphics 4 46 578 528 Software Engineering 6 23 592 540 Systems Programing 1 37 590 560
Economics (BS) 1 78 560 630
English (BA) 9 49 535 538 Writing 5 32 470 566English/Secondary Ed. Certification (BA) 20 25 521 553
French (BA) 2 47 395 555French/Secondary Ed. Certification (BA) 2 9 545 565Spanish (BA) 2 32 490 520Spanish/Secondary Ed. Certification (BA) 2 39 475 480
Earth Science (BSEd) 2 36 585 475Geoenvironmental Studies (BS) 8 41 521 515Geography/Social Studies (BSEd) 4 20 555 533

30
College of Arts & Sciences (continued)
Degree Program Total Mean Mean Mean Concentration Headcount Centile SAT Math SAT Verbal
History (BA) 16 45 508 528History/Social Studies Cert. (BSEd) 36 37 515 547
Interdisciplinary Arts (BA) 1 54 540 750
Mathematics (BA) 1 63 520 510Mathematics (BS) 3 34 607 500 Applied Math 3 16 620 523 Computer Science 1 35 620 640 Secondary Ed. Certification 21 28 603 516 Statistics 1 98 610 560
Applied Physics (BS) 16 46 566 538Physics (BS) 4 53 650 550 Nanofabrication 2 32 610 555Physics (BSEd) 1 15 680 740
Political Science (BA) 19 37 499 547Political Science/Social Studies Cert. (BSEd) 2 44 475 575Public Administration (BS) 1 57 700 620
Psychology (BA) 43 31 502 511
Sociology (BA) 3 60 437 513
COLLEGE TOTAL 447 34 537 536
College of Business
Accounting (BSBA) 52 28 578 519Information Technology (BSBA) 5 33 504 536Information Tech for Business Ed/ Secondary Ed. Certification (BSBA) 4 18 558 500Management Information Systems (BSBA) 3 32 587 523
Finance (BSBA) 16 37 565 524 Personal Financial Planning 1 18 550 600Information Management & Analysis (BSBA) 1 44 610 650 Supply Chain Management 2 34 605 510
Management (BSBA) Entrepreneurship & Corporate 3 53 510 487 General Management 15 39 532 505 Human Resource Management 5 34 570 574 International Management 5 31 540 562Marketing (BSBA) 27 38 556 522
Business Administration (General) 102 40 544 513
COLLEGE TOTAL 241 36 554 519

31
College of Education and Human Services
Degree Program Total Mean Mean Mean Concentration Headcount Centile SAT Math SAT Verbal
Criminal Justice (BS) 74 38 506 499
Exercise Science (BS) 13 29 568 544
Social Work (BSW) 11 32 501 493
Elementary Education (BSEd) 71 21 550 548
Education (General) 67 33 484 477
COLLEGE TOTAL 236 31 516 510
TOTAL - Office of Undeclared Students 612 43 487 482
TOTAL NEW FRESHMEN 1536 37 520 511
a/ Act 101 and Summer Bridge students are included in total headcount, not included in Centile or SAT's. Non-Degree students are not included in total headcount, Centile or SAT's.

32 a/
NEW FRESHMEN BY GENDER
Academic Year Female Male Total
2002-03 852 698 1550
2003-04 754 765 1519
2004-05 763 732 1495
2005-06 795 738 1533
2006-07 800 736 1536
a/ NEW FRESHMEN BY MINORITY ENROLLMENT AND GENDER
A. Ind.A. Na. Asian Black Hispanic TOTAL
Academic Year F M F M F M F M F M
b/2002-03 N 0 2 15 19 41 50 13 18 69 89
% 0.00 0.13 0.97 1.23 2.65 3.23 0.84 1.16 4.45 5.74 c/2003-04 N 0 3 16 6 40 49 10 13 66 71
% 0.00 0.20 1.05 0.39 2.63 3.23 0.66 0.86 4.34 4.67 d/2004-05 N 3 2 11 15 43 44 11 7 68 68
% 0.20 0.13 0.74 1.00 2.88 2.94 0.74 0.47 4.55 4.55 e/2005-06 N 4 0 9 12 51 46 21 13 85 71
% 0.26 0.00 0.59 0.78 3.33 3.00 1.37 0.85 5.54 4.63 f/2006-07 N 3 1 13 11 47 57 7 12 70 81
% 0.20 0.07 0.85 0.72 3.06 3.71 0.46 0.78 4.56 5.27
a/ Non-Degree students are not included. b/ Please note there are 1 students who chose not to report their race. c/ Please note there are 63 students who chose not to report their race. d/ Please note there are 85 students who chose not to report their race. e/ Please note there are 89 students who chose not to report their race. f/ Please note there are 115 students who chose not to report their race.

33a/
NEW TRANSFERS BY MAJOR, CLASS LEVEL AND INCOMING MEAN GPA 2006-2007 ACADEMIC YEAR
College of Arts & Sciences b/Mean
Degree Program College Concentration Freshmen Sophomore Junior Senior Total GPA
Art (BA) 2 0 0 0 2 3.25 Computer Graphics 3 2 1 0 6 3.21Art/Secondary Ed. Certification (BA) 3 5 2 0 10 3.36
Biology (BS) 2 3 4 1 10 3.07 Biotechnology 0 0 1 0 1 2.93 Ecology & Environmental Biology 1 3 3 0 7 3.31 Health Professions 5 2 3 0 10 3.31 Health Sciences (TJU) 0 1 1 0 2 3.45Biology/Secondary Ed. Certification (BS) 0 0 1 0 1 2.62
Chemistry (BS) 1 1 1 0 3 3.19 Health Professions 1 2 0 0 3 3.13Chemistry Secondary Ed. Certification (BS) 0 1 1 0 2 3.47
Communication Journalism (BA) Electronic Media 4 2 2 0 8 2.60 Print Media 6 2 3 0 11 2.92 Public Relations 5 10 0 0 15 2.80
Computer Science (BS) 2 3 2 0 7 2.91 Computer Graphics 1 1 1 0 3 2.56 Software Engineering 0 0 1 0 1 2.52 Systems Programming 0 1 0 0 1 2.24
Earth Science (BSEd) 1 0 0 0 1 3.72
Economics (BS) 2 3 1 0 6 2.51 Business 1 2 0 0 3 2.52 Political Science 1 0 0 0 1 3.20
English (BA) 3 5 4 0 12 2.67 Writing 1 1 1 0 3 2.30English/Secondary Ed. Certification (BA) 1 1 1 2 5 3.74
French/Secondary Ed. Certification (BA) 0 0 1 0 1 3.32Spanish (BA) 0 2 0 0 2 2.21Spanish/Secondary Ed. Certification (BA) 0 1 0 0 1 3.13
Geoenvironmental Studies (BS) 2 4 1 0 7 3.11Geography (BS) Land Use 0 0 1 0 1 2.77
Health Care Administration (BS) 2 7 8 0 17 3.22
History (BA) 4 9 3 1 17 2.86History/Social Studies Certification (BSEd) 3 0 4 1 8 3.30

34b/
College of Arts & Sciences (continued) MeanCollege
Degree Program Freshmen Sophomore Junior Senior Total GPA Concentration
Human Communication Studies (BS) 0 4 2 0 6 2.23
Interdiciplinary Arts (BA) 0 1 0 0 1 2.51
Mathematics (BS) 0 1 2 0 3 2.96Mathematics/Secondary Ed. Certification (BS) 2 0 1 0 3 3.51
Applied Physics (BS) 1 1 1 0 3 2.38Physics (BSEd) 1 1 0 0 2 3.16
Political Science (BA) 10 5 3 0 18 2.79Public Administration (BS) 0 0 1 0 1 3.36
Psychology (BA) 13 20 8 3 44 2.79
Sociology (BA) 1 5 5 0 11 2.43
COLLEGE TOTAL 85 112 75 8 280 2.92
College of Business
Accounting (BSBA) 3 5 7 0 15 3.10Info Tech for Sec Ed/Sec Ed Cert (BSBA) 0 0 2 0 2 3.65Management Information Systems (BSBA) 0 2 2 0 4 2.71
Finance (BSBA) 2 6 3 0 11 2.62 Personal Financial Planning 0 1 0 0 1 2.49Information Management & Analysis (BSBA) 0 0 1 0 1 3.31 Supply Chain Management 1 0 2 0 3 3.45Supply Chain Management (BSBA) 0 1 0 0 1 2.11
Management (BSBA) Entrepreneurship & Corporate 0 0 1 0 1 3.57 General Management 3 4 2 0 9 3.00 Human Resource Management 2 2 2 0 6 3.02 International Management 0 3 1 0 4 2.26Marketing (BSBA) 4 7 5 0 16 3.05
Business Administration (General) 7 9 5 0 21 3.13
COLLEGE TOTAL 22 40 33 0 95 2.99

35
b/College of Education and Human Services Mean
CollegeDegree Program GPA Concentration Freshmen Sophomore Junior Senior Total
Criminal Justice (BS) 10 9 11 0 30 2.97
Exercise Science (BS) 1 2 1 0 4 3.04
Elementary Education (BSEd) 10 25 19 0 54 3.29
Social Work (BSW) 6 10 12 0 28 2.93
Education (General) 9 5 0 0 14 2.82
COLLEGE TOTAL 36 51 43 0 130 3.08
TOTAL - Office of Undeclared Students 55 1 0 0 56 2.74
TOTAL NEW TRANSFERS 198 204 151 8 561 2.95
a/ Classification based on transcript evaluation - credits on database. Non-degree students are not included.b/ Caution, could be mean of single entry.

36 a/
NEW TRANSFERS BY GENDER
Academic Year Female Male Total
2002-03 221 194 415
2003-04 163 153 316
2004-05 234 235 469
2005-06 276 261 537
2006-07 296 265 561
a/NEW TRANSFERS BY MINORITY ENROLLMENT AND GENDER
A. Ind.A. Na. Asian Black Hispanic TOTAL
Academic Year F M F M F M F M F M
b/2002-03 N 1 1 1 0 10 6 2 1 14 8
% 0.24 0.24 0.24 0.00 2.41 1.45 0.48 0.24 3.37 1.93 c/2003-04 N 0 1 7 1 1 6 4 4 12 12
% 0.00 0.32 2.22 0.32 0.32 1.90 1.27 1.27 3.80 3.80 d/2004-05 N 0 1 1 1 8 9 8 5 17 16
% 0.00 0.21 0.21 0.21 1.71 1.92 1.71 1.07 3.62 3.41 e/2005-06 N 3 0 3 2 11 10 7 1 24 13
% 0.56 0.00 0.56 0.37 2.05 1.86 1.30 0.19 4.47 2.42 f/2006-07 N 0 1 10 9 19 17 5 2 34 29
% 0.00 0.18 1.78 1.60 3.39 3.03 0.89 0.36 6.06 5.17
a/ Non-Degree students are not included. b/ Please note there are 3 students who chose not to report their race. c/ Please note there are 33 students who chose not to report their race. d/ Please note there are 47 students who chose not to report their race. e/ Please note there are 66 students who chose not to report their race. f/ Please note there are 58 students who chose not to report their race.
37 a/
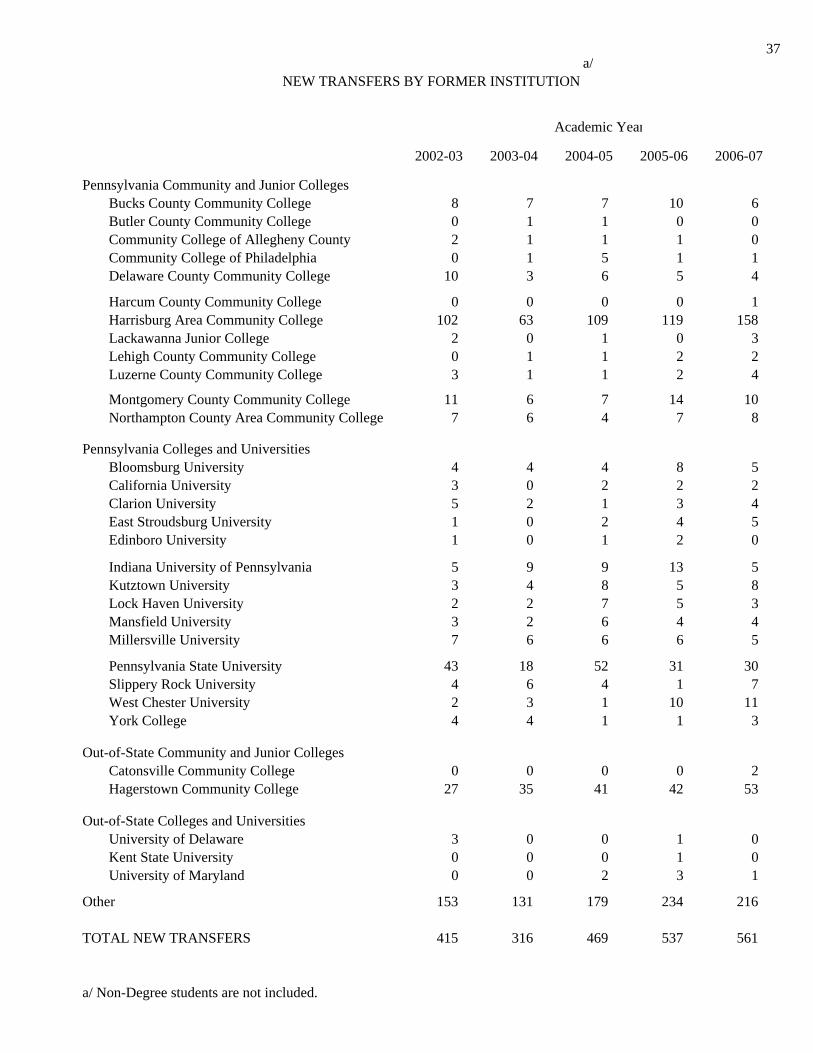
NEW TRANSFERS BY FORMER INSTITUTION
Academic Year
2002-03 2003-04 2004-05 2005-06 2006-07
Pennsylvania Community and Junior CollegesBucks County Community College 8 7 7 10 6Butler County Community College 0 1 1 0 0Community College of Allegheny County 2 1 1 1 0Community College of Philadelphia 0 1 5 1 1Delaware County Community College 10 3 6 5 4
Harcum County Community College 0 0 0 0 1Harrisburg Area Community College 102 63 109 119 158Lackawanna Junior College 2 0 1 0 3Lehigh County Community College 0 1 1 2 2Luzerne County Community College 3 1 1 2 4
Montgomery County Community College 11 6 7 14 10Northampton County Area Community College 7 6 4 7 8
Pennsylvania Colleges and UniversitiesBloomsburg University 4 4 4 8 5California University 3 0 2 2 2Clarion University 5 2 1 3 4East Stroudsburg University 1 0 2 4 5Edinboro University 1 0 1 2 0
Indiana University of Pennsylvania 5 9 9 13 5Kutztown University 3 4 8 5 8Lock Haven University 2 2 7 5 3Mansfield University 3 2 6 4 4Millersville University 7 6 6 6 5
Pennsylvania State University 43 18 52 31 30Slippery Rock University 4 6 4 1 7West Chester University 2 3 1 10 11York College 4 4 1 1 3
Out-of-State Community and Junior CollegesCatonsville Community College 0 0 0 0 2Hagerstown Community College 27 35 41 42 53
Out-of-State Colleges and UniversitiesUniversity of Delaware 3 0 0 1 0Kent State University 0 0 0 1 0University of Maryland 0 0 2 3 1
Other 153 131 179 234 216
TOTAL NEW TRANSFERS 415 316 469 537 561
a/ Non-Degree students are not included.

38 a/
NEW TRANSFERS BY CLASS LEVEL, FIRST YEAR MEAN GPA, AND GENDER
Academic Year
Entering 2002-03 2003-04 2004-05 2005-06 2006-07Level N GPA N GPA N GPA N GPA N GPA
Freshman Female 73 2.61 47 2.59 84 2.57 90 2.74 102 2.49 Male 73 2.48 47 2.39 79 2.35 101 2.37 96 2.25
Sophomore Female 89 2.91 76 2.84 95 2.78 98 2.85 102 2.69 Male 71 2.51 73 2.44 101 2.48 105 2.62 102 2.33
Junior Female 54 2.97 36 2.92 46 3.17 71 3.02 87 3.10 Male 48 2.73 31 2.75 55 2.54 49 2.73 64 2.59
Senior Female 5 3.14 4 3.42 9 3.34 5 2.90 5 2.75 Male 2 3.34 2 3.27 0 - 2 3.09 3 3.01
New Transfers Female 221 2.83 163 2.81 234 2.81 264 2.86 296 2.75 Male 194 2.56 153 2.50 235 2.45 257 2.54 265 2.37 Total 415 2.70 316 2.66 469 2.63 521 2.70 561 2.57
a/ Non-Degree students are not included.

a/ 39CUMULATIVE MEAN GPA'S BY COLLEGE AND GENDER, FALL '06
Arts & Education & Office ofSciences Business Human Services Undeclared Students University
FreshmenFemale 2.72 2.64 2.88 2.48 2.65Male 2.44 2.51 2.32 2.13 2.34Total 2.57 2.55 2.70 2.32 2.49
SophomoreFemale 2.96 2.90 3.13 2.65 2.96Male 2.72 2.69 2.79 2.49 2.69Total 2.84 2.77 3.03 2.58 2.83
JuniorFemale 3.01 2.97 3.33 2.45 3.10Male 2.87 2.75 2.95 2.36 2.83Total 2.94 2.83 3.23 2.40 2.97
SeniorFemale 3.13 3.00 3.45 2.10 3.23Male 2.99 2.93 3.03 2.15 2.98Total 3.06 2.95 3.33 2.12 3.11
UndergraduateFemale 2.96 2.89 3.22 2.51 2.95Male 2.75 2.71 2.77 2.21 2.66Total 2.86 2.77 3.09 2.37 2.81
a/CUMULATIVE MEAN GPA'S BY COLLEGE AND GENDER, SPRING '07
Arts & Education & Office ofSciences Business Human Services Undeclared Students University
FreshmenFemale 2.77 2.85 3.00 2.50 2.72Male 2.50 2.53 2.49 2.16 2.39Total 2.63 2.63 2.86 2.35 2.56
SophomoreFemale 2.97 2.82 3.15 2.41 2.93Male 2.68 2.70 2.74 2.32 2.65Total 2.83 2.74 3.03 2.36 2.80
JuniorFemale 2.99 2.97 3.29 2.49 3.08Male 2.82 2.69 2.86 2.15 2.78Total 2.91 2.79 3.17 2.26 2.94
SeniorFemale 3.10 2.96 3.45 2.08 3.20Male 3.01 2.88 3.03 --- 2.97Total 3.06 2.91 3.33 2.08 3.09
UndergraduateFemale 2.97 2.90 3.25 2.48 2.98Male 2.77 2.71 2.81 2.20 2.69Total 2.88 2.78 3.13 2.35 2.84
a/ Non-Degree students are not included.

II. Graduate Data

a/ 40GRADUATE HEADCOUNT AND CREDIT HOURS
College of Arts and Sciences Fall '03 Fall '04 Fall '05 Fall '06
Degree Program Head Credit Head Credit Head Credit Head Credit Concentration Count Hours Count Hours Count Hours Count Hours
Biology (MS) 17 130 30 192 29 192 29 165
Communication Studies (MS) 40 234 37 210 24 169 39 252
Computer Science (MS) 40 370 8 54 16 135 17 126Information Systems (MS) 0 0 16 48 1 9 17 51
English (MA) (Obsolete) 1 3 0 0 0 0 0 0
Geoenvironmental Studies (MS) 45 319 48 371 32 246 47 330
History (MA) (Obsolete) 3 21 3 30 2 21 1 12Applied History (MA) 26 170 34 258 37 252 40 283
Mathematics (MS) (Obsolete) 1 3 0 0 0 0 0 0Mathematics (MEd) (Obsolete) 1 3 1 3 0 0 0 0
Organizational Development & Leadership (MS) 15 93 36 228 42 246 34 181
Psychology (MS) 25 168 22 180 38 294 34 231
Public Administration (MPA) 30 189 36 249 27 171 34 231
COLLEGE TOTAL 244 1703 271 1823 248 1735 292 1862
College of Business
Business Administration (MBA) 54 351 45 219 51 255 109 598
College of Education and Human Services
Administration of Justice (MS) 44 231 32 179 33 209 31 192 Juvenile Justice 38 228 40 240 40 240 37 222
Applied Gerontology (MS) 11 66 11 57 8 33 3 9
Counseling (MS) College Counseling 7 51 5 36 8 66 6 42 College Student Personnel Work 29 216 27 216 23 171 27 207 Community Counseling 10 63 24 141 16 96 20 93 Mental Health 31 186 42 267 49 345 53 381Counseling (MEd) Elementary School Counselor 33 207 39 243 39 249 31 198 Secondary School Counselor 41 234 48 300 42 267 37 240

41
College of Education and Human Services (continued)
Fall '03 Fall '04 Fall '05 Fall '06Degree Program Head Credit Head Credit Head Credit Head Credit Concentration Count Hours Count Hours Count Hours Count Hours
Educational Administration (MEd) (Obsolete) Elementary School Administration (Obsolete) 26 102 14 57 7 24 7 21 Secondary School Administration (Obsolete) 34 123 24 93 9 30 4 18School Admin. Principal K-12 (MEd) 33 117 46 180 53 180 63 207
Curriculum & Instruction (MEd) 21 108 41 228 65 309 68 330Elementary Education (MEd) (Obsolete) 2 6 1 3 0 0 0 0 Early Childhood (Obsolete) 6 18 1 12 2 6 2 6Reading (MEd) 67 237 84 276 91 297 77 249Special Education (MEd) Behavioral Disorders 5 15 11 45 9 51 10 34 Comprehensive Special Education 97 348 76 282 63 279 35 154 Learning Disabilities 22 90 17 60 19 78 12 47 Mentally Retarded 3 9 12 42 9 36 11 36
Social Work (MSW) --- --- --- --- --- --- 15 123
Certification Only Comm/English Supervisor --- --- --- --- --- --- 1 3 Counseling Supervisor 1 2 1 3 1 3 0 0 Elementary Education Supervisor 1 3 1 3 1 3 1 3 Elementary School Administrator (Obsolete) 5 14 0 0 1 3 1 3 Environmental Ed Supervisor 1 3 1 3 1 3 1 3 Mathematics Supervisor 0 0 0 0 1 3 0 0 Pupil Services Supervision --- --- 1 3 1 6 2 6 Reading Supervisor 4 13 3 12 2 6 4 15 School Admin. Principal K-12 27 87 31 123 29 105 32 114 Secondary School Administrator (Obsolete) 2 6 2 6 2 6 2 9 Special Education Supervisor 22 66 16 81 9 30 8 24 Superintendent's Letter of Eligibility 16 49 19 63 22 76 8 24Post Masters - Reading Recovery Teacher Leader Training (Obsolete) 0 0 1 3 0 0 0 0
COLLEGE TOTAL 639 2898 671 3257 655 3210 609 3013
TOTAL - Non-Degree 103 328 87 278 72 231 83 297
GRADUATE TOTAL 1040 5280 1074 5577 1026 5431 1093 5770
FTES 440.0 464.8 452.6 480.8
a/ Please see Section VII for color charts.

42GRADUATE HEADCOUNT AND CREDIT HOURS
College of Arts and Sciences Spring '04 Spring '05 Spring '06 Spring '07
Degree Program Head Credit Head Credit Head Credit Head Credit Concentration Count Hours Count Hours Count Hours Count Hours
Biology (MS) 25 175 29 200 28 175 31 215
Communication Studies (MS) 34 213 35 210 31 192 33 225
Computer Science (MS) 28 242 6 48 14 114 15 120Information Systems (MS) 34 102 21 63 26 78 32 96
English (MA) (Obsolete) 0 0 0 0 1 3 0 0
Geoenvironmental Studies (MS) 53 373 45 364 37 267 34 261
History (MA) (Obsolete) 1 16 2 18 1 15 1 3Applied History (MA) 29 191 33 216 31 228 31 204
Mathematics (MEd) (Obsolete) 1 3 0 0 0 0 0 0
Organizational Development & Leadership (MS) 22 117 39 231 41 277 47 281
Psychology (MS) 21 127 22 183 31 207 34 234
Public Administration (MPA) 31 210 30 192 30 201 34 222
COLLEGE TOTAL 279 1769 262 1725 271 1757 292 1861
College of Business
Business Administration (MBA) 54 333 42 222 91 548 108 625
College of Education and Human Services
Administration of Justice (MS) 40 222 33 195 31 161 33 165 Juvenile Justice 38 228 36 216 36 216 34 204
Applied Gerontology (MS) 8 42 11 57 5 30 2 6
Counseling (MS) College Counseling 5 30 8 63 7 48 7 48 College Student Personnel Work 31 237 28 210 22 180 27 207 Community Counseling 25 102 10 63 17 76 11 78 Mental Health 35 216 49 336 46 324 52 339

43
College of Education and Human Services (continued) Spring '04 Spring '05 Spring '06 Spring '07
Degree Program Head Credit Head Credit Head Credit Head Credit Concentration Count Hours Count Hours Count Hours Count Hours
Counseling (MEd) Elementary School Counselor 31 198 37 252 38 264 28 198 Secondary School Counselor 40 261 43 267 37 228 38 273
Educational Administration (MEd) (Obsolete) Elementary School Administration (Obsolete) 27 96 12 42 8 24 4 15 Secondary School Administration (Obsolete) 28 105 18 54 10 30 5 15School Admin. Principal K-12 (MEd) 33 117 44 162 69 243 77 258
Curriculum & Instruction (MEd) 38 216 46 258 69 348 77 396Elementary Education (MEd) (Obsolete) 0 0 0 0 1 3 1 3 Early Childhood (Obsolete) 4 15 2 6 3 9 2 9Reading (MEd) 70 255 81 264 80 255 65 213Reading Recovery Teacher Leader Training --- --- 1 3 0 0 0 0Special Education (MEd) Behavioral Disorders 8 27 10 51 11 48 9 44 Comprehensive Special Education 83 369 72 270 43 174 43 212 Learning Disabilities 19 78 15 57 17 69 12 45 Mentally Retarded 3 12 10 45 10 39 11 48
Social Work (MSW) --- --- --- --- --- --- 13 108
Certification Only Counseling Supervisor 2 6 2 6 1 1 0 0 Early Childhood Supervisor --- --- --- --- --- --- 1 3 Elementary Education Supervisor 1 3 1 3 1 3 0 0 Elementary School Administration (Obsolete) 5 18 2 9 2 9 0 0 Environmental Education Supervisor 1 3 1 3 1 3 1 6 Math Supervisor --- --- --- --- --- --- 1 3 Pupil Services Supervision --- --- 1 3 2 9 1 3 Reading Supervisor 5 15 4 12 5 15 4 15 Science Supervisor 1 3 0 0 0 0 0 0 School Admin. Principal K-12 28 93 25 78 23 87 26 90 Secondary School Administration (Obsolete) 4 15 2 9 1 3 0 0 Special Education Supervisor 19 63 13 51 10 36 12 48 Superintendent's Letter of Eligibility 19 70 14 45 19 68 12 40
COLLEGE TOTAL 651 3115 631 3090 625 3003 609 3092
TOTAL - Non-Degree 103 337 93 303 90 321 108 433
GRADUATE TOTAL 1087 5554 1028 5340 1077 5629 1117 6011
FTES 462.8 445.0 469.1 500.9

College of Arts and Sciences
Degree Program Concentration '04 '05 '06 '04 '05 '06 '04 '05 '06 '04 '05 '06 '04 '05 '06
Biology (MS) 3 4 1 10 19 9 1 7 10 11 21 16 55 98 57Biology (MEd) (Obsolete) 0 0 0 0 0 0 0 0 0 0 0 0 0 0 0
Communication Studies (MS) 14 7 17 10 6 12 18 10 5 24 17 23 156 75 111
Computer Science (MS) 1 1 0 8 0 1 13 1 1 14 1 2 67 3 9Information Systems (MS) 45 44 31 0 0 0 43 44 34 46 44 36 273 261 195
Geoenvironmental Studies (MS) 3 4 4 22 12 14 13 18 10 26 25 22 133 129 108
History (MA) (Obsolete) 0 0 1 0 1 0 0 1 1 0 2 1 0 12 6Applied History (MA) 8 1 13 2 5 2 8 8 12 12 13 21 57 60 100
Mathematics (MS) (Obsolete) 0 0 0 0 0 0 1 0 1 1 0 1 3 0 3Mathematics (MEd) (Obsolete) 0 0 0 0 0 1 2 0 0 2 0 1 12 0 3
Organizational Development & Leadership (MS) 16 16 6 12 17 16 8 19 15 22 32 25 123 210 133
Psychology (MS) 2 1 1 6 14 8 1 6 0 7 14 8 31 81 39
Public Administration (MPA) 11 16 7 0 10 8 6 11 4 14 23 16 66 120 63
COLLEGE TOTAL 103 94 81 70 84 71 114 125 93 179 192 172 976 1049 827
44Unduplicated
HeadcountTerm VTerm IV
GRADUATE SUMMER ENROLLMENT
Term III
Summer Session TotalCredits

45
College of Business
Degree Program Concentration '04 '05 '06 '04 '05 '06 '04 '05 '06 '04 '05 '06 '04 '05 '06
Business Administration (MBA) 23 23 27 9 5 43 12 12 1 30 28 61 138 129 245
COLLEGE TOTAL 23 23 27 9 5 43 12 12 1 30 28 61 138 129 245
College of Education and Human Services
Counseling (MS) College Counseling 2 3 1 5 6 2 0 2 2 5 8 3 30 39 21 College Student Personnel Work 20 11 12 18 8 19 2 8 10 28 17 24 168 102 147 Community Counseling 5 3 13 24 17 1 19 16 4 25 18 16 147 105 54 Mental Health 14 12 15 21 24 29 5 24 23 25 34 38 141 204 246Counseling (MEd) Elementary School Counselor 3 2 1 26 25 22 6 23 14 27 32 29 150 186 159 Secondary School Counselor 7 4 0 32 25 27 22 18 16 38 33 32 243 171 180
Administration of Justice (MS) 12 23 11 9 27 12 28 11 13 35 32 25 168 210 123 Juvenile Justice 35 36 36 18 18 0 18 0 0 35 36 36 219 162 216
Educational Administration (MEd) (Obsolete) Elementary School Administration (Obsolete) 1 0 0 11 5 6 9 5 2 17 9 7 78 39 27 Secondary School Administration (Obsolete) 2 0 2 11 4 4 7 5 2 16 7 6 84 33 30School Admin Principal K-12 (MEd) 10 1 13 26 25 49 17 26 32 34 40 70 180 231 369
Curriculum & Instruction (MEd) 3 2 12 29 38 53 33 37 40 40 54 72 249 333 418Elementary Education (MEd) (Obsolete) 0 0 0 3 0 0 0 1 0 3 1 0 9 3 0 Early Childhood (Obsolete) 1 0 1 1 3 1 3 1 0 4 3 2 18 12 6Reading (MEd) 1 14 6 49 53 64 71 57 40 94 94 93 603 507 510Special Education (MEd) Behavioral Disorders 4 1 4 6 8 6 3 2 3 10 10 9 54 54 48 Comprehensive Special Education 38 19 24 70 50 25 20 17 10 84 67 42 445 297 213 Learning Disabilities 3 1 5 10 15 12 3 5 7 12 16 16 57 84 81 Mentally Retarded 5 2 6 3 10 3 0 2 5 6 12 9 36 48 48
Headcount CreditsTerm III Term IV Term V
Summer Session Unduplicated Total

College of Education and Human Services (continued)
Degree Program Concentration '04 '05 '06 '04 '05 '06 '04 '05 '06 '04 '05 '06 '04 '05 '06
Applied Gerontology (MS) 0 1 3 3 3 3 0 2 1 3 5 5 9 18 21
Social Work (MSW) 0 0 0 0 0 1 0 0 0 0 0 1 0 0 3
Certification Counseling Supervisor 0 0 0 1 1 1 0 1 1 1 2 1 3 6 6 Elementary Education Supervisor 0 0 0 1 0 0 0 0 0 1 0 0 3 0 0 Elementary School Administration (Obsolete) 0 1 0 1 1 0 0 3 0 1 4 0 6 15 0 Environmental Education Supervisor 0 0 0 0 1 0 0 0 0 0 1 0 0 3 0 Mathematics Supervisor 0 0 0 1 1 0 0 0 0 1 1 0 6 3 0 Pupil Services Supervision 0 0 1 0 0 1 0 1 0 0 1 1 0 3 9 Reading Supervisor 0 1 1 1 2 3 0 4 4 1 4 5 6 27 30 School Admin Principal K-12 1 0 2 16 6 15 3 13 17 18 17 24 79 72 123 Secondary School Administration (Obsolete) 0 0 0 0 0 0 1 0 1 1 0 1 3 0 3 Special Education Supervisor 0 0 3 11 3 3 0 3 0 11 5 5 51 24 21 Superintendent's Letter of Eligibility 0 8 11 11 6 7 0 1 1 11 13 12 36 45 51
COLLEGE TOTAL 167 145 183 418 385 369 270 288 248 587 576 584 3281 3036 3163
TOTAL Non-Degree 31 4 18 79 61 108 73 94 71 148 146 168 549 524 661
GRADUATE TOTAL 324 266 309 576 535 591 469 519 413 944 942 985 4944 4738 4896
FTES 412.0 394.8 408.0
46
Headcount CreditsTotal
Term III Term IV Term V
Summer Session Unduplicated

47
GRADUATE HEADCOUNT BY CERTIFICATE ENROLLMENT
Fall '03 Fall '04 Fall '05 Fall '06
Adlerian Studies 11 0 0 0Advanced Study in Counseling 1 0 0 1Aging 1 0 0 0
Spring '04 Spring '05 Spring '06 Spring '07
Adlerian Studies 8 0 0 0Advanced Study in Counseling 0 1 1 0Applied History 1 0 0 0

48
County Headcount Δ County Headcount Δ
Adams 56 +10 Lancaster 26 +5Allegheny 1 -2 Lawrence 0 0Armstrong 1 +1 Lebanon 9 -1Beaver 2 +2 Lehigh 3 +1Bedford 8 +3 Luzerne 6 -1
Berks 9 +5 Lycoming 0 -2Blair 7 +3 McKean 0 -1Bradford 0 -3 Mercer 0 0Bucks 9 +6 Mifflin 5 -3Butler 2 +1 Monroe 1 +1
Cambria 3 -1 Montgomery 6 +2Cameron 0 0 Montour 1 0Carbon 0 0 Northampton 1 -3Centre 8 0 Northumberland 4 -2Chester 6 +2 Perry 16 -11
Clarion 0 0 Philadelphia 7 +3Clearfield 0 0 Pike 1 0Clinton 1 +1 Potter 0 0Columbia 1 -1 Schuylkill 7 -1Crawford 0 0 Snyder 4 +2
Cumberland 392 +48 Somerset 1 0Dauphin 114 +14 Sullivan 0 0Delaware 3 -4 Susquehanna 1 +1Elk 0 0 Tioga 1 0Erie 1 +1 Union 1 0
Fayette 0 -1 Venango 1 0Forrest 0 0 Warren 0 0Franklin 215 -4 Washington 2 +2Fulton 12 -3 Wayne 0 -1Greene 1 +1 Westmoreland 2 -3
Huntingdon 7 -4 Wyoming 0 -1Indiana 0 0 York 84 +22Jefferson 0 0Juniata 3 -7Lackawanna 1 -5 PA TOTAL 1053 +72
where Δ indicates change from Fall 2005 valuesPlease see Section VII for color map
GRADUATE HEADCOUNT BY COUNTY, FALL '06

49a/
Head- Head-State count Δ State count Δ
Alabama 0 0 Montana 0 0Alaska 0 0 Nebraska 0 0Arizona 0 0 Nevada 0 0Arkansas 0 0 New Hampshire 0 0California 0 0 New Jersey 6 +1
Colorado 0 0 New Mexico 0 0Connecticut 0 0 New York 0 -2Delaware 0 0 North Carolina 0 0District of Columbia 0 0 North Dakota 0 0Florida 1 +1 Ohio 1 +1
Georgia 0 0 Oklahoma 0 0Hawaii 0 0 Oregon 0 0Idaho 0 0 Pennsylvania 1053 +69Illinois 0 0 Rhode Isalnd 0 0Indiana 0 0 South Carolina 0 -1
Iowa 0 0 South Dakota 0 0Kansas 0 0 Tennessee 0 0Kentucky 0 0 Texas 0 0Louisiana 0 0 Utah 0 0Maine 1 +1 Vermont 0 -1
Maryland 18 +2 Virginia 0 -3Massachusetts 0 0 Washington 0 0Michigan 0 0 West Virginia 2 -2Minnesota 0 0 Wisconsin 0 0Mississippi 0 0 Wyoming 0 0Missouri 0 0
U.S. TOTAL 1082 +66
where Δ indicates change from Fall 2005 valuesa/ Reflects current legal addresses self-reported by students.
GRADUATE HEADCOUNT BY STATE, FALL '06
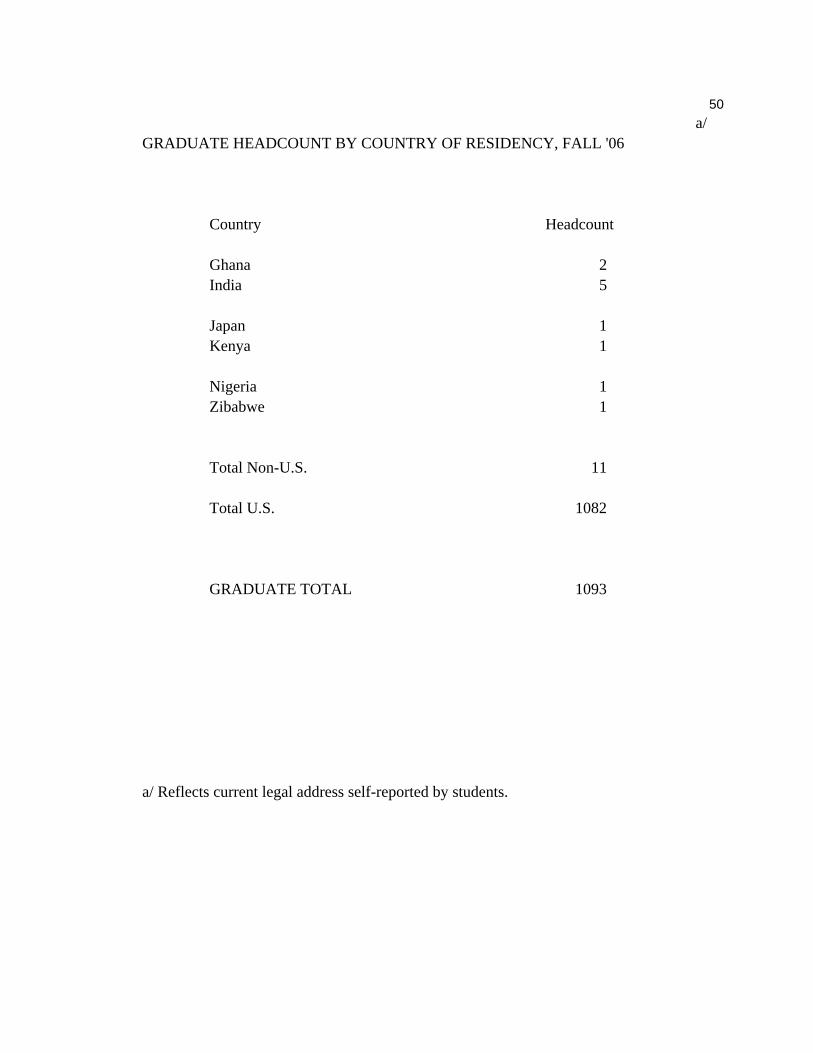
Total U.S. 1082
GRADUATE TOTAL 1093
a/ Reflects current legal address self-reported by students.
50 a/
GRADUATE HEADCOUNT BY COUNTRY OF RESIDENCY, FALL '06
Country Headcount
Ghana 2India 5
Japan 1Kenya 1
Nigeria 1Zibabwe 1
Total Non-U.S. 11

51GRADUATE HEADCOUNT BY COLLEGE AND GENDER
College and Gender Fall '02 Fall '03 Fall '04 Fall '05 Fall '06
Arts and Sciences
Female 110 107 135 137 149
Male 139 137 136 111 143
TOTAL 249 244 271 248 292
Education & Human Services Female 413 460 505 505 471
Male 166 179 166 150 138
TOTAL 579 639 671 655 609
Business
Female 10 26 24 22 43
Male 16 28 21 29 66
TOTAL 26 54 45 51 109
Non-Degree Female 120 86 73 56 57
Male 25 17 14 16 26
TOTAL 145 103 87 72 83
GRADUATE TOTAL 999 1040 1074 1026 1093

52GRADUATE HEADCOUNT BY GENDER, FULL-TIME AND PART-TIME
Full-Time Part-Time Full and Part-TimeF M Total F M Total F M Total
Fall '02 N 126 98 224 527 248 775 653 346 999% 12.6 9.8 22.4 52.8 24.8 77.6 65.4 34.6 100.0
Fall '03 N 132 101 233 547 260 807 679 361 1040% 12.7 9.7 22.4 52.6 25.0 77.6 65.3 34.7 100.0
Fall '04 N 150 91 241 587 246 833 737 337 1074% 14.0 8.5 22.4 54.7 22.9 77.6 68.6 31.4 100.0
Fall '05 N 162 89 251 558 217 775 720 306 1026% 15.8 8.7 24.5 54.4 21.2 75.5 70.2 29.8 100.0
Fall '06 N 153 90 243 567 283 850 720 373 1093% 14.0 8.2 22.2 51.9 25.9 77.8 65.9 34.1 100.0
GRADUATE MINORITY ENROLLMENT BY GENDER
A. Ind.Al. Na. Asian Black Hispanic TOTAL
F M F M F M F M F M
Fall '02 N 2 1 4 6 27 14 4 3 37 24% 0.20 0.10 0.40 0.60 2.70 1.40 0.40 0.30 3.70 2.40
a/Fall '03 N 0 1 5 6 21 11 1 4 27 22
% 0.00 0.10 0.48 0.58 2.02 1.06 0.10 0.38 2.60 2.12 b/
Fall '04 N 0 0 8 3 14 10 3 3 25 16% 0.00 0.00 0.74 0.28 1.30 0.93 0.28 0.28 2.33 1.49
c/Fall '05 N 1 1 9 4 23 11 5 3 38 19
% 0.10 0.10 0.88 0.39 2.24 1.07 0.49 0.29 3.70 1.85 d/
Fall '06 N 1 0 7 9 18 18 5 6 31 33% 0.09 0.00 0.64 0.82 1.65 1.65 0.46 0.55 2.84 3.02
a/ Fall 2003 data reflects 22 students who chose not to report their race.b/ Fall 2004 data reflects 26 students who chose not to report their race.c/ Fall 2005 data reflects 39 students who chose not to report their race.d/ Fall 2006 data reflects 55 students who chose not to report their race.

53
Part- Full- Part- Full- Part- Full- Part- Full-Time Time Total Time Time Total Time Time Total Time Time Total
18 - 19 M 0 0 0 0 0 0 0 0 0 0 0 0F 0 0 0 0 0 0 0 0 0 0 0 0Total 0 0 0 0 0 0 0 0 0 0 0 0
20 - 21 M 0 0 0 0 2 2 0 0 0 0 1 1F 0 3 3 1 4 5 0 2 2 0 5 5Total 0 3 3 1 6 7 0 2 2 0 6 6
22 - 24 M 26 55 81 23 45 68 27 56 83 40 60 100F 80 79 159 75 83 158 81 87 168 101 92 193Total 106 134 240 98 128 226 108 143 251 141 152 293
25 - 29 M 84 21 105 85 21 106 75 17 92 106 17 123F 176 29 205 207 37 244 209 38 247 217 29 246Total 260 50 310 292 58 350 284 55 339 323 46 369
30 - 34 M 61 11 72 56 9 65 48 7 55 66 3 69F 88 7 95 87 8 95 78 20 98 81 6 87Total 149 18 167 143 17 160 126 27 153 147 9 156
35 - 39 M 37 5 42 33 5 38 32 3 35 33 1 34F 56 1 57 72 4 76 61 1 62 50 8 58Total 93 6 99 105 9 114 93 4 97 83 9 92
40 - 49 M 35 5 40 35 5 40 29 2 31 27 6 33F 99 10 109 100 10 110 85 9 94 75 9 84Total 134 15 149 135 15 150 114 11 125 102 15 117
Over 50 M 17 4 21 14 4 18 6 4 10 11 2 13F 48 3 51 45 4 49 44 5 49 43 4 47Total 65 7 72 59 8 67 50 9 59 54 6 60
Total Graduate StudentsM 260 101 361 246 91 337 217 89 306 283 90 373F 547 132 679 587 150 737 558 162 720 567 153 720Total 807 233 1040 833 241 1074 775 251 1026 850 243 1093
GRADUATE HEADCOUNT BY AGE AND GENDER, FULL-TIME AND PART-TIME
Fall '05Fall '04 Fall '06Fall '03
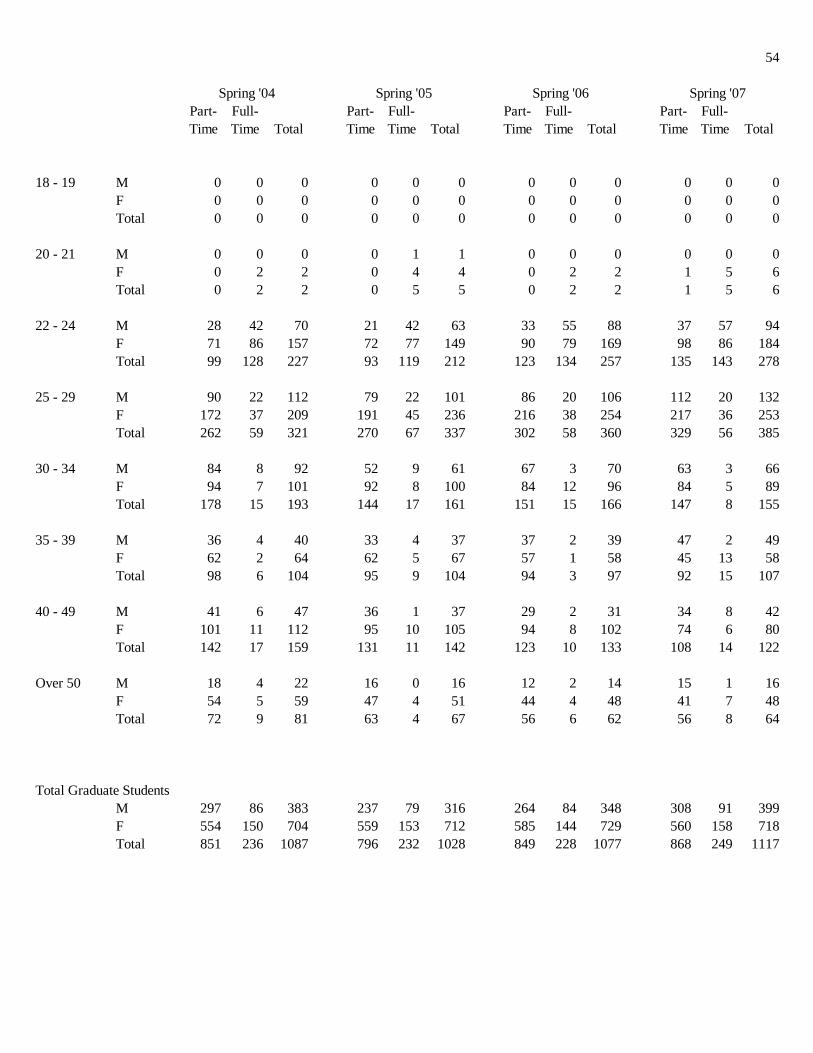
54
Part- Full- Part- Full- Part- Full- Part- Full-Time Time Total Time Time Total Time Time Total Time Time Total
18 - 19 M 0 0 0 0 0 0 0 0 0 0 0 0F 0 0 0 0 0 0 0 0 0 0 0 0Total 0 0 0 0 0 0 0 0 0 0 0 0
20 - 21 M 0 0 0 0 1 1 0 0 0 0 0 0F 0 2 2 0 4 4 0 2 2 1 5 6Total 0 2 2 0 5 5 0 2 2 1 5 6
22 - 24 M 28 42 70 21 42 63 33 55 88 37 57 94F 71 86 157 72 77 149 90 79 169 98 86 184Total 99 128 227 93 119 212 123 134 257 135 143 278
25 - 29 M 90 22 112 79 22 101 86 20 106 112 20 132F 172 37 209 191 45 236 216 38 254 217 36 253Total 262 59 321 270 67 337 302 58 360 329 56 385
30 - 34 M 84 8 92 52 9 61 67 3 70 63 3 66F 94 7 101 92 8 100 84 12 96 84 5 89Total 178 15 193 144 17 161 151 15 166 147 8 155
35 - 39 M 36 4 40 33 4 37 37 2 39 47 2 49F 62 2 64 62 5 67 57 1 58 45 13 58Total 98 6 104 95 9 104 94 3 97 92 15 107
40 - 49 M 41 6 47 36 1 37 29 2 31 34 8 42F 101 11 112 95 10 105 94 8 102 74 6 80Total 142 17 159 131 11 142 123 10 133 108 14 122
Over 50 M 18 4 22 16 0 16 12 2 14 15 1 16F 54 5 59 47 4 51 44 4 48 41 7 48Total 72 9 81 63 4 67 56 6 62 56 8 64
Total Graduate StudentsM 297 86 383 237 79 316 264 84 348 308 91 399F 554 150 704 559 153 712 585 144 729 560 158 718Total 851 236 1087 796 232 1028 849 228 1077 868 249 1117
Spring '04 Spring '06 Spring '07Spring '05

55GRADUATE APPLICATION AND ENROLLMENT DATA BY GENDER
Academic Year
2002-03 2003-04 2004-05 2005-06 2006-07New Applications
Female 774 815 800 792 727Male 528 413 383 433 392TOTAL 1302 1228 1183 1225 1119
AcceptedFemale 609 590 551 529 459Male 414 302 246 310 264TOTAL 1023 892 797 839 723
IncompleteFemale 155 206 218 239 240Male 96 99 122 106 109TOTAL 251 305 340 345 349
RejectedFemale 10 19 31 24 28Male 18 12 15 17 19TOTAL 28 31 46 41 47
Total New Apps Not Rejected 1274 1197 1137 1184 1072% of New Applications 97.8% 97.5% 96.1% 96.7% 95.8%
New Students EnrolledFemale 341 278 286 291 368Male 185 141 122 140 209TOTAL 526 419 408 431 577% of Apps Not Rejected 41.3% 35.0% 35.9% 36.4% 53.8%

III. Degrees and Alumni

a/ 56UNDERGRADUATE DEGREES CONFERRED
College of Arts and Sciences Academic Year
Degree Program Concentration 2002-03 2003-04 2004-05 2005-06 2006-07
Art (BA) 27 19 21 17 18 Computer Graphics --- --- 1 1 1Art/Secondary Ed. Certification (BA) --- --- --- 2 3
Biology (BS) 13 20 20 21 27 Biotechnology 4 5 6 5 2 Health Professions 21 18 21 27 13 Medical Technology 5 4 8 1 1 Ecology & Environmental Biology 5 6 5 6 6Biology/Secondary Ed. Certification (BS) 3 5 5 3 3 Environmental Biology 1 4 1 1 0Medical Technology (BS) (Obsolete) 2 0 0 3 2
Chemistry (BS) 7 13 8 8 4 Biochemistry 1 0 3 1 1 Medical Technology --- --- --- --- 0Chemistry/Secondary Ed. Certification (BS) 1 2 0 0 0
Communication Journalism (BA) 0 0 0 1 0 Electronic Media 18 36 31 29 24 Print Media 14 11 19 16 20 Public Relations 40 61 51 56 37 Radio/TV/Film (Obsolete) 1 0 0 0 0
Computer Science (BS) 32 33 19 11 12 Computer Graphics --- 3 3 3 5 Embedded Systems --- --- --- 1 0 Information Systems 3 4 9 0 3 Related Discipline --- --- 3 5 4 Scientific Programming 1 0 0 0 0 Software Engineering 5 5 9 15 7 Systems Programming 6 9 11 7 4
Economics (BS) --- --- --- 1 3 Political Science --- --- --- --- 1 Social Science --- --- --- --- 1Economics/Social Studies Certification (BSEd) --- --- --- 1 0
English (BA) 18 18 22 24 27 Writing 11 19 19 19 24English/Secondary Ed. Certification (BA) 12 18 15 19 27
French (BA) 1 1 1 2 5French/Secondary Ed. Certification (BA) 0 0 0 0 1Spanish (BA) 4 8 10 5 10Spanish/Secondary Ed. Certification (BA) 6 3 3 4 5Spanish (BSEd) (Obsolete) 1 0 0 0 0
CSS/Geography (BSEd) (Obsolete) 1 3 0 0 0Geography/Social Studies Certification (BSEd) --- --- --- 3 0Earth Science (BSEd) 2 4 3 7 1Geography (BA) (Obsolete) Regional Development & Tourism (Obsolete) 2 0 0 1 0

57
College of Arts and Sciences (continued)
Degree Program Concentration 2002-03 2003-04 2004-05 2005-06 2006-07
Geography (BS) Cartography-Spatial Analysis (Obsolete) 1 1 0 0 0 Geographic Information Systems 0 2 3 2 7 Land Use 3 4 3 2 5 Regional Development & Tourism 1 1 1 4 2Geoenvironmental Studies (BS) 48 48 43 41 38Urban Studies (BA) (Obsolete) 0 1 0 0 0
History (BA) 18 25 36 33 20 Public History 5 1 5 4 2CSS/History (BSEd) (Obsolete) 24 13 6 1 0History/Citizenship (BSEd) 3 8 1 0 0History/Social Studies Cert. (BSEd) --- --- 15 26 32
Human Communication Studies (BA) --- --- --- --- 22 African American Communications --- --- --- --- 0 Applied Communication --- --- --- --- 2
Mathematics (BA) 1 0 0 0 0Mathematics (BS) 2 4 2 4 0 Actuarial Science (Obsolete) 1 1 0 0 0 Applied Math 3 10 8 6 10 Computer Science 2 3 0 3 0 Secondary Ed. Certification 15 14 21 19 14 Statistics 1 4 5 1 3Mathematics (BSEd) (Obsolete) 1 0 0 0 0
Interdiciplinary Arts (BA) 1 0 0 2 1
Applied Physics (BS) 2 3 3 1 1Physics (BS) 6 2 4 8 2 Nanofabrication --- 1 0 5 0Physics (BSEd) 0 1 3 1 1
CSS/Political Science (BSEd) (Obsolete) 3 1 0 0 0Political Science (BA) 21 20 20 25 21Political Science/Social Studies Cert. (BSEd) --- --- 2 3 3Public Administration (BS) 10 9 7 9 8
Psychology (BA) 91 101 79 89 94Psychology (BSEd) (Obsolete) 0 1 0 0 0
Sociology (BA) 31 9 31 21 38CSS/Sociology (BSEd) (Obsolete) 4 3 0 0 0
Speech Communication (BA) 28 50 21 35 0 Applied Communication 1 1 0 2 0
CertificateGeographic Information Systems 28 40 28 44 21
COLLEGE TOTAL 623 714 674 717 649

58
College of Business
Degree Program Concentration 2002-03 2003-04 2004-05 2005-06 2006-07
Accounting (BSBA) 44 42 48 50 47Information Technology for Business Ed. (BSBA) 3 8 9 4 7 Secondary Ed. Certification 3 1 2 5 4Management Information Systems (BSBA) 49 38 37 25 31
Economics (BA) 0 2 0 0 0Economics (BSBA) 6 3 9 7 7
Finance (BSBA) 49 48 51 53 33 Personal Financial Planning --- --- --- 2 4Information Management & Analysis (BSBA) 8 9 7 7 4 Supply Chain Management --- 8 9 8 15Real Estate (BSBA) (Obsolete) 1 0 0 0 0Business Education (BSEd) (Obsolete) 0 0 1 0 0 Multi-Sequence (Obsolete) 2 0 0 0 0
Management (BSBA) 1 1 2 1 0 Entrepreneurship & Corporate --- --- --- 0 4 General Management 37 62 55 53 43 Human Resource Management 21 23 29 33 24 International Management 8 5 15 7 4Marketing (BSBA) 65 73 81 83 88 Supply Chain Management (Obsolete) 4 0 0 0 0
COLLEGE TOTAL 301 323 355 338 315

59
College of Education and Human Services
Degree Program Concentration 2002-03 2003-04 2004-05 2005-06 2006-07
Criminal Justice (BS) --- 4 14 47 73 Corrections (Obsolete) 1 0 1 0 0 Generalist (Obsolete) 23 25 43 27 23 Juvenile Justice (Obsolete) 3 3 0 0 1 Juvenile & Adult Corrections (Obsolete) 8 15 11 6 1 Law Enforcement (Obsolete) 47 48 29 27 17
Excersise Science (BS) --- --- --- --- 8
Social Work (BA) (Obsolete) 1 1 0 0 0Social Work (BSW) 42 47 55 44 52
Elementary Education (BSEd) Biology 1 0 0 0 0 Elementary Education 155 185 211 203 180 Environmental Education 4 9 11 6 8 Mathematics 9 13 11 2 3 Sociology 1 0 1 0 1 TESOL --- --- --- --- 1
COLLEGE TOTAL 295 350 387 362 368
UNDERGRADUATE DEGREES BA 351 405 385 405 402 BS 287 333 329 331 312 BSBA 299 321 354 338 315 BSW 42 47 55 44 52 BSEd 211 241 265 253 230
CertificateGeographic Information Systems 28 40 28 44 21
TOTAL 1218 1387 1416 1415 1332
a/ Please see Section VII for color charts.
SOURCE: Degrees Conferred Submission.

a/ 60GRADUATE DEGREES CONFERRED
College of Arts and Sciences Academic Year
Degree Program Concentration 2001-02 2002-03 2003-04 2004-05 2005-06 2006-07
Biology (MS) 4 8 4 7 11 8Biology (MEd) (Obsolete) 0 1 1 0 0 0
Communication Studies (MS) 11 6 4 17 6 16
Computer Science (MS) 12 18 25 18 4 10Information Systems (MS) 0 18 11 20 12 7
English (MA) (Obsolete) 3 5 1 0 0 0English (MEd) (Obsolete) 2 4 0 0 0 0
Geoenvironmental Studies (MS) 16 21 10 19 15 11
Public Administration (MPA) 34 15 12 11 12 9
Applied History (MA) --- 1 5 11 14 13History (MA) (Obsolete) 10 7 0 0 2 2
Mathematics (MS) (Obsolete) 5 2 0 2 0 1Mathematics (MEd) (Obsolete) 0 0 0 2 0 0
Psychology (MS) 13 8 14 6 9 11
Organizational Development & Leadership (MS) --- --- 2 11 16 19
COLLEGE TOTAL 110 114 89 124 101 107
College of Business
Business Administration (MBA) --- --- 14 19 21 17
COLLEGE TOTAL --- --- 14 19 21 17
College of Education and Human Services
Counseling (MS) College Counseling 1 1 0 1 5 3 College Student Personnel Work 9 10 11 11 5 5 Community Counseling 4 5 4 3 2 14 Mental Health 6 7 3 7 8 14Guidance and Counseling (MEd) Elementary School Counselor 12 2 11 11 11 14 Secondary School Counselor 9 13 13 13 11 8
Administration of Justice (MS) 12 16 14 28 13 16 Juvenile Justice 15 15 9 16 18 18

61
College of Education and Human Services (continued)
Degree Program Concentration 2001-02 2002-03 2003-04 2004-05 2005-06 2006-07
Educational Administration (MEd) (Obsolete) Elementary School Administrator (Obsolete) 9 13 13 6 3 6 Secondary School Administrator (Obsolete) 19 10 20 6 4 4School Admin Pincipal K-12 (MEd) --- 1 5 3 7 18
Applied Gerontology (MS) --- --- 1 1 4 1
Elementary Education (MEd) (Obsolete) 11 9 4 1 1 0Elementary Education/Early Childhood (MEd) (Obs.) 15 7 6 3 0 0Reading (MEd) 28 37 32 21 24 39Special Education (MEd) Behavioral Disorders 4 1 4 4 4 5 Comprehensive Special Education 14 16 21 30 24 22 Learning Disabilities 6 10 9 7 6 9 Mentally Retarded 4 0 0 6 3 7Curriculum & Instruction (MEd) --- --- 3 5 12 15
COLLEGE TOTAL 178 173 183 183 165 218
GRADUATE DEGREES MA 13 13 6 11 16 15 MS 108 135 112 167 128 154 MEd 133 124 142 118 110 147 MPA 34 15 12 11 12 9 MBA --- --- 14 19 21 17
TOTAL 288 287 286 326 287 342
Fall '02 Fall '03 Fall '04 Fall '05 Fall '06Adlerian StudiesAdvanced Study in Counseling 0 8 0 0 0Aging 0 1 0 0 0Applied History 0 1 0 0 0
0 0 0 0 0
Spring '03 Spring '04 Spring '05 Spring '06 Spring '07Adlerian StudiesAdvanced Study in Counseling 0 0 5 0 0Aging 0 0 0 0 0Applied History 0 0 0 0 0
0 0 1 0 0
a/ Please see Section VII for color charts.
SOURCE: Degrees Conferred Submission.
GRADUATE HEADCOUNT - AWARDED CERTIFICATES

a/ 62
County Headcount County Headcount
Adams 1184 Lancaster 2090Allegheny 363 Lawrence 15Armstrong 14 Lebanon 673Beaver 47 Lehigh 586Bedford 335 Luzerne 167
Berks 1060 Lycoming 188Blair 351 McKean 7Bradford 52 Mercer 15Bucks 1118 Mifflin 290Butler 63 Monroe 99
Cambria 155 Montgomery 1798Cameron 2 Montour 42Carbon 53 Northampton 436Centre 195 Northumberland 169Chester 1463 Perry 611
Clarion 16 Philadelphia 409Clearfield 42 Pike 23Clinton 31 Potter 12Columbia 85 Schuylkill 294Crawford 13 Snyder 138
Cumberland 6470 Somerset 146Dauphin 2837 Sullivan 7Delaware 867 Susquehanna 20Elk 9 Tioga 49Erie 36 Union 101
Fayette 18 Venango 8Forest 4 Warren 8Franklin 3413 Washington 52Fulton 274 Wayne 47Greene 8 Westmoreland 182
Huntingdon 415 Wyoming 16Indiana 45 York 2968Jefferson 17Juniata 229 Unknown 11Lackawanna 118 TOTAL 33079
a/ Please see Section VII for color map.
SOURCE: SU Alumni Data Base, Alumni Office.
PENNSYLVANIA ALUMNI BY COUNTY

California 484 Mississippi 14 Utah 29
Florida 912 North Carolina 536 Wisconsin 65
Illinois 162 New York 468Illinois 162 New York 468
Louisiana 34 Pennsylvania 33079Maine 50 Rhode Island 30
Total 44463
See map in Section VIISOURCE: SU Alumni Data Base, Alumni Office.
63ALUMNI BY STATE OF RESIDENCE
Head- Head- Head-State count State count State count
Alaska 19 Maryland 2407 South Carolina 181Alabama 76 Massachusetts 168 South Dakota 6Arkansas 19 Michigan 136 Tennessee 130Arizona 161 Minnesota 63 Texas 381
Colorado 200 Missouri 79 Vermont 38Connecticut 137 Montana 25 Virginia 1286District of Columbia 48 Nebraska 13 Washington 99Delaware 311 Nevada 47 West Virginia 206
Wyoming 23Georgia 288 North Dakota 1Hawaii 54 New Hampshire 57 Unknown 30Iowa 45 New Jersey 1186 International 2Idaho 15 New Mexico 50
Indiana 101 Ohio 287Kansas 47 Oklahoma 46Kentucky 67 Oregon 65

a/ 64LIVING ALUMNI
Known UnknownAddress Address Total Alumni
N % N % N %
Sex Female 23956 47.8 3035 6.1 26991 53.9
Male 20490 40.9 2571 5.1 23061 46.1Unknown 17 0.0 1 0.0 18 0.0
Total 44463 88.8 5607 11.2 50070 100.0
Race African American 832 1.7 143 0.3 975 1.9 American Indian 41 0.1 8 0.0 49 0.1 Asian 345 0.7 101 0.2 446 0.9 Hispanic 208 0.4 25 0.0 233 0.5 White 25634 51.2 3005 6.0 28639 57.2 Other 62 0.1 6 0.0 68 0.1 Unknown 17341 34.6 2319 4.6 19660 39.3
Total 44463 88.8 5607 11.2 50070 100.0 Total 44463 88.8 5607 11.2 50070 100.0
a/Decade of Graduation 1920-1929 18 0.0 8 0.0 26 0.0 1930-1939 71 0.1 29 0.1 100 0.2 1940-1949 217 0.4 28 0.1 245 0.4 1950-1959 1173 2.1 82 0.2 1255 2.3 1960-1969 4251 7.8 385 0.7 4636 8.5 1970-1979 10630 19.5 1311 2.4 11941 21.9 1980-1989 11087 20.3 1533 2.8 12620 23.1 1990-1999 12237 22.4 1990 3.6 14227 26.0 2000-2009 9012 16.5 545 1.0 9557 17.5 Unknown 12 0.0 1 0.0 13 0.0
Total 48708 89.2 5912 10.8 54620 100.0
a/College Arts and Sciences 19725 36.1 2679 4.9 22404 41.0 Business 11074 20.3 1263 2.3 12337 22.6 Education and Human Services 16905 31.0 1823 3.3 18728 34.3 Unknown 1004 1.8 147 0.3 1151 2.1
Total 48708 89.2 5912 10.8 54620 100.0

65 Known Unknown Department Address Address Total Alumni
a/ N % N % N %College of Arts and Sciences
Art 263 1.2 34 0.2 297 1.3Biology 1748 7.8 222 1.0 1970 8.8Chemistry 478 2.1 72 0.3 550 2.5Communications/Journalism 2712 12.1 346 1.5 3058 13.6Economics 4 0.0 0 0.0 4 0.0English 1900 8.5 245 1.1 2145 9.6Geography/Earth Science 1710 7.6 187 0.8 1897 8.5Government/Political Science 2664 11.9 487 2.2 3151 14.1History/Philosophy 1496 6.7 152 0.7 1648 7.4Information Systems Studies 26 0.1 0 0.0 26 0.1Interdisciplinary Arts 8 0.0 3 0.0 11 0.0Math & Computer Science 3019 13.5 376 1.7 3395 15.2Modern Languages 392 1.7 53 0.2 445 2.0Physics 251 1.1 39 0.2 290 1.3Psychology 1855 8.3 290 1.3 2145 9.6Sociology/Anthropology 691 3.1 111 0.5 802 3.6Speech/Theatre Arts 508 2.3 62 0.3 570 2.5
Total 19725 88.0 2679 12.0 22404 100.0 a/
College of Business
Accounting 2518 20.4 249 2.0 2767 22.4Economics 192 1.6 25 0.2 217 1.8F/DS/IS 3645 29.5 394 3.2 4039 32.7Management/Marketing 4719 38.3 595 4.8 5314 43.1
Total 11074 89.8 1263 10.2 12337 100.0a/
College of Education and Human Services
Counseling 1968 10.5 257 1.4 2225 11.9Criminal Justice 2558 13.7 356 1.9 2914 15.6Educational Leadership and Policy 444 2.4 43 0.2 487 2.6Exercise Science 3 0.0 0 0.0 0 0.0Gerontology 5 0.0 0 0.0 5 0.0Library Science 527 2.8 70 0.4 597 3.2Social Work 1216 6.5 151 0.8 1367 7.3Teacher Education 10184 54.4 946 5.1 11130 59.4
Total 16905 90.3 1823 9.7 18725 100.0
Unknown 1004 87.2 147 12.8 1151 100.0
University Total 48708 89.2 5912 10.8 54620 100.0a/Duplicate count of students who graduated from more than one program.SOURCE: SU Alumni Data Base, Alumni Office.

IV. Employees
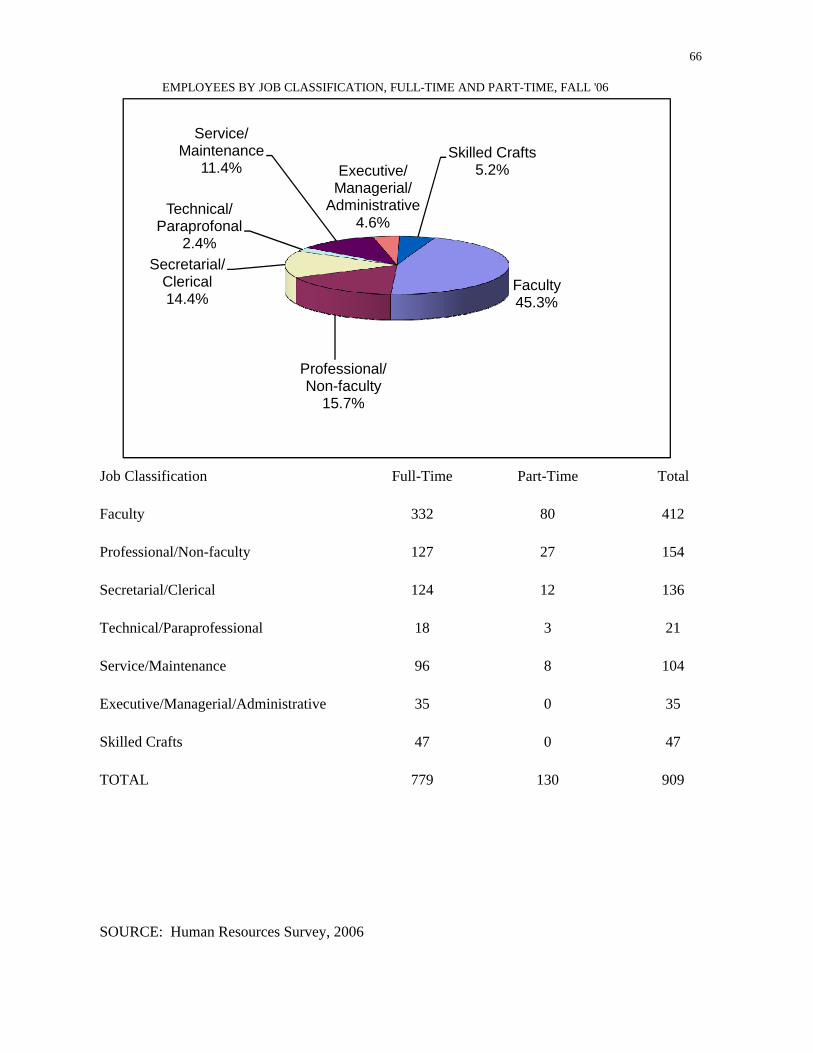
66
EMPLOYEES BY JOB CLASSIFICATION, FULL-TIME AND PART-TIME, FALL '06
Job Classification Full-Time Part-Time Total
Faculty45.3%
Professional/Non-faculty
15.7%
Secretarial/Clerical14.4%
Technical/Paraprofonal
2.4%
Service/Maintenance
11.4% Executive/Managerial/
Administrative4.6%
Skilled Crafts5.2%
Faculty 332 80 412
Professional/Non-faculty 127 27 154
Secretarial/Clerical 124 12 136
Technical/Paraprofessional 18 3 21
Service/Maintenance 96 8 104
Executive/Managerial/Administrative 35 0 35
Skilled Crafts 47 0 47
TOTAL 779 130 909
SOURCE: Human Resources Survey, 2006

67FULL-TIME EMPLOYEES BY JOB CLASSIFICATION, RACE AND GENDER
Fall '02 Fall '03 Fall '04 Fall '05 Fall '06Female Male Female Male Female Male Female Male Female Male
Faculty White 112 177 118 168 138 169 110 165 117 174 Black 10 11 10 12 9 10 7 10 6 9 Hispanic 3 1 4 2 3 2 3 2 3 2 Asian 6 8 7 7 9 7 6 9 7 13 Am. Indian 0 0 0 0 0 0 0 0 1 0 TOTAL 131 197 139 189 159 188 126 186 134 198
Executive/Managerial/Administrative White 9 34 9 31 10 28 8 25 7 26 Black 1 1 1 1 1 1 0 1 1 1 Hispanic 0 0 0 1 0 1 0 0 0 0 Asian 0 0 0 0 0 0 0 0 0 0 Am. Indian 0 0 0 0 0 0 0 0 0 0 TOTAL 10 35 10 33 11 30 8 26 8 27
Professional Non-Faculty White 42 45 44 43 44 50 51 57 51 57 Black 3 4 3 4 3 7 3 7 5 6 Hispanic 2 1 3 2 2 1 2 1 2 1 Asian 1 0 1 1 2 2 5 1 3 1 Am. Indian 1 0 1 0 1 0 1 0 1 0 TOTAL 49 50 52 50 52 60 62 66 62 65
Secretarial/Clerical White 92 11 99 11 99 12 101 16 100 17 Black 4 1 3 1 3 1 3 0 4 0 Hispanic 2 0 2 0 2 0 3 0 3 0 Asian 0 0 0 0 0 0 0 0 0 0 Am. Indian 0 0 0 0 0 0 0 0 0 0 TOTAL 98 12 104 12 104 13 107 16 107 17
Technical/Paraprofessional White 19 6 16 4 15 4 13 5 13 4 Black 1 0 1 0 1 0 1 0 1 0 Hispanic 0 0 0 0 0 0 0 0 0 0 Asian 0 0 0 0 0 0 0 0 0 0 Am. Indian 0 0 0 0 0 0 0 0 0 0 TOTAL 20 6 17 4 16 4 14 5 14 4

68
Fall '02 Fall '03 Fall '04 Fall '05 Fall '06Female Male Female Male Female Male Female Male Female Male
Skilled Crafts White 1 45 0 44 0 41 0 41 0 45 Black 0 2 0 2 0 2 0 2 0 1 Hispanic 0 1 0 1 0 1 0 1 0 1 Asian 0 0 0 0 0 0 0 0 0 0 Am. Indian 0 0 0 0 0 0 0 0 0 0 TOTAL 1 48 0 47 0 44 0 44 0 47
Service/Maintenance White 35 51 34 51 37 53 34 49 36 48 Black 3 5 4 6 4 5 3 6 3 6 Hispanic 0 1 0 1 0 2 0 1 0 1 Asian 0 0 0 1 0 1 0 1 0 2 Am. Indian 0 0 0 0 0 0 0 0 0 0 TOTAL 38 57 38 59 41 61 37 57 39 57
GRAND TOTAL White 310 369 320 352 343 357 317 358 324 371 Black 22 24 22 26 21 26 17 26 20 23 Hispanic 7 4 9 7 7 7 8 5 8 5 Asian 7 8 8 9 11 10 11 11 10 16 Am. Indian 1 0 1 0 1 0 1 0 2 0 TOTAL 347 405 360 394 383 400 354 400 364 415
SOURCE: Fall Staff Survey (Human Resources Survey since Fall 2006)

V. Budget and Finances

69TUITION HISTORY
Undergraduate Cost Per Academic Year
PA Out-of-StateOut-of-
Academic Out-of- In-State StateYear PA State Room Board Fees Fees Total % Change Total % Change
1995-96 3224 8198 2012 1582 786 786 7604 3.3 12578 3.81996-97 3368 8566 2100 1602 862 862 7932 4.3 13130 4.41997-98 3468 8824 2146 1666 876 876 8156 2.8 13512 2.91998-99 3468 8824 2396 1712 878 878 8454 3.7 13810 2.21999-00 3618 9046 2468 1760 932 932 8778 3.8 14206 2.92000-01 3792 9480 2548 1836 954 954 9130 4.0 14818 4.32001-02 4016 10040 2742 1900 988 988 9646 5.7 15670 5.72002-03 4378 10946 2916 1948 1124 1174 10366 7.5 16984 8.42003-04 4598 11496 3086 1994 1148 1198 10826 4.4 17774 4.72004-05 4810 12026 3190 2084 1176 1226 11260 4.0 18526 4.22005-06 4906 12266 3290 2156 1269 1332 11621 3.2 19044 2.82006-07 5038 12598 3420 2276 1511 1574 12245 5.4 19868 4.3
Graduate
% Increase of CostCost Per SCH Cost Per 9-15 SCH Per Credit Hour
Out-of-Academic Out-of- Out-of- In-State State Out-of-
Year PA State PA State Fees Fees PA State
1995-96 179 322 1612 2897 313 313 4.7 4.51996-97 187 336 1684 3027 331 331 4.5 4.31997-98 193 346 1734 3118 338 338 3.2 3.01998-99 193 346 1734 3118 339 339 0.0 0.01999-00 210 367 1890 3305 346 346 8.8 6.12000-01 230 389 2069 3504 357 357 9.5 6.02001-02 256 420 2300 3777 374 374 11.3 8.02002-03 292 467 2627 4204 442 467 14.1 11.22003-04 307 491 2759 4415 454 479 5.1 5.12004-05 321 513 2886 4618 468 493 4.6 4.52005-06 327 523 2944 4711 490 521 1.9 1.92006-07 336 538 3024 4839 500 532 2.8 2.9
SOURCE: Fee Schedule 1.

OCRB3 - FINANCIAL ASSISTANCE TO STUDENTS Use Summer 2005, Fall 2005, and Spring 2006 for this reportIN INSTITUTIONS OF HIGHER EDUCATIONSave file as: OCRB32006xx.xls where xx=1st two letters of university name. Save on SyTEC server at: ftp://ftp.sytecpa.org/Public/System Research/[univname]/IncomingFilestoSRO/OCRB3Due date: December 1, 2006
FICE CODE: RACE/ETHNIC IDENTIFICATION AND SEXUNIVERSITY:
GRANDTOTAL
LINE MALE FEMALE MALE FEMALE MALE FEMALE MALE FEMALE MALE FEMALE MALE FEMALE MALE FEMALE MALE FEMALENO. 1 2 3 4 5 6 7 8 9 10 11 12 13 14 15 16 17
I. GRANTS A. Pell Grants No. of Awards 1 87 93 3 4 4 11 12 23 408 516 23 26 0 0 537 673 1210 Dollar Amount 2 224113 283077 2100 12750 7150 28900 35175 51100 910291 1204627 58394 63475 0 0 1237223 1643929 2881152 B. SEOG No. of Awards 3 25 40 0 2 1 2 7 8 149 218 10 8 0 0 192 278 470 Dollar Amount 4 13525 25200 0 1200 800 1250 3950 4050 73895 114725 5875 4000 0 0 98045 150425 248470 C. Vocational Rehab- No. of Awards 5 0 2 0 1 0 0 1 1 19 14 1 1 0 0 21 19 40 ilitation Grants Dollar Amount 6 0 2700 0 1680 0 0 3976 2385 67083 44602 830 3978 0 0 71889 55345 127234 D. State and Local No. of Awards 7 83 101 2 5 8 17 17 24 721 897 46 50 0 0 877 1094 1971 Grants Dollar Amount 8 245525 283399 6750 13705 19737 38125 41750 63274 1594296 1982033 107775 115187 0 0 2015833 2495723 4511556 E. Private Sources No. of Awards 9 0 0 0
Dollar Amount 10 0 0 0 F. Institutional No. of Awards 11 0 0 0 0 0 0 0 0 2 3 0 0 0 0 2 3 5 Grants Dollar Amount 12 0 0 0 0 0 0 0 0 3000 4500 0 0 0 0 3000 4500 7500 G. Tuition Waivers No. of Awards 13 44 73 6 4 17 30 16 34 145 250 12 14 0 0 240 405 645 (Remissions) Dollar Amount 14 119033 217607 20115 11012 67378 145961 62168 123670 629288 1042293 82752 83854 0 0 980734 1624397 2605131 H. All Other Grants No. of Awards 15 0 0 0
Dollar Amount 16 0 0 0 I. Total Number of unduplicated
TOTALBLACK (not of
Hispanic origin)AMERICAN INDIAN
OR ALASKAN NATIVE ASIAN OR
PACIFIC ISLANDER HISPANIC MULTI-RACIALUNKNOWNWHITE (not of
Hispanic origin)
p recipients 17 124 149 6 6 20 40 28 46 959 1245 65 69 0 0 1202 1555 2757 J. Total dollar amount 18 602196 811983 28965 40347 95065 214236 147019 244479 3277853 4392780 255626 270494 0 0 4406724 5974319 10381043
II. LOANS A. Repayable By Cash Only
1. NDSL No. of Awards 19 26 42 0 1 1 2 6 9 128 187 6 8 0 0 167 249 416Dollar Amount 20 40900 66700 0 1300 2000 5400 8600 14800 174100 268200 6700 10900 0 0 232300 367300 599600
2. Federally In- No. of Awards 21 138 148 5 7 22 32 30 42 1720 2108 112 107 0 0 2027 2444 4471 sured Loans Dollar Amount 22 849096 875954 21834 31611 118477 187230 171180 246520 10712253 13892890 731238 666044 0 0 12604078 15900249 28504327 3. State Insured No. of Awards 23 0 0 0 Loans Dollar Amount 24 0 0 0 4. Institutional No. of Awards 25 0 0 0 0 0 0 0 0 0 0 0 0 0 0 0 0 0 Loans Dollar Amount 26 0 0 0 0 0 0 0 0 0 0 0 0 0 0 0 0 0 5. Private Sources No. of Awards 27 21 17 0 0 3 3 3 4 310 319 14 19 0 0 351 362 713 Dollar Amount 28 132090 135075 0 0 33531 15000 35093 24375 2088760 2047156 129296 125431 0 0 2418770 2347037 4765807 6. All Other Loans No. of Awards 29 0 0 0 (repayable cash Dollar Amount 30 0 0 0 only) B. Repayable By Cash or Service 1. Institutional No. of Awards 31 0 0 0 Loans Dollar Amount 32 0 0 0 2. Private Sources No. of Awards 33 0 0 0
Dollar Amount 34 0 0 0 3. All Other Loans No. of Awards 35 0 0 0 (repayable by Dollar Amount 36 0 0 0 cash or service)
C. Total Number of unduplicated recipients 37 145 151 5 7 24 32 31 43 1785 2164 116 110 0 0 2106 2507 4613
D. Total Dollar Amount 38 1022086 1077729 21834 32911 154008 207630 214873 285695 12975113 16208246 867234 802375 0 0 15255148 18614586 33869734

OCRB3 - FINANCIAL ASSISTANCE TO STUDENTS Use Summer 2005, Fall 2005, and Spring 2006 for this reportIN INSTITUTIONS OF HIGHER EDUCATIONSave file as: OCRB32006xx.xls where xx=1st two letters of university name. Save on SyTEC server at: ftp://ftp.sytecpa.org/Public/System Research/[univname]/IncomingFilestoSRO/OCRB3Due date: December 1, 2006
FICE CODE: RACE/ETHNIC IDENTIFICATION AND SEXUNIVERSITY:
GRANDTOTAL
LINE MALE FEMALE MALE FEMALE MALE FEMALE MALE FEMALE MALE FEMALE MALE FEMALE MALE FEMALE MALE FEMALENO. 1 2 3 4 5 6 7 8 9 10 11 12 13 14 15 16 17
TOTALBLACK (not of
Hispanic origin)AMERICAN INDIAN
OR ALASKAN NATIVE ASIAN OR
PACIFIC ISLANDER HISPANIC MULTI-RACIALUNKNOWNWHITE (not of
Hispanic origin)
III. SCHOLARSHIPS A. Total Number of Awards 39 69 70 2 5 11 11 13 15 602 742 42 43 0 0 739 886 1625 B. Total Number of Unduplicated Recipients 40 62 64 2 4 9 10 12 14 524 601 33 38 0 0 642 731 1373 C. Total Dollar Amount 41 177504 188104 981 13619 12851 18396 30076 18352 1432981 1433784 120224 98605 0 0 1774617 1770860 3545477
IV. STUDENT EMPLOYMENT A. Federal Program- No. of Awards 42 13 21 1 0 2 4 4 5 72 158 5 8 0 0 97 196 293 college/work study Dollar Amount 43 8005 20176 1105 0 1612 4361 2797 4914 59229 135604 3774 8874 0 0 76522 173929 250451 B. Institutional No. of Awards 44 34 43 2 0 3 12 7 6 249 369 11 25 0 0 306 455 761 Employment Dollar Amount 45 59629 64943 3053 0 1262 21513 6075 5173 346980 534065 25180 42099 0 0 442179 667793 1109972 C. All Other Work/ No. of Awards 46 0 0 0 study programs Dollar Amount 47 0 0 0 D. Total Number of Unduplicated Recipients 48 47 61 3 0 4 15 11 11 314 517 16 32 0 0 395 636 1031 E. Total Dollar Amount 49 67634 85119 4158 0 2874 25874 8872 10087 406209 669669 28954 50973 0 0 518701 841722 1360423
V. TOTALS All Categories of Financial Assistance A. Total Number of Aid Applicants (Optional) 50 0 0 0 B. Total Number of Aid Applicants who actually enrolled at this institution (Optional) 51 0 0 0
C. Total Number of Awards and Loans 52 540 650 21 29 72 124 116 171 4525 5781 282 309 0 0 5556 7064 12620 D. Total Dollar Amount 53 1869420 2162935 55938 86877 264798 466136 400840 558613 18092156 22704479 1272038 1222447 0 0 21955190 27201487 49156677 E. Total Unduplicated Number of Recipients 54 174 187 9 10 33 49 43 60 2217 2702 147 142 0 0 2623 3150 5773
VI. NON-RESIDENT ALIENS A. Total Number Unduplicated Grant Recipients 55 11 11 22 B. Total Number Unduplicated Loan Recipients 56 0 1 1 C. Total Number Undup- licated Scholarship Recipients 57 1 2 3 D. Total Number Undup- licated Employment Recipients 58 6 5 11

Grants Loans Scholarships Student EmploymentTotal
Year Amount Awards Amount Awards Amount Awards Amount Awards Amount
1987 $2,981,258.00 2036 $5,079,271.00 2248 $0.00 0 $946,530.00 1055 $9,007,059.001988 $3,120,561.00 2024 $4,800,869.00 2147 $0.00 0 $986,803.00 1033 $8,908,233.001989 $3,057,397.00 1700 $5,378,075.00 2189 $935,653.00 714 $1,039,440.00 1025 $10,410,565.001990 $3,157,442.00 1969 $5,916,703.00 2263 $1,125,183.00 777 $1,083,525.00 982 $11,282,853.001991 $2,940,132.00 1610 $6,636,468.00 2407 $1,341,191.00 881 $1,250,648.00 994 $12,168,439.001992 $3,866,896.00 1896 $8,284,493.00 2733 $1,477,271.00 945 $1,171,774.00 968 $14,800,434.001993 $4,143,501.00 1883 $8,496,640.00 2710 $1,454,647.00 886 $1,163,538.00 918 $15,258,326.001994 $4,683,779.00 1921 $10,684,062.00 2880 $1,000,992.00 681 $1,197,699.00 935 $17,566,532.001995 $5,334,265.00 2042 $12,345,422.00 3060 $1,026,443.00 669 $1,203,292.00 895 $19,909,422.001996 $5,388,164.00 2063 $14,287,141.00 3324 $1,234,408.00 743 $1,296,347.00 955 $22,206,060.001997 $5,635,067.00 2068 $14,459,936.00 3338 $1,517,901.00 751 $1,427,910.00 986 $23,040,814.001998 $6,761,672.00 2366 $14,685,191.00 3243 $1,709,402.00 872 $1,562,890.00 901 $24,719,155.001999 $6,483,304.00 2490 $17,092,672.00 3692 $1,629,505.00 1049 $1,804,001.00 1928 $27,009,482.002000 $7,300,170.00 2632 $17,238,814.00 3655 $1,875,991.00 1127 $2,442,657.00 1075 $28,857,632.002001 $8,113,369.00 2829 $19,002,002.00 3794 $2,370,702.00 1306 $2,240,294.00 1027 $31,726,367.002002 $8,496,302.00 2739 $21,201,287.00 3954 $2,860,916.00 1363 $2,084,325.00 1057 $34,642,830.002003 $9,536,025.00 2813 $24,159,669.00 4216 $3,200,463.00 1366 $1,837,799.00 1020 $38,733,956.002004 $10,290,871.00 2975 $28,921,205.00 4562 $3,278,549.00 1372 $1,365,102.00 1067 $43,855,727.002005 $10,312,920.00 2778 $31,617,459.00 4630 $3,515,359.00 1388 $1,460,143.00 1096 $46,905,881.002006 $10,381,043.00 2757 $33,869,734.00 4613 $3,545,477.00 1373 $1,360,423.00 1031 $49,156,677.00
SOURCE: OCRB3 Report, Financial Assistance to Students in Institutions of Higher Education.
FINANCIAL AID AWARD HISTORY72
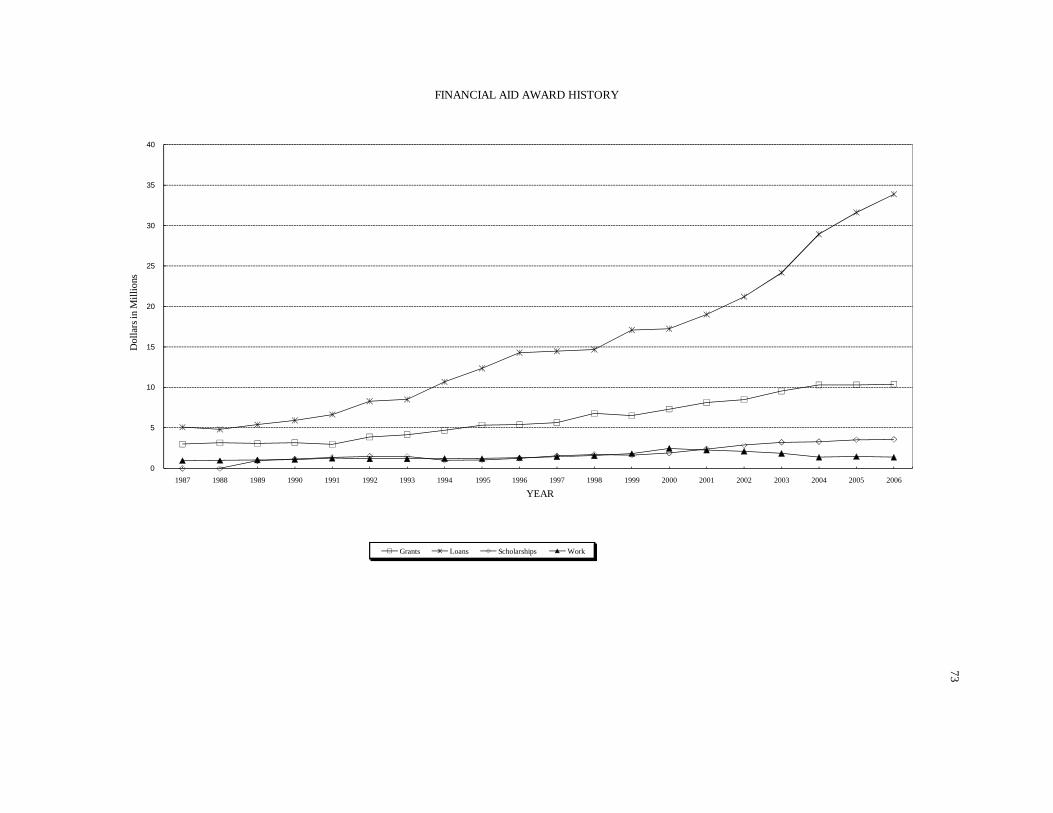
FINANCIAL AID AWARD HISTORY73
0
5
10
15
20
25
30
35
40
1987 1988 1989 1990 1991 1992 1993 1994 1995 1996 1997 1998 1999 2000 2001 2002 2003 2004 2005 2006
Dol
lars
in M
illio
ns
YEAR
Grants Loans Scholarships Work

74
Fiscal Year
2002-03 2003-04 2004-05 2005-06
Revenue
State Appropriation $32,208,044 $30,130,244 $31,636,878 $32,591,097
Tuition and Fees $38,931,212 $42,112,814 $43,584,838 $44,563,309
Miscellaneous $3,457,744 $3,123,792 $3,084,890 $4,286,613
Total Revenue $74,597,000 $75,366,850 $78,306,606 $81,441,019
Expenditures by Function
Instruction $36,679,214 $36,576,864 $36,779,711 $37,577,870
Academic Support $8,493,266 $9,025,283 $9,632,728 $10,672,018
General Institutional Support $11,017,268 $11,919,905 $12,492,608 $12,267,364
Operation and Maintenance of Plant $6,865,722 $7,603,281 $7,606,550 $7,513,225
Public Service/Research $1,615,316 $1,344,086 $1,239,978 $1,624,381
Student Services $7,314,208 $7,877,089 $8,298,034 $8,940,116
Total Expenditures $71,984,994 $74,346,508 $76,049,609 $78,594,974
Transfers
Mandatory $1,384,451 $948,289 $1,352,118 $2,190,310
Non-Mandatory $2,093,649 $1,474,771 $1,656,992 $3,132,651
Total Transfers $3,478,100 $2,423,060 $3,009,110 $5,322,961
SOURCE: Audited Financial Statements.
CURRENT UNRESTRICTED EDUCATION & GENERAL FUNDS

75
State Appropriation, 40.0%
Tuition and Fees, 54.7%
Miscellaneous, 5.3%
REVENUE, 2005-06
Instruction, 47.8%
Academic Support, 13.6%
General Institutional Support, 15.6%
Operation and Maintenance of
Plant, 9.6%
Public Service/Research
2.1%
Student Services, 11.4%
EXPENDITURES, 2005-06

76
Instruction51%
Academic Support
12%
General Institutional
Support15%
Operation and Maintenance of
Plant10%
Public Service/Research
2%Student Services
10%
EXPENDITURES, 2002-03
State Appropriation, 43.2%
Tuition and Fees, 52.2%
Miscellaneous, 4.6%
REVENUE, 2002-03

77 CURRENT RESTRICTED FUNDS
GRANT ACTIVITY
Fiscal Year
Government Contracts and Grants 2002-03 2003-04 2004-05 2005-06
Federal $5,011,858 $5,784,903 $5,776,149 $5,648,084
State $7,314,444 $6,116,245 $6,331,623 $6,538,882
Local - -
Total $12,326,302 $11,901,148 $12,107,772 $12,186,966
SOURCE: Audited Financial Statements.
1/16/2008 Current Restricted Funds Grant Activity

78
FUNDING FORMULA DATA
2002-03 2003-04 2004-05 2005-06 2006-07
FTE Students Lower Division 4578.07 4160.30 4218.51 4125.16 4016.05 Upper Division 1849.98 1681.17 1818.35 1934.13 2008.36 Graduate 543.28 549.36 479.35 531.19 539.51Total 6971.33 6390.83 6516.21 6590.48 6563.92
Square Feet 1123556 1123556 1139840 1142093 1187638
Source: Administration and Finance.

79PHYSICAL FACILITIES, FALL 2006
Construction Gross AssignableBuilding Function Date Square Feet Square Feet
Little Red School House Demonstration 1865 997 805Old Main Administration 1871 113,943 50,667Stewart Hall Classroom 1893 11,936 5,956Horton Hall Offices 1894 57,535 34,918Martin House Residence 1908 8,378 6,341
Gilbert Hall Classroom 1912 13,926 8,370Huber Art Center Classroom 1931 19,352 11,902Henderson Gym Athletics 1937 36,372 25,029Reed Operations Center Maintenance 1937 36,194 27,526Rowland Hall Classroom 1937 27,528 14,441
Shearer Hall Classroom 1937 23,209 10,779Memorial Auditorium Assembly 1951 34,670 18,937Steam Plant Utility 1952 13,754 10,188Reisinger House Maintenance 1954 1,866 1,272Kriner Hall Food Service 1957 32,611 23,857
Wright Hall Offices 1958 33,257 20,638McCune Hall Residence Hall 1959 33,697 21,947Huber Art Center Annex Classroom 1961 4,854 2,894Shippen Hall Classroom 1963 48,473 28,774Harley Hall Residence Hall 1964 59,097 36,956
Kieffer Hall Residence Hall 1964 52,498 32,676Lackhove Hall Residence Hall 1964 52,961 32,473Naugle Hall Residence Hall 1965 103,260 64,583Reisner Hall Food Service 1965 51,296 38,890Ezra Lehman Memorial Library Library 1967 76,762 61,451
McLean Hall Residence Hall 1967 99,878 67,935Ceddia Union Building Student Union 1970 83,743 49,442Dauphin Humanities Center Classroom 1970 47,671 27,688Mathematics and Computing Tech Ctr Classroom 1996 38,982 21,833Faculty Office Building Offices 1970 6,550 4,325

80
Construction AssignableBuilding Function Date Square Feet Square Feet
Franklin Science Center Classroom 1970 119,640 78,005Heiges Field House Athletics 1970 91,634 68,877Mowrey Hall Residence Hall 1970 91,108 57,491Seth Grove Grandstand Athletics 1972 19,257 9,321Bookstore Storage Storage 1974 1,938 1,804
Dermestid Facility Research 1974 138 100Grounds Storage Maintenance 1974 1,535 1,305Etter Health Center Medical 1976 8,998 5,003Seavers Apartments Residence Hall 1976 115,603 75,887Centrex Building Telephone 1977 1,159 1,001
Grace B. Luhrs Univ. Ele. School Laboratory School 2001 33,195 18,159John L. Grove Hall Classroom 1997 69,278 36,424Rife House Alumni Affairs UNK 7,359 4,532Fogelsonger Warehouse Storage UNK 8,000 7,880Water Tower Storage 1987 7,693 2,097
Street Hockey Pavilion Recreation 1997 11,223 11,081Picnic Pavilion Recreation 1997 666 0Pump House Utility 1962 400 294H. Ric Luhrs Performing Arts Center Assembly 2005 92,380 31,246
TOTAL 1,906,454 1,174,000
LEASED:
Conference Center Classroom 2005 25,917 12,506Davis House Offices UNK 3,925 2,088Spiritual Center Assembly 2001 9,198 7,272Stoneridge Commons Residence Hall 2000 50,655 50,655
TOTAL 89,695 72,521
SOURCE: Director for Planning and Engineering.

VI. Miscellaneous Data

81
HISTORY
Shippensburg University was established in 1871 under the Normal School Act of 1857 as the Cumberland Valley State Normal School. The School received official approval by the state on February 21, 1873, admitted its first class of 217 students on April 15, 1873, and received its first state appropriation of $30,000 in 1877. In 1917, the School was purchased by the Commonwealth for $38,100. On June 4, 1926, the School was authorized to grant the bachelor of science in education degree in elementary and junior high education. By authority of Section 1307 of the 1923 Administrative Code, the School received a charter on October 12, 1926, making it the first normal school in Pennsylvania to become a state teachers college. On June 3, 1927, the State Council of Education authorized the School to change its name to the State Teachers College at Shippensburg effective August 13, 1927. The Act approved April 25, 1929, P.L. 712, provided that it should be the State Teachers College for Adams, Cumberland, Franklin, Fulton, Bedford, Huntingdon, and Blair counties. On December 3, 1937, the business education curriculum was approved. On December 8, 1939, Shippensburg State Teachers College became the first teachers college in Pennsylvania and the fourth in the United States to be accredited by the Middle States Association of Colleges and (Secondary) Schools. The State Council of Education approved graduate work leading to the master of education degree on January 7, 1959. The Act approved January 8, 1960, P.L. 2130, authorized the name change to Shippensburg State College. On April 18, 1962, the arts and sciences curriculum was authorized by the State Council of Education. The bachelor of science in business administration degree program was initiated on September 1, 1967. In January 1975, the Board of State College and University Directors adopted a resolution assigning to Shippensburg the three major missions of liberal arts, business, and teacher education. On November 15, 1979 the Board of State College and University Directors approved the additional missions of human services and public administration. On November 12, 1982, the governor of the Commonwealth signed Senate Bill 506 establishing the State System of Higher Education. Shippensburg State College was designated Shippensburg University of Pennsylvania effective July 1, 1983.
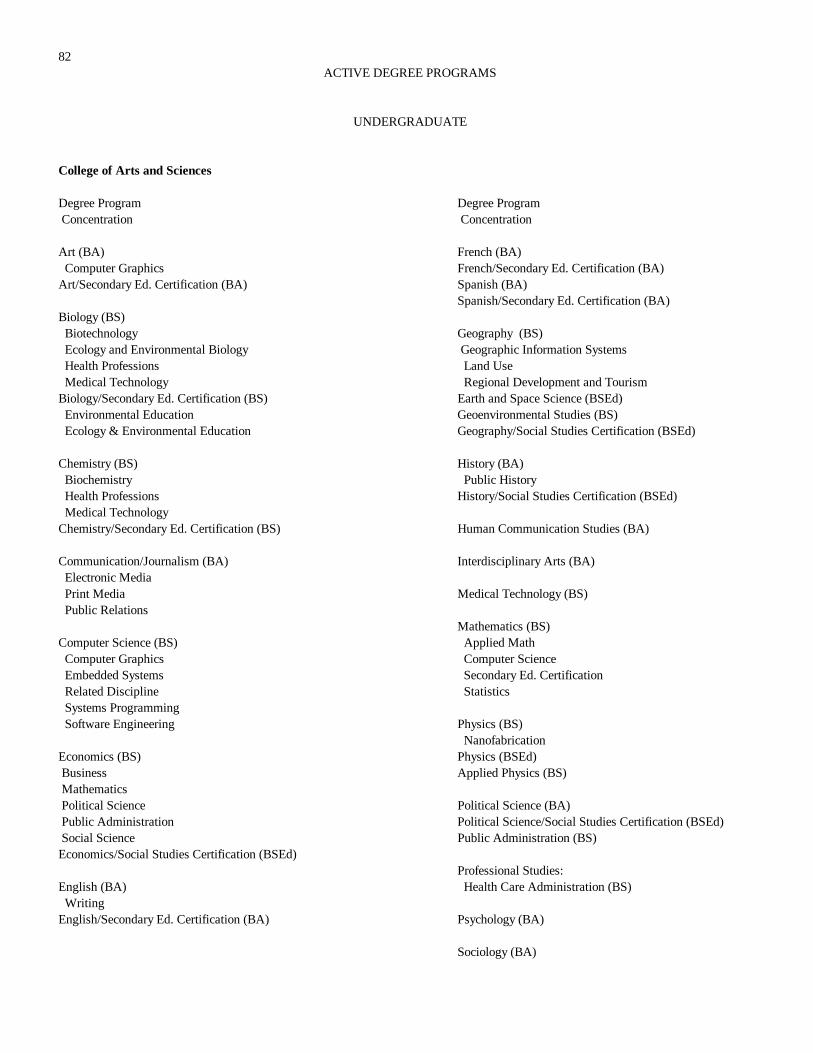
82ACTIVE DEGREE PROGRAMS
UNDERGRADUATE
College of Arts and Sciences
Degree Program Degree Program Concentration Concentration
Art (BA) French (BA) Computer Graphics French/Secondary Ed. Certification (BA)Art/Secondary Ed. Certification (BA) Spanish (BA)
Spanish/Secondary Ed. Certification (BA)Biology (BS) Biotechnology Geography (BS) Ecology and Environmental Biology Geographic Information Systems Health Professions Land Use Medical Technology Regional Development and TourismBiology/Secondary Ed. Certification (BS) Earth and Space Science (BSEd) Environmental Education Geoenvironmental Studies (BS) Ecology & Environmental Education Geography/Social Studies Certification (BSEd)
Chemistry (BS) History (BA) Biochemistry Public History Health Professions History/Social Studies Certification (BSEd) Medical TechnologyChemistry/Secondary Ed. Certification (BS) Human Communication Studies (BA)
Communication/Journalism (BA) Interdisciplinary Arts (BA) Electronic Media Print Media Medical Technology (BS) Public Relations
Mathematics (BS)Computer Science (BS) Applied Math Computer Graphics Computer Science Embedded Systems Secondary Ed. Certification Related Discipline Statistics Systems Programming Software Engineering Physics (BS)
NanofabricationEconomics (BS) Physics (BSEd) Business Applied Physics (BS) Mathematics Political Science Political Science (BA) Public Administration Political Science/Social Studies Certification (BSEd) Social Science Public Administration (BS)Economics/Social Studies Certification (BSEd)
Professional Studies: English (BA) Health Care Administration (BS) WritingEnglish/Secondary Ed. Certification (BA) Psychology (BA)
Sociology (BA)

83College of Business College of Education and Human Services
Degree Program Degree Program Concentration Concentration
Accounting (BSBA) Criminal Justice (BS)Information Technology for Business Education (BSBA)Information Technology for Business Education/Secondary Exercise Science (BS) Ed. Certification (BSBA)Management Information Systems (BSBA) Social Work (BSW)
Finance (BSBA) Elementary Education (BSEd) Personal Financial Planning Biology
ChemistryManagement (BSBA) Communication/Journalism General Management Environmental Education Human Resource Management Mathematics International Management Multicultural Entrepreneurship & Corporate SociologyMarketing (BSBA) Special Education
TESOLSupply Chain Management (BSBA) Logistics
Minors Offered
Anthropology English PhilosophyArt Ethnic Studies PhysicsBiochemistry French Political ScienceBiology Geography/Earth Science Public AdministrationBusiness Gerontology PsychologyChemistry German Studies ReadingCoaching Government SociologyCommunication/Journalism History SpanishComputer Science Human Communication Studies Technical ProfessionalCriminal Justice International Studies TheatreEarly Childhood Mathematics Women's StudiesEconomics Music
Certificate Programs
Geographic Information Systems International Studies Modern LanguagesWomen's Studies African & Middle East Studies FrenchBusiness Education Asian Studies GermanEthnic Studies European Studies SpanishGraphic Design Latin American Studies
Pre-Professional Options
Pre-Chiropractic Pre-PharmacyPre-Dentistry Pre-Physical TherapyPre-Law Pre-PodiatryPre-Medicine Pre-Veterinary SciencePre-Optometry

84 GRADUATE
College of Arts and Sciences College of Education and Human Services
Degree Program Degree Program Concentration Concentration
Biology (MS) Counseling (MS) College Counseling
Communication Studies (MS) Community Counseling College Student Personnel Work
Information Systems (MS) Mental HealthComputer Science (MS)
Counseling (MEd)Geoenvironmental Studies (MS) Elementary School Counseling
Secondary School CounselingPublic Administration (MPA)
Administration of Justice (MS)Applied History (MA) Juvenile Justice
Psychology (MS) Social Work (MSW)
Organizational Development & Leadership (MS) School Administration Principal K-12 (MEd) Business Communications Curriculum & Instruction (MEd) Education Early Childhood Education Environmental Management Elementary Education Higher Education Middle School Individual & Organizational Development Secondary Biology Public Organizations Secondary English
Secondary Geography/Earth ScienceCollege of Business Secondary History
Secondary MathematicsBusiness Administration (MBA)
Special Education (MEd)Certificate Programs Behavioral Disorders
Comprehensive Special EducationPost-Masters Certificates Learning DisabilitiesAdlerian Studies Mentally RetardedAdvanced Study in CounselingCouple & Family Counseling Reading Specialist (MEd)
Post-Bachelor's CertificatesAgingApplied HistoryGraduate Business

85 HISTORICAL UNDERGRADUATE ENROLLMENT
10
15
20
25
30
35
40
45
50
PER
CEN
TAG
E
BA, BS, Office ofBSW BSBA BSEd Undeclared A&S, Bus, Non- Certi-
Semester Programs Programs Programs Students Ed(General) Degree fication Total
Fall '97 2592 993 882 789 338 72 7 5673Fall '98 2578 1027 917 820 319 58 6 5725Fall '99 2562 1060 940 813 287 63 10 5735Fall '00 2729 1078 948 911 258 63 3 5990Fall '01 2943 1127 912 959 245 42 10 6238Fall '02 3079 1102 933 989 246 53 11 6413Fall '03 3197 1120 962 975 242 51 20 6567Fall '04 3153 1100 978 981 284 60 23 6579Fall '05 3169 1128 884 953 261 41 23 6459Fall '06 3061 1160 787 1018 337 38 22 6423
0
5
10
Fall '97 Fall '98 Fall '99 Fall '00 Fall '01 Fall '02 Fall '03 Fall '04 Fall '05 Fall '06
SEMESTER
BA,BS,BSW Programs BSBA Programs BSEd Programs Office of Undeclared Students
A&S, Bus, Ed (General) Non-Degree Certification

86 HISTORICAL GRADUATE ENROLLMENT
ElementarySupervi- & Secon-
MA & MS MPA MEd MSW sory Cert- dary Certifi- Non PostSemester Programs MBA Programs Programs Programs fication cation Degree Masters Total
Fall '97 418 --- 53 356 --- 25 16 133 0 1001Fall '98 420 --- 54 351 --- 21 22 147 1 1016Fall '99 362 --- 44 320 --- 33 16 162 4 941Fall '00 333 --- 43 344 --- 26 35 237 3 1021Fall '01 355 --- 33 366 --- 35 29 137 0 955Fall '02 359 26 30 386 --- 33 20 145 0 999Fall '03 383 54 30 391 --- 45 34 103 0 1040Fall '04 415 45 36 415 --- 42 33 87 1 1074Fall '05 398 51 27 408 --- 38 32 72 0 1026Fall '06 435 109 34 357 15 25 35 83 0 1093
0
5
10
15
20
25
30
35
40
45
Fall '97 Fall '98 Fall '99 Fall '00 Fall '01 Fall '02 Fall '03 Fall '04
PER
CEN
TAG
E
SEMESTER
MA & MS Programs MPA Programs MEd Programs Secondary Certification Non-Degree
0
5
10
15
20
25
30
35
40
45
Fall '97 Fall '98 Fall '99 Fall '00 Fall '01 Fall '02 Fall '03 Fall '04 Fall '05 Fall '06
PER
CEN
TAG
E
SEMESTER
MA & MS Programs MPA Programs MEd Programs Secondary Certification Non-Degree

87LIBRARY ACQUISITIONS AND HOLDINGS, 2006 FISCAL YEAR
TOTAL NUMBER TOTAL NUMBER ADDED DURING HELD AT END
FISCAL YEAR OF FISCAL YEAR
CATEGORY
BOOKS, SERIAL BACKFILES AND OTHER MATERIALS (INCLUDING GOVERNMENT DOCUMENTS): 4,439 454,122
Microforms 2,408 1,286,455Audiovisual Materials 353 72,284Current Serial Subscriptions 0 1,243
LIBRARY SERVICES, FISCAL YEAR 2005
SERVICES
DOCUMENT DELIVERY/INTERLIBRARY LOANS PROVIDED TO OTHER LIBRARIES: Returnable 2,066 Non-returnable 2,661 Total provided 4,727 INTERLIBRARY LOANS RECEIVED FROM OTHER LIBRARIES Returnable 2,116 Non-returnable 1,424 Total provided 3,540
Documents delivered from commercial services 0
General Circulation Transactions 41,603
Reserve Circulation Transactions 43,481
INFORMATION SERVICES TO GROUPS
Number or presentations 135
Total attendance at all presentations 3,794
SOURCE: Academic Libraries Survey.

88 COMPUTING TECHNOLOGIES CENTER
Network The campus network consists of a fiber optic backbone between buildings and 10/100/1000BaseT connectivity between classrooms and faculty offices. The fiber backbone now connects all academic and administrative buildings as well as the residence halls. There are central gigabit Ethernet switches in the Mathematics and Computing Technologies building (MCT) that switches the data traffic between buildings and to the Internet. Internet and Internet 2 connectivity is via a fiber OC3 link to the SSHE-NET ATM switch in Harrisburg. The SSHE-NET is an ATM network that connects the 14 SSHE schools to each other and provides a gateway to the Internet in Philadelphia. The SSHE-NET also provides the data connectivity for the SAP Administrative Computing and the SSHE Personnel system with staff offices at SyTEC (SSHE System Technology Consortium) in Harrisburg and computing resources at Millersville University. It is also the backbone for the Keystone library network that provides library automation capabilities for the SSHE institutions and the State Library. Wireless Access Wireless access to the campus network is available in the Lehman Library, Huber Art Center, FOB, Shippen Hall, Grove Hall, Franklin Science Center, Horton Hall, Gilbert Hall, Stewart Hall, Hieges Field House, Grace B. Luhrs University Elementary School, Reisner and Kriner dining halls, Etter Heath Center, Mathematics and Computing Technologies Center and in the common areas of the Residence Halls. Any computer having an 802.11b compliant card may use wireless access. The Ethernet address of the card must be registered with the CTC before the network will recognize it. The web page for a student to register a wireless card is located at http://burgee.ship.edu. Central Information and Computing Services Several high-speed servers running a Microsoft Active Directory system service the campus network. These servers provide shareable disk space, print services, and Microsoft Outlook calendaring and e-mail. They also serve on-line scheduling, grade reporting, and academic information. There are also servers that provide the physical plant work order system. The Enterprise Server from UNISYS is a model IX5601-B1 system that serves the academic administration systems such as registration, scheduling, student records, accounts receivable, financial aid and admissions. The student information systems are based on the UNISYS relational database using LINC development system tools. The Financial and HR/Payroll systems are based on the SAP FI-MM relational database module of the Shared Administrative System run by SyTEC in Harrisburg.

89 Several Sun servers provide DNS and other network services. They are also used as a platform to teach relational database and query techniques using the ORACLE® software system. Micro-Computer Services Microcomputer laboratories are located in various locations. The following table gives an indication of their location and purpose. Location Type Special Purpose MCT 054 PC, Mac General use MCT 158 PC, Mac General use Grove 106/108 PC Business Applications Grove 402 PC Business Education Grove 301 PC Finance, Decision Sciences Grove 302 PC Business Information Wright Hall 111 PC English Composition Roland Hall 200/202 PC/Mac Communication/Journalism Shearer Hall 005 PC, Sun Geography/Earth Science Huber Art Center 307 Mac Graphic Arts MCT 162 PC Math/Computer Science MCT 163 PC Math/Computer Science MCT 164 PC Math/Computer Science MCT 251 PC Whitaker Grant Lab FSC 216 PC, Silicon Graphics Biology, Chemistry, Physics FSC 122 PC Psychology Shippen Hall 240 PC, Mac Elementary Education Maintenance and support for PC’s and Mac’s is centrally administered from the Computing Technologies Center (CTC). Please call FIXX (3499) for service in this area. The CTC maintains a time and materials contract with a local service provider for physical maintenance. The CTC also has a group of graduate and work-study students who provide software support for microcomputers and who supervise the MCT054, Grove 106, and Shippen Hall labs. SOURCE: Computing Technologies Center.
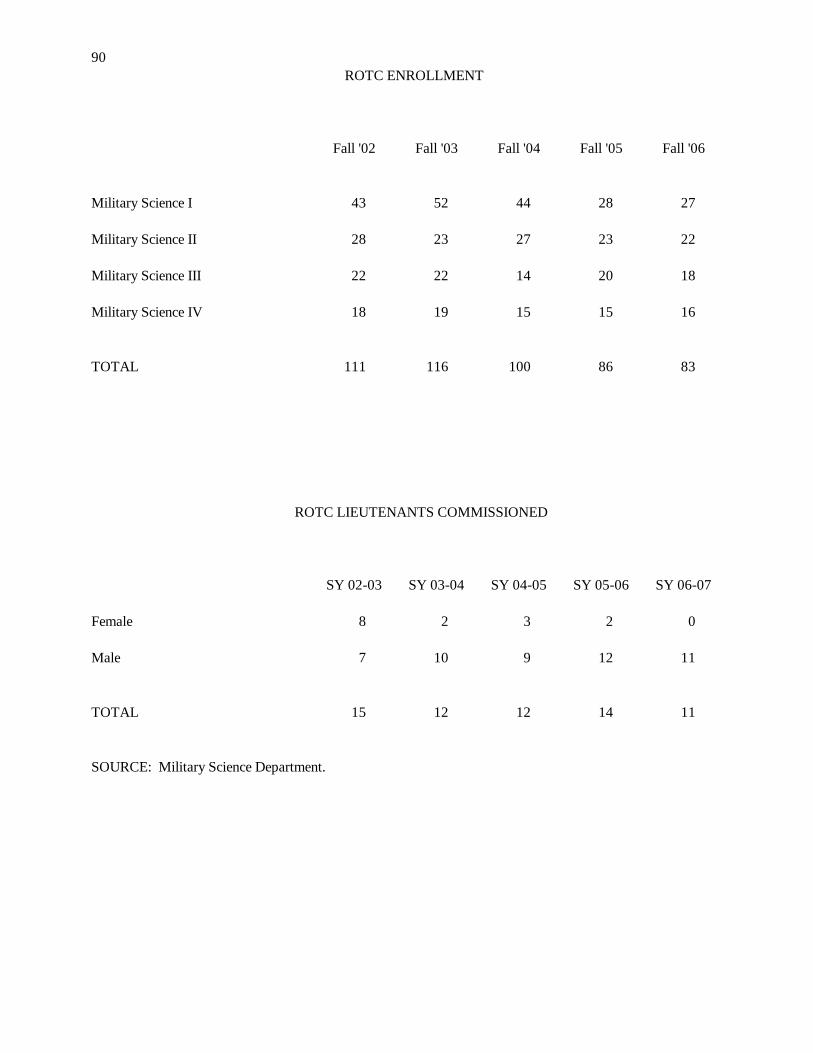
90 ROTC ENROLLMENT
Fall '02 Fall '03 Fall '04 Fall '05 Fall '06
Military Science I 43 52 44 28 27
Military Science II 28 23 27 23 22
Military Science III 22 22 14 20 18
Military Science IV 18 19 15 15 16
TOTAL 111 116 100 86 83
ROTC LIEUTENANTS COMMISSIONED
SY 02-03 SY 03-04 SY 04-05 SY 05-06 SY 06-07
Female 8 2 3 2 0
Male 7 10 9 12 11
TOTAL 15 12 12 14 11
SOURCE: Military Science Department.

VII. Charts and Maps

200
250
300
350
400
450
UNDERGRADUATE HEADCOUNTS- Arts & Sciences
Fall 2003 Fall 2004 Fall 2005 Fall 2006COMM / JOURN 383 352 343 288PSYCHOLOGY 338 325 337 337BIOLOGY 295 287 274 265COMP. SCI. 295 249 212 159HISTORY 288 324 314 320ENGLISH 267 256 270 244GEO & ESS 205 179 167 160MATH 156 146 132 123POLITICAL SCI. 139 146 152 139
0
50
100
150

60
80
100
120
140
160
UNDERGRADUATE HEADCOUNTS- Arts & Sciences
Fall 2003 Fall 2004 Fall 2005 Fall 2006COMM. ARTS 111 91 92 75ART 81 106 125 140SOCIOLOGY 72 106 112 117CHEMISTRY 72 70 68 92PHYSICS 70 71 62 67MODERN LANG. 42 54 62 53A & S GENERAL 8 12 4 0CERT. ONLY 10 12 15 9INTER. ARTS 1 3 2 6HLTH ADMIN 0 0 13 30
0
20
40

400
500
600
700
800
UNDERGRADUATE HEADCOUNTS-Education & Human Services
Fall 2003 Fall 2004 Fall 2005 Fall 2006ELEM. EDUC. 746 759 668 583CRIMINAL JUST. 435 434 412 381SOCIAL WORK 157 162 200 194EDUC. GENERAL 8 17 75 132CERT. ONLY 2 3 2 2
0
100
200
300
400

300
400
500
600
UNDERGRADUATE HEADCOUNTS-Business
Fall 2003 Fall 2004 Fall 2005 Fall 2006MANAGE & MRKT 513 531 560 559ACC. & INFO. TECH. 401 373 353 379BUS ADM GEN 217 249 181 204FINANCE 193 178 197 210ECONOMICS 19 25 22 12BUSINESS GEN 9 6 1 1CERT. ONLY 8 8 6 11
0
100
200

800
1000
1200
UNDERGRADUATE HEADCOUNTS-Undeclared & Non-Degree
Fall 2003 Fall 2004 Fall 2005 Fall 2006UNDECLARED 975 981 953 1018NON-DEGREE 51 60 41 38
0
200
400
600

60
80
100
120
UNDERGRADUATE DEGREES - Arts & Sciences
2002-2003 2003-2004 2004-2005 2005-2006 2006-2007COMM / JOURN 73 108 101 102 81PSYCHOLOGY 91 101 79 89 94GEO & ESS 58 64 53 60 53BIOLOGY 54 62 66 67 54ENGLISH 41 55 56 62 78COMP. SCI. 47 54 54 42 35COMM. ARTS 29 51 21 37 24HISTORY 50 47 63 64 54
0
20
40
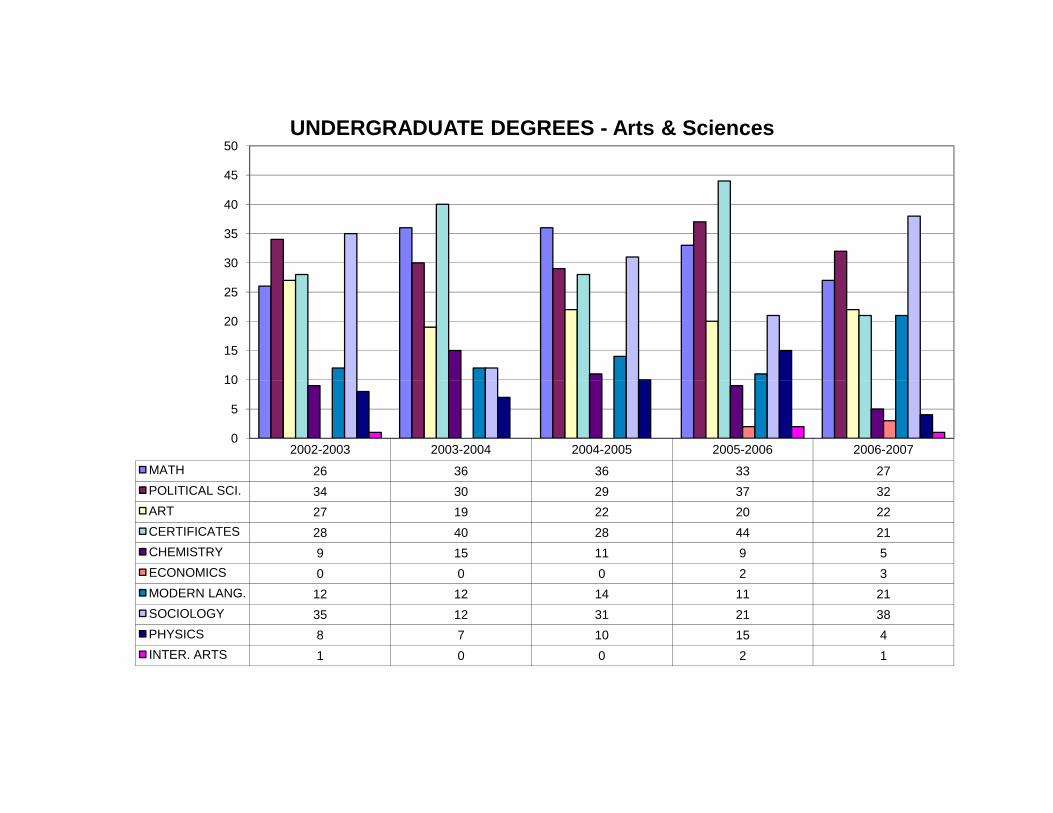
10
15
20
25
30
35
40
45
50UNDERGRADUATE DEGREES - Arts & Sciences
2002-2003 2003-2004 2004-2005 2005-2006 2006-2007MATH 26 36 36 33 27POLITICAL SCI. 34 30 29 37 32ART 27 19 22 20 22CERTIFICATES 28 40 28 44 21CHEMISTRY 9 15 11 9 5ECONOMICS 0 0 0 2 3MODERN LANG. 12 12 14 11 21SOCIOLOGY 35 12 31 21 38PHYSICS 8 7 10 15 4INTER. ARTS 1 0 0 2 1
0
5
10

150
200
250
UNDERGRADUATE DEGREES - Education & Human Services
2002-2003 2003-2004 2004-2005 2005-2006 2006-2007ELE. EDUC. 170 207 234 211 193CRIM. JUSTICE 82 95 98 107 115SOCIAL WORK 43 48 55 44 52
0
50
100

100
120
140
160
180
200
UNDERGRADUATE DEGREES - Business
2002-2003 2003-2004 2004-2005 2005-2006 2006-2007MANAGE & MRKT. 136 164 182 177 159ACC. & INFO. TECH. 99 89 96 84 89FINANCE 58 65 67 70 56ECONOMICS 6 5 9 7 7BUS. ED. 2 0 1 0 0
0
20
40
60
80

Fall 2006 Headcount by County
Fall 2006 Headcount by County
Fall 2006 Headcount by County
1,000
32
1
Copyright © and (P) 1988–2006 Microsoft Corporation and/or its suppliers. All rights reserved. http://www.microsoft.com/mappoint/ © Portions © 1990–2005 InstallShield Software Corporation. All rights reserved. Certain mapping and direction data © 2005 NAVTEQ. All rights reserved. The Data for areas of Canada includes information taken with permission from Canadian authorities, including: © Her Majesty the Queen in Right of Canada, © Queen's Printer for Ontario. NAVTEQ and NAVTEQ ON BOARD are trademarks of NAVTEQ. © 2005 Tele Atlas North America, Inc. All rights reserved. Tele Atlas and Tele Atlas North America are trademarks of Tele Atlas, Inc.
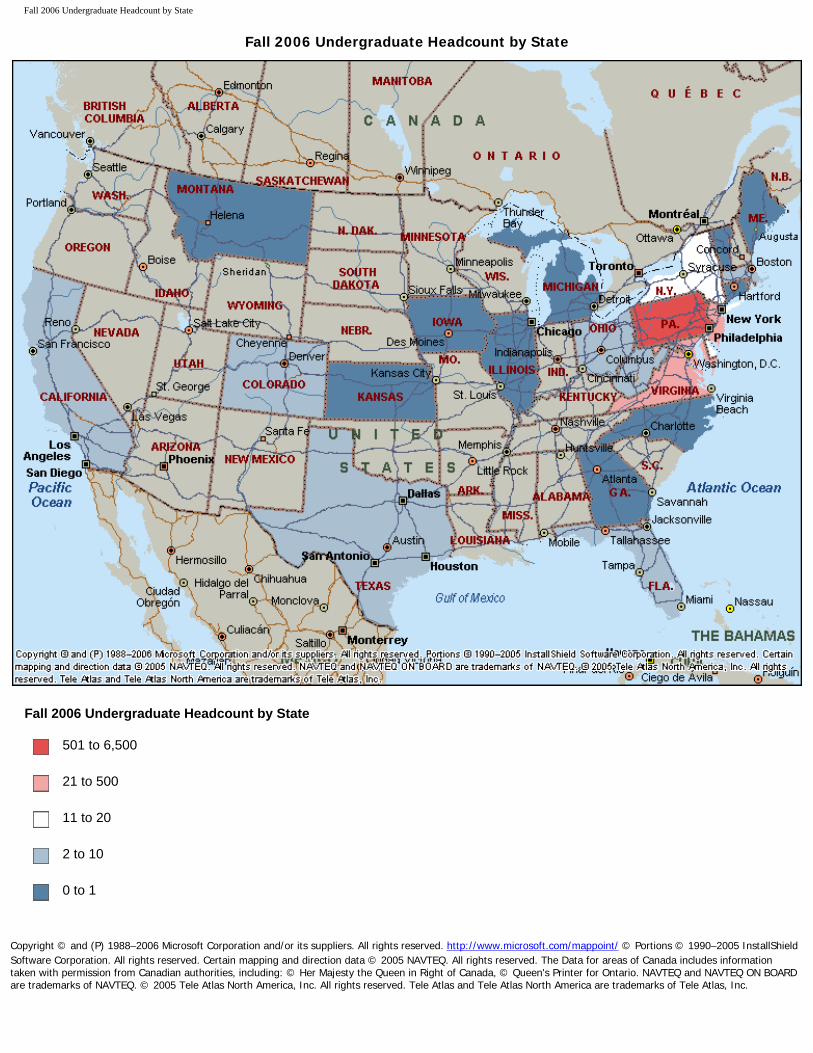
Fall 2006 Undergraduate Headcount by State
Fall 2006 Undergraduate Headcount by State
Fall 2006 Undergraduate Headcount by State
501 to 6,500
21 to 500
11 to 20
2 to 10
0 to 1
Copyright © and (P) 1988–2006 Microsoft Corporation and/or its suppliers. All rights reserved. http://www.microsoft.com/mappoint/ © Portions © 1990–2005 InstallShield Software Corporation. All rights reserved. Certain mapping and direction data © 2005 NAVTEQ. All rights reserved. The Data for areas of Canada includes information taken with permission from Canadian authorities, including: © Her Majesty the Queen in Right of Canada, © Queen's Printer for Ontario. NAVTEQ and NAVTEQ ON BOARD are trademarks of NAVTEQ. © 2005 Tele Atlas North America, Inc. All rights reserved. Tele Atlas and Tele Atlas North America are trademarks of Tele Atlas, Inc.

2006 Pennsylvania Alumni Headcount by County
2006 Pennsylvania Alumni Headcount by County
7,000
118
2
Copyright © and (P) 1988–2006 Microsoft Corporation and/or its suppliers. All rights reserved. http://www.microsoft.com/mappoint/ © Portions © 1990–2005 InstallShield Software Corporation. All rights reserved. Certain mapping and direction data © 2005 NAVTEQ. All rights reserved. The Data for areas of Canada includes information taken with permission from Canadian authorities, including: © Her Majesty the Queen in Right of Canada, © Queen's Printer for Ontario. NAVTEQ and NAVTEQ ON BOARD are trademarks of NAVTEQ. © 2005 Tele Atlas North America, Inc. All rights reserved. Tele Atlas and Tele Atlas North America are trademarks of Tele Atlas, Inc.

2006 Alumni by State of Residence
2006 Alumni by State of Residence
10,001 to 40,000
1,001 to 10,000
251 to 1,000
101 to 250
51 to 100
16 to 50
0 to 15

20 - 21, 2460
22
30 -34, 43
35 - 39, 20
Number of Undergraduate Full-Time Students by Age Range Fall 2006
Under 18, 1438
18 - 19, 2606
22 -24, 721
25 -29, 137
40 - 49, 23
Over 50, 2
Other, 225

Under 184% 18 - 19
6%
20 - 2113%35 - 39
40 - 4912%
Over 505%
Percentage of Undergraduate Part-Time Students by Age Range
Fall 2006
13%
22 - 2430%
25 - 2916%
30 - 348%
6%

100
150
200
250
300
GRADUATE HEADCOUNTS
Fall 2003 Fall 2004 Fall 2005 Fall 2006Edu. Special Areas 223 243 258 215Counseling 151 185 177 174Non-Degree 103 87 72 83Edu. Adm. 93 84 69 74Adm. of Justice 82 72 73 68Certifications 79 76 70 60MBA 54 45 51 109Geoenv. Studies 45 48 32 47Comm. Studies 40 37 24 39
0
50
100
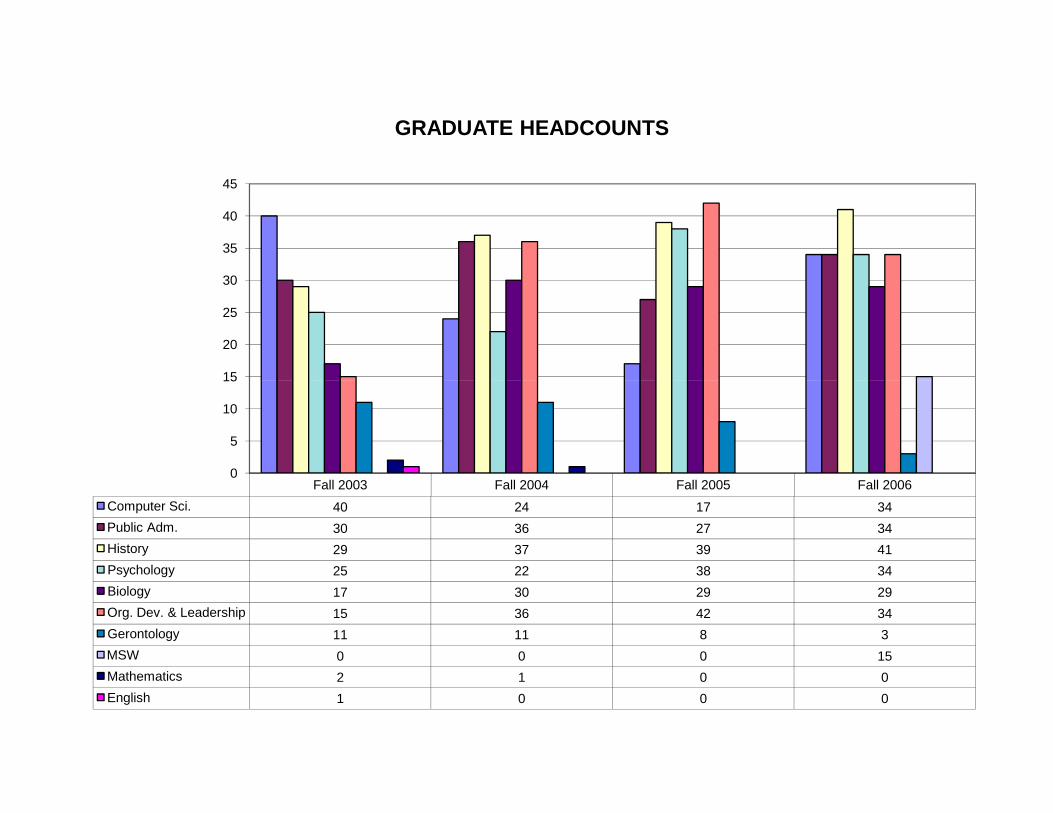
15
20
25
30
35
40
45
GRADUATE HEADCOUNTS
Fall 2003 Fall 2004 Fall 2005 Fall 2006Computer Sci. 40 24 17 34Public Adm. 30 36 27 34History 29 37 39 41Psychology 25 22 38 34Biology 17 30 29 29Org. Dev. & Leadership 15 36 42 34Gerontology 11 11 8 3MSW 0 0 0 15Mathematics 2 1 0 0English 1 0 0 0
0
5
10
15
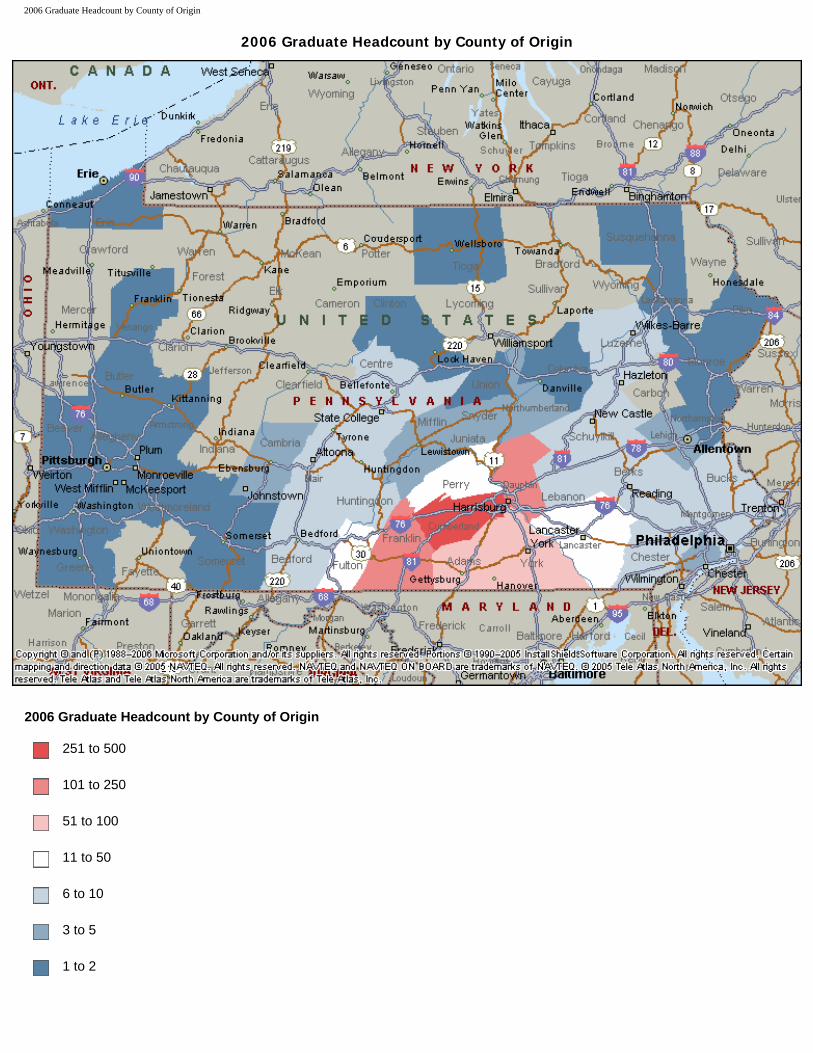
2006 Graduate Headcount by County of Origin
2006 Graduate Headcount by County of Origin
2006 Graduate Headcount by County of Origin
251 to 500
101 to 250
51 to 100
11 to 50
6 to 10
3 to 5
1 to 2

30
40
50
60
70
GRADUATE DEGREES
2002-03 2003-04 2004-05 2005-06 2006-07Counseling 38 42 46 42 58Elementary Edu. 53 42 25 25 39Edu. Adm. 24 38 15 14 28Computer Sci. 36 36 38 16 17Special Edu. 27 34 47 37 43Adm. Justice 31 23 44 31 34Psychology 8 14 6 9 11MBA 0 14 19 21 17Public Adm. 15 12 11 12 9
0
10
20

10
15
20
25
GRADUATE DEGREES
2002-03 2003-04 2004-05 2005-06 2006-07Geoenv. Studies 21 10 19 15 11Biology 9 5 7 11 8History 8 5 11 16 15Comm. Studies 6 4 17 6 16Curr. & Inst. 0 3 5 12 15Org. Dev. & Leadership 0 2 11 16 19English 9 1 0 0 0Gerontology 0 1 1 4 1Mathematics 2 0 4 0 1
0
5