profile of bc college transfer students admitted to simon ... · p rofile of bc college transfer...
TRANSCRIPT

Profile of BC College Transfer Students admitted to Simon Fraser University 2003/04 to 2007/08 Prepared by: Jacy Lee, Liny Chan, & Rachel Chuang Institutional Research and Planning Simon Fraser University

Profile of BC College Transfer Students Admitted to Simon Fraser University, 2003/04 to 2007/08
© Copyright 2009 by the British Columbia Council on Admissions and Transfer. BCCAT is the official mark of the BC Council on Admissions and Transfer, as published by the Registrar of Trade-marks of the Canadian Intellectual Property Office.
This Report is also available in Adobe Acrobat Portable Document Format (pdf), from BCCAT Online, the Internet service of the BC Council on Admissions and Transfer: www.bccat.ca. Photocopying and further distribution of this document is permitted. Please credit source.
Prepared by: Jacy Lee, Liny Chan, and Rachel Chuang Institutional Research and Planning Simon Fraser University
709 – 555 Seymour Street Vancouver BC Canada V6B 3H6 bccat.ca | [email protected]
t 604 412 7700 | f 604 683 0576

Page i
EXECUTIVE SUMMARY This report presents data and analysis about students admitted to Simon Fraser University (SFU) who have BC College experience in the period 2003/04 to 2007/08. The first and second sections of the report focus on the profile of students admitted to SFU on the basis of BC College transfer including number of credits transferred, institution transferred from, Faculty admitted to, degree and approved major program, age, gender and academic performance. The third section of the report provides a brief profile of BC College transfer students who have graduated. The final section deals with students who are not admitted on the basis of BC College transfer but who have some BC College experience prior to admission to SFU. BC College Transfer Students to SFU Between 2003/04 and 2007/08, a total of 10,930 BC College transfer students were admitted to SFU (compared to 7,768 students between 1998/99 and 2002/03). Approximately 94 per cent of these students came from the Lower Mainland: 86 per cent from public colleges, university colleges, and institutes, with another 8 per cent from private colleges in the Lower Mainland. Only 30 per cent of BC College transfer students were full-time compared to 77 per cent of BC Grade 12 direct entry students. Key findings include:
• BC College transfer students admitted to SFU from 2003/04 to 2007/08 on average transferred 49 credits to SFU (50 credits in the previous period 1998/99 to 2002/03).
• The Faculty of Arts and Social Sciences accepted 82 per cent of all BC College
transfer students followed by the Faculty of Sciences (8 per cent), Business (5 per cent) and Applied Sciences (4 per cent). The distribution by Faculty of admission has changed compared to the previous five-year period starting 1998/99 to 2002/03. For comparison, BC Grade 12 direct entry students were admitted to Faculties as follows: 40 per cent to Arts and Social Sciences, 25 per cent to Applied Sciences, 22 per cent to Sciences, 12 per cent to Business, and 1 per cent to Health Sciences.
• The top three most popular degrees of choice for BC College transfer students
were: Bachelor of Arts (78 per cent), Bachelor of Science (8 per cent), and Bachelor of Business Administration (5 per cent).
• The top five most popular majors of choice were in: Business Administration,
Psychology, Criminology, General Studies and Economics. • The average GPAs of BC College transfer students to SFU were:

Page ii
2.91 upon admission to SFU 2.53 after one semester 2.81 after completing 30 credit hours, and 2.94 upon graduation.
For comparison, the average GPAs at each of these points for BC Grade 12 direct entry students were: 3.59, 2.59, 2.81 and 3.10 respectively.
• While the average admission GPA of BC Grade 12 direct entry students was nearly 0.7 grade point higher, their average graduation GPA was higher than BC College transfer students by 0.16 grade point.
• For the 277 courses examined in the report, the average course grade for BC
College transfer students was lower than for BC Grade 12 direct entry students (2.60 vs 2.80). The percentage of students who received grades below a “C” was higher among transfer students (17 per cent) than among BC Grade 12 direct entry students (13 per cent for immediate direct entry and 16 per cent for non-immediate direct entry).
BC College Transfer Students Who Graduated Of the 4,452 BC College transfer students admitted in 2003/04 and 2004/05, about 63 per cent graduated between October 2003 and June 2008 with at least one degree.1 Compared to all BC College transfer students admitted to SFU during 2003/04 to 2007/08, these students who graduated have a slightly higher average GPA at each of the following four points:
GraduatedAll Transfer Students
Admission GPA 3.00 2.91First Semester GPA 2.79 2.53CGPA After 30 credits 2.90 2.81CGPA At Graduation 2.95 2.94
2003/04-2007/08
Other findings include:
• The top three programs from which BC College transfer students graduated were: Business Administration, Psychology and Economics.
• The credentials awarded to the 3,269 students who graduated included 3,638 degrees and 190 Certificates. In addition, 156 students completed the Professional
1 The sum of the number of BC College transfer students admitted in 2003/04 and 2004/05 (4,452) can be derived from Table 1a on page 5 of this report.

Page iii
Development Program and were recommended to the BC College of Teachers for teaching certification.
• On average, BC College transfer students who graduated took 7.9 semesters to
complete a first degree. This is equivalent to 2.6 years. Students with BC College Experience From 2003/04 to 2007/08, there were 1,167 students admitted to SFU with some transfer credit from a BC College but they were not admitted as BC College transfer students. They were admitted to SFU under other bases of admission including University Transfer (30 per cent), BC Grade 12 (23 per cent), Mature Student (14 per cent), and Special Entry (13 per cent). Again, a large majority (74 per cent) of these students come from the Lower Mainland public colleges. Other findings include:
• The average admission GPA of these students was 2.99, that is, 0.08 grade point higher than the average admission GPA of BC College transfer students.
• Of the 1,167 students, 53 per cent transferred less than one year of credits and 46
percent transferred between one and two years of credit to SFU. In total they transferred 41,415 credits (on average 35 credits per student), in contrast to the 10,930 BC College transfer students who transferred 528,015 credits (on average 48 credits per student).
• Upon admission, these students tend to be older on average than BC College
transfer students (24.7 years vs 22.7 years).
• Approximately 57 per cent of these students were female compared to 60 per cent female among the BC College transfer students.

Page iv

Page v
TABLE OF CONTENTS EXECUTIVE SUMMARY ............................................................................................... i LIST OF FIGURES ........................................................................................................ vii LIST OF TABLES ......................................................................................................... viii INTRODUCTION............................................................................................................. 1 ANALYSIS I. BC College Transfer Students to SFU ........................................................................ 3 Credits Transferred to SFU ........................................................................................... 6 First Semester Credit Hours Taken ............................................................................... 7 Faculty of Admission .................................................................................................... 9 Credential of Choice by Faculty ................................................................................. 11 Approved Major Program ........................................................................................... 12 Age .............................................................................................................................. 14 Gender ......................................................................................................................... 16 II. Academic Performance of BC College Transfer Students to SFU ....................... 19 Average Admission GPA ............................................................................................ 19 Academic Performance ............................................................................................... 20 Grades in Selected Courses ......................................................................................... 23 200- and 300-Level Course Grades ............................................................................ 24 Degree Completion Rate……………………………………………. ……………..26 Graduation Cumulative Grade Point Average ............................................................ 28 III. BC College Transfer Students Who Have Graduated From SFU ....................... 31 Academic Performance ............................................................................................... 31 Graduation Degree Program ....................................................................................... 32 Credential Awarded .................................................................................................... 33 Average Number of Semesters to Complete Credential ............................................. 34

Page vi
IV. Students At SFU with BC College Experience....................................................... 37 Number of Students Admitted .................................................................................... 37 Basis of Admission ..................................................................................................... 39 Average Admission GPA ............................................................................................ 40 Credits Transferred to SFU ......................................................................................... 40 Age .............................................................................................................................. 42 Gender ......................................................................................................................... 44 APPENDICES APPENDIX A: ADDITIONAL TABLES ..................................................................... 47
Table A1: BC College Transfers by Approved Major Program ................................. 48
Table A2: Grades in Selected Courses (BC Transfers vs. BC 12).............................. 51
Table A3: Grades in 200- and 300- Level Courses Completed (BC Transfers vs BC12) .......................................................................................................................... 69
Table A4: Degree Completion Rate ............................................................................ 76
Table A5: BC College Transfers by Graduation Degree Program ............................. 78 APPENDIX B: SUPPORTING TABLES AND FIGURES ........................................ 81
Table B1: New Students Admitted by Basis of Admission ........................................ 82
Table B2: Credit Hour and Credential Completion Status (BC12) ............................ 83
Table B3: Credit Hour and Credential Completion Status (Post-Secondary)............. 84
Figure B1: New Students Admitted by Basis of Admission....................................... 85
Figure B2: Annual Admission Intake at SFU—Trends .............................................. 86
APPENDIX C: DEFINITIONS ..................................................................................... 87
Table C1: SFU Admission Quotas by Admission Category and Year ....................... 91 Table C2: New Undergraduate Students Admitted to SFU by Basis of Admission
and Year ...................................................................................................................... 91 Table C3: Percent of Admission Quotas Met ............................................................. 91
APPENDIX D: DATA DICTIONARY ......................................................................... 93

Page vii
LIST OF FIGURES Figure 1 : Transfer Students from Capilano, Douglas, Kwantlen and Langara ................ 3
Figure 2 : Transfer Students by Region (98/99 – 02/03 vs 03/04 – 07/08) ....................... 4
Figure 3 : Transfer Students by College (98/99 – 02/03 vs 03/04 – 07/08) ...................... 4
Figure 4 : Faculty of Admission (98/99 – 02/03 vs 03/04 – 07/08) .................................. 9
Figure 5 : Faculty of Choice and Admission GPA (98/99 – 02/03 vs 03/04 – 07/08) .... 11
Figure 6 : Approved Major Program Popularity Ranking by Region ............................. 13
Figure 7 : Gender (98/99 – 02/03 vs 03/04 – 07/08) ....................................................... 16
Figure 8 : Grades at Admission, After First Semester, After 30 Credits, At Graduation 21
Figure 9 : Grades at Graduation (98/99 – 02/03 vs 03/04 – 07/08) ................................. 28
Figure 10 : Grades on Last 60 Credits (98/99 – 02/03 vs 03/04 – 07/08) ......................... 29
Figure 11 : Top Three Graduation Degree Programs by Region ...................................... 33

Page viii
LIST OF TABLES I. PROFILE OF BC COLLEGE TRANSFER STUDENTS TO SFU Table 1a : Year of Admission and College ........................................................................ 5
Table 1b : BC College Transfers Admitted by Region ...................................................... 5
Table 2a : Transfer Credits at Time of Admission ............................................................ 6
Table 2b : Transfer Credits by Region ............................................................................... 7
Table 3a : First Semester Credit Hours Taken by College ................................................ 8
Table 3b : First Semester Credit Hours Taken by Region ................................................. 8
Table 4 : Faculty of Admission ...................................................................................... 10
Table 5 : Initial Credential Goal by Faculty .................................................................. 12
Table 6 : Top 10 Approved Major Programs ................................................................. 13
Table 7a : Age by College ............................................................................................... 15
Table 7b : Age by Region…………………………………………………………...……………….16 Table 8 : Gender by College and Region ....................................................................... 17
II. ACADEMIC PERFORMANCE OF BC COLLLEGE TRANSFER STUDENTS TO SFU Table 9 : Admission GPA .............................................................................................. 20
Table 10 : Grades at Admission, After First Semester, After 30 Credits, At Graduation 22
Table 11 : Grades in Selected 100 Level Courses (BC Transfers > BC12) ..................... 24
Table 12a : Grades in 200- and 300-Level Courses ........................................................... 25
Table 12b: Grades in Selected 200- and 300-Level Courses (BC Transfers > BC12) ..... 25
Table 13a: Degree Completion Rates ............................................................................... 26
Table 13b: College with Average Degree Completion Rate > 63 per cent ...................... 27
Table 14 : CGPA upon Graduation from SFU and on the Last 60 Credit Hours ............ 29

Page ix
III. BC COLLEGE TRANSFER STUDENTS WHO GRADUATED FROM SFU Table 15 : Average GPAs (98/99 – 99/00 vs 03/04 – 07/08) ........................................... 31
Table 16 : Grades at Admission, After First Semester, At 30 Credits, At Graduation .... 32
Table 17 : Credential Awarded by College ...................................................................... 34
Table 18 : Average Number of Semesters to Complete Credential ................................. 35
IV. STUDENTS AT SFU WITH BC COLLEGE EXPERIENCE Table 19a : Number Admitted by Year and College ......................................................... 38
Table 19b: BC College Transfers Admitted by Region .................................................... 38
Table 20 : Basis of Admission by Year ........................................................................... 39
Table 21 : Average Admission GPA................................................................................ 40
Table 22a : Transfer Credits at Time of Admission .......................................................... 41
Table 22b: Transfer Credits by Region ............................................................................. 41
Table 23a : Age by College ............................................................................................... 43
Table 23b: Age by Region ................................................................................................ 43
Table 24 : Gender by College and Region ....................................................................... 44

Page x

Page 1
INTRODUCTION This report was commissioned by the British Columbia Council on Admissions and Transfer (BCCAT) to provide a profile of BC College transfer students admitted to Simon Fraser University (SFU) in the period 2003/04 to 2007/08. This report constitutes an update to a previous report covering the period 1998/99 to 2002/03. Where appropriate, comparisons will be made with the previous five-year period. There are four distinct sections to this report. The first section, a profile of BC College transfer students to SFU, includes data for college transfer students by year of admission and college, credits transferred to SFU, first semester credits taken, Faculty admitted to, degree of choice, Approved Major Program, age and gender. The second section of the report examines the academic performance of BC College transfer students to SFU. The report includes a discussion of admission grade point average (GPA), first semester GPA at SFU, Cumulative GPAs at 30 credits and at graduation, course grades in selected courses, and degree completion rate of admitted BC College transfer students. The third section of the report presents a profile of BC College transfer students who graduated with a degree from SFU between October 2003 and June 2008. This section examines academic performance, degree of choice, credential awarded and average number of semesters to complete a degree. The fourth and final section of the report presents a profile of students who had attended a BC College and were admitted to SFU but not on the basis of a BC College transfer student. These students were admitted on other bases including university transfer, BC Grade 12, Mature Student, Special Entry, etc. This section examines students, with BC College experience, admitted to SFU by college and region, bases of admission, admission GPA, number of credits transferred, age and gender. Where applicable, the data presented in this report is consistently broken down by college and region. During the preparation this report, a number of public institutions were established as special purpose teaching universities in pursuance of legislation passed in May 2008. These public institutions were: Capilano University (formerly Capilano College), Kwantlen Polytechnic University (formerly Kwantlen University College), University of the Fraser Valley (formerly University College of the Fraser Valley), and Emily Carr University of Art and Design (formerly Emily Carr Institute of Art and Design). Given that this report covers the time period prior to the change, the status and name of these institutions before the change will be used in this report.2 2 It is noted that in 2005, Okanagan University College became Okanagan College. Students reported under Okanagan College include students from Okanagan University College prior to 2005. In the same year, the University College of the Caribou became Thompson Rivers University. Students from the University College of the Caribou prior to 2005 are reported under Thompson Rivers University.

Page 2
Appendix A contains tables that relate directly to the report but are very large and span over one page. Appendix B contains supporting tables and graphs that serve as additional background information, and Appendix C contains definitions and file structure descriptions. Appendix D contains the data dictionary.

Page 3
I. BC COLLEGE TRANSFER STUDENTS TO SFU Over the five-year period ending in the 2008 Spring semester, a total of 10,930 students were admitted to SFU from BC Colleges. This represents 34 per cent of all new student admissions to SFU during this period. It also represents an increase of 41 per cent compared to a total of 7,768 transfer students admitted to SFU over the previous five year period from 1998/99 to 2002/03 (hereafter referred to as “the previous five-year period”). In the five-year period from 2003/04 to 2007/08, SFU increased its total intake of new students by 40 per cent, compared to 17 per cent from the previous five-year period. Over the current five-year period, the intake of new college transfer students increased by 19 per cent but the share of college transfer student intake to total intake decreased from 33 per cent in 2003/04 to 28 per cent in 2007/08. It is noted that the share of BC Grade 12 students increased slightly from 46 per cent to 48 per cent and the share of other admission categories increased from 21 per cent to 29 per cent. The majority of transfer students (94 per cent) came to SFU from the Lower Mainland: 86 per cent from eight public colleges and 8 per cent from private colleges. The majority of BC College transfer students to SFU from the Lower Mainland public colleges came from Douglas (25 per cent), Kwantlen (23 per cent), Langara (20 per cent) and Capilano (16 per cent).3 Figure 1 indicates that there are year by year variations in the number of transfer students to SFU from these Lower Mainland colleges. Transfer student numbers peaked in 2004/05 and have been declining since then. Figure 1: Transfer Students from Capilano, Douglas, Kwantlen and Langara from 1998/99 to 2007/08.
3 The BC Government announced in April 2008 that Kwantlen and Capilano are granted university status. This change could affect transfer rates to SFU from these institutions in future years.

Page 4
The pie charts in Figure 2 indicate that there has been a small increase in the share of BC College transfer students from the Lower Mainland over the 2003/04 to 2007/08 period compared to the previous five-year period. The share of college transfer students from non-Lower Mainland regions remained small. Figure 2: BC College Transfer Students by Region (98/99 – 02/03 vs. 03/04 – 07/08)
1998/99‐2002/03
Lower Mainland‐Private5%
Northern BC/Yukon 3%
Interior/Kootenays 4%
Vancouver Island 4%
LowerMainland‐Public 84%
2003/04‐2007/08
LowerMainland‐Public 86%Lower Mainland‐Private 8%
Northern BC/Yukon 2%Interior/Kootenays 2%Vancouver Island 3%
Figure 3 indicates that the Lower Mainland’s increase in the number of BC College transfer students compared to the previous five-year period was primarily due to increased transfers from four Lower Mainland institutions. The number of students transferring from Douglas, Kwantlen, Langara and Capilano increased by 42 per cent, 35 per cent, 87 per cent and 45 per cent respectively. Figure 3: BC College Transfer Students to SFU by Lower Mainland Institutions (98/99 – 02/03 vs. 03/04 – 07/08)
0 500 1,000 1,500 2,000 2,500 3,000
Douglas
Kwantlen
Capilano
Langara
UCFV
Columbia
Other
BCIT
1998/99 ‐ 2002/03
0 500 1,000 1,500 2,000 2,500 3,000
Douglas
Kwantlen
Langara
Capilano
Other
Columbia
UCFV
BCIT
2003/04 ‐ 2007/08
Notes: a) Other includes: Institute of Indigenous Government, Emily Carr Institute of Art and Design, Coquitlam College, Corpus Christi College, and Fraser International College. Please see Tables 1a and 1b below for more detailed information about the distribution of BC College transfer students to SFU by admission year.

Page 5
Table 1a: BC College Transfer Students Admitted to SFU by Year of Admission, College and Region Non-Lower Mainland 2003/04 2004/05 2005/06 2006/07 2007/08 5Yr Total % of TotalNorthern BC/Yukon 48 46 38 20 29 181 1.7%
College of New Caledonia 21 26 21 5 16 89 0.8%Northern Lights College 19 8 13 10 6 56 0.5%Northwest Community College 7 12 <5 5 7 33 0.3%Yukon College <5 - <5 - - <5 0.0%
Interior/Kootenays 46 59 41 24 23 193 1.8%College of the Rockies 7 8 <5 <5 <5 21 0.2%Nicola Valley Institute of Technology - 9 - - <5 10 0.1%Okanagan College 17 14 18 8 11 68 0.6%Selkirk College 5 7 8 7 5 32 0.3%Thompson Rivers University Open Learning <5 <5 <5 <5 - 6 0.1%Thompson Rivers University 16 19 10 6 5 56 0.5%
Vancouver Island 56 70 62 69 61 318 2.9%Camosun College 23 30 37 29 37 156 1.4%Malaspina University College 26 37 23 34 23 143 1.3%North Island College 7 <5 <5 6 <5 19 0.2%
Total Non-Lower Mainland 150 175 141 113 113 692 6.3%
Lower MainlandPublic 1,534 2,315 1,986 1,804 1,779 9,418 86.2%
BC Institute of Technology - - <5 - <5 <5 0.0%Capilano College 324 439 368 337 268 1,736 15.9%Douglas College 462 616 549 539 568 2,734 25.0%Emily Carr Institute of Art and Design - <5 - - <5 <5 0.0%Institute of Indigenous Government <5 <5 <5 5 6 18 0.2%Kwantlen University College 388 666 502 455 461 2,472 22.6%Langara College 317 536 503 411 404 2,171 19.9%University College of the Fraser Valley 42 55 59 57 70 283 2.6%
Private 105 173 151 159 232 820 7.5%Columbia College 46 74 68 88 120 396 3.6%Coquitlam College 59 98 76 64 68 365 3.3%Corpus Christi College - <5 7 7 <5 16 0.1%Fraser International College - - - - 43 43 0.4
Total Lower Mainland 1,639 2,488 2,137 1,963 2,011 10,238 93.7%Grand Total 1,789 2,663 2,278 2,076 2,124 10,930 100.0%Total BC Grade 12 Direct Entry 2,174 2,240 2,435 2,560 3,239 12,648 -
%
Notes: a) A direct entry BC Grade 12 student is a student who was admitted to SFU within one year of graduation from high school. b) Thompson Rivers University was known as University College of the Cariboo (UCC) until 2005. Data for 2003/04 to 2005/06 is for UCC. Table 1b: Percent Distribution of Transfers Admitted by Region
2003/04 2004/05 2005/06 2006/07 2007/08 5Yr AvgNon-Lower Mainland 8.4% 6.6% 6.2% 5.4% 5.3% 6.3%
Northern BC/Yukon 2.7% 1.7% 1.7% 1.0% 1.4% 1.7%Interior/Kootenays 2.6% 2.2% 1.8% 1.2% 1.1% 1.8%Vancouver Island 3.1% 2.6% 2.7% 3.3% 2.9% 2.9%
Lower Mainland 91.6% 93.4% 93.8% 94.6% 94.7% 93.7%Public 85.7% 86.9% 87.2% 86.9% 83.8% 86.2%Private 5.9% 6.5% 6.6% 7.7% 10.9% 7.5%
Grand Total 100.0% 100.0% 100.0% 100.0% 100.0% 100.0%

Page 6
Credits Transferred to SFU On average, college transfer students to SFU transferred 49 credits over the five year period from 2003/04 to 2007/08 compared to 50 credits over the previous five year period.4 Approximately 33 per cent of college transfer students transferred 60 or more credits to SFU.5 Overall, the proportion of students transferring with 60 or more credits was highest for Northern BC/Yukon colleges (37 per cent) followed by Lower Mainland public colleges (35 per cent) and Vancouver Island (34 per cent). Table 2a: Distribution of Student Transfer Credits at Time of Admission to SFU (For BC College Transfer Students Admitted from 2003/04 to 2007/08) Non-Lower mainland < 30 30-34 35-39 40-44 45-49 50-54 55-59 60+ TotalNorthern BC/Yukon 16 34 10 13 18 11 13 66 181
College of New Caledonia 5 10 5 7 9 5 8 40 89Northern Lights College 8 18 5 5 5 <5 5 6 56Northwest Community College <5 6 - <5 <5 <5 - 17 33Yukon College - - - - - - - <5 <5
Interior/Kootenays 27 30 23 7 28 18 14 46 193College of the Rockies <5 <5 <5 <5 <5 - - 10 21Nicola Valley Institute of Technology <5 <5 <5 - <5 <5 <5 - 10Okanagan College 8 17 5 <5 11 7 5 13 68Selkirk College <5 <5 7 <5 <5 <5 <5 8 32Thompson Rivers University Open Learning <5 - - <5 - <5 <5 - 6Thompson Rivers University 8 5 7 <5 11 5 <5 15 56
Vancouver Island 45 46 27 16 28 30 17 109 318Camosun College 12 21 7 <5 11 12 6 84 156Malaspina University College 32 22 13 10 16 15 11 24 143North Island College <5 <5 7 <5 <5 <5 - <5 19
Total Non-Lower Mainland 88 110 60 36 74 59 44 221 692
Lower MainlandPublic 565 793 759 628 1,168 1,190 995 3,320 9,418
BC Institute of Technology - - - - - <5 - <5 <5Capilano College 87 180 154 110 247 230 168 560 1,736Douglas College 147 181 189 158 343 357 304 1,055 2,734Emily Carr Institute of Art and Design <5 - - <5 - - - - <5Institute of Indigenous Government - <5 <5 <5 <5 <5 <5 <5 18Kwantlen University College 166 200 202 161 254 276 263 950 2,472Langara College 139 196 187 168 293 291 224 673 2,171University College of the Fraser Valley 25 34 24 28 28 32 34 78 283
Private 103 192 108 99 106 83 76 53 820Columbia College 51 90 48 46 52 41 39 29 396Coquitlam College 49 65 53 52 47 40 36 23 365Corpus Christi College <5 <5 - <5 7 <5 - <5 16Fraser International College - 35 7 - - - <5 - 43
Total Lower Mainland 668 985 867 727 1,274 1,273 1,071 3,373 10,238Grand Total 756 1,095 927 763 1,348 1,332 1,115 3,594 10,930
4 Starting Fall 2007, students admitted on the basis of BC College Transfer must complete 24 credits of transferable course work with a minimum grade point average set by each Faculty. Prior to Fall 2007, transfer students had to complete 30 credits of transferable course work. 5 Approximately 97 per cent of the BC College transfer students in the 60+ column in Table 2a transferred 60 credits to SFU.

Page 7
In terms of institutions, 54 per cent of transfer students from Camosun, and 52 per cent from Northwest, transferred 60 and more credits to SFU. For the Lower Mainland public colleges, Douglas led with 39 per cent, followed by Kwantlen (38 per cent) and Capilano (32 per cent). See Tables 2a and 2b for further detailed information. Table 2b: Percent Distribution of Student Transfer Credits to SFU by Region
< 30 30-34 35-39 40-44 45-49 50-54 55-59 60+ Grand TotalNon-Lower Mainland 12.7% 15.9% 8.7% 5.2% 10.7% 8.5% 6.4% 31.9% 100.0%
Northern BC/Yukon 8.8% 18.8% 5.5% 7.2% 9.9% 6.1% 7.2% 36.5% 100.0%Interior/Kootenay 14.0% 15.5% 11.9% 3.6% 14.5% 9.3% 7.3% 23.8% 100.0%Vancouver Island 14.2% 14.5% 8.5% 5.0% 8.8% 9.4% 5.3% 34.3% 100.0%
Lower-Mainland 6.5% 9.6% 8.5% 7.1% 12.4% 12.4% 10.5% 32.9% 100.0%Public 6.0% 8.4% 8.1% 6.7% 12.4% 12.6% 10.6% 35.3% 100.0%Private 12.6% 23.4% 13.2% 12.1% 12.9% 10.1% 9.3% 6.5% 100.0%
Grand Total 6.9% 10.0% 8.5% 7.0% 12.3% 12.2% 10.2% 32.9% 100.0%
First Semester Credit Hours Taken In their first semester at SFU, 30 per cent of BC College transfer students were full-time,6 compared to 77 per cent of BC Grade 12 direct entry students during the five year period from 2003/04 to 2007/08. This pattern is somewhat consistent with the previous five-year period where 34 per cent of college transfer students were full-time compared to 74 per cent of BC Grade 12 direct entry students. Full-time university participation in the first semester was higher among non-Lower Mainland students on average (54 per cent) than among students from the Lower Mainland (28 per cent). Northern Lights College had the lowest full-time participation rate at 14 per cent among 56 transfer students during this period. College transfer students from outside the Lower Mainland also took heavier course loads averaging 10.8 credit hours compared to students in the Lower Mainland at 9.0 credit hours. Students from the Interior/Kootenays took the heaviest course load averaging 11.4 credit hours. See Tables 3a and 3b for more detailed information.
6 A full-time student is one who registers for 12 or more credits in a semester.

Page 8
Table 3a: Distribution of First Semester Credit Hours Taken at SFU by College and Region (For BC College Transfer Students Admitted from 2003/04 to 2007/08) Non-Lower Mainland ≤ 3 4-6 7-9 10-12 > 12 Part-time Full-time %PT %FT TotalNorthern BC/Yukon 7 12 56 36 70 89 92 49.2% 50.8% 181
College of New Caledonia <5 6 12 27 40 32 57 36.0% 64.0% 89Northern Lights College <5 <5 41 <5 8 48 8 85.7% 14.3% 56Northwest Community College <5 <5 <5 5 20 8 25 24.2% 75.8% 33Yukon College - <5 - - <5 <5 <5 33.3% 66.7% <5
Interior/Kootenays 9 15 26 74 69 80 113 41.5% 58.5% 193College of the Rockies <5 <5 <5 9 6 9 12 42.9% 57.1% 21Nicola Valley Institute of Technology - - - <5 9 <5 9 10.0% 90.0% 10Okanagan College <5 <5 12 27 23 27 41 39.7% 60.3% 68Selkirk College <5 <5 <5 16 9 12 20 37.5% 62.5% 32Thompson Rivers University Open Learning <5 <5 <5 <5 - 6 - 100.0% 0.0% 6Thompson Rivers University <5 <5 7 20 22 25 31 44.6% 55.4% 56
Vancouver Island 20 23 79 104 92 153 165 48.1% 51.9% 318Camosun College 15 12 36 43 50 73 83 46.8% 53.2% 156Malaspina University College 5 10 40 50 38 74 69 51.7% 48.3% 143North Island College - <5 <5 11 <5 6 13 31.6% 68.4% 19
Total Non-Lower Mainland 36 50 161 214 231 322 370 46.5% 53.5% 692
Lower MainlandPublic 1,266 1,345 2,656 2,697 1,454 6,701 2,717 71.2% 28.8% 9,418
BC Institute of Technology - <5 - - <5 <5 <5 50.0% 50.0% <5Capilano College 208 199 494 546 289 1,152 584 66.4% 33.6% 1,736Douglas College 422 431 832 743 306 2,113 621 77.3% 22.7% 2,734Emily Carr Institute of Art and Design - - <5 - <5 <5 <5 50.0% 50.0% <5Institute of Indigenous Government <5 <5 6 6 <5 13 5 72.2% 27.8% 18Kwantlen University College 310 382 644 709 427 1,725 747 69.8% 30.2% 2,472Langara College 292 312 628 592 347 1,555 616 71.6% 28.4% 2,171University College of the Fraser Valley 33 18 51 101 80 141 142 49.8% 50.2% 283
Private 67 138 316 223 76 662 158 80.7% 19.3% 820Columbia College 31 65 157 106 37 324 72 81.8% 18.2% 396Coquitlam College 33 69 135 99 29 301 64 82.5% 17.5% 365Corpus Christi College <5 <5 5 6 <5 10 6 62.5% 37.5% 16Fraser International College <5 <5 19 12 8 27 16 62.8% 37.2% 43
Total Lower Mainland 1,333 1,483 2,972 2,920 1,530 7,363 2,875 71.9% 28.1% 10,238Grand Total 1,369 1,533 3,133 3,134 1,761 7,685 3,245 70.3% 29.7% 10,930Total BC Grade 12 Direct Entry 89 219 1,495 5,346 5,499 2,935 9,713 23.2% 76.8% 12,648
Note: A Full-time student is defined as a student who takes 12 or more credit hours in a semester. Table 3b: Percent Distribution First Semester Credit Hours Taken at SFU by Region (For BC College Transfer Students Admitted from 2003/04 to 2007/08)
≤ 3 4-7 7-9 10-12 > 12 Grand TotalNon-Lower Mainland 5.2% 7.2% 23.3% 30.9% 33.4% 100.0%
Northern BC/Yukon 3.9% 6.6% 30.9% 19.9% 38.7% 100.0%Interior/Kootenays 4.7% 7.8% 13.5% 38.3% 35.8% 100.0%Vancouver Island 6.3% 7.2% 24.8% 32.7% 28.9% 100.0%
Lower Mainland 13.0% 14.5% 29.0% 28.5% 14.9% 100.0%Public 13.4% 14.3% 28.2% 28.6% 15.4% 100.0%Private 8.2% 16.8% 38.5% 27.2% 9.3% 100.0%
Grand Total 12.5% 14.0% 28.7% 28.7% 16.1% 100.0%

Page 9
Faculty of Admission During the period between 2003/04 and 2007/08, 82 per cent of BC College transfer students to SFU were admitted to the Faculty of Arts and Social Sciences. The Faculty of Sciences was the next highest at 8 per cent followed by Business (5 per cent), and Applied Sciences (4 per cent). By comparison, 40 per cent of BC Grade 12 direct entry students were admitted to Arts and Social Sciences, 25 per cent to Applied Sciences, 22 per cent to Sciences, 12 per cent to Business and 1 per cent to Health Sciences. The distribution by faculty has changed compared to the previous five-year period (see Figure 4). Figure 4: BC College Transfer Students by Faculty of Admission (98/99 – 02/03 vs. 03/04 – 07/08)
1998/99 ‐ 2002/03
BUS‐10.2%
EDUC‐2.1%INTERDIS. STUD.‐0.2%
SCI‐9.3%
APSC‐7.5%
ARTS‐70.6%
2003/04 ‐ 2007/08
ARTS‐82.3%
BUS‐4.8%EDUC‐0.5%HSCI‐0.4%
SCI‐8.1%
UNSPC‐0.027%
APSC‐4.0%
Table 4 contains further detailed information on faculty of admission of BC College transfer students by college and region.

Page 10
Table 4: Distribution of BC College Transfer Students Admitted to SFU by Faculty (For BC College Transfers Admitted from 2003/04 to 2007/08) Non-Lower Mainland APSC ARTS BUS EDUC HSCI SCI UnspecifiedNorthern BC/Yukon 1.0% 82.1% 0.5% 8.7% 0.0% 7.1% 0.5%College of New Caledonia 1.1% 80.9% 1.1% 5.3% 0.0% 11.7% 0.0%Northern Lights College 1.7% 89.7% 0.0% 5.2% 0.0% 1.7% 1.7%Northwest Community College 0.0% 73.2% 0.0% 22.0% 0.0% 4.9% 0.0%Yukon College 0.0% 100.0% 0.0% 0.0% 0.0% 0.0% 0.0%
Interior/Kootenays 6.0% 80.9% 0.5% 3.0% 0.5% 9.0% 0.0%College of the Rockies 0.0% 85.7% 0.0% 0.0% 0.0% 14.3% 0.0%Nicola Valley Institute of Technology 0.0% 100.0% 0.0% 0.0% 0.0% 0.0% 0.0%Okanagan College 2.8% 85.9% 1.4% 4.2% 0.0% 5.6% 0.0%Selkirk College 15.6% 81.3% 0.0% 0.0% 0.0% 3.1% 0.0%Thompson Rivers University Open Learning 14.3% 71.4% 0.0% 0.0% 0.0% 14.3% 0.0%Thompson Rivers University 6.9% 70.7% 0.0% 5.2% 1.7% 15.5% 0.0%
Vancouver Island 5.9% 83.6% 0.6% 0.9% 0.6% 8.4% 0.0%Camosun College 7.0% 83.5% 0.0% 0.6% 0.6% 8.2% 0.0%Malaspina University College 3.4% 84.8% 1.4% 1.4% 0.7% 8.3% 0.0%North Island College 15.0% 75.0% 0.0% 0.0% 0.0% 10.0% 0.0%
Total Non-Lower Mainland 4.6% 82.5% 0.6% 3.6% 0.4% 8.2% 0.1%
Lower MainlandPublic 3.6% 83.2% 4.4% 0.3% 0.3% 8.2% 0.0%BC Institute of Technology 0.0% 50.0% 0.0% 0.0% 0.0% 50.0% 0.0%Capilano College 3.6% 84.5% 4.6% 0.1% 0.6% 6.5% 0.1%Douglas College 3.1% 82.8% 4.1% 0.2% 0.3% 9.6% 0.0%Emily Carr Institute of Art and Design 0.0% 100.0% 0.0% 0.0% 0.0% 0.0% 0.0%Institute of Indigenous Government 0.0% 100.0% 0.0% 0.0% 0.0% 0.0% 0.0%Kwantlen University College 2.9% 82.4% 5.8% 0.2% 0.3% 8.5% 0.0%Langara College 4.1% 84.7% 3.4% 0.1% 0.4% 7.4% 0.0%University College of the Fraser Valley 11.1% 72.7% 1.0% 5.4% 0.0% 9.8% 0.0%
Private 7.9% 71.9% 13.7% 0.0% 0.4% 6.2% 0.0%Columbia College 11.6% 67.3% 14.3% 0.0% 0.3% 6.5% 0.0%Coquitlam College 4.6% 78.5% 9.8% 0.0% 0.5% 6.5% 0.0%Corpus Christi College 0.0% 100.0% 0.0% 0.0% 0.0% 0.0% 0.0%Fraser International College 4.7% 46.5% 46.5% 0.0% 0.0% 2.3% 0.0%
Total Lower Mainland 3.9% 82.3% 5.1% 0.3% 0.3% 8.1% 0.0%Grand Total 4.0% 82.3% 4.8% 0.5% 0.4% 8.1% 0.0%Total BC Grade 12 Direct Entry 24.7% 39.7% 12.1% 0.0% 1.2% 22.3% 0.1% Notes: a) Students are classified according to the Faculty of their initial degree goal upon admission to SFU. b) A student in more than one Faculty is counted once under each Faculty.

Page 11
Credential of Choice by Faculty Over the period 2003/04 to 2007/08, 10,930 BC College transfer students sought 11,035 degrees or credentials, averaging 1.01 credentials per transfer student.7 The top three most popular degrees were Bachelor of Arts (78 per cent), Bachelor of Science (8 per cent) and Bachelor of Business Administration (5 per cent). Students pursuing Business Administration had the highest average admission GPA of 3.46 and those pursuing Health Sciences had the lowest average admission GPA of 2.62. Figure 5 provides a comparison of average admission GPA by faculty during the periods 1998/99 – 2002/03 and 2003/04 – 2007/08. The distribution of BC College transfer students by faculty for the two periods is similar. Figure 5 also indicates that the majority of the students are admitted to the Faculty of Arts and Social Sciences in both periods. The apparent decrease in student numbers in all faculties except Arts and Social Sciences between the two periods can be explained largely by the change in the SFU student information system in 2003/04. Prior to 2003/04, students could be reported in their approved faculty/credential if they had an approved faculty/credential, and those who did not have an approved faculty/credential could be reported under their intended faculty/credential. With the current student information system starting 2003/04, students can only be reported in their approved faculty/credential, and not in their intended faculty/credential. When students are not approved for admission to their intended faculty/credential, they generally are approved for admission to the Faculty of Arts and Social Sciences which explains the increase between the two periods. Figure 5: Faculty of Choice and Admission GPA (98/99 – 02/03 vs. 03/04 – 07/08)
3.20
2.89
3.46
2.96
2.62
2.84
2.60
2.70
2.80
2.90
3.00
3.10
3.20
3.30
3.40
3.50
3.60
0
2,000
4,000
6,000
8,000
10,000
APSC ARTS BUS EDUC HSCI SCI
2003/04 ‐ 2007/08
Faculty of Choice Avg Admission GPA
3.11 3.07
3.28
3.053.08
2.602.702.802.903.003.103.203.303.403.503.60
0
2,000
4,000
6,000
8,000
10,000
APSC ARTS BUS EDUC SCI
1998/99 ‐ 2002/03
Faculty of Choice Avg Admission GPA
Notes: a) Students are classified according to their initial faculty of choice upon admission to SFU. b) A student is counted once for each credential goal. c) Additions/changes to credential goal(s) subsequent to the first semester at SFU are excluded. d) Average admission GPA is based on college work.
7 Students may declare more than one initial credential of choice at the outset.

Page 12
Table 5 shows further detailed information on credentials sought by number and per cent and the average admission GPA of BC College transfer students who seek the respective credentials. Table 5: Distribution of BC College Transfer Students by Initial Credential Goal (For BC College Transfer Students Admitted to SFU from 2003/04 to 2007/08) Credential # Credentials Sought Percent Distribution Avg Admission GPAApplied Sciences 440 4.0% 3.20
Bachelor of Arts (Communications) 226 2.0% 3.27Bachelor of Science (Computing Science) 102 0.9% 3.26Bachelor of Applied Science 59 0.5% 3.00Bachelor of General Studies (Applied Sci) 13 0.1% 2.94Bachelor of Arts (Interactive Arts & Technology) 11 0.1% 2.77TechOne 11 0.1% 3.01Bachelor of Science (Interactive Arts & Technology) 7 0.1% 2.93Apsc Certificates 6 0.1% 2.81Bachelor of Science (Kinesiology) 5 0.0% 3.55
Arts and Social Sciences 9,078 82.3% 2.89Bachelor of Arts 8,593 77.9% 2.89Bachelor of General Studies 366 3.3% 2.78Bachelor of Fine Arts 65 0.6% 2.91Certificate in Liberal Arts 25 0.2% 2.77Fass Certificates 25 0.2% 2.98Fass Unspecified <5 0.0% 2.88Explorations <5 0.0% 2.71
Business Administration 530 4.8% 3.46BUS 530 4.8% 3.46
Education 55 0.5% 2.96PDP 51 0.5% 2.99Bachelor of Education <5 0.0% 2.79Educ Certificates <5 0.0% 2.44Educ Unspecified <5 0.0% 2.65
Health Sciences 39 0.4% 2.62Bachelor of Arts (Health Sciences) 21 0.2% 2.58Bachelor of Science (Health Sciences) 18 0.2% 2.67
Science 890 8.1% 2.84Bachelor of Science 888 8.0% 2.84Science One <5 0.0% 2.80
Unspecified <5 0.0% 2.97Grand Total 11,035 100.0% 2.92 Notes: a) Students are classified according to their initial credential goal upon admission to SFU. b) A student initially pursuing more than one credential is reported once under each credential. c) Additions/changes to credential goal(s) subsequent to the first semester at SFU are excluded. d) Average admission GPA is based on college work.
Approved Major Program SFU students will declare one or more major programs of study as they move through their education. The top five most popular declared majors for college transfer students were Business Administration (12 per cent), Psychology (11 per cent), Criminology (10 per cent), General Studies (7 per cent) and Economics (7 per cent). Figure 6 indicates Business, Psychology and Criminology were consistently among the top five programs of choice in each of the regions. See Table 6 for the top ten approved major programs and Table A1 for further detailed information on approved major programs by college and by region.

Page 13
Figure 6: Approved Major Program Popularity Ranking by Region
Ranking
1
2
3
4
5
Lower Mainland
Business
Psychology
Criminology
Economics
General Studies
Northern BC/Yukon
Education
General Studies
Criminology
Business
Psychology
Interior/ Kootenays
General Studies
Psychology
Business
Communication
Criminology
Vancouver Island
Criminology
Business
Communication
Psychology (tie)
Education (tie)
Table 6: Top 10 Approved Programs of Study (For BC College Transfer Students Admitted to SFU from 2003/04 to 2007/08) Non-Lower Mainland BUS PSYC CRIM BGS ECON CMNS ENGL HIST GEOG POSC OTHERNorthern BC/Yukon 6.7% 3.3% 19.0% 23.8% 1.4% 0.0% 1.4% 2.9% 0.5% 0.0% 41.0%College of New Caledonia 15.9% 6.8% 40.9% 6.8% 1.1% 0.0% 2.3% 4.5% 0.0% 0.0% 21.6%Northern Lights College 0.0% 0.0% 0.0% 42.0% 0.0% 0.0% 1.1% 0.0% 0.0% 0.0% 56.8%Northwest Community College 0.0% 0.0% 9.4% 21.9% 6.3% 0.0% 0.0% 6.3% 3.1% 0.0% 53.1%Yukon College 0.0% 50.0% 50.0% 0.0% 0.0% 0.0% 0.0% 0.0% 0.0% 0.0% 0.0%
Interior/Kootenays 11.2% 12.5% 7.2% 14.5% 2.6% 8.6% 6.6% 2.6% 1.3% 0.7% 32.2%College of the Rockies 12.5% 0.0% 25.0% 12.5% 6.3% 0.0% 6.3% 0.0% 0.0% 0.0% 37.5%Nicola Valley Institute of Technology 0.0% 0.0% 0.0% 100.0% 0.0% 0.0% 0.0% 0.0% 0.0% 0.0% 0.0%Okanagan College 11.1% 20.4% 7.4% 5.6% 1.9% 9.3% 11.1% 0.0% 1.9% 0.0% 31.5%Selkirk College 3.8% 11.5% 3.8% 11.5% 3.8% 15.4% 11.5% 11.5% 0.0% 0.0% 26.9%Thompson Rivers University Open Learning 0.0% 25.0% 0.0% 0.0% 0.0% 50.0% 0.0% 0.0% 0.0% 0.0% 25.0%Thompson Rivers University 18.6% 9.3% 4.7% 11.6% 2.3% 4.7% 0.0% 2.3% 2.3% 2.3% 41.9%
Vancouver Island 19.2% 3.8% 31.2% 3.4% 2.1% 5.1% 3.0% 1.7% 1.3% 1.7% 27.4%Camosun College 6.8% 4.2% 47.5% 2.5% 0.8% 5.9% 2.5% 1.7% 0.8% 1.7% 25.4%Malaspina University College 37.0% 3.0% 17.0% 3.0% 4.0% 2.0% 2.0% 1.0% 2.0% 1.0% 28.0%North Island College 0.0% 6.3% 0.0% 12.5% 0.0% 18.8% 12.5% 6.3% 0.0% 6.3% 37.5%
Total Non-Lower Mainland 12.8% 5.9% 20.8% 13.4% 2.0% 4.2% 3.4% 2.3% 1.0% 0.8% 33.4%
Lower MainlandPublic 10.6% 11.2% 9.5% 7.1% 6.4% 5.6% 6.4% 5.9% 5.6% 5.0% 26.7%Capilano College 11.2% 12.5% 4.7% 6.2% 5.3% 6.8% 9.0% 4.3% 5.5% 6.1% 28.4%Douglas College 10.2% 10.8% 13.0% 8.1% 4.3% 3.8% 5.9% 7.4% 5.2% 3.8% 27.6%Emily Carr Institute of Art and Design 0.0% 100.0% 0.0% 0.0% 0.0% 0.0% 0.0% 0.0% 0.0% 0.0% 0.0%Institute of Indigenous Government 0.0% 0.0% 28.6% 57.1% 0.0% 0.0% 0.0% 0.0% 0.0% 0.0% 14.3%Kwantlen University College 12.7% 12.6% 15.3% 6.5% 7.1% 3.7% 5.3% 5.6% 5.2% 3.5% 22.4%Langara College 8.6% 10.1% 3.1% 7.1% 10.1% 7.3% 6.2% 5.9% 6.6% 7.0% 28.0%University College of the Fraser Valley 6.7% 3.8% 1.9% 5.2% 1.0% 19.5% 6.7% 4.8% 5.2% 7.6% 37.6%
Private 33.0% 5.1% 0.4% 4.5% 22.8% 10.5% 0.4% 0.4% 0.4% 0.6% 22.1%Columbia College 31.6% 6.8% 0.0% 4.9% 17.3% 15.4% 0.4% 0.0% 0.0% 0.4% 23.3%Coquitlam College 30.2% 3.4% 0.9% 4.7% 32.3% 6.4% 0.4% 0.0% 0.9% 0.4% 20.4%Corpus Christi College 14.3% 14.3% 0.0% 0.0% 0.0% 0.0% 0.0% 28.6% 0.0% 14.3% 28.6%Fraser International College 76.9% 0.0% 0.0% 0.0% 0.0% 0.0% 0.0% 0.0% 0.0% 0.0% 23.1%
Total Lower Mainland 12.1% 10.8% 8.9% 6.9% 7.6% 5.9% 6.0% 5.5% 5.2% 4.7% 26.4%Grand Total 12.2% 10.5% 9.7% 7.4% 7.2% 5.8% 5.8% 5.3% 4.9% 4.4% 26.9%

Page 14
Notes: a) For students who have graduated, all completed honors and majors in their first degree are reported. b) For students who have not yet graduated, all approved, current honors or majors in progress are reported. c) Students without an approved honors or majors program are excluded. d) An education student is defined as a student who has completed or is pursuing a Bachelor of Education (B.Ed.) or Professional Development Program (PDP) diploma as a degree/program goal. e) A General Studies student is defined as a student who has completed or is pursuing a Bachelor of General Studies (BGS) in either Applied Sciences or Arts & Social Sciences. f) A student with more than one completed/approved program is counted once under each program.
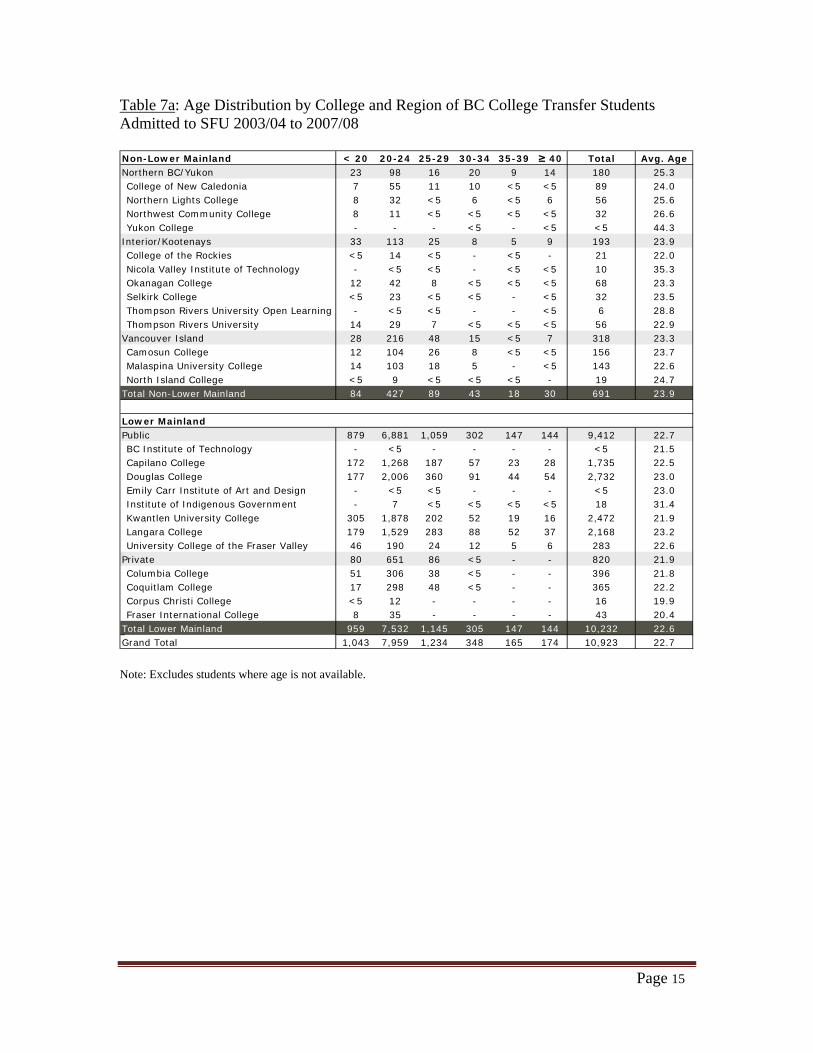
Age Upon admission to SFU, BC College transfer students were 22.7 years of age on average and the majority (73 per cent) were aged 20 to 24 over the period 2003/04 to 2007/08. As expected, college transfer students were older than students who enter SFU directly from high school. The average age of direct entry students was 18, and 98 per cent of them were below 20 years of age. In comparison, the average age of college transfer students during the previous five-year period was 23.3 years of age and only 66 per cent were aged 20 to 24. Similar to the previous five year period, the oldest BC College transfer students came from Northern BC/Yukon with an average age of 25.3 (previously 26.2) and the youngest came from private Lower Mainland colleges with an average age of 21.9 (previously 21.2). See Tables 7a and 7b for further detailed information.
Page 15
Table 7a: Age Distribution by College and Region of BC College Transfer Students Admitted to SFU 2003/04 to 2007/08 Non-Lower Mainland < 20 20-24 25-29 30-34 35-39 ≥ 40 Total Avg. AgeNorthern BC/Yukon 23 98 16 20 9 14 180 25.3College of New Caledonia 7 55 11 10 <5 <5 89 24.0Northern Lights College 8 32 <5 6 <5 6 56 25.6Northwest Community College 8 11 <5 <5 <5 <5 32 26.6Yukon College - - - <5 - <5 <5 44.3
Interior/Kootenays 33 113 25 8 5 9 193 23.9College of the Rockies <5 14 <5 - <5 - 21 22.0Nicola Valley Institute of Technology - <5 <5 - <5 <5 10 35.3Okanagan College 12 42 8 <5 <5 <5 68 23.3Selkirk College <5 23 <5 <5 - <5 32 23.5Thompson Rivers University Open Learning - <5 <5 - - <5 6 28.8Thompson Rivers University 14 29 7 <5 <5 <5 56 22.9
Vancouver Island 28 216 48 15 <5 7 318 23.3Camosun College 12 104 26 8 <5 <5 156 23.7Malaspina University College 14 103 18 5 - <5 143 22.6North Island College <5 9 <5 <5 <5 - 19 24.7
Total Non-Lower Mainland 84 427 89 43 18 30 691 23.9
Lower MainlandPublic 879 6,881 1,059 302 147 144 9,412 22.7BC Institute of Technology - <5 - - - - <5 21.5Capilano College 172 1,268 187 57 23 28 1,735 22.5Douglas College 177 2,006 360 91 44 54 2,732 23.0Emily Carr Institute of Art and Design - <5 <5 - - - <5 23.0Institute of Indigenous Government - 7 <5 <5 <5 <5 18 31.4Kwantlen University College 305 1,878 202 52 19 16 2,472 21.9Langara College 179 1,529 283 88 52 37 2,168 23.2University College of the Fraser Valley 46 190 24 12 5 6 283 22.6
Private 80 651 86 <5 - - 820 21.9Columbia College 51 306 38 <5 - - 396 21.8Coquitlam College 17 298 48 <5 - - 365 22.2Corpus Christi College <5 12 - - - - 16 19.9Fraser International College 8 35 - - - - 43 20.4
Total Lower Mainland 959 7,532 1,145 305 147 144 10,232 22.6Grand Total 1,043 7,959 1,234 348 165 174 10,923 22.7
Note: Excludes students where age is not available.

Page 16
Table 7b: Percent Age Distribution by Region of BC College Transfer Students Admitted to SFU 2003/04 to 2007/08
< 20 20-24 25-29 30-34 35-39 ≥ 40 Grand Total Age
Non-Lower Mainland 12.2% 61.8% 12.9% 6.2% 2.6% 4.3% 100.0% 23.9Northern BC/Yukon 12.8% 54.4% 8.9% 11.1% 5.0% 7.8% 100.0% 25.3Interior/Kootenays 17.1% 58.5% 13.0% 4.1% 2.6% 4.7% 100.0% 23.9Vancouver Island 8.8% 67.9% 15.1% 4.7% 1.3% 2.2% 100.0% 23.3
Lower Mainland 9.4% 73.6% 11.2% 3.0% 1.4% 1.4% 100.0% 22.6Public 9.3% 73.1% 11.3% 3.2% 1.6% 1.5% 100.0% 22.7Private 9.8% 79.4% 10.5% 0.4% 0.0% 0.0% 100.0% 21.9
Grand total 9.5% 72.9% 11.3% 3.2% 1.5% 1.6% 100.0% 22.7
Gender Of all new undergraduate students admitted to SFU from 2003/04 to 2007/08, approximately 57 per cent were female (58 per cent during the previous five-year period). During this same period 60 per cent of BC College transfer students and 53 per cent of direct high school students admitted to SFU were female. Figure 7 indicates that by college region, the proportion of females were significantly higher in Northern BC/Yukon in both the current (2003/04 – 2007/08) and previous (1998/99 – 2002/03) five-year periods. The change in gender distribution of college transfer students to SFU between the current and previous five-year periods ranges from 0 to 5 percent with the exception of BCIT and Corpus Christi College, where the numbers were very small. Figure 7: Gender (98/99 – 02/03 vs 03/04 – 07/08)
Northern BC/ Yukon
Interior/ Kootenays
Vancouver Island Lower Mainland ‐Public
Lower Mainland ‐Private
25%
37% 35%40%
47%
75%
63% 65%60%
53%
1998/99 ‐ 2002/03
Male Female
Northern BC/ Yukon
Interior/ Kootenays
Vancouver Island
Lower Mainland ‐ Public
Lower Mainland ‐ Private
26%34% 37% 40%
50%
74%66% 63% 60%
50%
2003/04 ‐ 2007/08
Male Female
Table 8 shows further detailed information on gender distribution by region.

Page 17
Table 8: Gender Distribution by College and Region of BC College Transfer Students Admitted to SFU 2003/04 to 2007/08 Non-Lower Mainland Male Female Total Male FemaleNorthern BC/Yukon 47 134 181 26% 74%
College of New Caledonia 31 58 89 35% 65%Northern Lights College 11 45 56 20% 80%Northwest Community College 5 28 33 15% 85%Yukon College - <5 <5 0% 100%
Interior/Kootenays 66 127 193 34% 66%College of the Rockies 8 13 21 38% 62%Nicola Valley Institute of Technology 6 <5 10 60% 40%Okanagan College 18 50 68 26% 74%Selkirk College 9 23 32 28% 72%Thompson Rivers University Open Learning <5 <5 6 33% 67%Thompson Rivers University 23 33 56 41% 59%
Vancouver Island 118 200 318 37% 63%Camosun College 58 98 156 37% 63%Malaspina University College 51 92 143 36% 64%North Island College 9 10 19 47% 53%
Total Non-Lower Mainland 231 461 692 33% 67%
Lower MainlandPublic 3,726 5,692 9,418 40% 60%
BC Institute of Technology - <5 <5 0% 100%Capilano College 708 1,028 1,736 41% 59%Douglas College 1,101 1,633 2,734 40% 60%Emily Carr Institute of Art and Design <5 <5 <5 50% 50%Institute of Indigenous Government 7 11 18 39% 61%Kwantlen University College 943 1,529 2,472 38% 62%Langara College 860 1,311 2,171 40% 60%University College of the Fraser Valley 106 177 283 37% 63%
Private 414 406 820 50% 50%Columbia College 204 192 396 52% 48%Coquitlam College 187 178 365 51% 49%Corpus Christi College 10 6 16 63% 38%Fraser International College 13 30 43 30% 70%
Total Lower Mainland 4,140 6,098 10,238 40% 60%Grand Total 4,371 6,559 10,930 40% 60%Total BC Grade 12 Direct Entry 5,948 6,700 12,648 47% 53%

Page 18

Page 19
II. ACADEMIC PERFORMANCE OF BC COLLEGE TRANSFER STUDENTS TO SFU This section of the report will look at admission GPA, average cumulative GPA from First Semester to Graduation, course grades in selected courses and degree completion rate of new BC transfer students at SFU over the period 2003/04 to 2007/08. Where applicable, comparisons will be made with BC 12 direct entry students during this period and transfer students during the previous period.
Average Admission GPA The average admission grade point average of college transfer students to SFU was 2.91 during the five year period from 2003/04 to 2007/08 compared to 3.10 during the previous five year period. The median GPA was 2.87 compared to 3.08 during the previous five year period. The drop in admission GPA reflects the BC government’s goal to expand access to university education for all students with a B average which equates to 3.00 GPA. Table 9 indicates that 81 per cent of all transfers were admitted with a GPA of 2.50 or higher, 41 per cent at 3.00 or higher, 12 per cent at 3.50 or higher and one per cent at 4.00 or higher.

Page 20
Table 9: Distribution of Admission GPA for BC College Transfer Students Admitted to SFU from 2003/04 to 2007/08
< 2.00 32 32 0.3%2.00 - 2.09 228 260 2.4%2.10 - 2.19 312 572 5.2%2.20 - 2.29 379 951 8.7%2.30 - 2.39 519 1,470 13.5%2.40 - 2.49 645 2,115 19.4%2.50 - 2.59 837 2,952 27.1%2.60 - 2.69 882 3,834 35.1%2.70 - 2.79 932 4,766 43.7%2.80 - 2.89 840 5,606 51.4%2.90 - 2.99 811 6,417 58.8%3.00 - 3.09 802 7,219 66.2%3.10 - 3.19 695 7,914 72.5%3.20 - 3.29 663 8,577 78.6%3.30 - 3.39 530 9,107 83.5%3.40 - 3.49 485 9,592 87.9%3.50 - 3.59 377 9,969 91.4%3.60 - 3.69 300 10,269 94.1%3.70 - 3.79 231 10,500 96.2%3.80 - 3.89 149 10,649 97.6%3.90 - 3.99 128 10,777 98.8%≥ 4.00 133 10,910 100.0%
Median GPAAverage GPA
Admission GPA
Number of Students
Cumulative Number of Students
Cumulative Percent
2.872.91
Notes: a) Admission GPA is the grade point average on courses transferable to SFU from college. b) Excludes 20 students without admission GPA information.
Academic Performance The average GPAs of BC College transfer students at admission, and average cumulative GPA (CGPA) after the first semester, after 30 credits and at graduation were 2.91, 2.53, 2.81 and 2.94 respectively. By comparison, the average GPAs at each point in time for BC Grade 12 direct entry students were: 3.59 (82.9 per cent), 2.59, 2.81 and 3.10. Figure 8 compares the GPAs for the two periods, 1998/99 – 2002/03 and 2003/04 – 2007/08, at each point.8
8 A 2004 BCCAT report based on 1992 to 1999 SFU student data found that students with high school grades below 75 per cent performed better at SFU if they transferred from college as opposed to entering directly from high school and that college transfer students and direct entry students often performed equally if their high school grades were 75 per cent or higher. (see British Columbia Council on Admissions and Transfer (BCCAT): Alternate Paths to SFU. A comparative Academic Performance Study of BC College Transfer Students and BC Direct Entry Secondary School Students Admitted to SFU from 1992 to 1999 (October 2004). Whether a similar finding holds for the students in the current period requires more study.

Page 21
The average GPAs for transfer students for the most recent period were lower than the previous five year period. For Grade 12 direct entry students, however, the average GPA was higher during this period compared to the previous five year period at each of the four points in time.9 Figure 8: Grades at Admission, After First Semester, After 30 Credits, At Graduation
Admission First Semester After 30 Credits Graduation
2003/04‐2007/08 BC College Transfer 2.91 2.53 2.81 2.94
1998/99‐2002/03 BC College Transfer 3.10 2.64 2.86 2.99
2003/04‐2007/08 BC Gr. 12 Direct Entry 3.59 2.59 2.81 3.10
1998/99‐2002/03 BC Gr. 12 Direct Entry 3.37 2.51 2.76 3.06
0.00
0.50
1.00
1.50
2.00
2.50
3.00
3.50
4.00
GPA
Academic Performance from First Semester to Graduation
Notes: a) Admission GPA is the grade point average on courses transferable to SFU from college. b) BC Grade 12 Direct Entry Admission GPAs were converted from a percentage to a 4.33 GPA scale for comparison. A decline in the grade point average between the time of admission and the end of the first semester is generally known as “university entrance shock”. As a rough measure,10 the entrance shock experienced by college transfer students of 0.38 in grade point was 2.6 times smaller than the experience of BC Grade 12 direct entry students (1.00).
9 The finding here concerning better academic performance for BC Grade 12 direct entry students in the current period compared to the previous can be said to be contrary to the assumption that the expansion of student spaces that led to lower admission GPAs would result in poorer academic performance. An explanation for this requires more study. 10 The university entrance shock is estimated by taking the difference between the admission GPA and the GPA at the end of the first semester.

Page 22
Students from the Lower Mainland private colleges experienced the largest university entrance shock of 0.64 grade point while students from public colleges in the Lower Mainland and Interior/Kootenays experienced the smallest entrance shock, each at 0.35 grade point. For further information by college and region, please see Table 10. Table 10: Academic Performance from First Semester to Graduation by College and Region of BC College Transfer Students Admitted to SFU from 2003/04 to 2007/08
Non-Lower Mainland N GPA N GPA N GPA N GPANorthern BC/Yukon 180 3.27 169 2.82 130 3.15 52 3.23College of New Caledonia 88 3.36 87 2.69 63 3.02 38 3.25Northern Lights College 56 3.13 56 3.18 41 3.28 8 3.29Northwest Community College 33 3.24 23 2.53 24 3.27 6 3.07Yukon College <5 3.28 <5 2.01 <5 2.93 - -
Interior/Kootenays 190 3.09 185 2.74 132 3.02 84 3.19College of the Rockies 21 3.11 20 2.87 14 3.10 11 3.16Nicola Valley Institute of Technology 10 3.08 8 2.79 7 3.16 7 3.16Okanagan College 67 3.02 67 2.81 48 3.08 29 3.28Selkirk College 31 3.11 31 2.55 20 2.80 10 3.03Thompson Rivers University Open Learning 6 2.96 6 2.83 <5 3.02 <5 3.10Thompson Rivers University 55 3.16 53 2.70 39 3.01 24 3.16
Vancouver Island 316 3.14 308 2.60 195 2.90 100 3.08Camosun College 155 3.07 151 2.61 89 3.00 52 3.18Malaspina University College 142 3.20 138 2.55 91 2.78 42 2.93North Island College 19 3.23 19 2.92 15 3.09 6 3.21
Total Non-Lower Mainland 686 3.16 662 2.70 457 3.01 236 3.15
Lower MainlandPublic 9,404 2.89 9,232 2.54 5,950 2.81 3,186 2.94BC Institute of Technology <5 2.69 <5 2.22 - - - -Capilano College 1,735 2.92 1,710 2.63 1,183 2.87 637 2.99Douglas College 2,727 2.85 2,687 2.49 1,630 2.79 826 2.94Emily Carr Institute of Art and Design <5 3.28 <5 3.06 <5 2.91 - -Institute of Indigenous Government 18 3.15 17 1.66 5 2.47 - -Kwantlen University College 2,470 2.97 2,428 2.54 1,587 2.81 921 2.94Langara College 2,167 2.80 2,124 2.52 1,374 2.74 713 2.87University College of the Fraser Valley 283 3.01 262 2.65 170 2.96 89 3.17
Private 820 2.96 809 2.32 441 2.61 214 2.73Columbia College 396 2.93 389 2.24 208 2.60 95 2.74Coquitlam College 365 3.02 361 2.36 223 2.61 117 2.72Corpus Christi College 16 2.62 16 2.40 9 2.74 <5 2.85Fraser International College 43 2.87 43 2.73 <5 3.25 - -
Total Lower Mainland 10,224 2.90 10,041 2.52 6,391 2.79 3,400 2.93Grand Total 10,910 2.91 10,703 2.53 6,848 2.81 3,636 2.94Total BC Grade 12 Direct Entry 12,642 82.90 12,243 2.59 7,868 2.81 844 3.10
from SFUGPA at SFU passed at SFU Admission 1st Sem 30 Credits At Graduation
Notes: a) Admission GPA data excludes 20 students without admission GPA information. b) SFU CGPA after first semester at SFU is calculated on courses completed in first semester at SFU. c) SFU CGPA at graduation from SFU is shown for degree completers only. Students who complete only PDP or certificates are excluded. d) Students who complete multiple degrees simultaneously are included in the graduation statistics for each degree completed. e) Students who complete multiple degrees sequentially are included in the graduation statistics for the first degree completed. f) 34 per cent of college transfers admitted from 2003/04 to 2007/08 have graduated with a credential (between October 2003 and June 2008). g) The average GPA of BC Grade 12 Direct Entry students are indicated in percentages throughout this report. To convert this to the 4.33 GPA scale, multiply the percentage by 0.0433 (see Figure 8).

Page 23
Over time, the cumulative grade point average of both admission groups gradually recovered but it was the college transfer students who finished with a graduation GPA (2.94) exceeding their admission GPA (2.91). While the average admission GPA of BC Grade 12 direct entry students was nearly 0.7 grade point higher than that of college transfer students, their average graduation GPA (3.10) was higher by 0.16 grade point. By college region, the highest admission GPA was attained by Northern BC/Yukon college students. These transfer students on average also had the highest CGPAs after the first semester (2.82), after 30 credits (3.15) and at graduation (3.23).
Grades in Selected Courses This study examines the average grades for selected courses in the following programs: Archaeology (Arch) Humanities (Hum) Biological Sciences (Bisc) Kinesiology (Kin) Business/Economics (Buec) Linguistics (Ling) Business (Bus) Mathematics and Computing (Macm) Chemistry (Chem) Mathematics (Math)
Communication (Cmns) Molecular Biology and Biochemistry (Mbb)
Computing Science (Cmpt) Philosophy (Phil) Criminology (Crim) Physics (Phys) Economics (Econ) Political Science (Pol) Education (Educ) Psychology (Psyc) English (Engl) Sociology and Anthropology (SA) French (Fren) Statistics (Stat) Geography (Geog) Women's Studies (Ws) History (Hist)
These courses were selected because they were highly enrolled in by college transfer students, including degree completers and non-completers. The courses are typically required core courses for programs frequently taken by college transfer students. Where possible, courses selected in the previous edition of SFU’s college profile report have been retained in this report, except in cases where enrollments are too low or the course no longer exists. See Table A2 in the Appendix for detailed information on all the courses selected. In the majority of the courses reported (91 per cent or 49 of the 54 courses), the average grade achieved by BC College transfer students overall was lower than the grade achieved by BC Grade 12 direct entry students. The five courses in which college transfer students out-performed BC Grade 12 direct entry students are highlighted in Table 11.

Page 24
Table 11: Courses in which the Average Course Grade of BC College Transfer Students is higher than BC Grade 12 Direct Entry Students
BC College BC Grade 12Course Description Transfer Direct EntryArch 100 Ancient Peoples and Places 2.73 2.72Cmns 110 Intro. to Communication Studies 2.79 2.78Cmpt 150 Intro. to Computer Design 2.50 2.38Phys 100 Intro. to Physics 2.70 2.56Ws 101 Intro. to Women's Issues in Canada 2.78 2.77
Avg Course Grade
200- and 300-Level Course Grades This section discusses the admission GPA, SFU course grade and proportion of grades awarded below a ‘C’ in 200- and 300-level courses at SFU. This analysis includes only those courses in which at least 100 BC College transfer students were registered over the five year period from 2003/04 to 2007/08. For the 277 courses included in this report, the overall average course grade was lower among transfer students (2.60) than among BC Grade 12 direct entry students (2.78 for all BC Grade 12 students; 2.80 for those who attended SFU immediately following or within one year of high school graduation and 2.65 for non-immediate or those who attended SFU after one year of high school graduation). In the previous five-year period, the average course grade was 2.76 for transfer students and 2.90 for BC Grade 12 direct entry students. The percentage of college transfer students who receive grades below a ‘C’ (17 per cent) was higher than the percentage of BC direct entry students (13 per cent for all; 13 per cent for immediate direct entry and 16 per cent for non-immediate direct entry). In the previous five-year period, the proportion of those who received grades below a ‘C’ was 10 per cent for college transfer students and 9 per cent for BC Grade 12 students. Table 12a shows the average course grade and per cent grades below ‘C’ for 200- and 300-Level courses at the aggregated level for BC College transfer and Grade 12 entry students for the two five-year periods. Compared to the previous five-year period, the average course grades for both admission groups are lower and the proportion of students with grades below ‘C’ are higher for both the 200- and 300-Level courses.

Page 25
Table 12a: Comparison of Academic Performance in 200- and 300-Level Courses
All 200-Level 2.73 11.6% 2.86 9.4% 2.48 20.3% 2.77 13.1%All 300-Level 2.88 8.1% 3.08 5.5% 2.76 12.1% 3.01 8.3%Total 2.76 10.4% 2.90 8.5% 2.60 16.8% 2.80 12.5%
Direct EntryTransfer %
Grades <CAvg Crse
Grade
Transfer Direct Entry%
Grades <CAvg Crse
Grade%
Grades <CAvg Crse
Grade
1998/99 to 2002/03 2003/04 to 2007/08BC College BC Grade 12 BC College BC Grade 12
% Grades <C
Avg CrseGrade
Notes: a) Excludes courses with fewer than 100 BC College transfer students. b) Average course grade calculated on grades with a numerical equivalent only. Therefore excludes such grades as course challenge, pass, audit, etc. BC College transfer students out-performed BC Grade 12 direct entry students in approximately 5 per cent (15) of the 277 highly enrolled courses examined in this study. These courses are shown in Table 12b below. Performance was tied in one course (or 0.36 percent): ENGL 313 was the only course that BC College transfer students and BC Grade 12s performed equally well in. For further detailed information by course, please see Table A3 in the Appendix.
Table 12b: Courses in which BC College Transfer Students Out-performed BC Grade 12 Direct Entry Students
ARCH 226 103 2.93 2.59 19.4% 60 84.8 2.57 15.0%CMNS 304 122 2.99 2.62 8.2% 44 80.8 2.55 18.2%ECON 331 312 3.05 2.76 12.2% 75 81.3 2.61 18.7%EDUC 222 164 2.91 2.40 29.3% 74 80.9 2.29 31.1%EDUC 311 103 2.73 3.54 1.9% 7 84.1 3.48 0.0%EDUC 323 162 2.93 3.11 2.5% 33 80.6 3.09 3.0%EDUC 351 196 2.83 3.25 2.0% 54 75.6 3.22 0.0%EDUC 382 136 2.86 3.36 2.9% 35 80.7 3.25 2.9%ENGL 306 167 2.93 3.08 4.8% 50 86.0 3.04 10.0%ENGL 359 281 2.91 2.98 5.3% 80 82.7 2.90 10.0%ENGL 368 110 2.88 2.93 5.5% 12 78.9 2.44 25.0%HIST 319 105 2.83 2.69 8.6% 6 82.5 2.67 16.7%PHIL 203 143 2.99 2.78 5.6% 54 84.6 2.75 9.3%PHIL 331 171 3.09 2.78 9.9% 47 84.8 2.72 6.4%PHIL 332 126 3.06 2.71 11.9% 6 80.2 2.17 33.3%
% Grades<C
BC College Transfer BC Grade 12 Direct Entry
Course# of
GradesAdm.GPA
Avg CrseGrade
% Grades<C
# of Grades
Adm.GPA
Avg CrseGrade
Notes: a) Excludes courses with fewer than 100 BC College transfer students. b) Average course grade calculated on grades with a numerical equivalent only. Therefore excludes such grades as course challenge, pass, audit, etc.

Page 26
Degree Completion Rate The academic performance, from admission through to graduation, of 4,452 BC College transfer students admitted to SFU in 2003/04 and 2004/0511 was examined. Approximately 63 per cent graduated from SFU between October 2003 and June 2008 with at least one degree. Generally speaking, the higher the number of credits transferred at admission to SFU, the higher the degree completion rate. However, the following findings are noted:
1. The degree completion rate was lowest among students entering SFU with between 30 – 34 transfer credits (50 per cent), 5 per cent lower than among students with less than 30 transfer credits.
2. The degree completion rate was highest among students with between 45 and 54 transfer credits (70 per cent), 6 per cent higher than students with more than 55 transfer credits.
Regionally, there were differences in completion rates. Table 13a indicates the degree completion rates by number of credits and by region. Table 13a: Degree Completion Rates by Number of Credits Transferred and Region (for BC College Transfer Students Admitted to SFU from 2003/04 to 2004/05)
Northern Interior Vancouver Total Non- Total LowerB.C./Yukon Kootenays Island Lower Mainland Mainland
N 6 15 28 49 174 39 213 262%Grad 33.3% 33.3% 67.9% 53.1% 55.7% 48.7% 54.5% 54.2%
N 21 12 19 52 272 61 333 385%Grad 19.0% 75.0% 63.2% 48.1% 50.0% 49.2% 49.8% 49.6%
N <5 11 12 27 248 40 288 315%Grad 50.0% 54.5% 50.0% 51.9% 59.7% 60.0% 59.7% 59.0%
N 9 <5 6 18 231 37 268 286%Grad 44.4% 100.0% 50.0% 55.6% 59.3% 62.2% 59.7% 59.4%
N 7 18 7 32 496 33 529 561%Grad 57.1% 77.8% 57.1% 68.8% 70.0% 69.7% 69.9% 69.9%
N <5 11 10 24 492 32 524 548%Grad 66.7% 54.5% 60.0% 58.3% 69.3% 87.5% 70.4% 69.9%
N 44 35 44 123 1,936 36 1,972 2,095%Grad 54.5% 74.3% 50.0% 58.5% 64.7% 61.1% 64.6% 64.2%Gran
d N 94 105 126 325 3,849 278 4,127 4,452Total %Grad 44.7% 65.7% 57.1% 56.3% 63.9% 60.8% 63.7% 63.1%
30-34
35-39
40-44
45-49
Grand Total
50-54
≥ 55
Non-Lower Mainland Lower MainlandPublic Private
<30
Note: ‘N’=Total number of students admitted with specified credits between 2003/04 and 2004/05. ‘%Grad’=Proportion of N who were awarded a credential.
11 By looking only at the entry cohorts admitted in 2003/04 and 2004/05 (i.e., summer 2003 to spring 2005), we have allowed enough time for transfer students to complete their SFU program. If more recent entry cohorts had been included, students would not have had sufficient time to graduate.

Page 27
Degree completion rates of transfer students from some colleges were higher than the overall average of 63 per cent. Table 13b shows these colleges with the total number of transfer students to SFU and the degree completion rate. Table 13b: Colleges with Average Degree Completion Rate > 63 per cent (for BC College Transfer Students Admitted to SFU from 2003/04 to 2004/05)
College #Student # Student % GraduatedAdmitted Graduated
Kwantlen University College 1,054 717 68.0%Capilano College 763 505 66.1%University College of the Fraser Valley 97 67 69.1%College of New Caledonia 47 30 63.8%Okanagan College 31 23 74.2%College of the Rockies 15 11 73.3%Nicola Valley Institute of Technology 9 7 77.8%Corpus Christi College <5 <5 100.0%Thompson Rivers University Open Learning <5 <5 66.7% For further detailed information on degree completion, please see Table A4 in the Appendix.

Page 28
Graduation Cumulative Grade Point Average Among the SFU degree completers admitted in the five year period between 2003/04 and 2007/08, the graduation cumulative grade point average (CGPA) of the 3,892 BC College transfer students was lower than the graduation CGPA of 940 BC Grade 12 direct entry students (2.95 versus 3.11).12 Figure 9 compares the distribution of the graduation CGPA of BC College transfer and BC Grade 12 direct entry students for the previous and current five-year periods. Figure 9: Grades at Graduation at SFU (98/99 – 02/03 vs 03/04 – 07/08)
0%
5%
10%
15%
20%
< 2.00 2.00 ‐2.19
2.20 ‐2.39
2.40 ‐2.59
2.60 ‐2.79
2.80 ‐2.99
3.00 ‐3.19
3.20 ‐3.39
3.40 ‐3.59
3.60 ‐3.79
3.80 ‐3.99
≥ 4.00
Distribution of CGPA at Graduation from SFU
2003/04‐2007/08 Col Transfer 2003/04‐2007/08 Gr 12
1998/99‐2002/03 Col Transfer 1998/99‐2002/03 Gr 12
Figure 10 shows the distribution of the CGPA on the last 60 credit hours at SFU of BC College transfer and BC Grade 12 direct entry students. Again BC College transfer students achieved a lower CGPA than BC Grade 12 direct entry students (2.90 versus 3.20).
12 Please note that the graduation CGPA of college transfer students only includes two or three years of courses at SFU, whereas the graduation CGPA of BC Grade 12 direct entry students includes all four or more years of courses at SFU.

Page 29
Figure 10: Grades on the Last 60 SFU Credits (98/99 – 02/03 vs 03/04 – 07/08)
0%
5%
10%
15%
20%
< 2.00 2.00 ‐2.19
2.20 ‐2.39
2.40 ‐2.59
2.60 ‐2.79
2.80 ‐2.99
3.00 ‐3.19
3.20 ‐3.39
3.40 ‐3.59
3.60 ‐3.79
3.80 ‐3.99
≥ 4.00
Distribution of CGPA on Last 60 Credit Hours at SFU
2003/04‐2007/08 Col Transfer 2003/04‐2007/08 Gr 12
1998/99‐2002/03 Col Transfer 1998/99‐2002/03 Gr 12 Please see Table 14 for further detailed information on CGPA at Graduation and on the last 60 SFU Credit Hours. Table 14: Distribution of CGPA upon Graduation from SFU and on the Last 60 Credit Hours at SFU for BC College Transfer vs. BC Grade 12 Direct Entry Students (for Students Admitted to SFU from 2003/04 to 2007/08)
Freq % Freq % Freq % Freq %< 2.00 <5 0.0% 151 3.9% - - <5 0.3%2.00 - 2.19 74 1.9% 88 2.3% <5 0.2% 5 0.5%2.20 - 2.39 302 7.8% 304 7.8% 39 4.1% 27 2.9%2.40 - 2.59 512 13.2% 488 12.5% 77 8.2% 75 8.0%2.60 - 2.79 680 17.5% 665 17.1% 146 15.5% 92 9.8%2.80 - 2.99 609 15.6% 592 15.2% 151 16.1% 133 14.1%3.00 - 3.19 584 15.0% 537 13.8% 161 17.1% 140 14.9%3.20 - 3.39 496 12.7% 428 11.0% 111 11.8% 145 15.4%3.40 - 3.59 320 8.2% 321 8.2% 101 10.7% 101 10.7%3.60 - 3.79 180 4.6% 170 4.4% 65 6.9% 104 11.1%3.80 - 3.99 96 2.5% 106 2.7% 51 5.4% 56 6.0%≥ 4.00 38 1.0% 42 1.1% 36 3.8% 59 6.3%Total Graduates 3,892 100.0% 3,892 100.0% 940 100.0% 940 100.0%Average CGPA
SFU CGPAAt SFU Graduation
BC College Transfer On Last 60 SFU Hrs
BC Grade 12 Direct Entry At SFU Graduation On Last 60 SFU Hrs
2.95 2.90 3.11 3.20

Page 30

Page 31
III. BC COLLEGE TRANSFER STUDENTS WHO HAVE GRADUATED FROM SFU This section examines academic performance, degree of choice, credential awarded and average number of semesters to complete of BC College transfer students who graduated with a degree from SFU between October 2003 and June 2008. Where possible, comparisons are made with BC College transfer students who graduated over the previous five-year period from 1998/99 to 2002/03.
Academic Performance Among the BC College transfer students13 who graduated with a degree between October 2003 and June 2008, the average GPAs at the four points in their SFU education are shown in detail in Table 15. The four points are at admission, after the first semester, after 30 credits, and upon graduation. Table 15 also shows comparisons of GPAs for those transfer students who graduated during the previous five-year period from 1998/99 to 2002/03 as well as all BC College transfer students from 2003/04 to 2007/08. Table 15: Comparison of Average GPAs at Four Points
1998/99 - 2002/03Graduated Graduated All
Admission GPA 3.15 3.00 2.91First Semester GPA 2.84 2.79 2.53CGPA After 30 credits 2.91 2.90 2.81CGPA At Graduation 2.99 2.95 2.94
2003/04 - 2007/08
Comparing BC College transfer students who have graduated to all BC College transfer students admitted to SFU, Table 15 shows that the average GPAs at each of the four points are higher for those who have graduated. Table 15 also shows that compared to the previous five years, the average GPAs at first semester, after 30 credits and at graduation were slightly lower for the current cohort that have graduated due to a lower average admission GPA requirement in the period. The effects of transfer shock of degree completers was a drop of only 0.21 grade points compared to 0.38 for all BC College transfer students (degree completers and non-completers combined) and 0.99 for all BC Grade 12 direct entry students (see Tables 10 and 16).
13 The total of 3,892 is larger than the unique count of students who received a degree (3,629) because students who complete multiple degrees simultaneously are included in the graduation statistics for each degree completed.

Page 32
Table 16: Admission GPA, CGPA after First Semester, at 30 Credits and at Graduation of BC College Transfer Students Who Have Graduated
Non-Lower Mainland N GPA N GPA N GPA N GPANorthern BC/Yukon 67 3.23 67 3.08 67 3.20 67 3.23College of New Caledonia 41 3.50 41 3.19 41 3.23 41 3.27Northern Lights College 18 2.75 18 3.23 18 3.24 18 3.22Northwest Community College 8 2.95 8 2.22 8 3.00 8 3.08
Interior/Kootenays 86 3.22 86 3.02 86 3.12 86 3.19College of the Rockies 11 3.47 11 2.95 11 3.10 11 3.16Nicola Valley Institute of Technology 7 3.23 7 3.06 7 3.16 7 3.16Okanagan College 31 3.19 31 3.01 31 3.20 31 3.28Selkirk College 10 3.15 10 2.99 10 2.95 10 3.03Thompson Rivers University Open Learning <5 2.87 <5 2.94 <5 3.09 <5 3.10Thompson Rivers University 24 3.21 24 3.08 24 3.08 24 3.16
Vancouver Island 103 3.30 101 2.93 103 3.02 103 3.08Camosun College 56 3.23 54 3.04 56 3.12 56 3.19Malaspina University College 42 3.38 42 2.77 42 2.87 42 2.93North Island College 5 3.39 5 3.07 5 3.14 5 3.16
Total Non-Lower Mainland 256 3.25 254 3.00 256 3.10 256 3.16
Lower MainlandPublic 3,420 2.97 3,389 2.79 3,414 2.90 3,420 2.95Capilano College 686 2.96 684 2.84 686 2.94 686 2.99Douglas College 914 2.95 904 2.78 914 2.91 914 2.95Kwantlen University College 964 3.05 960 2.78 964 2.89 964 2.94Langara College 759 2.87 756 2.74 759 2.83 759 2.88University College of the Fraser Valley 97 3.16 85 2.94 91 3.12 97 3.19
Private 216 3.15 215 2.63 216 2.70 216 2.74Columbia College 95 3.12 95 2.59 95 2.70 95 2.74Coquitlam College 119 3.18 118 2.68 119 2.70 119 2.73Corpus Christi College <5 2.59 <5 2.00 <5 2.78 <5 2.85
Total Lower Mainland 3,636 2.98 3,604 2.78 3,630 2.89 3,636 2.93Grand Total 3,892 3.00 3,858 2.79 3,886 2.90 3,892 2.95
SFU CGPA at graduationGPA
Admission SFU CGPA after Sem1
SFU CGPA after 30 credits
Notes: a) Includes degree completers only. PDP and certificates are excluded. b) Students who complete multiple degrees simultaneously are included in the graduation statistics for each degree completed. c) Students who complete multiple degrees sequentially are included in the graduation statistics for the first degree completed. d) Not all students who have graduated have a CGPA after the first semester or after 30 hours at SFU (e.g., students who take Pass/Fail courses only). e) Graduation occurred between October 2003 and June 2008.
Graduation Degree Program At a summary level, the top three programs from which BC College transfer students graduated were: Business Administration (12 per cent); Psychology (11 per cent) and Economics (11 per cent). In comparison, the top three programs of choice by all BC College transfer students during this five year period were: Business Administration (12 per cent); Psychology (11 per cent) and Criminology (10 per cent).

Page 33
Figure 11 indicates that the top three programs differ by region. For example, the top three programs for college transfer students in Northern BC/Yukon were: Criminology, Education, and General Studies whereas for students on Vancouver Island, they were Criminology, Business Administration, and Communication.
Figure 11: Top Three Graduation Degree Programs by Region
Ranking
1
2
3
Lower Mainland
Business
Psychology
Economics
Northern BC/Yukon
Criminology
Education
General Studies
Interior/ Kootenays
Vancouver Island
Business (tie)
Psychology(tie)
General Studies(tie)
Criminology
Business
Communi‐cation
Table A5 in the Appendix contains further detailed information by college and region of these BC College transfer students.
Credential Awarded Of the BC College transfer students admitted to SFU from 2003/04 to 2007/08, a total of 3,629 students graduated between October 2003 and June 2008 with 3,984 credentials. These credentials included 3,638 degrees (91 per cent), 190 Certificates (5 per cent) and 156 Professional Development Program completers (4 per cent). (Students with more than one credential are counted once under each credential). The most common SFU degrees awarded to BC College transfer students included: 2,713 Bachelor of Arts (68 per cent), 443 Bachelor of Business Administration (11 per cent); 222 Bachelor of Science (6 per cent) and 180 Bachelor of General Studies (5 per cent). Compared to the previous five-year period, the number of credentials has increased (3,629 versus 3,199). The most common SFU degrees awarded during the previous five-year period were also Bachelor of Arts (58 per cent); Bachelor of Business Administration (13 per cent) and Bachelor of General Studies (3 per cent). For more detailed information on credentials awarded to BC College transfer students by college and region, please see Table 17.

Page 34
Table 17: BC College Transfers by Credential Awarded (for Students Admitted to SFU from 2003/04 to 2007/08) Non-Lower Mainland BA BBA BSC BGSAR BED BFA BSK BASC BGSAP PDP CLA Othr Cert Total
Northern BC/Yukon 35 <5 <5 12 <5 - - - - 46 <5 - 103College of New Caledonia 31 <5 <5 <5 <5 - - - - 6 <5 - 46Northern Lights College - - <5 7 <5 - - - - 27 <5 - 38Northwest Community College <5 - - <5 - - - - - 13 - - 19
Interior/Kootenays 54 11 6 11 - - <5 - - 5 <5 <5 92College of the Rockies 6 <5 <5 - - - <5 - - - - - 11Nicola Valley Institute of Technology - - - 7 - - - - - - - - 7Okanagan College 22 5 <5 - - - <5 - - <5 <5 - 33Selkirk College 8 - <5 <5 - - - - - - - <5 11Thompson Rivers University Open Learning <5 - - - - - - - - - - - <5Thompson Rivers University 15 <5 <5 <5 - - - - - <5 - - 27
Vancouver Island 61 23 7 <5 <5 <5 <5 - - <5 <5 - 105Camosun College 41 5 <5 <5 <5 <5 - - - <5 <5 - 57Malaspina University College 16 18 5 - <5 <5 - - <5 - - 43North Island College <5 - - - - - <5 - - - - - 5
Total Non-Lower Mainland 150 37 15 24 <5 <5 <5 - - 55 6 <5 300
Lower MainlandPublic 2,432 351 186 145 23 18 17 9 6 101 101 79 3,468
Capilano College 488 72 36 29 <5 <5 <5 <5 <5 21 24 15 698Douglas College 612 85 52 46 11 5 7 <5 <5 36 43 21 926Kwantlen University College 708 120 49 32 <5 <5 <5 - <5 21 19 13 973Langara College 558 71 38 35 - 5 <5 <5 - 8 15 28 765University College of the Fraser Valley 66 <5 11 <5 5 - <5 - - 15 - <5 106
Private 131 55 21 5 - - - <5 - - - <5 216Columbia College 60 27 8 - - - - - - - - - 95Coquitlam College 69 28 13 5 - - - <5 - - - <5 119Corpus Christi College <5 - - - - - - - - - - - <5
Total Lower Mainland 2,563 406 207 150 23 18 17 10 6 101 101 82 3,684Grand Total 2,713 443 222 174 28 21 21 10 6 156 107 83 3,984 Notes: a) Students graduating with more than one credential are counted once under each credential. b) There were 3,717 unique students graduating with a credential from SFU. 3,629 of these students received a degree between October 2003 and June 2008. c) Students who complete multiple degrees simultaneously are included in the graduation statistics for each degree completed. d) On the other hand, students who complete multiple degrees sequentially are included in the graduation statistics for the first degree completed. Due to this definition, it appears that 156 students (4 per cent) completed a PDP. However, if students who complete multiple degrees sequentially are included in the graduation statistics for each degree completed, then the percentage of PDP completers would rise to 7 per cent. e) The credential acronyms used in this Table are explained in “Definitions” in Appendix C.
Average Number of Semesters to Complete Credential On average, BC College transfer students took 7.9 semesters to complete a first degree, measured from the semester of admission to the semester of graduation.14 Given that SFU operates on a trimester system, this is equivalent to 2.6 years. The average number
14 Note that many students do not maintain a continuous enrollment in each semester from admission to graduation, but this measure provides a reasonable indicator of degree completion time.

Page 35
of semesters to complete a degree was also 7.9 semesters for BC College transfer students during the previous five year period. For more information on the average number of semesters to complete a credential by college and region, please see Table 18. Table 18: BC College Transfer Students by Credential Awarded and Average Number of Semesters to Complete Credential (for Students Admitted to SFU from 2003/04 to 2007/08) Non-Lower Mainland BA BBA BSC BGSAR BED BFA BSK BASC BGSAP TotalNorthern BC/Yukon 6.8 7.7 11.5 8.7 8.7 - - - - 7.5College of New Caledonia 6.7 7.7 9.0 8.0 8.0 - - - - 7.0Northern Lights College - - 14.0 8.9 9.0 - - - - 9.4Northwest Community College 7.3 - - 9.0 - - - - - 7.
Interior/Kootenays 8.1 8.2 8.7 6.1 - - 11.0 - - 8.0College of the Rockies 5.7 8.5 9.0 - - - 11.0 - - 7.3Nicola Valley Institute of Technology - - - 5.0 - - - - - 5.Okanagan College 8.7 9.0 9.0 - - - 11.0 - - 8.8Selkirk College 8.1 - 8.0 10.0 - - - - - 8.Thompson Rivers University Open Learning 5.7 - - - - - - - - 5.Thompson Rivers University 8.7 7.0 8.5 7.3 - - - - - 8.
Vancouver Island 7.3 9.1 8.9 10.0 6.5 9.0 9.0 - - 7.9Camosun College 7.0 10.8 8.0 10.0 6.5 11.0 - - - 7.5Malaspina University College 8.1 8.6 9.2 - - 8.0 9.0 - - 8.5North Island College 7.0 - - - - - 9.0 - - 7.4
Total Non-Lower Mainland 7.5 8.7 9.1 7.5 7.8 9.0 10.0 - - 7.8
Lower MainlandPublic 7.6 8.2 9.0 8.3 8.5 10.1 10.7 12.0 8.8 7.8Capilano College 7.8 8.4 9.2 8.3 9.3 11.5 12.5 11.0 4.0 8.0Douglas College 7.8 8.3 9.9 8.7 9.9 10.2 10.0 12.0 9.5 8.1Kwantlen University College 7.4 8.3 8.5 7.5 10.8 9.5 10.0 - 11.0 7.6Langara College 7.6 7.6 8.4 8.8 - 9.4 9.3 12.3 - 7.7University College of the Fraser Valley 7.5 8.3 8.9 6.3 3.0 - 14.0 - - 7.4
Private 7.9 8.3 8.9 9.0 - - - 12.0 - 8.2Columbia College 7.8 8.2 9.5 - - - - - - 8.Coquitlam College 8.0 8.4 8.5 9.0 - - - 12.0 - 8.2Corpus Christi College 8.0 - - - - - - - - 8.
Total Lower Mainland 7.6 8.2 9.0 8.4 8.5 10.1 10.7 12.0 8.8 7.9Grand Total 7.6 8.2 9.0 8.3 8.4 10.0 10.6 12.0 8.8 7.9
8
0
372
1
0
Notes: a) Credential completion time is estimated from the elapsed semesters between semester admitted and semester of graduation from first degree. b) Credentials which may be completed before, during or after a degree program (PDP or certificates) are excluded from this table. c) Graduation occurred between October 2003 and June 2008.

Page 36

Page 37
IV. STUDENTS AT SFU WITH BC COLLEGE EXPERIENCE Over the five year period ending in the 2008 spring semester, 1,167 students with some transfer credit from a BC College were admitted to SFU as non-BC College transfer students. These students, while they had some transfer credits from a BC College, were admitted to SFU under other bases of admission, such as BC Grade 12, Mature Student, Special Entry, University Transfer, etc. These 1,167 students represented 4 per cent of all new students admitted to SFU and 8 per cent of all new students admitted to SFU from all admission categories with some transfer credits from another postsecondary institution.15 In terms of credit volume, college experience students transferred 7 per cent of the total credits and about 8 per cent of the total BC College credits to SFU. This section provides a profile of these students with college experience including number admitted, basis of admission, admission GPA, number of transfer credits, and their age and gender distributions.
Number of Students Admitted Similar to BC College transfer students, the majority of students with college experience came to SFU from the Lower Mainland colleges (82 per cent) with 74 per cent coming from the public colleges and 8 per cent from private institutions. Among the Lower Mainland colleges, the highest number of students came from Douglas (19 per cent), Langara (18 per cent), Kwantlen (17 per cent), and Capilano (12 per cent). From outside the Lower Mainland, University College of the Cariboo (now known as Thompson Rivers University), Camosun, Malaspina and Okanagan provided the largest source of these students with college experience (each above 2 per cent). Their combined total constitutes approximately 12 per cent of all students with college experience. Over the past five years, the proportion of students admitted to SFU with some college experience averaged 4 per cent of all new students admitted, ranging from 3.4 per cent in 2003/04 to 3.5 per cent in 2007/08.16 For more detailed information on the number of admissions by year, college and region, please see Tables 19a and 19b.
15 See Table B1 in Appendix B for distribution of new students admitted to SFU by Basis of Admission (2003/04 – 2007/08). 16 See Table B1 and Figure B2 for more detailed information.

Page 38
Table 19a: Students with College Experience Admitted to SFU by Year of Admission
5 YearNon-Lower Mainland 2003/04 2004/05 2005/06 2006/07 2007/08 Total % of TotalNorthern BC/Yukon 13 7 11 9 7 47 4.0%College of New Caledonia 5 <5 <5 <5 <5 15 1.3%Northern Lights College <5 <5 <5 <5 <5 7 0.6%Northwest Community College 5 <5 5 5 <5 20 1.7%Yukon College <5 <5 - <5 <5 5 0.4%
Interior/Kootenays 15 11 14 20 32 92 7.9%College of the Rockies <5 <5 <5 <5 <5 6 0.5%Nicola Valley Institute of Technology - <5 <5 - - <5 0.2%Okanagan College 6 <5 5 <5 6 25 2.1%Selkirk College <5 <5 <5 <5 <5 11 0.9%Thompson Rivers University 5 <5 6 12 22 48 4.1%
Vancouver Island 10 22 15 14 14 75 6.4%Camosun College <5 10 8 10 8 40 3.4%Malaspina University College 5 9 7 <5 5 30 2.6%North Island College <5 <5 - - <5 <5 0.4%
Total Non-Lower Mainland 38 40 40 43 53 214 18.3%
Lower MainlandPublic 124 199 144 200 192 859 73.6%BC Institute of Technology 19 <5 <5 <5 <5 31 2.7%Capilano College 14 27 28 36 32 137 11.7%Douglas College 36 40 39 61 49 225 19.3%Emily Carr Institute of Art and Design - <5 - - - <5 0.1%Institute of Indigenous Government <5 - - - 5 6 0.5%Kwantlen University College 24 50 38 46 40 198 17.0%Langara College 21 62 31 44 49 207 17.7%University College of the Fraser Valley 9 15 5 11 14 54 4.6%
Private 19 21 16 18 20 94 8.1%Columbia College 7 5 5 8 7 32 2.7%Coquitlam College 11 15 9 8 10 53 4.5%Corpus Christi College - <5 <5 <5 - <5 0.3%Fraser International College - - - - <5 <5 0.3%Native Education Centre <5 - <5 <5 - <5 0.3%
Total Lower Mainland 143 220 160 218 212 953 81.7%Total with College Experience 181 260 200 261 265 1,167 100.0%
Table 19b: Percent Distribution of BC College Transfers Admitted by Region
2003/04 2004/05 2005/06 2006/07 2007/08 5Yr AvgNon Lower Mainland 21.0% 15.4% 20.0% 16.5% 20.0% 18.3%Northern BC/Yukon 7.2% 2.7% 5.5% 3.4% 2.6% 4.0%Interior/Kootenays 8.3% 4.2% 7.0% 7.7% 12.1% 7.9%Vancouver Island 5.5% 8.5% 7.5% 5.4% 5.3% 6.4%
Lower Mainland 79.0% 84.6% 80.0% 83.5% 80.0% 81.7%Public 68.5% 76.5% 72.0% 76.6% 72.5% 73.6%Private 10.5% 8.1% 8.0% 6.9% 7.5% 8.1%
Grand Total 100.0% 100.0% 100.0% 100.0% 100.0% 100.0% Note: Excludes students admitted to SFU on the basis of 'BC College Transfer'.

Page 39
Basis of Admission The majority of students with college experience admitted to SFU were admitted under the ‘university transfer’ basis of admission (30 per cent). Three other major bases for admission were BC Grade 12 (23 per cent), Mature Student (14 per cent) and Special Entry (13 per cent).17 Table 20 indicates the basis of admission by year of admission. Over the last five years, university transfer for students with some college experience has overtaken BC Grade 12 as the largest basis of admission. For the previous five year period from 1998/99 to 2002/03, BC Grade 12 was consistently the top basis of admission. Table 20: Distribution of Students with College Experience Admitted to SFU by Admission Year and Basis of Admission
Basis of Admission 2003/04 2004/05 2005/06 2006/07 2007/08 Total 5-Yr %University Transfer 35 76 63 98 82 354 30.3%BC Grade 12 57 52 42 59 56 266 22.8%Mature Student 28 44 38 34 22 166 14.2Special Entry 6 28 23 34 56 147 12.6%Transfer from a Technical Program 21 19 10 14 18 82 7.0Foreign Equivalent of Cdn Grade 12/13 21 19 14 9 10 73 6.3%Transfer from a College outside BC 8 13 6 9 17 53 4.5%University Degree 3 6 <5 <5 <5 12 1.0%Canadian Grade 12 <5 <5 <5 - - 5 0.4%Transfer from a CEGEP <5 <5 - <5 <5 5 0.4%Unspecified - <5 - <5 <5 <5 0.3%Visiting Student - - - <5 - <5 0.1%Total 181 260 200 261 265 1,167 100%
%
%
Note: Excludes students admitted to SFU on the basis of 'BC College Transfer'.
17 For more information on the different categories of admissions to SFU, please refer to Basis of Admission in Definitions in Appendix C.

Page 40
Average Admission GPA The average admission GPA of SFU students with some college experience was 2.99, that is 0.08 grade point higher than the average BC College transfer students to SFU at 2.91. Compared to students with college experience at SFU during the previous five-year period, the admission GPA has decreased (2.99 versus 3.13). Of all the bases of admission of students with college experience, students admitted on the basis of Foreign Equivalent of Canadian Grade 12/13 had the highest 5-year average admission GPA of 3.38 while students admitted under Special Entry had the lowest average at 2.51 (see Table 21). Table 21: Average Admission GPA by Admission Year and Basis of Admission for Students with College Experience Admitted to SFU Basis of Admission N 2003/04 2004/05 2005/06 2006/07 2007/08 5Yr AvgUniversity Transfer 354 3.28 3.00 2.98 2.89 2.81 2.95BC Grade 12 266 3.30 3.18 3.09 2.98 2.96 3.10Mature Student 166 3.12 2.84 3.09 2.94 2.79 2.96Special Entry 147 2.65 2.53 2.70 2.51 2.39 2.51Transfer from a Technical Program 82 3.48 3.31 3.12 3.14 2.98 3.24Foreign Equivalent of Cdn Grade 12/13 73 3.65 3.31 3.33 3.20 3.16 3.38Transfer from a College outside BC 53 3.60 3.05 3.17 2.62 3.16 3.11University Degree 12 3.21 3.23 2.48 2.30 3.33 3.09Total with College Experience 1,167 3.32 3.01 3.04 2.88 2.80 2.99 Notes: a) Excludes students admitted to SFU on the basis of 'BC College Transfer'. b) Admission GPA average excludes students with no admission GPA. c) The average Admission GPA by basis of admission is based on transferable course work associated with each basis of admission. d) Table includes only Basis of Admission with N ≥ 5
Credits Transferred to SFU Of all the SFU students with college experience, 53 per cent of them transferred less than one year of credit (up to 30 credits); 46 per cent transferred between one and two years of credit (31 to 60 credits); and the remaining 1 per cent, more than two years of credit to SFU. The 1,167 students with college experience brought in approximately 38,378 credits to SFU while the 10,930 BC College transfer students brought about 531,344 credits. Note that not all credits transferred to SFU by these groups come from BC Colleges. In fact, about 72 per cent of the credits brought in by college experience students were from BC Colleges versus 98 per cent for BC College transfer students. For further detailed information on credits transferred of students by college and region, please refer to Tables 22a and 22b.

Page 41
Table 22a: Distribution of Student Transfer Credits at Time of Admission to SFU (for Students with College Experience Admitted to SFU from 2003/04 to 2007/08)
Non-Lower Mainland < 9 9-15 16-21 22-30 31-45 46-60 > 60 TotalNorthern BC/Yukon 6 <5 <5 <5 6 23 <5 47
College of New Caledonia <5 - <5 <5 <5 9 - 15Northern Lights College - <5 <5 <5 <5 <5 - 7Northwest Community College <5 - <5 <5 - 11 <5 20Yukon College <5 - - - <5 <5 5
Interior/Kootenays 10 11 12 18 14 26 <5 92College of the Rockies <5 <5 <5 <5 - <5 - 6Nicola Valley Institute of Technology <5 - - - - - - <5Okanagan College <5 <5 <5 5 <5 12 - 25Selkirk College <5 <5 <5 <5 <5 - - 11Thompson Rivers University <5 7 6 9 9 13 <5 48
Vancouver Island 9 15 7 12 6 25 <5 75Camosun College <5 7 <5 10 <5 15 <5 40Malaspina University College 5 6 <5 <5 4 10 - 30North Island College <5 <5 - - <5 - - 5
Total Non-Lower Mainland 25 27 23 34 26 74 5 214
Lower MainlandPublic 105 160 73 105 106 298 12 859
BC Institute of Technology - <5 6 <5 <5 16 <5 31Capilano College 15 25 12 19 19 46 <5 137Douglas College 32 48 16 26 15 86 <5 225Emily Carr Institute of Art and Design - - - - <5 - - <5Institute of Indigenous Government - <5 - - <5 <5 - 6Kwantlen University College 29 37 15 23 26 63 5 198Langara College 22 34 15 24 31 79 <5 207University College of the Fraser Valley 7 14 9 9 8 6 <5 54
Private 16 17 13 16 13 18 <5 94Columbia College <5 6 4 4 6 9 <5 32Coquitlam College 12 9 6 10 7 9 - 53Corpus Christi College <5 <5 <5 - - - - <5Fraser International College - - <5 <5 - - - <5Native Education Centre <5 <5 <5 - - - - <5
Total Lower Mainland 121 177 86 121 119 316 13 953Grand Total 146 204 109 155 145 390 18 1,167 Table 22b: Percent Distribution of Student Transfer Credits at Time of Admission to SFU (for Students with College Experience Admitted to SFU from 2003/04 to 2007/08)
< 9 9-15 16-21 22-30 31-45 46-60 > 60 TotalNon-Lower Mainland 11.7% 12.6% 10.7% 15.9% 12.1% 34.6% 2.3% 100.0%
Northern BC/Yukon 12.8% 2.1% 8.5% 8.5% 12.8% 48.9% 6.4% 100.0%Interior/Kootenays 10.9% 12.0% 13.0% 19.6% 15.2% 28.3% 1.1% 100.0%Vancouver Island 12.0% 20.0% 9.3% 16.0% 8.0% 33.3% 1.3% 100.0%
Lower Mainland 12.7% 18.6% 9.0% 12.7% 12.5% 33.2% 1.4% 100.0%Public 12.2% 18.6% 8.5% 12.2% 12.3% 34.7% 1.4% 100.0%Private 17.0% 18.1% 13.8% 17.0% 13.8% 19.1% 1.1% 100.0%
Grand Total 12.5% 17.5% 9.3% 13.3% 12.4% 33.4% 1.5% 100.0% Notes: a) Excludes students admitted to SFU on the basis of 'BC College Transfer'. b) Not all credits transferred by 'college experience' students come from BC colleges. Of all credits transferred, about 28 per cent of credits were transferred from institutions other than BC Colleges or Institutes.

Page 42
Age Upon admission to SFU, students with college experience are older, on average, than BC College transfer students (24.7 versus 22.7). During the previous five year period, the average age difference between these groups of students was slightly higher (25.6 versus 23.3). The higher average age of these students with college experience can be expected because approximately 14 per cent of them are admitted under the ‘Mature Student’ basis of admission.18 During the previous five-year period, ‘Mature Students’ constituted 20 per cent of college experience students admitted. The average age of students with college experience from Northern BC/Yukon is the highest and is approximately 7 years older than all college experience transfer students (32.1 versus 24.7). Compared to the previous five year period (30.1 versus 25.6), the average age gap has widened. See Tables 23a and 23b for further detailed information on the age distribution of students with college experience by college and region.
18 Mature students by definition are applicants, 23 years or older, who have attempted less than one year of postsecondary transferable course work, and who do not meet regular admission requirements. See Definitions in Appendix C.
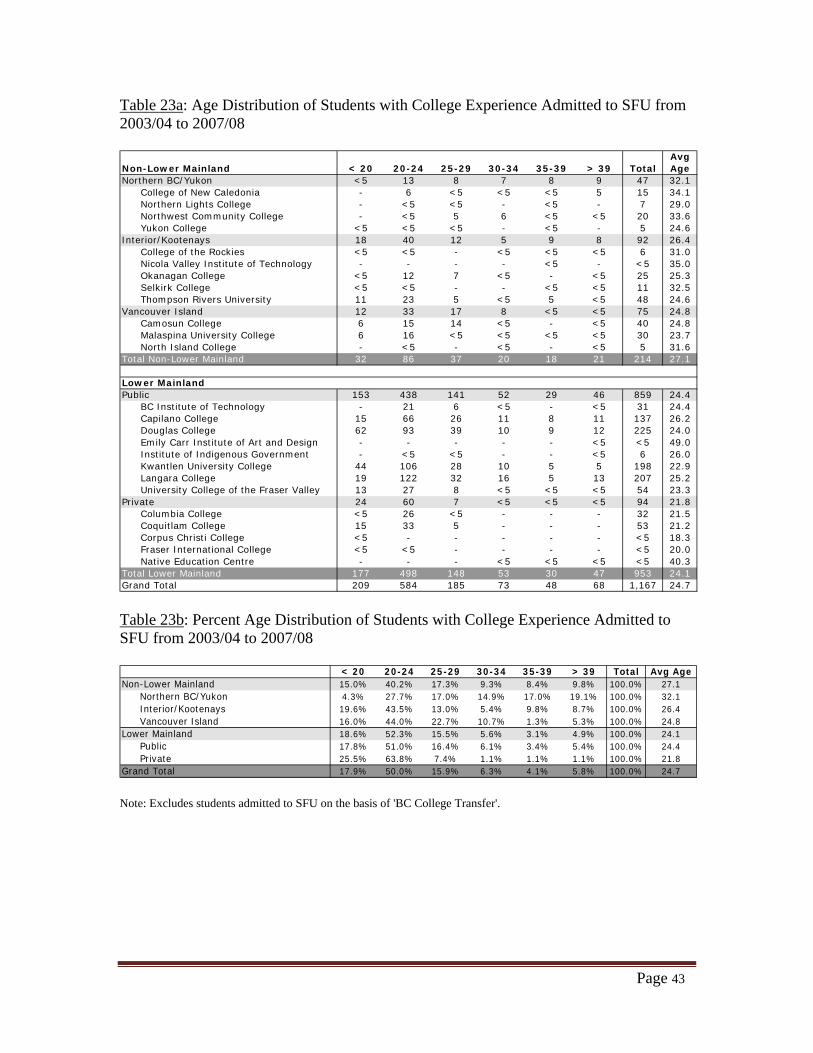
Page 43
Table 23a: Age Distribution of Students with College Experience Admitted to SFU from 2003/04 to 2007/08
AvgNon-Lower Mainland AgeNorthern BC/Yukon <5 13 8 7 8 9 47 32.1
College of New Caledonia - 6 <5 <5 <5 5 15 34.1Northern Lights College - <5 <5 - <5 - 7 29.0Northwest Community College - <5 5 6 <5 <5 20 33.6Yukon College <5 <5 <5 - <5 - 5 24.6
Interior/Kootenays 18 40 12 5 9 8 92 26.4College of the Rockies <5 <5 - <5 <5 <5 6 31.0Nicola Valley Institute of Technology - - - - <5 - <5 35.0Okanagan College <5 12 7 <5 - <5 25 25.3Selkirk College <5 <5 - - <5 <5 11 32.5Thompson Rivers University 11 23 5 <5 5 <5 48 24.6
Vancouver Island 12 33 17 8 <5 <5 75 24.8Camosun College 6 15 14 <5 - <5 40 24.8Malaspina University College 6 16 <5 <5 <5 <5 30 23.7North Island College - <5 - <5 - <5 5 31.6
Total Non-Lower Mainland 32 86 37 20 18 21 214 27.1
Lower MainlandPublic 153 438 141 52 29 46 859 24.4
BC Institute of Technology - 21 6 <5 - <5 31 24.4Capilano College 15 66 26 11 8 11 137 26.2Douglas College 62 93 39 10 9 12 225 24.0Emily Carr Institute of Art and Design - - - - - <5 <5 49.0Institute of Indigenous Government - <5 <5 - - <5 6 26.0Kwantlen University College 44 106 28 10 5 5 198 22.9Langara College 19 122 32 16 5 13 207 25.2University College of the Fraser Valley 13 27 8 <5 <5 <5 54 23.3
Private 24 60 7 <5 <5 <5 94 21.8Columbia College <5 26 <5 - - - 32 21.5Coquitlam College 15 33 5 - - - 53 21.2Corpus Christi College <5 - - - - - <5 18.3Fraser International College <5 <5 - - - - <5 20.0Native Education Centre - - - <5 <5 <5 <5 40.3
Total Lower Mainland 177 498 148 53 30 47 953 24.1Grand Total 209 584 185 73 48 68 1,167 24.7
30-3425-2920-24< 20 Total> 3935-39
Table 23b: Percent Age Distribution of Students with College Experience Admitted to SFU from 2003/04 to 2007/08
< 20 20-24 25-29 30-34 35-39 > 39 Total Avg AgeNon-Lower Mainland 15.0% 40.2% 17.3% 9.3% 8.4% 9.8% 100.0% 27.1
Northern BC/Yukon 4.3% 27.7% 17.0% 14.9% 17.0% 19.1% 100.0% 32.1Interior/Kootenays 19.6% 43.5% 13.0% 5.4% 9.8% 8.7% 100.0% 26.4Vancouver Island 16.0% 44.0% 22.7% 10.7% 1.3% 5.3% 100.0% 24.8
Lower Mainland 18.6% 52.3% 15.5% 5.6% 3.1% 4.9% 100.0% 24.1Public 17.8% 51.0% 16.4% 6.1% 3.4% 5.4% 100.0% 24.4Private 25.5% 63.8% 7.4% 1.1% 1.1% 1.1% 100.0% 21.8
Grand Total 17.9% 50.0% 15.9% 6.3% 4.1% 5.8% 100.0% 24.7 Note: Excludes students admitted to SFU on the basis of 'BC College Transfer'.

Page 44
Gender Of all new students with college experience admitted to SFU during the 2003/04 to 2007/08 period, approximately 57 per cent were female (59 per cent during the previous five-year period). This is slightly lower compared to BC College transfer students at 60 per cent. Overall, only 55 per cent of students from the Lower Mainland were female compared to 64 per cent from outside the Lower Mainland. The region with the highest percentage of female students was Vancouver Island with 67 per cent. For further detailed information on gender distribution by college and region, please see Table 24. Table 24: Gender Distribution of Students with College Experience Admitted to SFU from 2003/04 to 2007/08 Non-Lower Mainland Male Female Total Male % Female %Northern BC/Yukon 19 28 47 40% 60%
College of New Caledonia 6 9 15 40% 60%Northern Lights College <5 <5 7 43% 57%Northwest Community College 8 12 20 40% 60%Yukon College <5 <5 5 40% 60%
Interior/Kootenays 34 58 92 37% 63%College of the Rockies - 6 6 0% 100%Nicola Valley Institute of Technology <5 <5 <5 50% 50%Okanagan College 12 13 25 48% 52%Selkirk College <5 8 11 27% 73%Thompson Rivers University 18 30 48 38% 63%
Vancouver Island 25 50 75 33% 67%Camosun College 13 27 40 33% 68%Malaspina University College 10 20 30 33% 67%North Island College <5 <5 5 40% 60%
Total Non-Lower Mainland 78 136 214 36% 64%
Lower Mainland Male Female Total Male % Female %Public 374 485 859 44% 56%
BC Institute of Technology 22 9 31 71% 29%Capilano College 54 83 137 39% 61%Douglas College 84 141 225 37% 63%Emily Carr Institute of Art and Design - <5 <5 0% 100%Institute of Indigenous Government <5 <5 6 50% 50%Kwantlen University College 93 105 198 47% 53%Langara College 92 115 207 44% 56%University College of the Fraser Valley 26 28 54 48% 52%
Private 51 43 94 54% 46%Columbia College 16 16 32 50% 50%Coquitlam College 30 23 53 57% 43%Corpus Christi College <5 <5 <5 67% 33%Fraser International College <5 <5 <5 67% 33%Native Education Centre <5 <5 <5 33% 67%
Total Lower Mainland 425 528 953 45% 55%Total with College Experience 503 664 1,167 43% 57% Note: Excludes students admitted to SFU on the basis of 'BC College Transfer'.

Page 45

Page 46

Page 47
APPENDIX A
ADDITIONAL TABLES

Page 48
Table A1: Distribution of BC College Transfers by Approved Major Program (for BC College Transfer Students Admitted from 2003/04 to 2007/08)
Non-Lower Mainland BUS PSYC CRIM BGS ECON CMNS ENGL HIST GEOG POSCNorthern BC/Yukon 6.7% 3.3% 19.0% 23.8% 1.4% 0.0% 1.4% 2.9% 0.5% 0.0%College of New Caledonia 15.9% 6.8% 40.9% 6.8% 1.1% 0.0% 2.3% 4.5% 0.0% 0.0%Northern Lights College 0.0% 0.0% 0.0% 42.0% 0.0% 0.0% 1.1% 0.0% 0.0% 0.0%Northwest Community College 0.0% 0.0% 9.4% 21.9% 6.3% 0.0% 0.0% 6.3% 3.1% 0.0%Yukon College 0.0% 50.0% 50.0% 0.0% 0.0% 0.0% 0.0% 0.0% 0.0% 0.0%
Interior/Kootenays 11.2% 12.5% 7.2% 14.5% 2.6% 8.6% 6.6% 2.6% 1.3% 0.7%College of the Rockies 12.5% 0.0% 25.0% 12.5% 6.3% 0.0% 6.3% 0.0% 0.0% 0.0%Nicola Valley Institute of Technology 0.0% 0.0% 0.0% 100.0% 0.0% 0.0% 0.0% 0.0% 0.0% 0.0%Okanagan College 11.1% 20.4% 7.4% 5.6% 1.9% 9.3% 11.1% 0.0% 1.9% 0.0%Selkirk College 3.8% 11.5% 3.8% 11.5% 3.8% 15.4% 11.5% 11.5% 0.0% 0.0%Thompson Rivers University Open Learning 0.0% 25.0% 0.0% 0.0% 0.0% 50.0% 0.0% 0.0% 0.0% 0.0%Thompson Rivers University 18.6% 9.3% 4.7% 11.6% 2.3% 4.7% 0.0% 2.3% 2.3% 2.3%
Vancouver Island 19.2% 3.8% 31.2% 3.4% 2.1% 5.1% 3.0% 1.7% 1.3% 1.7%Camosun College 6.8% 4.2% 47.5% 2.5% 0.8% 5.9% 2.5% 1.7% 0.8% 1.7%Malaspina University College 37.0% 3.0% 17.0% 3.0% 4.0% 2.0% 2.0% 1.0% 2.0% 1.0%North Island College 0.0% 6.3% 0.0% 12.5% 0.0% 18.8% 12.5% 6.3% 0.0% 6.3%
Total Non-Lower Mainland 12.8% 5.9% 20.8% 13.4% 2.0% 4.2% 3.4% 2.3% 1.0% 0.8%
Lower MainlandPublic 10.6% 11.2% 9.5% 7.1% 6.4% 5.6% 6.4% 5.9% 5.6% 5.0%Capilano College 11.2% 12.5% 4.7% 6.2% 5.3% 6.8% 9.0% 4.3% 5.5% 6.1%Douglas College 10.2% 10.8% 13.0% 8.1% 4.3% 3.8% 5.9% 7.4% 5.2% 3.8%Emily Carr Institute of Art and Design 0.0% 100.0% 0.0% 0.0% 0.0% 0.0% 0.0% 0.0% 0.0% 0.0%Institute of Indigenous Government 0.0% 0.0% 28.6% 57.1% 0.0% 0.0% 0.0% 0.0% 0.0% 0.0%Kwantlen University College 12.7% 12.6% 15.3% 6.5% 7.1% 3.7% 5.3% 5.6% 5.2% 3.5%Langara College 8.6% 10.1% 3.1% 7.1% 10.1% 7.3% 6.2% 5.9% 6.6% 7.0%University College of the Fraser Valley 6.7% 3.8% 1.9% 5.2% 1.0% 19.5% 6.7% 4.8% 5.2% 7.6%
Private 33.0% 5.1% 0.4% 4.5% 22.8% 10.5% 0.4% 0.4% 0.4% 0.6%Columbia College 31.6% 6.8% 0.0% 4.9% 17.3% 15.4% 0.4% 0.0% 0.0% 0.4%Coquitlam College 30.2% 3.4% 0.9% 4.7% 32.3% 6.4% 0.4% 0.0% 0.9% 0.4%Corpus Christi College 14.3% 14.3% 0.0% 0.0% 0.0% 0.0% 0.0% 28.6% 0.0% 14.3%Fraser International College 76.9% 0.0% 0.0% 0.0% 0.0% 0.0% 0.0% 0.0% 0.0% 0.0%
Total Lower Mainland 12.1% 10.8% 8.9% 6.9% 7.6% 5.9% 6.0% 5.5% 5.2% 4.7%Grand Total 12.2% 10.5% 9.7% 7.4% 7.2% 5.8% 5.8% 5.3% 4.9% 4.4% Notes: a) For students who have graduated, all completed honors and majors in their first degree are reported. b) For students who have not yet graduated, all approved honors or majors in progress are reported. c) Students without an approved honors or majors program are excluded. d) An education student is defined as a student who has completed or is pursuing a Bachelor of Education (B.Ed.) as a degree goal or is enrolled in the Professional Development Program (PDP) program. e) A General Studies student is defined as a student who has completed or is pursuing a Bachelor of General Studies (BGS) in either Applied Sciences or Arts & Social Sciences. f) A student with more than one completed/approved program is counted once under each program.

Page 49
Table A1 (Cont.) Distribution of BC College Transfers by Approved Major Program (for BC College Transfer Students Admitted from 2003/04 to 2007/08) EDUC SOCI BISC CMPT ARCH ANTH MBB OTHER Total Non-Lower Mainland34.3% 0.5% 0.0% 1.0% 0.0% 0.0% 1.0% 4.3% 210 Northern BC/Yukon10.2% 1.1% 0.0% 2.3% 0.0% 0.0% 2.3% 5.7% 88 College of New Caledonia54.5% 0.0% 0.0% 0.0% 0.0% 0.0% 0.0% 2.3% 88 Northern Lights College46.9% 0.0% 0.0% 0.0% 0.0% 0.0% 0.0% 6.3% 32 Northwest Community College0.0% 0.0% 0.0% 0.0% 0.0% 0.0% 0.0% 0.0% <5 Yukon College5.9% 5.3% 2.0% 2.6% 4.6% 1.3% 0.7% 9.9% 152 Interior/Kootenays0.0% 0.0% 12.5% 0.0% 12.5% 0.0% 0.0% 12.5% 16 College of the Rockies0.0% 0.0% 0.0% 0.0% 0.0% 0.0% 0.0% 0.0% 9 Nicola Valley Institute of Technology11.1% 3.7% 0.0% 0.0% 5.6% 1.9% 0.0% 9.3% 54 Okanagan College0.0% 3.8% 0.0% 7.7% 0.0% 0.0% 3.8% 11.5% 26 Selkirk College0.0% 25.0% 0.0% 0.0% 0.0% 0.0% 0.0% 0.0% <5 Thompson Rivers University Open Learning7.0% 9.3% 2.3% 4.7% 4.7% 2.3% 0.0% 11.6% 43 Thompson Rivers University3.8% 1.7% 2.6% 1.3% 1.3% 2.1% 1.3% 13.2% 234 Vancouver Island5.1% 1.7% 1.7% 1.7% 2.5% 2.5% 0.8% 9.3% 118 Camosun College3.0% 2.0% 4.0% 0.0% 0.0% 2.0% 1.0% 16.0% 100 Malaspina University College0.0% 0.0% 0.0% 6.3% 0.0% 0.0% 6.3% 25.0% 16 North Island College15.1% 2.2% 1.5% 1.5% 1.7% 1.2% 1.0% 9.2% 596 Total Non-Lower Mainland
Lower Mainland3.1% 3.0% 2.5% 1.7% 1.4% 1.4% 1.1% 12.4% 7,191 Public2.9% 2.5% 1.7% 2.1% 2.4% 2.2% 0.7% 13.9% 1,390 Capilano College4.3% 3.0% 2.9% 2.1% 0.7% 1.4% 1.1% 12.1% 2,054 Douglas College0.0% 0.0% 0.0% 0.0% 0.0% 0.0% 0.0% 0.0% <5 Emily Carr Institute of Art and Design0.0% 0.0% 0.0% 0.0% 0.0% 0.0% 0.0% 14.3% 7 Institute of Indigenous Government2.2% 2.8% 3.7% 1.1% 1.5% 1.0% 1.4% 8.7% 1,930 Kwantlen University College1.6% 3.8% 1.3% 1.6% 1.6% 1.6% 1.1% 15.6% 1,599 Langara College13.3% 0.0% 3.8% 1.9% 0.5% 0.5% 1.9% 15.7% 210 University College of the Fraser Valley0.0% 0.4% 0.6% 6.0% 0.0% 0.0% 2.2% 12.9% 534 Private0.0% 0.4% 0.8% 6.0% 0.0% 0.0% 3.0% 13.2% 266 Columbia College0.0% 0.4% 0.4% 6.0% 0.0% 0.0% 1.3% 12.3% 235 Coquitlam College0.0% 0.0% 0.0% 0.0% 0.0% 0.0% 0.0% 28.6% 7 Corpus Christi College0.0% 0.0% 0.0% 7.7% 0.0% 0.0% 3.8% 11.5% 26 Fraser International College2.9% 2.8% 2.4% 2.0% 1.3% 1.3% 1.2% 12.4% 7,725 Total Lower Mainland3.8% 2.7% 2.3% 2.0% 1.4% 1.3% 1.2% 12.2% 8,321 Grand Total
Notes: a) For students who have graduated, all completed honors and majors in their first degree are reported. b) For students who have not yet graduated, all approved honors or majors in progress are reported. c) Students without an approved honors or majors program are excluded. d) An education student is defined as a student who has completed or is pursuing a Bachelor of Education (B.Ed.) as a degree goal or is enrolled in the Professional Development Program (PDP) program. e) A General Studies student is defined as a student who has completed or is pursuing a Bachelor of General Studies (BGS) in either Applied Sciences or Arts & Social Sciences. f) A student with more than one completed/approved program is counted once under each program.

Page 50

Page 51
Table A2: Comparison of Course Grades in Selected Courses by College and Region BC College Transfer vs. BC Grade 12 Direct Entry Students (for Students Admitted to SFU from 2003/04 to 2007/08)
Avg Adm Avg Crs # Avg Adm Avg Crs # Avg Adm Avg Crs #Non-Lower Mainland GPA Grade Stdnts GPA Grade Stdnts GPA Grade StdntsNorthern BC/Yukon 3.12 1.75 <5 3.60 3.17 <5 3.68 2.49 11College of New Caledonia 2.85 1.00 <5 3.36 2.33 <5 3.66 2.26 9Northern Lights College 2.56 2.00 <5 - - - - - -Northwest Community College 3.55 2.00 <5 3.85 4.00 <5 3.78 3.50 <5Yukon College - - - - - - - - -
Interior/Kootenays 3.09 3.42 <5 3.23 2.48 7 3.40 2.38 20College of the Rockies - - - 3.15 2.11 <5 3.90 3.50 <5Nicola Valley Institute of Technology - - - - - - - - -Okanagan College 3.28 3.34 <5 3.52 2.67 <5 3.81 2.61 6Selkirk College - - - - - - 2.77 1.53 5Thompson Rivers University Open Learning 2.90 3.50 <5 - - - - - -Thompson Rivers University - - - 3.22 2.78 <5 3.38 2.48 7
Vancouver Island 3.42 3.12 11 2.95 2.30 11 3.47 2.98 47Camosun College 3.21 2.73 5 2.86 1.84 <5 3.22 3.00 7Malaspina University College 3.72 3.50 <5 2.96 2.53 5 3.51 2.97 40North Island College 3.33 3.34 <5 3.08 2.67 <5 - - -
Total Non-Lower Mainland 3.29 2.90 19 3.11 2.45 20 3.48 2.76 78
Lower MainlandPublic 2.96 2.75 316 2.79 2.35 288 2.90 2.31 650BC Institute of Technology - - - 2.67 2.67 <5 2.71 2.33 <5Capilano College 3.01 2.81 50 2.73 2.52 52 2.82 2.21 101Douglas College 2.96 2.71 94 2.79 2.28 107 2.92 2.29 97Emily Carr Institute of Art and Design - - - - - - - - -Institute of Indigenous Government - - - - - - 3.25 1.33 <5Kwantlen University College 3.01 2.80 99 2.85 2.30 71 2.97 2.31 260Langara College 2.85 2.70 60 2.78 2.36 47 2.75 2.37 161University College of the Fraser Valley 2.90 2.74 13 2.84 2.37 10 3.24 2.59 27
Private 2.84 2.22 21 3.08 2.97 11 2.99 2.42 184Columbia College 2.87 2.44 9 2.99 2.75 8 2.92 2.10 48Coquitlam College 3.00 2.26 9 3.89 4.17 <5 2.99 2.42 118Corpus Christi College 2.29 1.45 <5 2.20 2.33 <5 3.93 4.33 <5Fraser International College - - - - - - 3.16 3.20 17
Total Lower Mainland 2.95 2.72 337 2.80 2.37 299 2.92 2.34 834Grand Total 2.97 2.73 356 2.82 2.37 319 2.97 2.37 912BC Grade 12 Direct Entry 83.2 2.72 1,458 85.2 2.84 925 83.7 2.72 2,136
Arch100 Bisc202 Buec232
Notes: a) Please note that in many cases above, the number of students from a particular institution who have received a grade in a particular SFU course is small and the corresponding course grade averages, although accurate, are not statistically reliable as an indicator for the college. b) Course Titles: Arch 100 - Ancient Peoples and Places Bisc 202 - Genetics Buec 232 - Data and Decisions I c) The proportion of students with a strong academic background (as evidenced by secondary school grades) varies among transfer and direct entry students. This table describes differences between the two groups but does not explain the cause of the differences. d) The Average Admission GPA of BC Grade 12 Direct Entry students are reported as a percentage. To convert to a 4,33 GPA scale, multiply the percentage by 0.0433.

Page 52
Table A2 (Cont.) Comparison of Course Grades in Selected Courses by College and Region BC College Transfer vs. BC Grade 12 Direct Entry Students (for Students Admitted to SFU from 2003/04 to 2007/08)
Avg Adm Avg Crs # Avg Adm Avg Crs # Avg Adm Avg Crs #Non-Lower Mainland GPA Grade Stdnts GPA Grade Stdnts GPA Grade StdntsNorthern BC/Yukon 3.72 3.44 <5 3.26 1.97 10 3.49 2.19 18College of New Caledonia 3.73 3.00 <5 3.36 1.97 10 3.54 2.26 17Northern Lights College - - - 3.13 - - 2.54 1.00 <5Northwest Community College 3.72 4.33 <5 3.24 - - - - -Yukon College - - - 3.28 - - - - -
Interior/Kootenays 3.19 2.87 5 3.09 2.30 10 3.45 2.63 17College of the Rockies 3.67 2.50 <5 3.11 2.00 <5 3.64 3.11 <5Nicola Valley Institute of Technology - - - 3.08 - - - - -Okanagan College 3.52 4.33 <5 3.02 2.06 6 3.68 2.90 7Selkirk College 2.73 2.67 <5 3.11 3.33 <5 3.00 2.34 <5Thompson Rivers University Open Learning - - - 2.96 - - - - -Thompson Rivers University 2.36 2.33 <5 3.16 2.67 <5 3.19 2.07 5
Vancouver Island 3.34 3.06 6 3.14 2.59 49 3.47 2.53 65Camosun College 3.11 2.00 <5 3.07 2.53 10 3.39 2.47 12Malaspina University College 3.39 3.27 5 3.20 2.61 39 3.48 2.55 53North Island College - - - 3.23 - - - - -
Total Non-Lower Mainland 3.37 3.07 14 3.16 2.46 69 3.47 2.49 100
Lower MainlandPublic 2.89 2.53 535 2.89 2.34 568 2.89 2.49 602BC Institute of Technology - - - 2.69 2.00 <5 2.71 3.33 <5Capilano College 2.93 2.62 79 2.92 2.25 114 2.99 2.55 173Douglas College 2.91 2.42 103 2.85 2.44 173 2.86 2.51 132Emily Carr Institute of Art and Design - - - 3.28 - - - - -Institute of Indigenous Government - - - 3.15 1.00 <5 3.20 1.67 <5Kwantlen University College 2.97 2.45 156 2.97 2.37 138 2.95 2.34 104Langara College 2.80 2.61 194 2.80 2.28 132 2.76 2.52 174University College of the Fraser Valley 3.00 2.45 <5 3.02 2.41 9 3.17 2.49 17
Private 2.97 2.60 148 2.96 2.51 106 3.12 2.41 111Columbia College 2.95 2.57 47 2.93 2.44 58 3.03 2.18 32Coquitlam College 2.98 2.61 101 3.02 2.54 39 3.16 2.46 64Corpus Christi College - - - 2.62 3.67 <5 3.24 2.67 <5Fraser International College - - - 2.87 2.75 8 3.15 2.72 13
Total Lower Mainland 2.91 2.54 683 2.90 2.37 674 2.93 2.48 713Grand Total 2.92 2.55 697 2.91 2.38 743 2.99 2.48 813BC Grade 12 Direct Entry 80.3 2.67 226 85.6 2.56 1,111 84.2 2.74 2,401
Buec333 Bus207 Bus237
Notes: a) Please note that in many cases above, the number of students from a particular institution who have received a grade in a particular SFU course is small and the corresponding course grade averages, although accurate, are not statistically reliable as an indicator for the college. b) Course Titles: Buec 333 - Statistical Analysis of Economic Data Bus 207 - Managerial Economics Bus 237 - Introduction to Computers and Information Systems in Business c) The proportion of students with a strong academic background (as evidenced by secondary school grades) varies among transfer and direct entry students. This table describes differences between the two groups but does not explain the cause of the differences. d) The Average Admission GPA of BC Grade 12 Direct Entry students are reported as a percentage. To convert to a 4,33 GPA scale, multiply the percentage by 0.0433.

Page 53
Table A2 (Cont.) Comparison of Course Grades in Selected Courses by College and Region BC College Transfer vs. BC Grade 12 Direct Entry Students (for Students Admitted to SFU from 2003/04 to 2007/08)
Avg Adm Avg Crs # Avg Adm Avg Crs # Avg Adm Avg Crs #Non-Lower Mainland GPA Grade Stdnts GPA Grade Stdnts GPA Grade StdntsNorthern BC/Yukon 3.39 2.27 5 3.73 2.48 11 3.67 2.12 11College of New Caledonia 3.58 2.42 <5 3.73 2.48 11 3.67 2.12 11Northern Lights College - - - - - - - - -Northwest Community College 2.60 1.67 <5 - - - - - -Yukon College - - - - - - - - -
Interior/Kootenays 3.45 2.76 14 3.71 2.79 14 3.67 2.89 15College of the Rockies - - - 3.90 2.84 <5 3.90 2.84 <5Nicola Valley Institute of Technology - - - - - - - - -Okanagan College 3.63 2.87 8 3.79 2.53 5 3.81 3.50 6Selkirk College 3.06 2.00 <5 3.56 3.00 <5 3.56 3.00 <5Thompson Rivers University Open Learning - - - - - - - - -Thompson Rivers University 3.54 3.83 <5 3.60 2.95 6 3.48 2.28 6
Vancouver Island 3.48 2.57 52 3.63 2.98 36 3.60 2.57 41Camosun College 3.46 2.57 10 3.55 2.91 7 3.40 2.70 11Malaspina University College 3.48 2.57 42 3.64 3.00 29 3.67 2.52 30North Island College - - - - - - - - -
Total Non-Lower Mainland 3.47 2.59 71 3.66 2.85 61 3.63 2.57 67
Lower MainlandPublic 2.89 2.23 479 3.38 2.75 682 3.32 2.79 583BC Institute of Technology - - - - - - 2.71 3.33 <5Capilano College 2.88 2.33 116 3.40 2.68 133 3.35 2.84 132Douglas College 2.91 2.30 123 3.34 2.82 176 3.29 2.81 114Emily Carr Institute of Art and Design - - - - - - - - -Institute of Indigenous Government - - - - - - - - -Kwantlen University College 2.94 2.11 120 3.45 2.62 223 3.38 2.74 217Langara College 2.75 2.16 102 3.30 2.91 142 3.18 2.75 107University College of the Fraser Valley 3.21 2.22 18 3.44 3.25 8 3.41 3.31 12
Private 3.12 2.12 89 3.33 2.75 143 3.31 2.33 143Columbia College 3.15 2.26 39 3.30 2.77 76 3.27 2.30 76Coquitlam College 3.08 1.99 48 3.37 2.72 67 3.34 2.31 65Corpus Christi College 3.35 2.84 <5 - - - 3.93 4.00 <5Fraser International College - - - - - - 3.97 4.33 <5
Total Lower Mainland 2.92 2.21 568 3.37 2.75 825 3.32 2.70 726Grand Total 2.98 2.25 639 3.39 2.76 886 3.34 2.69 793BC Grade 12 Direct Entry 84.2 2.63 2,716 85.8 2.93 844 85.1 3.00 1,019
Bus343Bus251 Bus312
Notes: a) Please note that in many cases above, the number of students from a particular institution who have received a grade in a particular SFU course is small and the corresponding course grade averages, although accurate, are not statistically reliable as an indicator for the college. b) Course Titles: Bus 251 - Financial Accounting I Bus 312 - Introduction to Finance Bus 343 - Introduction to Marketing c) The proportion of students with a strong academic background (as evidenced by secondary school grades) varies among transfer and direct entry students. This table describes differences between the two groups but does not explain the cause of the differences. d) The Average Admission GPA of BC Grade 12 Direct Entry students are reported as a percentage. To convert to a 4,33 GPA scale, multiply the percentage by 0.0433.

Page 54
Table A2 (Cont.) Comparison of Course Grades in Selected Courses by College and Region BC College Transfer vs. BC Grade 12 Direct Entry Students (for Students Admitted to SFU from 2003/04 to 2007/08)
Avg Adm Avg Crs # Avg Adm Avg Crs # Avg Adm Avg Crs #Non-Lower Mainland GPA Grade Stdnts GPA Grade Stdnts GPA Grade StdntsNorthern BC/Yukon 3.24 1.00 <5 2.96 0.00 <5 3.47 2.58 <5College of New Caledonia 3.24 1.00 <5 2.84 0.00 <5 3.62 2.55 <5Northern Lights College - - - - - - - - -Northwest Community College - - - 3.20 0.00 <5 3.03 2.67 <5Yukon College - - - - - - - - -
Interior/Kootenays 3.45 3.33 <5 3.27 2.60 5 3.12 2.97 21College of the Rockies - - - 3.28 1.17 <5 - - -Nicola Valley Institute of Technology - - - - - - - - -Okanagan College 3.70 3.50 <5 3.21 3.50 <5 3.13 2.97 10Selkirk College - - - - - - 3.10 2.72 6Thompson Rivers University Open Learning - - - - - - - - -Thompson Rivers University 3.19 3.17 <5 3.36 3.67 <5 3.10 3.27 5
Vancouver Island 3.17 3.09 <5 2.98 2.96 9 3.26 2.65 21Camosun College 2.80 2.67 <5 2.53 2.50 <5 3.10 2.82 11Malaspina University College 3.15 3.00 <5 2.99 2.93 5 3.37 2.25 8North Island College 3.57 3.67 <5 3.39 3.50 <5 3.76 3.33 <5
Total Non-Lower Mainland 3.29 2.77 10 3.06 2.33 17 3.21 2.79 46
Lower MainlandPublic 2.84 2.16 130 2.84 2.54 324 2.87 2.80 810BC Institute of Technology - - - - - - - - -Capilano College 2.78 2.28 18 2.77 2.91 50 2.89 2.82 191Douglas College 2.75 1.98 45 2.92 2.50 99 2.86 2.78 189Emily Carr Institute of Art and Design - - - - - - 3.33 3.00 <5Institute of Indigenous Government - - - - - - - - -Kwantlen University College 2.91 2.24 28 2.85 2.60 99 2.92 2.87 205Langara College 2.90 2.23 35 2.73 2.25 66 2.81 2.73 218University College of the Fraser Valley 3.06 2.42 <5 3.03 2.43 10 3.10 2.50 6
Private 2.78 1.67 <5 3.25 2.86 17 2.93 2.57 24Columbia College - - - 3.02 2.79 8 2.72 2.52 9Coquitlam College 3.53 3.33 <5 3.46 2.93 9 3.08 2.64 14Corpus Christi College - - - - - - 2.62 2.00 <5Fraser International College 2.03 0.00 <5 - - - - - -
Total Lower Mainland 2.84 2.15 132 2.86 2.56 341 2.87 2.79 834Grand Total 2.87 2.19 142 2.87 2.55 358 2.89 2.79 880BC Grade 12 Direct Entry 84.1 2.54 3,337 85.2 2.79 1,522 83.0 2.78 2,001
Chem121 Chem281 Cmns110
Notes: a) Please note that in many cases above, the number of students from a particular institution who have received a grade in a particular SFU course is small and the corresponding course grade averages, although accurate, are not statistically reliable as an indicator for the college. b) Course Titles: Chem 121 - General Chemistry and Laboratory I Chem 281 - Organic Chemistry I Cmns 110 - Introduction to Communication Studies c) The proportion of students with a strong academic background (as evidenced by secondary school grades) varies among transfer and direct entry students. This table describes differences between the two groups but does not explain the cause of the differences. d) The Average Admission GPA of BC Grade 12 Direct Entry students are reported as a percentage. To convert to a 4,33 GPA scale, multiply the percentage by 0.0433.

Page 55
Table A2 (Cont.) Comparison of Course Grades in Selected Courses by College and Region BC College Transfer vs. BC Grade 12 Direct Entry Students (for Students Admitted to SFU from 2003/04 to 2007/08)
Avg Adm Avg Crs # Avg Adm Avg Crs # Avg Adm Avg Crs #Non-Lower Mainland GPA Grade Stdnts GPA Grade Stdnts GPA Grade StdntsNorthern BC/Yukon 4.02 3.00 <5 3.35 2.73 5 3.56 2.89 <5College of New Caledonia 4.02 3.00 <5 3.90 3.11 <5 3.71 2.67 <5Northern Lights College - - - 2.52 2.17 <5 - - -Northwest Community College - - - - - - 3.26 3.33 <5Yukon College - - - - - - - - -
Interior/Kootenays 2.85 2.42 <5 3.57 3.00 5 3.19 3.06 17College of the Rockies - - - 3.90 3.00 <5 3.09 2.67 <5Nicola Valley Institute of Technology - - - - - - - - -Okanagan College - - - 3.75 3.00 <5 2.99 3.15 9Selkirk College 2.70 2.17 <5 - - - 3.70 3.00 <5Thompson Rivers University Open Learning - - - - - - - - -Thompson Rivers University 3.01 2.67 <5 3.16 3.00 <5 3.35 3.00 5
Vancouver Island 3.07 1.72 6 3.42 2.57 14 3.29 2.83 10Camosun College 2.97 1.59 <5 3.98 4.00 <5 2.85 2.33 5Malaspina University College 3.15 0.00 <5 3.38 2.46 13 3.78 3.33 <5North Island College 3.39 4.00 <5 - - - 3.54 3.33 <5
Total Non-Lower Mainland 3.16 2.17 12 3.44 2.70 24 3.26 2.97 30
Lower MainlandPublic 2.89 2.57 146 2.97 2.64 451 2.82 2.82 468BC Institute of Technology - - - - - - - - -Capilano College 2.77 2.33 20 3.11 2.99 72 2.79 2.94 110Douglas College 2.94 2.39 37 2.84 2.40 88 2.87 2.87 100Emily Carr Institute of Art and Design - - - - - - - - -Institute of Indigenous Government - - - - - - 3.22 2.00 <5Kwantlen University College 3.06 2.48 28 3.07 2.58 139 2.93 2.78 96Langara College 2.82 2.78 57 2.86 2.68 139 2.72 2.74 150University College of the Fraser Valley 3.04 3.09 <5 3.31 2.64 13 2.91 2.76 11
Private 3.07 2.32 39 3.09 2.81 92 2.85 2.33 48Columbia College 3.04 2.32 24 3.10 2.83 48 2.71 2.03 24Coquitlam College 3.12 2.33 15 3.09 2.80 43 3.01 2.62 23Corpus Christi College - - - - - - 2.73 3.00 <5Fraser International College - - - 2.63 2.67 <5 - - -
Total Lower Mainland 2.93 2.52 185 2.99 2.67 543 2.82 2.78 516Grand Total 2.95 2.50 197 3.01 2.67 567 2.85 2.79 546BC Grade 12 Direct Entry 83.2 2.38 666 81.4 2.71 1,413 82.7 2.83 2,816
Cmpt150 Cmpt165 Crim101
Notes: a) Please note that in many cases above, the number of students from a particular institution who have received a grade in a particular SFU course is small and the corresponding course grade averages, although accurate, are not statistically reliable as an indicator for the college. b) Course Titles: Cmpt 150 - Introduction to Computer Design Cmpt 165 - Introduction to the Internet and the World Wide Web Crim 101 - Introduction to Criminology c) The proportion of students with a strong academic background (as evidenced by secondary school grades) varies among transfer and direct entry students. This table describes differences between the two groups but does not explain the cause of the differences. d) The Average Admission GPA of BC Grade 12 Direct Entry students are reported as a percentage. To convert to a 4,33 GPA scale, multiply the percentage by 0.0433.

Page 56
Table A2 (Cont.) Comparison of Course Grades in Selected Courses by College and Region BC College Transfer vs. BC Grade 12 Direct Entry Students (for Students Admitted to SFU from 2003/04 to 2007/08)
Avg Adm Avg Crs # Avg Adm Avg Crs # Avg Adm Avg Crs #Non-Lower Mainland GPA Grade Stdnts GPA Grade Stdnts GPA Grade StdntsNorthern BC/Yukon 3.50 3.05 33 3.48 3.25 38 3.88 2.83 <5College of New Caledonia 3.51 3.10 31 3.50 3.28 34 3.88 2.83 <5Northern Lights College - - - - - - - - -Northwest Community College 3.43 3.00 <5 3.02 3.17 <5 - - -Yukon College 3.33 1.67 <5 3.58 2.67 <5 - - -
Interior/Kootenays 3.25 3.00 9 3.22 3.40 10 3.24 2.41 14College of the Rockies 3.34 2.83 <5 3.34 3.75 <5 3.90 3.17 <5Nicola Valley Institute of Technology - - - - - - - - -Okanagan College 3.10 3.22 <5 3.10 3.22 <5 3.64 3.34 <5Selkirk College - - - - - - 2.53 1.00 <5Thompson Rivers University Open Learning - - - - - - - - -Thompson Rivers University 3.29 3.00 <5 3.20 3.11 <5 3.16 2.33 8
Vancouver Island 3.11 2.50 55 3.12 2.65 61 3.48 2.78 24Camosun College 3.13 2.59 46 3.15 2.74 48 3.21 2.67 <5Malaspina University College 3.02 2.07 9 3.00 2.31 13 3.53 2.80 20North Island College - - - - - - - - -
Total Non-Lower Mainland 3.26 2.74 97 3.26 2.92 109 3.42 2.65 40
Lower MainlandPublic 2.97 2.60 534 2.97 2.84 526 2.96 2.57 530BC Institute of Technology - - - - - - - - -Capilano College 2.96 2.66 53 2.97 2.89 64 3.04 2.44 103Douglas College 2.90 2.45 207 2.86 2.73 181 3.00 2.63 113Emily Carr Institute of Art and Design - - - - - - - - -Institute of Indigenous Government 3.43 0.00 <5 3.43 1.84 <5 - - -Kwantlen University College 3.06 2.76 233 3.07 2.93 244 2.99 2.52 115Langara College 2.84 2.41 37 2.80 2.86 33 2.87 2.61 190University College of the Fraser Valley 2.62 2.67 <5 2.58 1.84 <5 3.10 3.04 9
Private 2.89 2.33 <5 2.89 2.00 <5 2.93 2.33 158Columbia College - - - - - - 2.95 2.29 78Coquitlam College 2.89 2.33 <5 2.89 2.00 <5 2.91 2.32 72Corpus Christi College - - - - - - 2.78 2.00 <5Fraser International College - - - - - - 2.93 2.90 7
Total Lower Mainland 2.97 2.60 535 2.97 2.84 527 2.96 2.51 688Grand Total 3.02 2.62 632 3.02 2.86 636 2.98 2.52 728BC Grade 12 Direct Entry 82.2 2.89 172 82.0 3.09 183 82.5 2.84 496
Crim330Crim320 Econ210
Notes: a) Please note that in many cases above, the number of students from a particular institution who have received a grade in a particular SFU course is small and the corresponding course grade averages, although accurate, are not statistically reliable as an indicator for the college. b) Course Titles: Crim 320 - Quantitative Research Methods in Criminology Crim 330 - Criminal Procedure and Evidence Econ 210 - Money and Banking c) The proportion of students with a strong academic background (as evidenced by secondary school grades) varies among transfer and direct entry students. This table describes differences between the two groups but does not explain the cause of the differences. d) The Average Admission GPA of BC Grade 12 Direct Entry students are reported as a percentage. To convert to a 4,33 GPA scale, multiply the percentage by 0.0433.

Page 57
Table A2 (Cont.) Comparison of Course Grades in Selected Courses by College and Region BC College Transfer vs. BC Grade 12 Direct Entry Students (for Students Admitted to SFU from 2003/04 to 2007/08)
Avg Adm Avg Crs # Avg Adm Avg Crs # Avg Adm Avg Crs #Non-Lower Mainland GPA Grade Stdnts GPA Grade Stdnts GPA Grade StdntsNorthern BC/Yukon 3.73 3.00 6 3.69 3.22 6 3.07 3.25 49College of New Caledonia 3.70 2.58 <5 3.65 2.67 <5 3.02 2.67 <5Northern Lights College - - - - - - 3.06 3.34 41Northwest Community College 3.78 3.83 <5 3.78 4.33 <5 3.14 2.92 <5Yukon College - - - - - - - - -
Interior/Kootenays 3.27 2.90 7 3.26 2.80 5 2.95 3.18 19College of the Rockies 3.67 2.50 <5 3.67 2.84 <5 2.63 2.34 <5Nicola Valley Institute of Technology - - - - - - - - -Okanagan College 3.52 4.00 <5 3.52 4.33 <5 2.90 3.67 10Selkirk College 2.73 3.00 <5 - - - 3.19 3.00 <5Thompson Rivers University Open Learning - - - - - - - - -Thompson Rivers University 3.10 2.78 <5 2.73 2.00 <5 3.09 2.60 5
Vancouver Island 3.37 3.17 10 3.43 2.93 9 2.87 2.14 22Camosun College 2.92 3.33 <5 2.80 2.50 <5 2.81 2.19 12Malaspina University College 3.56 3.09 7 3.61 3.05 7 2.92 1.92 8North Island College - - - - - - 3.00 2.67 <5
Total Non-Lower Mainland 3.43 3.04 23 3.47 2.98 20 2.99 2.96 90
Lower MainlandPublic 2.95 2.58 682 2.94 2.57 574 2.86 2.58 1,125BC Institute of Technology - - - - - - - - -Capilano College 2.98 2.47 110 3.02 2.67 99 2.84 2.65 194Douglas College 2.93 2.44 123 2.92 2.52 101 2.82 2.52 393Emily Carr Institute of Art and Design - - - - - - - - -Institute of Indigenous Government - - - - - - 3.32 1.00 <5Kwantlen University College 3.02 2.56 202 2.99 2.62 172 2.97 2.66 316Langara College 2.86 2.71 237 2.83 2.50 194 2.75 2.46 204University College of the Fraser Valley 3.26 2.63 10 3.28 2.88 8 3.07 2.90 16
Private 2.99 2.79 179 3.00 2.72 160 2.88 2.31 18Columbia College 2.98 2.85 69 2.97 2.79 57 2.80 2.49 11Coquitlam College 3.01 2.75 110 3.02 2.69 103 3.07 2.22 6Corpus Christi College - - - - - - 2.62 1.00 <5Fraser International College - - - - - - - - -
Total Lower Mainland 2.96 2.62 861 2.95 2.61 734 2.86 2.57 1,143Grand Total 2.97 2.63 884 2.96 2.62 754 2.87 2.60 1,233BC Grade 12 Direct Entry 81.6 2.93 354 81.3 2.75 250 82.7 2.69 704
Educ220Econ301 Econ305
Notes: a) Please note that in many cases above, the number of students from a particular institution who have received a grade in a particular SFU course is small and the corresponding course grade averages, although accurate, are not statistically reliable as an indicator for the college. b) Course Titles: Econ 301 - Microeconomic Theory I: Competitive Behavior Econ 305 - Intermediate Macroeconomic Theory Educ 220 - Introduction to Educational Psychology c) The proportion of students with a strong academic background (as evidenced by secondary school grades) varies among transfer and direct entry students. This table describes differences between the two groups but does not explain the cause of the differences. d) The Average Admission GPA of BC Grade 12 Direct Entry students are reported as a percentage. To convert to a 4,33 GPA scale, multiply the percentage by 0.0433.

Page 58
Table A2 (Cont.) Comparison of Course Grades in Selected Courses by College and Region BC College Transfer vs. BC Grade 12 Direct Entry Students (for Students Admitted to SFU from 2003/04 to 2007/08)
Avg Adm Avg Crs # Avg Adm Avg Crs # Avg Adm Avg Crs #Non-Lower Mainland GPA Grade Stdnts GPA Grade Stdnts GPA Grade StdntsNorthern BC/Yukon 3.46 3.40 5 3.14 3.44 54 3.49 3.27 5College of New Caledonia 3.66 3.84 <5 3.53 3.53 5 3.41 3.08 <5Northern Lights College 3.52 3.34 <5 3.10 3.42 48 - - -Northwest Community College 2.95 2.67 <5 3.32 4.00 <5 3.83 4.00 <5Yukon College - - - - - - - - -
Interior/Kootenays 2.69 2.67 6 2.72 3.42 <5 3.04 3.00 <5College of the Rockies 2.23 3.00 <5 3.03 3.33 <5 3.83 2.67 <5Nicola Valley Institute of Technology - - - - - - - - -Okanagan College 2.78 2.50 <5 2.38 3.17 <5 2.97 2.67 <5Selkirk College 2.78 3.00 <5 - - - - - -Thompson Rivers University Open Learning - - - - - - - - -Thompson Rivers University - - - 3.11 4.00 <5 2.32 3.67 <5
Vancouver Island 2.64 3.33 <5 2.80 3.58 11 3.13 3.25 <5Camosun College 3.00 3.00 <5 2.78 3.42 <5 3.19 3.44 <5Malaspina University College - - - 2.74 3.73 5 2.94 2.67 <5North Island College 2.45 3.50 <5 3.00 3.50 <5 - - -
Total Non-Lower Mainland 2.95 3.07 14 3.06 3.46 69 3.26 3.20 12
Lower MainlandPublic 2.84 3.25 365 2.79 3.42 250 2.98 2.96 119BC Institute of Technology - - - - - - - - -Capilano College 2.86 3.23 63 2.80 3.52 30 3.18 2.76 17Douglas College 2.80 3.20 130 2.78 3.36 100 2.76 2.82 27Emily Carr Institute of Art and Design - - - - - - - - -Institute of Indigenous Government - - - - - - 2.72 0.00 <5Kwantlen University College 2.94 3.36 105 2.84 3.52 75 3.18 2.98 30Langara College 2.70 3.19 61 2.72 3.33 42 2.86 3.12 40University College of the Fraser Valley 3.21 3.00 6 2.95 3.22 <5 3.33 3.75 <5
Private 3.09 3.17 6 2.90 4.00 <5 2.79 2.45 <5Columbia College 3.60 3.67 <5 2.90 4.00 <5 2.80 2.67 <5Coquitlam College 2.99 3.07 5 - - - 2.79 2.34 <5Corpus Christi College - - - - - - - - -Fraser International College - - - - - - - - -
Total Lower Mainland 2.84 3.25 371 2.79 3.42 251 2.97 2.95 122Grand Total 2.85 3.24 385 2.85 3.43 320 3.00 2.97 134BC Grade 12 Direct Entry 81.6 3.28 287 82.5 3.56 169 85.6 3.18 459
Engl199Educ230 Educ240
Notes: a) Please note that in many cases above, the number of students from a particular institution who have received a grade in a particular SFU course is small and the corresponding course grade averages, although accurate, are not statistically reliable as an indicator for the college. b) Course Titles: Educ 230 - Introduction to Philosophy of Education Educ 240 - Social Issues in Education Engl 199 - Introduction to University Writing c) The proportion of students with a strong academic background (as evidenced by secondary school grades) varies among transfer and direct entry students. This table describes differences between the two groups but does not explain the cause of the differences. d) The Average Admission GPA of BC Grade 12 Direct Entry students are reported as a percentage. To convert to a 4,33 GPA scale, multiply the percentage by 0.0433.

Page 59
Table A2 (Cont.) Comparison of Course Grades in Selected Courses by College and Region BC College Transfer vs. BC Grade 12 Direct Entry Students (for Students Admitted to SFU from 2003/04 to 2007/08)
Avg Adm Avg Crs # Avg Adm Avg Crs # Avg Adm Avg Crs #Non-Lower Mainland GPA Grade Stdnts GPA Grade Stdnts GPA Grade StdntsNorthern BC/Yukon 3.03 2.11 9 4.02 3.00 <5 - - -College of New Caledonia 2.89 2.11 <5 4.02 3.00 <5 - - -Northern Lights College 3.27 2.55 <5 - - - - - -Northwest Community College 3.05 2.50 <5 - - - - - -Yukon College 2.68 0.00 <5 - - - - - -
Interior/Kootenays 3.10 2.95 12 2.64 1.33 <5 3.33 2.55 <5College of the Rockies - - - - - - - - -Nicola Valley Institute of Technology - - - - - - - - -Okanagan College 2.91 3.06 6 2.96 2.00 <5 3.33 2.55 <5Selkirk College 3.12 2.83 <5 - - - - - -Thompson Rivers University Open Learning - - - - - - - - -Thompson Rivers University 3.65 2.84 <5 2.00 0.00 <5 - - -
Vancouver Island 3.35 2.72 6 3.41 2.69 18 3.25 2.33 <5Camosun College 3.24 3.22 <5 3.21 3.11 <5 3.63 2.17 <5Malaspina University College 3.17 3.34 <5 3.45 2.57 14 - - -North Island College 4.02 0.00 <5 3.39 3.00 <5 2.88 2.50 <5
Total Non-Lower Mainland 3.13 2.62 27 3.33 2.52 22 3.29 2.43 7
Lower MainlandPublic 2.87 2.66 318 3.01 2.67 217 2.99 2.58 94BC Institute of Technology - - - - - - - - -Capilano College 2.84 2.57 91 3.08 2.97 50 2.97 2.46 16Douglas College 2.87 2.71 106 3.04 2.75 65 2.92 2.59 29Emily Carr Institute of Art and Design - - - - - - - - -Institute of Indigenous Government 2.67 2.00 <5 - - - - - -Kwantlen University College 2.94 2.77 62 3.14 2.52 54 3.12 2.80 23Langara College 2.79 2.55 50 2.76 2.43 47 2.94 2.46 22University College of the Fraser Valley 3.09 3.04 8 2.20 1.67 <5 3.12 2.42 <5
Private 3.22 1.22 <5 3.10 2.59 88 3.55 2.56 <5Columbia College - - - 3.02 2.67 46 3.54 3.00 <5Coquitlam College 3.62 1.84 <5 3.22 2.49 37 3.55 2.34 <5Corpus Christi College 2.40 0.00 <5 - - - - - -Fraser International College - - - 2.93 2.60 5 - - -
Total Lower Mainland 2.87 2.65 321 3.04 2.65 305 3.01 2.58 97Grand Total 2.89 2.65 348 3.06 2.64 327 3.03 2.57 104BC Grade 12 Direct Entry 84.5 2.91 300 82.4 2.82 351 83.8 2.75 317
Engl205 Fren120 Fren210
Notes: a) Please note that in many cases above, the number of students from a particular institution who have received a grade in a particular SFU course is small and the corresponding course grade averages, although accurate, are not statistically reliable as an indicator for the college. b) Course Titles: Engl 205 - Restoration and Eighteenth Century Literature Fren 120 - French for Beginners Fren 210 - Intermediate French I c) The proportion of students with a strong academic background (as evidenced by secondary school grades) varies among transfer and direct entry students. This table describes differences between the two groups but does not explain the cause of the differences. d) The Average Admission GPA of BC Grade 12 Direct Entry students are reported as a percentage. To convert to a 4,33 GPA scale, multiply the percentage by 0.0433.

Page 60
Table A2 (Cont.) Comparison of Course Grades in Selected Courses by College and Region BC College Transfer vs. BC Grade 12 Direct Entry Students (for Students Admitted to SFU from 2003/04 to 2007/08)
Avg Adm Avg Crs # Avg Adm Avg Crs # Avg Adm Avg Crs #Non-Lower Mainland GPA Grade Stdnts GPA Grade Stdnts GPA Grade StdntsNorthern BC/Yukon 3.08 2.58 <5 2.52 2.00 <5 3.22 2.67 <5College of New Caledonia 3.26 2.78 <5 - - - 3.07 2.67 <5Northern Lights College - - - - - - - - -Northwest Community College 2.52 2.00 <5 2.52 2.00 <5 3.37 2.67 <5Yukon College - - - - - - - - -
Interior/Kootenays 3.20 2.50 8 3.15 3.25 <5 - - -College of the Rockies 3.43 3.00 <5 - - - - - -Nicola Valley Institute of Technology - - - - - - - - -Okanagan College 3.62 3.34 <5 3.69 3.67 <5 - - -Selkirk College 3.23 2.17 <5 - - - - - -Thompson Rivers University Open Learning - - - - - - - - -Thompson Rivers University 2.83 2.00 <5 2.97 3.11 <5 - - -
Vancouver Island 2.93 2.27 10 3.19 3.08 <5 3.04 2.75 <5Camosun College 2.76 2.72 6 4.04 4.33 <5 2.98 2.34 <5Malaspina University College 3.20 1.58 <5 2.91 2.67 <5 2.35 2.67 <5North Island College - - - - - - 3.86 3.67 <5
Total Non-Lower Mainland 3.06 2.41 22 3.10 3.04 9 3.13 2.71 8
Lower MainlandPublic 2.89 2.42 371 2.84 2.67 341 2.85 2.33 183BC Institute of Technology - - - - - - - - -Capilano College 2.94 2.43 73 2.88 2.74 72 2.93 2.44 34Douglas College 2.86 2.47 130 2.81 2.65 101 2.78 2.18 66Emily Carr Institute of Art and Design - - - - - - - - -Institute of Indigenous Government 3.05 0.00 <5 - - - - - -Kwantlen University College 2.93 2.32 78 2.92 2.60 71 2.95 2.45 50Langara College 2.84 2.42 82 2.77 2.67 90 2.67 2.21 25University College of the Fraser Valley 2.91 2.76 7 2.91 2.90 7 3.09 2.63 8
Private 2.76 1.89 24 2.58 2.60 5 2.86 1.44 <5Columbia College 2.66 1.89 9 2.97 3.67 <5 3.33 0.00 <5Coquitlam College 2.87 1.87 13 2.45 2.11 <5 2.69 1.00 <5Corpus Christi College 2.55 1.67 <5 2.55 3.00 <5 2.55 3.33 <5Fraser International College 2.47 2.33 <5 - - - - - -
Total Lower Mainland 2.88 2.39 395 2.84 2.67 346 2.85 2.31 186Grand Total 2.89 2.39 417 2.84 2.68 355 2.86 2.33 194BC Grade 12 Direct Entry 83.5 2.76 1,153 82.9 2.89 184 84.0 2.54 445
Geog111 Geog221 Hist225
Notes: a) Please note that in many cases above, the number of students from a particular institution who have received a grade in a particular SFU course is small and the corresponding course grade averages, although accurate, are not statistically reliable as an indicator for the college. b) Course Titles: Geog 111 - Physical Geography Geog 221 - Economic Geography Hist 225 - 20th Century Europe c) The proportion of students with a strong academic background (as evidenced by secondary school grades) varies among transfer and direct entry students. This table describes differences between the two groups but does not explain the cause of the differences. d) The Average Admission GPA of BC Grade 12 Direct Entry students are reported as a percentage. To convert to a 4,33 GPA scale, multiply the percentage by 0.0433.

Page 61
Table A2 (Cont.) Comparison of Course Grades in Selected Courses by College and Region BC College Transfer vs. BC Grade 12 Direct Entry Students (for Students Admitted to SFU from 2003/04 to 2007/08)
Avg Adm Avg Crs # Avg Adm Avg Crs # Avg Adm Avg Crs #Non-Lower Mainland GPA Grade Stdnts GPA Grade Stdnts GPA Grade StdntsNorthern BC/Yukon 2.97 3.33 <5 3.36 3.13 8 3.31 2.17 8College of New Caledonia - - - 3.29 3.07 5 3.32 2.33 5Northern Lights College 2.97 3.33 <5 3.48 3.22 <5 3.29 1.89 <5Northwest Community College - - - - - - - - -Yukon College - - - - - - - - -
Interior/Kootenays 3.20 3.00 8 3.23 3.10 16 3.04 2.76 14College of the Rockies 3.25 2.83 <5 3.48 3.33 <5 2.93 2.34 <5Nicola Valley Institute of Technology - - - - - - - - -Okanagan College 3.10 3.00 <5 3.25 3.48 9 2.98 2.81 7Selkirk College 3.33 3.33 <5 3.24 3.00 <5 3.33 2.67 <5Thompson Rivers University Open Learning - - - - - - - - -Thompson Rivers University 3.40 3.00 <5 3.12 2.25 <5 3.36 3.50 <5
Vancouver Island 3.13 2.65 17 2.95 2.57 20 3.01 2.42 15Camosun College 3.01 2.90 10 2.98 2.80 10 3.02 2.50 6Malaspina University College 3.30 2.29 7 2.73 2.12 8 2.88 2.14 7North Island College - - - 3.71 3.17 <5 3.39 3.17 <5
Total Non-Lower Mainland 3.14 2.78 26 3.13 2.86 44 3.09 2.50 37
Lower MainlandPublic 2.94 3.03 229 2.85 2.56 733 2.85 1.99 341BC Institute of Technology - - - - - - - - -Capilano College 3.07 3.12 53 2.88 2.71 140 2.88 2.25 50Douglas College 2.86 2.98 77 2.83 2.54 242 2.74 1.83 108Emily Carr Institute of Art and Design - - - - - - - - -Institute of Indigenous Government 3.85 4.00 <5 - - - 2.72 0.00 <5Kwantlen University College 2.92 3.04 57 2.94 2.56 178 2.94 2.10 108Langara College 2.87 2.83 33 2.76 2.44 160 2.82 1.90 58University College of the Fraser Valley 3.13 3.50 8 2.98 2.77 13 3.03 2.02 16
Private 2.99 2.50 <5 3.19 2.55 17 2.85 0.87 5Columbia College 2.80 2.00 <5 3.32 2.63 9 2.74 0.00 <5Coquitlam College 3.61 3.00 <5 3.03 2.46 8 3.03 2.17 <5Corpus Christi College - - - - - - - - -Fraser International College - - - - - - - - -
Total Lower Mainland 2.94 3.02 233 2.86 2.56 750 2.85 1.98 346Grand Total 2.96 2.99 259 2.88 2.58 794 2.87 2.03 383BC Grade 12 Direct Entry 84.5 3.22 312 83.7 2.94 1,472 83.6 2.49 1,494
Hum230 Kin110 Kin142
Notes: a) Please note that in many cases above, the number of students from a particular institution who have received a grade in a particular SFU course is small and the corresponding course grade averages, although accurate, are not statistically reliable as an indicator for the college. b) Course Titles: Hum 230 - Introduction to Religious Studies Kin 110 - Human Nutrition: Current Issues Kin 142 - Introduction to Kinesiology c) The proportion of students with a strong academic background (as evidenced by secondary school grades) varies among transfer and direct entry students. This table describes differences between the two groups but does not explain the cause of the differences. d) The Average Admission GPA of BC Grade 12 Direct Entry students are reported as a percentage. To convert to a 4,33 GPA scale, multiply the percentage by 0.0433.

Page 62
Table A2 (Cont.) Comparison of Course Grades in Selected Courses by College and Region BC College Transfer vs. BC Grade 12 Direct Entry Students (for Students Admitted to SFU from 2003/04 to 2007/08)
Avg Adm Avg Crs # Avg Adm Avg Crs # Avg Adm Avg Crs #Non-Lower Mainland GPA Grade Stdnts GPA Grade Stdnts GPA Grade StdntsNorthern BC/Yukon 3.28 2.45 <5 3.44 3.00 <5 3.82 2.08 <5College of New Caledonia 3.65 2.84 <5 3.72 3.11 <5 3.79 1.44 <5Northern Lights College 2.56 1.67 <5 - - - 3.90 4.00 <5Northwest Community College - - - 2.60 2.67 <5 - - -Yukon College - - - - - - - - -
Interior/Kootenays 3.71 3.22 6 3.25 2.46 8 2.89 2.20 5College of the Rockies 3.90 2.67 <5 3.22 2.83 <5 - - -Nicola Valley Institute of Technology - - - - - - - - -Okanagan College 4.07 4.00 <5 3.61 2.78 <5 2.37 1.00 <5Selkirk College 3.27 3.00 <5 2.69 1.00 <5 2.78 3.00 <5Thompson Rivers University Open Learning - - - - - - - - -Thompson Rivers University 3.86 4.00 <5 3.35 3.67 <5 3.11 2.33 <5
Vancouver Island 3.34 2.14 14 3.49 2.80 18 3.24 2.44 <5Camosun College 3.06 2.00 <5 3.43 2.67 5 2.48 2.00 <5Malaspina University College 3.45 2.20 10 3.53 2.83 12 3.84 3.00 <5North Island College - - - 3.39 3.00 <5 3.39 2.33 <5
Total Non-Lower Mainland 3.43 2.46 23 3.42 2.73 30 3.29 2.22 12
Lower MainlandPublic 3.01 2.52 428 2.98 2.71 726 3.10 2.55 146BC Institute of Technology - - - - - - - - -Capilano College 3.03 2.57 82 3.12 2.72 99 3.04 2.47 33Douglas College 2.98 2.53 104 2.94 2.68 187 3.19 2.57 37Emily Carr Institute of Art and Design - - - - - - - - -Institute of Indigenous Government - - - 3.24 0.00 <5 - - -Kwantlen University College 3.13 2.50 122 3.04 2.70 233 3.18 2.65 23Langara College 2.88 2.49 111 2.87 2.79 193 2.99 2.62 44University College of the Fraser Valley 3.03 2.44 9 3.16 2.00 13 3.28 2.15 9
Private 2.97 2.20 115 2.95 2.68 265 3.21 2.58 37Columbia College 2.97 2.29 49 2.91 2.52 99 3.09 2.80 20Coquitlam College 2.99 2.13 64 2.98 2.75 158 3.34 2.31 17Corpus Christi College 2.55 2.33 <5 - - - - - -Fraser International College 2.33 2.33 <5 2.71 3.29 8 - - -
Total Lower Mainland 3.00 2.45 543 2.97 2.70 991 3.12 2.55 183Grand Total 3.02 2.45 566 2.99 2.70 1,021 3.13 2.53 195BC Grade 12 Direct Entry 82.2 2.47 1,173 82.3 2.80 1,830 86.9 2.86 261
Ling110 Macm316Ling100
Notes: a) Please note that in many cases above, the number of students from a particular institution who have received a grade in a particular SFU course is small and the corresponding course grade averages, although accurate, are not statistically reliable as an indicator for the college. b) Course Titles: Ling 100 - Communication and Language Ling 110 - The Wonder of Words Macm 316 - Numerical Analysis I c) The proportion of students with a strong academic background (as evidenced by secondary school grades) varies among transfer and direct entry students. This table describes differences between the two groups but does not explain the cause of the differences. d) The Average Admission GPA of BC Grade 12 Direct Entry students are reported as a percentage. To convert to a 4,33 GPA scale, multiply the percentage by 0.0433.

Page 63
Table A2 (Cont.) Comparison of Course Grades in Selected Courses by College and Region BC College Transfer vs. BC Grade 12 Direct Entry Students (for Students Admitted to SFU from 2003/04 to 2007/08)
Avg Adm Avg Crs # Avg Adm Avg Crs # Avg Adm Avg Crs #Non-Lower Mainland GPA Grade Stdnts GPA Grade Stdnts GPA Grade StdntsNorthern BC/Yukon 3.61 2.20 5 3.67 3.67 <5 3.56 1.50 <5College of New Caledonia 3.61 2.20 5 - - - 3.74 2.00 <5Northern Lights College - - - 3.67 3.67 <5 - - -Northwest Community College - - - - - - 3.03 0.00 <5Yukon College - - - - - - - - -
Interior/Kootenays 3.04 1.91 7 2.90 1.58 8 2.94 2.00 5College of the Rockies 2.45 1.00 <5 - - - - - -Nicola Valley Institute of Technology - - - - - - - - -Okanagan College 3.53 3.33 <5 2.76 1.17 <5 2.95 2.17 <5Selkirk College 2.65 1.67 <5 2.68 2.33 <5 - - -Thompson Rivers University Open Learning - - - - - - - - -Thompson Rivers University 3.16 1.84 <5 3.20 1.11 <5 2.94 1.89 <5
Vancouver Island 3.43 2.66 <5 3.39 2.69 13 2.98 2.21 8Camosun College 3.54 2.83 <5 3.00 2.40 5 2.87 2.11 6Malaspina University College - - - 3.67 3.05 7 3.31 2.50 <5North Island College 3.22 2.33 <5 3.39 1.67 <5 - - -
Total Non-Lower Mainland 3.31 2.16 15 3.22 2.33 22 3.11 1.98 17
Lower MainlandPublic 2.86 1.84 174 2.92 2.29 263 2.89 2.27 175BC Institute of Technology 2.67 0.00 <5 - - - - - -Capilano College 2.79 1.91 21 2.88 2.08 52 2.82 2.26 24Douglas College 2.88 1.76 75 3.00 2.40 65 3.01 2.39 56Emily Carr Institute of Art and Design - - - - - - - - -Institute of Indigenous Government - - - - - - - - -Kwantlen University College 2.94 2.02 37 3.00 2.47 50 2.97 2.34 36Langara College 2.73 1.78 30 2.82 2.26 87 2.75 2.04 52University College of the Fraser Valley 3.03 2.10 10 3.14 1.96 9 2.91 2.67 7
Private 2.77 1.80 15 3.08 2.31 45 3.11 2.75 43Columbia College 3.13 1.83 6 3.08 2.09 23 3.07 2.70 20Coquitlam College 2.59 1.88 8 3.06 2.46 21 3.15 2.80 23Corpus Christi College - - - - - - - - -Fraser International College 2.00 1.00 <5 3.60 4.33 <5 - - -
Total Lower Mainland 2.86 1.84 189 2.94 2.29 308 2.94 2.36 218Grand Total 2.89 1.86 204 2.96 2.29 330 2.95 2.34 235BC Grade 12 Direct Entry 84.8 2.49 1,892 84.9 2.48 1,205 86.2 2.66 654
Math152 Math232 Math251
Notes: a) Please note that in many cases above, the number of students from a particular institution who have received a grade in a particular SFU course is small and the corresponding course grade averages, although accurate, are not statistically reliable as an indicator for the college. b) Course Titles: Math 152 - Calculus II Math 232 - Applied Linear Algebra Math 251 - Calculus III c) The proportion of students with a strong academic background (as evidenced by secondary school grades) varies among transfer and direct entry students. This table describes differences between the two groups but does not explain the cause of the differences. d) The Average Admission GPA of BC Grade 12 Direct Entry students are reported as a percentage. To convert to a 4,33 GPA scale, multiply the percentage by 0.0433.

Page 64
Table A2 (Cont.) Comparison of Course Grades in Selected Courses by College and Region BC College Transfer vs. BC Grade 12 Direct Entry Students (for Students Admitted to SFU from 2003/04 to 2007/08)
Avg Adm Avg Crs # Avg Adm Avg Crs # Avg Adm Avg Crs #Non-Lower Mainland GPA Grade Stdnts GPA Grade Stdnts GPA Grade StdntsNorthern BC/Yukon 4.06 3.84 <5 3.19 1.00 <5 - - -College of New Caledonia 4.22 3.67 <5 3.19 1.50 <5 - - -Northern Lights College 3.90 4.00 <5 - - - - - -Northwest Community College - - - 3.20 0.00 <5 - - -Yukon College - - - - - - - - -
Interior/Kootenays 2.64 2.00 <5 3.34 2.33 <5 3.36 3.67 <5College of the Rockies - - - 3.48 1.67 <5 - - -Nicola Valley Institute of Technology - - - - - - - - -Okanagan College - - - 3.17 2.00 <5 - - -Selkirk College 2.78 2.33 <5 - - - - - -Thompson Rivers University Open Learning - - - - - - - - -Thompson Rivers University 2.57 1.84 <5 3.36 3.33 <5 3.36 3.67 <5
Vancouver Island 3.43 2.00 <5 2.90 2.44 13 3.04 2.10 7Camosun College 3.24 1.84 <5 2.43 1.56 <5 2.09 2.00 <5Malaspina University College 3.83 2.33 <5 2.87 2.28 7 3.03 1.67 <5North Island College - - - 3.44 3.67 <5 3.55 3.00 <5
Total Non-Lower Mainland 3.29 2.46 8 3.01 2.19 19 3.08 2.29 8
Lower MainlandPublic 3.10 2.48 110 2.83 2.21 271 2.89 2.32 220BC Institute of Technology - - - 2.67 1.67 <5 2.67 2.33 <5Capilano College 2.92 2.12 14 2.83 2.63 36 2.75 2.44 26Douglas College 3.17 2.56 25 2.84 2.13 120 2.96 2.34 89Emily Carr Institute of Art and Design - - - - - - - - -Institute of Indigenous Government - - - - - - - - -Kwantlen University College 3.12 2.31 27 2.87 2.29 53 2.91 2.29 69Langara College 3.06 2.64 38 2.73 2.14 51 2.76 2.20 33University College of the Fraser Valley 3.39 2.72 6 2.93 1.67 10 3.23 2.50 <5
Private 3.28 2.63 24 3.30 2.73 15 3.26 3.04 9Columbia College 3.19 2.85 9 3.01 2.44 9 3.09 2.81 7Coquitlam College 3.33 2.49 15 3.75 3.17 6 3.89 3.84 <5Corpus Christi College - - - - - - - - -Fraser International College - - - - - - - - -
Total Lower Mainland 3.13 2.51 134 2.85 2.24 286 2.90 2.35 229Grand Total 3.14 2.50 142 2.86 2.24 305 2.91 2.34 237BC Grade 12 Direct Entry 86.4 2.55 364 85.4 2.74 1,220 85.8 2.79 744
Math310 Mbb221 Mbb222
Notes: a) Please note that in many cases above, the number of students from a particular institution who have received a grade in a particular SFU course is small and the corresponding course grade averages, although accurate, are not statistically reliable as an indicator for the college. b) Course Titles: Math 310 - Introduction to Ordinary Differential Equations Mbb 221 - Cellular Biology and Biochemistry Mbb 222 - Molecular Biology and Biochemistry c) The proportion of students with a strong academic background (as evidenced by secondary school grades) varies among transfer and direct entry students. This table describes differences between the two groups but does not explain the cause of the differences. d) The Average Admission GPA of BC Grade 12 Direct Entry students are reported as a percentage. To convert to a 4,33 GPA scale, multiply the percentage by 0.0433.

Page 65
Table A2 (Cont.) Comparison of Course Grades in Selected Courses by College and Region BC College Transfer vs. BC Grade 12 Direct Entry Students (for Students Admitted to SFU from 2003/04 to 2007/08)
Avg Adm Avg Crs # Avg Adm Avg Crs # Avg Adm Avg Crs #Non-Lower Mainland GPA Grade Stdnts GPA Grade Stdnts GPA Grade StdntsNorthern BC/Yukon 3.70 2.61 6 3.37 2.67 <5 3.32 2.50 6College of New Caledonia 3.70 2.61 6 3.02 1.67 <5 3.34 2.53 5Northern Lights College - - - - - - - - -Northwest Community College - - - 3.72 3.67 <5 3.26 2.33 <5Yukon College - - - - - - - - -
Interior/Kootenays 3.48 2.73 20 3.29 2.50 8 3.15 2.27 15College of the Rockies 3.64 2.33 <5 3.59 2.78 <5 4.21 2.00 <5Nicola Valley Institute of Technology - - - - - - - - -Okanagan College 3.20 2.20 5 3.32 1.67 <5 3.04 2.61 6Selkirk College 3.54 2.56 <5 2.73 3.67 <5 3.07 1.84 <5Thompson Rivers University Open Learning - - - - - - - - -Thompson Rivers University 3.56 3.22 9 2.89 3.00 <5 3.10 2.11 6
Vancouver Island 3.32 2.30 21 3.27 3.02 13 3.47 2.76 21Camosun College 3.26 2.44 6 3.58 3.33 <5 3.43 3.20 10Malaspina University College 3.35 2.24 15 3.22 3.00 10 3.45 2.20 10North Island College - - - 3.38 3.00 <5 4.07 4.00 <5
Total Non-Lower Mainland 3.44 2.52 47 3.29 2.81 23 3.33 2.55 42
Lower MainlandPublic 2.97 2.16 328 2.91 2.63 367 2.89 2.52 529BC Institute of Technology - - - - - - - - -Capilano College 2.96 2.12 38 2.88 2.71 52 2.90 2.59 92Douglas College 2.95 2.04 88 2.92 2.54 110 2.82 2.44 128Emily Carr Institute of Art and Design - - - - - - - - -Institute of Indigenous Government 3.10 0.00 <5 3.31 1.67 <5 - - -Kwantlen University College 3.03 2.10 90 2.95 2.72 112 3.02 2.60 140Langara College 2.95 2.43 103 2.83 2.58 84 2.78 2.40 143University College of the Fraser Valley 2.76 1.84 6 3.05 2.84 8 3.17 2.95 26
Private 3.10 2.38 73 2.93 2.86 129 2.89 1.68 47Columbia College 3.22 2.51 22 2.87 2.96 37 2.89 1.73 30Coquitlam College 3.06 2.35 50 2.97 2.76 87 2.90 1.59 17Corpus Christi College 2.55 1.00 <5 - - - - - -Fraser International College - - - 2.69 3.73 5 - - -
Total Lower Mainland 2.99 2.20 401 2.92 2.69 496 2.89 2.45 576Grand Total 3.04 2.24 448 2.93 2.70 519 2.92 2.46 618BC Grade 12 Direct Entry 83.0 2.30 2,541 82.9 2.56 1,466 83.4 2.64 1,584
Philxx1 Phys100 Pol100
Notes: a) Please note that in many cases above, the number of students from a particular institution who have received a grade in a particular SFU course is small and the corresponding course grade averages, although accurate, are not statistically reliable as an indicator for the college. b) Course Titles: Phil xx1 - Critical Thinking Phys 100- Introduction to Physics Pol 100 - Introduction to Politics and Government c) The proportion of students with a strong academic background (as evidenced by secondary school grades) varies among transfer and direct entry students. This table describes differences between the two groups but does not explain the cause of the differences. d) The Average Admission GPA of BC Grade 12 Direct Entry students are reported as a percentage. To convert to a 4,33 GPA scale, multiply the percentage by 0.0433.
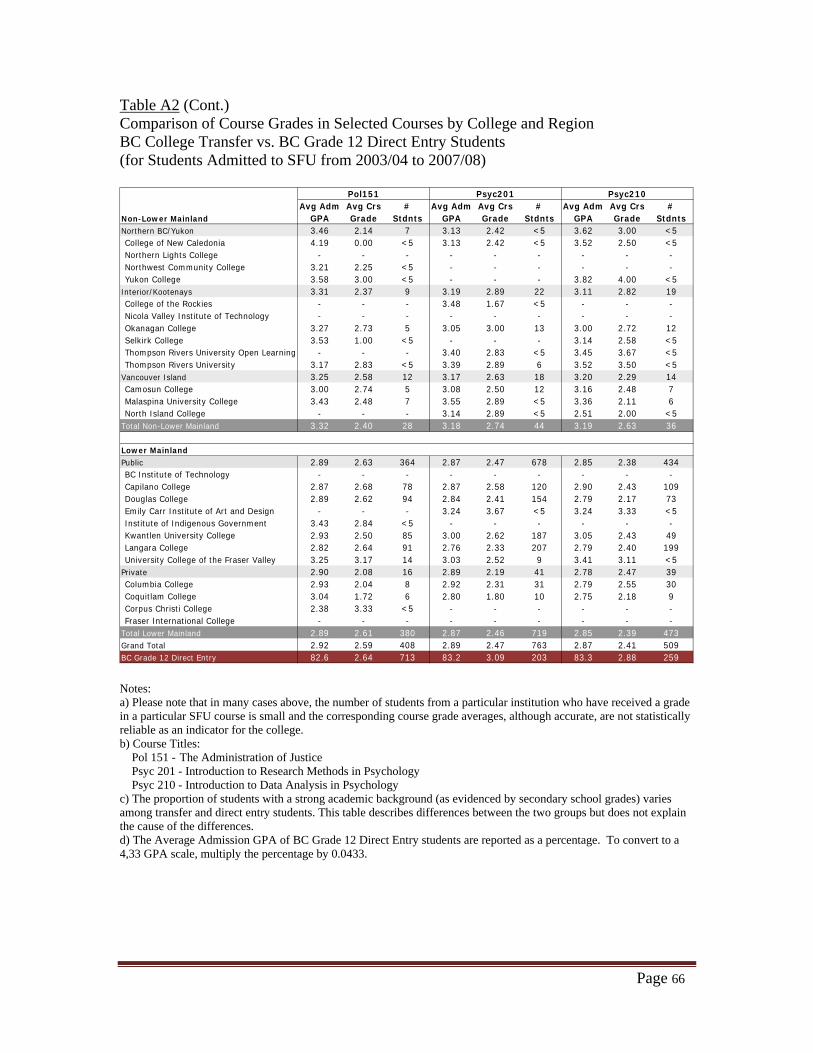
Page 66
Table A2 (Cont.) Comparison of Course Grades in Selected Courses by College and Region BC College Transfer vs. BC Grade 12 Direct Entry Students (for Students Admitted to SFU from 2003/04 to 2007/08)
Avg Adm Avg Crs # Avg Adm Avg Crs # Avg Adm Avg Crs #Non-Lower Mainland GPA Grade Stdnts GPA Grade Stdnts GPA Grade StdntsNorthern BC/Yukon 3.46 2.14 7 3.13 2.42 <5 3.62 3.00 <5College of New Caledonia 4.19 0.00 <5 3.13 2.42 <5 3.52 2.50 <5Northern Lights College - - - - - - - - -Northwest Community College 3.21 2.25 <5 - - - - - -Yukon College 3.58 3.00 <5 - - - 3.82 4.00 <5
Interior/Kootenays 3.31 2.37 9 3.19 2.89 22 3.11 2.82 19College of the Rockies - - - 3.48 1.67 <5 - - -Nicola Valley Institute of Technology - - - - - - - - -Okanagan College 3.27 2.73 5 3.05 3.00 13 3.00 2.72 12Selkirk College 3.53 1.00 <5 - - - 3.14 2.58 <5Thompson Rivers University Open Learning - - - 3.40 2.83 <5 3.45 3.67 <5Thompson Rivers University 3.17 2.83 <5 3.39 2.89 6 3.52 3.50 <5
Vancouver Island 3.25 2.58 12 3.17 2.63 18 3.20 2.29 14Camosun College 3.00 2.74 5 3.08 2.50 12 3.16 2.48 7Malaspina University College 3.43 2.48 7 3.55 2.89 <5 3.36 2.11 6North Island College - - - 3.14 2.89 <5 2.51 2.00 <5
Total Non-Lower Mainland 3.32 2.40 28 3.18 2.74 44 3.19 2.63 36
Lower MainlandPublic 2.89 2.63 364 2.87 2.47 678 2.85 2.38 434BC Institute of Technology - - - - - - - - -Capilano College 2.87 2.68 78 2.87 2.58 120 2.90 2.43 109Douglas College 2.89 2.62 94 2.84 2.41 154 2.79 2.17 73Emily Carr Institute of Art and Design - - - 3.24 3.67 <5 3.24 3.33 <5Institute of Indigenous Government 3.43 2.84 <5 - - - - - -Kwantlen University College 2.93 2.50 85 3.00 2.62 187 3.05 2.43 49Langara College 2.82 2.64 91 2.76 2.33 207 2.79 2.40 199University College of the Fraser Valley 3.25 3.17 14 3.03 2.52 9 3.41 3.11 <5
Private 2.90 2.08 16 2.89 2.19 41 2.78 2.47 39Columbia College 2.93 2.04 8 2.92 2.31 31 2.79 2.55 30Coquitlam College 3.04 1.72 6 2.80 1.80 10 2.75 2.18 9Corpus Christi College 2.38 3.33 <5 - - - - - -Fraser International College - - - - - - - - -
Total Lower Mainland 2.89 2.61 380 2.87 2.46 719 2.85 2.39 473Grand Total 2.92 2.59 408 2.89 2.47 763 2.87 2.41 509BC Grade 12 Direct Entry 82.6 2.64 713 83.2 3.09 203 83.3 2.88 259
Pol151 Psyc201 Psyc210
Notes: a) Please note that in many cases above, the number of students from a particular institution who have received a grade in a particular SFU course is small and the corresponding course grade averages, although accurate, are not statistically reliable as an indicator for the college. b) Course Titles: Pol 151 - The Administration of Justice Psyc 201 - Introduction to Research Methods in Psychology Psyc 210 - Introduction to Data Analysis in Psychology c) The proportion of students with a strong academic background (as evidenced by secondary school grades) varies among transfer and direct entry students. This table describes differences between the two groups but does not explain the cause of the differences. d) The Average Admission GPA of BC Grade 12 Direct Entry students are reported as a percentage. To convert to a 4,33 GPA scale, multiply the percentage by 0.0433.

Page 67
Table A2 (Cont.) Comparison of Course Grades in Selected Courses by College and Region BC College Transfer vs. BC Grade 12 Direct Entry Students (for Students Admitted to SFU from 2003/04 to 2007/08)
Avg Adm Avg Crs # Avg Adm Avg Crs # Avg Adm Avg Crs #Non-Lower Mainland GPA Grade Stdnts GPA Grade Stdnts GPA Grade StdntsNorthern BC/Yukon 3.32 2.74 13 2.93 2.14 7 3.27 3.48 7College of New Caledonia 3.39 2.97 12 2.98 2.33 6 3.18 3.50 6Northern Lights College 2.50 0.00 <5 - - - - - -Northwest Community College - - - 2.60 1.00 <5 - - -Yukon College - - - - - - 3.82 3.33 <5
Interior/Kootenays 3.14 3.04 16 3.15 3.17 18 3.30 3.22 17College of the Rockies - - - - - - 3.48 2.33 <5Nicola Valley Institute of Technology - - - - - - - - -Okanagan College 3.03 3.17 12 3.04 3.20 10 3.21 3.48 7Selkirk College 3.46 2.33 <5 3.14 2.83 <5 3.24 2.44 <5Thompson Rivers University Open Learning 3.36 2.00 <5 3.45 3.00 <5 3.45 3.67 <5Thompson Rivers University 3.49 3.17 <5 3.45 3.55 <5 3.39 3.40 5
Vancouver Island 3.13 2.50 20 3.25 2.82 17 3.18 3.20 10Camosun College 3.12 2.33 9 3.25 2.71 8 3.25 3.33 6Malaspina University College 3.16 2.63 9 3.31 3.26 5 3.08 3.00 <5North Island College 2.99 2.67 <5 3.16 2.50 <5 - - -
Total Non-Lower Mainland 3.18 2.74 49 3.15 2.86 42 3.26 3.26 34
Lower MainlandPublic 2.91 2.48 776 2.88 2.48 704 2.95 2.86 661BC Institute of Technology - - - - - - - - -Capilano College 2.90 2.70 161 2.90 2.58 181 2.99 3.08 137Douglas College 2.90 2.47 215 2.88 2.45 175 2.94 2.78 169Emily Carr Institute of Art and Design 3.24 3.67 <5 3.24 3.67 <5 3.24 3.67 <5Institute of Indigenous Government 3.60 1.67 <5 - - - - - -Kwantlen University College 2.97 2.42 233 2.95 2.47 148 3.02 2.85 203Langara College 2.82 2.38 150 2.79 2.39 186 2.82 2.76 147University College of the Fraser Valley 3.02 2.29 15 3.16 2.67 13 2.98 3.00 <5
Private 2.90 2.02 16 2.85 2.12 42 2.90 2.63 21Columbia College 2.97 2.33 11 2.85 2.10 30 2.95 2.62 16Coquitlam College 2.76 1.42 <5 2.75 2.00 10 2.76 2.67 5Corpus Christi College 2.62 1.00 <5 3.35 3.00 <5 - - -Fraser International College - - - - - - - - -
Total Lower Mainland 2.91 2.47 792 2.88 2.46 746 2.95 2.86 682Grand Total 2.92 2.49 841 2.90 2.48 788 2.96 2.88 716BC Grade 12 Direct Entry 82.9 2.84 320 83.8 3.12 333 82.4 3.18 120
Psyc385Psyc250 Psyc260
Notes: a) Please note that in many cases above, the number of students from a particular institution who have received a grade in a particular SFU course is small and the corresponding course grade averages, although accurate, are not statistically reliable as an indicator for the college. b) Course Titles: Psyc 250 - Introduction to Developmental Psychology Psyc 260 - Introduction to Social Psychology Psyc 385 - Evolutionary Psychology c) The proportion of students with a strong academic background (as evidenced by secondary school grades) varies among transfer and direct entry students. This table describes differences between the two groups but does not explain the cause of the differences. d) The Average Admission GPA of BC Grade 12 Direct Entry students are reported as a percentage. To convert to a 4,33 GPA scale, multiply the percentage by 0.0433.

Page 68
Table A2 (Cont.) Comparison of Course Grades in Selected Courses by College and Region BC College Transfer vs. BC Grade 12 Direct Entry Students (for Students Admitted to SFU from 2003/04 to 2007/08)
Avg Adm Avg Crs # Avg Adm Avg Crs # Avg Adm Avg Crs #Non-Lower Mainland GPA Grade Stdnts GPA Grade Stdnts GPA Grade StdntsNorthern BC/Yukon 3.03 3.22 <5 3.72 2.29 8 3.29 3.00 6College of New Caledonia 2.63 3.33 <5 3.85 2.39 6 3.44 3.17 <5Northern Lights College - - - 3.67 1.00 <5 2.72 3.00 <5Northwest Community College 3.23 3.17 <5 3.03 3.00 <5 3.26 2.33 <5Yukon College - - - - - - - - -
Interior/Kootenays 2.34 2.33 <5 3.20 1.93 9 2.92 2.67 <5College of the Rockies - - - - - - - - -Nicola Valley Institute of Technology - - - - - - - - -Okanagan College 2.51 3.00 <5 3.34 0.84 <5 2.75 2.83 <5Selkirk College 2.42 2.33 <5 2.78 2.00 <5 - - -Thompson Rivers University Open Learning 2.08 1.67 <5 - - - 2.78 2.00 <5Thompson Rivers University - - - 3.23 2.28 6 3.40 3.00 <5
Vancouver Island 3.07 2.95 7 3.27 1.49 11 3.16 3.03 13Camosun College 3.12 3.00 <5 3.13 1.40 5 3.05 3.11 <5Malaspina University College 3.02 2.92 <5 3.39 1.53 5 3.19 3.00 10North Island College - - - 3.39 1.67 <5 - - -
Total Non-Lower Mainland 2.89 2.87 13 3.38 1.86 28 3.15 2.96 23
Lower MainlandPublic 2.84 2.77 271 2.98 2.11 234 2.93 2.78 192BC Institute of Technology - - - - - - - - -Capilano College 2.87 2.86 50 3.00 1.94 41 3.05 2.70 22Douglas College 2.77 2.71 71 3.05 2.33 72 2.81 2.78 55Emily Carr Institute of Art and Design - - - - - - - - -Institute of Indigenous Government 2.72 2.00 <5 - - - 2.92 2.00 <5Kwantlen University College 2.88 2.73 59 3.08 1.99 37 3.01 2.86 67Langara College 2.84 2.77 84 2.85 2.06 79 2.90 2.74 41University College of the Fraser Valley 3.17 3.22 6 3.01 2.00 5 3.10 3.11 <5
Private 3.05 2.45 22 3.15 2.28 75 2.78 2.28 6Columbia College 3.15 2.37 8 3.07 2.08 32 2.81 2.27 5Coquitlam College 3.00 2.50 14 3.20 2.41 41 2.58 2.33 <5Corpus Christi College - - - - - - - - -Fraser International College - - - 3.35 2.83 <5 - - -
Total Lower Mainland 2.86 2.75 293 3.02 2.15 309 2.93 2.76 198Grand Total 2.86 2.75 306 3.05 2.13 337 2.95 2.78 221BC Grade 12 Direct Entry 82.7 2.83 283 85.8 2.53 733 82.7 2.77 256
Sa100 Stat270 Ws101
Notes: a) Please note that in many cases above, the number of students from a particular institution who have received a grade in a particular SFU course is small and the corresponding course grade averages, although accurate, are not statistically reliable as an indicator for the college. b) Course Titles: Sa 100 - Perspectives on Canadian Society Stat 270 - Introduction to Probability and Statistics Ws 101 - Introduction to Women's Issues in Canada c) The proportion of students with a strong academic background (as evidenced by secondary school grades) varies among transfer and direct entry students. This table describes differences between the two groups but does not explain the cause of the differences. d) The Average Admission GPA of BC Grade 12 Direct Entry students are reported as a percentage. To convert to a 4,33 GPA scale, multiply the percentage by 0.0433.

Page 69
Table A3: Comparison of Grades in 200- and 300- Level Courses Completed by BC College Transfer and BC Grade 12 Direct Entry Students (for Students Admitted to SFU from 2003/04 to 2007/08)
# of Adm. Avg % Grade # of Adm. Avg % GradeCourse Grades GPA Crse Grade <C Grades GPA Crse Grade <C
ARCH 201 141 2.94 2.39 22.7% 342 83.0 2.61 14.3%ARCH 226 103 2.93 2.59 19.4% 60 84.8 2.57 15.0%ARCH 272 123 3.03 2.71 10.6% 60 85.4 2.80 13.3%ARCH 273 105 2.99 2.79 9.5% 65 84.8 2.88 10.8%ARCH 332 140 2.98 2.96 7.1% 28 83.1 3.05 14.3%ARCH 336 117 2.96 2.51 18.0% 21 82.1 2.68 28.6%ARCH 372 147 3.03 2.86 9.5% 22 86.1 3.36 4.6%ARCH 373 141 3.00 2.85 15.6% 25 86.5 3.40 4.0%
BISC 202 349 2.81 2.24 29.8% 986 84.9 2.72 19.0%BISC 204 213 2.81 2.50 25.4% 501 84.2 2.76 14.4%BISC 300 144 2.92 2.88 13.9% 272 84.0 2.99 10.7%BISC 305 121 2.95 2.66 14.9% 173 85.3 2.85 8.1%BISC 316 158 2.97 2.47 18.4% 197 84.8 3.04 9.6%BISC 333 164 3.00 2.74 12.8% 254 84.2 2.91 12.2%
BUEC 232 1,024 2.95 2.22 28.1% 2,226 83.3 2.65 15.2%BUEC 280 393 2.93 2.38 21.1% 134 82.3 2.80 9.7%BUEC 333 775 2.91 2.35 25.3% 239 79.6 2.56 19.3%
BUS 207 835 3.25 2.18 32.2% 1,155 85.4 2.48 23.1%BUS 237 839 2.99 2.45 19.9% 2,435 84.0 2.72 10.8%BUS 251 711 2.98 2.12 31.9% 2,854 83.9 2.54 18.8%BUS 254 986 3.18 2.27 23.9% 1,618 85.1 2.62 14.8%BUS 272 644 2.99 2.39 18.2% 2,531 84.0 2.73 9.4%BUS 303 937 3.36 2.38 32.8% 802 85.6 2.84 14.0%BUS 312 949 3.38 2.64 18.7% 884 85.7 2.83 15.2%BUS 315 400 3.43 2.59 16.5% 289 85.4 2.85 11.4%BUS 316 396 3.44 2.79 10.4% 302 85.3 3.11 3.3%BUS 319 184 3.57 2.53 14.1% 74 86.2 3.23 1.4%BUS 320 368 3.44 2.67 16.9% 340 86.5 3.01 9.4%BUS 321 285 3.47 2.72 11.6% 246 86.4 3.02 8.1%BUS 322 172 3.33 2.46 17.4% 241 86.4 2.96 7.9%BUS 336 944 3.35 2.65 14.5% 805 85.5 2.87 11.1%BUS 343 817 3.34 2.64 16.5% 1,022 85.0 3.00 4.2%BUS 346 163 3.27 2.89 8.6% 164 85.0 3.19 3.7%BUS 347 182 3.28 3.01 2.8% 204 85.0 3.26 2.5%BUS 360 447 3.43 2.55 10.3% 268 84.8 2.92 3.7%BUS 360W 366 3.26 2.64 15.9% 522 86.1 2.99 4.6%BUS 362 130 3.33 2.97 3.9% 147 86.3 3.09 2.0%BUS 374 434 3.37 2.86 6.7% 401 85.6 3.17 2.7%BUS 381 515 3.35 2.83 6.6% 451 85.2 3.08 3.6%BUS 393 719 3.35 2.64 12.4% 728 85.5 2.97 5.2%
CHEM 215 159 2.89 2.19 29.6% 353 85.0 2.92 9.1%CHEM 281 397 2.86 2.36 24.4% 1,621 84.9 2.67 16.5%CHEM 282 293 2.87 2.23 31.7% 1,096 85.2 2.62 21.1%CHEM 286 168 2.88 2.56 20.2% 724 86.0 3.00 5.7%
BC College Transfer BC Grade 12 Direct Entry
Note: Courses shaded in gray are the courses in which BC College transfer students performed equally or outperformed Direct Entry BC Grade 12 students.

Page 70
Table A3 (Cont.) Comparison of Grades in 200- and 300-Level Courses Completed by BC College Transfer and BC Grade 12 Direct Entry Students (for Students Admitted to SFU from 2003/04 to 2007/08)
# of Adm. Avg % Grade # of Adm. Avg % GradeCourse Grades GPA Crse Grade <C Grades GPA Crse Grade <C
CMNS 210 115 2.85 2.86 2.6% 112 82.5 3.12 2.7%CMNS 220 242 2.86 2.89 5.0% 348 82.7 2.95 3.7%CMNS 221 331 2.92 2.85 4.8% 357 83.2 2.97 2.0%CMNS 223 161 2.95 2.59 8.1% 203 82.3 2.81 5.9%CMNS 230 217 2.86 2.69 9.7% 281 82.4 2.90 3.6%CMNS 240 165 2.94 2.68 9.1% 173 83.6 2.87 4.1%CMNS 253 204 2.90 2.97 3.4% 134 82.1 3.24 1.5%CMNS 253W 108 2.87 2.59 10.2% 179 82.8 2.80 5.0%CMNS 260 260 3.00 2.77 14.6% 292 82.6 3.07 9.6%CMNS 261 364 2.92 2.35 19.0% 354 82.8 2.49 14.7%CMNS 262 277 2.89 2.87 5.1% 269 82.7 3.00 3.7%CMNS 304 122 2.99 2.62 8.2% 44 80.8 2.55 18.2%CMNS 323 184 2.93 2.58 12.0% 106 83.0 2.87 5.7%CMNS 362 128 2.92 2.95 3.9% 81 80.5 2.98 7.4%CMNS 371 286 2.88 2.50 16.1% 163 81.4 2.81 9.8%CMNS 372 388 2.89 2.83 4.6% 246 81.7 2.85 4.9%CMNS 375 429 2.88 3.32 0.0% 233 80.4 3.52 0.0%
CMPT 225 126 2.90 1.99 37.3% 480 84.1 2.36 30.2%CMPT 250 156 3.08 1.93 37.2% 339 84.9 2.45 25.4%CMPT 275 127 3.09 2.47 19.7% 257 85.7 3.06 7.0%CMPT 300 140 3.10 2.30 30.7% 187 85.8 2.62 23.0%CMPT 307 124 3.16 1.87 49.2% 150 87.3 2.54 23.3%CMPT 320 154 3.08 2.38 19.5% 162 86.1 2.88 3.7%CMPT 354 131 3.14 2.70 9.2% 164 86.3 3.01 8.5%CMPT 363 114 3.09 3.01 1.8% 117 85.2 3.48 0.9%CMPT 371 122 3.10 2.57 19.7% 128 86.0 2.92 14.1%
CNS 210 175 2.87 2.83 10.3% 152 82.5 3.00 6.6%CNS 390 249 2.83 2.96 5.6% 52 78.4 2.97 7.7%CNS 391 129 2.78 2.99 4.7% 20 80.3 3.25 0.0%
CRIM 203 150 2.90 2.97 4.7% 126 82.4 3.06 4.0%CRIM 210 114 2.90 2.78 7.9% 183 82.1 2.98 3.8%CRIM 213 228 2.83 2.88 8.8% 232 82.4 3.14 2.6%CRIM 220 377 2.84 2.49 17.2% 560 82.1 2.68 12.0%CRIM 230 351 2.87 2.69 11.4% 472 82.5 2.98 6.6%CRIM 241 188 2.90 2.76 11.2% 194 81.5 2.87 5.7%CRIM 300 332 3.04 2.99 1.8% 15 81.4 3.11 0.0%CRIM 300W 396 2.97 2.89 5.3% 219 82.3 3.22 1.8%CRIM 311 114 2.92 2.86 6.1% 15 84.7 3.47 0.0%CRIM 312 336 2.96 2.95 8.0% 64 82.0 3.20 1.6%CRIM 314 220 2.96 3.06 7.7% 38 80.1 3.39 2.6%CRIM 315 671 2.95 3.22 3.4% 210 81.7 3.38 1.9%CRIM 320 671 3.00 2.49 16.4% 179 82.0 2.77 10.6%CRIM 321 652 3.02 2.82 5.4% 190 82.7 2.99 4.2%CRIM 330 646 3.01 2.82 8.2% 182 82.0 3.08 3.3%CRIM 332 319 3.00 3.09 2.2% 92 81.5 3.30 0.0%
BC College Transfer BC Grade 12 Direct Entry
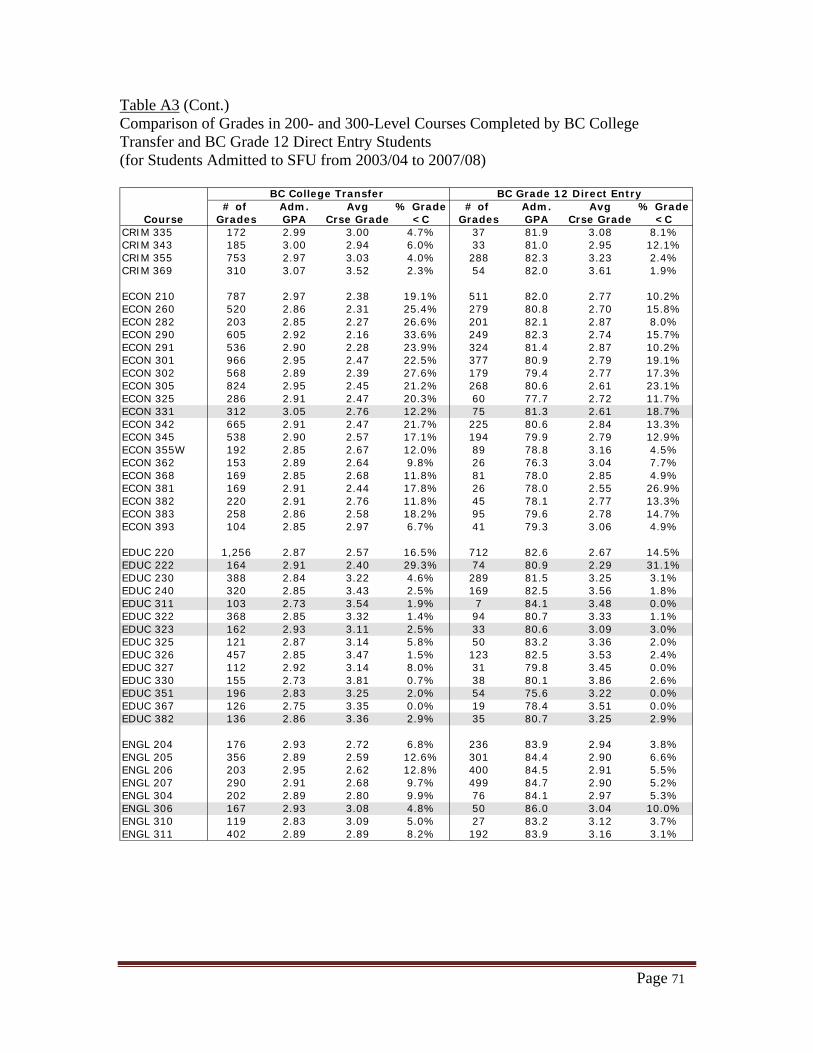
Page 71
Table A3 (Cont.) Comparison of Grades in 200- and 300-Level Courses Completed by BC College Transfer and BC Grade 12 Direct Entry Students (for Students Admitted to SFU from 2003/04 to 2007/08)
# of Adm. Avg % Grade # of Adm. Avg % GradeCourse Grades GPA Crse Grade <C Grades GPA Crse Grade <C
CRIM 335 172 2.99 3.00 4.7% 37 81.9 3.08 8.1%CRIM 343 185 3.00 2.94 6.0% 33 81.0 2.95 12.1%CRIM 355 753 2.97 3.03 4.0% 288 82.3 3.23 2.4%CRIM 369 310 3.07 3.52 2.3% 54 82.0 3.61 1.9%
ECON 210 787 2.97 2.38 19.1% 511 82.0 2.77 10.2%ECON 260 520 2.86 2.31 25.4% 279 80.8 2.70 15.8%ECON 282 203 2.85 2.27 26.6% 201 82.1 2.87 8.0%ECON 290 605 2.92 2.16 33.6% 249 82.3 2.74 15.7%ECON 291 536 2.90 2.28 23.9% 324 81.4 2.87 10.2%ECON 301 966 2.95 2.47 22.5% 377 80.9 2.79 19.1%ECON 302 568 2.89 2.39 27.6% 179 79.4 2.77 17.3%ECON 305 824 2.95 2.45 21.2% 268 80.6 2.61 23.1%ECON 325 286 2.91 2.47 20.3% 60 77.7 2.72 11.7%ECON 331 312 3.05 2.76 12.2% 75 81.3 2.61 18.7%ECON 342 665 2.91 2.47 21.7% 225 80.6 2.84 13.3%ECON 345 538 2.90 2.57 17.1% 194 79.9 2.79 12.9%ECON 355W 192 2.85 2.67 12.0% 89 78.8 3.16 4.5%ECON 362 153 2.89 2.64 9.8% 26 76.3 3.04 7.7%ECON 368 169 2.85 2.68 11.8% 81 78.0 2.85 4.9%ECON 381 169 2.91 2.44 17.8% 26 78.0 2.55 26.9%ECON 382 220 2.91 2.76 11.8% 45 78.1 2.77 13.3%ECON 383 258 2.86 2.58 18.2% 95 79.6 2.78 14.7%ECON 393 104 2.85 2.97 6.7% 41 79.3 3.06 4.9%
EDUC 220 1,256 2.87 2.57 16.5% 712 82.6 2.67 14.5%EDUC 222 164 2.91 2.40 29.3% 74 80.9 2.29 31.1%EDUC 230 388 2.84 3.22 4.6% 289 81.5 3.25 3.1%EDUC 240 320 2.85 3.43 2.5% 169 82.5 3.56 1.8%EDUC 311 103 2.73 3.54 1.9% 7 84.1 3.48 0.0%EDUC 322 368 2.85 3.32 1.4% 94 80.7 3.33 1.1%EDUC 323 162 2.93 3.11 2.5% 33 80.6 3.09 3.0%EDUC 325 121 2.87 3.14 5.8% 50 83.2 3.36 2.0%EDUC 326 457 2.85 3.47 1.5% 123 82.5 3.53 2.4%EDUC 327 112 2.92 3.14 8.0% 31 79.8 3.45 0.0%EDUC 330 155 2.73 3.81 0.7% 38 80.1 3.86 2.6%EDUC 351 196 2.83 3.25 2.0% 54 75.6 3.22 0.0%EDUC 367 126 2.75 3.35 0.0% 19 78.4 3.51 0.0%EDUC 382 136 2.86 3.36 2.9% 35 80.7 3.25 2.9%
ENGL 204 176 2.93 2.72 6.8% 236 83.9 2.94 3.8%ENGL 205 356 2.89 2.59 12.6% 301 84.4 2.90 6.6%ENGL 206 203 2.95 2.62 12.8% 400 84.5 2.91 5.5%ENGL 207 290 2.91 2.68 9.7% 499 84.7 2.90 5.2%ENGL 304 202 2.89 2.80 9.9% 76 84.1 2.97 5.3%ENGL 306 167 2.93 3.08 4.8% 50 86.0 3.04 10.0%ENGL 310 119 2.83 3.09 5.0% 27 83.2 3.12 3.7%ENGL 311 402 2.89 2.89 8.2% 192 83.9 3.16 3.1%
BC College Transfer BC Grade 12 Direct Entry

Page 72
Table A3 (Cont.) Comparison of Grades in 200- and 300-Level Courses Completed by BC College Transfer and BC Grade 12 Direct Entry Students (for Students Admitted to SFU from 2003/04 to 2007/08)
# of Adm. Avg % Grade # of Adm. Avg % GradeCourse Grades GPA Crse Grade <C Grades GPA Crse Grade <C
ENGL 313 241 2.90 3.03 5.0% 89 83.3 3.03 2.3%ENGL 325 156 2.90 2.82 8.3% 26 82.3 3.15 0.0%ENGL 327 137 2.88 2.97 6.6% 66 85.2 3.14 4.6%ENGL 333 110 2.88 2.88 6.4% 24 81.0 3.21 4.2%ENGL 340 199 2.90 2.62 13.1% 103 83.5 2.93 6.8%ENGL 342 211 2.91 2.89 7.1% 153 84.0 3.17 2.0%ENGL 349 131 2.96 2.86 9.9% 70 84.1 2.89 7.1%ENGL 354 108 2.87 2.88 8.3% 42 86.1 3.12 2.4%ENGL 359 281 2.91 2.98 5.3% 80 82.7 2.90 10.0%ENGL 364 105 3.11 3.26 2.9% 32 87.6 3.34 3.1%ENGL 368 110 2.88 2.93 5.5% 12 78.9 2.44 25.0%ENGL 383 155 2.85 3.04 3.9% 64 83.7 3.14 1.6%ENGL 387 192 2.83 2.95 6.3% 81 83.1 3.15 6.2%ENGL 392 123 2.95 3.19 3.3% 46 83.7 3.45 4.4%
FREN 210 104 3.03 2.57 13.5% 317 83.8 2.75 6.6%FREN 211 102 3.05 2.54 16.7% 295 85.9 2.80 6.8%FREN 222 114 3.03 2.28 20.2% 173 86.2 2.60 12.7%FREN 270 101 3.04 2.53 13.9% 92 85.4 2.88 8.7%
GEOG 213 191 2.78 2.29 25.7% 149 83.2 2.79 12.8%GEOG 214 106 2.77 2.65 11.3% 105 83.0 3.04 6.7%GEOG 215 122 2.91 2.84 9.8% 78 83.3 3.07 3.9%GEOG 221 364 2.84 2.63 11.0% 185 82.8 2.86 8.7%GEOG 241 395 2.83 2.63 12.9% 203 82.5 2.70 15.3%GEOG 251 183 2.86 2.52 13.1% 59 82.7 2.82 5.1%GEOG 253 101 2.87 2.27 28.7% 55 82.3 2.55 21.8%GEOG 255 189 2.86 2.28 29.6% 110 83.0 2.67 15.5%GEOG 312 340 2.81 2.84 6.8% 79 81.9 3.14 0.0%GEOG 313 140 2.85 2.30 26.4% 37 84.6 3.06 2.7%GEOG 322 200 2.86 2.89 3.5% 33 81.1 3.21 0.0%GEOG 323 102 2.77 2.68 7.8% 20 82.0 3.07 0.0%GEOG 325 138 2.75 2.88 5.8% 21 81.2 3.29 0.0%GEOG 327 145 2.77 3.02 2.1% 19 79.6 3.19 0.0%GEOG 362 103 2.83 2.74 8.7% 8 78.5 2.96 12.5%GEOG 363 133 2.80 2.75 12.0% 23 81.8 3.22 0.0%GEOG 381 128 2.84 2.79 2.3% 9 81.4 3.19 0.0%GEOG 383 188 2.82 2.80 9.0% 41 82.2 3.21 2.4%GEOG 385 114 2.84 3.06 3.5% 10 82.7 3.27 0.0%GEOG 386 180 2.79 2.72 10.6% 27 78.8 2.99 7.4%GEOG 387 170 2.80 2.57 12.9% 22 82.9 3.03 13.6%GEOG 389 129 2.85 2.92 7.8% 15 81.1 3.27 0.0%
GERO 300 191 2.87 2.57 10.0% 69 80.4 2.84 8.7%
HIST 204 207 2.80 2.77 9.2% 172 83.4 2.83 8.1%HIST 215 157 2.88 2.40 23.6% 195 84.6 2.62 13.3%HIST 225 200 2.86 2.27 24.0% 447 83.9 2.53 15.0%
BC College Transfer BC Grade 12 Direct Entry

Page 73
Table A3 (Cont.) Comparison of Grades in 200- and 300-Level Courses Completed by BC College Transfer and BC Grade 12 Direct Entry Students (for Students Admitted to SFU from 2003/04 to 2007/08)
# of Adm. Avg % Grade # of Adm. Avg % GradeCourse Grades GPA Crse Grade <C Grades GPA Crse Grade <C
HIST 249 118 2.84 2.53 21.2% 105 84.8 3.01 10.5%HIST 254 150 2.90 2.27 27.3% 91 83.3 2.67 13.2%HIST 255 207 2.86 2.21 33.8% 118 82.1 2.40 25.4%HIST 315 112 2.92 2.35 22.3% 20 85.4 2.97 5.0%HIST 319 105 2.83 2.69 8.6% 6 82.5 2.67 16.7%HIST 337 106 2.85 2.30 19.8% 11 80.3 2.45 27.3%HIST 338 322 2.79 2.38 18.6% 87 82.4 2.77 5.8%HIST 339 351 2.86 2.61 12.0% 88 83.3 2.99 2.3%HIST 390 207 2.91 2.61 15.0% 56 84.1 2.88 8.9%
HUM 230 262 2.96 2.97 7.3% 313 84.3 3.20 3.8%HUM 330 127 2.94 3.11 4.7% 41 84.5 3.14 9.8%
KIN 207 104 2.83 2.43 20.2% 379 85.3 2.91 11.9%KIN 241 105 2.88 2.91 7.6% 341 84.9 3.26 2.9%
LING 200 384 3.08 2.40 25.0% 355 82.6 2.43 27.6%LING 220 526 2.95 2.53 18.6% 800 82.8 2.64 17.4%LING 221 115 2.88 2.28 33.0% 92 82.3 2.71 16.3%LING 222 141 2.88 2.25 31.2% 122 82.9 2.84 16.4%LING 260 114 2.97 2.82 13.2% 80 82.4 2.85 7.5%
MACM 201 260 2.97 1.87 43.5% 504 84.4 2.22 33.7%MACM 316 210 3.11 2.38 24.3% 270 86.8 2.78 14.8%
MATH 232 377 2.94 2.05 39.0% 1,392 84.3 2.20 33.3%MATH 251 272 2.92 2.12 37.1% 736 85.8 2.43 26.9%MATH 310 151 3.13 2.38 26.5% 395 86.1 2.40 26.8%
MBB 221 356 2.83 2.00 36.2% 1,318 85.1 2.59 18.8%MBB 222 264 2.89 2.18 31.4% 791 85.4 2.69 15.0%MBB 321 128 3.05 2.29 30.5% 412 86.2 2.72 21.8%MBB 322 157 2.98 2.59 16.6% 338 85.9 3.07 9.8%MBB 331 141 3.02 2.39 22.7% 314 85.7 2.78 17.5%
PHIL 203 143 2.99 2.78 5.6% 54 84.6 2.75 9.3%PHIL 210 138 3.11 1.85 44.9% 73 85.8 2.99 15.1%PHIL 300 141 2.83 2.50 11.4% 23 80.8 2.85 8.7%PHIL 331 171 3.09 2.78 9.9% 47 84.8 2.72 6.4%PHIL 332 126 3.06 2.71 11.9% 6 80.2 2.17 33.3%PHIL 333 106 3.03 2.76 9.4% 10 82.3 3.10 0.0%
POL 201 263 2.87 2.27 28.5% 148 84.9 2.92 10.8%POL 210 232 2.92 2.47 22.4% 190 84.7 2.89 8.4%POL 221 124 2.87 2.58 18.6% 284 84.7 2.92 9.2%POL 231 113 2.98 2.95 9.7% 176 84.7 3.12 5.1%POL 232 163 2.92 2.52 23.3% 137 83.9 2.87 14.6%POL 241 193 2.97 2.35 25.9% 374 84.0 2.81 11.2%
BC College Transfer BC Grade 12 Direct Entry

Page 74
Table A3 (Cont.) Comparison of Grades in 200- and 300-Level Courses Completed by BC College Transfer and BC Grade 12 Direct Entry Students (for Students Admitted to SFU from 2003/04 to 2007/08)
# of Adm. Avg % Grade # of Adm. Avg % GradeCourse Grades GPA Crse Grade <C Grades GPA Crse Grade <C
POL 319 106 2.97 2.76 12.3% 33 83.7 3.00 9.1%POL 327 363 2.90 2.56 18.5% 100 83.5 2.70 17.0%POL 339 236 2.86 2.78 12.7% 51 83.0 3.22 0.0%POL 343 158 2.83 2.72 13.9% 39 82.9 3.22 2.6%POL 344 165 2.92 2.70 10.9% 71 83.1 2.86 7.0%POL 346 155 2.89 2.71 8.4% 68 83.8 3.03 1.5%POL 348 174 2.88 2.73 10.9% 52 82.1 3.01 13.5%POL 349 229 2.92 2.90 7.9% 65 82.9 3.25 3.1%
PSYC 201 823 2.87 2.38 23.5% 206 82.9 3.07 4.4%PSYC 201W 331 2.76 2.33 19.0% 212 83.8 2.99 5.2%PSYC 207 1,132 2.83 2.27 26.1% 361 82.8 2.83 10.3%PSYC 210 564 2.86 2.29 20.9% 274 82.9 2.80 10.6%PSYC 221 765 2.86 2.33 28.4% 293 83.0 3.06 9.9%PSYC 241 647 2.90 2.47 19.9% 321 83.1 2.98 6.5%PSYC 250 873 2.91 2.42 21.7% 321 82.8 2.82 11.8%PSYC 260 813 2.89 2.44 22.9% 333 83.6 3.12 7.2%PSYC 268 442 2.87 2.50 19.9% 162 82.9 2.90 9.3%PSYC 270 172 2.95 2.51 22.1% 26 79.0 2.92 11.5%PSYC 280 680 2.88 2.11 37.9% 201 83.9 2.94 9.0%PSYC 300W 303 2.92 2.65 9.6% 101 82.5 2.95 7.9%PSYC 301 174 3.09 2.42 25.3% 44 82.8 2.80 22.7%PSYC 303 334 2.96 2.27 35.3% 46 81.9 2.93 15.2%PSYC 325 398 2.94 2.09 38.7% 63 81.2 2.88 11.1%PSYC 330 402 2.93 2.40 27.1% 88 81.5 2.97 12.5%PSYC 354 456 2.93 2.54 19.3% 45 81.7 3.13 8.9%PSYC 355 619 2.94 2.65 16.5% 117 82.1 3.17 3.4%PSYC 356 466 2.96 2.67 12.7% 62 82.3 3.10 4.8%PSYC 357 543 2.94 2.74 8.1% 104 82.4 3.16 1.9%PSYC 358 221 2.91 2.40 25.8% 41 81.6 2.92 7.3%PSYC 361 441 2.95 2.70 14.1% 82 81.8 3.11 7.3%PSYC 362 738 2.96 2.60 19.4% 140 82.3 3.07 10.7%PSYC 363 199 2.90 2.83 14.1% 74 82.2 3.21 4.1%PSYC 365 477 2.97 2.88 2.9% 82 83.4 3.34 0.0%PSYC 368 199 2.97 2.82 9.6% 30 79.9 3.31 0.0%PSYC 369 268 2.99 2.59 12.3% 5 82.7 3.47 0.0%PSYC 371 176 2.99 2.87 10.8% 30 81.1 2.91 6.7%PSYC 381 171 2.98 2.28 27.5% 31 84.5 2.84 22.6%PSYC 382 197 2.99 2.51 19.3% 23 84.2 3.49 0.0%PSYC 383 365 3.03 2.55 17.5% 50 83.9 3.05 6.0%PSYC 384 166 3.03 2.62 13.9% 12 81.9 2.70 8.3%PSYC 385 724 2.96 2.85 4.3% 120 82.3 3.18 1.7%PSYC 387 166 3.01 2.53 15.1% 18 86.5 3.04 5.6%PSYC 388 158 3.01 2.44 20.3% 27 82.7 2.52 22.2%
SA 201 223 2.92 2.73 13.0% 33 83.6 3.15 3.0%SA 250 344 2.88 2.46 17.2% 176 82.4 2.67 13.6%SA 255 417 2.86 2.56 13.4% 130 82.7 2.70 15.4%
BC College Transfer BC Grade 12 Direct Entry

Page 75
Table A3 (Cont.) Comparison of Grades in 200- and 300-Level Courses Completed by BC College Transfer and BC Grade 12 Direct Entry Students (for Students Admitted to SFU from 2003/04 to 2007/08)
# of Adm. Avg % Grade # of Adm. Avg % GradeCourse Grades GPA Crse Grade <C Grades GPA Crse Grade <C
SA 275 106 2.85 3.09 1.9% 43 83.5 3.22 0.0%SA 301 131 2.92 3.07 5.3% <5 86.2 3.75 0.0%SA 316 347 2.80 2.60 11.0% 51 80.9 2.80 5.9%SA 335 126 2.76 2.88 5.6% 24 81.6 3.10 8.3%SA 345 259 2.82 2.73 8.5% 34 82.9 3.25 0.0%SA 350 231 2.82 2.77 8.2% 24 81.9 3.28 0.0%SA 355 189 2.80 2.63 12.2% 26 82.2 3.05 3.9%SA 356 192 2.83 3.23 1.0% 14 84.4 3.64 0.0%SA 358 290 2.80 2.48 13.1% 40 82.7 2.68 12.5%SA 360 131 2.89 3.02 6.9% 19 82.2 3.11 5.3%
STAT 201 394 2.83 2.43 24.4% 1,102 84.8 2.94 11.2%STAT 203 346 2.87 2.00 39.9% 304 81.7 2.71 17.8%STAT 270 408 3.02 1.89 44.6% 809 85.3 2.35 30.3%Total 81,169 2.97 2.60 16.8% 66,412 83.94 2.80 12.5%All 200-Level 41,796 2.92 2.48 20.3% 58,280 83.78 2.77 13.1%All 300-Level 65,515 2.99 2.76 12.1% 33,609 83.80 3.01 8.3%
BC College Transfer BC Grade 12 Direct Entry
Notes: a) Excludes courses with fewer than 100 BC College transfer students. b) Average course grade calculated on grades with a numerical equivalent only. Therefore excludes such grades as course challenge, pass, audit, etc. c) The total includes only the courses listed above. The 200- and 300-level totals include all 200- and 300-level courses (not all are listed). Course Names: ARCH- Archaeology
ECON- Economics
MACM- Mathematical Computing
BISC- Biological Sciences
EDUC- Education
MATH- Mathematics
BUEC- Business Economics
ENGL- English
PHIL- Philosophy
BUS- Business
FREN- French
POL- Political Science
CHEM- Chemistry
GEOG- Geography
PSYC- Psychology
CMNS- Communication
HIST- History
SA- Sociology/Anthropology
CMPT- Computer Science
HUM- Humanities
STAT- Statistics
CNS- Canadian Studies
KIN- Kinesiology
CRIM- Criminology
LING- Linguistics

Page 76
Table A4: Degree Completion Rate of BC College Transfer Students Admitted to SFU from 2003/04 to 2007/08
Non-Lower Mainland N %Grad N %Grad N %Grad N %GradNorthern BC/Yukon 6 33.3% 21 19.0% <5 50.0% 9 44.4%College of New Caledonia <5 33.3% 6 0.0% <5 50.0% 5 80.0%Northern Lights College <5 0.0% 12 16.7% <5 50.0% <5 0.0%Northwest Community College <5 50.0% <5 66.7% - - <5 0.0%Yukon College - - - - - - - -
Interior/Kootenays 15 33.3% 12 75.0% 11 54.5% <5 100.0%College of the Rockies <5 50.0% <5 100.0% <5 100.0% <5 100.0%Nicola Valley Institute of Technology <5 0.0% <5 100.0% <5 100.0% <5 -Okanagan College <5 66.7% <5 75.0% <5 100.0% <5 100.0%Selkirk College <5 100.0% <5 50.0% <5 0.0% - -Thompson Rivers University Open Learning <5 0.0% - - - - - -Thompson Rivers University 6 16.7% <5 75.0% <5 33.3% <5 100.0%
Vancouver Island 28 67.9% 19 63.2% 12 50.0% 6 50.0%Camosun College 6 83.3% 9 66.7% <5 100.0% <5 100.0%Malaspina University College 21 66.7% 8 50.0% 8 50.0% <5 0.0%North Island College <5 0.0% <5 100.0% <5 33.3% <5 100.0%
Total Non-Lower Mainland 49 53.1% 52 48.1% 27 51.9% 18 55.6%
Lower MainlandPublic 174 55.7% 272 50.0% 248 59.7% 231 59.3%BC Institute of Technology - - - - - - - -Capilano College 24 50.0% 71 57.7% 52 67.3% 47 63.8%Douglas College 49 59.2% 65 43.1% 58 55.2% 58 65.5%Emily Carr Institute of Art and Design - - - - - - <5 0.0Institute of Indigenous Government - - - - <5 0.0% - -Kwantlen University College 49 53.1% 65 44.6% 77 64.9% 65 53.8%Langara College 43 60.5% 67 53.7% 55 49.1% 48 56.3%University College of the Fraser Valley 9 44.4% <5 50.0% 5 80.0% 12 58.3%
Private 39 48.7% 61 49.2% 40 60.0% 37 62.2%Columbia College 12 33.3% 30 50.0% 13 53.8% 16 68.8%Coquitlam College 27 55.6% 30 46.7% 27 63.0% 21 57.1%Corpus Christi College - - <5 100.0% - - - -Fraser International College - - - - - - - -
Total Lower Mainland 213 54.5% 333 49.8% 288 59.7% 268 59.7%Grand Total 262 54.2% 385 49.6% 315 59.0% 286 59.4%
Transfer Credits at Time of Admission to SFU< 30 30-34 35-39 40-44
%
Notes: a) N is the total number of students admitted to SFU from summer 2003 to spring 2005. b) % Grad is the proportion of N who were awarded a degree (PDP and certificates excluded) between October 2003 and June 2005. c) Students who completed multiple degrees simultaneously are included in the graduation statistics for each degree completed. d) Students who completed multiple degrees sequentially are included in the graduation statistics for degree completed only. e) Of the 4,414 BC Grade 12 direct entry students admitted to SFU from 2003/04 to 2004/05, 19 per cent have completed their degree between October 2003 and June 2008. f) The number of students who have graduated in each of the two admission groups are not comparable. BC College transfers will typically complete their degree within two or three years of transferring to SFU, while BC Grade 12s will typically complete their degree within four or five years of admission to SFU.

Page 77
Table A4 (Cont.) Degree Completion Rate of BC College Transfer Students Admitted to SFU from 2003/04 to 2007/08
Non-Lower Mainland N %Grad N %Grad N %Grad N %GradNorthern BC/Yukon 7 57.1% <5 66.7% 44 54.5% 94 44.7%College of New Caledonia <5 100.0% <5 100.0% 26 73.1% 47 63.8%Northern Lights College <5 0.0% <5 0.0% 6 66.7% 27 25.9%Northwest Community College <5 50.0% - - 11 9.1% 19 26.3%Yukon College - - - - <5 0.0% <5 0.0%
Interior/Kootenays 18 77.8% 11 54.5% 35 74.3% 105 65.7%College of the Rockies <5 0.0% - - 8 87.5% 15 73.3%Nicola Valley Institute of Technology <5 100.0% <5 100.0% <5 100.0% 9 77.8%Okanagan College 7 85.7% <5 25.0% 10 80.0% 31 74.2%Selkirk College - - <5 100.0% 5 80.0% 12 58.3%Thompson Rivers University Open Learning - - <5 100.0% <5 100.0% <5 66.7%Thompson Rivers University 8 87.5% <5 50.0% 9 44.4% 35 54.3%
Vancouver Island 7 57.1% 10 60.0% 44 50.0% 126 57.1%Camosun College <5 75.0% <5 100.0% 29 41.4% 53 58.5%Malaspina University College <5 33.3% 6 50.0% 14 64.3% 63 55.6%North Island College - - <5 0.0% <5 100.0% 10 60.0%
Total Non Lower Mainland 32 68.8% 24 58.3% 123 58.5% 325 56.3%
Lower MainlandPublic 496 70.0% 492 69.3% 1,936 64.7% 3,849 63.9%BC Institute of Technology - - - - - - - -Capilano College 112 73.2% 103 70.9% 354 65.5% 763 66.2%Douglas College 140 67.1% 141 68.8% 567 57.5% 1,078 59.7%Emily Carr Institute of Art and Design - - - - - - <5 0.0Institute of Indigenous Government <5 0.0% - - <5 0.0% <5 0.0%Kwantlen University College 117 71.8% 125 70.4% 556 72.8% 1,054 68.0%Langara College 116 66.4% 112 68.8% 412 61.9% 853 61.5%University College of the Fraser Valley 10 100.0% 11 54.5% 46 73.9% 97 69.1%
Private 33 69.7% 32 87.5% 36 61.1% 278 60.8%Columbia College 15 66.7% 16 81.3% 18 55.6% 120 58.3%Coquitlam College 18 72.2% 16 93.8% 18 66.7% 157 62.4%Corpus Christi College - - - - - - <5 100.0Fraser International College - - - - - - - -
Total Lower Mainland 529 69.9% 524 70.4% 1,972 64.6% 4,127 63.7%Grand Total 561 69.9% 548 69.9% 2,095 64.2% 4,452 63.1%
45-49 50-54 ≥ 55 Grand TotalTransfer Credits at Time of Admission to SFU
%
%
Notes: a) N is the total number of students admitted to SFU from summer 2003 to spring 2005. b) % Grad is the proportion of N who were awarded a degree (PDP and certificates excluded) between October 2003 and June 2005. c) Students who completed multiple degrees simultaneously are included in the graduation statistics for each degree completed. d) Students who completed multiple degrees sequentially are included in the graduation statistics for degree completed only. e) Of the 4,414 BC Grade 12 direct entry students admitted to SFU from 2003/04 to 2004/05, 19 per cent have completed their degree between October 2003 and June 2008. f) The number of students who have graduated in each of the two admission groups are not comparable. BC College transfers will typically complete their degree within two or three years of transferring to SFU, while BC Grade 12s will typically complete their degree within four or five years of admission to SFU.

Page 78
Table A5: BC College Transfers by Graduation Degree Program (for Students Admitted to SFU from 2003/04 to 2007/08) Non-Lower Mainland BUS PSYC ECON CRIM GEOG HIST ENGL CMNS POSC BGSNorthern BC/Yukon 4.5% 4.5% 3.0% 38.8% 1.5% 4.5% 0.0% 0.0% 0.0% 17.9%College of New Caledonia 7.1% 7.1% 2.4% 59.5% 0.0% 4.8% 0.0% 0.0% 0.0% 7.1%Northern Lights College 0.0% 0.0% 0.0% 0.0% 0.0% 0.0% 0.0% 0.0% 0.0% 41.2%Northwest Community College 0.0% 0.0% 12.5% 12.5% 12.5% 12.5% 0.0% 0.0% 0.0% 25.0%
Interior/Kootenays 12.5% 12.5% 2.3% 9.1% 2.3% 3.4% 9.1% 10.2% 0.0% 12.5%College of the Rockies 16.7% 0.0% 8.3% 25.0% 0.0% 0.0% 8.3% 0.0% 0.0% 0.0%Nicola Valley Institute of Technology 0.0% 0.0% 0.0% 0.0% 0.0% 0.0% 0.0% 0.0% 0.0% 100.0%Okanagan College 16.7% 20.0% 3.3% 10.0% 3.3% 0.0% 16.7% 10.0% 0.0% 0.0%Selkirk College 0.0% 0.0% 0.0% 0.0% 0.0% 18.2% 18.2% 27.3% 0.0% 9.1%Thompson Rivers University Open Learning 0.0% 33.3% 0.0% 0.0% 0.0% 0.0% 0.0% 33.3% 0.0% 0.0%Thompson Rivers University 16.0% 16.0% 0.0% 8.0% 4.0% 4.0% 0.0% 8.0% 0.0% 12.0%
Vancouver Island 23.0% 2.0% 4.0% 29.0% 1.0% 2.0% 4.0% 8.0% 3.0% 1.0%Camosun College 9.6% 3.8% 1.9% 46.2% 0.0% 0.0% 3.8% 9.6% 3.8% 1.9%Malaspina University College 41.9% 0.0% 7.0% 11.6% 2.3% 2.3% 2.3% 4.7% 0.0% 0.0%North Island College 0.0% 0.0% 0.0% 0.0% 0.0% 20.0% 20.0% 20.0% 20.0% 0.0%
Total Non-Lower Mainland 14.5% 6.3% 3.1% 24.7% 1.6% 3.1% 4.7% 6.7% 1.2% 9.4%
Lower MainlandPublic 10.6% 11.8% 9.4% 8.7% 7.4% 7.4% 7.1% 5.8% 5.1% 4.5%Capilano College 10.7% 12.6% 7.5% 4.0% 7.6% 5.4% 9.7% 7.3% 5.4% 4.4%Douglas College 10.0% 10.4% 6.2% 11.4% 7.2% 10.0% 6.9% 3.9% 4.4% 5.6%Kwantlen University College 12.5% 12.8% 10.8% 14.7% 6.8% 7.1% 5.6% 4.1% 3.5% 3.4%Langara College 9.5% 12.6% 13.9% 3.1% 8.4% 6.4% 6.7% 7.0% 7.0% 4.7%University College of the Fraser Valley 3.3% 4.4% 2.2% 0.0% 7.7% 7.7% 9.9% 22.0% 9.9% 3.3%
Private 25.3% 2.8% 39.2% 0.0% 0.9% 0.5% 0.0% 12.9% 1.4% 2.3%Columbia College 27.8% 5.2% 32.0% 0.0% 0.0% 0.0% 0.0% 21.6% 1.0% 0.0%Coquitlam College 23.7% 0.8% 45.8% 0.0% 1.7% 0.0% 0.0% 5.9% 0.8% 4.2%Corpus Christi College 0.0% 0.0% 0.0% 0.0% 0.0% 50.0% 0.0% 0.0% 50.0% 0.0%
Total Lower Mainland 11.5% 11.3% 11.2% 8.1% 7.1% 7.0% 6.7% 6.2% 4.8% 4.3%Grand Total 11.7% 11.0% 10.6% 9.2% 6.7% 6.7% 6.6% 6.3% 4.6% 4.7% Notes: a) The programs reported are the most common programs selected and approved for BC College transfer students. b) An Education graduate is defined as a student who has graduated with a Bachelor of Education or from the PDP program. c) A General Studies graduate is defined as a student who has graduated with a Bachelor of General Studies (in either Applied Sciences or Arts & Social Sciences). d) A student simultaneously graduating in more than one program is counted once under each program. e) A student graduating in more than one program in subsequent degrees is counted in the program(s) of the first degree only. f) "Other" program graduates includes all other degree programs (certificate programs are excluded). g) Graduation occurred between October 2003 and June 2008.

Page 79
Table A5 (Cont.) BC College Transfers by Graduation Degree-Program (for Students Admitted to SFU from 2003/04 to 2007/08) SOCI EDUC ARCH BISC ANTH CMPT LING Other Total Non-Lower Mainland1.5% 20.9% 0.0% 0.0% 0.0% 0.0% 0.0% 3.0% 67 Northern BC/Yukon2.4% 7.1% 0.0% 0.0% 0.0% 0.0% 0.0% 2.4% 42 College of New Caledonia0.0% 52.9% 0.0% 0.0% 0.0% 0.0% 0.0% 5.9% 17 Northern Lights College0.0% 25.0% 0.0% 0.0% 0.0% 0.0% 0.0% 0.0% 8 Northwest Community College5.7% 0.0% 8.0% 3.4% 1.1% 1.1% 0.0% 6.8% 88 Interior/Kootenays0.0% 0.0% 16.7% 16.7% 0.0% 0.0% 0.0% 8.3% 12 College of the Rockies0.0% 0.0% 0.0% 0.0% 0.0% 0.0% 0.0% 0.0% 7 Nicola Valley Institute of Technology0.0% 0.0% 10.0% 0.0% 0.0% 0.0% 0.0% 10.0% 30 Okanagan College9.1% 0.0% 0.0% 0.0% 0.0% 0.0% 0.0% 18.2% 11 Selkirk College33.3% 0.0% 0.0% 0.0% 0.0% 0.0% 0.0% 0.0% <5 Thompson Rivers University Open Learning12.0% 0.0% 8.0% 4.0% 4.0% 4.0% 0.0% 0.0% 25 Thompson Rivers University1.0% 2.0% 3.0% 1.0% 2.0% 0.0% 0.0% 14.0% 100 Vancouver Island0.0% 3.8% 5.8% 0.0% 1.9% 0.0% 0.0% 7.7% 52 Camosun College2.3% 0.0% 0.0% 2.3% 2.3% 0.0% 0.0% 20.9% 43 Malaspina University College0.0% 0.0% 0.0% 0.0% 0.0% 0.0% 0.0% 20.0% 5 North Island College2.7% 6.3% 3.9% 1.6% 1.2% 0.4% 0.0% 8.6% 255 Total Non-Lower Mainland
Lower Mainland3.5% 2.1% 1.9% 1.8% 1.6% 1.1% 0.8% 9.4% 3,371 Public2.9% 2.5% 3.1% 1.3% 2.8% 1.2% 0.1% 11.4% 682 Capilano College3.6% 3.2% 1.1% 2.1% 1.7% 1.6% 0.9% 9.8% 888 Douglas College3.5% 1.7% 1.9% 2.3% 1.1% 0.6% 0.7% 7.0% 962 Kwantlen University College4.3% 0.7% 2.0% 0.7% 1.3% 0.9% 1.3% 9.6% 748 Langara College0.0% 6.6% 1.1% 4.4% 0.0% 2.2% 0.0% 15.4% 91 University College of the Fraser Valley0.0% 0.0% 0.0% 0.0% 0.0% 3.7% 3.2% 7.8% 217 Private0.0% 0.0% 0.0% 0.0% 0.0% 4.1% 1.0% 7.2% 97 Columbia College0.0% 0.0% 0.0% 0.0% 0.0% 3.4% 5.1% 8.5% 118 Coquitlam College0.0% 0.0% 0.0% 0.0% 0.0% 0.0% 0.0% 0.0% <5 Corpus Christi College3.3% 2.0% 1.8% 1.6% 1.5% 1.3% 0.9% 9.3% 3,588 Total Lower Mainland3.3% 2.3% 2.0% 1.6% 1.5% 1.2% 0.9% 9.3% 3,843 Grand Total
Notes: a) The programs reported are the most common programs selected and approved for BC College transfer students. b) An Education graduate is defined as a student who has graduated with a Bachelor of Education or from the PDP program. c) A General Studies graduate is defined as a student who has graduated with a Bachelor of General Studies (in either Applied Sciences or Arts & Social Sciences). d) A student simultaneously graduating in more than one program is counted once under each program. e) A student graduating in more than one program in subsequent degrees is counted in the program(s) of the first degree only. f) "Other" program graduates includes all other degree programs (certificate programs are excluded). g) Graduation occurred between October 2003 and June 2008.

Page 80
Page 81
APPENDIX B
SUPPORTING TABLES AND FIGURES
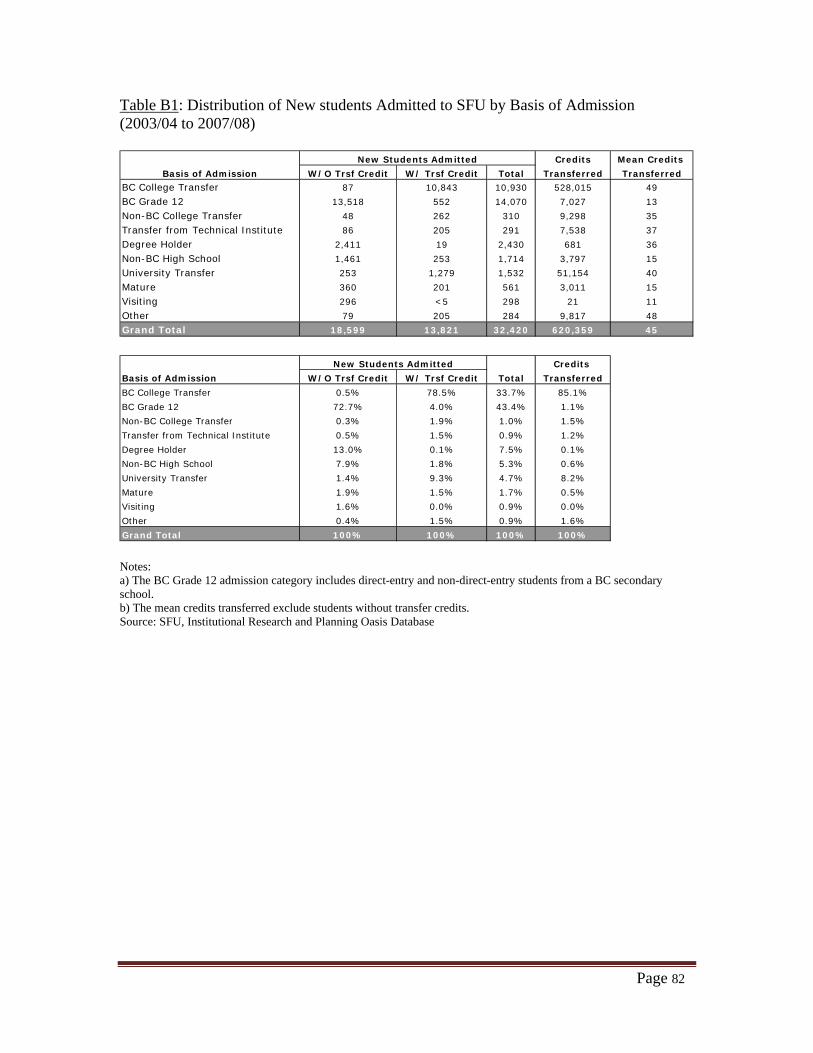
Page 82
Table B1: Distribution of New students Admitted to SFU by Basis of Admission (2003/04 to 2007/08)
Credits Mean Credits
W/O Trsf Credit W/ Trsf Credit Total Transferred Transferred
BC College Transfer 87 10,843 10,930 528,015 49
BC Grade 12 13,518 552 14,070 7,027 13
Non-BC College Transfer 48 262 310 9,298 35
Transfer from Technical Institute 86 205 291 7,538 37
Degree Holder 2,411 19 2,430 681 36
Non-BC High School 1,461 253 1,714 3,797 15
University Transfer 253 1,279 1,532 51,154 40
Mature 360 201 561 3,011 15
Visiting 296 <5 298 21 11
Other 79 205 284 9,817 48
Grand Total 18,599 13,821 32,420 620,359 45
Basis of Admission
New Students Admitted
Credits
W/O Trsf Credit W/ Trsf Credit Total Transferred
BC College Transfer 0.5% 78.5% 33.7% 85.1%
BC Grade 12 72.7% 4.0% 43.4% 1.1%
Non-BC College Transfer 0.3% 1.9% 1.0% 1.5%
Transfer from Technical Institute 0.5% 1.5% 0.9% 1.2%
Degree Holder 13.0% 0.1% 7.5% 0.1%
Non-BC High School 7.9% 1.8% 5.3% 0.6%
University Transfer 1.4% 9.3% 4.7% 8.2%
Mature 1.9% 1.5% 1.7% 0.5%
Visiting 1.6% 0.0% 0.9% 0.0%
Other 0.4% 1.5% 0.9% 1.6%
Grand Total 100% 100% 100% 100%
Basis of Admission
New Students Admitted
Notes: a) The BC Grade 12 admission category includes direct-entry and non-direct-entry students from a BC secondary school. b) The mean credits transferred exclude students without transfer credits. Source: SFU, Institutional Research and Planning Oasis Database

Page 83
Table B2: Credit Hour and Credential Completion Status for Undergraduate Students Admitted to SFU on the Basis of BC Grade 12-Direct and Non-Direct (as at June 2008)
Year #Admitted Admitted 0 1 - 29 30-59 60-89 90-119 ≥120 Cert/Dipl Degree
1998/99 2,100 21 259 169 103 48 37 11 1,4521.0% 12.3% 8.0% 4.9% 2.3% 1.8% 0.5% 69.1%
1999/00 2,177 30 222 151 97 59 36 8 1,5741.4% 10.2% 6.9% 4.5% 2.7% 1.7% 0.4% 72.3%
2000/01 2,447 20 242 221 113 69 46 8 1,7280.8% 9.9% 9.0% 4.6% 2.8% 1.9% 0.3% 70.6%
2001/02 2,250 34 272 206 101 87 79 8 1,4631.5% 12.1% 9.2% 4.5% 3.9% 3.5% 0.4% 65.0%
2002/03 2,713 37 351 282 149 213 171 12 1,4981.4% 12.9% 10.4% 5.5% 7.9% 6.3% 0.4% 55.2%
2003/04 2,694 42 289 251 240 563 334 25 9501.6% 10.7% 9.3% 8.9% 20.9% 12.4% 0.9% 35.3%
2004/05 2,785 50 433 318 572 1,134 81 17 1801.8% 15.5% 11.4% 20.5% 40.7% 2.9% 0.6% 6.5%
2005/06 2,982 46 424 600 1,655 232 <5 10 111.5% 14.2% 20.1% 55.5% 7.8% 0.1% 0.3% 0.4%
2006/07 2,989 63 586 2,090 245 <5 - - <52.1% 19.6% 69.9% 8.2% 0.1% 0.0% 0.0% 0.0%
2007/08 3,836 89 3,498 242 5 <5 - - <52.3% 91.2% 6.3% 0.1% 0.0% 0.0% 0.0% 0.0%
Credit Hours Successfully Completed Credential Completed# and % Still Enrolled at SFU # and % Graduated
Notes: a) Only includes students who are pursuing at least one degree program at SFU. b) Excludes students who withdraw from the university during their first semester at SFU. c) Credit hours successfully completed include both SFU credits and transfer credits from another post-secondary institution. d) For reporting students who have graduated, a student is reported under one category only: either 'Cert/Dipl' or 'Degree'. If a student is awarded a certificate or diploma and is still pursuing a degree, the student is reported under 'Cert/Dipl'. If a student is awarded a degree later, the student is then reported under 'Degree' and no longer reported under 'Cert/Dipl'. e) High school includes students admitted in the following categories: BC grade 12, Canadian grade 12, Foreign grade 12, US grade 12, International baccalaureate. Source: SFU Factbook, Table ST-31b

Table B3: Credit Hour and Credential Completion Status for Undergraduate Students Admitted to SFU from another Post-Secondary Institution (as at June 2008)
Year #Admitted Admitted 0 1 - 29 30 - 59 60 - 89 90 - 119 ≥120 Cert/Dipl Degree
1998/99 1,473 18 9 91 171 57 20 16 1,0911.2% 0.6% 6.2% 11.6% 3.9% 1.4% 1.1% 74.1%
1999/00 1,656 34 10 95 173 54 29 26 1,2352.1% 0.6% 5.7% 10.4% 3.3% 1.8% 1.6% 74.6%
2000/01 2,000 27 10 108 244 96 37 33 1,4451.4% 0.5% 5.4% 12.2% 4.8% 1.9% 1.7% 72.3%
2001/02 1,701 26 <5 103 185 69 41 29 1,2441.5% 0.2% 6.1% 10.9% 4.1% 2.4% 1.7% 73.1%
2002/03 1,989 28 12 109 243 88 62 27 1,4201.4% 0.6% 5.5% 12.2% 4.4% 3.1% 1.4% 71.4%
2003/04 1,953 29 11 78 229 127 77 24 1,3781.5% 0.6% 4.0% 11.7% 6.5% 3.9% 1.2% 70.6%
2004/05 3,002 51 22 170 440 341 244 38 1,6961.7% 0.7% 5.7% 14.7% 11.4% 8.1% 1.3% 56.5%
2005/06 2,568 51 11 183 534 690 259 36 8042.0% 0.4% 7.1% 20.8% 26.9% 10.1% 1.4% 31.3%
2006/07 2,424 62 23 261 969 916 70 12 1112.6% 0.9% 10.8% 40.0% 37.8% 2.9% 0.5% 4.6%
2007/08 2,526 83 87 887 1,400 68 <5 - -3.3% 3.4% 35.1% 55.4% 2.7% 0.0% 0.0% 0.0%
# and % Still Enrolled at SFU # and % Graduated Credit Hours Successfully Completed Credential Completed
Notes: a) Only includes students who are pursuing at least one degree program at SFU. b) Excludes students who withdraw from the university during their first semester at SFU. c) Credit hours successfully completed include both SFU credits and transfer credits from another post-secondary institution. d) For reporting students who have graduated, a student is reported under one category only: either 'Cert/Dipl' or 'Degree'. If a student is awarded a certificate or diploma and is still pursuing a degree, the student is reported under 'Cert/Dipl'. If a student is awarded a degree later, the student is then reported under 'Degree' and no longer reported under 'Cert/Dipl'. e) Post-secondary transfers include students admitted in the following categories: BC College transfer (with associate degree), BC College transfer, Non-BC College transfer, BC university transfer, Non-BC university transfer. Source: SFU Factbook, Table ST-31
Page 84

Figure B1: Distribution of New Students Admitted to SFU by Basis of Admission (2003/04 - 2007/08)
49
13
35 37 36
15
40
15
11
48
0
10
20
30
40
50
60
0
2,000
4,000
6,000
8,000
10,000
12,000
14,000
16,000
BC College BC Gr.12 Direct Entry
Non‐BC College
Tech Inst Deg Hlder Non‐BC HS Uni Trans Mature Visiting Other
Mean Cred
its Transferred
Numbe
r of N
ew Stude
nts
With Transfer Credit Without Transfer Credit Mean Credits Transferred
Page 85

Figure B2: Annual Admission Intake at SFU—Trends
0%
10%
20%
30%
40%
50%
60%
70%
80%
90%
100%
81/82
82/83
83/84
84/85
85/86
86/87
87/88
88/89
89/90
90/91
91/92
92/93
93/94
94/95
95/96
96/97
97/98
98/99
99/00
00/01
01/02
02/03
03/04
04/05
05/06
06/07
07/08
Numbe
r of N
ew St
uden
ts
Year
BC GrXII Out‐of‐Province GrXII BC College / Assoc Deg All OtherAdmissions
Page 86
Page 87
APPENDIX C
DEFINITIONS

Page 88
DEFINITIONS A total of 24 institutions in the BC College transfer system19 are represented in this report and are organized by region (see below). For the purposes of this report, the student's college of transfer is the institution from which the most credits were transferred.
Notes: a) Students reported under Okanagan College include students from Okanagan University College prior to 2005. b) Students reported under Thompson Rivers University include students from University College of the Cariboo prior to 2005.
19 The Native Education Centre and the Fraser International College while not part of the BC College Transfer System are included in this report. The Native Education Centre is only discussed in Part IV which pertains to students not admitted to SFU as BC College transfers. The Fraser International College is included in this report due to the special arrangement it has with SFU.

Page 89
BC College transfer students in this report include 10,930 students admitted to Simon Fraser University from 2003/04 to 2007/08 from a College or Institute within the BC Transfer System. These students represent approximately 34 per cent of SFU’s new student admissions over the five years. They normally transferred at least one full year (30 credits) of transferable work from a BC college or completed a two-year technical program from BCIT; these students did not withdraw during their first semester at SFU. SFU lowered its requirements for 30 credits to 24 credits in Fall 2007. BC Grade 12 Direct Entry students include the 12,648 students admitted to SFU over the past five years on the basis of BC secondary school completion and who entered SFU within one year of high school graduation. Basis of Admission - Apart from BC College Transfers and BC Direct Entry Grade 12’s defined above, applicants may be admitted to undergraduate studies at SFU based on these other qualifications:
BC Adult Education Provincial Diploma - applicants, aged 19 years and older, who
have completed the Adult Basic Education Provincial Diploma. Canadian Grade 12 or 13 - completion of grade 12 or 13 at a non-BC high school in
Canada. Foreign Equivalent of BC Grade 12 or 13 - the equivalent of grade 12 or grade 13
completion at a high school outside of Canada. International Baccalaureate – International Baccalaureate exam grades can be used in
place of equivalent provincially–approved grade 12 courses for the purpose of determining a student’s admission. A student who has completed the IB diploma will typically be admitted subject to a minimum overall score of 30.
Irregular Student – irregular admission gives limited access to certain courses offered
by the Faculty of Education, thus allowing certified teachers in BC, who seek professional development opportunities, to avoid long lead times and full documentation of their academic histories. Irregular admission students may not pursue a credential at SFU.
Mature Student - applicants 23 years or older who have attempted less than one year
of post-secondary transferable course work, and who do not meet regular admission requirements.
Special Entry - applicants already holding a first degree may register in undergraduate
courses as a ‘special student’. Credit for these courses may not be applied toward completion of any certificate, diploma, graduate or undergraduate credential at SFU.

Page 90
Transfer from CEGEP – applicants who have completed a Quebec Diploma of College Studies (DEC) or at least one year of an approved academic program. The minimum average is 70% per cent.
Transfer from College outside of BC - applicants who have completed a minimum of
one year of transferable work (30 credits) with a minimum 2.00 GPA admission average at a college outside of British Columbia.
Transfer from a Technical Program - students who have completed two-year
diplomas from institutes of technology. Students who transfer from BCIT are included in this admission category, but for the purposes of this report, we have classified BCIT transfer students as BC College Transfers.
United States Grade 12 - completion of grade 12 at a high school in the United States. University Degree - applicants with baccalaureate degrees from recognized
universities may be admitted with a minimum GPA average of 2.00 based on the last two years of degree work attempted.
University Transfer - applicants in good standing at other recognized universities may
be admitted on completion of at least one full year (30 credits) of transferable work with a minimum 2.00 GPA admission average (if the transfer program is articulated with SFU) or a minimum average of 2.40 (for applicants who have attended other community college programs). Starting Fall 2007, SFU admitted transfer students on completion of 24 credits of transferable work.
Visiting Student - students from other accredited institutions who take specified
courses for subsequent transfer back to their ‘home’ institution towards a degree, certificate or diploma at their home institution.
A limit to the number of students admitted from each category is set each year. A five year history of these quotas, regrouped into three broad admission categories is shown in the table below. These quotas include both domestic and international students. Credentials Awarded and PDP Completed – Credentials include: BA – Bachelor of Arts (the count of BA Honours are included here) BASc – Bachelor of Applied Science BBA – Bachelor of Business Administration BEd – Bachelor of Education BSc – Bachelor of Science BGSAR – Bachelor of General Studies – Arts BGSAP – Bachelor of General Studies – Applied Science CLA – Certificate in Liberal Arts PDP – Professional Development Program

Page 91
Students with College Experience are profiled in Section IV of this report. These 1,167 students had some transfer credits from a BC College and were admitted to SFU under other bases of admission, such as BC Grade 12, Mature Student, Special Entry, University Transfer, etc. (see Table 20 and basis of admission definitions below). SFU Admission Quotas and Category. From 2003/04 to 2007/08, SFU Admission quotas and new admits are provided in Tables C1 and C2. Table C3 shows new student admits as a per cent of admission quotas by year. Table C1: SFU Admission Quotas by Basis of Admission and Year
Table C2: New Undergraduate Students Admitted to SFU by Basis of Admission and Year
Source: SFU Factbook, Table ST-11 Table C3: Percent of Admission Quotas Met by Basis of Admission and Year
Admission Category
BC College Transfer
BC Grade 12
Other
Total
2007/08
102% 110% 119%106%133%
2003/04 2004/05 2005/06
92%
76%
91%
101%
77%
2006/07
104%
117%
81%
106%
107%
72%
97%
97%
72%
92%

Page 92

Page 93
APPENDIX D
DATA DICTIONARY

Page 94
NEW_BCCOL.DAT Description: Students admitted to SFU from a BC College from 2003/04 to 2007/08. One record per student/credential combination (11,627 records for 10,930 students). For students who have not yet been awarded a degree, all active credentials were selected. For students who have been awarded one or more degrees, only the first degree awarded and any other previously awarded certificates were selected. Field name Type Description emplid character Unique student identifier. boa character Basis of admission category. fyear character Fiscal year. sem1 character Admission semester / first SFU semester. admgpa numeric GPA upon admission to SFU. tfrcred numeric Total transfer credits on admission to SFU. sem1crhrs numeric Number of credits enrolled in during SEM1. birthdate date Date of birth of student (YYYYMMDD). age numeric Age of student at beginning of first semester to SFU. gender character Gender of student. visa character Visa abbreviation of student. maxcollege character College attended with maximum transfer credits. maxtfrcred numeric Transfer credits from MAXCOLLEGE. cgpa1 numeric CGPA after first semester at SFU. sem1_status character Registration status of student at end of SEM1. 'W' if student withdrew in first semester at SFU. cgpa30 numeric CGPA after 30 credit hours at SFU. arch100 character Course grade in arch100. bisc202 character Course grade in bisc202. buec232 character Course grade in buec232. buec333 character Course grade in buec333. bus207 character Course grade in bus207. bus237 character Course grade in bus237. bus251 character Course grade in bus251. bus312 character Course grade in bus312. bus343 character Course grade in bus343. chem121 character Course grade in chem121. chem281 character Course grade in chem281. cmns110 character Course grade in cmns110. cmpt150 character Course grade in cmpt150. cmpt165 character Course grade in cmpt165. crim101 character Course grade in crim101. crim320 character Course grade in crim320.

Page 95
NEW_BCCOL.DAT (Cont.) Field name Type Description crim330 character Course grade in crim330. econ210 character Course grade in econ210. econ301 character Course grade in econ301. econ305 character Course grade in econ305. educ220 character Course grade in educ220. educ230 character Course grade in educ230. educ240 character Course grade in educ240. engl199 character Course grade in engl199. engl205 character Course grade in engl205. fren120 character Course grade in fren120. fren210 character Course grade in fren210. geog111 character Course grade in geog111. geog221 character Course grade in geog221. hist225 character Course grade in hist225. hum230 character Course grade in hum230. kin110 character Course grade in kin110. kin142 character Course grade in kin142. ling100 character Course grade in ling100. ling110 character Course grade in ling110. macm316 character Course grade in macm316. math152 character Course grade in math152. math232 character Course grade in math232. math251 character Course grade in math251. math310 character Course grade in math310. mbb221 character Course grade in mbb221. mbb222 character Course grade in mbb222. philxx1 character Course grade in philxx1. phys100 character Course grade in phys100. pol100 character Course grade in pol100. pol151 character Course grade in pol151. psyc201 character Course grade in psyc201. psyc210 character Course grade in psyc210. psyc250 character Course grade in psyc250. psyc260 character Course grade in psyc260. psyc385 character Course grade in psyc385. sa100 character Course grade in sa100. stat270 character Course grade in stat270. ws101 character Course grade in ws101. degawrdcnt numeric Number of undergraduate degrees awarded since SEM1. degawrdsem character Semester of first bachelor degree awarded. firstintro character Semester first degree introduced.

Page 96
NEW_BCCOL.DAT (Cont.) Field name Type Description acad_prog character Academic program(s) student is currently pursuing or program(s) student has graduated from or latest program(s) student pursued prior to leaving SFU. cred_status_flag character Status of credential: 'Comp' for completed, 'Disc' for discontinued, 'Curr' for current/actively pursuing. honors character Approved honours and joint honours associated with ACAD_PROG. majors character Approved majors, joint majors and programs associated with ACAD_PROG. minors character Approved minors and extended minors associated with ACAD_PROG. credcount numeric Number of credentials sought. fraction numeric Fractional count for multiple credentials. acad_group character Faculty associated with ACAD_PROG. gradsem character Semester of graduation from SFU. Order of preference for choosing GRADSEM: bachelors, cert/pbd/pdp. #SemToCompDeg numeric Number of elapsed semesters to first degree completion. gradgpa numeric CGPA upon graduating from SFU. Order of preference for choosing GRADGPA: bachelors, cert/pbd/pdp. last60hrs numeric Last 60 credit hours up to SFU graduation. last60pts numeric Grade points in last 60 hours at SFU. last60gpa numeric CGPA on last 60 hours up to SFU graduation. region character Region of student's college (Lower Mainland or Non-Lower Mainland). category character Category of student's college (Northern BC/Yukon, Interior/Kootenays, Vancouver Island, Public or Private). collegeseq character College sequence (order for reporting college in report).

Page 97
NEW_BC12.DAT Description: Students admitted to SFU from a BC high school from 2003/04 to 2007/08. One record per student/credential combination (14,994 records for 14,070 students). For students who have not yet been awarded a degree, all active credentials were selected. For students who have been awarded one or more degrees, only the first degree awarded and any other previously awarded certificates were selected.
Field name Type Description emplid character Unique student identifier. boa character Basis of admission category. fyear character Fiscal year. sem1 character Admission semester / first SFU semester. admgpa numeric GPA upon admission to SFU. sem1crhrs numeric Number of credits enrolled in during SEM1. birthdate date Date of birth of student (YYYYMMDD). age numeric Age of student at beginning of first semester to SFU. gender character Gender of student. visa character Visa abbreviation of student. secschname character Secondary school attended. schdist character School district number of secondary school attended. degree_dt date High school graduation date (YYYYMMDD) cgpa1 numeric CGPA after first semester at SFU. sem1_status character Registration status of student at end of SEM1. 'W' if student withdrew in first semester at SFU. cgpa30 numeric CGPA after 30 credit hours at SFU. arch100 character Course grade in arch100. bisc202 character Course grade in bisc202. buec232 character Course grade in buec232. buec333 character Course grade in buec333. bus207 character Course grade in bus207. bus237 character Course grade in bus237. bus251 character Course grade in bus251. bus312 character Course grade in bus312. bus343 character Course grade in bus343. chem121 character Course grade in chem121. chem281 character Course grade in chem281. cmns110 character Course grade in cmns110. cmpt150 character Course grade in cmpt150. cmpt165 character Course grade in cmpt165.

Page 98
NEW_BC12.DAT(Cont.) Field name Type Description crim101 character Course grade in crim101. crim320 character Course grade in crim320. crim330 character Course grade in crim330. econ210 character Course grade in econ210. econ301 character Course grade in econ301. econ305 character Course grade in econ305. educ220 character Course grade in educ220. educ230 character Course grade in educ230. educ240 character Course grade in educ240. engl199 character Course grade in engl199. engl205 character Course grade in engl205. fren120 character Course grade in fren120. fren210 character Course grade in fren210. geog111 character Course grade in geog111. geog221 character Course grade in geog221. hist225 character Course grade in hist225. hum230 character Course grade in hum230. kin110 character Course grade in kin110. kin142 character Course grade in kin142. ling100 character Course grade in ling100. ling110 character Course grade in ling110. macm316 character Course grade in macm316. math152 character Course grade in math152. math232 character Course grade in math232. math251 character Course grade in math251. math310 character Course grade in math310. mbb221 character Course grade in mbb221. mbb222 character Course grade in mbb222. philxx1 character Course grade in philxx1. phys100 character Course grade in phys100. pol100 character Course grade in pol100. pol151 character Course grade in pol151. psyc201 character Course grade in psyc201. psyc210 character Course grade in psyc210. psyc250 character Course grade in psyc250. psyc260 character Course grade in psyc260. psyc385 character Course grade in psyc385. sa100 character Course grade in sa100. stat270 character Course grade in stat270. ws101 character Course grade in ws101. degawrdcnt numeric Number of undergraduate degrees awarded since SEM1. degawrdsem character Semester of first bachelor degree awarded.
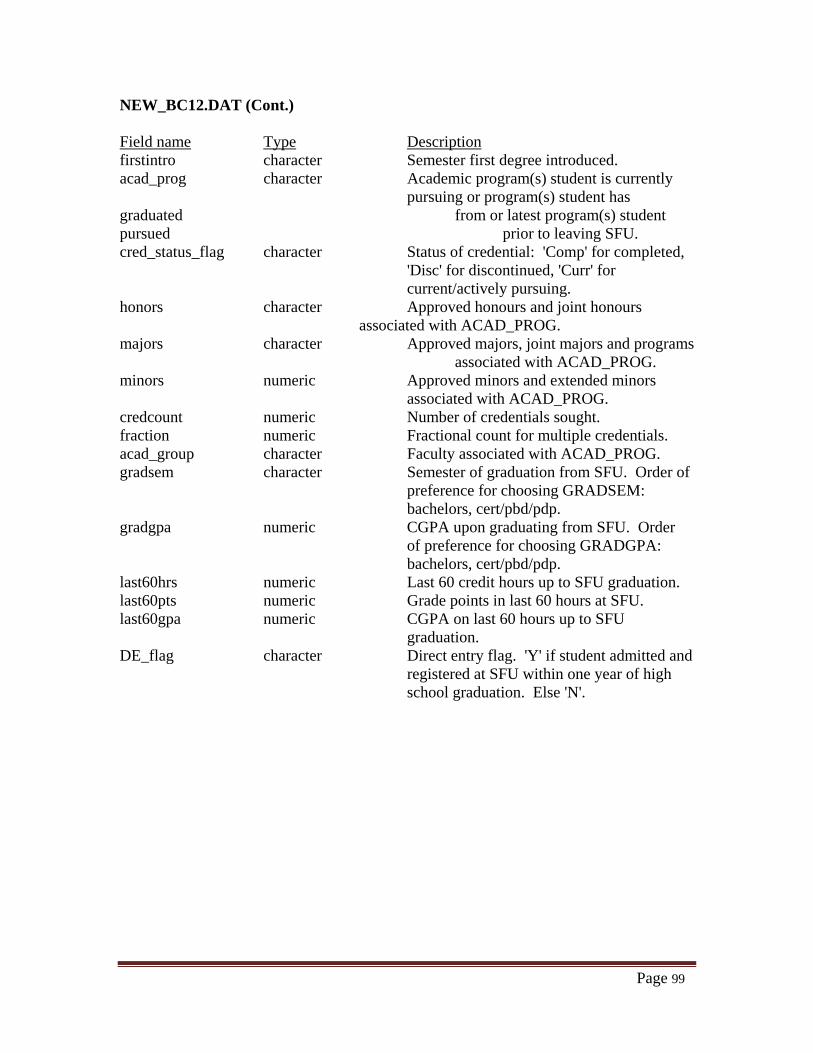
Page 99
NEW_BC12.DAT (Cont.) Field name Type Description firstintro character Semester first degree introduced. acad_prog character Academic program(s) student is currently pursuing or program(s) student has graduated from or latest program(s) student pursued prior to leaving SFU. cred_status_flag character Status of credential: 'Comp' for completed, 'Disc' for discontinued, 'Curr' for current/actively pursuing. honors character Approved honours and joint honours associated with ACAD_PROG. majors character Approved majors, joint majors and programs associated with ACAD_PROG. minors numeric Approved minors and extended minors associated with ACAD_PROG. credcount numeric Number of credentials sought. fraction numeric Fractional count for multiple credentials. acad_group character Faculty associated with ACAD_PROG. gradsem character Semester of graduation from SFU. Order of preference for choosing GRADSEM: bachelors, cert/pbd/pdp. gradgpa numeric CGPA upon graduating from SFU. Order of preference for choosing GRADGPA: bachelors, cert/pbd/pdp. last60hrs numeric Last 60 credit hours up to SFU graduation. last60pts numeric Grade points in last 60 hours at SFU. last60gpa numeric CGPA on last 60 hours up to SFU graduation. DE_flag character Direct entry flag. 'Y' if student admitted and registered at SFU within one year of high school graduation. Else 'N'.

Page 100
NEW_COLEXP.DAT Description: Students admitted to SFU with college experience from a BC College from 2003/04 to 2007/08 (excluding students whose basis of admission was 'BC College Transfer'). One record per student/credential combination (1,249 records for 1,167 students). For students who have not yet been awarded a degree, all active credentials were selected. For students who have been awarded one or more degrees, only the first degree awarded and any other previously awarded certificates were selected. Field name Type Description emplid character Unique student identifier. boa character Basis of admission category. fyear character Fiscal year. sem1 character Admission semester / first SFU semester. tfr_admgpa numeric Admission GPA of college transfer work upon admission to SFU. tfrcred numeric Total transfer credits on admission to SFU. sem1crhrs numeric Number of credits enrolled in during SEM1. birthdate date Date of birth of student (YYYYMMDD). age numeric Age of student at beginning of first semester to SFU. gender character Gender of student. visa character Visa abbreviation of student. maxcollege character College attended with maximum transfer credits. maxtfrcred numeric Transfer credits from MAXCOLLEGE. cgpa1 numeric CGPA after first semester at SFU. sem1_status character Registration status of student at end of SEM1. 'W' if student withdrew in first semester at SFU. cgpa30 numeric CGPA after 30 credit hours at SFU. degawrdcnt numeric Number of undergraduate degrees awarded since SEM1. degawrdsem character Semester of first bachelor degreee awarded. firstintro character Semester first degree introduced. acad_prog character Academic program(s) student is currently pursuing or program(s) student has graduated from or latest program(s) student pursued prior to leaving SFU. cred_status_flag character Status of credential: 'Comp' for completed, 'Disc' for discontinued, 'Curr' for current/actively pursuing. honors character Approved honours and joint honours associated with ACAD_PROG.

Page 101
NEW_COLEXP.DAT (Cont.) Field name Type Description majors character Approved majors, joint majors and programs associated with ACAD_PROG. minors character Approved minors and extended minors associated with ACAD_PROG. credcount numeric Number of credentials sought. fraction numeric Fractional count for multiple credentials. acad_group character Faculty associated with ACAD_PROG. gradsem character Semester of graduation from SFU. Order of preference for choosing GRADSEM: bachelors, cert/pbd/pdp. gradgpa numeric CGPA upon graduating from SFU. Order of preference for choosing GRADGPA: bachelors, cert/pbd/pdp. last60hrs numeric Last 60 credit hours up to SFU graduation. last60pts numeric Grade points in last 60 hours at SFU. last60gpa numeric CGPA on last 60 hours up to SFU graduation. region character Region of student's college (Lower Mainland or Non-Lower Mainland). category character Category of student's college (Northern BC/Yukon, Interior/Kootenays, Vancouver Island, Public or Private). collegeseq character College sequence (order for reporting college in report).

Page 102
BCCOL_GOAL.DAT Description: This file includes only those credentials which were active upon admission to SFU for all BC College transfer students admitted from 2003/04 to 2007/08. This file was used to identify the degree goal upon admission. The credentials in this file may be different from those in New_Bccol. (11,035 records for 10,930 students). Field name Type Description Emplid character Unique student identifier. Boa character Basis of admission category. Sem1 character Admission semester / first SFU semester. AdmGPA numeric GPA upon admission to SFU. AcadGroup character Faculty associated with ACAD_PROG. AcadProg character Student's academic program(s) at admission to SFU. region character Region of student's college (Lower Mainland or Non-Lower Mainland). category character Category of student's college (Northern BC/Yukon, Interior/Kootenays, Vancouver Island, Public or Private). collegeseq character College sequence (order for reporting college in report).


709 – 555 Seymour Street Vancouver BC Canada V6B 3H6 bccat.ca | [email protected]
t 604 412 7700 | f 604 683 0576