transfer credits and transfer students at the university colleges … · 2013-08-02 · a bc...
TRANSCRIPT

555 SEYMOUR STREETSUITE 709VANCOUVER, BCV6B 3H6CANADA
TEL: 604-412-7700FAX: 604-683-0576
EMAIL: [email protected]: www.bccat.bc.ca
Transfer Credits and Transfer Students at the University Colleges of British Columbia: A Study of the Baccalaureate Graduates of 1998-2001
May 2005
Prepared by: Roderick Church
With assistance from: Moufida Holubeshen
Malaspina University-College
Prepared for and Funded by the

2
Transfer Credits and Transfer Students at the University Colleges of British Columbia
A study of the baccalaureate graduates of 1998-2001
Prepared by
Roderick Church Malaspina University-College
With assistance from
Moufida Holubeshen Malaspina University-College
And the support of
Dale Box, University College of the Fraser Valley Susan Chambers, Kwantlen University College
Lynda Lays, Okanagan University College Michaline Novak, University College of the Cariboo
© Copyright 2005 by the British Columbia Council on Admissions and Transfer
709 - 555 Seymour Street, Vancouver, BC V6B 3H6 Canada Phone: (604) 412-7700 Fax: (604) 683-0576
E-Mail: [email protected]
BCCAT is the official mark of the B.C. Council on Admissions and Transfer,
As published by the Registrar of Trade-marks of the Canadian Intellectual Property Office
This Report is also available in Adobe Acrobat Portable Document Format (pdf),
from BCCAT Online, the Internet service of the B.C. Council on Admissions and Transfer:
www.bccat.bc.ca
Photocopying and further distribution of this document is permitted. Please credit source.

Transfer at BC’s University Colleges
3 May 2005
Table of Contents Table of Contents..................................................................................................................................... 3 List of Figures and Tables ....................................................................................................................... 4 Abbreviations and Glossary..................................................................................................................... 5 Acknowledgements.................................................................................................................................. 6 Executive Summary................................................................................................................................. 7 Section 1: Introduction .......................................................................................................................... 11 Section 2: Baccalaureate degrees at the university colleges .................................................................. 14
2.0. Summary................................................................................................................................. 14 2.1. University colleges as degree-granting institutions ................................................................ 14 2.2. Faculties of degrees: universities versus university colleges.................................................. 18 2.3. A profile of degree holders ..................................................................................................... 20 2.4. First and second degrees......................................................................................................... 20
Section 3: The importance of transfer credits for first degrees at university colleges........................... 23 3.0. Summary................................................................................................................................. 23 3.1. The magnitude of transfer credit for first degrees .................................................................. 23 3.2. Transfer credits over time....................................................................................................... 25 3.3. The distribution of transfer credits among students................................................................ 26 3.4. Transfer and university colleges—the regional dimension .................................................... 29
Section 4: University college admissions and transfer students ............................................................ 32 4.0. Summary................................................................................................................................. 32 4.1. Estimated admission categories .............................................................................................. 33 4.2. Admission categories over time.............................................................................................. 37 4.3. BC Transfers—the regional dimension .................................................................................. 39 4.4. The demographic characteristics of major admission categories ........................................... 41
Appendix: The data and their limitations .............................................................................................. 45 A.0. Summary................................................................................................................................ 45 A.1. A learning experience ............................................................................................................ 45 A.2. The approach to data cleaning and the initial data exclusions............................................... 47 A.3. Too many credits—second degrees and more exclusions ..................................................... 47 A.4. Too few credits—inferred degree admissions and transfer credits........................................ 49 A.5. Overall picture of excluded and created credits..................................................................... 52 A.6. Issues not dealt with............................................................................................................... 53 A.7. The structure of the data ........................................................................................................ 54
References.............................................................................................................................................. 56

Transfer at BC’s University Colleges
May 2005 4
List of Figures and Tables Figure ES.1: How admission categories are defined for university college graduates 8 Figure 2.1: The changing institutional ownership of degrees at university colleges, 1998-2001. 15 Table 2.1.a: Baccalaureate degrees (partnership and autonomous) at university colleges, by year 16 Table 2.1.b: Sources of partnership degrees, 1998-2001 17 Table 2.2: Percent of baccalaureate degrees at university colleges, 1998-2001, by faculty, with a
university comparison 18 Figure 2.2: Proportions of Arts & Science versus Applied & Profession degrees, 1998-2001, by
university college 19 Table 2.3: Age and sex of baccalaureate graduates at university colleges, 1998-2001, by faculty 21 Table 2.4: First and second degrees at university colleges, 1998-2001 22 Table 3.1: All transfer credits as a proportion of all credits used for first degrees at university
colleges, 1998-2001 24 Figure 3.2: Percentage of all lower-division transfer credits used for first-degrees at university
colleges, 1998-2001 25 Table 3.2: Percentage of all lower-division transfer credits used for first degrees at university
colleges, by year and source of degree 27 Table 3.3.a: University college first-degree graduates, 1998-2001, by number of transfer credits 28 Table 3.3.b: University college first-degree graduates with 15 or more transfer credits, 1998-
2001, by faculty 28 Table 3.4.a: Provincial origin of lower-division transfer credits used for first degrees at university
colleges, 1998-2001 29 Table 3.4.b: Regional and institutional origin of lower-division BC transfer credits used for first
degrees at university colleges, 1998-2001 31 Table 4.1: Probable admission categories for students with first degrees at university colleges,
1998-2001 36 Table 4.2: Probable admission categories for students with first degrees at university colleges, by
year 38 Table 4.3: Regional and institutional origin of BC Transfer students earning first degrees at
university colleges, 1998-2001 40 Table 4.4: Characteristics of first-degree holders at university colleges, 1998-2001, for major
admission categories 43 Table A.4: Number of attributed transfer students at university colleges, by faculty, 1998-2001 51 Table A.5: Summary of excluded and included credits for first degrees at university colleges,
1998-2001 52

Transfer at BC’s University Colleges
5 May 2005
Abbreviations and Glossary Abbreviation Short Name Full Name BCCAT BCCAT British Columbia Council on Admissions and Transfer CDW Data Warehouse Central Data Warehouse CIP CIP Classification of Instructional Programs KUC Kwantlen Kwantlen University College MUC Malaspina Malaspina University-College OUC Okanagan Okanagan University College PEN PEN Personal Education Number SFU Simon Fraser Simon Fraser University UBC UBC University of British Columbia UCC Cariboo University College of the Cariboo UCFV Fraser Valley University College of the Fraser Valley UNBC UNBC University of Northern British Columbia UVic UVic University of Victoria
Applied and professional degrees The same “applied and professional” designation that is used to group programs on the annual outcomes survey of BC College students. It includes nursing, education, social work, business, art, and the like. It contrasts with “general arts and science” degrees—the typical BA or BSc with a standard disciplinary major like Psychology or Biology.
Attributed transfer credits Transfer credits created for this study for students whose on-line registration record is obviously incomplete and for whom it is reasonable to infer that they had had transfer credits to qualify for their degree.
BC Transfer, BC College Transfer, BC University Transfer A BC Transfer student is someone who has 24-transfer credits (mostly lower-division) from another BC post-secondary institution, including universities, before registering at a university college. This category is also sometimes divided into College and University components in order to match standard university admission categories.
General arts and Science degrees See “applied and professional” degrees
Regional university colleges An informal term to identify Cariboo, Fraser Valley, Malaspina, and Okanagan, which were created first, offer a broad range of degrees, and exist outside the Lower Mainland. Kwantlen, by contrast, was created later, with a mandate originally restricted to applied programs, and it is part of the Greater Vancouver area.
Stable enrolment date Or “stable date”—the date about two weeks after the beginning of a semester or a course when the course registration is considered to be official and course switching and further registration is no longer allowed.
Transfer back An informal term used loosely to refer to either (1) a student who has started at a university college, transferred to a university, and subsequently comes back to the university college to complete a degree, or (2) a student who has moved from the local community directly to a more distant university and who subsequently transfers back to the local university college to complete a degree. In this study, the second type is considered a transfer student but the first is not.

Transfer at BC’s University Colleges
May 2005 6
Acknowledgements This study is a cooperative effort of BC’s five university colleges. Rod Church did the feasibility study and is responsible for the overall design of this project, in conjunction with various directors of Institutional Research: Dale Box (Fraser Valley), Ken Burt (Okanagan), Moufida Holubeshen (Malaspina), and Alistair Watt (Cariboo).
Those primarily responsible for extracting data and trouble shooting initial data problems at their institutions are Dale Box (Fraser Valley), Susan Chambers (Kwantlen), Lynda Lays (Okanagan), Moufida Holubeshen (Malaspina), and Michaline Novak (Cariboo). No doubt there have been many other less visible contributors as well. Institutional Research offices cannot function without the dedicated work of many people in the Registrar’s Office and Information Systems.
Malaspina University-College administered this study on behalf of the BC University College Consortium (now the University Colleges of BC). Moufida Holubeshen had a significant role during the middle stages of this project. She coordinated the data gathering from other institutions, built and managed the original composite database (in Oracle), integrated and cleaned the original data, identified problems, designed some of the earlier results tables, and performed coding for preliminary and quality assurance reports. Rod Church is responsible for everything else—additional data from paper records at Malaspina, attributed transfer credits, admission categorizations, tables, calculations, and the writing of this report.
Besides the people already mentioned, who also commented on a draft of this report, helpful feedback on the first draft came from Stephanie Barclay-McKeown (Okanagan) and from Finola Finlay, Devron Gaber, and Jean Karlinski (all from BCCAT).
The Presidents of the five university colleges (the Consortium), together with Frank Gelin, the Director of BCCAT, deserve special credit. They initiated this study, supported its development, and urged that it be completed when it ran into various data issues and other time delays.

Transfer at BC’s University Colleges
7 May 2005
Executive Summary The questions This report examines transfer credits and transfer students among more than 5,000 baccalaureate graduates at the five university colleges of British Columbia in the calendar years 1998 through 2001. It is intended to complement the reports that BCCAT has commissioned from the universities on how the college-to-university transfer system works in British Columbia. It addresses five main questions:
1. What role do the university colleges play in granting baccalaureate degrees in BC?
2. How important is transfer to university colleges (i.e., how can the university college role as a transfer receiving institution be quantified)?
3. How did transfer activity at university colleges change as these institutions made the transition from providing partnership degrees to awarding their own degrees?
4. What is the impact of regionalism on the pattern of transfer to university colleges?
5. How do transfer students at university colleges differ demographically from other admission categories and how do they perform academically?
The data This study differs in important ways from most university studies of transfer, which are based on admitted students and their admission categories—e.g., “BC College Transfer” and “BC High School.” For the period of this study, university colleges had not yet developed a “transfer” admission category, nor did they routinely track transfer credits at the point of admission. To compensate, this study focuses on baccalaureate graduates (not students admitted) and examines their course records to assess the role that transfer credits played in meeting graduation requirements.
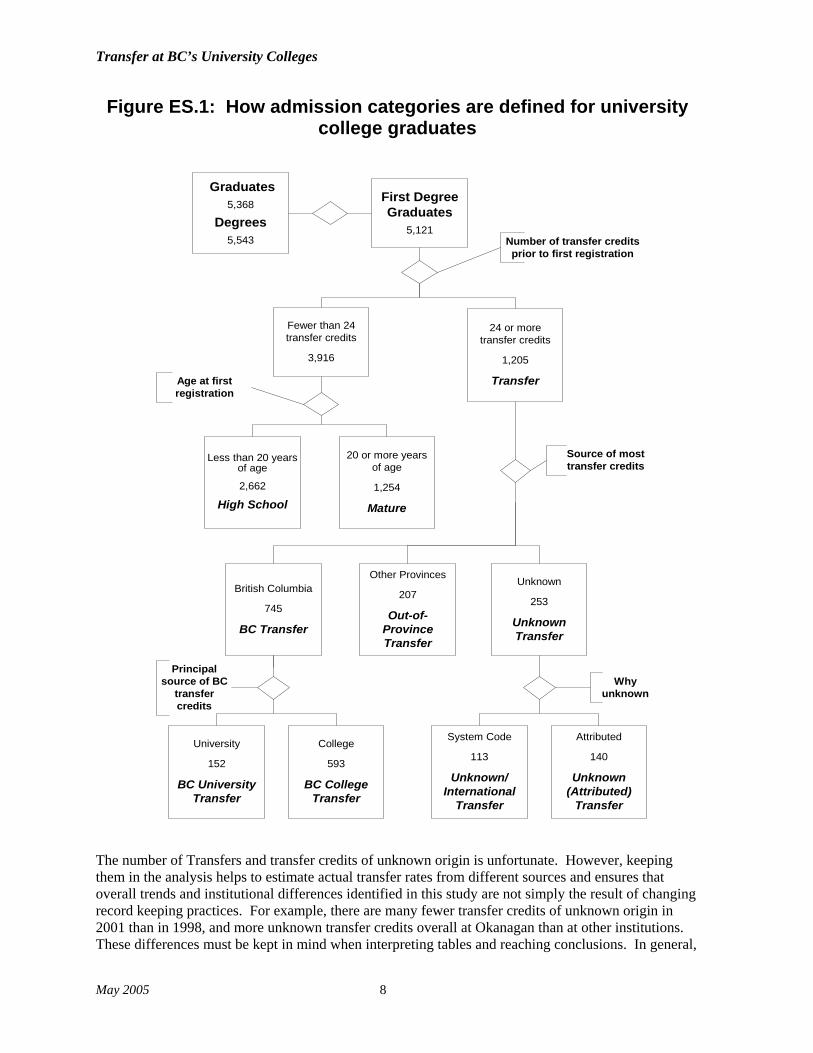
In section 4, this study uses transcripts to infer university-like admission categories for graduates earning their first degree at a university college. These categories and the process for deriving them are outlined in the diagram on the next page. The basic admission categories for this study are High School, Mature, and Transfer. To be considered a Transfer admission, a university college graduate must have had 24 (mainly lower division) transfer credits before beginning at the university college. Transfers are further divided on the basis of the origin of the majority of their transfer credits—BC Transfer, Out-of-Province Transfer, and Unknown Transfer (when the origin of the transfer credits is unknown). BC Transfers are further divided into BC College Transfer and BC University Transfer, depending on the institutional origin of the transfer credits. Although university colleges tend not to distinguish between colleges and universities as sources of transfer credit, universities do, and the creation of separate BC College and BC University Transfer categories for this study allows better comparisons with university studies that focus on BC College Transfers.
Using the system records of graduates to track transfer credits and infer admission categories proved more difficult than expected, mainly because of incompletely documented transfer credits. Various efforts were made to correct the data problems (including consulting paper records at Malaspina), but in the end it was necessary to have the “unknown” element, which comes in two forms. Sometimes the transfer credits are on the student record, but their source is unknown (a problem that is compounded because of a coding scheme that lumps together both unknown Canadian institutions and all international institutions). In other cases (most commonly at Okanagan), it was necessary to attribute transfer credits to students where it was reasonable to infer that they must have been admitted with transfer credits that had simply gone unrecorded in a university college’s on-line student record system. The Appendix explains how this was done.
Transfer at BC’s University Colleges
May 2005 8
Figure ES.1: How admission categories are defined for university college graduates
First DegreeGraduates
5,121
Fewer than 24transfer credits
3,916
24 or moretransfer credits
1,205
Transfer
Number of transfer creditsprior to first registration
Less than 20 yearsof age
2,662
High School
Age at firstregistration
20 or more yearsof age
1,254
Mature
British Columbia
745
BC Transfer
Source of mosttransfer credits
Other Provinces
207
Out-of-ProvinceTransfer
Unknown
253
UnknownTransfer
University
152
BC UniversityTransfer
College
593
BC CollegeTransfer
Principalsource of BC
transfercredits
Attributed
140
Unknown(Attributed)
Transfer
System Code
113
Unknown/International
Transfer
Whyunknown
Graduates5,368
Degrees5,543
The number of Transfers and transfer credits of unknown origin is unfortunate. However, keeping them in the analysis helps to estimate actual transfer rates from different sources and ensures that overall trends and institutional differences identified in this study are not simply the result of changing record keeping practices. For example, there are many fewer transfer credits of unknown origin in 2001 than in 1998, and more unknown transfer credits overall at Okanagan than at other institutions. These differences must be kept in mind when interpreting tables and reaching conclusions. In general,

Transfer at BC’s University Colleges
9 May 2005
however, this report can be read in fairly straightforward fashion. Much has been done to compensate for data issues and tables are interpreted cautiously. If a bias remains, it probably works to understate the importance of transfer at university colleges.
Some findings and conclusions This report is easy to skim. Each section begins with a summary of the main findings from each table, followed by a more detailed analysis of each table written primarily in point form. Section 1 is a general introduction. Section 2 examines the development of the university colleges as degree granting institutions and provides an initial profile of the 5,543 baccalaureate degrees awarded at university colleges between 1998 and 2001. Sections 3 and 4 are based only on university college graduates earning their first degree. Section 3 focuses on the transfer credits for these graduates and Section 4 focuses on the probable admission categories of these students.
In general, this report shows that transfer is alive and well at university colleges, although it is only about half as important as it is at universities. Those who are familiar with the regional pattern of transfer to universities and the differences between transfer and other students at universities will see many of the same relationships at work in the university college context. A summary of the main findings and conclusions can be organized around the five questions outlined above:
1. University colleges by 2000 and 2001 were producing about 1,500 degrees annually, or 10% of all the baccalaureate degrees in the province. In 1998 university colleges still offered a majority of partnership degrees. By 2001 93% were “autonomous” degrees (the university colleges’ own). These degrees (partnership and autonomous) are in nearly all major fields, except engineering, law, and medicine. Compared to universities, university colleges produce a larger proportion of degrees in the helping professions—education, nursing, and social work. Each university college has developed its own distinctive mix of degrees (e.g., Cariboo emphasises Science and Malaspina emphasizes Education). University college degree holders tend to be older and are more likely to be female than university graduates. In general, the picture of university college graduates is consistent with the university college mandate to meet the needs of its region and of less mobile students.
2. About 12% of all credits used for university college degrees are transfer credits and about 18% of all lower-division credits are transfer credits. Over 50% of graduates have some transfer credit and over 33% have 15 or more transfer credits. Over 23% of graduates would have been Transfer students on admission—i.e., they had 24 or more lower–division transfer credits when they first entered the university college. BC Transfers comprise at least 14.5% of first-degree graduates, and the real figure (accounting for some transfers of unknown origin) is probably about 17%. The proportion of BC Transfers (whether college or university in origin) among university college graduates appears to be about half (or slightly less than half) the proportion at universities. The caveat for this generalization is location. Fraser Valley, Kwantlen, and Malaspina, which are closer to other post secondary institutions, have proportions of BC Transfers that are about twice as large as those at Cariboo and Okanagan. In other words, university colleges which are more like the universities in having other post-secondary institutions nearby are more like the universities in their transfer levels. In transfer, as in real estate, location is (almost) everything.
3. There is no clear evidence that transfer to university colleges becomes more important between 1998 and 2001. There is a hint that BC Transfers become more important but it is only a hint. However, there is certainly no decline in transfer overall. The transition from partnership degrees to the university college’s own degrees appears not to have affected the attractiveness of university colleges to transfer students.
4. The transfers to university colleges show a pattern of regionalism that is akin to that found for universities. University colleges draw BC Transfers from institutions that are nearby. Post-

Transfer at BC’s University Colleges
May 2005 10
secondary institutions that are distant from any university college are less likely to have a strong preference for a particular university college.
5. Graduates who entered university colleges as BC Transfers (whether from colleges or universities) tend to differ from direct entry students in the same way that BC College Transfers and direct entry students at universities do—transfer students are more likely to be female, to be older when they graduate, and to be in applied and professional programs. This pattern of difference is actually more pronounced at university colleges. One area where the pattern is not the same is academic achievement. At university colleges BC Transfers tend to have higher graduating GPAs than direct entry students—exactly the reverse of what is true at universities. The explanation for this difference is probably the ability of the universities, on average, to attract high school students with higher GPAs than the college and university colleges attract. This fact could also explain why BC University Transfers to university colleges have even higher graduating GPAs than BC College Transfers.

Transfer at BC’s University Colleges
11 May 2005
Section 1: Introduction
Origins of the study By 1999, the 10th anniversary of BC’s first three university colleges, it seemed the then five university colleges (Cariboo, Fraser Valley, Kwantlen, Malaspina, Okanagan) were here to stay. They had become significant contributors to the province’s annual total of baccalaureate graduates and they had, for the most part, become independent of their former university partners. Yet little was known about how these university colleges fitted into a BC system of higher education that had heretofore depended solely on community colleges and universities. For years, the universities, under the auspices of the BC Council on Admissions and Transfer (BCCAT), had been reporting on the transfer of BC college students to the universities. The Presidents of the university colleges suggested that it was time that their own institutions also got similar attention. BCCAT agreed.
In 2000, BCCAT authorized a grant to the BC University College Consortium to develop transfer reports similar to those that were being produced by the universities for students admitted as BC College Transfers. By October 2001, however, it became clear that university colleges could not yet produce such reports (Church, 2001). Admission and record-keeping practices at most university colleges still reflected community college traditions—there was no well-defined admission category for transfer students and there was no regular practice of assessing and reporting transfer credits at the point of admission. If transfer issues were to be explored at university colleges, a different approach would be necessary.
BCCAT agreed that a different approach could be taken. This different approach begins with graduates (rather than students admitted) and then examines course records to learn about transfer. Although university colleges could not guarantee that transfer credits were documented at the point of admission, they thought the transcripts of their baccalaureate graduates would be complete, with all transfer credits documented. Thus the records of graduates would allow an assessment of the importance of transfer credits in earning degrees and would also permit a fairly reliable inference about whether or not a graduate could have been considered a transfer student on admission.
The questions Five questions provide direction for this study.
1. What role do the university college play in the granting of baccalaureate degrees in BC?
This background question is necessary only because this study is the first to look at what university colleges as a group have been doing with their new mandate to offer degrees. University colleges did not have a secretariat (like The University Presidents’ Council) to aggregate and disseminate information on what they were doing.
2. What is the extent of transfer activity to university colleges (i.e., how can the university college role as a transfer receiving institution be quantified)?
This is a basic question of interest to BCCAT, because the provincial transfer system has so far been studied only from the perspective of universities. People realized that the new university colleges were receiving transfer students, even though they might not have a transfer admission category, but no one had good information about the extent of transfer to university colleges or about how the level of transfer activity might vary among university colleges.
3. How did transfer activity at university colleges change as these institutions made the transition from providing partnership degrees to awarding their own degrees?
Transfer at BC’s University Colleges
May 2005 12
This question concerned university colleges. This study can address it because the 1998-2001 period coincides with the switch at university colleges from a majority of partnership degrees to a majority of autonomous degrees. Under partnership arrangement, a student was essentially attending a remote campus of a university and earning that university’s degree. University colleges were unsure how the ending of partnership arrangements would affect their attractiveness to students. They were concerned that students, particularly transfer students who might have come for university degrees, would not come for university college degrees.
4. What is the impact of regionalism on the pattern of transfer to university colleges?
University profiles of transfer students (well summarized by Heslop [2001]) have always documented the college and regional origin of transfer students. The results have always showed a pronounced regionalism in the pattern of transfer to universities, with students preferring the closest university. Something similar could be expected at university colleges, but how similar remained to be seen. Geographically, university colleges are already more regional than the universities and they are usually without other post-secondary institutions nearby to act as feeders.
5. How do transfer students to university colleges differ demographically from other admission categories and how do they perform academically?
This question is also a staple of the university profiles of transfer students, and the basic concern has always been the comparison between High School direct entry students (who tend to have high admission GPAs) and college transfer students. Transfer students are more likely to be female, to be older at graduation, and to prefer professional programs. For the educational system in the province, probably the most important finding of the comparison is that transfer students from colleges do almost as well academically by graduation as those who are admitted to university directly from high school. Would these finding hold at university colleges?
The data Data for this study were gathered in light of the standards already in use for the provincial Central Data Warehouse or CDW (Version September 2000). However, university colleges were asked to provide complete historical records for students, as well as transfer course records—and neither kind of record was part of the existing submissions to the CDW. The information collected can be summarized this way (the Appendix provides much more detail):
• All baccalaureate degrees between 1998 and 2001 (more than 5,500).
• All students who earned these degrees (more than 5,300).
• All courses, including transfer courses, on the records of these students (more than 300,000).
Unfortunately, as it turned out, the transfer courses on the records of graduates were not nearly as complete as institutional researchers believed they would be. The Appendix discusses this and other data quality problems, as well as the attempts to compensate for them. One problem was a CDW code (“99”) that does not distinguish international institutions from unknown institutions—although the impact of this is largely confined to Cariboo in 1998 and 1999. More seriously, many transfer courses were simply not recorded in on-line registration systems. At Malaspina many of the problems (but by no means all) were rectified by spending many hours consulting paper records and creating new data for this study. But this was not possible at other institutions. This led to the decision to attribute transfer credits to some students where it was reasonable to infer that they must have had them when they entered the university college (see the Appendix for more detail).

Transfer at BC’s University Colleges
13 May 2005
Needless to say, having a number of “unknown” transfer credits and transfer admissions, especially when they are unevenly distributed among the university colleges (Okanagan has more than its share), limits this study in some ways. However, the attributed transfer credits (11.3% of all transfer credits in this study) are absolutely necessary to ensure better answers to some questions—and to remove biases that might arise because of differences among university colleges in record keeping practices and changes in these practices over the years. For example, at an earlier point in the development of this report, it appeared the data would support the conclusion that transfer was becoming significantly more important at the university colleges between 1998 and 2001. But that was before transfer credits were attributed to certain graduates—graduates who almost certainly should have had transfer credits on their record. Now, while the data in Sections 3 and 4 still hint at an increase in the importance of transfer between 1998 and 2001, it is just a hint about a modest change.
The large proportion of transfer credits with an unknown origin has the most impact on the ability of this study to speak clearly to the magnitude of BC Transfers and of the movement of students from particular institutions to university colleges. However, there is no reason to suspect that these transfer credits of unknown origin (especially the attributed transfer credits) differ significantly from those of known origin. The best approach is simply to be aware of the “unknown origin” issue, be aware when it could impact the interpretation of a table or parts of a table, and keep the focus on patterns and relationships within the data, rather than on precise numbers.
Overall, despite the limitations in the data, this report can be read in a fairly straightforward fashion. Much has been done to compensate for data issues and tables are interpreted cautiously. If a bias remains, it probably works to understate the importance of transfer at university colleges.
The future This report was to be the first of two reports, the first one covering 1999-2001 and the second 2002-2004. As it turns out, this first report was able to include 1998—something that is important because it is a year when the majority of graduates still received “partnership” degrees. It is now unlikely that a second report, at least in this format, will be done. The provincial government has decided most degree programs and the whole north campus at Okanagan University College will become part of the University of British Columbia, while the University College of the Cariboo has become Thompson Rivers University. Meanwhile, the remaining university colleges are becoming more university-like in their admission and record-keeping practices, so it may soon be possible to study transfer issues in other ways.

Transfer at BC’s University Colleges
May 2005 14
Section 2: Baccalaureate degrees at the university colleges
2.0. Summary University colleges have become an important source of degrees in BC, first in partnership with the major universities, and then as autonomous degree-granting institutions. By 2000, the five university colleges together were producing about 1500 baccalaureate degrees per year, about 10% of the provincial total. This is almost three times as many as the University of Northern British Columbia and about half the annual number of either Simon Fraser University or the University of Victoria. This section reviews the emergence of BC’s five university colleges as degree granting institutions and shows that:
• By 1999 the university colleges’ own degrees surpassed “partnership” degrees in numbers. By 2001 “autonomous” (i.e., university-college-only) degrees accounted for 93% of all degrees awarded through university colleges (Table 2.1.a).
• The University of Victoria has the most extensive and complex “partnership” relationship with the university colleges during the 1998-2001 period (Table 2.1.b).
• The disciplinary “mix” of baccalaureate degrees at university colleges differs somewhat from that at universities, with more emphasis at university colleges on professional degrees, particularly in education and nursing. Each university college has developed a somewhat distinctive disciplinary “mix” of baccalaureate graduates (Table 2.2).
• University college degree holders tend to be older and are more likely to be female than their counterparts at the universities (Table 2.3).
• Almost 92% of university college degrees are first degrees, but the proportion varies considerably among institutions, with Malaspina having the highest percentage of second degrees (Table 2.4). Second degrees are overwhelmingly in Education. These second degrees are removed from the data that are used for the analysis of transfer in the remainder of this report.
2.1. University colleges as degree-granting institutions In 1989, as part of its “Access for All” initiative, the provincial government began to create university colleges by enhancing the mandate of some community colleges. Okanagan University College (OUC), the University College of the Cariboo (UCC), and Malaspina University-College (MUC) were created in 1989. The University College of the Fraser Valley (UCFV) followed in 1991 and Kwantlen University College (KUC) in 1995.
In all cases except Kwantlen, which had a mandate restricted to applied degrees, the university colleges began their new baccalaureate degree programs in “partnership” with one or more of the province’s major universities—Simon Fraser University (SFU), the University of British Columbia (UBC), and the University of Victoria (UVic). Until 1995, all degrees offered through the university colleges had to be “partnership” degrees. Legally, these were degrees of one of the universities, although the parchment might indicate the degree was offered at the university college. Universities paid close attention to the operations and standards (especially the academic operations and standards) of their university college partners. There was no doubt about who was in control, especially in the early years. Chancellors and other officials of the universities came to the convocations at the university colleges to award their degrees and pass out their alumni pins.

Transfer at BC’s University Colleges
15 May 2005
In 1995, the partnership-apprenticeship period began to end when changes to legislation allowed the university colleges to begin offering degrees under their own name. Over the next few years, one degree program after another left the partnership arrangements. Gradually, as degree programs became autonomous and students finished the partnership programs they had entered, the proportion of partnership degrees began to drop and the proportion of degrees awarded directly by university colleges began to climb. By 2001 only a few examples of partnership degrees remained in the system.
For the four calendar years 1998-2001, the five university colleges of British Columbia awarded 5,543 baccalaureate degrees. Figure 2.1 portrays how quickly the balance between partnership and autonomous degrees shifts during the period of this study.
Figure 2.1: The changing institutional ownership of degrees at university colleges, 1998-2001.
0
200
400
600
800
1000
1200
1400
1600
1800
1998 1999 2000 2001
Partnership Degree Own Degree
Transfer at BC’s University Colleges
May 2005 16
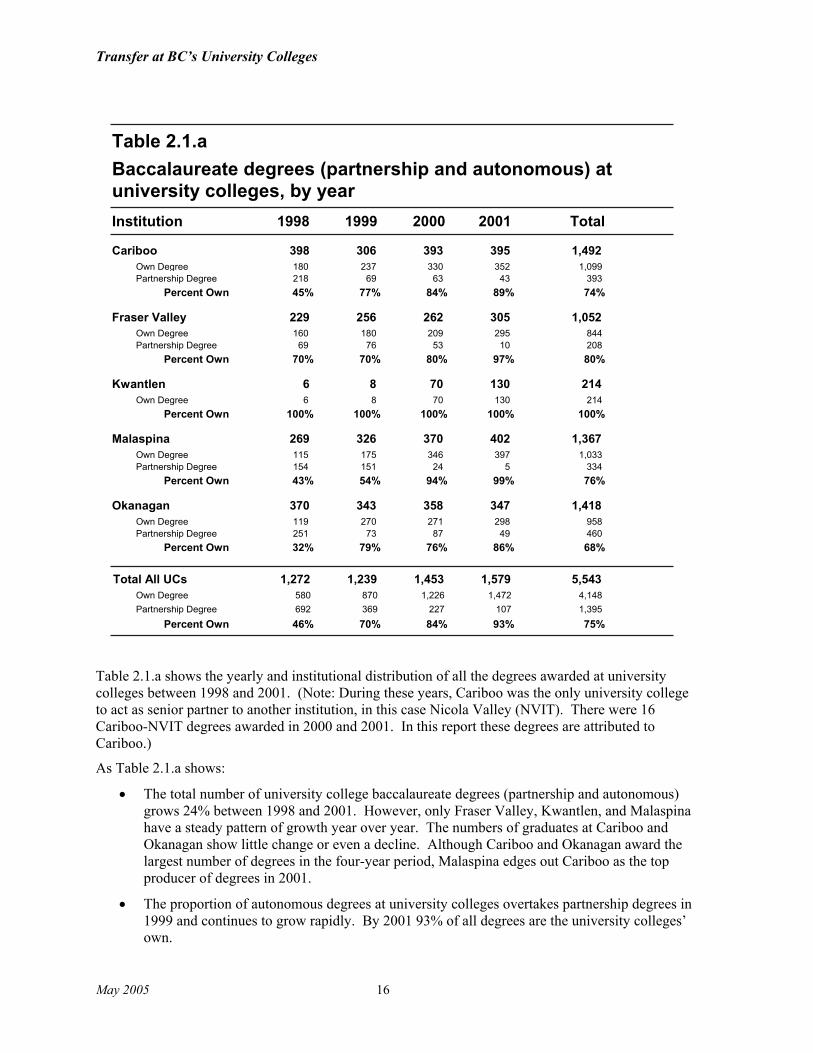
Table 2.1.a shows the yearly and institutional distribution of all the degrees awarded at university colleges between 1998 and 2001. (Note: During these years, Cariboo was the only university college to act as senior partner to another institution, in this case Nicola Valley (NVIT). There were 16 Cariboo-NVIT degrees awarded in 2000 and 2001. In this report these degrees are attributed to Cariboo.)
As Table 2.1.a shows:
• The total number of university college baccalaureate degrees (partnership and autonomous) grows 24% between 1998 and 2001. However, only Fraser Valley, Kwantlen, and Malaspina have a steady pattern of growth year over year. The numbers of graduates at Cariboo and Okanagan show little change or even a decline. Although Cariboo and Okanagan award the largest number of degrees in the four-year period, Malaspina edges out Cariboo as the top producer of degrees in 2001.
• The proportion of autonomous degrees at university colleges overtakes partnership degrees in 1999 and continues to grow rapidly. By 2001 93% of all degrees are the university colleges’ own.
1998 1999 2000 2001 Total
Table 2.1.aBaccalaureate degrees (partnership and autonomous) at university colleges, by yearInstitution
Cariboo 398 393 395306 1,492180Own Degree 237 330 352 1,099218Partnership Degree 69 63 43 39345%Percent Own 77% 84% 89% 74%
Fraser Valley 229 262 305256 1,052160Own Degree 180 209 295 844
69Partnership Degree 76 53 10 20870%Percent Own 70% 80% 97% 80%
Kwantlen 6 70 1308 2146Own Degree 8 70 130 214
100%Percent Own 100% 100% 100% 100%
Malaspina 269 370 402326 1,367115Own Degree 175 346 397 1,033154Partnership Degree 151 24 5 33443%Percent Own 54% 94% 99% 76%
Okanagan 370 358 347343 1,418119Own Degree 270 271 298 958251Partnership Degree 73 87 49 46032%Percent Own 79% 76% 86% 68%
1,272 1,239 1,453 1,579 5,543Total All UCs580Own Degree 870 1,226 1,472692Partnership Degree 369 227 10746%Percent Own 70% 84% 93%
4,1481,39575%

Transfer at BC’s University Colleges
17 May 2005
• Of the four university colleges in partnership arrangements, Fraser Valley is the first to have a majority of autonomous degrees. By 2001, Malaspina ranks first in the proportion of degrees that are its own.
With about 1,500 degrees per year in 2000 and 2001, the five university colleges together produced baccalaureate degrees at about half the rate of Simon Fraser University or the University of Victoria, each of which produced about 3,000 baccalaureate degrees per year during this period. UBC produced about 6,000 per year, and UNBC produced about 525 per year. Looked at another way, by 2000 and 2001 the university colleges were producing more than 10% of all baccalaureate degrees from public post-secondary institutions in British Columbia.
Table 2.1.b shows the source of partnership degrees at the university colleges. From 1998 to 2001:
• The University of Victoria plays the most significant role as a partner to university colleges. It has by far the largest number of degrees awarded and it is connected to all four of the university colleges with partnership arrangements. UVic’s prominence is due to its professional degrees—the BEd (at Malaspina and Okanagan), the BSW (at Cariboo and Okanagan), the BA in Child and Youth Care (Fraser Valley and Malaspina), and the BSN (Cariboo, Malaspina, and Okanagan). Malaspina also offered UVic’s BA and BSc degrees.
• UBC plays a significant role because of its BA and BSc programs at Cariboo and Okanagan, and its BEd at Cariboo.
• Simon Fraser and the Open University play more limited roles as partnering institutions, both exclusively with Fraser Valley. SFU provides the BA and BSc partnership programs. The OU is Fraser Valley’s BSN partner.
• With three partners, Fraser Valley has the most varied partnership relationships. With only one partner, Malaspina has the simplest arrangement (and one of the most flexible—in one case Malaspina offered a partnership BA degree in Liberal Studies that was not offered at UVic itself).
Partnership arrangements tended to end earliest in the Arts and Sciences. Thus, fully 50% of all partnership degrees between 1998 and 2001 are Education degrees—all BEd degrees at Okanagan and Cariboo and about 45% of the Education degrees at Malaspina. By contrast, none of the Business and Management degrees are partnership degrees, as these degree programs tended to be developed after autonomy. (The disciplines of degrees are discussed in more detail in the next section.)
OU SFU UBC UVic Total
Table 2.1.bSources of partnership degrees, 1998-2001University College
Cariboo 328 65 393Fraser Valley 50 86 72 208Kwantlen 0Malaspina 334 334Okanagan 97 363 460
50 834Total partnership degrees 86 425 1,395

Transfer at BC’s University Colleges
May 2005 18
2.2. Faculties of degrees: universities versus university colleges University colleges were expected to be less expensive alternatives to the existing provincial universities, both for students who did not have to travel so far for education and for the province which did not have to fund research facilities or specialized schools like engineering. University colleges were also expected to be responsive to the specific needs of their regions. Do these expectations influence the fields in which university colleges developed degrees and produced graduates?
Table 2.2 examines this issue. It includes all degrees awarded at university colleges (both “partnership” and “autonomous”) organized by faculties (or disciplines or fields of study). The two right-most columns show how the degrees awarded at university colleges as a group compare to those awarded at universities. They show:
• University colleges as a whole award a much lower proportion of degrees in science and applied science, a reflection in part of what facilities the province was prepared to fund.
• University colleges award a much higher proportion of degrees in the helping professions—human services, education, and nursing.
This is not an unexpected picture. This different emphasis between university colleges and universities is similar to that between regional universities and research universities in an American state. Science and engineering degrees require a much more costly infrastructure, something that university colleges are discouraged from developing. The demand for professionals in the regions also explains the popularity of professional programs at university colleges—and in this case the Ministry has been prepared to sponsor the more expensive nursing programs.
Uni-ver-
sitiesUCFV KUC MUC OUC
Table 2.2Percent of baccalaureate degrees at university colleges, 1998-2001, by faculty, with a university comparison
Degree Category UCC AllUCs
Humanities and Social Sciences 39.227.2 54.3 39.9 29.8 35.1
Fine and Applied Arts, Journalism 3.42.1 28.0 5.4 3.0
Science 17.222.6 7.5 4.7 5.3 13.7 12.5
Business and Administration 10.915.4 9.3 40.2 5.0 8.0 10.8
Education 11.411.6 4.3 33.4 18.9 17.0
Human Services 2.910.6 17.5 7.4 10.2 10.6
Nursing 7.410.5 7.1 27.1 9.0 13.9 11.0
NOTE: University data are for 2000-01 and 2001-02 only. These university data are summarized from system figures (all public universities, including UNBC and Royal Roads) for baccalaureate degrees, found in TUPC Facts and Figures, TUPC Table 5.2, Degrees Conferred By Discipline, available at: http://www.tupc.bc.ca/facts_figures/index.asp. Note: these data have now been replaced on the website with those for later years.
100.0%Total
N
100.0% 100.0% 100.0%100.0% 100.0% 100.0%1,492 2141,052 1,367 5,543 25,3421,418

Transfer at BC’s University Colleges
19 May 2005
Table 2.2 also shows how university colleges are developing their own emphases in terms of degrees awarded:
• Cariboo has by far the highest proportion of science degrees—higher even than the universities.
• Malaspina has the highest proportion of education degrees—and it is the only university college to offer its own degree in Education during this period.
• The Kwantlen emphasis is nursing and applied arts—although Kwantlen is in the very early stages of degree development.
• Fraser Valley has the highest proportion of graduates in general arts and in human services—UCFV’s criminology degree is classified as a social science under general arts.
• Okanagan’s degree mix most closely approximates the pattern of all university colleges.
Figure 2.2 provides an overview, grouping degree programs into the two categories sometimes used in other parts of this report—degrees for general Arts & Science programs versus degrees for Applied & Professional programs (Business, Education, Fine Arts, Nursing, Social Work)). At this more general level, the three oldest university colleges (Cariboo, Malaspina, Okanagan) have quite similar profiles, while Kwantlen, the newest university college and the one with a more restricted mandate, definitely stands out.
Figure 2.2: Proportions of Arts & Science versus Applied & Profession degrees, 1998-2001, by university college
0
10
20
30
40
50
60
70
80
90
100
UCC UCFV KUC MUC OUC
Arts & Science Applied & Professional

Transfer at BC’s University Colleges
May 2005 20
2.3. A profile of degree holders Even with their new status as degree-granting institutions, university colleges were expected to serve the traditional functions of the community colleges—offering students a “second chance” and making education available to those who, because of family obligations or limited finances, could not easily make the journey to one of the universities.
Table 2.3 offers a brief profile of the 5,268 students who were awarded degrees at university colleges between 1998 and 2001. It shows:
• Overall, about 70% of those with baccalaureate degrees at university colleges are women. This is a higher proportion than at the universities. The 2002 BC University Baccalaureate Graduate Survey prepared by Dumaresq and Sudmant (2002: 7) reports about 61% women among all baccalaureate graduates. The higher proportion of women graduates at university colleges can be explained partly by the disciplinary mix of degrees at university colleges—for example, faculties like Nursing, Education, and Human Services have higher proportions of females even at universities, and it is these fields that are more common at university colleges. By contrast, men are more dominant at universities in engineering, a field that is absent at university colleges.
• University college graduates are older on average than their university counterparts—29.4 versus 27.9 (the university age comes from Dumaresq and Sudmant (2002: 7). The surprise for some people might be that the age difference is not larger. (However, the university data are from a survey and it may be that the most mobile, and youngest, graduates are underrepresented.)
• Business and science graduates at university colleges are younger than those from other fields—a fact which mirrors the situation in universities (Dumaresq and Sudmant [2002: 9]).
• If the general image is one of university colleges serving a more female and older clientele than the universities, Malaspina serves as the exemplar. It has the highest proportion of female graduates and the oldest average age at graduation. Cariboo, with its larger number of science graduates, more closely approximates the university pattern.
Overall, Table 2.3 suggests that university colleges are serving a somewhat different clientele than the universities, but perhaps not that much different—especially if the different program mix at university colleges is taken into account.
2.4. First and second degrees Not all the degrees awarded at university colleges are first degrees. Because admissions to first degrees are the focus of most studies of college-to-university transfer, this study has tried to identify second degrees among university college graduates and to eliminate these cases from the analysis of transfer. The Appendix (A.3 and A.4) explains how second degrees are identified (first degrees are the residual category). It is sufficient here to note that the identification process is far from perfect, and some errors undoubtedly remain—although they are not likely to bias the results significantly. Only the records of graduates earning their first degrees are used in the analysis of transfer credits and transfer students in Sections 3 and 4 of this report. Removing second degrees from the analysis is also the only convenient way to avoid double counting some records or including atypical credit records.

Transfer at BC’s University Colleges
21 May 2005
UCC KUC MUC OUC All UCs
Table 2.3Age and sex of baccaulaureate graduates at university colleges, 1998-2001, by faculty
UCFV
Females
Females by faculty
Graduation age by sex
Average graduation age by faculty
NOTE: Some cases get dropped in calculations because of missing gender or birth date information. Overall, 14 cases are missing both birthdate and gender, 4 cases are missing only birth date, and 17 are missing only gender. Cases affected are from Okanagan (16), Fraser Valley (13), and Cariboo (6).
Ns for cells in this table (by faculty)
69.8%65.9% 67.0% 68.2% 74.6% 71.4%
71.7% 65.1% 70.9% 67.2% 68.6%Humanities and Social Sciences54.8% 93.3% 71.4% 76.2%Fine and Applied Arts, Journalism48.8% 19.7% 40.0% 52.8% 45.4% 44.9%Science40.4% 43.9% 37.2% 55.9% 48.2% 43.8%Business and Administration79.8% 80.0% 76.1% 84.6% 79.4%Education84.1% 89.1% 90.1% 84.4% 86.8%Human Services93.6% 97.3% 93.1% 95.9% 92.8% 94.2%Nursing
27.9 29.5 27.6 31.0 29.6 29.4Overall
30.028.4 30.3 28.0 31.2 30.3Female
28.126.9 28.2 26.5 30.5 27.6Male
Humanities and Social Sciences 29.027.3 28.0 31.8 28.2Fine and Applied Arts, Journalism 29.328.7 28.3 30.4Science 25.925.6 26.6 33.7 26.9 25.4Business and Administration 26.025.6 26.0 25.8 26.6 26.5Education 31.028.2 46.7 30.8 30.5Human Services 33.934.7 32.9 32.8 35.4Nursing 31.330.3 30.7 28.3 31.6 33.1
Humanities and Social Sciences 1,946406 571 546 423Fine and Applied Arts, Journalism 16831 60 77Science 692337 79 10 72 194Business and Administration 596230 98 86 68 114Education 943173 45 457 268Human Services 588158 184 101 145Nursing 610157 75 58 123 197

Transfer at BC’s University Colleges
May 2005 22
Table 2.4 shows Malaspina awards second degrees more often than other university colleges do. This may partly reflect more complete access to Malaspina records (see the Appendix), but Malaspina has a high proportion of second degrees primarily because of the size and structure of its Education program. This program has had a distinct post-degree route to the BEd degree for years. Malaspina now admits to the BEd program only students who already have a degree or who agree to pursue a BEd and another degree concurrently. All 275 of the second degrees at Malaspina are BEd degrees—fully 60% of the 457 BEd degrees awarded at the institution.
Education degrees are also the most common second degrees elsewhere. Although the Education programs at other university colleges do not seem to put the same emphasis on second degrees as Malaspina does, the option is always there and the provincial system of education puts a premium on teachers who have two degrees. Of the 93 second degrees identified at Cariboo, 83 are Education (48% of the Education degrees awarded at Cariboo). At Okanagan 49 of the 51 second degrees are in Education (18% of all the Education degrees awarded).
Thus, the main difference between first degrees (the basis of the following sections of this report) and all degrees (the focus of this section) is the subtraction of about 400 BEd degrees. This is about 45% all Education degrees awarded by university colleges from 1998 to 2001. The majority of these subtractions come from Malaspina. (For a fuller discussion of second degrees, see the Appendix.)
UCC KUC MUC OUC Total
Table 2.4First and second degrees at university colleges, 1998-2001Status of Degree UCFV
Second degree: another UC degree 1998-2001 40 121 14 175
Second degree: another UC degree before 1998 27 25 15 67
Second degree: admitted with university degree 26 1 129 20 176
First degree 1,399 1,051 214 1,092 1,369 5,125
1,492
93.8%
Total Degrees
Percent First Degrees
1,052
99.9%
214 1,367 1,418 5,543
100.0% 79.9% 96.5% 92.5%

Transfer at BC’s University Colleges
23 May 2005
Section 3: The importance of transfer credits for
first degrees at university colleges 3.0. Summary University studies of transfer in British Columbia focus on student admissions, particularly the distinction between transfer and direct entry students. This section takes a different approach and focuses instead on the type, origin, and importance of transfer credits that students use to earn their first degrees. The analysis shows:
• For 1998-2001, all transfer credits (known or unknown origin) are 12.3% of all credits used to earn first degrees at university colleges, and 17.9% of lower-division credits. The relative importance of transfer credits varies considerably by institution and seems to depend on proximity to other institutions—compared to Cariboo and Okanagan in the Interior, Kwantlen, Fraser Valley, and Malaspina have significantly higher levels of transfer credit (Table 3.1).
• The importance of lower-division transfer credits remains relatively constant between 1998 and 2001. Although the proportion of all transfer credits for all university colleges is higher in 2001 than in any of the three earlier years, and the general trend over the four years is a slight increase, the relationship is weak and the pattern is inconsistent among institutions. However, the evidence shows clearly that university colleges have made the transition to their own degrees without a loss in transfer credits (Table 3.2).
• The proportion of first-degree graduates at university colleges with at least some transfer credit on their record is 50.1%. This varies considerably by institution. The proportion with 15 or more transfer credits is 33.1 % overall, with Kwantlen, Fraser Valley, and Malaspina significantly higher than the others. Graduates with applied and professional degrees (except Business) are more likely to have 15 or more transfer credits (Tables 3.3.a and 3.3.b).
• The pattern of credit transfer among institutions is clouded by a large number of transfer credits of unknown origin, especially at Okanagan. But, overall, for transfer credits of known Canadian origin, 20.6% come from out-of-province. All the university colleges are close to this proportion, except Kwantlen, where the out-of-province proportion is only 5% (Table 3.4.a).
• Transfer credits that are known to originate in British Columbia display the expected regional pattern. University colleges are linked most closely with institutions near to them (Table 3.4.b).
3.1. The magnitude of transfer credit for first degrees Table 3.1 shows how transfer credits contribute to the records of 5,125 students who earned their first degree at university colleges between 1998 and 2001. The table shows both lower-division (years 1 and 2) and upper-division (year 3 and higher) credits and whether the credits come from transfer or the university college itself.

Transfer at BC’s University Colleges
May 2005 24
As Table 3.1 shows:
• Overall, 12.3% of the credits students used to get their first degrees at university colleges are transfer credits—a proportion that varies from 9.1% (Cariboo) to 19.5% (Kwantlen).
• As one would expect, these transfer credits are predominantly lower-division (years 1 and 2) compared to upper-division (years 3 and higher). The ratio is about 4:1. Overall, 17.9% of the lower-division credits come from transfer. There are no comparable figures available for the universities, but the university numbers are probably about twice as large or more. [Note: The university estimates are based on the following assumptions: (i) more than half of university graduates are transfers from colleges or other universities and (ii) they typically bring in close to two full years of credit, so the proportion of transfer credit among university graduates is likely to be 25% or more overall. Because nearly all transfer credits are lower division, and (iii) lower-division credits constitute about 60% of all credits used for graduation, the transfer proportion among lower-division credits is likely to be about 40%.]
• The importance of lower-division transfer credits seems to depend on geography. The two lower mainland institutions (Kwantlen and Fraser Valley) have the highest proportion of transfer credits—a reflection, no doubt, of how easy it is for students attending other lower-mainland institutions to attend them. It is fitting that Malaspina has the next highest proportion of transfer credits, because Malaspina is next in line in terms of proximity to other institutions (North Island College, Camosun College, and the University of Victoria.) Graduates at Cariboo and Okanagan, the university colleges that are farthest from other population centers and other institutions, rely less on transfer credits.
UCC UCFV KUC MUC OUC
Table 3.1 All transfer credits as a proportion of all credits used for first degrees at university colleges, 1998-2001
Level and sourceof credit All UCs
Lower Division89,512 65,834 13,815 70,652 95,809Own Credits 335,62015,291 20,105 5,013 17,623 15,045Transfer Credits 73,076
14.6% 23.4% 26.6% 20.0% 13.6% 17.9%Percent Transfer
Upper Division78,782 52,683 10,437 59,272 73,570Own Credits 274,743
1,591 2,976 859 3,499 3,345Transfer Credits 12,270
2.0% 5.3% 7.6% 5.6% 4.3% 4.3%Percent Transfer
9.1%
Total 168,294Own Credits16,882Transfer Credits
16.3%
118,51623,081
19.5%
24,2515,871
14.0%
129,92421,122
9.8%
169,37818,390
12.3%
610,36385,346
Percent Transfer

Transfer at BC’s University Colleges
25 May 2005
3.2. Transfer credits over time Although a four-year period is a short one in which to detect trends in transfer patterns, trends are worth looking for because they are important in understanding what university colleges have achieved and how they are evolving. Two possible trends have been suggested:
1. Transfer credits decline in importance over time. This could result both from the ending of “partnership” degrees, which might make the university colleges less attractive to transfer students, and from the gradual depletion of the original population of older local students who had completed some post-secondary education elsewhere but who, in the 1990s, were located in towns like Kamloops, Kelowna, and Nanaimo, without ready access to a way to finish their degree.
2. Transfer credits increase in importance over time. This could result (and university colleges hope it will result) as university colleges establish themselves, build their reputations, and gradually become “destination” institutions like the universities.
This issue is best examined by focussing on lower-division transfer credits because they are the ones associated with the classic transfer student. Figure 3.2 illustrates the overall trend at university colleges for all lower-division transfer credits (of both known and unknown origin). It shows relatively little change over the four years. The percentage of lower-division transfer credits hovers around 18%, with a hint (but only a hint) at a rising trend since 1999.
Figure 3.2: Percentage of all lower-division transfer credits used for first-degrees at university colleges, 1998-2001
0
5
10
15
20
25
1998 1999 2000 2001

Transfer at BC’s University Colleges
May 2005 26
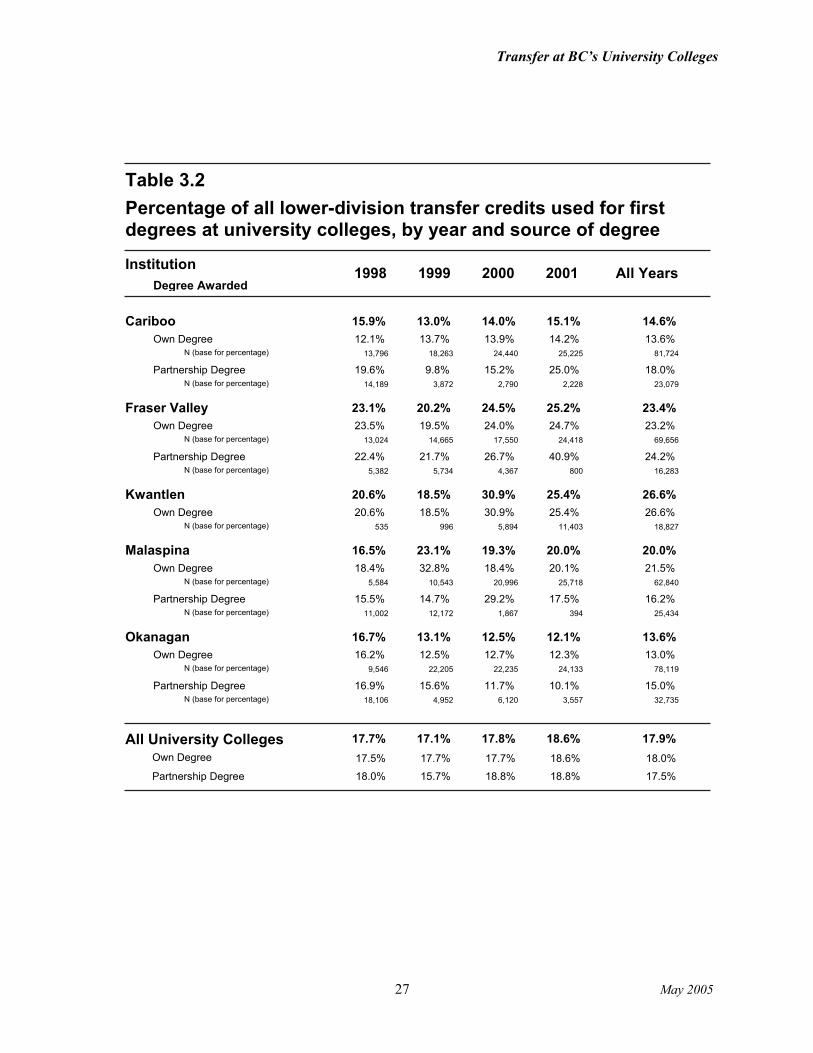
Table 3.2 presents more detailed evidence, including a distinction between partnership degrees and the university colleges’ own degrees. At the institutional level it is difficult to see any consistent pattern in the relative importance of transfer credits over the four years in this study.
• Among the four “regional” university colleges, where trends are most relevant, the evidence is mixed. Malaspina is up slightly (the spike in 1999 is due largely to a cohort of international nursing students) and so is Fraser Valley. But Cariboo is at best steady and Okanagan is trending steadily downward in the proportion of transfer credits over the four years.
• For the university colleges’ own degrees, the picture is not much different. Overall there is a steady if very modest increase in the proportion of transfer credits, but Kwantlen (the new and growing addition to the ranks of university colleges) contributes directly to this aggregate trend. Among the four “regional” university colleges, the Okanagan trend is still downward, Malaspina and Fraser Valley show (at most) slight increases, and Cariboo (which starts out at lower level than anyone else) has a steady increase with 2001 about 17% higher than 1998.
• For all university colleges, the proportion of transfer credits does not differ much for partnership degrees (17.5%) or autonomous ones (18.0%). Over the four years, the proportion of transfer credits is higher for partnership degrees at Cariboo, Okanagan and Fraser Valley, but not Malaspina. Year to year variation at institutions is also quite high.
In short, there is no convincing evidence for transfer credits either increasing or decreasing over time. However, because there is no general trend downward in transfer credits (Okanagan is the only exception), it is probably fair to conclude that the transition to partnership degrees has not hurt the ability of the university colleges to attract lower-division transfer credits. At the same time, these data do not suggest university colleges are moving much in the direction of becoming “destination” institutions.
This topic is revisited in terms of transfer students instead of transfer credits in the next section (4.2).
3.3. The distribution of transfer credits among students Table 3.3.a shows how all transfer credits are distributed among students who earned first degrees at university colleges during the period of the study. Table 3.3.b shows the faculties most likely to attract students with 15 or more transfer credits.
• The proportion of university college first-degree graduates with at least some transfer credit on their record is 50.1%. This varies from a high of 62.7% (Fraser Valley) to 41.8% (Cariboo).
• The proportion with 15 or more transfer credits (equivalent to one semester of study) is 33.1% overall, with Kwantlen, Fraser Valley, and Malaspina significantly higher than Okanagan or Cariboo—a situation which mirrors the distribution of all transfer credits (Table 3.1).
Professional faculties such as Social Work, Nursing, and Education are more likely to have students with 15 or more transfer credits than are Arts and Science and Business Administration. Science and Business are lowest, the two areas that also have the highest proportion of males and the youngest graduation ages (Table 2.3).
Transfer at BC’s University Colleges
27 May 2005
1998 1999 2000 2001 All Years
Table 3.2Percentage of all lower-division transfer credits used for first degrees at university colleges, by year and source of degree
InstitutionDegree Awarded
Cariboo 15.9% 13.0% 14.0% 15.1% 14.6%Own Degree 12.1%
N (base for percentage) 13,796
13.7%18,263
13.9%24,440
14.2%25,225
13.6%81,724
Partnership Degree 19.6%N (base for percentage) 14,189
9.8%3,872
15.2%2,790
25.0%2,228
18.0%23,079
Fraser Valley 23.1% 20.2% 24.5% 25.2% 23.4%Own Degree 23.5%
N (base for percentage) 13,024
19.5%14,665
24.0%17,550
24.7%24,418
23.2%69,656
Partnership Degree 22.4%N (base for percentage) 5,382
21.7%5,734
26.7%4,367
40.9%800
24.2%16,283
Kwantlen 20.6% 18.5% 30.9% 25.4% 26.6%Own Degree 20.6%
N (base for percentage) 535
18.5%996
30.9%5,894
25.4%11,403
26.6%18,827
Malaspina 16.5% 23.1% 19.3% 20.0% 20.0%Own Degree 18.4%
N (base for percentage) 5,584
32.8%10,543
18.4%20,996
20.1%25,718
21.5%62,840
Partnership Degree 15.5%N (base for percentage) 11,002
14.7%12,172
29.2%1,867
17.5%394
16.2%25,434
Okanagan 16.7% 13.1% 12.5% 12.1% 13.6%Own Degree 16.2%
N (base for percentage) 9,546
12.5%22,205
12.7%22,235
12.3%24,133
13.0%78,119
Partnership Degree 16.9%N (base for percentage) 18,106
15.6%4,952
11.7%6,120
10.1%3,557
15.0%32,735
All University Colleges 17.7%17.5%Own Degree
Partnership Degree 18.0%
17.1%17.7%
15.7%
17.8%17.7%
18.8%
18.6%18.6%
18.8%
17.9%18.0%
17.5%

Transfer at BC’s University Colleges
May 2005 28
UCC UCFV KUC MUC OUC
Table 3.3.aUniversity college first-degree graduates, 1998-2001, by number of transfer credits
Transfer Credits All UCs
814 392 86 513 753 2,55858.2%0 37.3% 40.2% 47.0% 55.0% 49.9%
N (base for percentage)
153 162 10 100 158 58310.9%01-06 15.4% 4.7% 9.2% 11.5% 11.4%
N (base for percentage)
73 73 16 54 73 2895.2%07-14 6.9% 7.5% 4.9% 5.3% 5.6%
N (base for percentage)
62 57 16 66 68 2694.4%15-23 5.4% 7.5% 6.0% 5.0% 5.2%
N (base for percentage)
87 69 19 88 97 3606.2%24-35 6.6% 8.9% 8.1% 7.1% 7.0%
N (base for percentage)
81 88 17 89 71 3465.8%36-53 8.4% 7.9% 8.2% 5.2% 6.8%
N (base for percentage)
129 210 50 182 149 7209.2%54 plus 20.0% 23.4% 16.7% 10.9% 14.0%
N (base for percentage)
Total 15 or more
Percent of university college first-degree graduates with 15 or more transfer credits, 1998-2001, by faculty
UCC UCFV KUC MUC OUC All UCs
25.7% 40.3% 47.7% 38.9% 28.1% 33.1%
NOTE: Students with 15 or more transfer credits should not be confused with "transfers" or transfer students. Transfer admissions are discussed in the next section of this study.
Faculty
Table 3.3.b
NOTE: Based on all transfer creditis, including those with an unknown origin.
18.7% 39.2% 38.8% 21.7%Humanities and Social Sciences 31.1%
65.5% 65.0% 14.3%Fine and Applied Arts, Journalism 41.6%
18.8% 25.3% 50.0% 34.7% 20.1%Science 22.0%
18.7% 15.3% 32.6% 36.8% 15.8%Business and Administration 21.6%
14.4% 90.9% 38.5% 34.8%Education 37.2%
59.4% 57.1% 37.6% 45.5%Human Services 51.5%
34.4% 26.7% 51.7% 44.7% 42.1%Nursing 39.7%

Transfer at BC’s University Colleges
29 May 2005
3.4. Transfer and university colleges—the regional dimension The interprovincial picture Table 3.4.a shows the provincial origins of lower-division transfer credits. Unfortunately, because over 20% of all transfer credits have an unknown origin (some are international), and because these “unknowns” are very unevenly distributed among institutions, it is difficult to say much about the absolute number of transfer credits from different sources. With this in mind, the lines at the bottom of Table 3.4.a are based only on credits of known Canadian origin.
• Close to 80% of all transfer credits with a known Canadian origin come from BC. The four older, regional university colleges are quite consistent in their proportion of BC transfer credits. Kwantlen has a much higher proportion of BC credits (95%), perhaps because of its restricted range of programs or perhaps because it is the newest university college.
• Neighbouring Alberta provides the largest proportion of out-of-province transfer credits—9.6% overall, and 12.0% of those of known origin. With the exception of Kwantlen, these Alberta transfer credits also are quite evenly distributed across the university colleges.
• Populous Ontario provides 3.6% of all lower-division transfer credits overall and 4.5% of those of known origin. Malaspina gets proportionally more of these Ontario transfer credits than average, and Cariboo less.
Overall, despite the sharp diversity in the proportion of total transfer credit at the different university colleges, the relative strength of the various provincial sources of such credit is strikingly similar, especially for the four regional institutions.
UCC UCFV KUC MUC OUC
Table 3.4.aProvincial origin of lower-division transfer credits used for first degrees at university colleges, 1998-2001
Province All UCs
British Columbia 57.8% 74.5% 90.9% 67.3% 40.1% 63.3%Alberta-North 10.0% 13.8% 9.8% 6.4% 9.6%Prairies 1.9% 0.7% 0.8% 1.5% 2.0% 1.4%Ontario 1.9% 4.5% 2.9% 5.6% 2.1% 3.6%Quebec 1.3% 0.5% 0.4% 1.4% 1.0% 1.0%Maritimes 0.4% 1.3% 0.6% 0.9% 0.6% 0.8%International/Unknown 23.7% 1.4% 3.7% 8.9% 5.7% 8.9%Unknown Attributed 3.0% 3.3% 0.5% 4.5% 42.1% 11.3%
15,291N 20,105 5,013 17,623 15,033 73,064Total 100.0% 100.0% 100.0% 100.0% 100.0% 100.0%
11,209N 19,154 4,799 15,250 7,844 58,256
British Columbia 78.2% 95.0% 77.8% 76.8% 79.4%78.8%
Percentages based only on credits of known Canadian origin
Alberta-North 14.4% 0.0% 11.4% 12.2% 12.0%13.7%
Ontario 4.7% 3.1% 6.5% 4.0% 4.5%2.6%
Transfer at BC’s University Colleges
May 2005 30
BC transfer credits University studies of BC College Transfer students have shown a marked regionalism in the pattern of transfer. Students from Vancouver Island colleges favour UVic. Students from Langara and Capilano (nearest Point Grey) favour UBC. Students from Douglas and Kwantlen favour SFU. Those from New Caledonia favour UNBC. Students from colleges that are more distant from the universities show less allegiance to particular universities, although UVic seems to be a favourite (see Heslop [2001: 37]). Given the importance of living and transportation costs, and therefore the advantage of studying close to home, the regional preferences of students transferring to university is not surprising.
Table 3.4.b explores the regional origin of BC transfer credits at university colleges. This table must be interpreted carefully because transfer credits of unknown origin are excluded. It is not appropriate to read across the rows of the table to compare the preference of students of a particular college for different university colleges. For example, one could read Table 3.4.b to say Selkirk transfer credits are almost as likely to end up at Cariboo as Okanagan. But Okanagan has a much higher proportion of unknown (attributed) transfer credits than Cariboo does. It is quite likely that more than a few of these unknown transfer credits at Okanagan are from Selkirk, which would then make Okanagan the significantly more likely destination for Selkirk transfer credits. Reading Table 3.4.b by columns to show the comparative importance of different regions as sources of transfer credit at university colleges (as the percentages in Table 3.4.b do) presents fewer problems.
Table 3.4.b definitely shows the expected regionalism:
• Cariboo and Okanagan draw transfer credits disproportionately from the Interior and the Kootenays. NVIT shows the close connection with Cariboo that one would expect. Cariboo also draws well from the North.
• Although Malaspina draws better than might be expected from the North and the Interior, it is decidedly Island-centric in its transfer credits. Over 50% of the BC transfer credits at Malaspina come from the Island (and over 50% of the known Island transfer credits end up at Malaspina). North Island College credits which are transferred to university colleges almost invariably go to Malaspina. The Malaspina-North Island connection is the strongest tie between any two institutions in Table 3.4.b. Malaspina also has more than 50% of the credits from Northwest Community College, no doubt because of the coastal and First Nations connections.
• Fraser Valley and Kwantlen draw disproportionately from Lower Mainland institutions. Douglas is a heavy contributor to Fraser Valley, as is Kwantlen. The relative paucity of transfer credits from Capilano and Langara is also striking—confirming the close connection of these colleges with UBC and SFU (see Heslop [2001: Table 3]).
• The university colleges also draw from the universities—over 20% of all the known BC transfer credits originate at the five universities (including Trinity Western but excluding the Open Learning Agency—with OLA the proportion rises to 25.7%). Relative to the size of their student populations, there are fewer transfer credits from UBC and more from UVic than one would expect. (Perhaps UVic’s prominence as a source of transfer credits is explained by some combination of its large summer school, extension programs, and partnerships with university colleges for professional degrees.) In general, the credits from universities are quite widely dispersed among university colleges, although there is the expected connection between UVic and Malaspina and between Simon Fraser and Fraser Valley. Perhaps the biggest surprise is Cariboo, which draws well from both UVic and Simon Fraser.
• Credits from Fraser Valley are least likely to end up at other university colleges. Okanagan, by contrast, has many lower-division credits transferred to Cariboo and Malaspina. Cariboo and Okanagan are each other’s most common destination for transfer credits—a reflection of

Transfer at BC’s University Colleges
31 May 2005
their relative proximity to one another and their relative distance from the provincial universities.
UCC UCFV KUC MUC OUC
Table 3.4.b Regional and institutional origin of lower-division BC transfer credits used for first degrees at university colleges, 1998-2001
Source of Transfer All UCs
North 12.1% 3.0% 3.2% 6.3% 8.2% 6.3%348 276 81 1,194489College of New Caledonia41 102 219 685323Northern Lights College14 66 288 102 50636Northwest Community College53 81 81 90 524219University of Northern British Columbia
Interior/Kootenays 31.8% 6.3% 1.3% 15.7% 23.9% 15.4%147 102 372123College of the Rockies
21 91 460348Nicola Valley Institute of Technology518 61 825 2,8311,427Okanagan University College97 275 932 2,219915Selkirk College
306 525 408 1,239University College of the Cariboo
Lower Mainland 28.6% 68.8% 91.5% 21.0% 40.3% 47.4%224 195 124 39 759177British Columbia Institute of Technology361 102 219 189 1,027156Capilano College
4,189 2,652 516 338 8,070376Douglas College30 6 36Emily Carr Institute of Art & Design
3,045 162 252 3,49839Kwantlen University College599 565 381 543 2,307219Langara College38 30 54 14321Other
879 173 277 253 2,272690Simon Fraser University283 41 27 96 50760Trinity Western University
53 45 156 587333University College of the Fraser Valley585 354 588 450 2,415438University of British Columbia66 102 111 29718Vancouver Community College
Vancouver Island 20.0% 14.4% 2.1% 50.7% 17.6% 24.0%1,508 3 1,598 232 3,601260Camosun College
388 9 246 977334Malaspina University-College63 2,869 30 2,9653North Island College
205 84 1,548 555 3,5661,174University of Victoria
BC Other 7.5% 7.5% 1.8% 6.2% 10.0% 6.9%56 150 185 571180B.C. Department of Education
1,063 84 589 417 2,633480Open Learning Agency
8,838N 14,980 4,558 11,859 6,026 46,261All Regions 100.0% 100.0% 100.0% 100.0% 100.0% 100.0%

Transfer at BC’s University Colleges
May 2005 32
Section 4: University college admissions
and transfer students 4.0. Summary This section examines transfer to university colleges in a manner that is analogous to that used in university profiles of transfer students. It uses probable admission categories (established after the fact on the basis of transcripts) to approximate categories that universities apply at the time of admission. The Executive Summary for this report has a diagram of the admission categories for this study and the method by which they were inferred. This section (4.1) provides more detail on the categories and classification procedures. The basic categories are High School, Mature, and Transfer (where Transfer student admissions must have 24 or more transfer credits prior to their admission to the university college). Transfer admissions are further divided in terms of the source of the transfer credits. BC Transfers (where the majority of transfer credits are from British Columbia) are further divided between BC College Transfers and BC University Transfers in order to provide a closer approximation to the admission categories used by universities.
For first-degree graduates from the university colleges, the results show:
• Overall, 52% of first degree graduates enter university colleges directly from High School and another 24.5% enter as Mature students. Another 23.5% enter as Transfer students. Documented BC College Transfers are 11.6% and a reasonable estimate of the real proportion (taking unknown transfers into account) is about 13.6%. Documented BC University Transfers are 3.0%, and the real proportion is probably about 3.4%. Thus about 17% of graduates entered university colleges as BC Transfers, a proportion that is about half that found in studies of university graduates. University colleges that are closer to other post-secondary institutions (and thus more like universities in location) have a larger proportion of transfer students (Table 4.1).
• There is no large or consistent pattern of change in the admission categories of first degree graduates between 1998 and 2001, although there are signs of a decreasing proportion of Mature student admissions and an increasing proportion of High School direct entry and BC Transfer students. Most university colleges seem to have made the transition to their own degrees without any loss in transfer students (Table 4.2).
• BC Transfer among university college graduates shows the expected regionalism in choice of institution—with Fraser Valley and Kwantlen drawing disproportionately from the Lower Mainland, Malaspina from Vancouver Island, and Cariboo and Okanagan from the Interior-Kootenays and the North (Table 4.3).
• BC Transfers (whether College or University) are more likely to be female, be older at graduation, have an applied and professional degree, and get higher grades than students who enter university colleges directly from High School. This picture is similar to that found in university studies of BC College Transfer except that transfer students at universities tend to have slightly lower grades than BC High School entrants. At university colleges, BC University Transfers have higher average grades than do BC College Transfers (Table 4.4).
Transfer at BC’s University Colleges
33 May 2005
4.1. Estimated admission categories Until very recently, university colleges, in keeping with their community college roots, have administered their university programs without university-like admission categories or processes. There are two main issues:
• Colleges, especially for university transfer programs, have traditionally been open to all on a first-come, first-admitted basis, provided minimum qualifications are met. Typically, community colleges have only two admission categories—High School (someone who comes shortly after completing high school) and Mature (typically someone 20 or older, who can be admitted without completing high school). The “transfer” category doesn’t exist (or hasn’t in the past). From the college perspective, students in university transfer programs are simply passing through and it is a waste of resources to assess and record transfer credits for them at the time of admission. University colleges have moved beyond this community college approach only slowly, in part because many students continue to use them as a stop on the road to university, and the benefits of new admission practices may not seem worth the costs.
• Colleges have been open to the comings and goings of students and to changes in program. It is not unusual for a college student to try a course or two shortly after high school, do poorly, drop out, and reappear a few years later, perhaps after taking credits at another institution. Nor is it unusual for a student to start a college diploma program and shift to a related or unrelated university transfer program. Colleges usually do not treat these kinds of program changes as readmission decisions (the exception is entry to limited-enrolment technical programs which usually have competitive admissions). Compared to universities, it is easier to get into the first year of university programs at university colleges, to switch programs, and to find other institutions at which to study. This can make for much more complex educational paths than one typically finds at universities—paths that are largely unmarked by university-style admission decisions and record keeping.
In recent years, admissions processes at university colleges have begun to change. It may not be long before they have admission categories that are much like those of the universities. However, that time is not yet—which is why this study focuses on graduates, not on students admitted.
This study estimates university-like admission categories for university college graduates. The estimation procedure uses (a) the age a student started at the university college in a university program and (b) the number and origin of lower division transfer credits on the student’s record, together with (c) a check to ferret out “transfer back” cases—i.e., those situations where a student may have enough lower-division transfer credits to be considered a transfer student but where the student has actually begun at the university college, left, gained credits elsewhere, and returned to the university college.
The following subsections explain the estimation procedures in more detail and also consider how these estimation procedures might result in differences compared to similar university categories.
Category: High School High School (or Direct Entry) students are traditionally defined as those who go to a university college directly or almost directly after graduating from high school. In this study they are students who took their first course at the university college before their 20th birthday and who did not otherwise qualify as transfer students.
This category is not exactly the same as the BC High School “direct entry” category used by universities, but one study indicated that 98% of all BC High School admissions at SFU are less than 20 years of age (Heslop [1998: 30]). University college registration systems are often poor in their ability to report the high school attended by students or the high school graduation date. This means that a few of those classified here as High School admissions may not be high school graduates and a

Transfer at BC’s University Colleges
May 2005 34
few of them may be out-of-province or international students. On the other hand, Mature admissions (next category) may include a few people who are just out of high school but over 20 years old. Overall, however, errors in classification are not likely to be many, so High School admissions for this study are a fairly good equivalent of the BC High School direct entry category in university studies of transfer.
Category: Mature Mature students are those who start university programs at the university college at the age of 20 or more and who have fewer than 24 transfer credits (or who had 24 transfer credits but who were classified as Mature because they appeared to have taken a course at the university college after the age of 20 but before earning their transfer credits—the “transfer back” phenomenon).
Note: Four graduates could not be classified as either Mature or Direct Entry because of missing birth dates. There were 18 cases of missing birth dates altogether, but most of these were at Okanagan and they ended up being classified as Unknown (Attributed) Transfers They were Nursing graduates who obviously entered with diplomas from elsewhere.
Category: BC Transfer—College or University This study initially had only a BC Transfer category—in part to avoid further fragmentation of tables and numbers, but also to make a point. Universities have two BC transfer admission categories, one for the college system, including university colleges and institutes, and one for universities (a category that seldom gets studied). While this distinction is understandable historically, it is perhaps less relevant today. From the perspective of university colleges, the universities are potential sources of transfer students, just as university colleges are to universities. In the end, however, this study bows to convention and often distinguishes “BC College Transfers” and “BC University Transfers” (the latter includes Trinity Western University as well as SFU, UBC, UNBC, and UVic). The term “BC Transfers” is used when both college and university categories are combined.
In this study BC Transfers (either the College or the University variety) are those who move to a university college after completing at least 24 lower-division credits (i.e., most of first year), mostly or exclusively from other BC post-secondary institutions. In a few cases, the lower-division requirement is relaxed to a minimum of 18 transfer credits, provided a student still had a total of 24 transfer credits. This is because first and second year courses at one institution can sometimes transfer as upper-division courses at another institution, particularly in professional programs. These exceptions to the rule of 24 lower-division credits were made only after visually inspecting the student’s complete course record for sequencing. Only 12 of the 45 cases examined were eventually classified as BC Transfers.
Cases identified in the above fashion were also checked to see that a person was not a “transfer back” student—someone who started at the university college and who left and acquired transfer credits before returning. Of the more than 850 cases tentatively identified as BC Transfers based on lower-division transfer credits alone, about 70 cases were moved to the High School and Mature categories based on breaks in their enrolment record at the university college and a visual inspection of their records.
This definition of a BC College Transfer student may differ in a couple of ways from those in university studies:
• Universities use different numbers of credits for transfer admission status, from 15 to 30. A minimum of 24 credits is, however, most common and this seems to be the way most university colleges think about the difference between first and second year students and transfer status. This study therefore uses 24.

Transfer at BC’s University Colleges
35 May 2005
• The BC College Transfer category at universities requires that the relevant transfer credits be taken at a college or university college before admission to the university. This study cannot ensure this standard is met for university colleges because there is no consistent date coding on the transfer course records of university college students. (See the Appendix.) Although efforts have been made to detect and reclassify “transfer back” cases, some errors may remain.
Despite these caveats, it is likely that those classified as BC Transfers in this study are a reasonable approximation of those who would have been so classified by universities.
When a transfer student has transfer credits from multiple institutions, this study follows the same rule for attributing the student to a single institution as the university transfer studies do—the institution with the most credits becomes the transferring institution, or, in the case of a tie, the institution with the most recent transfer credits is the transferring institution.
Category: Out-of-Province Transfer These are students, like the BC Transfers, who have 24 or more transfer credits (at least 18 lower division), but with the majority from Canadian institutions outside BC. An attempt was made to eliminate “transfer back” cases and assign them to either the High School direct entry or Mature student admission categories. Because of the smaller numbers, no distinction is made in this category on the basis of a college or university origin of the transfer credits.
Category: International/Unknown Transfer These are students who have 24 lower division transfer credits from an international or unknown source. Unfortunately, the Data Definition standards for the Central Data Warehouse use the same code (“99”) for an international institution and an unknown institution. In at least one case (Cariboo in 1998 and 1999), there are probably a significant number of cases where “99” has been used to indicate “unknown” for some domestic students whose transfer credit details are unknown. For Malaspina, the cases in this admission category are usually international—for example, a cohort of students from Korea graduated with BSNs from Malaspina in 1999.
Category: Unknown (Attributed) Transfer These are cases where graduates lacked sufficient recorded credits for their degree and where it was reasonable to infer that they entered with transfer credits or advanced standing on the basis of a two-year diploma (see the Appendix, A.4). Many of these cases involve nursing and social work programs, where advanced standing on the basis of a two-year diploma or one-year certificate is common. These Unknown (Attributed) Transfers are a result of record keeping practices and are heavily concentrated at Okanagan. It is quite likely that these attributed transfers are primarily BC Transfers and Out-of-Province Transfers in about the same proportion as for recorded cases of transfer—although there are probably a few “international transfers” among them. (Note: Malaspina likely would have had just as many or more of these cases of attributed transfer as Okanagan does, were it not for the extra effort made to consult paper records at Malaspina and generate new data for this study. See the Appendix for more details.)
Results of the categorization Table 4.1 reports the distribution of first-degree graduates among university colleges in terms of these admission categories.

Transfer at BC’s University Colleges
May 2005 36
As Table 4.1 shows:
• The most common admission categories are High School (52.0%) and Mature (24.5%). The proportion of Mature admissions among graduates seems to be much higher than it is at BC universities—an indication that university colleges are still playing the “second-chance” role expected of them. The proportion of High School and Mature admissions varies among university colleges. Cariboo has a relatively high ratio of High School to Mature student admissions. Malaspina, on the other hand, has the highest proportion of Mature student admissions among its first-degree graduates.
• The proportion of all Transfer students among first-degree graduates at university colleges for 1998-2001 is 23.5%. The proportion varies from more than 37% (Kwantlen) to less than 19% (Cariboo and Okanagan). Not surprisingly, the proportions of Transfer students at the different institutions closely match the proportions of lower-division transfer credits reported in Table 3.1. Those highest in total transfers are also highest in BC Transfer students. The
UCC UCFV KUC MUC OUC
Table 4.1 Probable admission categories for students with first degrees at university colleges, 1998-2001
Admission Category All UCs
BC College Transfer103 211 53 161 65 593
7.4% 20.1% 24.8% 14.7% 4.8% 11.6%
BC University Transfer42 31 19 38 22 152
3.0% 2.9% 8.9% 3.5% 1.6% 3.0%
Out-of-Province Transfer42 71 4 58 32 207
3.0% 6.8% 1.9% 5.3% 2.3% 4.0%
International/Unknown Transfer67 4 3 25 14 113
4.8% 0.4% 1.4% 2.3% 1.0% 2.2%
Unknown (Attributed) Transfer7 10 1 14 108 140
0.5% 1.0% 0.5% 1.3% 7.9% 2.7%
High School836 493 89 472 772 2,662
59.8% 46.9% 41.6% 43.2% 56.5% 52.0%
Mature301 231 45 324 353 1,254
21.5% 22.0% 21.0% 29.7% 25.8% 24.5%
18.7% 31.1% 37.4% 27.1% 17.6% 23.5%All Transfers
77.5%BC Transfers as a proportion of all known Canadian transfers 77.3% 94.7% 77.4% 73.1% 78.3%
10.4% 23.0% 33.6% 18.2% 6.4% 14.5%All BC Transfers
1,398 1,051 214 1,092 1,366 5,121
100.0% 100.0% 100.0% 100.0% 100.0% 100.0%Total

Transfer at BC’s University Colleges
37 May 2005
proximity pattern noted in Table 3.1 also holds for Transfer students. Kwantlen, Fraser Valley, and Malaspina, which have other BC post-secondary institution nearby, have a much higher level of BC Transfers than do the more isolated university colleges (Cariboo and Okanagan).
• Known cases of BC College Transfer are 11.6% overall, with another 3.0% from universities—a total of 14.6% for all BC Transfers. The real proportion of BC Transfer students is probably about 17%, because many of the International/Unknown Transfers at Cariboo and a large proportion of the Unknown (Attributed) Transfers elsewhere are obviously BC Transfers. A reasonable estimate for the real level of BC College Transfers is 13.6% and for BC University Transfers 3.4%—a total of 17% for all BC Transfers (also see the discussion of Table 4.2—which suggests these estimates are reasonable and conservative). Data from a survey of the Class of 1996 shows BC College Transfers are about 30% of university graduates. BC University Transfer admissions are probably another 6% of university graduates. (These inferences come from combining information in Sudmant et al. [2002], Dumaresq et al. [2003], and Heslop [2001].) In general, therefore, BC Transfers appear to be just under half as important at university colleges as they are at universities (45% as important for BC College Transfers or 47% as important for all BC Transfers—college and university. (WARNING: This is a reasonable picture of the difference between university colleges and universities, but the data for the comparison are not equivalent. The university data, for example, besides being based on a survey, exclude international students. A few international students are included in the base for university college calculations, a fact which works to lower the university college number in comparison to university numbers.)
• The previous two points lead to a more general observation. BC Transfers may be only about half (or less) as important at university colleges as they are at universities, but there is an important caveat—location. Fraser Valley, Kwantlen, and Malaspina, which are closer to other post-secondary institutions, have proportions of BC transfer students that are about twice as large as those at Cariboo and Okanagan. It is fitting that Kwantlen, with its Lower Mainland location amidst other colleges and two of the three major universities, has the highest level of transfer (about equal to the level of the universities). Kwantlen is followed by Fraser Valley (which lies next closest to other post-secondary institutions) and then by Malaspina (next closest). In other words, university colleges which are more like the universities in having other post-secondary institutions nearby are more like the universities in their transfer levels. From this perspective, the existing levels of transfer to university colleges for baccalaureate degrees may be about what can reasonably be expected. In transfer, as in real estate, location is (almost) everything.
• If only transfer students of known Canadian origin are considered, the four regional and fairly comprehensive university colleges (Cariboo, Fraser Valley, Malaspina, and Okanagan) are quite consistent in the proportion of BC Transfers (see the bottom row in Table 4.1). Overall, about 4 in 5 Canadian transfer students are from BC. This ratio is almost identical to the proportion of transfer credits that come from BC (Table 3.4.a).
4.2. Admission categories over time Table 4.2 allows another look (see also section 3.2 above) at how transfer has been evolving at a time when most university colleges were celebrating their 10th anniversaries and completing the switch to offering their own degrees. One piece of good news in the transfer data is the reduction in “unknown” transfers of various kinds, an indication that record keeping practices in university colleges are improving. This is especially true at Okanagan, Cariboo, and Malaspina where most of the data issues were located. Even the need to use paper records was down significantly at Malaspina in 2001.
Transfer at BC’s University Colleges
May 2005 38
1998 1999 2000 2001 All Years
Table 4.2 Probable admission categories for graduates with first degrees at university colleges, by yearInstitution
Admission Category
Cariboo 18.7% 18.6% 18.2% 19.2% 18.7%All TransfersBC College Transfer 3611 24 322.9% 1038.2% 8.8% 9.8% 7.4%BC University Transfer 1410 7 112.7% 422.4% 3.0% 3.8% 3.0%Out-of-Province Transfer 167 6 131.9% 422.1% 3.6% 4.3% 3.0%International/Unknown Transfer 539 16 710.4% 675.5% 1.9% 1.4% 4.8%Unknown (Attributed) Transfer 3 1 30.8% 70.3% 0.8% 0.5%High School 220223 175 21859.5% 83660.1% 60.1% 59.6% 59.8%Mature 7882 62 7921.9% 30121.3% 21.8% 21.1% 21.5%
Fraser Valley 31.0% 24.6% 34.5% 33.8% 31.1%All TransfersBC College Transfer 6753 44 4723.1% 21117.2% 18.0% 22.0% 20.1%BC University Transfer 107 3 113.1% 311.2% 4.2% 3.3% 2.9%Out-of-Province Transfer 2110 12 284.4% 714.7% 10.7% 6.9% 6.8%International/Unknown Transfer 11 1 10.4% 40.4% 0.4% 0.3% 0.4%Unknown (Attributed) Transfer 43 3 101.2% 1.1% 1.3% 1.0%High School 144109 122 11847.6% 49347.7% 45.2% 47.2% 46.9%Mature 5849 71 5321.4% 23127.7% 20.3% 19.0% 22.0%
Kwantlen 50.0% 62.5% 41.4% 33.1% 37.4%All TransfersBC College Transfer 311 1 2016.7% 5312.5% 28.6% 23.8% 24.8%BC University Transfer 101 4 416.7% 1950.0% 5.7% 7.7% 8.9%Out-of-Province Transfer 22 42.9% 1.5% 1.9%International/Unknown Transfer 3 34.3% 1.4%Unknown (Attributed) Transfer 116.7% 10.5%High School 6326 8937.1% 48.5% 41.6%Mature 243 3 1550.0% 4537.5% 21.4% 18.5% 21.0%
Malaspina 23.7% 32.1% 24.3% 27.3% 27.1%All TransfersBC College Transfer 5828 38 3714.1% 16113.6% 13.0% 17.6% 14.7%BC University Transfer 123 9 141.5% 383.2% 4.9% 3.6% 3.5%Out-of-Province Transfer 1813 16 116.6% 585.7% 3.9% 5.5% 5.3%International/Unknown Transfer 220 3 257.1% 1.1% 0.6% 2.3%Unknown (Attributed) Transfer 3 7 41.5% 142.5% 1.4% 1.3%High School 15183 109 12941.9% 47238.9% 45.4% 45.8% 43.2%Mature 8968 81 8634.3% 32428.9% 30.3% 27.0% 29.7%
Okanagan 21.5% 16.6% 16.3% 16.0% 17.6%All TransfersBC College Transfer 249 15 172.5% 654.5% 4.9% 7.1% 4.8%BC University Transfer 92 5 60.6% 221.5% 1.7% 2.7% 1.6%Out-of-Province Transfer 68 9 92.3% 322.7% 2.6% 1.8% 2.3%International/Unknown Transfer 53 4 20.8% 141.2% 0.6% 1.5% 1.0%Unknown (Attributed) Transfer 1054 22 2215.3% 1086.6% 6.4% 3.0% 7.9%High School 194181 197 20051.3% 77259.3% 58.1% 57.6% 56.5%Mature 8996 80 8827.2% 35324.1% 25.6% 26.4% 25.8%
BC College Transfers 8.8% 102
All UCs All Transfers 23.0% 267
10.5% 122
22.9% 267
11.6% 153
23.4% 310
14.7% 216
24.5% 361
11.6% 593
23.5% 1,205
BC University Transfers 2.0% 23 2.4% 28 3.5% 46 3.7% 55 3.0% 152
Out-of-Province Transfers 3.3% 38 3.7% 43 4.8% 63 4.3% 63 4.0% 207
International/Unknown/Attributed 9.0% 104 6.3% 74 3.6% 48 1.8% 27 4.9% 253
High School 51.3% 596 51.7% 603 52.3% 691 52.5% 772 52.0% 2,662
Mature 25.7% 298 25.4% 297 24.3% 321 23.0% 338 24.5% 1,254
Transfer at BC’s University Colleges
39 May 2005
Overall, Table 4.2 shows limited change in the pattern of admission categories of graduates during the period of this study. More specifically:
• Overall, between 1998 and 2001, there is a modest but reasonably steady increase in the proportion of all transfer students among graduates with first degrees—from 23% to 24.5%, a small increase, but still a relative change of 6.5% (1.5/23). However, the pattern is not consistent at individual university colleges. Cariboo is steady and Okanagan actually decreases—which is consistent with the direction in transfer credits at Okanagan (Table 3.2).
• Table 4.2 can be read to support the real estimates of BC College and BC University Transfers provided in the discussion of Table 4.1. International/Unknown/Attributed transfers of various kinds have almost disappeared by 2001 (those that remain are likely to be largely international). In that year, BC Transfers are 18.4% overall, with Colleges at 14.7% and Universities at 3.7%. These figures are higher than the estimates provided in the discussion of the previous table (i.e., 17.0%, 13.6%, and 3.4%). Unfortunately, the large proportion of unknown transfer credits in the earlier years makes it impossible to be sure about any trends in BC Transfers. However, the jump in BC College Transfers between 2000 and 2001 is certainly more than can be explained by a dwindling number of unknown transfers. That plus the clearly increasing level of all transfers hints that university colleges are becoming more attractive to BC College Transfers, but it is no more than a hint.
• For all university colleges there is a small but steady increase in the proportion of High School admissions among graduates between 1998 and 2001. However, the pattern at individual university colleges is less consistent. Cariboo and Fraser Valley show almost no change—the increase for all university colleges is mainly due to changes at Okanagan in 1999, Malaspina in 2000, and Kwantlen in 2001.
• The most consistent (and strongest) trend in Table 4.2 is the decline in Mature student admissions. This is evident in the totals for all university colleges, where the drop from 25.7% of first degree graduates in 1998 to 23.0% in 2001 is a decline of more than 10% in relative terms (2.7/25.7). Also, every university college has a lower proportion of Mature student graduates in 2001 than it did in 1998. This decline in Mature students is apparently made up by the very small increase in High School direct entry admissions and a more significant, if still small, increase in BC Transfers.
Malaspina provides the best example of an institution which displays all the trends that are suggested for the university colleges as a group. At Malaspina, Mature student admissions among graduates are definitely down, High School and BC Transfer admissions are definitely up. However, compared to other university colleges, Malaspina in 1998 has the highest proportion of Mature admissions and the lowest proportion of High School admissions. In typifying overall trends, Malaspina is simply moving toward the group average and helping to shift that average slightly.
Overall, the relative stability in the importance of various admission categories over the four years supports the view that university colleges made the transition to autonomous degrees with little impact on admission patterns. Also the directions of changes (the small declines in Mature student admissions and the small increases in BC Transfers and direct entries from high school) are moving the university colleges in a university-like direction.
4.3. BC Transfers—the regional dimension Table 4.3 explores the regional origin of BC Transfer graduates at university colleges. Like Table 3.4.b, this table must be interpreted cautiously, because a significant number of transfers of unknown origin, particularly at Okanagan, are excluded. Therefore, analysis across the rows can be misleading.
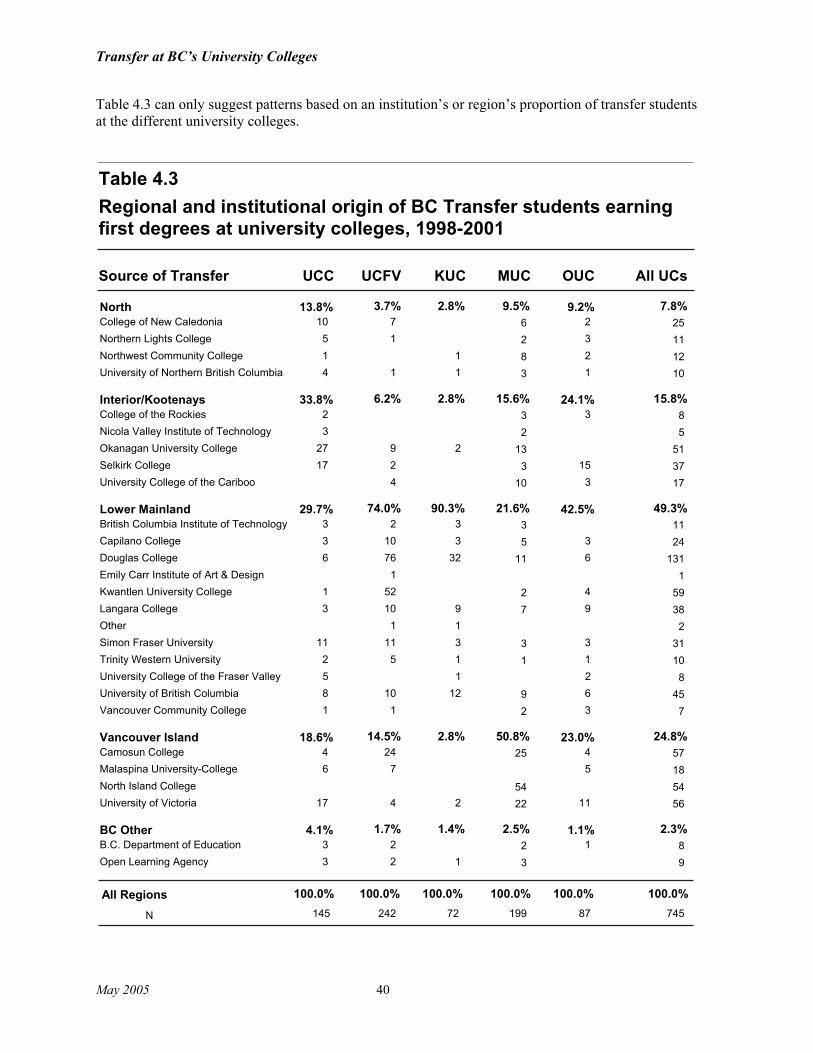
Transfer at BC’s University Colleges
May 2005 40
Table 4.3 can only suggest patterns based on an institution’s or region’s proportion of transfer students at the different university colleges.
UCC UCFV KUC MUC OUC
Table 4.3 Regional and institutional origin of BC Transfer students earning first degrees at university colleges, 1998-2001
Source of Transfer All UCs
North 13.8% 3.7% 2.8% 9.5% 9.2% 7.8%College of New Caledonia 10 7 6 2 25Northern Lights College 5 1 2 3 11Northwest Community College 1 1 8 2 12University of Northern British Columbia 4 1 1 3 1 10
Interior/Kootenays 33.8% 6.2% 2.8% 15.6% 24.1% 15.8%College of the Rockies 2 3 3 8Nicola Valley Institute of Technology 3 2 5Okanagan University College 27 9 2 13 51Selkirk College 17 2 3 15 37University College of the Cariboo 4 10 3 17
Lower Mainland 29.7% 74.0% 90.3% 21.6% 42.5% 49.3%British Columbia Institute of Technology 3 2 3 3 11Capilano College 3 10 3 5 3 24Douglas College 6 76 32 11 6 131Emily Carr Institute of Art & Design 1 1Kwantlen University College 1 52 2 4 59Langara College 3 10 9 7 9 38Other 1 1 2Simon Fraser University 11 11 3 3 3 31Trinity Western University 2 5 1 1 1 10University College of the Fraser Valley 5 1 2 8University of British Columbia 8 10 12 9 6 45Vancouver Community College 1 1 2 3 7
Vancouver Island 18.6% 14.5% 2.8% 50.8% 23.0% 24.8%Camosun College 4 24 25 4 57Malaspina University-College 6 7 5 18North Island College 54 54University of Victoria 17 4 2 22 11 56
BC Other 4.1% 1.7% 1.4% 2.5% 1.1% 2.3%B.C. Department of Education 3 2 2 1 8Open Learning Agency 3 2 1 3 9
145
100.0%All Regions242
100.0%72
100.0%199
100.0%87
100.0%745
100.0%
N
Transfer at BC’s University Colleges
41 May 2005
Table 4.3 does show the expected regionalism in the pattern of transfer. Transfer students to university colleges, just like transfer students to universities, are more likely to come from nearby institutions. More specifically:
• Transfer students to Cariboo are disproportionately from the Interior/Kootenays and (to a lesser extent) from the North. Okanagan shows a similar, but less pronounced, pattern.
• Malaspina draws transfer students proportionately from the Interior/Kootenays and from the North (mainly due to the coastal connection with NWCC), but it is last in the proportion of students from the Lower Mainland. As expected, Malaspina draws disproportionately from the Island—the only university college to do so. All transfer students from North Island College go to Malaspina. Camosun and UVic transfer students also are more likely to go to Malaspina than to other university colleges.
• Fraser Valley and Kwantlen draw transfer students disproportionately from Lower Mainland institutions, especially the nearby ones. The Lower Mainland institutions farthest from Fraser Valley and Kwantlen, the Point Grey nexus of UBC, Capilano, and Langara, have their transfer students relatively widely dispersed among university colleges. Douglas is the lynchpin of the Lower Mainland focus of Fraser Valley and Kwantlen. Among the university colleges outside the Lower Mainland, Okanagan is the only one close to drawing a proportionate share of BC Transfers from the Lower Mainland.
• Among the regional university colleges, Okanagan sends a disproportionately large number of transfer students to other university colleges, with Cariboo being the favourite destination. Fraser Valley is at the other extreme—it contributes relatively few transfer students to other university colleges.
Overall, Table 4.3 does not add much to our understanding of the regional pattern of transfer that was not already evident in the analysis of transfer credits in Table 3.4.b.
4.4. The demographic characteristics of major admission categories Table 4.4 examines some characteristics of the university college graduates by admission categories.
BC Transfer versus High School direct entry admissions Studies of university graduates have shown that BC College Transfer students differ in some ways from direct entry students—e.g., they are more likely to be female, prefer certain faculties (business, education, and human services), be older on graduation, and get slightly lower grades. At the university colleges, the picture is remarkably similar, except for the last point.
• The information on transfer credits in Table 4.4 is not demographic, but it does show that those categorized as BC Transfers are coming with a significant number of transfer credits. This is very similar to the situation at universities, where 56% of BC College Transfers transfer 45 credits or more (Heslop [2001: Table 6A]). The university college data also show that there is not a big difference in transfer credits between those transferring from universities and those transferring from colleges. This similarity between BC College Transfers and BC University Transfers at university colleges is one that continues throughout Table 4.4.
• University college graduates who entered as BC Transfers (both College and University) are more likely to be female than High School admissions. This is true overall and at each institution. At universities, BC College Transfers are also more likely to be female than direct entry students but the difference may be smaller. A study of admissions in the 1990s by Heslop (2001: Table 8) shows about 5% more females among BC College Transfers compared to direct entrants, while a study of graduates by Dumaresq et al. (2003: 12) showed only a 2% difference (versus the 10% for university college graduates).
Transfer at BC’s University Colleges
May 2005 42
• BC Transfer graduates (both College and University) are likely to be older at graduation than those who entered their university college directly. This pattern is consistent across all institutions—although the difference is least marked at Kwantlen. The average 5.8 year age difference for BC College Transfers is considerably more than the 2.8 year difference found for one group of university graduates (Dumaresq et al. [2003: 12]). It seems that many BC Transfers to university colleges do not follow a direct route to their post-secondary education but begin at another institution as mature students or work before completing their degree.
• Compared to High School entrants among university college graduates, BC Transfers (both College and University) are more likely to graduate with applied and professional degrees (as opposed to general arts and science degrees). However, this pattern does not hold across university colleges (Malaspina is a clear exception and there is not much difference at Okanagan, while Kwantlen should be ignored because of its focus on applied degrees). However, the general preference of BC Transfers for applied and professional programs is consistent with the pattern found at universities. For example, Heslop (2001: Table 5a), shows 26% of BC College Transfers enter professional faculties (Education, Business, Social Work, and Other) compared to 8% of BC High School entrants. This is a much more pronounced difference than at university colleges, but the university data may have something to do with the fact that transfer students are entering universities in second year or later when some professional faculties do their admissions. In a survey of university graduates (a group that is more akin to the university college graduates in this study), Dumaresq et al. (2003: Table 7) found a much more modest difference—36.1% of BC College Transfers had applied and professional degrees [excluding engineering] versus 32.6% of direct entry students.
• BC Transfer graduates at university colleges (both College and University) are likely to have higher GPAs than direct entry students on upper-division courses. The difference (4.4% higher) is not great, but the pattern holds true at each university college except Kwantlen. This difference is the opposite of the small differences (2.1% - 2.5% in favour of direct entry students) that Heslop (2001: 28) finds among university students. The difference with the universities on this point probably reflects the high school GPAs of direct entry students, which tend to be higher at universities. The tendency of universities to get a larger proportion of high school students with top grades is also likely to be the explanation for the fact that BC University Transfers to university colleges get even higher grades than BC College Transfers.
Mature versus direct entry admissions Much interest at university colleges focuses on the differences between direct entry and mature students, the two most common types of admission. For graduates, Table 4.4 shows:
• Those who began their degrees as Mature students are more likely to be female than those who entered directly from high school. This is consistent across institutions and the difference is almost as marked as the one between BC Transfers and direct entry students.
• Graduates admitted as Mature students are generally older at graduation than direct entry students—11.1 years on average. This is a rather obvious finding, but the magnitude of the difference is striking. The Mature student is not just one who decides to work or travel for a couple of years before returning to education.
• Mature student admissions among University college graduates show the same preference for applied and professional degrees that BC Transfers do.
• Overall, mature student admissions tend to have higher GPAs than direct entry students, but the pattern is not consistent across institutions.

Transfer at BC’s University Colleges
43 May 2005
Overall, the demographic portrait of BC Transfer students and Mature students among university college graduates is quite similar: they are more likely to be female, to be older at graduation, to prefer applied and professional degrees, and to get better grades.
UCC KUC MUC OUC All UCs
Table 4.4Characteristics of first-degree holders at university colleges, 1998-2001, for selected admission categories
UCFVAdmission Category
Percent female
Average graduation age
GPA for upper-division courses
Percent applied and professional degrees
WARNING: The small Ns for some cells signal caution in attributing much significance to some differences, especially if the pattern across institutions is not similar. NOTE: Out-of-province, international, and unknown transfers are omitted.
Average number of lower-division transfer credits
Ns for cells in this table
BC College Transfer 75.6%74.8% 75.6% 73.6% 75.8% 78.1%
BC University Transfer 73.0%71.4% 71.0% 73.7% 81.6% 63.6%
High School 65.3%62.2% 61.4% 56.2% 72.0% 68.1%
Mature 72.0%71.0% 68.4% 80.0% 72.8% 73.4%
BC College Transfer 31.3 30.0 29.1 31.7 31.8 30.8
BC University Transfer 31.2 33.9 27.3 32.7 32.0 31.8
High School 24.6 25.3 24.7 25.5 25.1 25.0
Mature 33.7 36.9 30.8 37.6 36.2 35.9
BC College Transfer 3.323.25 3.36 3.40 3.32 3.24
BC University Transfer 3.433.46 3.57 2.78 3.50 3.59
High School 3.193.16 3.20 3.39 3.20 3.18
Mature 3.303.14 3.42 3.39 3.34 3.31
BC College Transfer 50.9%66.0% 43.6% 90.6% 36.0% 55.4%
BC University Transfer 58.6%73.8% 54.8% 100.0% 31.6% 45.5%
High School 42.4%39.4% 30.4% 96.6% 42.2% 47.3%
Mature 54.5%54.2% 48.1% 95.6% 43.5% 64.0%
BC College Transfer 5248 55 64 49 48
BC University Transfer 4651 43 33 50 43
High School 22 2 4 3 2
Mature 45 5 6 4 4
BC College Transfer 593103 211 53 161 65
BC University Transfer 15242 31 19 38 22
High School 2,662836 493 89 472 772
Mature 1,254301 231 45 324 353

Transfer at BC’s University Colleges
May 2005 44

Transfer at BC’s University Colleges
45 May 2005
Appendix: The data and their limitations
A.0. Summary Compiling and cleaning the data for this study proved to be a much bigger problem than originally expected. In particular:
• The database design was deficient in places and additional elements had to be requested. More seriously, institutions could not provide all the requested data. It was, as they say, a “learning experience” (A.1).
• “Include” flags are set on both the STUDENT_CREDENTIALS and STUDENT_COURSES tables, and then various decisions exclude specific records from further analysis (A.2).
• Excess credits are often due to “second” degrees. These second degrees are identified in various ways and the “Include” flags are changed to exclude them and their associated credits from the analysis (A.3).
• Too few credits on a student’s record is a clue to a “degree admission” or unrecorded transfer credits. Some degree admissions are identified indirectly and probable transfer credits are attributed to students who appear to have qualified for admission as transfer students. Malaspina data for this study are improved considerably by consulting paper records, but even this does not eliminate the need to attribute transfer credits to some students (A.4).
• Table A.5 provides a summary of credits excluded or created for parts of this study (A.5).
• One issue not dealt with is excess credits (sometimes a large excess) on some student records due to a circuitous or “inefficient” route toward the degree (A.6).
The appendix concludes with the format of the tables for the data on which this study is based.
A.1. A learning experience In principle, getting the data for this study should have been fairly straightforward. The data format was modelled on the provincial Data Definition (DDEF) and Central Data Warehouse (CDW) standards. Each university college then provided selected data elements for:
1. Each degree awarded between January 1998 and December 2001—the CREDENTIALS and the STUDENT_CREDENTIALS tables. (The structure of all tables is outlined at the end of this Appendix.)
2. Students earning these degrees—the STUDENTS table.
3. The courses on the records of these students, including transfer courses and their institution of origin—the COURSES and the STUDENT_COURSES tables.
Inadequacies in the initial design of the elements that institutions were asked to provide created some extra work. For example, the first request for data did not include the actual credits earned by a student taking a particular offering of a course, because of a mistaken assumption that “Credits” on the COURSES table would suffice. This did not work for most institutions, especially where transfer courses were concerned. For example, a generic transfer course code like SCIE 1st would have a “block” of transfer credit attached to it with a range that could vary from 3 to 24. Thus, the “Credits_Attempted” field had to be added later to the STUDENT_COURSES table and some data resubmitted. Similarly, the name of the institution granting the degree had to be added to the
Transfer at BC’s University Colleges
May 2005 46
STUDENT_CREDENTIALS table when it became clear that the credential codes and titles at some institutions did not provide the necessary information about “partnership” degrees.
Two other interrelated design and data issues eventually made interpretation of the data more difficult because they could “hide” international students:
• The database design failed to include a field to identify international students.
• The Central Data Warehouse coding scheme to identify the institution of origin for transfer credits uses the same code (“99”) for both international institutions and unknown institutions. Normally, the “99” should stand for international institutions, because there is no reason a Canadian institution (which all have individual codes) should be unknown. However, some university colleges (notably Cariboo) lost institutional identification for some of their transfer credits and used “99” as an unknown code. The consequence is that international transfers cannot be identified with certainty.
Initially, more time was lost because institutions provided incomplete data. In retrospect, it is easy to see the roots of this problem:
• Institutions were being asked to provide data according to relatively newly defined standards and to do this for historical course records and transfer courses—neither of which had previously been included in submissions to the CDW.
• Institutional Research offices at some institutions were operating with new people, who did not fully understand their institution’s history or record systems. Also, some Institutional Research offices have only indirect access to data stored in institutional systems. Doing a non-routine data extraction became more complicated and more prone to error.
All university colleges, Malaspina included, had to review, resubmit, or augment some records as problems were discovered.
In the end, however, the really serious data problems in this study are simply the result of recordkeeping practices within institutions. In particular, these situations delayed this study and required the creation of additional data.
• Institutions (most notably Malaspina and Okanagan) do not have electronic records for many of the transfer credits used for a degree. Institutional researchers at all university colleges agreed at the outset of the study that the course records of graduates would be complete, even though their institutions might not bother to record transfer courses at the point of admission. This turned out to be incorrect, although the situation is improving and there are fewer problems with 2001 than with 1998 data. Malaspina’s records for this study were improved considerably by consulting paper records (a very time consuming process). But even this failed in some cases. When this study began, many of the most important paper records of graduates were located in program offices throughout the campus. Some records were incomplete, and in one case a program had intentionally and systematically destroyed many of its earlier paper records, even though they had not been turned over to the Registrar’s office. As a result of this study, all these programmed-based records at Malaspina were forwarded to the Registrar’s office, where they now are available in a new on-line (photo facsimile) record system.
• Although institutions with transfer credits in their on-line registration systems usually also have the institution of origin, this is not so in all cases. Cariboo has more than its share of these transfer credits with an unknown origin (the “99” code problem), although (to be fair) Cariboo’s transfer records in other respects seem to be more complete than those of most other university colleges.

Transfer at BC’s University Colleges
47 May 2005
• In several university colleges it is not possible from electronic records to tell when transfer credits were originally taken. Some institutions date their transfer course records in terms of the time when they were entered on their system, not the time when the course was originally completed or even the time of admission. Because institutions sometimes registered transfer credits just before graduation (and sometimes after graduation or not at all), it is sometimes impossible to say for sure what transfer credits a student had before admission to their current institution.
Most of the data problems at university colleges are a result of adjusting to a new mandate (degrees) and learning to move beyond the view (quite appropriate to colleges) that students in university programs are simply passing through on their way to universities and that it does not make much sense to track transfers or transfer credits. Most university colleges are now moving to more university-like admission processes for their university programs. Two things would be helpful:
1. Agreement among university college Registrars and the Central Data Warehouse on a set of standards for the business and record-keeping practices to handle transfer students and transfer credits. How are “transfer students” defined? How are transfer credits to be recorded on systems? With the later, using a stable date for transfer credits that reflects the date the course was actually taken or at least the time of admission would be helpful.
2. Regular routines for quality control. Even something as simple as checking to see that graduates have enough course credits on their system record to qualify for their degree would help identify problems before they begin confusing analysis and become more difficult to correct.
A.2. The approach to data cleaning and the initial data exclusions It was known at the outset that the data extraction rules for this study would produce more course credits than were needed. Ideally, one would not extract all the courses on a student’s system record, but only the ones that actually contribute to earning the degree in question. Unfortunately, this kind of discrimination is beyond the capacity of university college registration systems for the time period of this study. Such discrimination requires “degree audit” software that is only now finding its way into university colleges (and higher education generally).
This study tackles this problem by creating two “Include” flags, one on the STUDENT_COURSES table and one on the STUDENT_CREDENTIALS table. Initially these flags were set to “Y” (for “Yes” to include) and then moved to other values when a decision was made to exclude a course or credential from all or part of the analysis.
The two initial exclusions for the “Include” flag on the STUDENT_COURSES table are straightforward:
1. Courses not normally accepted for credit in university programs were excluded. These courses were mainly identified (rather laboriously) by listing course acronyms and checking CIPS and non-standard or unknown acronyms against institutional Calendars. Also, any course with a level below first year (usually Adult Basic Education) was excluded, after the course-level indicator was checked and corrected against the actual numbers of the courses. Courses that were deemed to be non-university-level had their “Include” flag changed to “A” (for “acronym.”)
2. Student course registrations that did not result in a passing grade were coded “G” (for “grade.”)
A.3. Too many credits—second degrees and more exclusions Once analysis began, it quickly became apparent that many students had too many credits on their records for the degrees they received. One reason was second degrees. Some students had earned two
Transfer at BC’s University Colleges
May 2005 48
university college degrees in the 1998-2001 period of the study, others had probably earned another degree at the university college prior to their current degree in the 1998-2001 period, and still others were pursuing another degree after earning the one included in this study. These situations could confuse the analysis by double counting or by including bloated or incomplete records. Therefore, it was decided to confine this study to first degrees and the credits associated with them. A “first degree” is the degree a student takes first after being admitted to university programs. With no clear way to identify first degrees, the operational procedure for this study was to begin by considering all degrees as first degrees (a “Y” on the “Include” field on the STUDENT_CREDENTIALS table). Then, various procedures identified different kinds of second degrees and changed the “include” flag to other values. Unfortunately, these procedures are more complex and open to error than one would wish.
The obvious cases—two degrees between 1998 and 2001 The most obvious cases of second degrees involved students who had two university college degrees within the timeframe of the study. There were 175 such students out of the total 5,368. None involved more than one university college. (However, it is not possible to be certain that there is no overlap in graduates among university colleges because a few Okanagan Personal Education Numbers (PENs) were missing and the PEN data submitted by Cariboo was faulty.) Of the 175 students with two degrees at their university college between 1998 and 2001, 169 involve a BEd degree as one of the two—Malaspina (121), Cariboo (35), and Okanagan (13). This is because the BEd is often pursued as a post-baccalaureate degree or concurrently with another degree. In these cases, where one of the two degrees is a BEd, this study always identified the BEd as the second degree, even if it were awarded at an earlier date. The “Include” flag on the STUDENT_CREDENTIAL table was set to “S” (for “second” degree). All the Education courses that were directly associated with this BEd degree also had the “Include” flag on the STUDENT_COURSES table set to “S.” These courses were identified mainly on the basis of having an upper-level course code and a CIP code starting with 13 (which denotes Education).
Of the six non-Education students with two degrees during the 1998-2001 period—Cariboo (5), Okanagan (1)—the degree coming second in time was considered the second degree and had its “Include” flag set to “S.” Any course taken after the date of the earlier degree was attributed to the second degree and the STUDENT_COURSES “Include” flag was set to “S.”
An earlier degree at the university college Even if they had only one degree during the 1998-2001 period, some students had many too many credits on their record for the degree they were awarded. This and the double degrees just noted were clues to the fact that some students had earned an earlier degree at the university college before the 1998 start of the study. This issue was checked at Malaspina by re-examining the system records for all degrees before 1998. This revealed that 25 people with Education degrees between 1998 and 2001 also had a BA from Malaspina prior to 1998. Thus their degree during the 1998-2001 period was a second degree. For them, the “Include” flag on the STUDENT_CREDENTIAL table was set to “P” (“previous”). A high credit total was a good indicator of this previous degree, but not everyone had “excess” credits on their record (they could be transfer students with unrecorded transfer credits). A more telling indicator of a previous degree was the high number of upper-division credits outside Education—this was always 39 or more in the Malaspina data.
Using Malaspina data as a guide, student records for other institutions were reviewed. Any record with more than 100 upper-division credits and with 42 or more of these outside Education was evaluated for the likelihood that the person had a degree at the university college prior to the degree in the 1998-2001 period. Of the 63 cases meeting these criteria, 42 eventually were classified as having a prior degree at the university college. This included 27 at Cariboo (25 with a BEd) and 15 at Okanagan (14 with a BEd). They had the “Include” code on the STUDENT_CREDENTIAL table set to “P.”

Transfer at BC’s University Colleges
49 May 2005
The heavy concentration of such previous degrees in Education is consistent with what is better documented at Malaspina. Cariboo and Okanagan are the only other two institutions with BEd degrees. However, this methodology for identifying graduates with previous degrees at the university college is far from foolproof. Some may have a degree attributed to them that they did not get and some previous degrees have probably been missed—although these errors are probably few and their consequences minor.
Pursuing a second degree—courses beyond the degree date Students often take courses after their first degree, either for personal interest or because they are pursuing a second degree. To remove these courses from the analysis, the stable enrolment dates of all courses taken at the university college were checked and the “Include” flag on the STUDENT_COURSES table was set to “L” (“late”) for any course taken after the date of the degree. (The same rule was not applied to a few transfer courses that had dates after the degree date because it was fairly clear that the great majority of these courses were simply delayed additions to the student’s record for the degree.)
A.4. Too few credits—inferred degree admissions and transfer credits As well as having too many credits on their records, many students had too few. This was more of a surprise, because there was general agreement among institutional researchers before the study began that their on-line registration system records did catch all transfer courses by the time of graduation. Eventually, it became clear that there were two issues:
• Some students had been admitted with degrees from elsewhere. Thus their university college degree was a second degree and they should not be included in the analysis of transfer. (Degree admissions are not usually considered to be transfers.)
• Some students had system records that failed to record the transfer credits they used to meet their degree requirements—in which case it was necessary to do something with their records in this study or the transfer phenomenon at university colleges would be underreported.
Improving Malaspina data Because incomplete systems records affected Malaspina as much as anyone, a decision was made to check the paper records to help improve the quality of information on Malaspina graduates. Many hours were spent looking at the “paper” records (actually on-line facsimiles) of Malaspina students with too few credits for their degrees. As a result, new transfer course records were created for this study (in the database these are STUDENT_COURSES records numbered between 500001 and 500236). The effort was worth it. The check added 5,404 transfer credits with known origin. This is an increase of about 35% over the total number of transfer credits originally identified on the Malaspina system. These additions to the database greatly improve the quality of the Malaspina data.
But, as noted earlier, even the paper records at Malaspina were incomplete, so it was necessary to make assumptions about missing Malaspina data, just as it was necessary to make similar assumptions at other institutions (but mostly at Okanagan).
Degrees from elsewhere as the basis of admission Typically a student with a degree who decides to pursue another degree gets two years of advanced standing toward the second degree. Thus a person with a BSc who decides to pursue a BA would be admitted to the BA and be expected to complete 60 additional credits, including all the requirements for the major. Someone with a BA who is admitted to a BEd program also gets two years’ standing in the 5-year program. Students admitted with a degree are typically not considered transfer students and their transfer credits are usually not recorded. These students are considered to be in a different admission category.

Transfer at BC’s University Colleges
May 2005 50
(Note: This study did not collect admission category information. Institutional researchers agreed at the outset that this information would not be helpful or reliable. Also, the Data Warehouse had not yet implemented tables to capture admission categories. In retrospect, collecting some admission information might have helped to sort out issues with the course records of some graduates.)
In principle, the course record of students with degrees from another institution should stand out because they have no transfer credits, fewer credits than required for the degree, and a heavy concentration of upper-division credits. However, someone with 60 unrecorded transfer credits at the lower level would have a university college course record that looked almost identical to someone admitted with a degree. Fortunately, it is sometimes possible to sort out the difference between unrecorded transfer credits and a degree admission because of other information. For example:
• BSN students often start as transfer students on the basis of a diploma or RN designation earned elsewhere. It is virtually impossible to start a Nursing program and complete just the third and fourth years on the basis of admission with a degree in another discipline. There is minimal overlap between BSN requirements and the requirements of any other degree.
• Where degree admission is common, as in Education, there may be signs within the program (different courses or different degree codes) that signal a degree admission.
In the end, 174 cases in the study were classified as having been admitted to their institution on the basis of a degree from another institution. These people had the “Include” field on the STUDENT_CREDENTIAL table set to “D” (for “Degree” admission):
• Malaspina: Because there was access to paper records at Malaspina, it was possible to identify 129 cases of students admitted on the basis of degrees from elsewhere. (There may be more, but these are the ones that turned up when pursuing records that seemed incomplete.) All of these were in Education. And almost all cases were also signalled by identifiable course sequences and degree codes. The pattern of credits was an indicator—a low total number of credits and upper-division credits almost entirely in Education. There were only three cases in the 129 where the student’s system record could otherwise have been mistaken for one that really represented an earlier degree at Malaspina.
• Okanagan: There were 20 cases of BEd graduates who apparently were admitted with degrees from elsewhere. These were identified on the basis of a distinctive degree code or a low number of credits for the program.
• Cariboo: There were 23 cases of BEd graduates who were classified as degree admissions from elsewhere, primarily on the basis of low credits. It is possible that a few of these were actually transfer students, although Cariboo has done a relatively good job of capturing its transfer credits in system records. Cariboo also had two other apparent cases of degree admissions. One is a BSW graduate who apparently started at Cariboo, completed a degree at Simon Fraser (in Arts?) and returned to Cariboo for Social Work. Also, a BA graduate at Cariboo was classified as a degree admission from elsewhere, although it could be a case of unrecorded transfer credits.
• Fraser Valley. One probable second degree was identified. Fraser Valley does not have a BEd program, but it does have a degree in Adult Education and this is the area of the degree admission. However, the degree in Adult Education runs in a non-standard way and it is not easy to make inferences about degree admissions from some of the student records submitted by Fraser Valley (especially for Adult Education graduates). These records often have many transfer credits but still have too few total credits for the degree.
Overall, some degree admissions probably escaped detection. A few of the graduates described below as unknown transfers may in fact be degree admissions.

Transfer at BC’s University Colleges
51 May 2005
Attributed transfer credits from unknown institutions The paper evidence showed how Malaspina’s system records failed to register many of the transfer credits students used for degrees—sometimes just because of inconsistent record keeping practices and sometimes (more understandably) because programs would treat certificates or diplomas as advanced standing, much like the degree admission category, and would not record the process as a block transfer. The inadequate number of credits on the records of some students from other institutions showed this was not a problem confined to Malaspina. Okanagan was the most obvious example of unrecorded transfer credits (apart from Malaspina), but no institution seemed immune.
This led to the decision to create transfer credits for students who were deficient in credits for their degree and who (it was reasonable to infer) most likely had transfer credits. (The inference is reasonable if we assume that institutions could and did report all their own credits.) However, rather than create credits for everyone who was deficient, it was decided to do it only for those who:
• Had a shortfall of 24 or more credits—enough to qualify them as a Transfer student; and
• Did not already have many lower-division transfer credits on their records—an indication that transfer credits at the time of admission simply went unrecorded.
These attributed transfer credits help to correct underreporting of transfer students (Section 4 of this study) and also help (to a lesser extent) to correct underreporting of transfer credits (Section 3). For each student with attributed transfer credits, a course (TRAN-P) was created in the STUDENT_COURSES table, with the number of credits required to get to 120 or another appropriate total and with the transfer institution listed as unknown (a code of 99999 in this case, instead of the 99 used by institutions to indicate transfer credits from international or “unknown” institutions).
Such attributions add 8,274 transfer credits for 153 students. Table A.4 shows how these students were distributed among institutions and disciplines. The most common disciplines for attributed transfer credits and admissions are the expected ones. Half the attributed credits are for Nursing, where those with RN certification are taken directly into third year. As noted earlier, it is unlikely that any of these Nursing graduates were degree admissions. The second most common degree category for the attributed transfer credits is Human Services. This is also a field where admission to programs is often based on a certificate or diploma in a college-level human services program.
UCFV KUC MUC OUC
Table A.4Number of attributed transfer students at university colleges by faculty, 1998-2001
Degree Category UCCAll
UCs
Humanities and Social Sciences 192 17
Fine and Applied Arts, Journalism 21 1
Science 71 6Business and Administration 61 5
Education 1212Human Services 282 26
Nursing 794 11 12 52
9 11 1 14 118 153Total

Transfer at BC’s University Colleges
May 2005 52
Although it appears from Table A.4 that Okanagan is the anomalous institution in terms of record keeping practices, this is only because of the paper check and the additions to the database for Malaspina. Without these additions, Malaspina’s numbers would be very much like Okanagan’s. There were 100 Malaspina graduates who had 24 or more transfer credits of known origin added to their record from the paper check.
The attributed transfer credits probably still leave transfer credits underreported. Even after the attributions, there are still 421 cases of first degrees where recorded credits are below 120—the normal minimum for a degree. This is a total deficit of over 5000 credits. This is equal to about 6% of the transfer credits already included in the study for holders of first degrees. More than half of these “missing” credits are at Fraser Valley, mainly for its Adult Education and Human Services degrees. Fraser Valley usually has recorded some transfer credits for these students, and Fraser Valley has a high proportion of transfer credits overall, so it is not clear what the issues are with these data.
A.5. Overall picture of excluded and created credits Table 2.3 shows how the second degrees (as determined by this study) are distributed among the university colleges. For credits (as opposed to degrees) Table A.5 shows how various exclusions and creations have affected the credits included in this analysis.
UCFV KUC MUC OUC
Table A.5Summary of excluded and included credits for first degrees at university colleges, 1998-2001
Degree Category UCCAll
UCs
All documented credits 768,347210,369 147,323 31,481 186,639 192,536
- Credits inappropriate for degree -3,942-778 -1,520 -245 -931 -469
- Credits without passing grades -29,958-11,805 -3,647 -815 -9,720 -3,972
- Credits connected to second degree -12,348-2,805 -8,801 -742
- All credits excluded--prior degree -12,799-5,465 -4,435 -2,899
- All credits excluded--degree admission -14,555-2,096 -151 -10,687 -1,621
- Credits after degree obtained -6,892-2,527 -1,068 -81 -1,819 -1,397
687,611184,894 140,937 30,096 150,247 181,437Documented credits after exclusions
+ All attributed credits 8,274459 660 26 798 6,331
All first degree credits 695,885185,353 141,597 30,122 151,045 187,768

Transfer at BC’s University Colleges
53 May 2005
A.6. Issues not dealt with One could argue that there are still too many credits included in this study. This is so because many students have many more credits on their records than they require for their degree. Sometimes these excess credits will be transfer credits, but most often they are the university colleges’ own credits—a situation that reduces significance of transfer credits for degrees
The main reasons for the excess credits is simply that some students take other programs before they start the program that eventually leads to their degree or they have accumulated more credits than are necessary for the degree, particularly at the lower level.
Here are three examples of student histories reconstructed from the course data in the database for this study. These are three graduates in the study with the highest credit totals. Fortuitously, each student comes from a different university college and each represents a different admission category used in this study.
• X, a BC transfer student at Malaspina. Born in 1962, X began first year Science at UBC immediately after high school (1981-82), but passed only 6 credits and was required to withdraw. X then took two years of general Arts at Vancouver Community College (1982-84), passing 48 credits. Six years later X was admitted to the Fisheries and Aquaculture diploma program at Malaspina and over the next two years (1990-1992) earned a diploma. X continued at Malaspina immediately afterwards (1992-1995), taking lower-division science courses with a 60% load over the three years. X was admitted to the major in Biology at Malaspina in the Fall of 1995 and over the next two and one-half years (until December 1997) completed the major and other requirements for the BSc. In the end, only a few of the VCC credits that qualified X in this study as a BC transfer student and only a few of the credits in the Fisheries and Aquaculture diploma eventually counted toward the BSc. The BSc requires only 120 credits, and X has more than 253 recorded on the Malaspina system. In this case there were excess transfer credits as well as excess Malaspina credits. This is the extreme case of too many credits at Malaspina, but it shows how the road to a degree can be circuitous and fairly inefficient judged by the number of credits taken along the way.
• Y, a direct entrant at Okanagan. Born in 1968, Y entered Okanagan directly from high school to study Science full-time for two years (1986-1988). Y accumulated 54 credits but with mediocre grades. In January 1990 Y returned to study part-time, taking between 3 and 9 credits per semester through Spring 1994, majoring in Biology. Grades improve somewhat. By this time Y had accumulated 114 credits, but apparently decided to leave school before completing the degree. (Math may have been the problem). In September 1996 Y entered the BSN program at Okanagan and studied full time for the next four years (1996-2000), graduating with a Nursing degree and good grades in June 2000. The many years of Science and Biology courses were largely irrelevant for the BSN. In the Nursing program, Y even did the required first-year Biology course, despite having already completed nearly all the requirements for a major in Biology. There are 247 credits on the record.
• Z, a mature student admission at Cariboo. Z was born in 1969 and entered Cariboo as a mature student in January 1990, taking 9 credits that were probably preparation for Nursing. In September 1990 Z began the Nursing program, earning reasonable grades but dropping out after the first semester. In September 1991 Z began studying Science full-time. Over the next two years (1991-1993), Z accumulated 54 more credits in first and second year Biology and Chemistry with good grades. Then in September 1993 Z entered the Respiratory Technology diploma program and studied full-time for two and one-half years, earning a diploma. After a break of 18 months, Z returned to Cariboo full-time to study Chemistry. Over the next two

Transfer at BC’s University Colleges
May 2005 54
years (1997-1999) Z completed the requirements for the Chemistry major and earned a BSc in the Spring of 1999. There are 245 credits on the record.
These illustrations show that some students take circuitous routes to their degrees and that this study is a long way from having isolated those credits actually used to earn degrees. Because the university colleges’ own credits are more likely to be over-represented on the record compared to transfer credits, this suggests that the estimates in this study of the relative importance of transfer credits in earning degrees at university colleges are conservative.
A.7. The structure of the data A copy of the database (in Access, compete with the queries and reports) is available at university college institutional research offices. Tables beginning with UCT_LU (the LU for “look up”) were created during the study and are not listed here. The Tables that are outlined below are the ones carrying the primary data for the study. Field names entirely in UPPER CASE are the fields institutions were asked to provide. They are derived from the Central Data Warehouse standards—Version 2000 (September 2000). Field names in lower case are ones produced during the study. Any one expecting to use the data should also read the Appendix and perhaps talk to Rod Church.
UCT_CREDENTIALS INST_CODE DEGREE TITLE PROGRAM_GRADUATION_CREDIT CIP_CODE Report_Cat1 General faculty/discipline of degree. Report_Cat2 “ArtsScience” or “Professional”
UCT_STUDENTS INST_CODE ID_NUMBER A student number supplied by institutions. PEN Not valid for Cariboo. All institutions had a few missing values. BIRTH_DATE Only a few missing values. GENDER Only a few missing values. Gender_Digital Added to make certain calculations easier: F=1, M=0, U=Null INITIAL_START_DATE Generated from institutional system. Not reliable. Not used. HIGH_SCHOOL_CODE Little data. Not used. HIGH_SCHOOL_GRAD_DATE Mostly missing. Unusable. Admit_Status The probable admission status of graduates used in Section 4. Trf_Inst TINS_CODE of transferring institution for transfer students. First_Reg_Age First registration age. The difference between a student’s birth
date and the stable date of the first university-level enrolment at the university college, divided by 365.25.
Transfer at BC’s University Colleges
55 May 2005
UCT_STUDENT_CREDENTIALS INST_CODE ID_NUMBER DEGREE DEGREE_DATE INST_GRANTING_DEGREE Identifies partnership degrees. Null for university college Include Flag set for the study (see Appendix and the look-up table) Grad_Age Graduation age. Calculated. Grad_Year For convenience. Calendar year. UD_gpa GPA for upper division courses. Calculated.
UCT_COURSES (Note: not used in queries; selected fields added to UCT_STUDENT_COURSES) INST_CODE CRS_CODE CRS_EFF_DATE CRS_TITLE CREDIT DIS_CODE CIP. Incomplete with errors originally. Revised for study. CRS_LEVEL Revised to be consistent with courses numbers.
UCT_STUDENT_COURSES ID Key added because transfer courses were sometimes used more
than once, so the table would not key on the next five fields. INST_CODE ID_NUMBER CRS_CODE CRS_EFF_DATE STABLE_DATE Warning: Inconsistent business practices for transfer courses. GRADE TINS_CODE Transferring Institution code used for all transfer courses. ACHIEVEMENT_STATUS CREDIT_ATTEMPTED Equals credits achieved with a passing grade. DIS_CODE CIP. Incomplete with errors originally. Redone for study on
basis of course names. Field originally on UCT_COURSES. CRS_LEVEL Revised to be consistent with courses numbers. Field originally
on UCT_COURSES. Include Flag set for this study (see Appendix and look-up table) Include_combo A flag which combines the effects of the Include flag on this
table and the one on UCT_STUDENT_CREDENTIALS.
Transfer at BC’s University Colleges
May 2005 56
References Church, Roderick. 2001. “Preliminary Report on Studying the University Colleges of British
Columbia as Transfer Receiving Institutions.” Unpublished report prepared for the BC Council on Admissions and Transfer.
Dumaresq, Cheryl, and Walter Sudmant. 2002. 2002 BC University Baccalaureate Graduate Survey. Report of Findings. The Class of 2000 Two Years after Graduation. University Presidents’ Council of British Columbian and the Centre for Education Information.
Dumaresq, Cheryl, Ashley Lambert-Maberly, and Walter Sudmant. 2003. The Class of 1996 Five Years after Graduation: Comparing BC University Outcomes for Direct Entry and Transfer Students, BC Council on Admissions and Transfer.
Heslop, Joanne. 1998. Profile of BC College Transfer Students Admitted to Simon Fraser University 1993/94 to 1997/98. BC Council on Admissions and Transfer.
Heslop, Joanne. 2001. Profile of BC College Transfer Students Admitted to BC Universities, 1994/95 to 1998/1999. BC Council on Admissions and Transfer.
Sudmant, Walter, Jena Greenall, Ashley Lambert-Maberly, and Cheryl Dumaresq. 2002. 2001 BC University Baccalaureate Graduate Survey. Report of Findings. The Class of 1996 Five Years after Graduation. The University Presidents’ Council of British Columbia and the Centre for Education Information.