professional development learning analysis
TRANSCRIPT

Professional Development Learning Analysis
Gallup-McKinley School District
Spring 2014
A Partnership with NMPED, and
Knowledge Delivery Systems
August 2014
2
Table of Contents Summary of New Mexico Online Programs - Year 2 ............................................................................... 3
Gallup-McKinley Success Factors .............................................................................................................. 4
Gallup-McKinley School District................................................................................................................. 7
Engagement Summary ................................................................................................................................... 9
Impact and Results ....................................................................................................................................... 15
Gallup-McKinley Program Overview ................................................................................................. 16
Key Benefits of the School-based/District-endorsed Blended PD Program Model ........ 17
Program Satisfaction Results ............................................................................................................... 17
Concluding Summary ................................................................................................................................... 18
3
Summary of New Mexico Online Programs - Year 2
During the 2013-14 School Year, Knowledge Delivery Systems (KDS) partnered with Solution Tree and the New Mexico Public Education Department to offer online courses as professional development for New Mexico Educators. The most successful of the professional development offerings was a district-wide effort in Gallup-McKinley School district. Sammy Orr, the Site Administrator and a Director within Gallup-McKinley County Public schools led the initiative by selecting the course: Assessment and the Common Core State Standards, presented by Kay Burke. He also led the effort to communicate with all district principals and then submitted rosters to enroll all the participants. Throughout the course School-based leaders facilitated the progress of all participants within each school.
All KDS courses are comprehensive depth-level courses. Each online course guides the participant through opportunities for research-based instruction, coaching and practice necessary to improve teaching skills. Leading experts provide course instruction through short video segments and professional texts. Personalized coaching from an online coach is a key element to participant learning throughout the course. Online coaches moderate participant discussion boards, offer online “office hours” to respond to participant questions and concerns and provide personalized feedback on key reflections. Participants Gallup-McKinley were given the option to upgrade for graduate professional development credit, however most participants chose to use the courses as a supplement to their in-person professional development workshops and as a Common Core resource. Those who participated in the coached courses did so at a high level of quality in regards to their reflections, assessments, and comments. Throughout the course participants are required to practice their learning, reflect on it and discuss new experiences with their colleagues. These supports ensure that teachers have multiple opportunities to try and perfect new skills over time as opposed to learning about a new skill at a workshop and then having to try it on their own.
To maximize the impact of KDS courses, participants need to receive clear communication about the course and accurate enrollment information. Once enrolled participants need to actively engage in the course and work toward completion. This step is crucial and often challenging. If participants do not have an understanding of the time expectations to complete the course, or a clear understanding of how the course content aligns to state, district and personal improvement goals, it can be challenging for teachers to have the requisite motivation and perseverance to engage in the course content and work toward completion. The Gallup-McKinley implementation exemplified the success that is attainable when all the right conditions are in place.

4
Gallup-McKinley Success Factors There were critical structures in place in Gallup-McKinley that have contributed to the program’s ongoing success, and the district and KDS collaborated to provide other key program components. Aligned Incentives
A key element in the Gallup’s success was a district-wide alignment and prioritization of the professional development program. The PD program aligned with the district’s structure for collaborative professional communities of practice. These teacher groups were leveraged to support peer reflection and discussion about application of practices from the online course. School leaders and teachers were enrolled in the same course, which promoted alignment and established a common language around CCSS instruction and assessment. This structured, focused approach was district-wide. The cohesive nature of this approach was an important factor in the program’s success; the district embraced the program and as a result, administrators and teachers were committed to completion and engagement. Additional critical success factors include:
District set clear expectations for the program and made explicit the alignment of the program with district and state priorities around implementation of CCSS
District identified a strong, engaged District Champion who leads the project within the district and collaborates closely with the KDS program management team
KDS is providing ongoing support to the District Champion, including: o Weekly reports of online course progress, by individual teacher, by school, by
grade level and by online coach cohort o Access to the KDS program management team for troubleshooting and
support District identified a school-based program lead for each participating school in the
district, who supports teachers in his/her school and facilitates the collaborative work focused on the online course. These educators have made a commitment to ensure that all school participants are effectively engaged in their coursework based on reporting data supplied by KDS
KDS is providing ongoing support to the school-based program leads, including: o Online course pacing guides o Guides for facilitating the in-person communities of practice meetings o Reports on progress through the course by all of the teachers in their cohort o Collaboration with the KDS online coaches around teacher course
participation and assessments

5
o Proactive support and troubleshooting by the KDS program management team
KDS provided a full day of program orientation and training on the KDS platform, the online course the district was taking and the implementation model. All participants registered into their courses on this day.
District made accommodations for teachers to use some scheduled professional development time for completing online coursework
A commitment by the District to listen and share teacher concerns/issues for quick resolution, with support from KDS

6
Gallup-McKinley Course Engagement Overview
A distinguishing feature and key contributor to the success of the Gallup-McKinley Program included an opportunity to train leaders in advance of teacher participants to ensure participants had the support and understanding of leaders as they completed their coursework.
The chart below shows the percentage of each cohort, teachers and administrators, who submitted each “Key Reflection” assignment. “Key Reflections” are short written responses that ask participants to tie course content to their own teaching practice and to consider the application of content. For Assessment and the Common Core, Gallup participants submitted 8 Key Reflections. Coaches provided feedback on every Key Reflection submitted.
The “average percent of course completed” represents the average course progress for all teachers or all administrators.
Engagement in Gallup rated highly on every metric. Almost 100% of teachers and administrators engaged in coursework. The average completion percentage was approximately 85% for both administrators and teachers. Of those engaged in the coursework, just over 70% completed the entire course.
Engagement Overview:
Admins Teachers
31 312
Participants who engaged in course work 29 298
Average % coursework completed by engaged participants* 87% 84%
% completed entire course 71% 72%
Percent Submitted Key Reflection 1 97% 98%
Percent Submitted Key Reflection 2 97% 87%
Percent Submitted Key Reflection 3 93% 85%
Percent Submitted Key Reflection 4 93% 86%
Percent Submitted Key Reflection 5 79% 80%
Percent Submitted Key Reflection 6 79% 79%
7
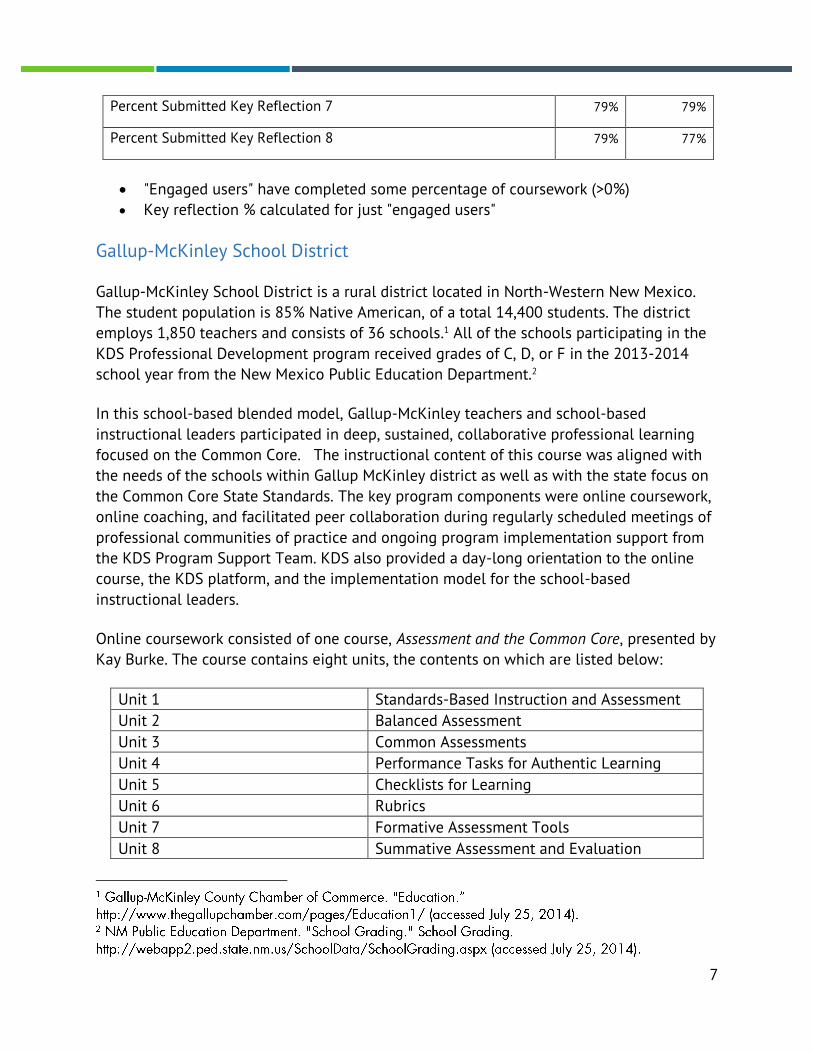
Percent Submitted Key Reflection 7 79% 79%
Percent Submitted Key Reflection 8 79% 77%
"Engaged users" have completed some percentage of coursework (>0%) Key reflection % calculated for just "engaged users"
Gallup-McKinley School District
Gallup-McKinley School District is a rural district located in North-Western New Mexico. The student population is 85% Native American, of a total 14,400 students. The district employs 1,850 teachers and consists of 36 schools.1 All of the schools participating in the KDS Professional Development program received grades of C, D, or F in the 2013-2014 school year from the New Mexico Public Education Department.2
In this school-based blended model, Gallup-McKinley teachers and school-based instructional leaders participated in deep, sustained, collaborative professional learning focused on the Common Core. The instructional content of this course was aligned with the needs of the schools within Gallup McKinley district as well as with the state focus on the Common Core State Standards. The key program components were online coursework, online coaching, and facilitated peer collaboration during regularly scheduled meetings of professional communities of practice and ongoing program implementation support from the KDS Program Support Team. KDS also provided a day-long orientation to the online course, the KDS platform, and the implementation model for the school-based instructional leaders.
Online coursework consisted of one course, Assessment and the Common Core, presented by Kay Burke. The course contains eight units, the contents on which are listed below:
Unit 1 Standards-Based Instruction and Assessment Unit 2 Balanced Assessment Unit 3 Common Assessments Unit 4 Performance Tasks for Authentic Learning Unit 5 Checklists for Learning Unit 6 Rubrics Unit 7 Formative Assessment Tools Unit 8 Summative Assessment and Evaluation
8
Assessment and the Common Core consists of videos modeling instructional practice, e-book readings, “Key Reflections,” pre and post assessments, and an end of course survey. Participants were placed in virtual classrooms along with their school-based professional learning cohort.
Online coaches provided feedback on Key Reflections. Coaches were also available for virtual office hours, twice weekly for a total of 3 hours. Participants were encouraged to contact coaches via email at any time during the week to ask questions or provide feedback.
Each school scheduled face-to-face sessions according to their particular schedules and needs. KDS provided a Facilitator’s Guide to help guide in person sessions and align discussions to online coursework.
Participants were successful in the course due to the support of online coaches and opportunities to practice new learning. Personalized coaching ensured that participants were supported in their learning throughout the course. Regular office hours, feedback on Key Reflection responses, and constant communication with coaches helped guide participants’ experience through the course. Gallup teachers gave the following feedback in post-course surveys:
“The online coach was receptive to my reflections. She was positive in her feedback and offered suggestions that were purposeful.”
“The coach was always positive and helpful!”
The support of school based facilitators ensured that participants maintained an understanding of the alignment of the course to school goals as well as clarity about what was expected of them. School based facilitators participated in a full day professional development session to understand the structure of the course and how they could support learners in their schools. A facilitation guide was shared with leaders during this session which included unit-by-unit suggestions of activities and discussion prompts that facilitators could use to guide their meetings with their professional communities of practice. To help guide progress through the course at each school, KDS shared engagement data at regular intervals throughout the course. This data allowed principals and instructional coaches to track the group’s progress and help participants stay on schedule for completion. Upon request, KDS sent more detailed engagement data to facilitators that showed progress for individual teachers.
9
Engagement Summary
In Gallup-McKinley we saw outstanding engagement levels across the district. Of those participants who enrolled in courses, almost 100% of teachers and administrators engaged in coursework. The average completion percentage was approximately 85% for both administrators and teachers. Of those engaged in the coursework, just over 70% completed the entire course. This high engagement rate may be attributed to the engaged coaches and administrators at these schools who facilitated participation in the program. According to one analysis of multiple MOOC courses across the web, the average completion rate for a typical MOOC is around 7%.3 Other studies present average MOOC engagement between 5 and 10%.4 5The completion percentages in Gallup-McKinley surpass this average by more than 60%
Administrators surveyed at the end of the program attributed increased engagement rates to Professional Learning Communities and casual pay in addition to time set aside for work on the course. Teachers in Gallup also ranked “time set aside” and Professional Learning Communities as key facilitators of engagement. Other motivators that teachers ranked highly included casual pay and the “Core Clips.” The table below shows engagement across the course for Gallup Administrators and Teachers. Both groups performed at equally high levels, with high rates of completion throughout the course.
To encourage additional engagement within schools, the KDS Team emailed course progress data to district administrators at key points during the implementation. These data showed a school’s progress overall, and progress through each “Key Reflection.” Administrators contacted KDS on multiple occasions to request additional data on their teachers’ progress in order to further facilitate coursework demonstrating a commitment in their teachers’ progress through this online coursework and interest in the data collected. In a post-course survey, administrators rated the KDS data support as a 3.1 (out of 4) in terms of usefulness.
10
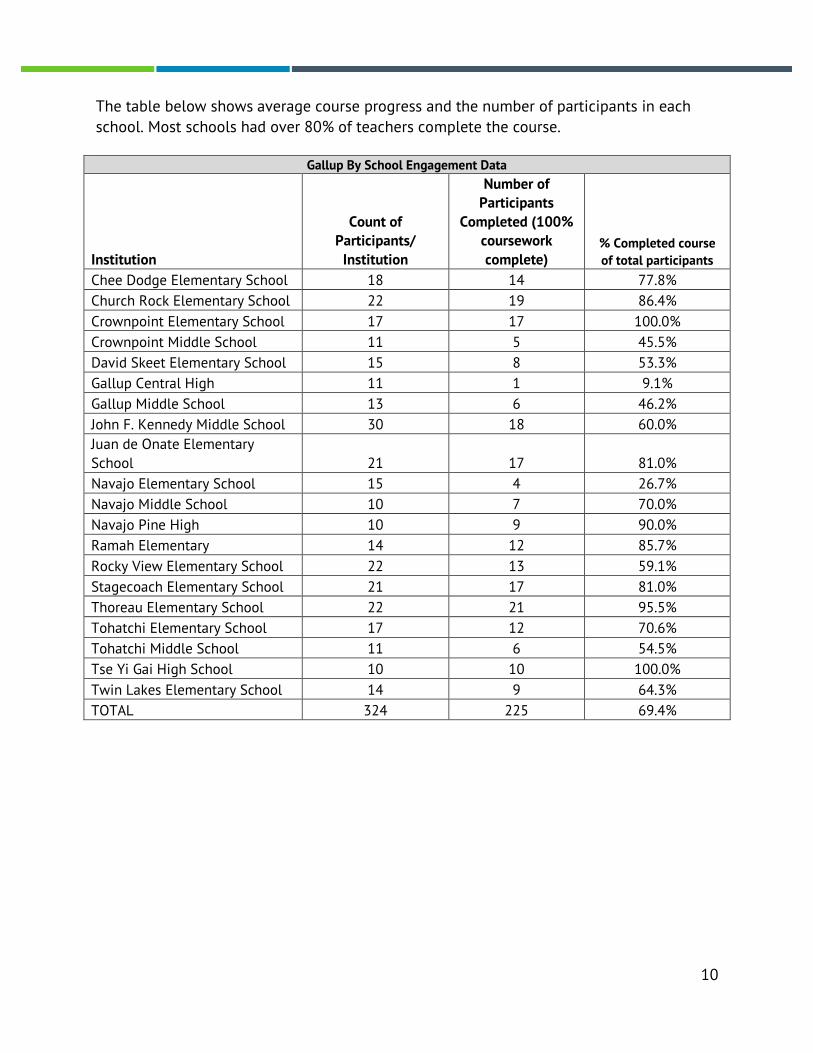
The table below shows average course progress and the number of participants in each school. Most schools had over 80% of teachers complete the course.
Gallup By School Engagement Data
Institution
Count of Participants/
Institution
Number of Participants
Completed (100% coursework complete)
% Completed course of total participants
Chee Dodge Elementary School 18 14 77.8% Church Rock Elementary School 22 19 86.4% Crownpoint Elementary School 17 17 100.0% Crownpoint Middle School 11 5 45.5% David Skeet Elementary School 15 8 53.3% Gallup Central High 11 1 9.1% Gallup Middle School 13 6 46.2% John F. Kennedy Middle School 30 18 60.0% Juan de Onate Elementary School 21 17 81.0% Navajo Elementary School 15 4 26.7% Navajo Middle School 10 7 70.0% Navajo Pine High 10 9 90.0% Ramah Elementary 14 12 85.7% Rocky View Elementary School 22 13 59.1% Stagecoach Elementary School 21 17 81.0% Thoreau Elementary School 22 21 95.5% Tohatchi Elementary School 17 12 70.6% Tohatchi Middle School 11 6 54.5% Tse Yi Gai High School 10 10 100.0% Twin Lakes Elementary School 14 9 64.3% TOTAL 324 225 69.4%
11
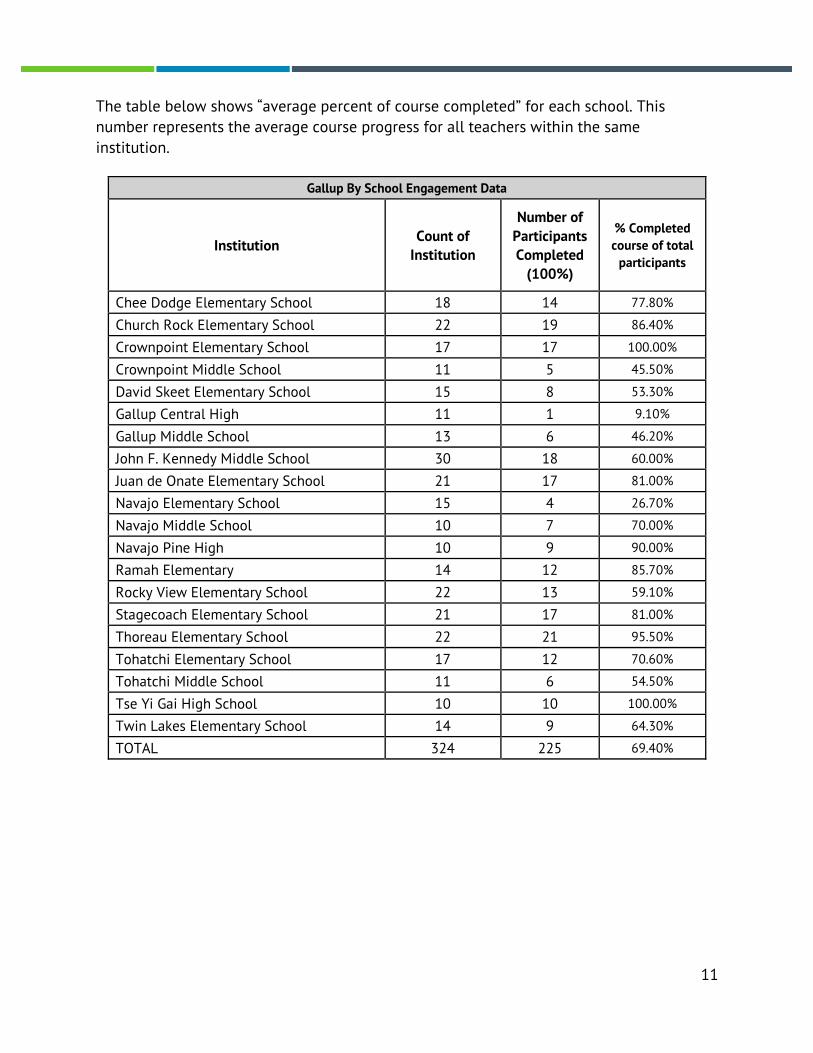
The table below shows “average percent of course completed” for each school. This number represents the average course progress for all teachers within the same institution.
Gallup By School Engagement Data
Institution Count of Institution
Number of Participants Completed
(100%)
% Completed course of total
participants
Chee Dodge Elementary School 18 14 77.80%
Church Rock Elementary School 22 19 86.40%
Crownpoint Elementary School 17 17 100.00%
Crownpoint Middle School 11 5 45.50%
David Skeet Elementary School 15 8 53.30%
Gallup Central High 11 1 9.10%
Gallup Middle School 13 6 46.20%
John F. Kennedy Middle School 30 18 60.00%
Juan de Onate Elementary School 21 17 81.00%
Navajo Elementary School 15 4 26.70%
Navajo Middle School 10 7 70.00%
Navajo Pine High 10 9 90.00%
Ramah Elementary 14 12 85.70%
Rocky View Elementary School 22 13 59.10%
Stagecoach Elementary School 21 17 81.00%
Thoreau Elementary School 22 21 95.50%
Tohatchi Elementary School 17 12 70.60%
Tohatchi Middle School 11 6 54.50%
Tse Yi Gai High School 10 10 100.00%
Twin Lakes Elementary School 14 9 64.30%
TOTAL 324 225 69.40%

12
Gallup Course Progress by School
Institution Average % of
Course Completed
Tse Yi Gai High School 100% Navajo Pine High 98% Thoreau Elementary School 98% Ramah Elementary 97% Crownpoint Elementary School 96% Juan de Onate Elementary School 92% Church Rock Elementary School 91% Chee Dodge Elementary School 89% Tohatchi Elementary School 89% Twin Lakes Elementary School 88% Stagecoach Elementary School 86% John F. Kennedy Middle School 85% Rocky View Elementary School 85% Navajo Middle School 84% TOTAL 82% David Skeet Elementary School 77% Crownpoint Middle School 72% Tohatchi Middle School 67% Gallup Middle School 62% Navajo Elementary School 54% Gallup Central High 37%
Participants showed high quality, engagement as demonstrated by the thoughtful responses to Key Reflection questions. Participating teachers have an opportunity to reflect on new learning and their implementation of new skills in the classroom. Each unit of our courses requires participants to engage in at least one Key Reflection. This is a question designed to prompt participants to reflect on their practice and think critically about how effectively they are adopting new skills. According to research and best practices, KDS aligns each reflection question to a rubric designed measure participants' reflections through a critical lens with rigor. Further, Online coaches rate reflective responses against the rubric to provide feedback to participants and support their learning.
KDS coaches rated each key reflection (see rubric below) on a scale of 1 (unsatisfactory) to 4 (distinguished). On average, participants received a score of 3.6 across all Key Reflections and schools. The average Key Reflection ratings for each school are below.

13
Sample Reflection Question and Rubric:
“In this segment, Dr. Burke reviews the process of repacking the standards, developing performance tasks, and creating checklists for teachers and students. At this point in the course, rate your comfort level with this process on a scale of 1-4, with 1 being “not on board” and 4 being “ready to go.” Explain your rating, and describe something you’re eager to try, as well as any challenges or concerns.”
Distinguished (4) Proficient (3) Basic (2) Unsatisfactory (1-0)
Participant has provided rich detail and supporting examples from the course content.
Participant has made responses to prompts personally meaningful and relevant to his or her teaching practice.
Participant has included appropriate content from the course content.
Participant has made thoughtful comments in direct response to the prompts.
Participant has included little that indicates consideration and comprehension of course content.
Participant has answered most questions directly but some too briefly.
Participant has included little to no content indicating consideration and comprehension of course content.
Participant has not addressed the specific questions posed.
Participant has not responded to all reflection questions.
Participant has copied from the course transcript without synthesis or analysis.

14
Average Key Reflection Ratings by School
Institution Number
participants Average rating on
ALL Key Reflections Chee Dodge Elementary School 18 3.9 Church Rock Elementary School 22 4.0 Crownpoint Elementary School 17 4.0 Crownpoint Middle School 11 3.3 David Skeet Elementary School 15 3.6 Gallup Central High 11 3.4 Gallup Middle School 13 4.0 John F. Kennedy Middle School 30 3.1 Juan de Onate Elementary School 21 3.3 Navajo Elementary School 15 3.6 Navajo Middle School 10 3.6 Navajo Pine High 10 3.5 Ramah Elementary 14 4.0 Rocky View Elementary School 22 3.4 Stagecoach Elementary School 21 3.8 Thoreau Elementary School 22 3.9 Tohatchi Elementary School 17 3.5 Tohatchi Middle School 11 3.5 Tse Yi Gai High School 10 3.4 Twin Lakes Elementary School 14 4.0 AVERAGE for all institutions: 3.6

15
Impact and Results Participants showed improvement from pre to post assessment; content knowledge increased as it participants’ self-evaluation of content-knowledge. Scores on content based questions increased from 58% to 71%.
The increase in percentage correct for each content-based question is show in the graph below.
0%
20%
40%
60%
80%
Pre-Assessment Post-Assessment
Change from Pre to Post Assessment
Content-Based Questions
0.00%
20.00%
40.00%
60.00%
80.00%
100.00%
120.00%
Q1 Q2 Q3 Q4 Q5 Q7 Q8 Q9
Change in % correct from pre- to post-assessment
16
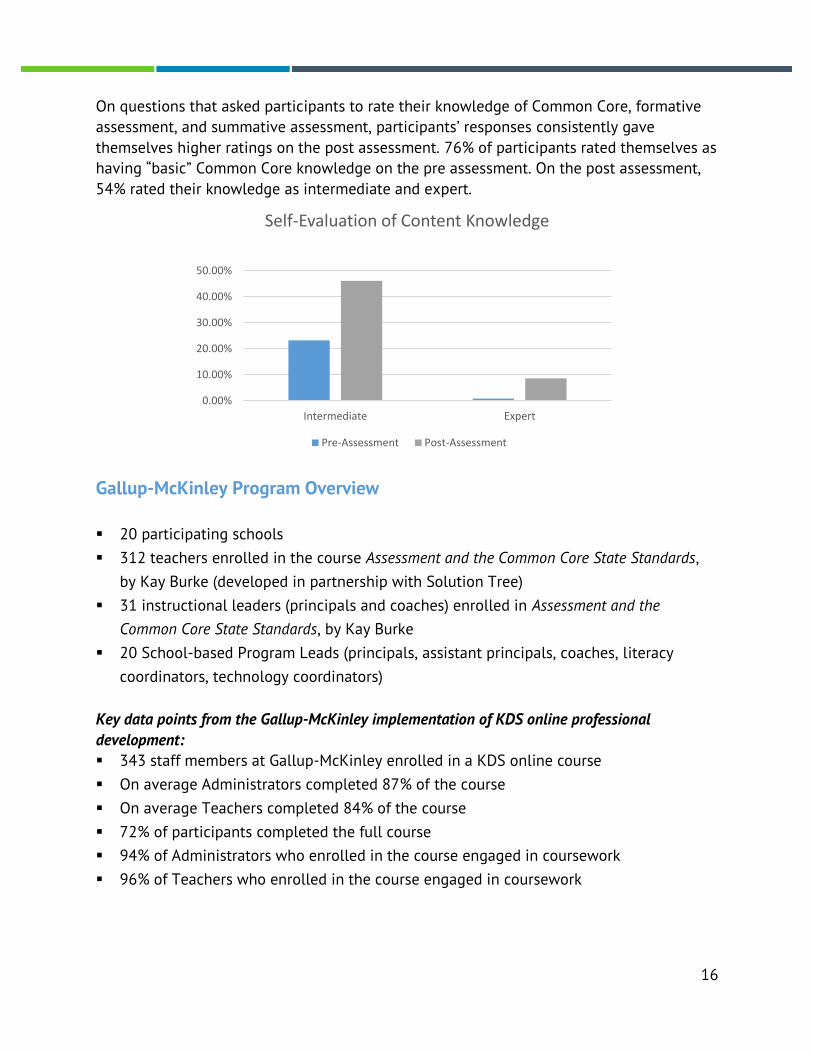
On questions that asked participants to rate their knowledge of Common Core, formative assessment, and summative assessment, participants’ responses consistently gave themselves higher ratings on the post assessment. 76% of participants rated themselves as having “basic” Common Core knowledge on the pre assessment. On the post assessment, 54% rated their knowledge as intermediate and expert.
Gallup-McKinley Program Overview
20 participating schools 312 teachers enrolled in the course Assessment and the Common Core State Standards,
by Kay Burke (developed in partnership with Solution Tree) 31 instructional leaders (principals and coaches) enrolled in Assessment and the
Common Core State Standards, by Kay Burke 20 School-based Program Leads (principals, assistant principals, coaches, literacy
coordinators, technology coordinators) Key data points from the Gallup-McKinley implementation of KDS online professional development: 343 staff members at Gallup-McKinley enrolled in a KDS online course On average Administrators completed 87% of the course On average Teachers completed 84% of the course 72% of participants completed the full course 94% of Administrators who enrolled in the course engaged in coursework 96% of Teachers who enrolled in the course engaged in coursework
0.00%
10.00%
20.00%
30.00%
40.00%
50.00%
Intermediate Expert
Self-Evaluation of Content Knowledge
Pre-Assessment Post-Assessment

17
Key Benefits of the School-based/District-endorsed Blended PD Program Model
Scalable, high-quality, consistent PD focused on district problems of practice Depth-level training of coaches and instructional leaders that prepares them to
observe, monitor and coach teachers Ongoing, targeted and differentiated coaching and support of school-based
instructional leaders Engaging, research-based online courses that provide depth-level training for
teachers on key practices Content and supports for use in professional communities of practice Personalized online coaching and course facilitation Professional learning that changes practice and impacts student achievement Reporting and analytics that provide visibility to learner progress and program
impact, and program-wide accountability
Program Satisfaction Results Participants who completed the post-course survey gave high marks on average to all aspects of the course. The chart below show the average satisfaction ratings for the online course experience across all participants (out of a highest ranking of 10).
1
2
3
4
5
6
7
8
9
10
eClassroomSoftware
Course Content CustomerSupport
Academic Rigor Presenter
Gallup-McKinley Average Course Satisfaction Ratings

18
Concluding Summary
The Gallup-McKinley implementation represents a model for future partnerships: an effective blend of online and in person support aligned with district priorities resulted in extraordinary engagement. The partnership between New Mexico PED, Solution Tree, and KDS delivered a range of courses to hundreds of New Mexico teachers, providing them with accessible, impactful PD. Across each of the programs in New Mexico, we saw varied levels of engagement in coursework but work completed was consistently high quality. Gallup-McKinley’s superb engagement rates are testament to the powerful influence engaged administrators and facilitators may have on a cohort. In Gallup, close to 100% of teachers and administrators engaged in their coursework and completion rates were significantly higher than in the other programs. The face-to-face introductory sessions and school-based facilitators ensured collaboration and encouraged teachers to engage deeply in the coursework. Other states and districts interested in pursuing impactful PD solutions can look to Gallup’s success as an exemplary model of blended professional development. Improvements in content knowledge show participants learned from the course, and the high quality of Key Reflection responses shows participants engaged with focus and produced quality work. Future student assessment data will provide further support for this program’s efficacy, and KDS will continue to monitor the progress of Gallup-McKinley schools. This model is replicable in the upcoming New Mexico implementation, in which we expect similarly high levels of engagement and participation. Improvements to the next implementation will include an examination of bandwidth requirements in schools to address some technical concerns expressed by several participants. Other concerns as addressed in the above sections will also be addressed to improve the PD experience for participants.