productivity shock and national food security for … shock and national food security for japan...
TRANSCRIPT
Productivity Shock and National Food Security for Japan
Tetsuji Tanakaa∗ and Nobuhiro Hosoeb†
aGraduate School of Arts and Sciences, University of Tokyo
bNational Graduate Institute for Policy Studies
14 April 2007
1 Introduction
1.1 National Food Security and Japan’s Agricultural Policy
Self-sufficiency rate of food has been regarded as a key indicator for Japanese
agricultural policy. Japan’s self-sufficiency rate is only 40% on a calorie basis, which
∗3-8-1 Komaba, Meguro, Tokyo 153-8902, Japan E-mail address: [email protected]†7-22-1 Roppongi, Minato, Tokyo 106-8677, Japan Tel: +81-3-6439-6129; Fax: +81-3-6439-6010
E-mail address: [email protected]
1

is clearly lower than that in other major developed countries. While this low food self-
sufficiency is a result of outstanding comparative advantage of Japan’s industrial sectors,
it brings us a concern of food shortage caused by unexpected events, such as crop fail-
ure by bad weather, war, and embargo. Actually, bad weather reduced rice harvest by
one-quarter compared with average yield in 1993. There were a soybean embargo due
to serious crop failure in the US in 1973 and a grain embargo in response to the USSR’s
invasion in Afghanistan in 1980. These unexpected events brought concerns about ex-
cessive dependency of food supply on imports to Japanese people. They are regarded
as important risk factors when Japanese government considers “national food security”.
The central idea of national food security is how to secure food consumption under such
uncertainty of food production and supply in Japan1.
Among various foods, rice is the most important commodity for Japan. Rice com-
poses 28% of total calorie intake, followed by wheat, which contributes to 13% of total
calorie intake in 2001. In expenditure, rice has a share of 29% in total food consump-
tion2. Paddy rice sector is the Japan’s largest agricultural sector and composes 28% of
agricultural value added. The rice sector is, thus, the core sector which is supporsed to
be strictly protected from foreign suppliers with an eventual import ban for the sake of
1This concept of “national food security” is a unique concept compared with the concept of “food
security”, which is often discussed in the context of development under increasing population and con-
tinuing poverty. Hayami(1997)[10] clarifies their difference.2Source: FAOSTAT
2

national food security. This high trade barrier is now one of major targets of increasing
pressures toward free trade.
Overall impacts of agricultural trade liberalization consist of (1) deterministic
efficiency improvements by removal of trade barriers and (2) probabilistic gains and
losses from productivity shocks, whose magnitude can be exacerbated or mitigated in
accordance with trade openness. We have often analyzed the first aspect of trade liber-
alization but have rarely done the second. This lack of analysis sometimes drives people
to be against trade liberalization without assessing the overall impacts of these two as-
pects. Only when we take both of them into account at once, we can evaluate whether
trade liberalization is really beneficial for national welfare and whether it is a risk factor
for national food security.
To answer to the question mentioned above, we develop a stochastic computable
general equilibrium (CGE) model focusing on rice sectors in Japan and her rice trade
partners. We simulate abolition of import tariffs of paddy rice and/or productivity
shocks at a paddy rice sector in Japan and other countries with a Monte Carlo method.
In addition, we evaluate effectiveness of buffer stocks, which Japanese government pre-
pared for bad crops and other emergency situations in food supply.
3

1.2 Rice Trade and its Barrier
Japan has strictly prohibited imports of paddy rice but recently permited mini-
mum access imports of rice as a part of the Uruguay Round agreements. Its amount is,
however, only 879 thousand tonnes, which is equivalent to 9.3 % of domestic produc-
tion. Effective trade barrier is estimated higher than 800% (Table 2). While such import
penetration is increasing year-by-year, domestic production and consumption of rice is
gradually declining as Engel’s law predicts (Fig. 2). Because imports of agricultural
goods other than rice are extensively carried out, self-sufficiency rate of food are gener-
ally very low. Japanese rice farmers and Ministry of Agriculture, Forestry, and Fishery
(MAFF) concern that trade liberalization will be also applied to the rice sector in fu-
ture negotiations for bilateral and multilateral trade liberalization. Thus, their political
activities increasingly become strong to protect their domestic market.
Japanese rice consumption is concentrated upon mid- or short-grain rice (a so-
called Japonica rice), rather than long-grain rice. The former type of rice is strongly
preferred by East Asian countries; the latter type is very popularly produced and con-
sumed in Asian countries. Trade patterns of rice by Japan reflect this tendency (Table 2).
There are three major partners for Japan: China, the US, and Australia, which produce
Japonica rice3.
3The original data in the GTAP database reports some amount of paddy rice exports by Japan to
the rest of Asia (ROA), partly because this is for the purpose of development assistance for near-by
4

As most of rice is domestically produced and domestically consumed, rice trade is
found thin. This means that only a small fraction of domestic production is exported and
imported internationally. This characteristic shows clear contrast to other merchandise
agricultural commodities, like wheat. Top ten countries produce almost 90% of world
total production (Table 4). They are mainly Asian countries, where a climate of high
temperature and high humidity is dominating. Their production fluctuates mainly by
weather condition. Droughts and cool summer days reduce rice production significantly.
While productivity (measured by yields per hectare) seems to have an upward-sloping
trend, it sometimes shows sudden drops (Fig. 1). Japan actually experienced a 25%
drop of rice yield in 1993.
Once we liberalize the rice market of Japan, shocks in domestic and foreign mar-
ket directly affect such a thin international markets. Furthermore, taking account of the
strong preference toward Japonica rice in Japan, the international market seems much
less reliable as an alternative supply source for Japan.
1.3 Literature Review
The majority of analysis about rice import barriers by Japan has employed with
partial equilibrium framework. For example, Wailes (2005)[9] developed a spatial par-
developing economies, and partly because this is to reduce supply of imported minimum access rice to
the domestic market.
5

tial equilibrium model for the world rice markets to analyze rice trade liberalization.
With the same framework, Crameret al. (1993)[1] analyzed impacts of rice tariffication
by Japan.
As those analyses employed partial equilibrium models, welfare impacts are eval-
uated in terms of producer surplus and consumer surplus only for the rice sector. How-
ever, substitutability is expected between commodities in household consumption; inter-
sectoral linkages are often assumed in production process. In addition, if impacts of
productivity shock are expected to be significant enough to affect a macro economy,
there arise not only substitution effects by changes of relative prices but also significant
income effects. We need to assess macroeconomic impacts of barriers on rice imports
with a general equilibrium framework.
In contrast to partial equilibrium analysis, general equilibrium assessments of
Japan’s rice sector are scant. For example, Nakajima (2005)[7] employed GTAP-based
CGE model to analyze impacts of formation of East Asian Free Trade Area in combi-
nation with policy measures to protect Japan’s rice sector. Hosoe (2004)[3] developed
a CGE model and evaluated how significantly the domestic rice price regulation ex-
acerbated the adverse impacts of the actual productivity shock in Japan in 1993 and
how much windfall benefits Japan’s emergency rice imports brought about to the rice-
exporters to Japan. Hosoe (2004)[3] found substitution between commodities in house-
hold consumption would play a significant role in evaluation of welfare impacts of
6

shocks to the rice sector. However, the productivity shock was assumed to experience a
deterministic shock, whose magnitude was calibrated to reproduce the historical event
of bad crop in 1993.
In assessment of the national food security, we have to consider not only the
actual magnitude of the productivity shock but also have to expect smaller and larger
magnitude. As for the location of shocks, we can expect productivity shocks in all the
countries, other than Japan, too. Our stochastic world trade CGE model in combination
with a Monte Carlo method provides a comprehensive framework to analyze interna-
tional rice markets under uncertainty. This technique has been employed by Harris and
Robinson (2001)[5] for analysis about impacts of weather fluctuations induced by El
Nino to agricultural sectors with a world trade stochastic CGE model. In their model,
productivity of value added was randomized to represent general agricultural productiv-
ity shocks and the El Nino-induced ones.
In sum, while there have been quite a lot of debate over national food security in
Japan, few have ever considered fluctuation or contingent supply shocks in agricultural
sector to evaluate real benefit or possible losses caused by trade liberalization. Though
conventional CGE analysis provide a baseline for analysis of agricultural trade liberal-
ization, we need to take account of stochastic property of agricultural productivity in
our CGE analysis. We develop a world trade stochastic CGE model in the next section.
7

2 Model and Scenarios
2.1 Basic Structure of World Trade Stochastic CGE model
While employing the basic model structure developed by Devarajanet al. (1990)[6],
we extend the model to analyze the rice sector with uncertainty of productivity. Reflect-
ing the fact that rice trade partners for Japan are limited to Asia-Pacific countries (Table
2), and we distinguish 12 countries using GTAP database version 6 (Table 1). Each
country has eight sectors, particularly focusing on rice and other food sectors. Each
sector is represented by a profit-maximizing firm with Leontief type production func-
tion for gross output and with Cobb-Douglas (CD) type production function for value-
added (Fig. 3). Among value added components, capital is assumed to be immobile
between sectors, but labor is mobile between sectors. International factor mobility is
not assumed. These factors are assumed to be fully employed with flexible factor price
adjustment.
Sectoral outputs are split into domestic sales and composite exports using a con-
stant elasticity of transformation (CET) function. The domestic sales and composite
imports are aggregated into composite goods with a constant elasticity of substitution
(CES) function following Armington (1969)[4]. The composite imports consist of im-
ports (or transportation) from various countries; the composite exports are decomposed
into exports to various countries. We use elasticity of substitution suggested in GTAP
8

database for these CES/CET functions. Current account surplus/deficit is set constant in
US dollar terms for each country. Exchanges rates are flexibly adjusted so as to achieve
the current account balance for each country4.
2.2 Simulation Scenarios
2.2.1 Scenario Design
To evaluate overall impacts of trade liberalization of rice market in Japan we con-
sider two scenario factors (1) abolition of trade barriers by Japan and (2) uncertainty of
productivity in the paddy rice sector. We assume that productivity shocks can randomly
happen in the process of gross output production in all the rice-producing countries.
When adverse productivity shocks are anticipated, we can take a counter-measure like
(3) buffer stocks to mitigate supply shortages of rice. Considering all these three sce-
nario factors, we set nine scenarios (Table 5). The first two Scenarios T0 and T1 are
employed in conventional trade liberalization analysis as the base run and a counter-
factual run only taking account of abolition of trade barriers of rice imports by Japan.
The following six Scenarios R0, R1, J0, J1, A0, and A1 are set to investigate impacts
of trade liberalization subject to productivity shocks in Japan, the rest of Japan (ROJ),
4Other than international trade of conventional commodities and services discussed above, there is
another international transaction of “international transportation service.” We followed Hertel and Tsigas
(1997)[8] regarding treatments for this service.
9

and in all over the world. The last Scenario S is set to analyze effectiveness of Japan’s
buffer stocks prepared for adverse productivity shocks in her domestic sector. Details
of those scenario factors are explained below.
2.2.2 Abolition of Trade Barriers
We assume unilateral abolition of tariff and non-tariff barriers by Japan, which
are reported by GTAP database version 6. Originally, Japan sets quite a high tariff and
non-tariff barriers on paddy rice imports from her major rice trade partners. The tariff
and non-tariff barriers are higher than 800% in terms of import tariff equivalent rate
(Table 2).
2.2.3 Assumptions for Productivity Shocks and Buffer Stocks
We estimate variances of paddy rice productivity of the ten countries/regions dis-
tinguished in our CGE model based on time series data for 15 years provided by FAO-
STAT while controling only their time trend (Table 3). We assume that paddy rice
productivity is iid normal variables with these estimated variances. We carry out 1,000
simulation draws for each scenario with the distribution of productivity.
On one hand, when an adverse productivity shock takes place in Japan–whose
output is almost perfectly for her own consumption–, domestic consumption will dete-
riorate but will be partly compensated with imported rice. Similarly, when an abundant
10

rice crop takes place in Japan, she can have a part of its surplus absorbed abroad. As
trade liberalization of paddy rice increases her accessibility to foreign rice markets,
fluctuation of her rice supply can be more flexibly smoothed through imports. In view
of distribution of domestic welfare, given the same magnitude of productivity shocks,
trade liberalization will shifts the mean of welfare distribution upward–as conventional
trade analysis tells us–and will decrease variance of welfare distribution (Fig. 5). In this
case, whether productivity shock is negative or positive, trade liberalization will always
bring about preferable impacts to welfare distribution (the upper panel of Fig. 4).
On the other hand, when an adverse productivity shock takes place in the rest of
Japan, particularly in China, the US, and Australia, Japan’s imports from these coun-
tries will decline. Trade liberalization of paddy rice increases Japan’s dependency of
rice supply on such foreign markets and thus can exacerbate adverse impacts of their
productivity shock to Japan. This is the point that agricultural protectionists take se-
rious. However, if a positive productivity shock (i.e., good crop) takes place in other
countries, Japan conversely can gain for the same reason. As long as we expect symmet-
ric distribution of productivity shocks abroad, such productivity shocksper sewill not
seriously deteriorate the mean of welfare distribution in Japan but will just increase its
variance while trade liberalization brings her deterministic gains through improvements
of resource allocation (the lower panel of Fig. 4). Wrapping up these two impacts to get
the overall welfare impacts, we cannot immediately judge whether trade liberalization
11

is always welfare improving or not. The thicker lower tail of the welfare distribution
under free rice trade implies that trade liberalization might significantly increase the
number of cases where welfare under free rice trade is lower than welfare without rice
trade liberalization.
2.2.4 Buffer Stocks
The size of buffer stocks is assumed to be as much as 1.5 million tonnes, which
is officially kept by Japanese government and is equivalent to about 15% of Japan’s
annual production. We assume that this buffer stock is released only when a negative
productivity shock takes place in Japan so as to maintain the original amount of her
paddy rice supply.
When the lost amount of paddy rice production exceeds the size of buffer stocks
prepared in advance, market mechanism starts to work with a flexible adjustment of
price. As a result, a part of distribution of rice supply is truncated (Fig. 5). For simplic-
ity, we assume the buffer stocks were prepared before the shocks and that there is no
capital gains or losses in connection with the release of buffer stocks. By subtracting the
maintenance costs of the buffer stocks from the expected social benefits of the buffer
stocks measured by equivalent variations, we can quantify net benefits of the buffer
stocks.
12

3 Simulation Results
3.1 Deterministic Impacts of Trade Liberalization
When we assume abolition of all the tariff and non-tariff barriers on paddy rice
imports Japan (Scenario T1), we obtain straightforward results (Table 6). Imports of
paddy rice would surge to reduce domestic production in Japan. As the paddy rice
sector is tightly connected with the processed rice sector through input-output structure,
its production and thus consumption would be also increased5. As a result, overall
welfare impacts measured with equivalent variations (EV) would be improved by 2,651
million US dollars, which is 0.066% of Japan’s GDP (Table 7). Major rice trade partners
of Japan would generally gain more than others would.
This result provides a reference point, which conventional trade liberalization
analysis shows. In the following six simulations, we consider fluctuation of paddy rice
productivity in Japan, in the rest of Japan (ROJ), and in all over the world. Monte Carlo
simulations yield distribution of various economic variables, such as output, consump-
tion, EV, etc.
5It is not common to directly consume paddy rice but to consume processed rice, which is made by
thrashing paddy rice. Thus, it makes sense for us to refer changes of consumption of processed rice rather
than that of paddy rice.
13

3.2 Productivity Shocks in the Rest of Japan
Protectionists are concerning that when we are heavily dependent on foreign sup-
ply for rice, food supply could be insecure due to, for example, unseen productivity
shocks in the ROJ. When we carry out Monte Carlo simulations with Scenarios R0 and
R1 and compare their results with others, we can answer whether their concerns are rea-
sonable or not. The results of Scenario R0 show eventually no change in mean of EV
but some variance of EV, while the results of Scenario T0 are all deterministic. (Table
8)6. The result ofPr{EV < EVT1} in Scenario R0 as well as Scenario J0 and A0
indicates that there would be no statistically significant chance for Japan to attain the
deterministic gain achieved in Scenario T1 without liberalizing rice imports.
Abolition of trade barriers on paddy rice imports increases penetration of for-
eign rice, which is subject to uncertainty of productivity. This situation is described
by Scenario R1 in Table 8. Its simulation results show that trade liberalization would
increase both mean and variance of EV. As discussed in 3.1, this increase of variance
itself is often regarded as a risk factor for Japan. The trade liberalization would increase
variance of welfare to some extent but would not be so large that it could provide sta-
6Even if we do not assume any trade liberalization of paddy rice, EV is found consistently slightly
negative in Scenarios R0, J0, and A0. This is due to concavity of utility function we assume. Though we
assume normal distribution for productivity shocks, which is risk neutral from an aggregate viewpoint,
the Cobb-Douglas type utility function is a risk-averse utility function. Thus, mean of EV is always less
than zero.
14

tistically significant chance for negative welfare impacts to take place as the collumn of
Pr{EV < 0} suggests.
3.3 Productivity Shocks in Japan
There is no reason why we assume productivity shocks only in the ROJ. Once we
assume productivity shocks in Japan, the value of trade liberalization under productivity
shocks can be assessed from a different viewpoint. The simulation results of Scenario
J0 show that productivity shocks in the domestic sector but without trade liberalization
would bring about significant magnitude of variance of EV as the shock is assumed to
directly hit the domestic market. In this case, the domestic market is eventually isolated
from alternative supply sources in foreign countries due to high trade barriers assumed
in Scenario J0 (Table 8).
Given the productivity shocks in Japan, the trade liberalization would bring about
a double-dividend for Japan (Scenario J1). That is, while mean of EV would increase,
variance of EV would decrease. This implies that higher welfare level is guaranteed
more securely by trade liberalization. By integrating the domestic market with for-
eign ones, we can pool risk of productivity shocks internationally. As the column of
Pr{EV < 0} in Table 8 shows, no possibility of welfare deterioration would be ex-
pected under free trade.
15

3.4 Overall Impacts of Productivity Shocks
Comparing the simulation results of Scenarios R0, R1, J0, and J1 with each other,
the impacts of productivity shocks in Japan are found dominating those in ROJ. Thus,
when we simulate perfectly random productivity shocks in all over the world with and
without trade liberalization, simulation results of Scenarios A0 and A1 are generally
similar to those of Scenarios J0 and J1, respectively. These results do not support the
idea that trade liberalization in combination with productivity shocks should be a risk
factor for Japanese economy.
3.5 Effectiveness of Buffer Stocks
Buffer stocks are one of common measures to cope with bad crops. Because of
restructuring of Japan’s food system lead by government, the rice supply shock in 1993
was exacerbated partly by the small amount of rice stocks (0.23 million tonnes) cover-
ing only 8% of the annual production. After the bad crop event in 1993, the government
increased buffer stocks up to as much as 1.5 million tonnes. We quantify the effec-
tiveness of such buffer stocks prepared for bad crop periods. By the way, to reflect the
current situation with high border barriers on paddy rice imports, we do not consider
trade liberalization but productivity shocks in all over the world in this particular Sce-
nario S. By comparing simulation results of Scenario A0 with those of Scenario S, we
16

can find benefits of buffer stocks.
In our Monte Carlo simulations with 1,000 draws, there are 530 cases of negative
productivity shocks in Japan. The buffer stocks are found large enough to fully cover
the lost rice yield in 95.9% of those negative productivity cases. Buffer stocks would
increase mean of EV by 50.5 million US dollars, compared with the result of Scenario
A0; variance of EV would be slightly decreased.
The issue is how much effectively the buffer stocks could mitigate welfare de-
terioration. According to MAFF (2001)[2], total storage costs of the buffer stocks are
estimated as much as 150 million US dollars per year. When we regard only the im-
provements in mean of EV as the social benefit of the buffer stocks– omitting procure-
ment costs of buffer stocks–, the buffer stocks would not seem worthy to maintain.
We should reduce the amount of buffer stocks or should keep them somewhere abroad,
where cheaper storage costs are offered.
4 Concluding Remarks
Major findings of our analysis are as follows. (1) There is no statistically signif-
icant chance for Japanese economy to be worse off by trade liberalization of rice even
though the trade liberalization would increase fluctuations of her welfare caused by pro-
ductivity shocks abroad. (2) When productivity shocks are assumed in the domestic
17

rice sector in Japan, trade liberalization of rice would contribute to both increases of
expected welfare and decreases of welfare fluctuations. Among these two cases in re-
gard to location of productivity shocks, the latter impacts are found overwhelming. In
sum, there would be no reason to support the idea to protect the domestic rice market in
Japan in accordance with the national food security.
In addition, (3) the current policy to secure rice supply with buffer stocks would
not be effective in the sense that the expected gains achieved by the buffer stocks would
be clearly less than their annual maintenance costs. It implies the optimal size of the
buffer stock should be much less than the current size.
There are some reservations for our analysis. In our Monte Carlo simulations, we
assumed that productivity shocks follow normal distribution. However, nature some-
times brings disastrous crop failures. Households are generally regarded as risk-averse
agents, who are very sensitive to a slight shortfalls of essential commodities, particu-
larly food, but do not enjoy good harvest so much once they are satisfied with some
amount of food consumption in developed countries. We may need to extend our simu-
lation considering choice of functional forms for the productivity shocks and household
utility.
In regard to buffer stocks, there are rice stocks as inventories held by dealers, other
than the official buffer stocks. Such private inventories also contribute to mitigating
shortfalls of rice supply to some extent. Our simulation results about the effectiveness
18

of the official buffer stocks would be found much smaller when we consider such private
stocks, too.
REFERENCE
[1] Cramer G. L, Wailes E. J, and Shui S. Impacts of Liberalizing Trade in the World
Rice Market.American Journal of Agricultural Economics, 1993.
[2] Forestry Ministry of Agriculture and Fishery, editors.A Minute of the Committee
for Food Security, September 2001.
[3] Hosoe N. Crop failure, price regulation, and emergency imports of Japan’s rice
sector in 1993.Applied Economics, Vol. 36, pp. 1051–1056, 2004.
[4] Armington P. S. A Theory of Demand for Products Distinguished by Place of
Production. International Monetary Fund Staff Papers, Vol. 16, No. 1, pp. 159–
78, March 1969.
[5] Harris R. L and Robinson S. Economy-Wide Effects of El Nino / Southern Oscil-
lation ENSO in Mexico and the Role of Improved Forecasting and Technological
Change. October 2001.
19

[6] Devarajan S, Lewis J D, and Robinson S. Policy Lessons from Trade-Focused,
Two-Sector Models.Journal of Policy Modeling, Vol. 12, No. 4, pp. 625–657,
1990.
[7] Nakajima T. Nikkanjiyubouekikyotei no koukabunseki [The Analysis of Effects
on FTA between Japan and Korea].Economic Research Institute for Northeast
Asia Discussion Paper, Vol. 0202, , 8 2002.
[8] Hertel T. W and Tsigas M. E. Structure of GTAP. InT. W. Hertel (ed.) Global
Trade Analysis. Cambridge, 1997.
[9] Eric J. Wailes. RICE: GLOBAL TRADE, PROTECTIONIST POLICIES, AND
THE IMPACT OF TRADE LIBERALIZATION. In Aksoy M. A. and Beghim J.
C., editors,Global Agricultural Trade and Developing Countries. The World
Bank, 2005.
[10] Hayami Y. Kaihatsukeizaigaku [Development Economics]. Sobunsha, 1997.
20

Fig. 1: Paddy Rice Productivity Fluctuation by Country
21

Fig. 2: Rice Production and Imports
22

Utility
+=
+
Composite Goods Household Consumption Government Consumption
Investment Uses+ Intermediates
Composite Imports Domestic Goods
Composite Exports
Domestic Outputs
Value Added Intermediates
Labor Capital
(Cobb-Douglas)
(CES)
(CET)
(Cobb-Douglas)
(Leontief)
Country A Country Z
(CES)Country A Country Z
(CET)
Productivity Shocks and Injection
of Rice from Buffer Stocks
Fig. 3: Model Structure
23

O
Frequency
Welfare
Productivity Shocks in Japan
Productivity Shocks in Japan
µ2
O Welfareµ1
Productivity Shocks in ROJ
Productivity Shocks in ROJ
Frequency
without Trade Liberalization
without Trade Liberalization
with Trade Liberalization
with Trade Liberalization
Fig. 4: Impacts of Productivity Shocks and Trade Liberalization on Distribution of Japan’s Welfare
24

O Production
Frequency
the size of prepared buffer stocks
rice supply without buffer stocks
rice supply with buffer stocks
Fig. 5: The Distribution of Rice Supply Considering Buffer Stocks
25

Table. 1: Country, Regions, and Sectoral Aggregation
Country/Region Abbreviation Sector/Commodity Abbreviation
Japan JPN Paddy Rice PDR
China CHN Wheat WHT
India IND Other Agriculture AGR
Indonesia IDN Processed Rice PCR
Bangladesh BGD Other Food FOD
Vietnam VNM Manufacturing MNF
Thailand THA Services SRV
Philippines PHL Transportation TRS
USA USA
Australia AUS Capital CAP
the rest of Asia ROA Labor LAB
the rest of the World ROW
26

Table. 2: International Trade of Paddy Rice(mil. USD) and its Tariff Rates (%)
To
JPN CHN IND IDN BGD VNM THA PHL USA AUS ROA ROW TOTAL
JPN 0 0 0 0 0 0 0 0 0 0 924.4 4.1 928.5
(0) (0) (0) (14.17) (4.95) (0) (0) (0) (4.2) (0) (0) (13.59)
CHN 1 0 0 0.1 0.4 12.5 0.1 0 2.4 0.2 19.1 12.3 48.2
(1000) (0) (0) (13) (0) (15) (0) (0) (6) (0) (965) (25)
IND 0.4 0.1 0 0.9 0.3 0 0.1 0.1 14.6 0.3 5 128.7 150.5
(0) (0) (0) (16) (5) (0) (14) (25) (3) (0) (18) (40)
IDN 0 0 0 0 0 0 0 0 0 0 0.4 0.2 0.6
(0) (0) (0) (0) (0) (0) (0) (0) (0) (0) (0) (35)
BGD 0 0 0 0 0 0 0 0 0 0 0 0 0
(0) (0) (0) (0) (0) (0) (0) (0) (0) (0) (0) (2)
VNM 0.2 0.1 0 3.2 0.5 0 0 0 0.7 0 0.3 5.3 10.3
(0) (0) (0) (11) (3) (0) (0) (0) (0) (0) (0) (11)
From THA 0 0.1 0 2.8 0 0 0 0 0.1 0 4.7 70.9 78.6
(0) (1) (0) (20) (0) (0) (0) (0) (6) (0) (803) (28)
PHL 0 0 0 0 0 0 0 0 0 0 0 0.3 0.4
(0) (0) (0) (12) (0) (0) (0) (0) (0) (0) (0) (28)
USA 33.2 0.1 0 0 0 0 0 0.1 0 0 11.9 40.3 285.6
(804) (1) (80) (14) (0) (0) (0) (50) (0) (0) (364) (20)
AUS 7.4 0 0 0 0 0 0 0 0 0 0.1 14.5 22
(804) (0) (0) (14) (0) (0) (0) (0) (4) (0) (4) (47)
ROA 1 0.4 0.1 0.2 0 0.1 0.1 0 8.5 0.3 1.5 54.9 167.1
(581) (1) (0) (22) (2) (0) (0) (0) (4) (0) (1) (13)
ROW 2.4 0.8 0.2 0.2 0 0.1 0.2 0.1 7.3 0.5 1.8 364.9 378.7
(30) (0) (6) (0) (0) (0) (0) (3) (3) (0) (0) (6)
TOTAL 45.6 1.6 0.4 7.4 1.4 12.7 0.5 0.3 33.7 1.3 969.2 996.4
Note: Tariff rates are in brackets.
Source: GTAP database version 6.0
27

Table. 3: Variance of Paddy Rice Productivity by Country
Country/Region Variance
China 0.0007
India 0.0009
Indonesia 0.0003
Bangladesh 0.0026
Viet Nam 0.0003
Thailand 0.0010
Philippines 0.0030
Japan 0.0067
USA 0.0014
Australia 0.0085
ROA 0.0260
ROW 0.0374
Source: Estimated by the authors
using FAOSTAT considering time trend.
28

Table. 4: Paddy Rice Production by Country in 2001
Country Production Share
(1,000 tonnes) (%)
China 179,305 30.0
India 139,900 23.4
Indonesia 50,461 8.4
Bangladesh 36,269 6.1
Viet Nam 32,108 5.4
Thailand 26,523 4.4
Myanmar 21,916 3.7
Philippines 12,955 2.2
Japan 11,320 1.9
Brazil 10,184 1.7
Others 76,716 12.8
Total 597,657 100.0
Source: FAOSTAT
29

Table. 5: Scenarios
ScenarioTrade Liberalization Shocks in Rice Buffer
by Japan Japan ROJ Stocks
T0 - - - -
T1 x - - -
R0 - - x -
R1 x - x -
J0 - x - -
J1 x x - -
A0 - x x -
A1 x x x -
S - x x x
ROJ denotes the rest of Japan
30

Table. 6: Simulation Results of Scenario T1
Changes in Quantity (%) Changes in Price (%)
Output Consumption Imports Exports Output Consumption Imports Exports
PDR -41.1 64.9 3924.2 74.5 -27.2 -39.4 -70.2 -9.7
WHT 0.5 -0.3 0.1 0.5 0.3 0.3 0.3 0.3
AGR -0.3 0.3 -1.2 0.7 -0.3 -0.2 0.1 0.2
PCR 11.6 12.0 -16.2 32.3 -11.3 -10.7 -1.0 -5.3
FOD 0.2 0.2 -0.7 0.9 -0.2 -0.1 0.2 0.1
MNF 0.3 -0.1 -0.4 0.6 0.1 0.1 0.3 0.2
SRV 0.1 0.0 -0.3 0.4 0.0 0.0 0.2 0.2
TRS 0.1 0.0 -0.3 0.4 0.1 0.1 0.2 0.2
Note: Change from the results of Scenario T0
31

Table. 7: Japan’s Unilateral Rice Imports of Trade Liberalization (Scenario T1)
EV EV/GDP
(mil. USD) (%)
JPN 2651 0.066
CHN 54 0.005
IND 4 0.001
IDN -1 -0.001
BGD 1 0.002
VNM 2 0.006
THA 8 0.007
PHL 4 0.005
USA 2292 0.023
AUS 146 0.043
ROA 165 0.014
ROW -126 -0.001
Total 5198
32

Table. 8: Simulation Scenarios and Results
ScenarioTrade Liberalization Shocks in Rice Buffer Distribution of EV Pr{EV < 0} Pr{EV < EVT1}
by Japan Japan ROJ Stocks Mean (mil. USD) Variance (%) (%)
T0 - - - - 0 0 - -
T1 x - - - 2650.8 0 - -
R0 - - x - -0.3 345 49.5 100
R1 x - x - 2656.2 8053 0 48.0
J0 - x - - -150.1 1282861 53.0 99.7
J1 x x - - 2599.8 295432 0 53.0
A0 - x x - -150.4 1281918 53.4 99.7
A1 x x x - 2604.5 305415 0 52.4
S - x x x -99.9 1131869 53.4 99.7
ROJ denotes the rest of Japan.
EVT1 denotes EV in Scenario T1 (i.e. 2,650.8 mil. USD).
The histograms of Japan’s EV for each scenario are displayed in Appendix (Fig. 6 and 7).
33

Appendix
�
�
�
�
�
�
�
�
�
�
�
�
�
�
�
�
�
�
�
�
�
�
�
�
�
�
�
�
�
�
�
�
�
�
�
�
Fig. 6: Histograms of Distribution of Japan’s Welfare by Scenario (1)
34
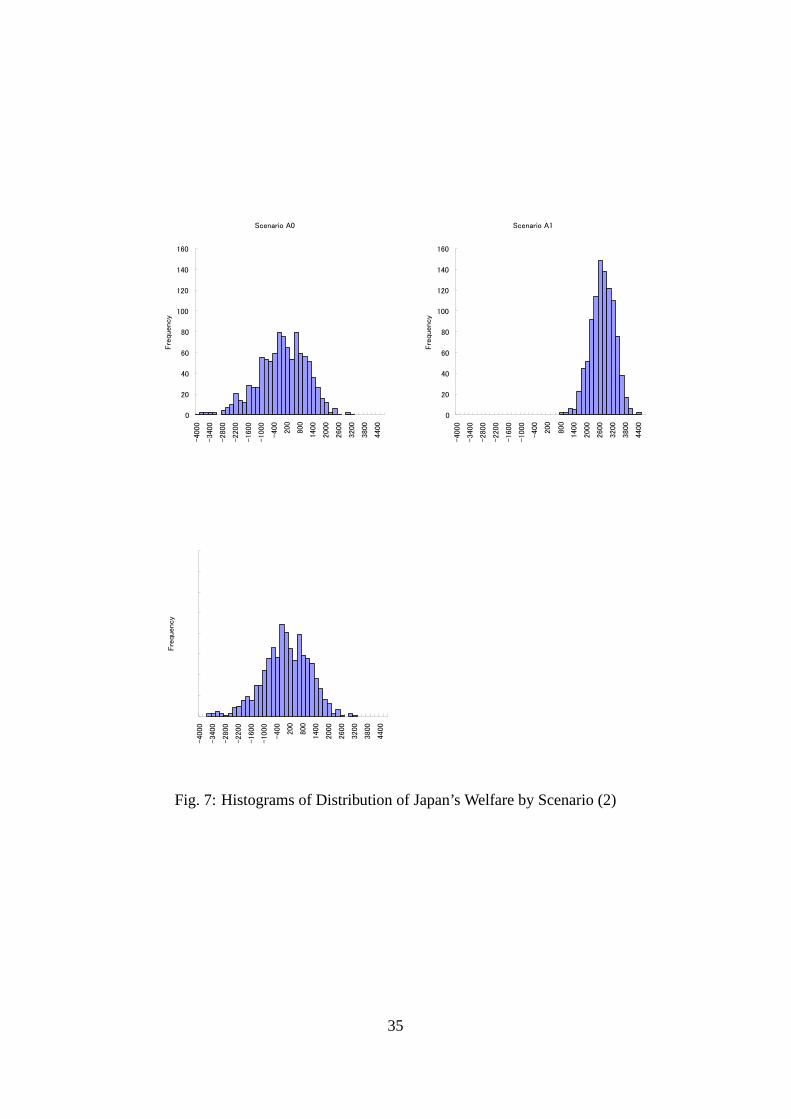
�
�
Fig. 7: Histograms of Distribution of Japan’s Welfare by Scenario (2)
35