productivity improvement of a manufacturing facility using systematic
TRANSCRIPT
Page 1 of 13
PRODUCTION & MANUFACTURING | RESEARCH ARTICLE
Productivity improvement of a manufacturing facility using systematic layout planningSyed Asad Ali Naqvi, Muhammad Fahad, Muhammad Atir, Muhammad Zubair and Muhammad Musharaf Shehzad
Cogent Engineering (2016), 3: 1207296
Ali Naqvi et al., Cogent Engineering (2016), 3: 1207296http://dx.doi.org/10.1080/23311916.2016.1207296
PRODUCTION & MANUFACTURING | RESEARCH ARTICLE
Productivity improvement of a manufacturing facility using systematic layout planningSyed Asad Ali Naqvi1, Muhammad Fahad1*, Muhammad Atir1, Muhammad Zubair1 and Muhammad Musharaf Shehzad1
Abstract: Implementation of lean manufacturing principles and believing in continu-ous improvement are the tools which help industries to sustain global competition. With the escalation in population, the demand for technology is increased more than ever. This leads to the steady increase in production rates of existing models and even introduction of new product models. These factors often results in “layout modification” of manufacturing industries. Plant layout improves resource utiliza-tion and provides means for application of lean tools such as 5S, seven wastes, kanban, Just In Time (JIT), etc. These tools not only contribute in reducing cost but also benefit the organization by improving product quality. This paper provides a comprehensive comparison of different approaches used in layout design. The study also simplifies the application of systematic layout planning (SLP) in the development of new layout. SLP is a technique used for layout development and material flow improvement. A case study of layout design using SLP is presented for a multina-tional company which manufactures a product with high variety. The results include four possible rearrangements of production departments. These layout alternatives are evaluated on basis of improved accessibility and material flow efficiency criteria.
*Corresponding author: Muhammad Fahad, Industrial & Manufacturing Department, NED University of Engineering & Technology, Karachi, Pakistan E-mail: [email protected]
Reviewing editor:Wenjun Xu, Wuhan University of Technology, China
Additional information is available at the end of the article
ABOUT THE AUTHORSMuhammad Fahad (In Photo) is a PhD scholar and an associate professor at the Department of Industrial and Manufacturing Engineering, NED University of Engineering & Technology, Pakistan. He completed his post-graduation in Manufacturing Management and PhD in Additive Manufacturing from Loughborough University, United Kingdom. His main research areas include Additive Manufacturing, Lean Manufacturing, Value Stream Mapping and Operations Management. He has supervised several lean manufacturing implementation projects in local/multinational industries.
Syed Asad Ali Naqvi, Muhammad Atir, Muhammad Zubair and Muhammad Musharaf Shehzad are recent graduates (2015) from Industrial and Manufacturing Engineering, NED University. The core interests of the group are related to productivity improvement projects in manufacturing firms by using lean methodologies such as Waste assessment, 5S, Kaizen, Kanban, Just in time, six sigma and Energy management.
PUBLIC INTEREST STATEMENTFacilities layout is the arrangement of machines, workstations and logistics. With the development in automation technology, small and medium enterprise (SME) now use a combination of both automated and manual skills to manufacture a customize product. The automation machines in SME are generally used for machining, welding and painting the product. The facility studied in this paper characterizes these automated machines as “pre-fabrication”. The parts are then transported to assembly line using suitable material handling equipment. Hence, a well-designed plant layout ensures efficient utilization of these resources. Factors such as increase in product demand, cost effective manufacturing and competitive pressure for improved quality are resolved by layout design. The selection of appropriate layout is a difficult decision because of complex relation between production departments. This paper helps enterprises by using a simplified approach for layout design and selection. The results show improvement in production rates, economic savings along with future impact in reducing greenhouse gas emission.
Received: 13 May 2016Accepted: 25 June 2016First Published: 29 June 2016
© 2016 The Author(s). This open access article is distributed under a Creative Commons Attribution (CC-BY) 4.0 license.
Page 2 of 13
Muhammad Fahad

Page 3 of 13
Ali Naqvi et al., Cogent Engineering (2016), 3: 1207296http://dx.doi.org/10.1080/23311916.2016.1207296
Thus, the economic benefits achieved by overall integration of facility are highlighted. The results illustrate the impact of layout design on elimination of waste and the economic benefits achieved by reducing overall material flow and lead time.
Subjects: Lean Manufacturing; Operations Management; Production Systems
Keywords: lean manufacturing; SLP; wastes; Kaizen; layout
1. IntroductionLean Manufacturing is a philosophy that maximizes efficiency, reduces costs, improves product quality, and also takes an important look how people work in a factory (Ohno, 1988). Lean produc-tion is “lean” because it uses less of everything; half the human effort in the factory and half the manufacturing space (Womack, Jones, & Roos, 1990). Factories that become lean can double output without enlarging their facilities or adding workers. Lean factories have one-tenth as much as work-in-process inventory (WIP) because material flows continuously during production from raw stock to the customer’s dock (Standard & Davis, 1999).
Some of the common tools utilized for implementing lean are (Ali, Jaweed, & Fahad, 2015; Ohno, 1988):
• Seven Wastes: wastes are the profits that the company can earn and lean is a revolution that earns that profit. As per Taiichi Ohno, wastes may comprise motion, waiting time, over produc-tion, over processing, defects, transportation and inventory. Eliminating waste is the primary focus of lean manufacturing.
• Kaizen: philosophy of continuous improvement of working practices
• Just In Time: reducing the in process inventory and associated costs
• 5S: methodology for work place organization
• Kanban: visual signal of customer demands
Facility layout is the arrangement of operations, machinery and spaces and the correlation be-tween them (Hales, 1984). It is the study of spatial allocation, for instance architecture space plan-ning, manufacturing layout, offices layout and very-large-scale integration (VLSI) layout (Tam & Li, 1991). The plant design is often directly related with production control and product quality (Vollmann & Buffa, 1966). Well-organized machine or department arrangements and suitable trans-portation paths create an efficient plant (Bock, 2007). Plant layout analysis generally incorporates a study of the production line process flow charts, material flow diagrams, product routings, process-ing times, development of from-to charts, relationship diagrams between different departments in the facility and the cost of material movement (Francis, McGinnis, & White, 1992). Systematic Layout Planning (SLP) is a prominent procedural approach and is widely used in layout design for various small and medium enterprises (Gilbert, 2004). Some recent work explore new areas in the applica-tion of layout planning such as hospitals and food industry (Helber, Böhme, Oucherif, Lagershausen, & Kasper, 2014; Lin, Liu, Wang, & Liu, 2015; Ojaghi, Khademi, Yusof, Renani, & Bin Syed Hassan, 2015; Wanniarachchi, Gopura, & Punchihewa, 2016).
This paper illustrates the use of SLP as a simplified approach for layout design. Since, the selected facility manufactures a customize product (switch gear) thus, the layout alternatives are evaluated on basis of better integration of facility. The economic benefits of the selected layout are also esti-mated. The rest of this paper is organized as follows, Section 2 provides a comparison between algo-rithmic and procedural approach and gives brief overview of factors considered during layout design. Section 3 explains the methodology and simplifies the criteria of layout alternative selection. In Section 4, an example of a facility is presented to apply the simplified SLP approach in real case. The final section discusses the concluding remarks and the application of the work in future research areas.
Page 4 of 13
Ali Naqvi et al., Cogent Engineering (2016), 3: 1207296http://dx.doi.org/10.1080/23311916.2016.1207296
2. Literature reviewFacility layout design has major influence on plant productivity. The purpose of layout design is to find the most effective facility arrangement and minimize the material handling. It has remained an active research area during recent decades (Allegri, 1984; Meller & Gau, 1996; Tarkesh, Atighehchian, & Nookabadi, 2009). Previous studies have shown that material handling cost has significant impact on plant’s operating cost. According to American Society of Mechanical Engineers, Material handling is defined the art and science dealing with the movement, packaging and storing of substances in a form. The equipment used in material handling influences the productivity of manufacturing (Jiamruangjarus & Naenna, 2016). It is estimated that material flow cost contributes from 30 to 70% of the total manufacturing cost, subject to the type of industry (Dongre & Mohite, 2015; Immer, 1953; Matson, Mellichamph, & Swaminathan, 1992). The operation cost during manufacturing can be reduced from 15 to 30% by well-organized material handling (Sule, 1994; Tuzkaya, Gülsün, Kahraman, & Özgen, 2010). Thus, it is critical that the location of machines/workstations should be arranged in a way that reduces the distance travelled by personnel or material handling (Heragu, 1992). Most literature for layout design problem falls into two major categories, algorithmic and procedural approaches. Table 1 compares both these approaches.
Layout generation and evaluation is often considered as time consuming and difficult task. This is because of two reasons. First, the extensive data collection process at the initial stage. Second, the multiple objective nature i.e. the best layout is selected after a trade-off between a combination of actual production requirements (Lin & Sharp, 1999a, 1999b). Examples include overall integration of all functions, minimum material movement, smooth work flow, effective space utilization, employee satisfaction, safety, flexibility, etc. (Raoot & Rakshit, 1993). The prioritization of the facility layout objectives decides the suitable approach to pursue (Aleisa & Lin, 2005). It is significant to evaluate long-term effects of modification before any change in facility layout. The new layout should justify the expense occurred during the rearrangement of machines/departments (Sule, 1994). Vollmann and Buffa (1966) investigated critically the assumptions involved in modification of layout. When following procedural approach these implications play a vital role in determining the best alternative.
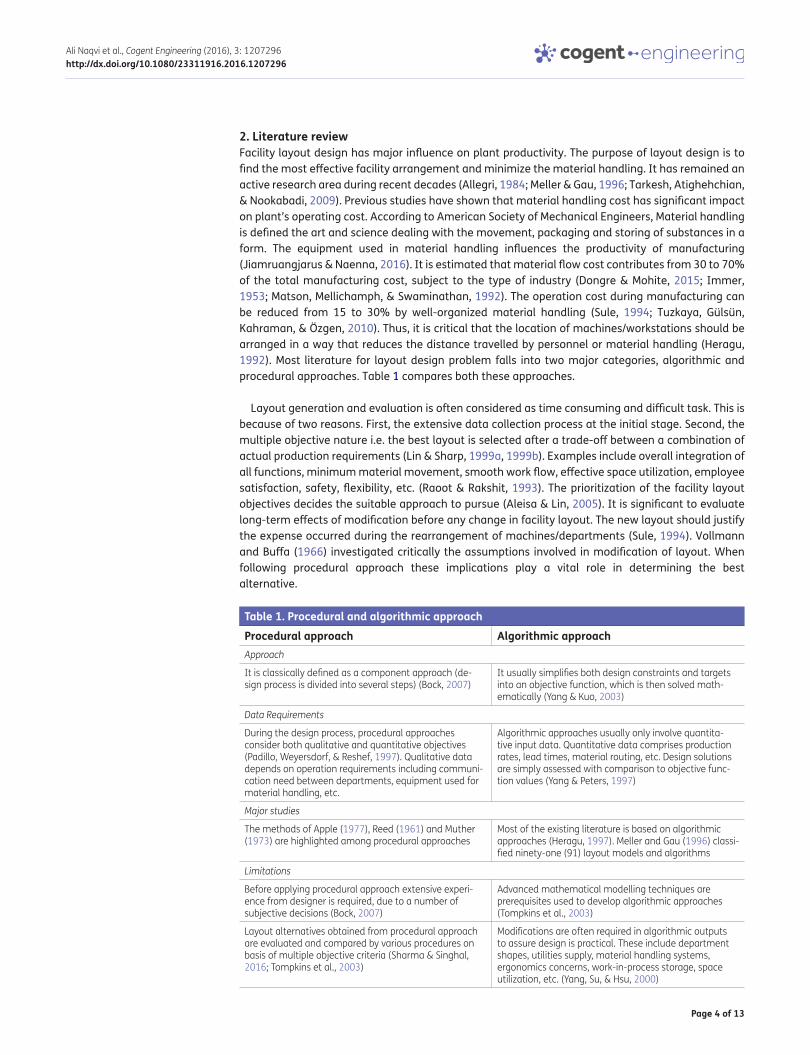
Table 1. Procedural and algorithmic approachProcedural approach Algorithmic approachApproach
It is classically defined as a component approach (de-sign process is divided into several steps) (Bock, 2007)
It usually simplifies both design constraints and targets into an objective function, which is then solved math-ematically (Yang & Kuo, 2003)
Data Requirements
During the design process, procedural approaches consider both qualitative and quantitative objectives (Padillo, Weyersdorf, & Reshef, 1997). Qualitative data depends on operation requirements including communi-cation need between departments, equipment used for material handling, etc.
Algorithmic approaches usually only involve quantita-tive input data. Quantitative data comprises production rates, lead times, material routing, etc. Design solutions are simply assessed with comparison to objective func-tion values (Yang & Peters, 1997)
Major studies
The methods of Apple (1977), Reed (1961) and Muther (1973) are highlighted among procedural approaches
Most of the existing literature is based on algorithmic approaches (Heragu, 1997). Meller and Gau (1996) classi-fied ninety-one (91) layout models and algorithms
Limitations
Before applying procedural approach extensive experi-ence from designer is required, due to a number of subjective decisions (Bock, 2007)
Advanced mathematical modelling techniques are prerequisites used to develop algorithmic approaches (Tompkins et al., 2003)
Layout alternatives obtained from procedural approach are evaluated and compared by various procedures on basis of multiple objective criteria (Sharma & Singhal, 2016; Tompkins et al., 2003)
Modifications are often required in algorithmic outputs to assure design is practical. These include department shapes, utilities supply, material handling systems, ergonomics concerns, work-in-process storage, space utilization, etc. (Yang, Su, & Hsu, 2000)
Page 5 of 13
Ali Naqvi et al., Cogent Engineering (2016), 3: 1207296http://dx.doi.org/10.1080/23311916.2016.1207296
The critical objective of layout is to minimize the material handling costs. Two basic sets of con-straints in designing a layout are: (1) department space and total floor area requirements and (2) operation boundaries, that is the departments placed within the facility should not overlap, and some departments must be isolated or have a specific position (Meller & Gau, 1996). New layout selection should consider long-term factors such as expandability and flexibility. Expandability is the ability to accommodate future expansions with least cost. Flexibility implies that layouts should be able to adapt future changes in product mix, variation in demand, and up gradation of technology. Both these factors emphasize that layout is not a one-time decision; it should be able to accommo-date modifications when needed (Vollmann & Buffa, 1966).
3. MethodologyThe benefit of using procedural approach in facility layout problem is that it involves both quantita-tive and qualitative factors. Thus, for developing plant layout SLP is used. It provides step-by-step guidelines for plant design from input data to evaluation of plant layout. The downside of SLP is that it requires thorough initial research on existing flows, procedures and activities of the facility (Trein & Amaral, 2001). For a detailed discussion and explanation of the technique, readers are suggested reference (Muther, 1973). According to Tortorella and Fogliatto (2008), SLP has three macro steps: (i) analysis, (ii) research and (iii) selection. Thus, SLP is often modified w.r.t system requirement and adaptability (De Carlo, Arleo, Borgia, & Tucci, 2013; Flessas, Rizzardi, Tortorella, Fettermann, & Marodin, 2015; Lin et al., 2015; Wanniarachchi et al., 2016).
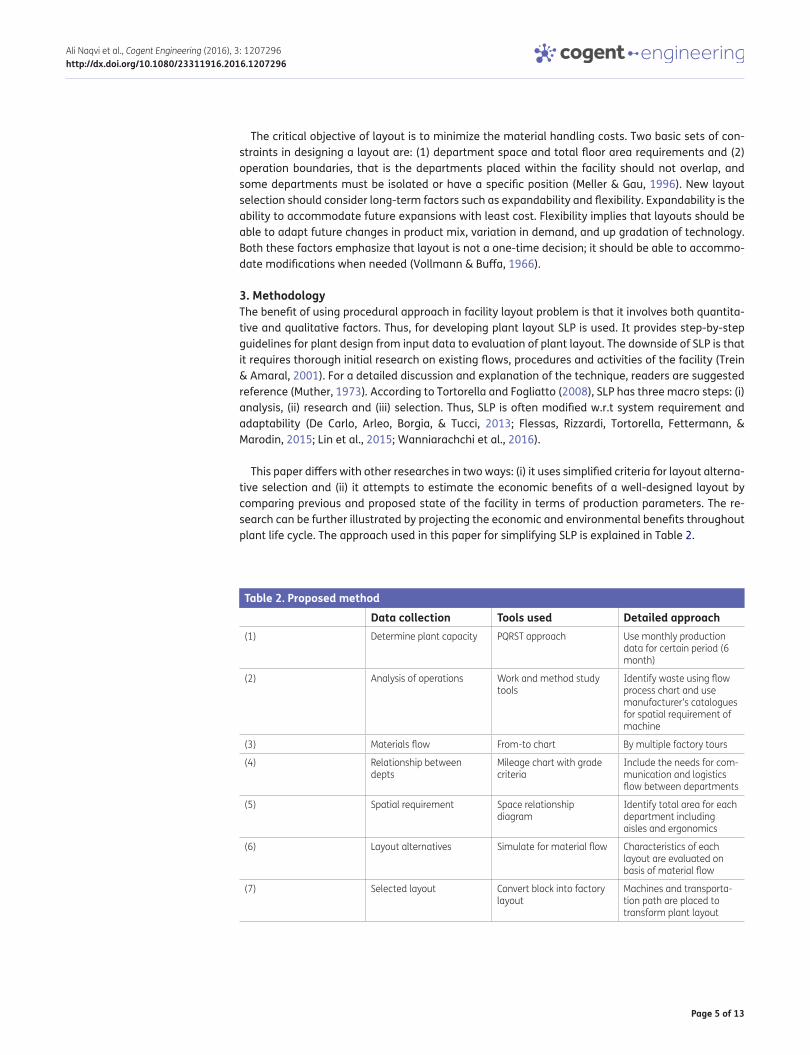
This paper differs with other researches in two ways: (i) it uses simplified criteria for layout alterna-tive selection and (ii) it attempts to estimate the economic benefits of a well-designed layout by comparing previous and proposed state of the facility in terms of production parameters. The re-search can be further illustrated by projecting the economic and environmental benefits throughout plant life cycle. The approach used in this paper for simplifying SLP is explained in Table 2.
Table 2. Proposed methodData collection Tools used Detailed approach
(1) Determine plant capacity PQRST approach Use monthly production data for certain period (6 month)
(2) Analysis of operations Work and method study tools
Identify waste using flow process chart and use manufacturer’s catalogues for spatial requirement of machine
(3) Materials flow From-to chart By multiple factory tours
(4) Relationship between depts
Mileage chart with grade criteria
Include the needs for com-munication and logistics flow between departments
(5) Spatial requirement Space relationship diagram
Identify total area for each department including aisles and ergonomics
(6) Layout alternatives Simulate for material flow Characteristics of each layout are evaluated on basis of material flow
(7) Selected layout Convert block into factory layout
Machines and transporta-tion path are placed to transform plant layout
Page 6 of 13
Ali Naqvi et al., Cogent Engineering (2016), 3: 1207296http://dx.doi.org/10.1080/23311916.2016.1207296
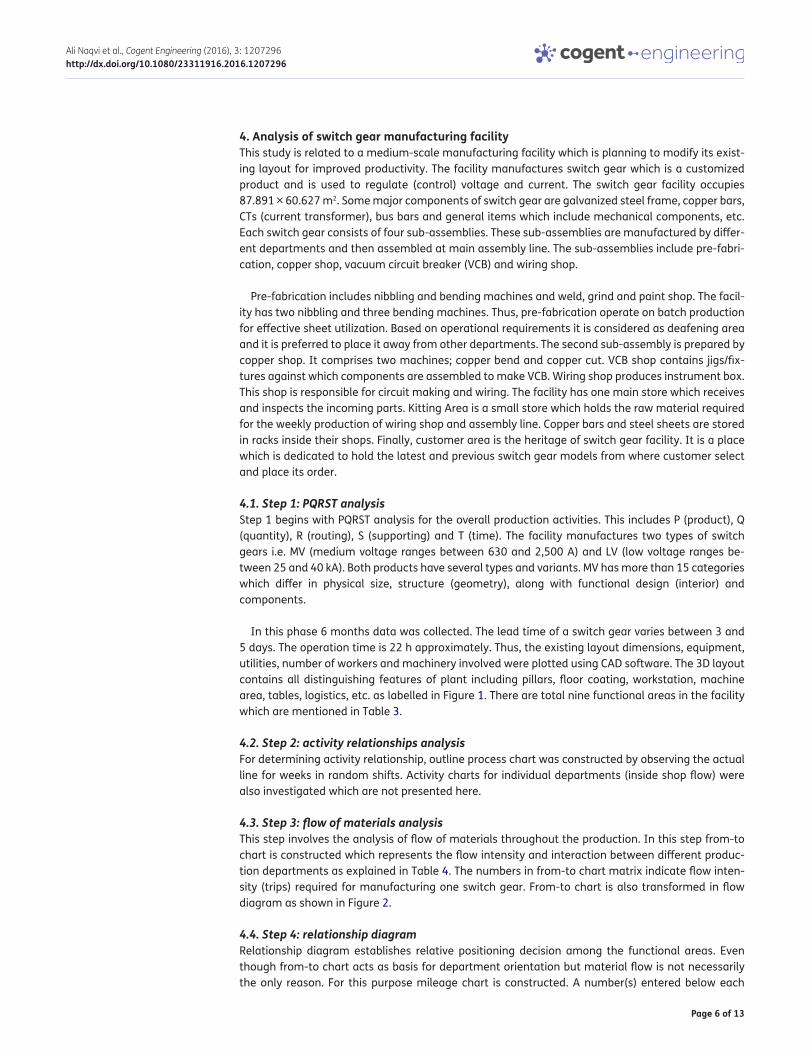
4. Analysis of switch gear manufacturing facilityThis study is related to a medium-scale manufacturing facility which is planning to modify its exist-ing layout for improved productivity. The facility manufactures switch gear which is a customized product and is used to regulate (control) voltage and current. The switch gear facility occupies 87.891 × 60.627 m2. Some major components of switch gear are galvanized steel frame, copper bars, CTs (current transformer), bus bars and general items which include mechanical components, etc. Each switch gear consists of four sub-assemblies. These sub-assemblies are manufactured by differ-ent departments and then assembled at main assembly line. The sub-assemblies include pre-fabri-cation, copper shop, vacuum circuit breaker (VCB) and wiring shop.
Pre-fabrication includes nibbling and bending machines and weld, grind and paint shop. The facil-ity has two nibbling and three bending machines. Thus, pre-fabrication operate on batch production for effective sheet utilization. Based on operational requirements it is considered as deafening area and it is preferred to place it away from other departments. The second sub-assembly is prepared by copper shop. It comprises two machines; copper bend and copper cut. VCB shop contains jigs/fix-tures against which components are assembled to make VCB. Wiring shop produces instrument box. This shop is responsible for circuit making and wiring. The facility has one main store which receives and inspects the incoming parts. Kitting Area is a small store which holds the raw material required for the weekly production of wiring shop and assembly line. Copper bars and steel sheets are stored in racks inside their shops. Finally, customer area is the heritage of switch gear facility. It is a place which is dedicated to hold the latest and previous switch gear models from where customer select and place its order.
4.1. Step 1: PQRST analysisStep 1 begins with PQRST analysis for the overall production activities. This includes P (product), Q (quantity), R (routing), S (supporting) and T (time). The facility manufactures two types of switch gears i.e. MV (medium voltage ranges between 630 and 2,500 A) and LV (low voltage ranges be-tween 25 and 40 kA). Both products have several types and variants. MV has more than 15 categories which differ in physical size, structure (geometry), along with functional design (interior) and components.
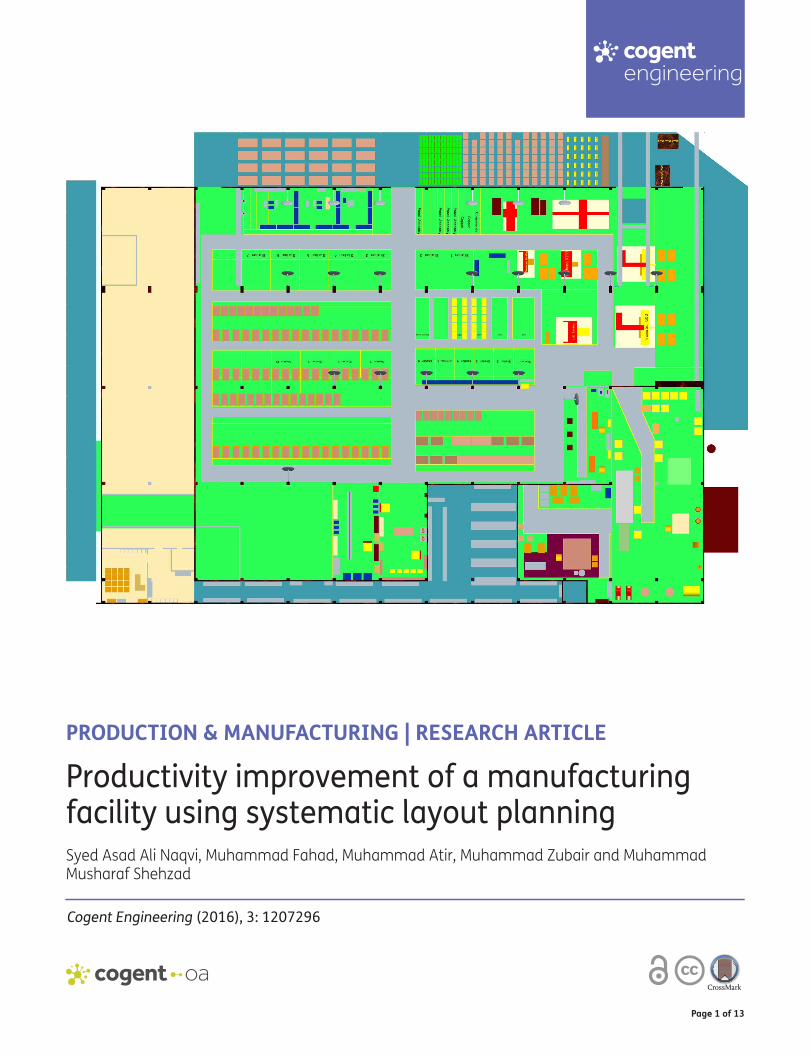
In this phase 6 months data was collected. The lead time of a switch gear varies between 3 and 5 days. The operation time is 22 h approximately. Thus, the existing layout dimensions, equipment, utilities, number of workers and machinery involved were plotted using CAD software. The 3D layout contains all distinguishing features of plant including pillars, floor coating, workstation, machine area, tables, logistics, etc. as labelled in Figure 1. There are total nine functional areas in the facility which are mentioned in Table 3.
4.2. Step 2: activity relationships analysisFor determining activity relationship, outline process chart was constructed by observing the actual line for weeks in random shifts. Activity charts for individual departments (inside shop flow) were also investigated which are not presented here.
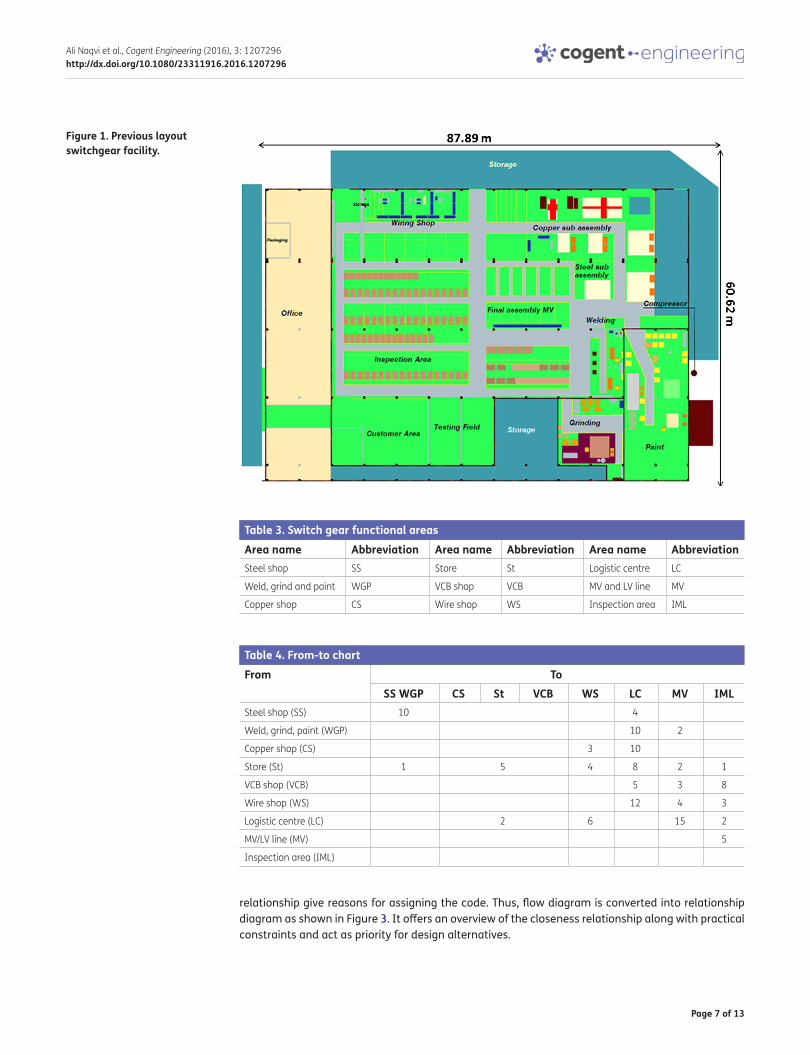
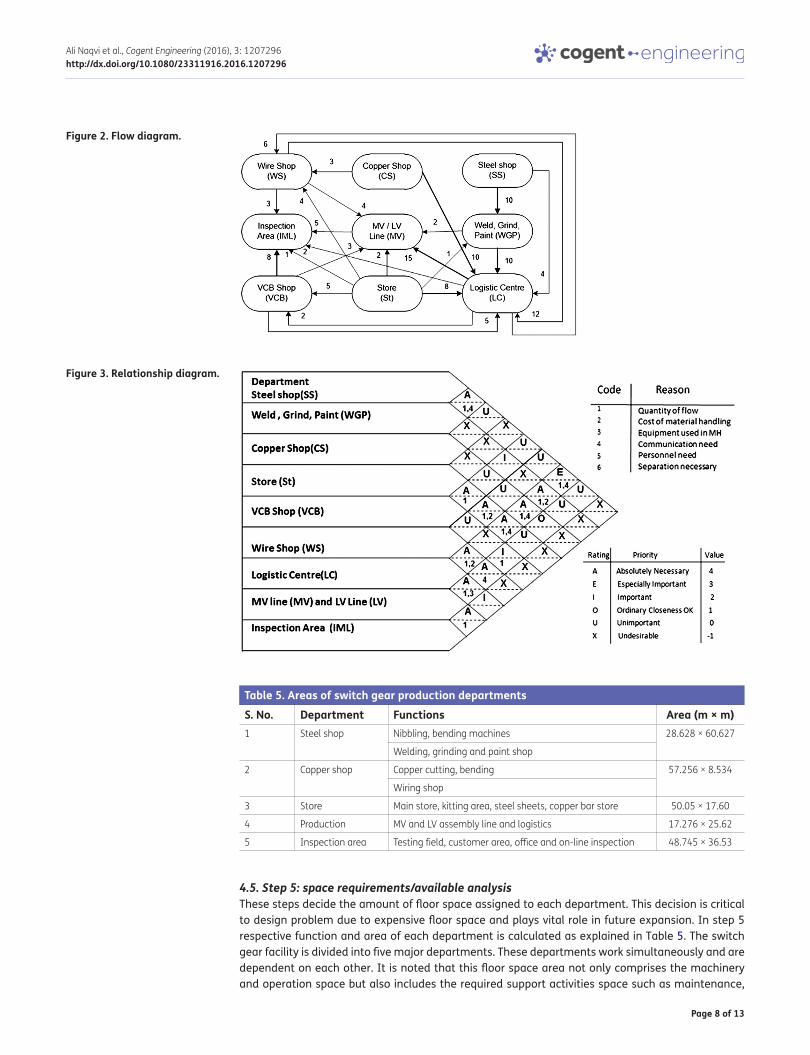
4.3. Step 3: flow of materials analysisThis step involves the analysis of flow of materials throughout the production. In this step from-to chart is constructed which represents the flow intensity and interaction between different produc-tion departments as explained in Table 4. The numbers in from-to chart matrix indicate flow inten-sity (trips) required for manufacturing one switch gear. From-to chart is also transformed in flow diagram as shown in Figure 2.
4.4. Step 4: relationship diagramRelationship diagram establishes relative positioning decision among the functional areas. Even though from-to chart acts as basis for department orientation but material flow is not necessarily the only reason. For this purpose mileage chart is constructed. A number(s) entered below each
Page 7 of 13
Ali Naqvi et al., Cogent Engineering (2016), 3: 1207296http://dx.doi.org/10.1080/23311916.2016.1207296
relationship give reasons for assigning the code. Thus, flow diagram is converted into relationship diagram as shown in Figure 3. It offers an overview of the closeness relationship along with practical constraints and act as priority for design alternatives.
Table 3. Switch gear functional areasArea name Abbreviation Area name Abbreviation Area name AbbreviationSteel shop SS Store St Logistic centre LC
Weld, grind and paint WGP VCB shop VCB MV and LV line MV
Copper shop CS Wire shop WS Inspection area IML
Table 4. From-to chartFrom To
SS WGP CS St VCB WS LC MV IMLSteel shop (SS) 10 4
Weld, grind, paint (WGP) 10 2
Copper shop (CS) 3 10
Store (St) 1 5 4 8 2 1
VCB shop (VCB) 5 3 8
Wire shop (WS) 12 4 3
Logistic centre (LC) 2 6 15 2
MV/LV line (MV) 5
Inspection area (IML)
Figure 1. Previous layout switchgear facility.
Page 8 of 13
Ali Naqvi et al., Cogent Engineering (2016), 3: 1207296http://dx.doi.org/10.1080/23311916.2016.1207296
4.5. Step 5: space requirements/available analysisThese steps decide the amount of floor space assigned to each department. This decision is critical to design problem due to expensive floor space and plays vital role in future expansion. In step 5 respective function and area of each department is calculated as explained in Table 5. The switch gear facility is divided into five major departments. These departments work simultaneously and are dependent on each other. It is noted that this floor space area not only comprises the machinery and operation space but also includes the required support activities space such as maintenance,
Figure 2. Flow diagram.
Figure 3. Relationship diagram.
Table 5. Areas of switch gear production departmentsS. No. Department Functions Area (m × m)1 Steel shop Nibbling, bending machines 28.628 × 60.627
Welding, grinding and paint shop
2 Copper shop Copper cutting, bending 57.256 × 8.534
Wiring shop
3 Store Main store, kitting area, steel sheets, copper bar store 50.05 × 17.60
4 Production MV and LV assembly line and logistics 17.276 × 25.62
5 Inspection area Testing field, customer area, office and on-line inspection 48.745 × 36.53
Page 9 of 13
Ali Naqvi et al., Cogent Engineering (2016), 3: 1207296http://dx.doi.org/10.1080/23311916.2016.1207296
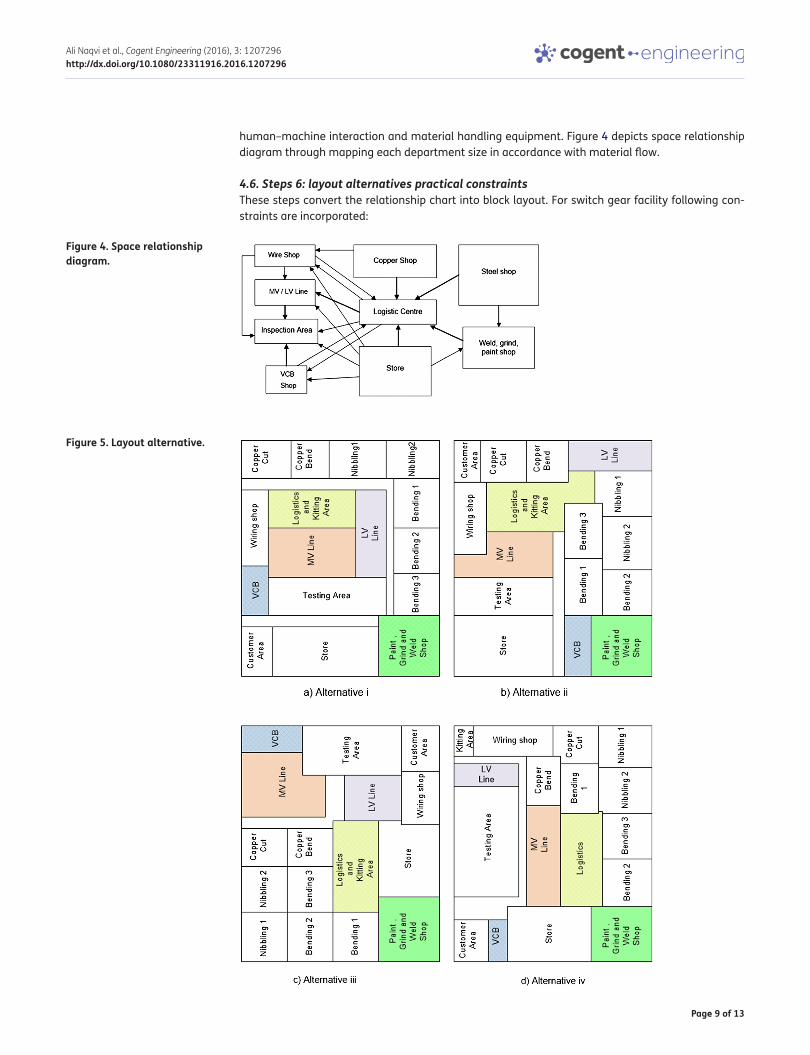
human–machine interaction and material handling equipment. Figure 4 depicts space relationship diagram through mapping each department size in accordance with material flow.
4.6. Steps 6: layout alternatives practical constraintsThese steps convert the relationship chart into block layout. For switch gear facility following con-straints are incorporated:
Figure 4. Space relationship diagram.
Figure 5. Layout alternative.

Page 10 of 13
Ali Naqvi et al., Cogent Engineering (2016), 3: 1207296http://dx.doi.org/10.1080/23311916.2016.1207296
• Grinding and paint shop should remain isolated from facility and office area. This is because of the hazardous nature of chemical used in these shops.
• The sub-assemblies VCB and testing field location should remain in close proximity.
• Wiring shop should be placed adjacent to pre-fabrication.
After applying the constraints on mileage chart, new layout alternatives are developed as shown in Figure 5.
4.7. Step 7: evaluationLayout alternatives are evaluated as explained in Table 6. The criteria comprise two aspects:
(a) No. of departments adjacent to logistic centre: this is a part of Kaizen philosophy and is impor-tant for implementation of lean tools including on-line inspection (jidoka), kanban and JIT.
(b) Overall material flow minimization: for productivity improvement and minimizing idle time (seven waste elimination), material flow is estimated for each alternative for production of one switch gear.
Therefore, layout alternative iv was selected and block layout was modified by placing actual shops and machines as shown in Figure 6.
Table 6. Layout alternative evaluationSwitch gear layout Number of adjacent
departmentsOverall material flow
(m)Remarks and problem highlights
Alternative i 6 115 Bending 3 and paint shop are far away from logistics
Alternative ii 7 92 Paint shop and logistics are distant which will increase idle time
Alternative iii 8 84 VCB and store are remote. This increase the material flow and accessiblity
Alternative iv 9 76 Maximum exposure to lo-gistics results in improved material tracking
Figure 6. New plant layout.
Page 11 of 13
Ali Naqvi et al., Cogent Engineering (2016), 3: 1207296http://dx.doi.org/10.1080/23311916.2016.1207296
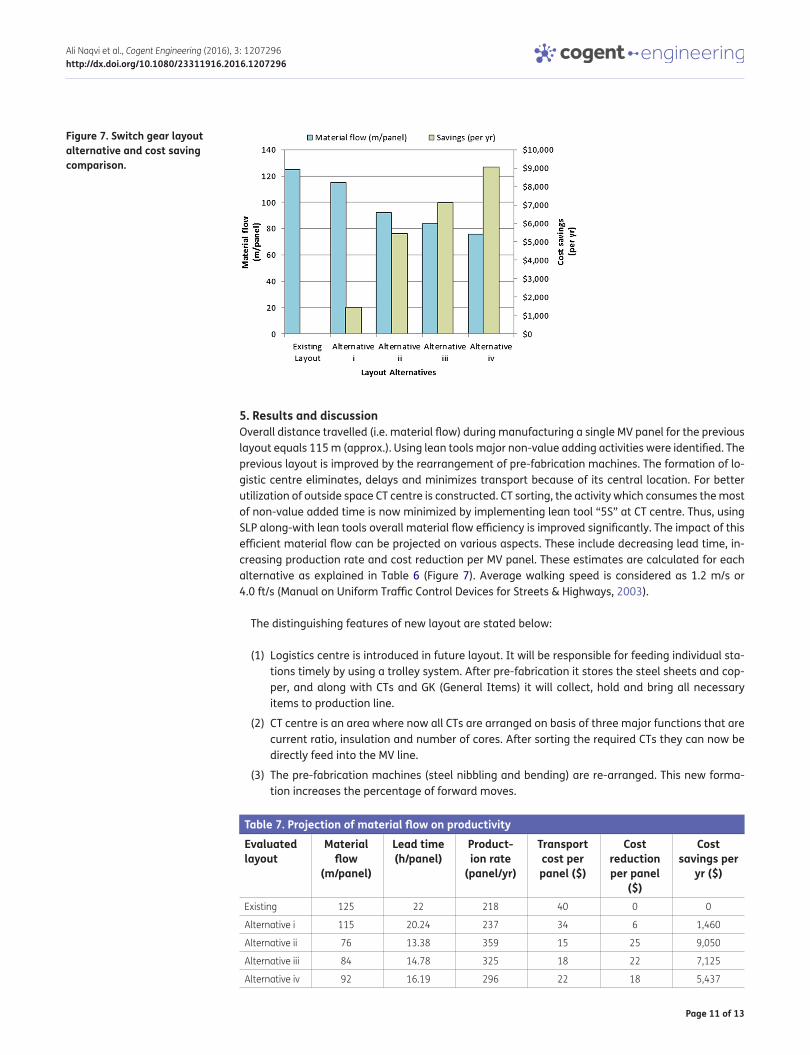
5. Results and discussionOverall distance travelled (i.e. material flow) during manufacturing a single MV panel for the previous layout equals 115 m (approx.). Using lean tools major non-value adding activities were identified. The previous layout is improved by the rearrangement of pre-fabrication machines. The formation of lo-gistic centre eliminates, delays and minimizes transport because of its central location. For better utilization of outside space CT centre is constructed. CT sorting, the activity which consumes the most of non-value added time is now minimized by implementing lean tool “5S” at CT centre. Thus, using SLP along-with lean tools overall material flow efficiency is improved significantly. The impact of this efficient material flow can be projected on various aspects. These include decreasing lead time, in-creasing production rate and cost reduction per MV panel. These estimates are calculated for each alternative as explained in Table 6 (Figure 7). Average walking speed is considered as 1.2 m/s or 4.0 ft/s (Manual on Uniform Traffic Control Devices for Streets & Highways, 2003).
The distinguishing features of new layout are stated below:
(1) Logistics centre is introduced in future layout. It will be responsible for feeding individual sta-tions timely by using a trolley system. After pre-fabrication it stores the steel sheets and cop-per, and along with CTs and GK (General Items) it will collect, hold and bring all necessary items to production line.
(2) CT centre is an area where now all CTs are arranged on basis of three major functions that are current ratio, insulation and number of cores. After sorting the required CTs they can now be directly feed into the MV line.
(3) The pre-fabrication machines (steel nibbling and bending) are re-arranged. This new forma-tion increases the percentage of forward moves.
Figure 7. Switch gear layout alternative and cost saving comparison.
Table 7. Projection of material flow on productivityEvaluated layout
Material flow
(m/panel)
Lead time (h/panel)
Product-ion rate
(panel/yr)
Transport cost per panel ($)
Cost reduction per panel
($)
Cost savings per
yr ($)
Existing 125 22 218 40 0 0
Alternative i 115 20.24 237 34 6 1,460
Alternative ii 76 13.38 359 15 25 9,050
Alternative iii 84 14.78 325 18 22 7,125
Alternative iv 92 16.19 296 22 18 5,437
Page 12 of 13
Ali Naqvi et al., Cogent Engineering (2016), 3: 1207296http://dx.doi.org/10.1080/23311916.2016.1207296
6. ConclusionLayout enhancement of a production plant is a common problem. Although, the use of SLP provides sequential steps to develop layout; it is generally considered as slow and time consuming process. The case study of switch gear facility presented in this paper consumed six months to depict the existing state and propose the new layout. This study attempts to illustrate the use of modified SLP procedure and also uses a simplified approach in layout selection criteria. The new layout success-fully increased the overall productivity of the facility. Results prove improvement in distance which ultimately reduces lead time and increases value addition. The proposed layout also emphasize on better integration of production departments of the facility (Table 7).
For future research, computer aided simulation software such as witness can be employed for a detailed “before and after” comparison. The simulation should illustrate real-time results of factors including capacity utilization, machine idle time, labour efficiency, etc. Since material flow has a di-rect influence on fuel (diesel) use. Thus, the findings of this study can also be used to examine the layout from a “green factory” perspective i.e. estimation of decrease in greenhouse gas emission throughout the plant life cycle.
AcknowledgementThis work became possible by the support of Industrial and Manufacturing department (NED University, Pakistan). Authors would like to thank all production supervisors and office staff who cooperated throughout the implementation of this project.
Funding.The authors received no direct funding for this research.
Author detailsSyed Asad Ali Naqvi1
E-mail: [email protected] ID: http://orcid.org/0000-0003-0093-3858Muhammad Fahad1
E-mail: [email protected] Atir1
E-mail: [email protected] Zubair1
E-mail: [email protected] ID: http://orcid.org/0000-0003-3921-5503Muhammad Musharaf Shehzad1
E-mail: [email protected] ID: http://orcid.org/0000-0002-2748-96731 Industrial & Manufacturing Department, NED University of
Engineering & Technology, Karachi, Pakistan.
Cover imageSource: Author.
Citation informationCite this article as: Productivity improvement of a manufacturing facility using systematic layout planning, Syed Asad Ali Naqvi, Muhammad Fahad, Muhammad Atir, Muhammad Zubair & Muhammad Musharaf Shehzad, Cogent Engineering (2016), 3: 1207296.
ReferencesAleisa, E. E., & Lin, L. (2005). For effective facilities planning: Layout
optimization then simulation, or vice versa. Proceedings of the 2005 Winter Simulation Conference, Orlando, FL.
Ali, B., Jaweed, S., & Fahad, M. (2015). Implementation of waste assessment matrix and line balancing for productivity improvement in a high variety/high volume manufacturing plant. Proceedings of ESMD, Karachi.
Allegri, T. H. (1984). Material handling: Principles and practices. New York, NY: Van Nostrand.
Apple, J. M. (1977). Plant layout and material handling (3rd ed.). New York, NY: Wiley.
Bock, K .H. S. (2007). Detailed layout planning for irregularly-shaped machines. European Journal of Operational Research, 177, 693–718.
De Carlo, F., Arleo, M. A., Borgia, O., & Tucci, M. (2013). Layout design for a low capacity manufacturing line: A case study. International Journal of Engineering Business Management, 5, 1–10.
Dongre, A., & Mohite, N. Y. (2015). Significance of selection of material handling system design in industry-A review. International Journal of Engineering Research and General Science, 3, 76–79.
Flessas, M., Rizzardi, V., Tortorella, G. L., Fettermann, D., & Marodin, G. A. (2015). Layout performance indicators and systematic planning. British Food Journal, 117, 2098–2111. http://dx.doi.org/10.1108/BFJ-01-2015-0012
Francis, R. L., McGinnis, L. F., & White, J. A. (1992). Facility layout and location: An analytical approach. Englewood Cliffs, N.J.: Prentice Hall.
Gilbert, J. P. (2004). Construction office design with systematic layout planning. 2nd World conference on POM 15th Annual POM conference Cancun, Mexico.
Hales, H. L. (1984). Computer aided facilities planning. New York, NY: M. Dekker.
Helber, S., Böhme, D., Oucherif, F., Lagershausen, S., & Kasper, S. (2014). A hierarchical facility layout planning approach for large and complex hospitals. Flexible Services and Manufacturing Journal, 28, 5–29.
Heragu, S. S. (1992). Recent models and techniques for solving the layout problem. European Journal of Operational Research, 57, 136–144.
Heragu, S. (1997). Facilities design. Boston, MA: PWS Publishing.Immer, J. R. (1953). Materials handling. New York, NY: McGraw-Hill.Jiamruangjarus, P., & Naenna, T. (2016). An integrated multi-
criteria decision-making methodology for conveyor system selection. Cogent Engineering, 3(1) , 1–16.
Lin, Q. L., Liu, H. C., Wang, D. J., & Liu, L. (2015). Integrating systematic layout planning with fuzzy constraint theory to design and optimize the facility layout for operating theatre in hospitals. Journal of Intelligent Manufacturing, 26, 87–95.
Lin, L. C., & Sharp, G. P. (1999a). Quantitative and qualitative indices for the plant layout evaluation problem. European Journal of Operational Research, 116, 100–117. http://dx.doi.org/10.1016/S0377-2217(98)00046-0
Lin, L. C., & Sharp, G. P. (1999b). Application of the integrated framework for the plant layout evaluation problem. European Journal of Operational Research, 116, 118–138. http://dx.doi.org/10.1016/S0377-2217(98)00174-X

Page 13 of 13
Ali Naqvi et al., Cogent Engineering (2016), 3: 1207296http://dx.doi.org/10.1080/23311916.2016.1207296
Manual on Uniform Traffic Control Devices for Streets and Highways. (2003). FHWA. U.S. Department of Transportation. Retrieved from mutcd.fhwa.dot.gov/
Matson, J. O., Mellichamph, J. M., & Swaminathan, S. R. (1992). EXCITE: Expert consultant for in-plant transportation equipment. International Journal of Production Research, 30, 1969–1983.
Meller, R. D., & Gau, K. Y. (1996). The facility layout problem: Recent and emerging trends and perspectives. Journal of Manufacturing Systems, 15, 351–366.
Muther, R. (1973). Systematic layout planning. Boston, MA: Cahners Books.
Ohno, T. (1988). Toyota production system: Beyond large-scale production. Portland, OR: Productivity Press.
Ojaghi, Y., Khademi, A., Yusof, N. M., Renani, N. G., & Bin Syed Hassan, S. A. H. (2015). Production layout optimization for small and medium scale food industry. Procedia CIRP, 26, 247–251.
Padillo, J. M., Weyersdorf, D., & Reshef, O. (1997). Incorporating manufacturing objectives into the semiconductor facility layout design process: A methodology and selected cases. IEEE/SEMI Advanced Semiconductor Manufacturing Conference and Workshop, Boston, MA.
Raoot, A. D., & Rakshit, A. (1993). A ‘linguistic pattern’ approach for multiple criteria facility layout problems. International Journal of Production Research, 31, 203–222. http://dx.doi.org/10.1080/00207549308956721
Reed Jr., R. (1961). Plant layout: Factors, principles and techniques. Homewood, IL: Richard D. Irvin.
Sharma, P., & Singhal, S. (2016). Implementation of fuzzy TOPSIS methodology in selection. The International Journal of Advance Manufacturing Technology, 1–9.
Standard, C., & Davis, D. (1999). Running today’s factory: A proven strategy for lean manufacturing. Cincinnati, OH: Hanser Gardner.
Sule, D. R. (1994). Manufacturing facilities: Location”, planning, and design. Boston, MA: PWS Publishing Company.
Tam, K. Y., & Li, S. G. (1991). A hierarchical approach to the facility layout problem. International Journal of Production Research, 29, 165–184.
Tarkesh, H., Atighehchian, A., & Nookabadi, A. S. (2009). Facility layout design using virtual multi-agent system. Journal of Intelligent Manufacturing, 20, 347–357.
Tompkins, J. A., White, J. A., Bozer, Y. A., Frazelle, E. H., Tanchoco, J. M. A., & Trevino, J. (2003). Facilities planning (3rd ed.). New York, NY: John Wiley & Sons.
Tortorella, G., & Fogliatto, F. (2008). Planejamento sistemático de layout com apoio de análise de decisão multicritério. [Systematic layout planning aided by multicriteria decision analysis]. Produção, 18, 609–624.
Trein, F. A., & Amaral, F. (2001). A aplicação de técnicas sistemáticas para a análise e melhoria de layout de processo na indústria de beneficiamento de couro. [A systematic application techniques for analysis and improvement process layout in leather processing industry]. Encontro Nacional de Engenharia de Produção, 21, 1–8.
Tuzkaya, G., Gülsün, B., Kahraman, C., & Özgen, D. (2010). An integrated fuzzy multi-criteria decision making methodology for material handling equipment selection problem and an application. Expert systems with applications, 37, 2853–2863.
Vollmann, T. E., & Buffa, E. S. (1966). The facilities layout problem in perspective. Management Science, 12, B450–B468.
Wanniarachchi, W. N. C., Gopura, R. A. R. C., & Punchihewa, H. K. G. (2016). Development of a layout model suitable for the food processing industry. Journal of Industrial Engineering, 2016, 1–8.
Womack, J. P., Jones, D. T., & Roos, D. (1990). Machine that changed the world. New York, NY: Rawson Associates.
Yang, T., & Kuo, C. (2003). A hierarchical AHP/DEA methodology for the facilities. European Journal of Operational Research, 147, 128–136.
Yang, I., & Peters, B. A. (1997). A spine layout design method for semiconductor fabrication facilities containing automated material‐handling systems. International Journal of Operations & Production Management, 17, 490–501.
Yang, T., Su, C. T., & Hsu, Y. R. (2000). Systematic layout planning: A study on semiconductor wafer fabrication facilities. International Journal of Operations & Production Management, 20, 1359–1371.
© 2016 The Author(s). This open access article is distributed under a Creative Commons Attribution (CC-BY) 4.0 license.You are free to: Share — copy and redistribute the material in any medium or format Adapt — remix, transform, and build upon the material for any purpose, even commercially.The licensor cannot revoke these freedoms as long as you follow the license terms.
Under the following terms:Attribution — You must give appropriate credit, provide a link to the license, and indicate if changes were made. You may do so in any reasonable manner, but not in any way that suggests the licensor endorses you or your use. No additional restrictions You may not apply legal terms or technological measures that legally restrict others from doing anything the license permits.