productive - socr
TRANSCRIPT


Spatial transformation that enhances the economy of cities
@gavman18 and @nezworx
3
PRODUCTIVE CITIES

Key Messages
1 Cities have a critical role to play in
driving South Africa’s economy.
2 However, the good story has not
included everyone.
3Spatial transformation is a key lever
for productive city economies and
inclusive city growth.
4Cities should develop bold
economic development strategies
that include the informal sector and
public employment programmes.
5Cities need to expand economic
activities and participation through
innovation, skills development and
targeted investments.
6Cities should learn from one
another’s strengths in order to
improve their business climate.
@loafus

3
P R O D U C T I V E C I T I E S 85
IntroductIonSouth Africa is heading for an economic storm. The economy is performing far below its potential, as evidenced by slow economic growth (not even reaching 2% a year) and mounting job losses. The daily realities of economic turbulence affect everyone – rich and poor; employed and unemployed; big and small businesses; entrepreneurs and informal traders. Attention is increasingly focused on the role that cities play in stimulating, supporting and enhancing economic development, and on the ability of cities to lead South Africa towards economic recovery.
City economies are a study in contrast. As concentrations of economic activity, cities offer promise and opportunity to those who are economically agile and entrepreneurial. Well-functioning cities are foremost about people, and their economies are likely to have lively market spaces and production warehouses, souks and bazaars where traders, investors, industrialists, producers, workers and customers meet to trade and do business. In such cities, people experience a vibrancy of place from the diversity of economic opportunities and that distinctive city character, which blends different tenors, cultures, cuisines, heritages and languages into a shared and unique history that shapes present-day experience.
Yet for many people, cities are sites of unprecedented exclusion where they are barred from participating in economic activity or accessing economic opportunities, and, as a result, live marginal lives on the edge of society. Urban spaces and the flows between these spaces can be exclusive, where economic activities are preserved for the few and the poor are trapped at the periphery, or inclusive, where people are able to access economic opportunities across the city.
The main aim of this chapter is to understand how to transform apartheid’s legacy of dispersed and distorted spatial settlement patterns, which characterise South Africa’s cities today, in order to strengthen city competitiveness, enhance transformative resilience, and intensify economic inclusion. The overarching message is that spatial form matters for strong and productive city economies, and that spatial transformation is essential to cities becoming effective drivers of local and national development.
A strong and productive city economy is one that is able to “attract, retain and develop firms, other entities and entrepreneurs with a stable or rising market share, while increasing the rate of economic participation and the quality of life of its residents” (SACN, 2011: 19).
86 S TaT E O f S O U T h a f R I C a n C I T I E S R E P O R T 2016
understandIng cIty economIes The human tendency is to agglomerate, as shown by the existence of cities and increasing urbanisation. The upside of urban agglomeration includes various benefits. These are outlined below.
Logistical efficiencies: Transport and information-sharing costs are reduced, while firms have better physical and electronic connectivity with their customers, suppliers and markets. People can get to and from work more easily, and so can participate in the economy and in city life. Equally, improved information and communications technology (ICT), i.e. high-speed broadband, reduces spatial barriers and enhances the sharing of information and knowledge.
Labour access: Cities have large and deep labour pools, which give employers increased flexibility (to adapt their workforce to changing technology and business needs) and provide a better match between employers and job-seekers, thereby reducing labour turnover and improving productivity. In addition, a city filled with different workplaces reduces commuting and job-search costs for workers and recruitment costs for firms.
Knowledge spillovers: The greater scale, density and diversity of economic activity in city life boosts the free flow of ideas and information-sharing that allow people and firms to learn from each other. Networking and knowledge spill-overs spur entrepreneurship and enhance productivity, particularly for newly emerging industries.
Innovation and diversity: The scale and diversity of city economies lead to greater innovation in response to changing technologies and market or customer demand. Economic diversity and close proximity increases the flow of goods, services and information among firms, strengthening firm competitiveness. The industrial mix also balances the demand for less-skilled workers with those that are more educated, bringing greater inclusivity to city life (SACN, 2011; Glaeser and Joshi-Ghani, 2013).
Liveability (i.e. the quality of life and how attractive a place is to live, work, and play): The “buzz” of diverse cultural and recreational activities in cities deepens social interaction and encourages the exchange of ideas and information. A city that offers quality urban and recreational amenities can attract and retain skilled workers and mobile “gold collar” professionals who are critical to city economies. Urban amenities also serve as drawcards for visitors who drive the broader tourism or visitor economy, which supports businesses, creates jobs and build the city’s reputation.
However, the downside of urban agglomeration manifests in:
Higher costs: Greater demand for products and services contributes to higher costs of doing business, including property rents and labour costs.

3
P R O D U C T I V E C I T I E S 87
Congestion and pressure on resources: Agglomeration can lead to higher levels of congestion, undue pressure on infrastructure, such as housing, transportation networks, water, sanitation and electricity, as well as excess demands on natural resources, such as water supply and air quality.
Increased poverty: In the developing world, successful cities attract many migrants (from rural areas and less prosperous, smaller cities and towns) seeking work and a better quality of life. The flow of people to large cities inevitably increases poverty, as few arrive with the skills and resources necessary to compete in urban labour markets. These migrants tend to swell the ranks of the poor and unemployed that congregate in overcrowded living spaces.
A city may, therefore, be both productive and inclusive, yet still have poverty, inequality and slums. “Cities aren’t full of poor people because cities make people poor, but because cities attract poor people with the prospect of improving their lot in life” (Glaeser, 2011: 70).
What a successful and inclusive city does is to enable poor people to develop pathways out of poverty through providing quality basic services (e.g. water, sanitation, healthcare and education) and facilitating decent jobs and livelihood opportunities for the less skilled, so that poor families are able to access income and opportunity. Such a city builds common spaces and flows between these spaces that encourage people from different communities to meet and mingle in ways that build a common city identity and understanding. This strengthens social coherence and enhances city resilience in an increasingly uncertain world.
resilient city economiesResilient cities can adapt and transform in the face of increasing social, economic and environmental change that accompanies the relentless push to urbanise in a globalised world (Seeliger and Turok, 2013). The way in which these cities function can enable the people living and working there – particularly the poor and vulnerable – to survive and thrive, no matter what the stresses or shocks encountered (Rockefeller Foundation and Arup, 2014). Resilience thinking appreciates that cities are complex and dynamic urban systems that operate at different scales, from beyond city boundaries and the city level itself, to the community, neighbourhood and even household level. The relationships between these levels are complex and shifting (Chelleri, 2010). There are different perspectives on city resilience: disaster and risk management approaches advocate bounce-back resilience, whereby cities are able to maintain basic city structures and functioning after disruptive or catastrophic events; bounce-forward or transformative resilience considers disruptive events or disasters as opportunities to bring about change, adapting and transforming city systems so that they are better able to manage or reduce the impact of the chronic stresses and shocks. Cities have the opportunity to reshape themselves, to revitalise, regenerate and become more inclusive (Seeliger and Turok, 2013).

88 S TaT E O f S O U T h a f R I C a n C I T I E S R E P O R T 2016
spatial transformation underpins economic strength“South Africa’s spatial landscape has to be re-shaped, including investment in dynamic city development, integrated housing and transport programmes and support for business activity and job creation in both urban and rural areas.”1
Successful cities know the extent (and limits) of their powers and competences, and actively collaborate to pursue economic development goals. They promote connectivity, mobility and flow in city space in a way that stimulates firms to invest and create jobs, and enhance economic participation. They nurture regional development coalitions and partnerships with the private sector and other interested stakeholders. And they lobby national and provincial government and broader public sector investors to catalyse spatial transformation in ways that strengthen city economic performance, inclusivity and resilience (World Bank, 2015a).
Cities are able to draw on three main levers for spatial transformation. (1) Spatial planning and land-use management, which are at the heart of transforming cities into more productive, inclusive and resilient city economies; (2) improved human settlements, as a city that is more compact is able to reduce transport costs, improve the integration of land uses and give poorer people better access to jobs, urban services and social amenities; (3) public transport because improving people’s ease of mobility and access to economic opportunities determines how well a city functions and underpins its economic performance. Non-spatial levers, such as intervention in the urban land markets, are also very effective.
City spatial form, human settlement and public transport interventions are interdependent and will undermine each other if planned and implemented separately. The challenge for cities is to enhance their spatial form in a way that makes them increasingly economically efficient and resilient, as well as more inclusive, enabling people to access different economic opportunities across city space. Cities therefore need to use their spatial planning and land-use management (zoning) instruments, and human settlement and public transport investments more effectively to concentrate and densify where people live and where they work along core public transport corridors and economic centres. This requires cities developing a deeper and more nuanced understanding of the spatial and locational factors that encourage firms to invest in certain areas and not in others, as well as strengthened capacity to implement and coordinate an integrated approach across spatial planning, human settlement and public transport functions (Schmidt, 2014).
spatial planning and land-use managementUrban spatial planning is about shaping and managing city (and regional) spaces and flows in a way that takes into account the different (and often contending) needs and interactions of people, the economy and the environment. Operating within an overall spatial planning framework, land-use management allocates different land uses to different spaces, which are connected through
1 Minister of Finance Nhlanhla Nene, 2014 Medium Term Budget Policy Statement Speech, 22 October 2014. http://www.sanews.gov.za/south-africa/full-speech-2014-medium-term-budget-policy-statement-speech

3
P R O D U C T I V E C I T I E S 89
transportation networks. Land-use planning most often leads to land-use regulation, which usually includes zoning. Zoning regulations specify the areas in which different activities (residential, industrial, recreational, commercial or mixed-use) can take place. They may also regulate the amount of space allocated to these activities and the density of development, and provide spaces for education and healthcare facilities, parks and green spaces, and protection of heritage places.
The legacy of land dispossession continues to scar cities, which still exhibit racially segregated suburbs separated by buffer zones, single-use land management inefficiencies, low density sprawl, and racially divided urban growth patterns and opportunities (Donaldson, 2001). With the promulgation of the Spatial Planning and Land Use Management Act (SPLUMA) (No. 16 of 2013), South Africa now has legislation to govern developments in urban spatial planning and land-use management, which is a municipal competency. With SPLUMA, cities have the potential to integrate strategic city-wide spatial planning strategies and city economic development strategies, and to facilitate spatially targeted interventions and infrastructure investments aimed at transforming city spatial form, thereby creating more productive, resilient and inclusive cities.
densified human settlements Unlike cities elsewhere in the world, South African cities are characterised by low-density urban sprawl and higher densities on the outskirts of cities, not the inner cities. This is a result of apartheid spatial segregation, aggravated by the low-cost housing developments built post-1994. Under pressure to deliver as many low-cost houses as inexpensively as possible, developers built where the land was cheaper – on the periphery. Better located and integrated development is critical to reducing urban sprawl and spatial economic transformation of cities. As better located land is usually more expensive, greater density is encouraged to make the best use of the land, thereby contributing to enhanced efficiency in the city space economy (Bertoldi, 2015). Government has shifted its emphasis from delivering mass housing to delivering human settlements, acknowledging the need for housing in well-located urban neighbourhoods. However, political and private developer vested interests have so far trumped concerns for better located, more compact and integrated housing alternatives.
The current national Minister for Human Settlements (in 2016) has prioritised the fast-tracking of housing delivery, but the plan is largely driven by 77 catalytic megaprojects. The real worry is that the drive to achieve numerical targets will yet again lead to mass housing delivery on large, remote greenfield sites, as infill development on better located, smaller brownfield land parcels is more complex. These megaprojects depend critically on attracting private sector investment and jobs that make them economically self-sufficient. If such projects are not able to generate economic activity internally, their distance to existing economic centres will exacerbate urban sprawl, spatial fragmentation and dislocation (GCRO, 2015). The concern is that proposals for the megaprojects implicitly assume that housing development drives economic development, but do not take into account the locational factors that are critical to firm competitiveness and inform where investors decide to locate. As over the longer term city residents and taxpayers will bear the brunt of further spatial fragmentation, there is concern about the current approach to human settlements and the reversal of a decade of progress towards devolving this function to city level bears significant weight.
90 S TaT E O f S O U T h a f R I C a n C I T I E S R E P O R T 2016
Improved mobility and access to public transportSouth African commuters have to contend daily with overcrowding, security concerns, long commuting times and high costs of travel, particularly for low-income users (Van Ryneveld, 2010). Providing reliable and affordable public transport would be a game changer for South Africa’s spatially dispersed cities, with their extensive road networks and orientation towards private car usage. Reducing public transport costs and travel time enhances city spatial connectivity and inclusivity, and strengthens city resilience. Consolidating public transport at city level presents the biggest opportunity to reshape South Africa’s urban spatial patterns. However, public transport systems are big ticket items that require significant ongoing subsidies to ensure affordable commuting costs for the broader population. With just four years to go to achieve the target of 85% of all urban residents living within one kilometre of a rapid public transport network by 2020, it is increasingly evident that the 2007 Public Transport Strategy underestimated the cost of rolling out integrated rapid public transport networks across South Africa’s cities (Cameron, 2009).
The BRT model requires significant financing and ongoing subsidisation because of South Africa’s spatially dispersed cities. Unlike similar systems in rapidly growing cities around the world, BRT in South Africa is not able to draw on sufficient population densities for the strong ridership that improves cost effectiveness and financial sustainability over the longer term. Furthermore, as public transport is devolved to city level, city governments and taxpayers become responsible for the significant costs associated with the inefficient urban form. Given the funding constraints, cities should focus on rolling out BRT along high-density corridors that can potentially generate sufficient revenue (thereby limiting operating subsidies over time) and on accommodating minibus taxis to continue to service dispersed demand patterns that feed into main urban transport trunk services (Schmidt, 2014).
non-spatial leversCity competitiveness is also about the ease of doing business in city space, and understanding that firms drive city economic activity and create (formal) jobs. Key factors or levers that make it easier for firms to do business include institutions and regulations (such as taxes, licences, duties and legal regulations); urban infrastructure (roads, public transport, electricity, water, sanitation and communications); land-use management (zoning); skills (schooling, vocational training and workforce development); innovation networks; and enterprise support and finance (access to capital, subsidies and incentives). Economic and social inclusion can also be supported by levers such as urban infrastructure, informal trading by-laws and the upscaling of public work programmes in poor communities.
developing robust urban economic strategiesTo improve the integration and sequencing of national, provincial and local economic development and spatial development strategies in cities, economic and spatial teams need to work closely together. This will enable the high-level city economic development strategies to inform and, in fact, drive spatial development interventions and investments, such as zoning regulations and public transport routes. Equally, spatial considerations and objectives should influence how cities formulate their economic development strategies. However, in reality, city teams often shape their individual development

3
P R O D U C T I V E C I T I E S 91
strategies in separate silos, with limited interaction and coordination. In addition, economic development strategies are not always informed by robust spatial economic data and intelligence, or by regular monitoring and evaluation to assess the impact of public investments. The end result is that city and stakeholder efforts are fragmented, and spatially targeted investments do not yield economic efficiencies and value for money. Cities should know and understand their economic metrics – at the city-level and at the functional economic level within the city. By “knowing their numbers”, cities will be able to more successfully target spatial economic development interventions and infrastructure investments, and enhance city economic performance.
Importance of spatial targeting and evidence City economic performance is usually analysed using data based on city administrative boundaries. However, this approach does not take into account the functional level, i.e. how people, goods and services connect and move among the different spaces in a city, and how these flows enhance or constrain a city’s overall economic performance. The aim of spatially targeted investments is to connect and reduce the distance2 between more vibrant, dense economic centres and less economically active neighbourhoods in a way that reshapes the spatial patterns and configurations of city life. Spatially targeted interventions and investment programmes have a better chance of success if they are made on the basis of robust analytical evidence. Empirical spatial economic analysis is relatively new to South Africa and has to date focused largely on the provincial, city and the city region3 level. There is a lack of robust economic information from official surveys, and administrative and private sector data, at the city and sub-city level.4
The spatial dimension is important because people live, work and play in defined spaces within cities. Geographic spaces shape social and economic activities, as well as the flows of people, goods and services that determine opportunities for inclusion and define barriers for exclusion. Businesses and entrepreneurs invest in particular localities. Government and public entities build critical economic and social infrastructure, such as roads, schools, hospitals, airports and harbours in specific areas. In a constrained fiscal environment, city-level economic intelligence enables cities to assess whether public spending (on area- or place-based economic development interventions and infrastructure) is having any meaningful economic impact in terms of increased firm-level activity and jobs. Figures 3.1 and 3.2 show how mapping VAT registrations in Johannesburg and Cape Town can provide a detailed understanding of where different economic sectors are concentrated.
2 “Distance” is used here in an economic sense rather than in respect of physical distance. Economic distance measures how “easily capital flows, labour moves, goods are transported and services are delivered between two locations” (World Bank, 2009).
3 City region is defined as the grouping together of local government boundaries that have broadly aligned economic activities and settlement concentrations.
4 For instance, the Gauteng City Region Observatory (GCRO) has mapped the distribution of businesses across Gauteng and the number of business per km2 within Johannesburg for 2010. This provides a detailed spatial mapping of formal business activity for that particular year. However, as the data was purchased from AfriGIS, a private sector technology innovation company that provides geographically coded firm-level data (see https://www.afrigis.co.za/), it is not freely publicly available. It also does not capture trends, as a new dataset is released each quarter, given that AfriGIS obtains the data from a credit bureau and releases a geocoded version on a quarterly basis (Harrison et al., 2014; AfriGIS, 2015).

92 S TaT E O f S O U T h a f R I C a n C I T I E S R E P O R T 2016
Figure 3.1: Johannesburg’s VAT registrations (March 2014–February 2015)
city of Johannesburg <null>agriculture, hunting, fishery, forestry
Whole traderetail traderetail trade automotiveHotels and restaurantstransport and communicationFinance, insurance, real estatecommunity, social, personal services
constructionmanufacturingmining and quarrying
Source: Laldaparsad (2015) from Stats SA Business Register
Figure 3.2: Cape Town’s VAT registrations (March 2014–February 2015)
Wc municipalitiesNumber of VAT Registrations per Ward (Square Km)
0 - 2021 - 100101 - 200201 - 510no data
Source: Laldaparsad (2015) from Stats SA Business Register

3
P R O D U C T I V E C I T I E S 93
tHe economIc role and PerFormance oF soutH aFrIca’s cItIes The economic role and performance of the nine cities were examined over an 18-year period (1995 to 20135) using city economic indicator data.6
city economic activityOver the past two decades, South Africa’s economy has become increasingly geographically concentrated. The nine SACN member cities now account for 58.7% of South Africa’s gross value added (GVA), which is a measure of economic activity at the city or regional level. As Figure 3.3 shows, the nine cities fall into two sub-groups: • Five large cities (Johannesburg, Cape Town, Tshwane, Ekurhuleni and eThekwini) that dominate the
national economy, are home to 35% of South Africa’s people and generally have diversified economies.• Four smaller cities (Nelson Mandela Bay, Mangaung, Buffalo City and Msunduzi) that serve as
regional economic hubs and tend to have a smaller economic base, which is more at risk from volatile global and domestic economic forces.
Figure 3.3: City contributions to South Africa’s total economic output (1995 and 2013)
14%
12%
10%
8%
6%
4%
2%
JHB
11.7%13.9%
CPT
10.3%10.9%
ETH
8.8% 8.7%
TSH
8.9% 9.2%
EKU
8.2%8.8%
NMB
2.4%3.3%
MAN
1.8%
BUFF
1.9% 1.9%1.6%
MSU
1.4%1.5%
Share
of So
uth Af
rica’s
GVA a
t con
stant
2005
price
s
1995 2013
Source: Quantec Research (2015)
5 While the initial period of review is the 20-year period 1994 to 2014, Quantec Research data was only available from 1995 to 2013.
6 The main data source used is Quantec Research’s standardised regional database. Quantec Research (Pty) Ltd is a South African-based consultancy providing economic and financial data and related country analysis. Its economic data covers a broad range of South Africa macroeconomic, industry, trade and regional indicator data. The Quantec Research regional database combines primary source regional data in a standardised form, a long-term demographic model of South Africa and other socioeconomic national and regional benchmark time series. As Stats SA only publishes economic data at the provincial level, the economic data in Quantec Research’s standardised regional database is modelled as an economic time series rather than primary source data. Quantec Research does not publish the detailed methodologies used to estimate its regional economic time series. This has led to certain critiques of the credibility and use of the data. However, in the absence of official municipal level economic time series, economic analysis of city economic performance has to rely on private sector data service providers, such as Quantec Research and IHS Global Insight. Given the limited information available on the private sector data providers modelling techniques, economists differ as to the merits of using Quantec Research versus IHS Global Insight regional economic time series data.

94 S TaT E O f S O U T h a f R I C a n C I T I E S R E P O R T 2016
• The Gauteng City Region is clearly the country’s economic heartland, with Johannesburg, Tshwane and Ekurhuleni accounting for a third (31.9%) of national economic activity (GVA), while Cape Town (10.9%) and eThekwini (8.7%) are significant urban economic drivers.
• The four smaller cities are distant but still important regional hubs, contributing between 1.4% and 2.4% of South Africa’s output.
• Since 1995, four cities have increased their share of South Africa’s GVA: Johannesburg (11.7% to 13.9%), Cape Town (10.3% to 10.9%), Tshwane (8.9% to 9.2%) and Ekurhuleni (8.2% to 8.8%), but the shares of eThekwini and all the smaller metros declined.
• Particularly worrisome for the Eastern Cape region is the lacklustre performance and continued slippage of Nelson Mandela Bay, whose share of South Africa’s total GVA declined from 3.3% in 1995 to 2.4% in 2013.
Figure 3.4 shows city growth in economic activity (GVA) since 1995. The impact of the global and domestic recession from 2008 is very apparent, while lagging business confidence underlies the sinking of growth performance between 2010 and 2013.
Figure 3.4: City growth in GVA (1995 to 2013)
JHB
CPT
ETH
TSH
EKU
NMB
MAN
BUFF
MSU
GVA a
t con
stant
2005
price
s inde
x: 19
95 =
100
220
200
180
160
140
120
100
801995 1996 1997 1998 1999 2000 2001 2002 2003 2004 2005 2006 2007 2008 2009 2010 2011 2012 2013
Source: Quantec Research (2015)
Note: The city and South African GVA time series are indexed to 100 in 1995 (that is set to a base value of 100
in 1995), so that the y-values on the graph show percentage change in GVA or GVA growth since 1995.
3
P R O D U C T I V E C I T I E S 95
• Johannesburg is South Africa’s largest and fastest-growing city economy, and from 2005 has outpaced the other larger cities.
• Between 2010 and 2013, the Gauteng cities led economic growth performance: Johannesburg’s GVA grew by 3.2% a year on average, followed by Tshwane at 2.9% and Ekurhuleni at 2.8%.
• During the same period, Cape Town’s GVA was 2.7% and eThekwini’s 2.5% a year.• Nelson Mandela Bay’s GVA grew by a mere 1.3% a year on average, while Mangaung (2.3%),
Buffalo City (2.3%), and Msunduzi (2.2%) performed slightly better.
These aggregate figures do not show the unequal ways that this growth manifests at a sub-city level as shown in Chapter 1 (“Population is concentrating in city cores and economic nodes”).
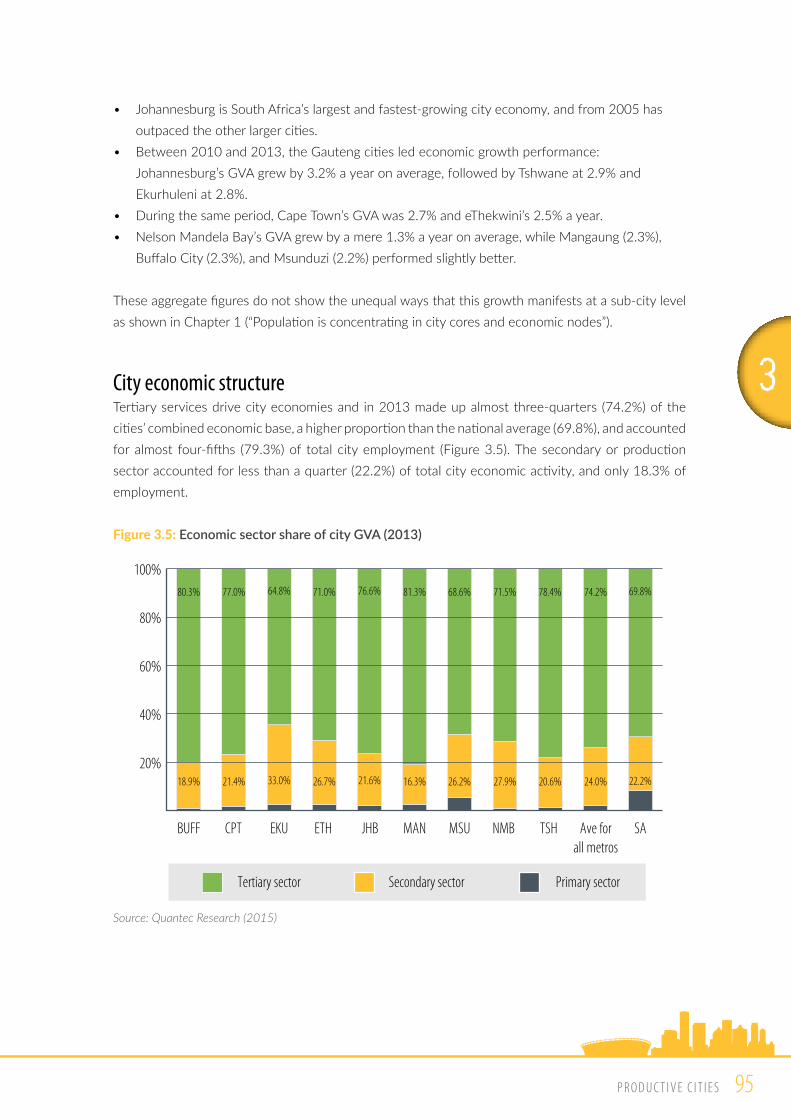
city economic structureTertiary services drive city economies and in 2013 made up almost three-quarters (74.2%) of the cities’ combined economic base, a higher proportion than the national average (69.8%), and accounted for almost four-fifths (79.3%) of total city employment (Figure 3.5). The secondary or production sector accounted for less than a quarter (22.2%) of total city economic activity, and only 18.3% of employment.
Figure 3.5: Economic sector share of city GVA (2013)
JHBCPT ETH TSH Ave forall metros
SAEKU NMBMANBUFF MSU
Primary sectorSecondary sectorTertiary sector
76.6%77.0% 78.4%64.8% 71.0% 71.5%81.3%80.3% 68.6% 74.2% 69.8%
21.6%21.4% 20.6%33.0% 26.7% 27.9%16.3%18.9% 26.2% 24.0% 22.2%
100%
80%
60%
40%
20%
0%
Source: Quantec Research (2015)

96 S TaT E O f S O U T h a f R I C a n C I T I E S R E P O R T 2016
• Over a third of GVA in Johannesburg (33.6%) and Cape Town (35.8%) comes from financial and business services, confirming the cities’ status as the country’s financial and business service hubs.
• In Tshwane, the seat of national government, not surprisingly the largest contribution comes from general government (26.3%), followed by financial and business services (25.7%).
• Home to OR Tambo International Airport, Ekurhuleni’s importance as a transportation and logistics hub in the Gauteng City Region is reflected in the predominance of transport and communication (26.3%) and manufacturing (27.2%).
The argument that manufacturing is important for achieving higher rates of economic growth and job creation assumes that manufacturing (and industry more generally) has much higher output and employment multipliers than tertiary services. It also assumes that a diversified manufacturing base can use a wide spectrum of skill levels and stimulate employment across the economy, by developing upstream and downstream industries (Zalk, 2014). However, the story is more complex, as critical linkages and interdependencies are found between manufacturing and services. Services also have fewer import leakages and potentially higher output and employment multipliers than manufacturing (Lockwood, 2013). Having said that, South Africa’s domestic market and global reach are not large enough to enable services alone to drive economic growth and employment. Therefore, growth in manufacturing is still important and can absorb semi-skilled labour. In contrast, services contribute to the upgrading or “professionalisation” of those who are employed, with strong growth in high-income professional and managerial jobs and middle-income clerical and sales jobs, but weaker growth in middle-income skilled and semi-skilled manual jobs (Crankshaw, 2012).
are south african cities “deindustrialising”?An often-asked question is whether South African cities are “deindustrialising”. Deindustrialisation occurs when employment in manufacturing falls as a share of total employment, which often appears to mirror a decline in manufacturing’s contribution to economic output (Rowthorn and Ramaswamy, 1997). However, the decline (in employment and economic contribution) may be relative, not absolute.
The manufacturing sector’s performance has been lacklustre across all nine cities, with particular evidence of deindustrialisation in Cape Town and eThekwini. Between 2003 and 2013, the secondary sector declined from 25.7% to 24%, while manufacturing declined from 20.9% to 14.6%. Of concern is the relative decline in South Africa’s traditional manufacturing hubs. Yet, although manufacturing’s share of the economic output fell in eThekwini (from 25% to 21.7%), in Ekurhuleni (from 30.4% to 27.2%) and in Nelson Mandela Bay (from 26.1% to 24.2%), manufacturing output has not declined in any of the nine cities.
The employment story is less positive. Both Cape Town and eThekwini experienced absolute losses in secondary and manufacturing sector employment. For the nine cities together, the sector’s contribution to total employment declined from 21.8% in 2003 to 18.4% in 2013, while manufacturing declined from 15.5% to 11.2% of total employment. Over the same 10-year period, manufacturing’s share of employment fell in eThekwini (from 18.4% to 11.6%), Ekurhuleni (from 19.3% to 15.3%) and Nelson Mandela Bay (from 16.9% to 13.1%).

3
P R O D U C T I V E C I T I E S 97
Nevertheless, recent economic foresight reports suggest that manufacturing, in particular high value-added automotive, industrial machinery and equipment, and chemical industries, still holds considerable opportunity for growth and employment, given improvements in innovation and productivity. Further suggested priorities include stepping up exports in construction services (design, construction management and maintenance services) and in financial services (wholesale and retail banking and insurance), particularly to fast-growing sub-Saharan African cities.
PRELIMINARY REFLECTIONS: 2014/15 eThekwini medium and large manufacturing firm surveyDespite having a strong manufacturing base, eThekwini’s manufacturing sector has lost a lot of ground over the past 15 years. Between 2000 and 2013, manufacturing’s contribution to eThekwini’s economic output declined by 5.4%, from 27.1% to 21.7%, and manufacturing’s share of total city employment dropped by 7.1%, from 18.7% to 11.6%.
In 2014 eThekwini undertook a manufacturing survey of large- and medium-sized firms to understand the underlying trends and challenges facing the manufacturing sector. It was a repeat of the World Bank-supported manufacturing survey done in 2002 and carried out in partnership with the provincial Department of Economic Development, Tourism and Environment, the UK Department for International Development and the University of KwaZulu-Natal. The survey found that between 2002 and 2014, iron and steel producers had increased dramatically, but almost all other manufacturing subsectors had declined. Constraints facing manufacturing growth in eThekwini included locational and supply-side, issues such as electricity costs, skill constraints, and poor transport infrastructure (Robbins & Velia, 2015).
Top constraints in Greater Durban Manufacturing Area (2002 study) Top constraints in eThekwini (2014 survey)
Crime and theft (83%) Markets dominated by established firms (86.5%)
Currency volatility (77%) Low rates of economic growth in Sa (86.5%)
hIV/aids (73%) Cost of energy (86%)
Corruption in government (65%) availability of technical/vocational labour skills (80%)
Changes in government policy (62%) Transport infrastructure and quality (80%)
Energy provision and quality (76%)
Source: Robbins and Velia (2015)
98 S TaT E O f S O U T h a f R I C a n C I T I E S R E P O R T 2016
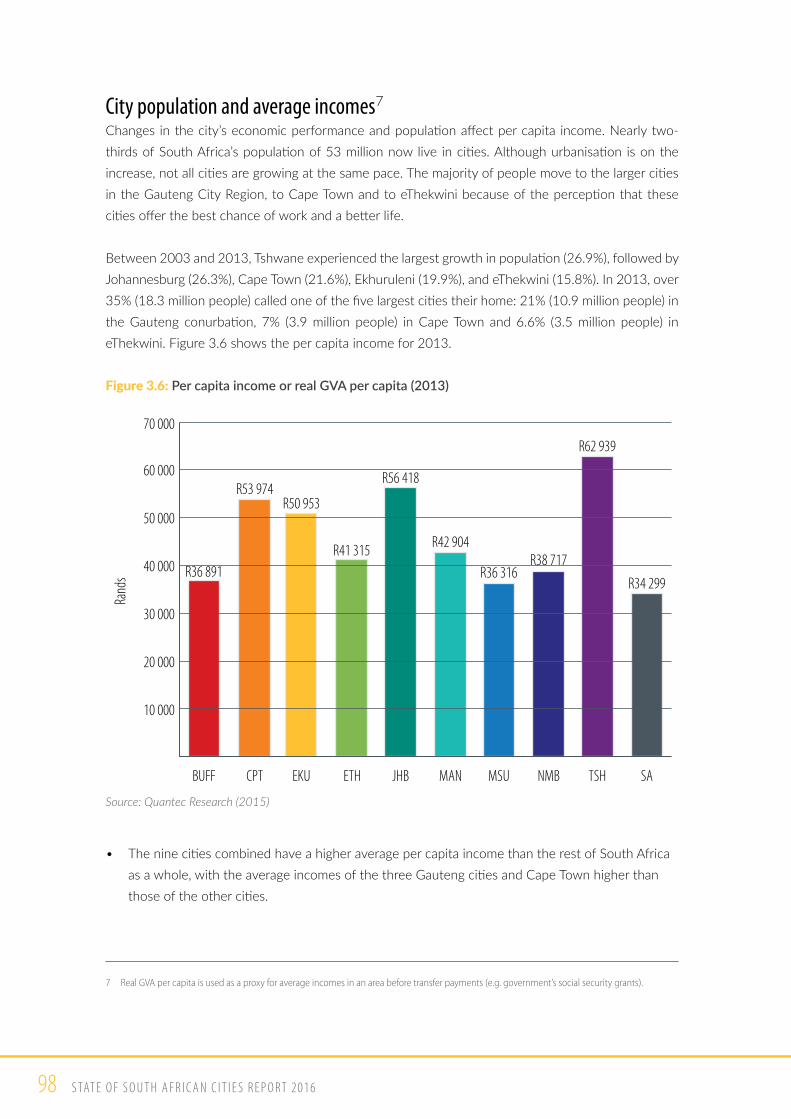
city population and average incomes7
Changes in the city’s economic performance and population affect per capita income. Nearly two-thirds of South Africa’s population of 53 million now live in cities. Although urbanisation is on the increase, not all cities are growing at the same pace. The majority of people move to the larger cities in the Gauteng City Region, to Cape Town and to eThekwini because of the perception that these cities offer the best chance of work and a better life.
Between 2003 and 2013, Tshwane experienced the largest growth in population (26.9%), followed by Johannesburg (26.3%), Cape Town (21.6%), Ekhuruleni (19.9%), and eThekwini (15.8%). In 2013, over 35% (18.3 million people) called one of the five largest cities their home: 21% (10.9 million people) in the Gauteng conurbation, 7% (3.9 million people) in Cape Town and 6.6% (3.5 million people) in eThekwini. Figure 3.6 shows the per capita income for 2013.
Figure 3.6: Per capita income or real GVA per capita (2013)
Rand
s
TSH
R62 939
JHB
R56 418
CPT
R36 891
BUFF
R53 974
EKU
R50 953
MAN
R42 904
ETH
R41 315
NMB
R38 717
MSU
R36 316
SA
R34 299
70 000
60 000
50 000
40 000
30 000
20 000
10 000
Source: Quantec Research (2015)
• The nine cities combined have a higher average per capita income than the rest of South Africa as a whole, with the average incomes of the three Gauteng cities and Cape Town higher than those of the other cities.
7 Real GVA per capita is used as a proxy for average incomes in an area before transfer payments (e.g. government’s social security grants).

3
P R O D U C T I V E C I T I E S 99
• In the last five years, Tshwane’s average annual per capita income (1.3%) grew at almost double the average national rate (0.7%).
• The concentration of public sector employees in Tshwane explains why it was the only city that did not experience a decline in real GVA per capita following the global recession. In the other cities (apart from Nelson Mandela Bay), average per capita incomes only recovered to pre-crisis levels in 2011 and 2012.
• In Nelson Mandela Bay, per capita income declined by an average of 0.4% a year between 2008 and 2013, reflecting weak economic performance.
city employment and unemploymentThe availability of employment in a city is a key measure of its economic success and inclusion. While all cities in South Africa face the challenge of creating jobs for the increasing numbers of work-seekers, the task is particularly acute in the larger cities that attract the majority of economic migrants. These cities have labour force participation rates8 that are much higher than the national average of 59.3%. In 2013, the rate was highest in Johannesburg (75%), followed by Tshwane (73.6%), Cape Town (72.4%) and Ekurhuleni (71.4%). The smaller cities might have lower labour force participation rates – Mangaung (65.7%), Nelson Mandela Bay (62.7%), Buffalo City (61%) – but were above the national average with the exception of Msunduzi (56.3%). Of note is eThekwini, which has a much lower labour force participation rate (59.4%) than most of the other cities, as a result of its steady decline in the period after the 2008 recession.9
The 2008 economic downturn has had a long-lasting effect on the labour market. South Africa’s formal employment participation rate10 declined from 35.5% in 2007 to 34.6% in 2008 and continued to fall, reaching 31.3% by 2013. Despite the relative economic strength of the large cities, their average formal employment participation rate also declined, from 44.1% in 2003 to 42.9% in 2008 and 39% in 2013. These trends are evidence of the acceleration in retrenchments leading up to the recession and sluggish job creation following the recession (von Fintel and Burger, 2010). The impact is also seen in informal employment participation rates.11 At the start of the recession, informal employment participation rates rose in all cities, with the average rate increasing from 12.4% to 15.2% in 2008. It then declined to 13.9% in 2011 but increased to 15.1% in 2013. Among the large cities, eThekwini has the highest informal employment participation rate (15.9%), followed closely by Johannesburg (15.8%) and Tshwane (15.2%); Cape Town trails at only 13.3%. Of interest is Buffalo City’s higher rate of 16.7% and Nelson Mandela Bay’s rate of 15.9%.
8 The labour force participation rate is the percentage of the population of working age (15 to 65 years) who are economically active; that is, they are willing and able to work (Mohr, 1998).
9 This is most likely the result of an increase in discouraged work-seekers, as well as the growth in the non-economically active population, but requires further research, given that such data is not yet available at the metropolitan level.
10 The formal employment participation rate is defined as the percentage of the working age population (15 years to 65 years) who are formally employed.
11 Similarly, the informal participation rate is defined as the percentage of the working age population (15 years to 65 years) who are informally employed.

100 S TaT E O f S O U T h a f R I C a n C I T I E S R E P O R T 2016
Similarly, the average city unemployment12 rate (using the narrow or official definition) fell from a high of 26.8% in 2003 to 20% in 2008, reaching 23.3% in 2013. In 2013, unemployment was highest in Ekurhuleni (27.8%), Nelson Mandela Bay (26.8%), Johannesburg (25.4%) and Cape Town (25%). eThekwini’s lower rate of unemployment (16.1%) is mainly because of its low labour force participation.
The Quarterly Labour Force Survey publishes both the narrow or official rate of unemployment and the expanded rate of unemployment for metropolitan municipalities. Table 3.1 shows these rates for Quarter 2 in 2015.
Table 3.1: Narrow and expanded unemployment rate (Q2 2015)
Unemployment (Q2 2015) Narrow Expanded
%
Mangaung 29.0 36.7
Tshwane 27.4 35.9
Ekhuruleni 29.4 34.4
Johannesburg 26.2 28.7
nelson Mandela Bay 33.2 33.2
Buffalo City 28.8 33.2
eThekwini 16.5 26.3
Cape Town 22.6 23.9
south africa 25.0 34.9
Source: Stats SA (2015)
Among the large cities, the Gauteng cities had the highest rates of expanded unemployment, with Tshwane (35.9%) and Ekurhuleni (34.4%) experiencing similar rates to the national average (34.9%). Of interest is eThekwini’s expanded rate of unemployment (26.3%), which is much higher than its narrow rate of unemployment (16.5%). This most likely reflects the sizable numbers of discouraged work-seekers in the city.
12 Statistics South Africa draws on two definitions of unemployment. The narrow or official definition of unemployment refers to those within the economically active population (i.e. aged 15 to 65 years) who (i) did not work in the seven days before the interview, (ii) want to work and are available to start within two weeks of the interview, and (iii) have taken active steps to find work or to start a form of self-employment in the four weeks before the interview. This definition of employment was formulated by the International Labour Organisation and is generally used in international comparisons of unemployment in more developed economies. In contrast, the expanded definition of unemployment excludes the last requirement – i.e. those who have taken active steps to find work or to start a form of self-employment in the four weeks before the interview. This was because either no jobs were available in the area, or they were unable to find jobs requiring their skills, or they had lost hope of finding any kind of job (Mohr, 1998; Stats SA, 2015).

3
P R O D U C T I V E C I T I E S 101
Figure 3.7 shows the average labour absorption rate for the cities over the period 2003–2013. If the average annual change in total employment (formal and informal) is greater than the average change in working age (15–65 years) population, the cities are absorbing labour and are positioned above the diagonal line, i.e., Tshwane, Johannesburg, Ekurhuleni, Buffalo City and Msunduzi. Cities that are not absorbing their growing working population into either formal or informal employment are positioned below the diagonal line, i.e. Cape Town, Nelson Mandela Bay and eThekwini.
Figure 3.7: Cities labour absorption rate (2003–2013)
JHB
CPT
Average annual % change in working age population: 2003 to 2013
ETH
TSH
EKU
MAN
MSU
Avera
ge an
nual
% ch
ange
in to
tal em
ploym
ent: 2
003 t
o 201
3
NMB
BUFF
4%
4.0%3.5%
3%
3.0%2.5%
2%
2.0%1.5%
1%
1.0%0.5%0%
0%
Source: Quantec Research (2015)
On the employment front, the five largest cities account for almost half (43%) of all employment in South Africa: Johannesburg with 11.3% of all employment, following by eThekwini (8.8%), Cape Town (8.4%), Ekurhuleni (7.1%) and Tshwane (7.9%).
However, not all jobs are the same, as they differ in level of skill and formality, and offer different opportunities and returns. Figure 3.8 illustrates employment across all levels of skill and formality for the five larger cities. Skill intensities are noticeably higher in Cape Town, Johannesburg and Tshwane, where the proportion of highly skilled and skilled formal employment is higher than that of semi-skilled and unskilled employment.

102 S TaT E O f S O U T h a f R I C a n C I T I E S R E P O R T 2016
Figure 3.8: City share of South Africa’s employment by skill and formality (2013)
JHBCPT ETH TSHEKU NMBMANBUFF MSU
Share
of SA
emplo
ymen
t by s
kill/f
ormali
ty in
2013
14%
12%
10%
8%
6%
4%
2%
Highly skilled formal Skilled formal
Semi- & unskilled formal Informal
Source: Quantec Research (2015)
Between 1995 and 2013, informal work increased from 21% to 29% of average city employment, while unskilled formal work declined from 36% to 25% (Figure 3.9). At the same time, the share of highly skilled and skilled formal jobs increased, which points to the main reason for the widening income inequality over the past two decades.
Figure 3.9: City average share of South Africa’s employment by skill and formality (1995 and 2013)1995 2013
Informal21%
Informal29%
Highly skilledformal11%
Skilled formal32%Unskilled formal
36%
Highly skilledformal13%
Skilled formal33%Unskilled formal
25%
Source: Quantec Research (2015)
3
P R O D U C T I V E C I T I E S 103
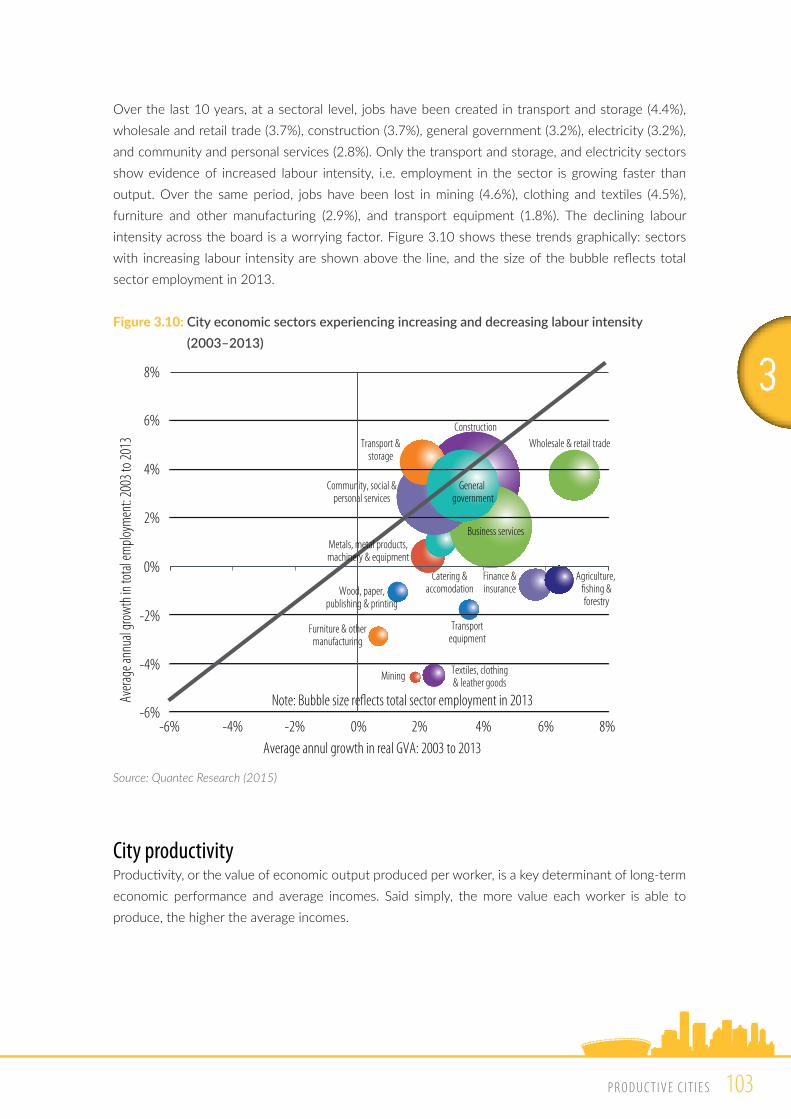
Over the last 10 years, at a sectoral level, jobs have been created in transport and storage (4.4%), wholesale and retail trade (3.7%), construction (3.7%), general government (3.2%), electricity (3.2%), and community and personal services (2.8%). Only the transport and storage, and electricity sectors show evidence of increased labour intensity, i.e. employment in the sector is growing faster than output. Over the same period, jobs have been lost in mining (4.6%), clothing and textiles (4.5%), furniture and other manufacturing (2.9%), and transport equipment (1.8%). The declining labour intensity across the board is a worrying factor. Figure 3.10 shows these trends graphically: sectors with increasing labour intensity are shown above the line, and the size of the bubble reflects total sector employment in 2013.
Figure 3.10: City economic sectors experiencing increasing and decreasing labour intensity (2003–2013)
Avera
ge an
nual
grow
th in
total
emplo
ymen
t: 200
3 to 2
013
ConstructionTransport &
storage
General government
Wholesale & retail trade
Community, social &personal services
Business services
Catering &accomodationWood, paper,
publishing & printing
Furniture & othermanufacturing
Mining Textiles, clothing& leather goods
Note: Bubble size re�ects total sector employment in 2013
Average annul growth in real GVA: 2003 to 2013
Transportequipment
Agriculture, �shing &forestry
Finance &insurance
-6%-6%
-4%
-4%
-2%
-2%
0%
0%
2%
2%
4%
6%
8%
4% 6% 8%
Metals, metal products,machinery & equipment
Source: Quantec Research (2015)
city productivityProductivity, or the value of economic output produced per worker, is a key determinant of long-term economic performance and average incomes. Said simply, the more value each worker is able to produce, the higher the average incomes.

104 S TaT E O f S O U T h a f R I C a n C I T I E S R E P O R T 2016
Figure 3.11: Labour productivity or value of output per worker at constant 2005 prices (2013)
TSHNMBMSU ALLMETROS
MANETHEKU JHBBUFF CPT
Value
of ou
tput
per w
orker
at co
nstan
t 200
5 pric
es in
2013
(R’00
)
140
120
100
80
60
40
20
Source: Quantec Research (2015)
As Figure 3.11 illustrates, Cape Town (R157,221), Ekurhuleni (R147,963) and Johannesburg (R147,140) have higher average productivity than South Africa as a whole. Productivity levels in eThekwini (R117,483) are at a similar level to Mangaung (R117,495) and the other smaller cities.
Key drIvers oF cIty economIc success, resIlIence and InclusIon
Education (human capital), innovation and investment (in infrastructure) are key drivers of city economic and competitive success. They can help to understand city economic dynamism and future prospects.
education at city levelIn an era of expertise where earnings are linked to knowledge and skills, the returns on education, especially secondary and higher education, are growing (Glaeser, 2011). Skills and knowledge capabilities are critical drivers of city economic success and a key aspect of locational advantage (Kruss et al., 2010).

3
P R O D U C T I V E C I T I E S 105
There is a marked correlation between education and economic prosperity, as skilled workers become more productive when they work among other skilled people (Glaeser, 2011). Furthermore, the growing sectors of the economy are knowledge intensive and require skills, which means that in many cases, matric is the minimum educational threshold for access to formal sector employment. The returns on schooling also increase dramatically for people who go on to achieve further or higher education qualifications (CSIR and Economic Rise Consulting, 2008).
Figure 3.12: Changes in the education composition of city populations aged 19+ years (1995 and 2013)
JHBCPT ETH TSHAll Metros EKU NMBMANBUFF MSU
100%
80%
60%
40%
20%
90%
70%
50%
30%
10%
29% 26% 23% 26% 30% 27% 28% 24% 28% 22% 29% 28% 34% 28% 28% 25% 25% 22% 31% 31%
24% 34% 18% 27% 23% 30% 24% 36% 24% 38% 26% 35% 23% 30% 22% 35% 22% 31% 29% 35%
47% 40% 29% 47% 47% 43% 48% 40% 48% 40% 45% 37% 43% 42% 50% 40% 54% 47% 40% 33%
1995
2013
1995
2013
1995
2013
1995
2013
1995
2013
1995
2013
1995
2013
1995
2013
1995
2013
1995
2013
Share
of po
pulat
ion ag
ed 19
and o
lder
Less than MatricMatricMore than Matric
Source: Quantec Research (2015)
As Figure 3.12 shows, between 1995 and 2013 the proportion of population aged 19+ years that achieved Grade 12 or a matriculation certificate increased from less than a quarter (24%) to just over a third (34%). However, despite 17 of South Africa’s 23 higher education institutions being concentrated in the nine cities, the proportion of population with an educational qualification higher than matriculation declined slightly, from 29% in 1995 to 26% in 2013.
Estimating the improvement in secondary schooling is difficult because of changes to the curriculum and criteria for passing matric, but the persistently high drop-out rates in tertiary education and training suggests that this improvement may not provide an adequate foundation for developing workforce skills. While schools in South Africa’s larger cities tend to perform well relative to national trends, the quality of schooling (i.e., the learning and skills provided, particularly numeracy and literacy) is lower compared with international peers in developing and developed countries (Kruss et al., 2010).

106 S TaT E O f S O U T h a f R I C a n C I T I E S R E P O R T 2016
At the higher education level, more graduates are studying business, management, the humanities and education than science and technology, design and engineering, which are the fields with critical skills and capability gaps. The high student attrition and low graduation rates also raise concerns that higher education outputs are not able to support city and national economic development and inclusive growth targets. City governments have already been involved in addressing the quality and performance at tertiary education institutions, and further collaboration between firms and higher education institutions is needed to ensure the appropriate supply of graduates in disciplines that are in high demand from firms. Such collaboration would also enable scientific excellence in universities to match the technological needs of firms, enhance firm-level competitiveness and contribute to greater city economic success and inclusion (Kruss et al., 2010).
Innovation at city levelThroughout history, cities have been the gateway to ideas and innovation. Dense urban spaces encourage greater interactions and conversations that lead to innovation. Innovation is a key determinant of economic competitiveness and resilience, enabling cities to adapt to economic developments and changes in technology and global demand (Lorentzen, 2010). Innovative activities include knowledge inputs or research and development (R&D), which is commonly measured by investment in R&D and R&D spending per capita, knowledge outputs (publications and patents) and the use of new knowledge (patents absorbed through licencing).
In 2012/13, South Africa’s R&D investment increased to R23.9-billion, a real increase of 2.6% since 2011/12. This maintains the country’s R&D spending at 0.76% of gross domestic product (GDP), which is still below the global average of 1.8% and the OECD average of 2.4% (CESTII, 2014). In 2012 the main contributors to R&D investment at sectoral level were government (45.4%) and business (38.3%). Just under half of total government funding for R&D went to higher education, and 43% went to government institutions, including science councils. Two-thirds of business R&D is in the financial and business services (35%) and the manufacturing (31%) sectors (CESTII, 2014).
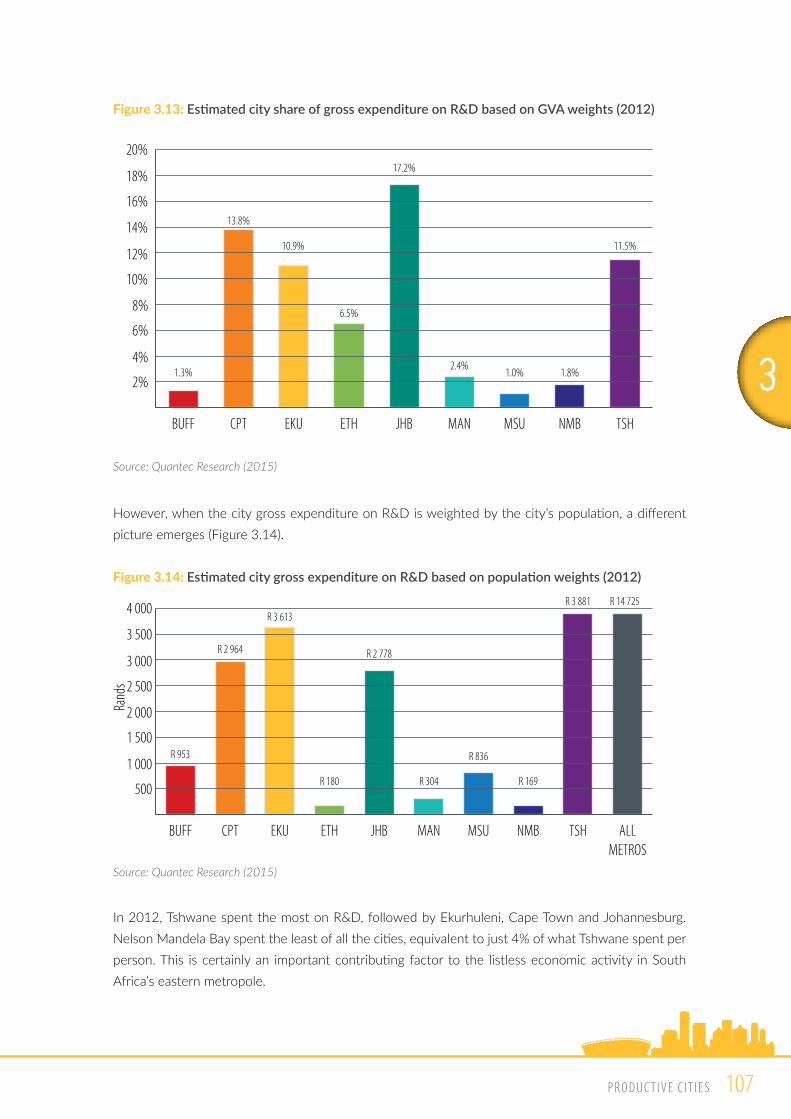
At the city level, the three Gauteng cities and Cape Town spent more on R&D, based on GVA weights (Figure 3.13) than the other cities. These cities also produced the majority of scientific excellence in the country (as measured by science and engineering articles per million of population) and registered the highest number of domestic and international patents (Lorentzen et al., 2009).
3
P R O D U C T I V E C I T I E S 107
Figure 3.13: Estimated city share of gross expenditure on R&D based on GVA weights (2012)
CPT
13.8%
BUFF
1.3%
MAN
2.4%
MSU
1.0%
TSH
11.5%
1.8%
NMBJHB
17.2%
ETH
6.5%
18%
20%
12%
14%
16%
10%
8%
6%
2%
4%
EKU
10.9%
Source: Quantec Research (2015)
However, when the city gross expenditure on R&D is weighted by the city’s population, a different picture emerges (Figure 3.14).
Figure 3.14: Estimated city gross expenditure on R&D based on population weights (2012)
JHB
R 2 778
CPT
R 2 964
BUFF
R 953
MAN
R 304
MSU
R 836
ETH
R 180
EKU
R 3 613
TSH
R 3 881
R 169
NMB
R 14 725
ALLMETROS
3 000
3 500
4 000
2 500
2 000
1 500
500
1 000
Rand
s
Source: Quantec Research (2015)
In 2012, Tshwane spent the most on R&D, followed by Ekurhuleni, Cape Town and Johannesburg. Nelson Mandela Bay spent the least of all the cities, equivalent to just 4% of what Tshwane spent per person. This is certainly an important contributing factor to the listless economic activity in South Africa’s eastern metropole.

108 S TaT E O f S O U T h a f R I C a n C I T I E S R E P O R T 2016
Infrastructure investment at city levelInvesting in social and economic infrastructure helps drive economic development. Within the context of rapid urbanisation, investing in good quality roads, public transport, freight logistics, energy supply, water and sanitation services, and electronic connectivity (mobile telephony and broadband) reduces the costs of doing business for firms and makes it easier for people to access jobs and economic opportunities. Similarly, access to good quality health and education services, and urban amenities underpin the social fabric and institutions that enhance city inclusion and resilience.
Gross fixed-capital formation (GFCF) is the broadest measure of investment used by economists. It spans private and public physical investment and includes land improvements (fence, ditches, drains, etc.); plant, machinery and equipment purchases; and the construction of roads, railways, schools, offices, hospital, private residential dwellings, and commercial and industrial buildings (World Bank, 2015a).
According to the National Development Plan (NDP), South Africa will need to ramp its investment rate to about 30% of GDP by 2030. The private sector spends the most on capital investment and so drives higher GCFC growth rates, but the public sector will also need to contribute fixed investment equivalent to around 10% of GDP on a sustained basis, primarily through the roll-out of its infrastructure programme (NPC, 2011; Investec, 2014).
In its latest Medium Term Expenditure Framework, government budgeted R813-billion for infrastructure, primarily transport, energy and water (National Treasury, 2015). At 7% of GDP, the budgeted public sector investment programme still falls short of the NDP target, while South Africa’s overall fixed investment growth rate of 20% is well under the NDP target of 30% and international benchmark rates of 25% of GDP or above, needed to underpin sustained economic growth and development levels (Investec, 2014).
At city level, GFCF as a percentage of GVA may have increased since 2003 but remains considerably below the international benchmarks (Figure 3.15). In Ekurhuleni and eThekwini, GFCF was 23% of GVA, reflecting the greater manufacturing activity in these regions. The investment rates in the other large cities are well below the levels needed to accelerate economic activity: Johannesburg (20%), Tshwane (21%) and Cape Town (20%).

3
P R O D U C T I V E C I T I E S 109
Figure 3.15: City gross fixed-capital formation (GFCF) as a percentage of GVA (2003 and 2013)
JHB
16%
20%
CPT
16%
20%
ETH
17%
23%
TSH
16%
21%
EKU
17%
23%
NMB
21%
16%
MAN
22%
16%
BUFF
20%
16%
SA
17%
23%
ALLMETROS
16%
20%
25%
20%
15%
10%
5%
2003 2013
MSU
17%
24%24%
Source: Quantec Research (2015)
These investment rates may reflect declining business confidence, which has yet to recover to pre-2008 levels. The deteriorating business confidence across the economy, particularly in the construction and manufacturing sectors, has negative implications for investment, employment and economic growth. The rates also reflect the much lower public sector capital expenditure levels than the 10% of GDP required for the NDP targets, with capital expenditure in 2013 varying between 1.1% (Ekurhuleni) and 2.4% (eThekwini) of GVA. Nevertheless, as Figure 3.16 shows, real GFCF grew faster than the national average in Johannesburg (7.1%), Tshwane (6.9%), Msunduzi (7.2%) and Mangaung (7.1%). Unsurprisingly Buffalo City (5.0%) and Nelson Mandela Bay (3.1%) grew at well below the national average.
Figure 3.16: Annual growth in city real GFCF (2003–2013)
EKU
6.8%
CPT
6.3%
NMB
3.1%
BUFF
5%
MAN
7.1%
MSU
7.2%
ETH
6.6%
JHB
7.1%
TSH
6.9%
SA
6.8%
ALLMETROS
6.6%
6%
7%
8%
5%
4%
3%
1%
2%
Source: Quantec Research (2015)
110 S TaT E O f S O U T h a f R I C a n C I T I E S R E P O R T 2016
Implications for city economic successCities have higher levels of output, employment, income and productivity, and have the potential to lead South Africa’s economic recovery through greater innovation, human capital and investment. The country’s economy is mainly driven by the five larger cities, with the economies of the three Gauteng cities and Cape Town slightly stronger than eThekwini, although the economies of smaller four cities serve as important regional economic hubs. As such, the weak and deteriorating performance of Nelson Mandela Bay is of key concern to economic growth and employment prospects in the Eastern Cape region in particular.
The structure of South Africa’s city economies is overwhelmingly dominated by tertiary services, with the secondary or productive sector contributing less than a quarter of total city economic activity and less than a fifth of employment. In the context of a weak employment environment, South Africa requires growth in both services and manufacturing to stimulate broad-based growth and job creation across the skills spectrum.
The large cities in particular have much higher labour force participation rates than the national average. However, although cities provide the most jobs, the 2008 economic downturn has had a severe effect on the urban labour market. Job losses during the recession and slow job creation in the recovery period that followed reduced formal employment rates, raised informal employment rates and contributed to higher levels of unemployment, particularly in the larger cities. These trends are particularly worrisome for exacerbating urban inequality and chronic social stresses, and reducing city inclusivity and resilience. The hardship of those who lose jobs and those who cannot find jobs will be felt by everyone in South Africa, including business and the wealthy.
Therefore, much more needs to be done to make city economies more competitive and productive, and capable of providing work and economic opportunities. The best way to enhance inclusion and resilience is to expand people’s abilities to participate in the formal or informal economy. This means higher levels of investment and concerted efforts to improve the quality of education and training in order to stimulate productivity, innovation, entrepreneurship and self-employment. The business environment can be improved by increasing investment in city economic infrastructure (public transport, roads, freight logistics, energy supply and electronic connectivity) and ensuring greater accessibility to safe drinking water and sanitation services. These investments raise urban economic activity and enhance the long-term economic growth and development potential of cities.
settIng cItIes uP to lead economIc develoPment
Cities are key stakeholders in South Africa’s economy and critical to the country’s future economic prospects (van Huyssteen et al., 2013). The Integrated Urban Development Framework (IUDF) recognises the significance of city economies and states that economic development should be at the core of city agendas (COGTA, 2014). This would be a practical expression of local government’s economic

3
P R O D U C T I V E C I T I E S 111
development role set out in the 1998 White Paper on Local Government and legislated in the Local Government Municipal Systems Act (No. 32 of 2000). What this means in practice is that city mayors will have to take personal responsibility for their city’s high-level transversal (i.e. across sectors) economic growth and development strategy. Like the delivery agreements for the 12 Outcomes adopted at national level, city economic objectives, outputs, targets and indicators would then cascade downwards through the objectives and performance reporting of all city line departments.
Clear, bold city economic strategies will open up the debate on what role cities should play in the economy. Without an explicit constitutional mandate, local economic development has been viewed as an unfunded mandate and not a core responsibility of local government.13 City economic strategies should consider all relevant levers across the entire economic system because economic development is more than just getting the spatial transformation elements right. City spatial form, human settlement and public transport interventions are important levers for productive cities, but need to work together with other economic development levers that cut across the broader public sector responsibilities, and private sector and other stakeholder contributions.
BUSINESS REGULATORY REFORM: Doing Business in South Africa 2015 In 2014, the National Treasury’s City Support Programme (CSP) partnered with the Department of Trade and Industry (the dti), and the Swiss State Secretariat for Economic Affairs (SECO) to commission the World Bank’s International Finance Corporation to undertake a sub-national Doing Business report covering nine of South Africa’s largest cities (the eight metros and Msunduzi), using the approach and methodology of the World Bank’s Doing Business Report. This flagship report assessed the business climate in the largest cities in 189 countries, based on surveys that generated 11 indicators relevant to the lifecycle of a small- to medium-sized formal domestic business. To date Johannesburg has been the sample city for South Africa.
Doing Business South Africa 2015 benchmarks the nine cities (Buffalo City, Cape Town, Ekurhuleni, eThekwini, Johannesburg, Mangaung, Msunduzi, Nelson Mandela Bay and Tshwane) and four maritime ports (Cape Town, Durban, Ngqura and Port Elizabeth) across six indicators: starting a business, dealing with construction permits, getting electricity, registering property, enforcing contracts and trading across borders.
The report finds that no city outperforms the others in all areas benchmarked: Ekurhuleni, Johannesburg and Tshwane lead in starting a business, Cape Town in dealing with construction permits, Mangaung in getting electricity and enforcing contracts, and Johannesburg in registering property. This implies that city governments could significantly improve their local and national business climate by replicating good practices already being used successfully in other cities in South Africa (World Bank, 2015b).
13 Nationally raised revenues are allocated to national, provincial and local government in terms of their constitutional mandates. While section 52(1)(c) of the Constitution confirms that social and economic development is a local government objective, schedules 4 and 5 do not explicitly include economic development as a core local government function that should benefit from nationally raised revenue.

112 S TaT E O f S O U T h a f R I C a n C I T I E S R E P O R T 2016
Table 3.2: Doing Business in South Africa: Where is it easier?
MunicipalityMunicipal seat
Starting a businessDealing with
construction permitsGetting electricity Registering property Enforcing contracts
ranking (1–9)
dtF score (100 = best result)
ranking (1–9)
dtF score (100 = best result)
ranking (1–9)
dtF score (100 = best result)
ranking (1–9)
dtF score (100 = best result)
ranking (1–9)
dtF score (100 = best result)
Buffalo CityEast London
4 78.67 3 77.50 4 75.32 4 62.84 9 62.54
Cape TownCape Town
4 78.67 1 78.08 2 81.81 8 59.23 6 67.53
EkurhuleniGermiston
1 81.18 4 76.84 5 71.83 3 64.23 4 68.26
eThekwiniDurban
4 78.67 5 76.15 3 75.73 6 62.05 3 69.27
JohannesburgJohannesburg
1 81.18 8 68.52 8 55.74 1 65.82 8 66.14
MangaungBloemfontein
4 78.67 9 68.22 1 83.86 9 58.41 1 71.04
MsunduziPietermaritzburg
4 78.67 6 74.07 7 63.00 7 59.49 2 70.81
Nelson Mandela BayPort Elizabeth
4 78.67 2 78.05 9 53.14 5 62.69 7 66.89
TshwanePretoria
1 81.18 7 69.88 6 68.51 2 64.71 5 68.17
economic development leversTable 3.3 attempts to categorise the economic development levers across national, provincial and city government competences, and extend them to the private sector and civil society. As mentioned above, cities can use various spatial and non-spatial levers to shape their economy. Examples include investing in infrastructure, strengthening land-use management instruments, and using zoning schemes or regulations related to the ease of doing business in a city (e.g. awarding business licences and informal trading permits, construction permits and registering property). Cities are also able to assist in developing business capabilities through private sector, cluster development and talent management programmes, as well as targeted support to small and even informal businesses (Turok et al., 2011; World Bank, 2015a).

3
P R O D U C T I V E C I T I E S 113
Table 3.3: Key economic development levers across broad public sector and private sector competences
Institutions & Regulations Infrastructure Skills & Innovation Finance & Enterprise Development Support
natio
nal g
over
nmen
t & st
ate-
owne
d ent
epris
es • Macroeconomic management (nT, SaRB)• Industrial & trade policy (DTI)• Investment policy & incentives (nT, DTI, DST)• Industrial specific taxes & regulations (nT,
DTI, DMR) • Industrial Development Zones & Special
Economic Zones (DTI)• Company & intellectual property
registration (CIPC)• Labour regulations (DoL, UIf,
Compensation fund)• Property rights & deeds management
(DRDLR, Deeds Registry)
• Electricity generation & national grid (Eskom)
• national highways (SanRaL)• Railways (Transnet & PRaSa)• Maritime ports (Transnet)• airports (aCSa)• Telecoms (Telkom)• human settlement (housing)
policy & grant funding• PPP Laws (nT)• Sector-specific infrastructure
upgrades (DRDLR)
• higher education & further education & training (fET) (DhET, SETas)
• Immigration policies (to attract talent) (Dha)
• R&D tax incentives, funding & support schemes (nT, DST)
• Worker training programmes (DhET, DTI)
• Public work programme policy management & funding (EPWP, CWP) (DPW, COGTa)
• national tax revenues (nT, SaRS)
• fiscal management (nT)• access to finance support
schemes (DTI, EDD, IDT, SEfa)
• Export & trade assistance (DTI)
Prov
incia
l gov
ernm
ent
• Provincial & regional spatial development frameworks
• Provincial roads• Schools• Secondary hospitals &
clinics• human settlement
(housing) grant coordination
• Regional economic branding• Regional economic
partnerships• Regional investment & trade
promotion• Talent attraction programmes• Cluster development support• Knowledge hubs• Linking firms with academia
• Gambling taxes• Motor vehicle licenses• Provincial development
finance institutions (e.g.• Small business support
services• Incubator hubs
city g
over
nmen
t
• City & local level spatial development frameworks
• City land use management (zoning) schemes
• City densification policies & by laws• Construction permits• Business licenses• Informal trading permits
• Public transport (bus rapid transit systems) (BRTs)
• City roads• Water• Sanitation• Electricity distribution• Solid waste management• Street lighting
• Talent attraction programmes• Cluster development support• Knowledge hubs• Linking firms with academia• Public work programme
implementation (EPWP, CWP)
• Municipal property rates• Utility (electricity, water,
sanitation & solid waste) surcharges
• City loans & bonds• Economic intelligence at
city-level & area/nodal level
Priva
te se
ctor
• Lobbying for industry-specific policy changes
• Lobbying for business climate improvements
• Lobbying government for infrastructure improvement
• Bidding for implementing infrastructure projects
• Raising capital
• Talent recruitment• Training programmes• R&D (leveraging national
support)
• Leveraging national support schemes
• Market intelligence & business information
• Lobbying for access to capital & export assistance
• Equity & debt
civil s
ociet
y
• Regional development partnerships • Public work programme implementation (CWP)
• Skills Development & training programmes
• Linking informal economy sector associations to city & other levels of government
• Mentoring small business & informal trader support
Source: Adapted from World Bank (2015a)

114 S TaT E O f S O U T h a f R I C a n C I T I E S R E P O R T 2016
For cities to take the lead in economic development, they need to engage with other spheres of government and stakeholders that invest in the city space, create regional development coalitions and partner with the private sector. City spatial investments must be aligned with provincial or regional spatial development strategies, environmental impact assessments, provincial roads and transport management. Cities also need to work closely with national government and broader public sector partners, as the hard economic investment and real money lies at this level. State-owned companies, such as Eskom, Transnet, the South African National Roads Agency Limited (SANRAL), the Passenger Rail Agency of South Africa (PRASA) and the Airports Company South Africa (ACSA), invest significant amounts of money in critical economic infrastructure that has a dramatic impact on city economic performance. Equally, national housing and other urban development grants enable cities to undertake crucial built environment investments at scale. National government extends its influence further in granting sizeable economic incentives, such as special economic zones (SEZs), the Automotive Production Development Programme (APDP), and the Manufacturing Competitiveness Enhancement Programme (MCEP). Although targeted at private sector investors, these incentives contribute to shaping city economic opportunities and strengthening local economic performance.
city capacity and skillsCities have to strengthen their capacity to take on this broader approach to economic development. They need to deepen their skillset to analyse economic development trends and develop effective strategies, to engage with stakeholders across public and private sectors, to identify key industries and work collaboratively to improve the business environment, and to address the needs of local firms in priority sectors and geographic areas across city space (World Bank, 2015a).
To date, four of the largest cities – Johannesburg, Tshwane, eThekwini and Cape Town – have taken considerable steps to strengthen economic capacity and to take a strengthened lead in city economic development.• The City of Johannesburg has appointed a chief economist within its economic development
department and released The Economic Development Strategy for the City of Johannesburg 2015, although the underlying economic data used is not yet widely published.
• The City of Tshwane has published its long-term Vision 205514 and finalised the city’s inclusive growth strategy and accompanying implementation plan, led by the chief economist and her economic intelligence division in the Mayor’s office. The City of Tshwane also released its Annual Economic Landscape Report 2015.
14 See http://www.tshwane2055.gov.za/home/tshwane-2055-info/tshwane-vision-2055
3
P R O D U C T I V E C I T I E S 115
• eThekwini has an active economic development and investment promotion unit that produced the city’s 2013 Economic Development & Job Creation Strategy: Durban @ Work (EMM, 2013). The team also produces EDGE (economic development and growth in eThekwini) quarterly bulletin and research papers that inform the city’s key policy and technical planning forums. While eThekwini does not have a chief economist, the city planning commission is an advisory body appointed by Council to steer the city’s long-term vision and strategic plan, and is busy finalising eThekwini’s economic strategy for publication in early 2016.
• The City of Cape Town, in contrast, has taken an interesting move to create a separate trade and investment department within the Mayor’s office that is responsible for economic strategy and research, while the city’s economic development department retains responsibility for business regulation and area-based development. Cape Town’s Economic Growth Strategy 2013 is a key element of the City’s five-year integrated development plan, and is based on a robust economic evidence base, the Economic Performance Indicators for Cape Town (EPIC), published on a quarterly basis.
For the smaller cities, their IDPs suggest a more limited interpretation of local economic development, focused on facilitation activities in prioritised economic sectors, such as automotive or tourism, small business and informal trading, skills development and urban regeneration. Although the smaller cities do not need to develop the scale of economic intelligence capacity required by the larger cities, they do need to take their economies more seriously. Every city, whether large or small, has a story to tell about their economy – the large corporates, small firms, entrepreneurs and informal traders that do business there; and the people – rich and poor, old and young, skilled and unskilled, employed or unemployed who live there. The role of towns and cities in their regional contexts is also crucial for unlocking development and delivering services efficiently (SACN, 2014b).
Successful, inclusive and resilient cities know their stories, understand their challenges, and devise and implement credible strategies that improve economic development prospects going forward.
cities spatial form and inclusive economic developmentAs South Africa continues to urbanise, the growing population (in particular in the large cities) places exceptional pressures on local government to deliver on increased demands for basic services, notably water, sanitation and electricity, as well as jobs and economic opportunities that would enable greater inclusion in city life (Turok, 2012; Turok and Borel-Saladin, 2014). Figure 3.17 shows that over the past 10 years, the population has increased by 2.4% in Johannesburg and Tshwane, followed by Cape Town (2.0%), Ekurhuleni (1.8%) and eThekwini (1.5%).

116 S TaT E O f S O U T h a f R I C a n C I T I E S R E P O R T 2016
Figure 3.17: Annual growth in city population (2003–2013)
CPT
2.0%
NMB
0.6%
BUFF
0.6%
MAN
1.0%
MSU
1.5%
ETH
1.5%
EKU
1.8%
JHB
2.4%
TSH
2.4%
SA
1.3%
ALLMETROS
1.8%
2.5%
2.0%
1.5%
0.5%
1.0%
Source: Quantec (2015)
This strong population growth in large cities could surpass their capacity to deliver on critical basic services, particularly water, sanitation and electricity, without which poor people become trapped in a vicious poverty cycle. Previously underserved township areas and largely unserved burgeoning informal settlements are particularly vulnerable, given their high population densities and levels of poverty and deprivation (Turok and Borel-Saladin, 2014).
Therefore, it is encouraging that thus far city performance on delivering water, sanitation and electricity services has tended to outstrip population growth, rather than the other way round (see Chapter 4). The delivery of basic services to a greater proportion of the growing city population points to increasing inclusivity and sustainability (Turok and Borel-Saladin, 2014). That said, it is important to examine inclusivity in terms of economic development within townships and dynamics in the informal economy.
township economic developmentHome to about 18 million people, townships and informal settlements are the fastest growing settlement areas in South Africa’s larger cities. During apartheid, townships were dormitory towns providing cheap, unskilled labour pools for mining and other industries, with limited social services and economic infrastructure. “Township” is also used to describe housing settlements developed through the government’s Reconstruction and Development Programme (RDP). These settlements are often poorly located on the periphery of cities and far away from economic activity and other opportunities.

3
P R O D U C T I V E C I T I E S 117
Both types of township are low-income neighbourhoods that have become poverty and unemployment traps for large numbers of poor people. While townships are not homogenous, they all lack a critical threshold of urban amenities and economic infrastructure necessary for developing cohesive communities and vibrant local economies. As a result, they continue to operate as dormitory towns, and those fortunate to secure work have to spend significant time and money on commuting daily from home to work and back home again. The only other option for people in these townships is to undertake small-scale and often marginal economic activities within their local neighbourhoods (Mahajan, 2014; McGaffin et al., 2015; GCRO, 2015).
Much effort has been spent on developing township economies, but most interventions have had limited success because these economies are not well understood. It is all about locational value. Firms and business invest and operate in areas that offer locational attributes and advantages that support competitiveness. Smaller scale markets and low incomes in townships limit the extent to which retailers are able to grow and attract investment (McGaffin et al., 2015; Urban LandMark, 2011). There are exceptions, such as Jabulani Mall in Soweto, which operate on a large enough scale to attract further investment within an emerging economic precinct. However, for the most part, townships do not possess the necessary locational attributes for the range of business activities that form the base of vibrant economic centres. They lack infrastructure, access to suppliers, and transportation and distribution networks, and are far from large, middle- to high-income consumer markets. Firms are also deterred from investing in township areas by the low skills levels, limited urban amenities and general crime and grime concerns.
As a result, local economic activity tends to be limited in scale and depth, without significant potential for growth and job creation. This means that townships must be better connected to and integrated with the main economic centres within the city, so that people living in townships can access jobs and economic opportunities beyond their local neighbourhoods (McGaffin et al., 2015). In addition, substantial public investment in community health and education facilities has the potential to create anchor tenants in medical and education precincts, attracting emerging businesses to service the requirements of these tenants. Public utility service depots and training facilities could also catalyse economic precinct development in townships.
118 S TaT E O f S O U T h a f R I C a n C I T I E S R E P O R T 2016
DIEPSLOOTDiepsloot is one of Johannesburg’s newest settlements, close to the border of the City of Tshwane. A dense, low-income neighbourhood, Diepsloot was originally established in 1995 as a transit camp for people who had been removed from the nearby areas of Alexandra, Honeydew and Zevenfontein. Today, Diepsloot has grown into a vibrant neighbourhood that is home to about 200 000 people, with new arrivals swelling its ranks daily. Diepsloot is uniquely located close to the wealthy suburbs of Dainfern and Chartwell and the booming commercial centres of Sandton, Fourways and Midrand on the Johannesburg-Midrand-Tshwane corridor, yet it remains isolated and unconnected to the regional economy.
A magnet for job seekers, Diepsloot’s population is young and poorly educated: the average age is 25 years, only 25% have completed secondary school, while a mere 6% hold any post-schooling qualification. Low education levels, limited skills and prior experience, and the lack of access to affordable public transport present formidable barriers to finding work. For most residents, Diepsloot’s spatial dislocation and high minibus transport costs make the costs of job searches unaffordable, creating a poverty trap despite its proximity to economic hubs. Those lucky enough to find work spend up to 40% of their earnings on transport to work and back (Mahajan, 2014).
Retail spaza shops and personal services (such as hair salons and childcare) are the main form of local business activity and operate in the local neighbourhood where customers are family members and nearby residents. Businesses not embedded in the residential community operate at key strategic locations. These include the Diepsloot Mall, which is anchored by Shoprite supermarket and includes other retail tenants such as Pep, Ackermans, Edgars, Liquor City, Standard Bank, Capitec and KFC (Future Growth, 2015), and the area close to the taxi rank. The taxi rank is Diepsloot’s main transport hub and attracts enterprises ranging from suppliers of construction materials and prefabricated shack-type structures, to car wash and repairs, used-furniture dealers, restaurants and street cafés, clothing and cell phone dealers. Residential retail activity is also increasing in response to the rising demand for accommodation and limited housing stock in the area.
A survey of over 2000 local businesses found that the main constraints to doing business in Diepsloot are crime and grime issues, lack of access to Eskom’s power grid and to formal finance, the shortage of space and serviced business sites, and high transport costs. Despite these constraints, Diepsloot has a growing number of “active entrepreneurs” involved in processing or in construction, welding and furniture making. These businesses hold the seeds of a more dynamic local economy, which depends on nurturing supply-chain links between local businesses and larger formal businesses, increasing local demand (as local incomes rise), and improving urban management in order to reduce crime and grime and other commercial risks for external investors (Mahajan, 2014).
3
P R O D U C T I V E C I T I E S 119
Informal economy and self-employmentSouth Africa is unique in having a relatively small informal economy despite its high unemployment. The informal economy contributes only about 7–10% to South Africa’s GDP but forms an important part of city economies, particularly within townships and low-income neighbourhoods (Wills, 2009; Altman, 2008). The evidence points to increasing informalisation of employment across all cities (increasing from 21% in 1995 to 29% in 2013), but little is known of the interaction between the mainstream economy and informal entrepreneurs, whether they are taxi operators, spaza shop and shebeen owners, shisa nyama street-side braaiers or hawkers. A survey of employers and the self-employed (Stats SA, 2014) suggests that the majority of South Africa’s informal businesses are survivalist rather than entrepreneurial in nature.
South Africa has an alarmingly low rate of entrepreneurial activity in both the informal and formal sectors, and, between 2013 and 2014, overall entrepreneurial activity decreased from a low 10.6% to a mere 7%. More businesses are closing than starting up, with the lack of finance and poor profitability cited as the main reasons for closure (Herrington et al., 2015). Reasons for the low level of self-employed include a lack of skills and entrepreneurship, access to finance, and ease of entry or regulatory barriers to doing business. However structural inequality also limits economic opportunities for poor people living in spatially marginalised areas. Small businesses in these areas find it difficult to compete on price, quality and brand recognition with mass-produced consumer goods valued by aspirant consumers. The answer seems to lie in finding good market opportunities in formal value chains, which are not easy to access for new entrepreneurs. And the barriers to entry are high, as these opportunities require skills, business acumen and access to finance – all the basics that poor and often first-time, would-be entrepreneurs do not have (Philip, 2010).
The informal economy is recognised worldwide as a growing and permanent feature of rapid urbanisation. Thus, cities should view it as a vibrant and dynamic part of their economic base rather than a temporary aberration. Cities need to accept informality as a way of doing business in order to strengthen inclusivity. They need to establish an evidence base, i.e. size, nature and spatial location of informal economic activity and linkages with the mainstream economy, to inform city interventions. Cities also need to understand how informal entrepreneurs and traders use city spaces and infrastructure to create economic opportunities and advantages. Cities can strengthen urban inclusivity and enhance economic participation through informal economy strategies and street trading policies. These include redrafting city by-laws to accommodate rather than criminalise informal activity, reviewing the informal trading permitting system, providing basic amenities and work infrastructure, and improving council and trader relations. (Mkhize et al., 2013).

120 S TaT E O f S O U T h a f R I C a n C I T I E S R E P O R T 2016
INFORMAL SECTOR: enterprises and employment in GautengInformal entrepreneurship includes wholesale and retail trading, provision of services, and manufacturing and making of goods. The 2013 Gauteng City Region Observatory (GCRO) Quality of Life III survey showed the importance of the informal sector to entrepreneurial activity in the Gauteng area. Of the 27 494 respondents, 11% owned their own business, and of these, 65% operated in the informal sector. Informal businesses are concentrated in township economies, such as Soweto, Sebokeng, Mamelodi and Soshanguve.
The majority (38%) of informal business owners sold food (fresh, cooked or groceries), followed by those providing other services (14%), such as plumbing, building, electrical and security services. A further 12% sold clothes, accessories and cosmetics, while only 4% made or manufactured goods. Selling food appears to be an “entry-level” business in the informal sector, as it represents over 36% of start-up businesses less than one-year old. More mature businesses in the informal sector were found in the services sector.
The survey confirmed strong linkages between the informal and formal sectors, with almost three-quarters of informal entrepreneurs sourcing supplies from wholesalers and retailers, as well as directly from nearby factories. However, only 6% of entrepreneurs had ever approached a government agency for support, suggesting a definite need to redesign business support for the informal sector.
Over 65% of the respondents worked full-time or part-time in the formal sector, while 22% worked full-time or part-time in the informal sector. Almost half (43%) of those who worked in the informal sector worked in private households, followed by personal services (10%), construction (9%) and retail (7%). Informal sector employees were found to be more vulnerable than those employed in the formal sector, as more than half did not have written contracts. The survey also showed that informal employees are more likely to lack leave provisions, receive lower salaries and work much longer hours than their formal counterparts. The data gained on informal sector employment is critical for developing policy and regulations to protect informal sector employees and improve their working conditions (Peberdy, 2015).
redefining work: Public employment programmes In developing countries, informal sector strategies tend to assume that the informal economy has the potential to create work at scale and to shift towards formalisation of work over time. However, South Africa faces significant structural constraints to creating employment through informal economic activity and self-employment. The high levels of unemployment and economic dependency are immensely disempowering and contribute to economic exclusion and social disengagement, resulting in heightened social tension and resource contestation. Strategies that focus on addressing structural inequality take time, and so complementary interventions that enable large numbers of working-age poor people to participate in the economy are critical. This is where public employment programmes can play a role, providing a safety net for the poor.

3
P R O D U C T I V E C I T I E S 121
South Africa’s Expanded Public Works Programme (EPWP) focuses on expanding labour-intensive ways of delivering government services in infrastructure, environmental and social programmes through work opportunities. These temporary work opportunities combine work experience with training and skills to assist participants’ ability to work or engage in entrepreneurial activities once they leave the programme. The EPWP design assumes that participants will use the EPWP as a stepping stone to obtaining a job or becoming self-employed. However, the structural nature of unemployment in South Africa means that participants return to poverty at the end of a short-term work opportunity (Philip, 2010).
Phases 1 and 2 of the EPWP met their quantitative targets, but the majority of work opportunities were of a short duration (see SACN, 2014a; 2015; 2016a; 2016b for details). Phase 3 of the EPWP recognises that many people are unable to access economic opportunities, and so public employment will need to be an ongoing part of their livelihoods. It sets an extremely ambitious target of creating six million work opportunities by 2019. The approach underscores that supporting people’s capacity to work and earn allows a sense of dignity, whereby they become self-reliant rather than economically dependent on others. The resulting social and economic multipliers include reduced crime, domestic violence and substance abuse; enhanced social cohesion; increased local consumption and thus investment in poor communities; and social and political stability (Philip, 2010; Wray, 2007). This represents a critical mind shift for cities, which have tended to define public employment programmes as a social issue that helps those on the margin rather than an essential component of the city’s economic development strategy.
The Community Work Programme (CWP) is designed as a complementary approach to the existing EPWP and provides regular, ongoing part-time work and predictable incomes, rather than full-time but short-term work opportunities. It provides an employment safety net and sustained income to people with little employment alternative. A form of “employer of the last resort”, the CWP brings together government, civil society and communities in a cross-sectoral development partnership.
conclusIon
Cities are South Africa’s heartbeat, generating almost two-thirds of the country’s economic activity and just over half of national employment. Cities can – and need to – take a leading role in South Africa’s economic recovery. They have the potential to expand diverse economic activity and create jobs and other forms of economic participation through increased innovation, human capital and investment.
The five larger cities – the three Gauteng cities and Cape Town, followed by eThekwini – drive the South African economy, while the four smaller cities – Nelson Mandela, Buffalo City, Mangaung and Msunduzi – serve as distant but important regional hubs. The large city economies are dominated by tertiary services, in particular the financial and business services industry, but manufacturing (in high-value added automotive, industrial machinery and equipment) and chemical industries still hold considerable opportunity for growth and employment.

122 S TaT E O f S O U T h a f R I C a n C I T I E S R E P O R T 2016
Much more needs to be done to make city economies competitive, productive and inclusive. This means expanding people’s abilities to participate in the economy, through improved education and training, and access to basic services, as well as enhancing the environment in which firms do business, through increasing investment in city economic infrastructure. It also means transforming apartheid’s legacy of dispersed spatial settlement patterns in order to make cities more economically efficient and inclusive, enabling people to access economic opportunities across the city.
recommendatIons
City economic strategies must consider all relevant levers across the entire economic system, not just the spatial transformation elements. This will require having a deeper and more nuanced understanding of the spatial and locational factors that encourage firms to invest in certain areas and not in others.
Cities need to develop new skills and expand existing ones required to take the lead in economic
development. These skills include being able to: understand economic metrics and analyse spatial economic data and intelligence; implement and coordinate an integrated approach across spatial planning, human settlement and public transport functions; engage with other spheres of government and the private sector; and create regional development coalitions and partnerships with the private sector.
Cities should do more about securing livelihoods for poor people. This involves having a massive focus on job creation (private sector, in particular) and scaling up public employment programmes for people who do not have the education, skills or capabilities to compete in the urban labour market, as well as accepting informality as a way of doing business. Connected to this is the need to understanding the informal sector and its links to the formal sector, and how informal entrepreneurs and traders use city spaces and infrastructure to create economic opportunities and advantages.
The way in which cities are financed needs to be revisited. This is critical to unlocking municipalities as key economic actors, and means relooking at how nationally raised revenue is divided among government spheres as well as exploring innovative city financing instruments, such as municipal bonds and city business taxes. In particular, financing city public transport is the public finance deal breaker in the economic development system. It is the biggest game changer in South Africa’s efforts to change apartheid spatial legacy, but its budgetary implications have been left to cities to address.
The critical role of cities in the national economy must be recognised. Such recognition fundamentally alters intergovernmental dynamics in economic leadership. No longer is the economic agenda solely a national role. Instead, cities are key partners in raising South Africa’s economic performance and enhancing inclusive and resilient economic development. Nevertheless, financing urbanisation and redressing apartheid’s spatial legacy is a national, not local, responsibility. Making cities work, deepening their inclusivity and strengthening their resilience is critical for South Africa’s economic story, and for improving the fortunes of all peoples living in the country.

3
P R O D U C T I V E C I T I E S 123