production planning system chapter 2 … · c. the availability of materials d. the availability of...
TRANSCRIPT

9
PRODUCTION PLANNING SYSTEM
CHAPTER 2
ANSWERS TO PROBLEMS
2.1 Ending inventory = opening inventory + production – demand
= 400 + 700 – 900 = 200 units
2.2 Total working days = 19 + 20 + 21 = 60
Average daily production = 480 60 = 8 units
2.3 Total working days = 22 + 21 + 20 = 63
Average daily production = 25,000 63 = 396.8 units
2.4 Month 1 production = 19 8.3 = 157.7 units
Month 2 production = 20 8.3 = 166 units
Month 3 production = 21 8.3 = 1174.3 units
2.5 Month 1 production = 22 396.8 = 8729.6 units
Month 2 production = 21 396.8 = 8332.8 units
Month 3 production = 20 396.8 = 7936 units
2.6
Per Period 1 2 3 4 5 6
F Forecast 750 800 1050 1600 1000 850
Planned production 1000 1000 1000 1000 1000 1000
Plann Planned
inventory 600 850 1050 1000 400 400 550
2.7
Period 1 2 3 4 5 6 Total
Forecast demand 100 120 125 130 115 110 700
Planned
production 125 125 125 125 125 125 750
Planned
inventory 100 125 130 130 125 135 150
Total production = 700 + 100 – 150 = 750 units
Period production = 750 6 = 125 units
10
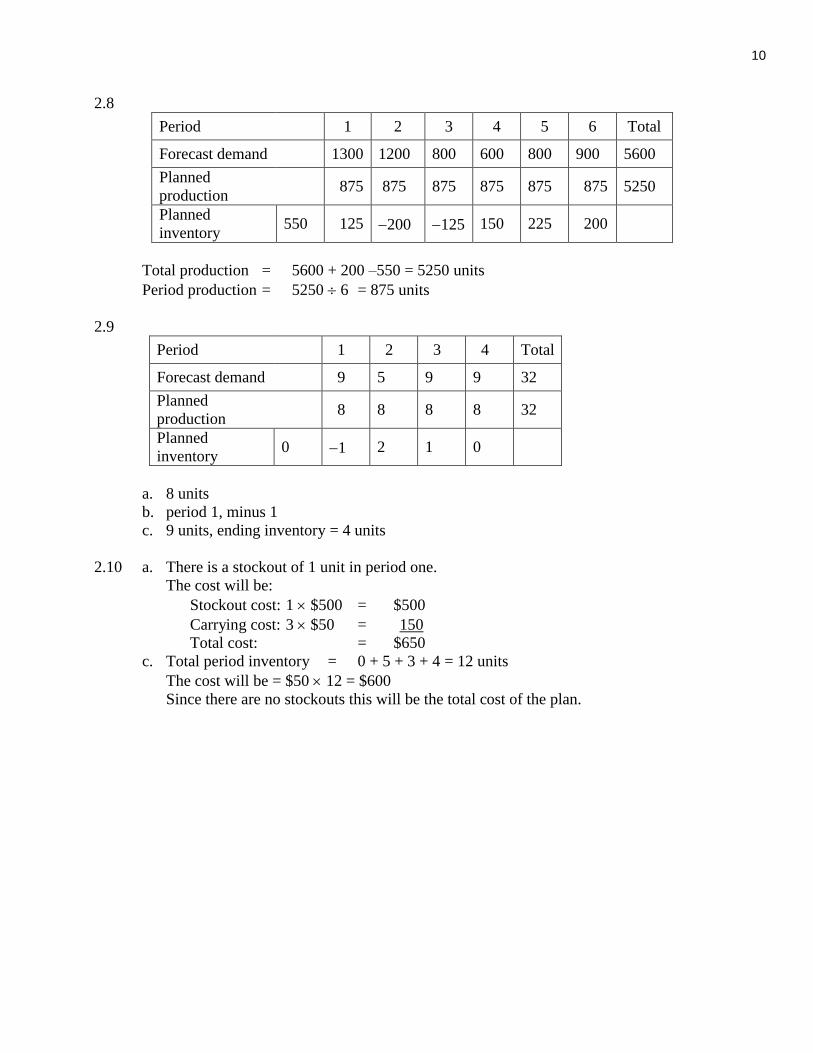
2.8
Period 1 2 3 4 5 6 Total
Forecast demand 1300 1200 800 600 800 900 5600
Planned
production 875 875 875 875 875 875 5250
Planned
inventory 550 125 200 125 150 225 200
Total production = 5600 + 200 –550 = 5250 units
Period production = 5250 6 = 875 units
2.9
Period 1 2 3 4 Total
Forecast demand 9 5 9 9 32
Planned
production 8 8 8 8 32
Planned
inventory 0 1 2 1 0
a. 8 units
b. period 1, minus 1
c. 9 units, ending inventory = 4 units
2.10 a. There is a stockout of 1 unit in period one.
The cost will be:
Stockout cost: 1 $500 = $500
Carrying cost: 3 $50 = 150
Total cost: = $650
c. Total period inventory = 0 + 5 + 3 + 4 = 12 units
The cost will be = $50 12 = $600
Since there are no stockouts this will be the total cost of the plan.

11
2.11 a. Total production = 530 + 130 – 100 = 560
b. Daily production = 560/70 = 8 units
c. The monthly production for May = 168 units
d. The ending inventory for May = 153 units
Month May Jun Jul Aug Total
Working days 21 19 20 10 70
Forecast demand 115 125 140 150 530
Planned
production 168 152 160 80 560
Planned
inventory 100 153 180 200 130
2.12
Month Jan Feb Mar Apr May Jun Total
Working days 20 22 20 20 18 19 119
Forecast demand 1300 1200 800 700 700 900 5600
Planned
production 899 989 899 899 810 854 5350
Planned
inventory 500 99 112 -13 186 296 250
Total production = 5600 + 250 – 500 = 5350
Daily production = 5350 119 = 44.95 units per day
There will be a stockout of 112 units in February and 13 units in March.
12
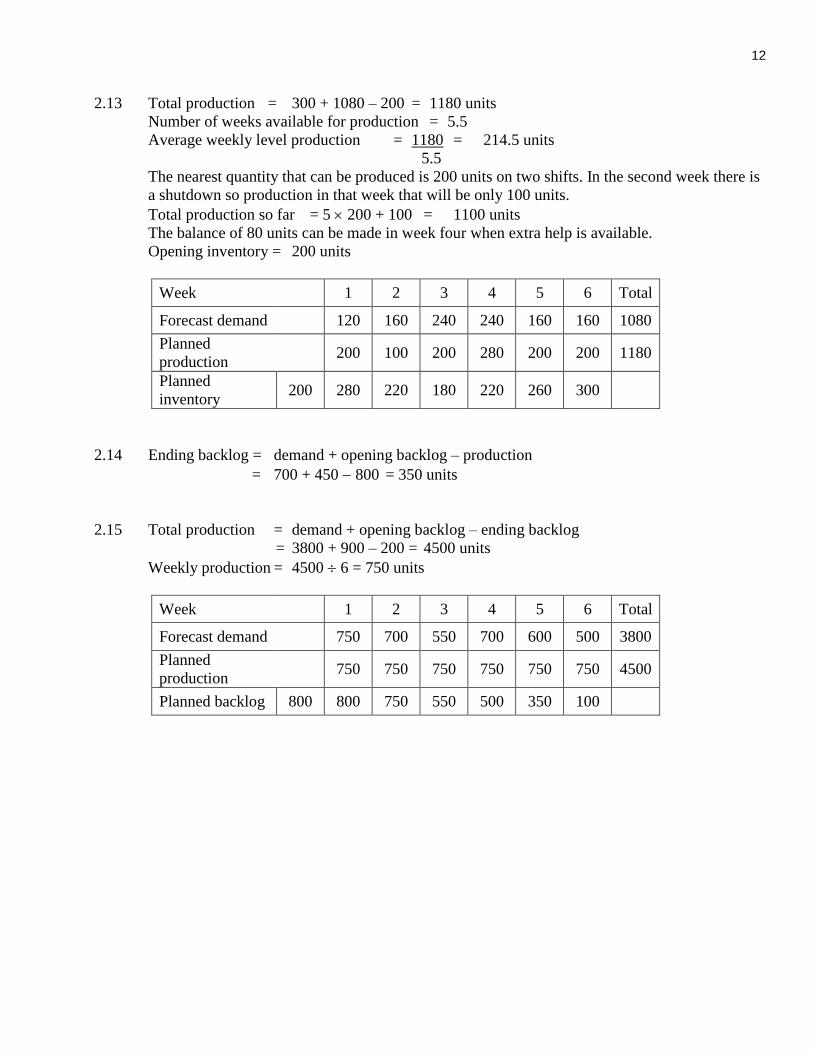
2.13 Total production = 300 + 1080 – 200 = 1180 units
Number of weeks available for production = 5.5
Average weekly level production = 1180 = 214.5 units
5.5
The nearest quantity that can be produced is 200 units on two shifts. In the second week there is
a shutdown so production in that week that will be only 100 units.
Total production so far = 5 200 + 100 = 1100 units
The balance of 80 units can be made in week four when extra help is available.
Opening inventory = 200 units
Week 1 2 3 4 5 6 Total
Forecast demand 120 160 240 240 160 160 1080
Planned
production 200 100 200 280 200 200 1180
Planned
inventory 200 280 220 180 220 260 300
2.14 Ending backlog = demand + opening backlog – production
= 700 + 450 800 = 350 units
2.15 Total production = demand + opening backlog – ending backlog
= 3800 + 900 – 200 = 4500 units
Weekly production = 4500 6 = 750 units
Week 1 2 3 4 5 6 Total
Forecast demand 750 700 550 700 600 500 3800
Planned
production 750 750 750 750 750 750 4500
Planned backlog 800 800 750 550 500 350 100

13
2.16 Desired ending backlog = 1200
Note: All weekly production amounts determined using standard rounding rules.
Total production = demand + opening backlog – ending backlog
= 6800 + 1100 – 1200 = 6700 units
Weekly production = 6700 6 = 1117 units
Week 1 2 3 4 5 6 Total
Forecast demand 1200 1100 1200 1200 1100 1000 7300
Planned
production 1117 1117 1117 1117 1117 1117 7200
Planned backlog 1100 1183 1166 1249 1332 1315 1198
2.17 Total production = 112,500 + 9000 – 11,250 = 110,250 units
Daily production = 110,000 75 = 1470 units
Number of workers required = 1470/15 = 98
Actual daily production = 98 15 = 1470 units
Month 1 2 3 4 Total
Working days 20 24 12 19 75
Forecast demand 28000 27500 28500 28500 112500
Planned
production 29400 35280 17640 27930 110250
Planned
inventory 11250 12650 20430 9750 9180

14
2.18 Total production = 17900 + 800 – 1000 = 17700
Daily production = 17700/117 = 151.28 units
Number of workers required = 151.28/9 = 16.81 17 workers
Actual daily production = 17 9 = 153 units
Month 1 2 3 4 5 6 Total
Working days 20 24 12 22 20 19 117
Forecast demand 2800 3000 2700 3300 2900 3200 17900
Planned
production 3060 3672 1836 3366 3060 2907 17901
Planned
inventory 1000 1260 1932 1068 1134 1294 1001
It is not possible to meet the ending inventory target because of the extra fraction of a worker
needed. The only way to do it would be to reduce the number of workers to 16 at some point.

15
MULTIPLE CHOICE QUESTIONS
1. The ability of manufacturing to produce goods and services is called:
a. scheduling
b. production planning
c. capacity
d. routing
e. none of the above
2. Priority in production planning relates to:
a. routing
b. how much of what is needed and when
c. capacity
d. an objective of the firm
e. none of the above
3. Which of the following is an input to the production plan?
a. strategic business plan
b. financial plan
c. market plan
d. engineering plan
e. all of the above are inputs
4. Which of the following plans has the longest planning horizon and the least level of detail?
a. strategic business plan
b. production plan
c. master production schedule
d. all of the above have the same level of detail
e. none of the above
5. In terms of INCREASING level of detail, which is the best sequence of activities?
I. Material requirements planning.
II. Master production scheduling.
III. Production planning.
a. I, II and III
b. I, III, and II
c. II, III, and I
d. II, I, and III
e. III, II, and I

16
6. Over the time span of the production plan, which of the following can usually be varied to change
capacity?
a. work force
b. inventories
c. plant and equipment
d. all of the above
e. a and b above
7. Which of the following is a characteristic of a production plan?
a. time horizons are five years
b. the production plan is for individual items
c. the only objective is to have an efficient plant
d. all of the above are characteristics of a production plan
e. none of the above is characteristic of a production plan
8. Determining the need for labor, machines, physical resources to meet the production objectives of
the firm is called:
a. production control
b. production planning
c. capacity planning
d. all of the above
e. none of the above
9. The function of setting the limits or levels of manufacturing operations based on the market plan
and resource availability is called:
a. production planning
b. production activity level
c. capacity planning
d. all of the above
e. none of the above
10. A statement of a schedule of requirements for individual end items is called:
a. a master production schedule
b. a material requirements plan
c. a production plan
d. a capacity plan
e. none of the above
11. Which of the following statements is most appropriate regarding production planning?
a. a high level of detail is not needed
b. a translation must be made from product demand to capacity demand
c. product groups based on similarity of manufacturing process should be used in planning
d. all of the above are true
e. none of the above is true
12. Which of the following statements is best about sales and operations planning?
a. it provides an means of updating the material requirements plan
b. it includes only the marketing and production plans
c. it is usually updated on a monthly basis
d. it has no effect on inventory levels
17
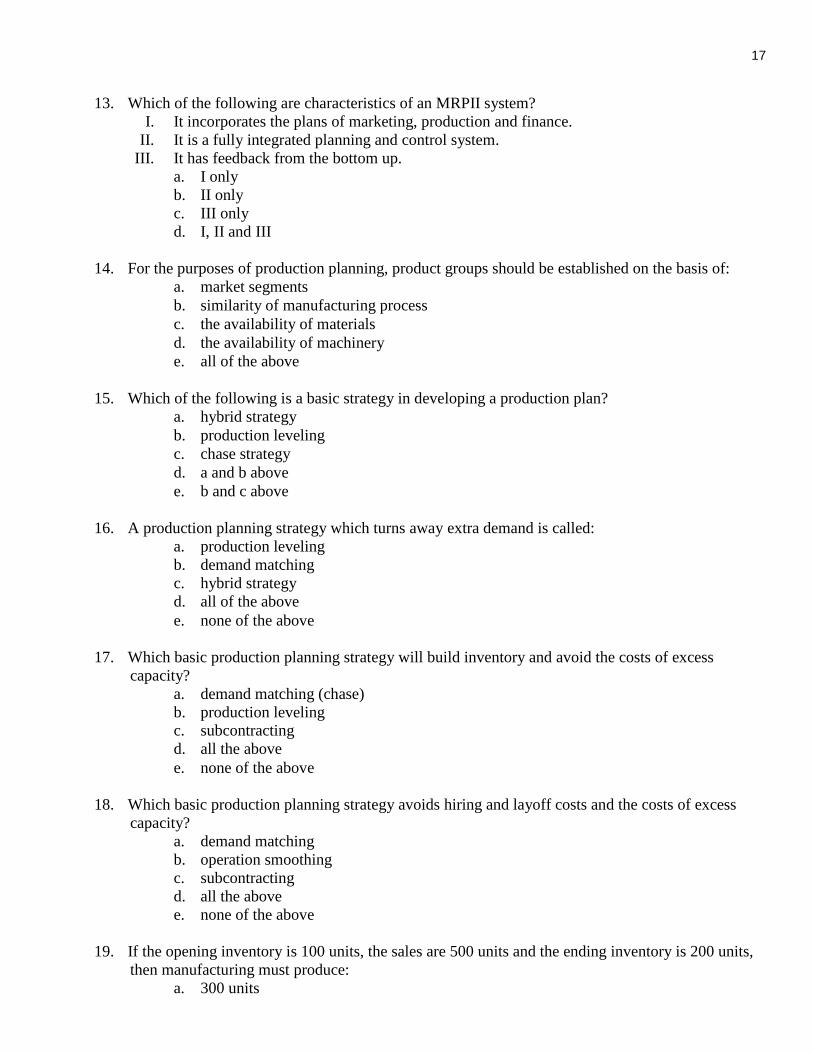
13. Which of the following are characteristics of an MRPII system?
I. It incorporates the plans of marketing, production and finance.
II. It is a fully integrated planning and control system.
III. It has feedback from the bottom up.
a. I only
b. II only
c. III only
d. I, II and III
14. For the purposes of production planning, product groups should be established on the basis of:
a. market segments
b. similarity of manufacturing process
c. the availability of materials
d. the availability of machinery
e. all of the above
15. Which of the following is a basic strategy in developing a production plan?
a. hybrid strategy
b. production leveling
c. chase strategy
d. a and b above
e. b and c above
16. A production planning strategy which turns away extra demand is called:
a. production leveling
b. demand matching
c. hybrid strategy
d. all of the above
e. none of the above
17. Which basic production planning strategy will build inventory and avoid the costs of excess
capacity?
a. demand matching (chase)
b. production leveling
c. subcontracting
d. all the above
e. none of the above
18. Which basic production planning strategy avoids hiring and layoff costs and the costs of excess
capacity?
a. demand matching
b. operation smoothing
c. subcontracting
d. all the above
e. none of the above
19. If the opening inventory is 100 units, the sales are 500 units and the ending inventory is 200 units,
then manufacturing must produce:
a. 300 units

18
b. 400 units
c. 500 units
d. 600 units
e. none of the above
20. Over a 10-week period the cumulative sales are forecast at 10,000 units, the opening inventory is
200 units and the closing inventory is to be 100 units. What should be the weekly planned
production for level production?
a. 990
b. 1000
c. 1010
d. 1030
e. none of the above
21. Firms will generally make-to-stock when:
a. demand is unpredictable
b. there are many product options
c. delivery lead times are long
d. all of the above
e. none of the above
22. Firms will generally make-to-order when:
a. products are produced to customer specifications
b. there are many product options
c. product is expensive to make and store
d. all of the above
e. none of the above
23. Which of the following information is needed to develop a make-to-stock production plan?
I. Forecast by time period for the production plan.
II. Opening inventory.
III. Opening backlog of customer orders.
IV. Desired ending inventory.
a. I, II and III
b. I, II and IV
c. 1, III and IV
d. II, III and IV
e. none of the above
24. If the old backlog was 200 units, the forecast for the next period is 500 units, and production for the
next period is 600 units, what will be the backlog at the end of the next period?
a. 100 units
b. 200 units
c. 300 units
d. 700 units
e. 800 units

19
25. Which of the following is concerned with long-term planning of manufacturing activity?
a. Sales and operations planning
b. Master production scheduling
c. MRP
d. Production activity control
e. Master planning
26. Which of the following is NOT a rule of Sales and Operations Planning?
a. Product Groups need not be decided
b. Planning units of measure need to be decided
c. A planning horizon must include new product development time
d. Performance review periods to be compared should be decided
27. Which of the following is a complete closed loop planning system that develops plans for all
materials and operations?
a. Capacity requirements planning
b. Enterprise resource planning
c. Supply chain management
d. Material requirements planning
28. Which of the following represents the major reason for developing the production plan as part of
Sales and Operations Planning?
a. To decide how to best produce exactly what is in the sales plan
b. To plan for resources required to produce to the agreed plan
c. To plan a schedule for the production of individual products
d. To plan the acquisition of new manufacturing facilities
29. Which of the following is true?
I The strategic plan is stated in product terms
II The strategic business plan is stated in financial terms
III The strategic business plan is developed from the strategic plan
a. I and II only
b. I and III only
c. II and III only
d. I, II, and III
e. None are correct
30. Which following best represents the concept of sustainability?
a. The ability to make long production runs
b. The ability to train labor effectively
c. The ability to maintain the supplier base
d. The ability to continue operation in the long term
31. When a company establishes a program to recycle or reuse products discarded or returned from
customers it is typically called which of the following?
a. Product return contract
b. Reverse supply chain

20
c. Customer servicing
d. Resupply planning
32. Which of the following is most true about Sales and Operations Planning
a. It usually is produced only once a year
b. It usually includes only sales and manufacturing people
c. It is typically done in financial terms
d. It usually includes all functions at the executive level
Answers.
1 c 2 b 3 e 4 a 5 e 6 e 7 e 8 c 9 a
10 a 11 d 12 c 13 d 14 b 15 e 16 e 17 b 18 c
19 d 20 a 21 e 22 d 23 b 24 a 25 a 26 a 27 b
28 b 29 c 31 b 32 d

Copyright © 2017 by Pearson Education, Inc.All Rights Reserved
Introduction to Materials Management, 8eChapman, Arnold, Gatewood, and Clive
Introduction to MATERIALS MANAGEMENT
CHAPTER
Introduction to Materials Management, 8eChapman, Arnold, Gatewood, and Clive
Copyright © 2017 by Pearson Education, Inc.All Rights Reserved
Production Planning
System
2

Copyright © 2017 by Pearson Education, Inc.All Rights Reserved
Introduction to Materials Management, 8eChapman, Arnold, Gatewood, and Clive
Planning System Questions
• What are we going to make?
• What does it take to make it?
• What do we already have?
• What do we need to get?

Copyright © 2017 by Pearson Education, Inc.All Rights Reserved
Introduction to Materials Management, 8eChapman, Arnold, Gatewood, and Clive
Key is to Match
• Priority
▪ What is needed, when, and how much
• Capacity
▪ Capability to produce what is needed and when
Priority(Demand)
Capacity(Resources)

Copyright © 2017 by Pearson Education, Inc.All Rights Reserved
Introduction to Materials Management, 8eChapman, Arnold, Gatewood, and Clive
Major Levels of Planning and Control
• In order of time span (long to short) and detail
(general to detailed)
▪ Strategic plans
▪ Strategic business plans
▪ Sales and Operations Plans (Production Plans
and Marketing Plans)
▪ Master Production Schedules
▪ Material Requirements Plans
▪ Purchasing and Production Activity Control

Copyright © 2017 by Pearson Education, Inc.All Rights Reserved
Introduction to Materials Management, 8eChapman, Arnold, Gatewood, and Clive
At Each Level, Need to Decide
• What are the priorities
▪ What to produce?
▪ How much?
▪ When?
• What is the available capacity?
• How can the differences between priorities and
capacities best be resolved?

Copyright © 2017 by Pearson Education, Inc.All Rights Reserved
Introduction to Materials Management, 8eChapman, Arnold, Gatewood, and Clive
The Strategic Plan
• Broad direction of the firm
▪ Product lines
▪ Markets
▪ Growth
• Senior management from all functions
responsible for input
• Some companies use Hoshin planning
▪ Vision
▪ Goals

Copyright © 2017 by Pearson Education, Inc.All Rights Reserved
Introduction to Materials Management, 8eChapman, Arnold, Gatewood, and Clive
Sustainability
• The capability to continue (sustain) operations
into the future
▪ Pollution and waste control
▪ Social responsibility
▪ Remanufacturing and the reverse supply chain
▪ Recycling

Copyright © 2017 by Pearson Education, Inc.All Rights Reserved
Introduction to Materials Management, 8eChapman, Arnold, Gatewood, and Clive
Risk Management
• Negative risks
▪ Evaluate sources and possible results of
failures
▪ Develop plans to minimize impacts
• Positive risks (opportunities)
▪ Evaluate sources
▪ Develop plans to exploit

Copyright © 2017 by Pearson Education, Inc.All Rights Reserved
Introduction to Materials Management, 8eChapman, Arnold, Gatewood, and Clive
The Strategic Business Plan
• Developed from the overall strategic plan
• Focuses on the financial implications
▪ Pro forma income statements
▪ Pro forma balance sheets

Copyright © 2017 by Pearson Education, Inc.All Rights Reserved
Introduction to Materials Management, 8eChapman, Arnold, Gatewood, and Clive
Planning Hierarchy
StrategicBusiness Plan
ProductionPlan
Master ProductionSchedule
MaterialRequirementsPlan
Production ActivityControl andPurchasing
MasterPlan
Planning
Implementation
Copyright © 2017 by Pearson Education, Inc.All Rights Reserved
Introduction to Materials Management, 8eChapman, Arnold, Gatewood, and Clive
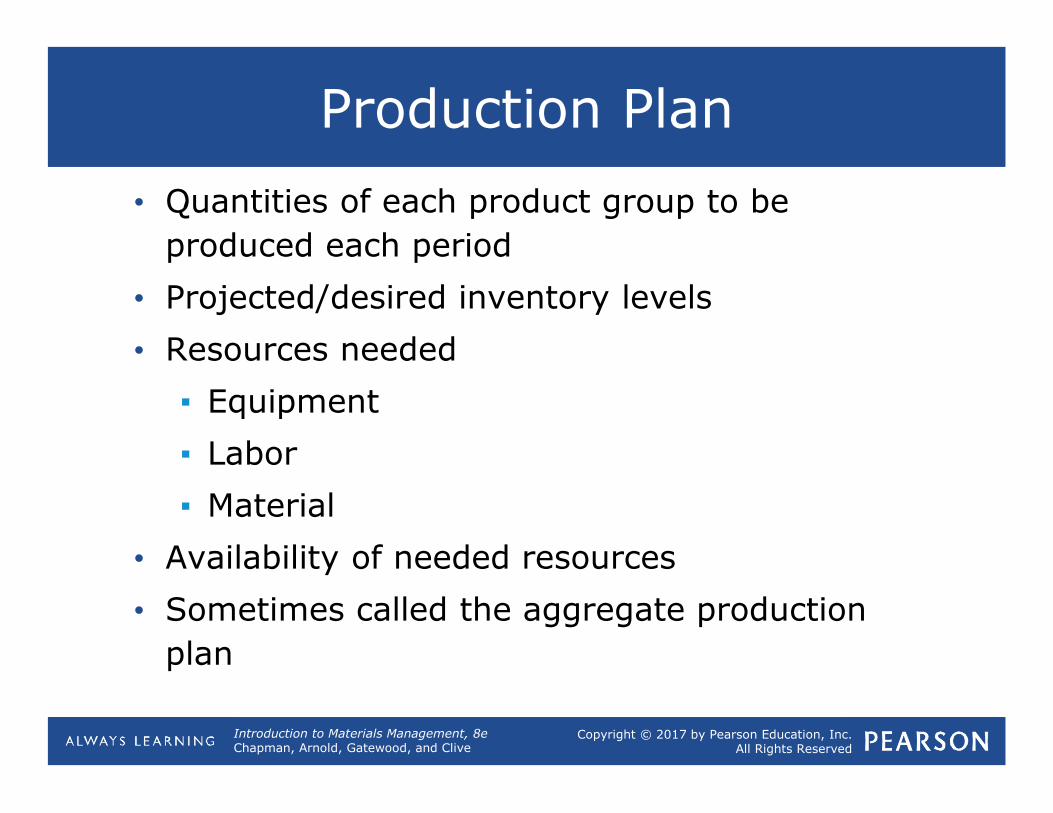
Production Plan
• Quantities of each product group to be
produced each period
• Projected/desired inventory levels
• Resources needed
▪ Equipment
▪ Labor
▪ Material
• Availability of needed resources
• Sometimes called the aggregate production
plan

Copyright © 2017 by Pearson Education, Inc.All Rights Reserved
Introduction to Materials Management, 8eChapman, Arnold, Gatewood, and Clive
Product Groups (Families)
• Established on the basis of similar resources and
processes used
• Makes long-term forecasting easier
• Effective for planning the major focus of the
production plan - resources

Copyright © 2017 by Pearson Education, Inc.All Rights Reserved
Introduction to Materials Management, 8eChapman, Arnold, Gatewood, and Clive
Master Production Schedule
• Shows, for each period, the quantity of each end
item to be made.
• Level of detail is higher than the Production Plan
▪ End items vs. groups of items
▪ Time periods usually shorter (e.g., weeks
versus months)
Copyright © 2017 by Pearson Education, Inc.All Rights Reserved
Introduction to Materials Management, 8eChapman, Arnold, Gatewood, and Clive
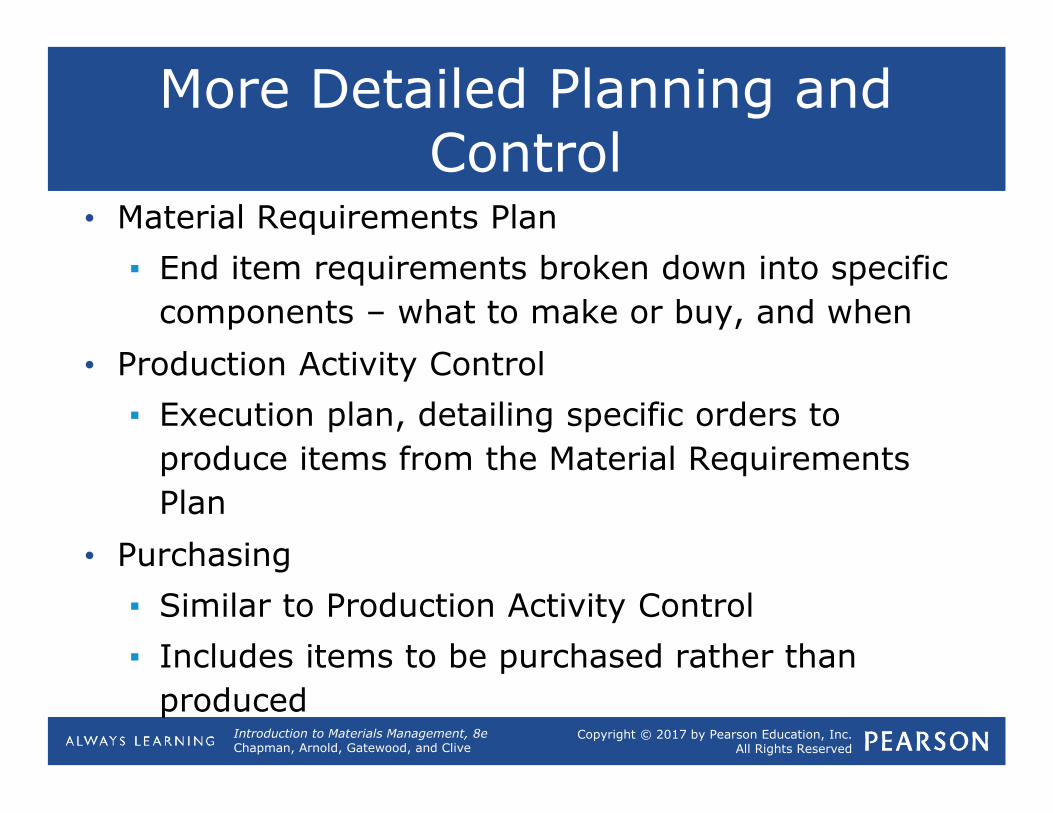
More Detailed Planning and Control
• Material Requirements Plan
▪ End item requirements broken down into specific
components – what to make or buy, and when
• Production Activity Control
▪ Execution plan, detailing specific orders to
produce items from the Material Requirements
Plan
• Purchasing
▪ Similar to Production Activity Control
▪ Includes items to be purchased rather than
produced

Copyright © 2017 by Pearson Education, Inc.All Rights Reserved
Introduction to Materials Management, 8eChapman, Arnold, Gatewood, and Clive
Capacity Management
• At each level of the planning and control system,
reconciliation with resources must be made
▪ Must obtain the right resources or change the
plan
• Inadequate resources = missed production
schedules
• Resources significantly exceed planned
production = idle resources and extra cost
Copyright © 2017 by Pearson Education, Inc.All Rights Reserved
Introduction to Materials Management, 8eChapman, Arnold, Gatewood, and Clive
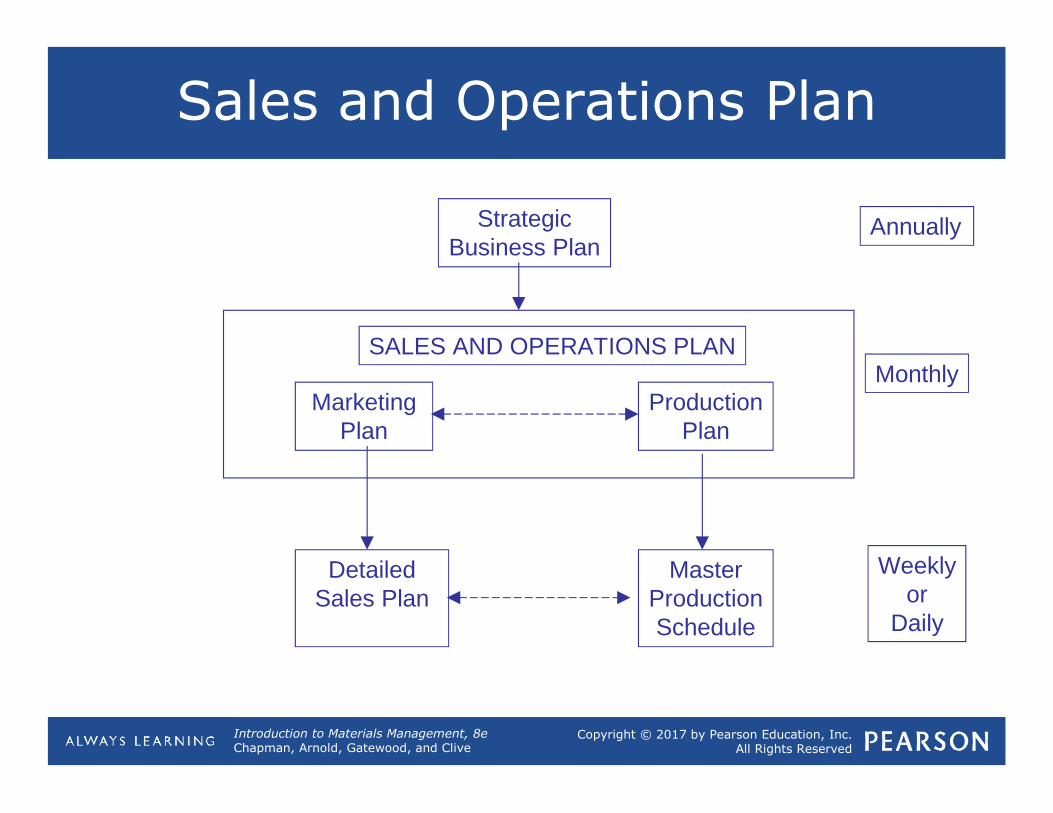
Sales and Operations Plan
Strategic Business Plan
MarketingPlan
ProductionPlan
Detailed Sales Plan
MasterProductionSchedule
SALES AND OPERATIONS PLAN
Annually
Monthly
Weeklyor
Daily

Copyright © 2017 by Pearson Education, Inc.All Rights Reserved
Introduction to Materials Management, 8eChapman, Arnold, Gatewood, and Clive
Sales and Operations Planning
• Can be used to update the strategic plan
• Provides a tool to manage change
• Enforces functional plans to be realistic and
coordinated
• Represents a plan to achieve company
objectives
• Provides management visibility of production,
inventory, and backlogs

Copyright © 2017 by Pearson Education, Inc.All Rights Reserved
Introduction to Materials Management, 8eChapman, Arnold, Gatewood, and Clive
Developing the Production Plan
• Some key questions that must be answered to
develop an effective planning strategy
▪ How flexible are the resources, both in
quantity and timing?
▪ Are “outside” resources available
(subcontracting)?
▪ Can we utilize inventory to meet demand?

Copyright © 2017 by Pearson Education, Inc.All Rights Reserved
Introduction to Materials Management, 8eChapman, Arnold, Gatewood, and Clive
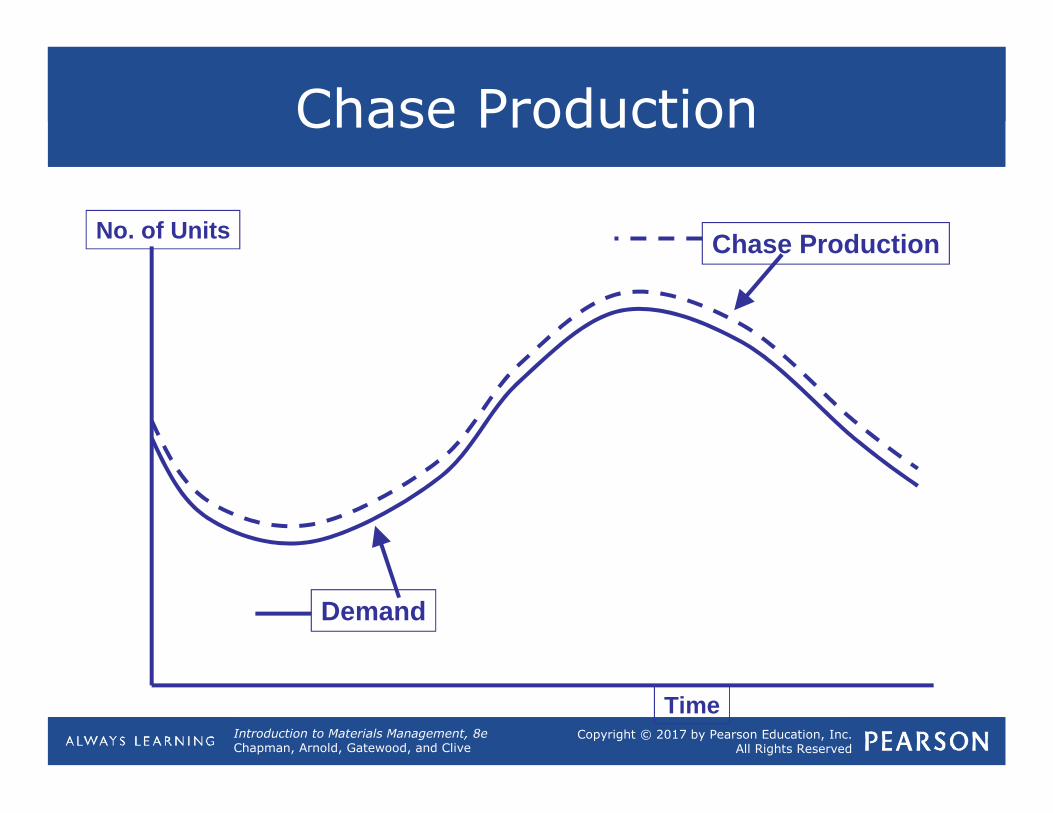
Basic Production Plan Strategies
• Chase – vary production rates to meet changes
in demand
▪ Often used when inventory cannot be used
or when resources are flexible and
inexpensive to change
• Level – establish average demand level and set
production rate to that level
▪ Often used when resources are difficult or
very expensive to change
• Hybrid – use a combination of some chase and
some level

Copyright © 2017 by Pearson Education, Inc.All Rights Reserved
Introduction to Materials Management, 8eChapman, Arnold, Gatewood, and Clive
Demand
No. of Units
Time
Demand Pattern
Copyright © 2017 by Pearson Education, Inc.All Rights Reserved
Introduction to Materials Management, 8eChapman, Arnold, Gatewood, and Clive
Demand
Chase ProductionNo. of Units
Time
Chase ProductionChase Production

Copyright © 2017 by Pearson Education, Inc.All Rights Reserved
Introduction to Materials Management, 8eChapman, Arnold, Gatewood, and Clive
Demand
Level Production
No. of Units
Time
Level ProductionLevel Production

Copyright © 2017 by Pearson Education, Inc.All Rights Reserved
Introduction to Materials Management, 8eChapman, Arnold, Gatewood, and Clive
Production Rate = Sales - Open Inv + End Inv
# of Production Periods
Level Production Plan

Copyright © 2017 by Pearson Education, Inc.All Rights Reserved
Introduction to Materials Management, 8eChapman, Arnold, Gatewood, and Clive
Level Production Plan Practice Problem
• Charlie’s Chairs has a forecast (in ‘000) of 50, 60,
70, 30 chairs for the next four quarters. His
opening inventory is 40 chairs but he would like
to reduce this to 30 by the end of the year.
• How many chairs should he make each quarter
and what will be his ending inventory?

Copyright © 2017 by Pearson Education, Inc.All Rights Reserved
Introduction to Materials Management, 8eChapman, Arnold, Gatewood, and Clive
Charlie’s Chairs - Solution
Sales = 210 chairs
Opening inventory = 40
Desired closing inventory = 30
Production rate = 210 – 40 + 30
4
= 50 chairs/ quarter

Copyright © 2017 by Pearson Education, Inc.All Rights Reserved
Introduction to Materials Management, 8eChapman, Arnold, Gatewood, and Clive
Demand
Level Production
No. of Units
Time
Level Production
CREATE Inventory
USE Inventory
Level Production

Copyright © 2017 by Pearson Education, Inc.All Rights Reserved
Introduction to Materials Management, 8eChapman, Arnold, Gatewood, and Clive
Demand
Hybrid
No. of Units
Time
Hybrid StrategyHybrid Strategy
Copyright © 2017 by Pearson Education, Inc.All Rights Reserved
Introduction to Materials Management, 8eChapman, Arnold, Gatewood, and Clive
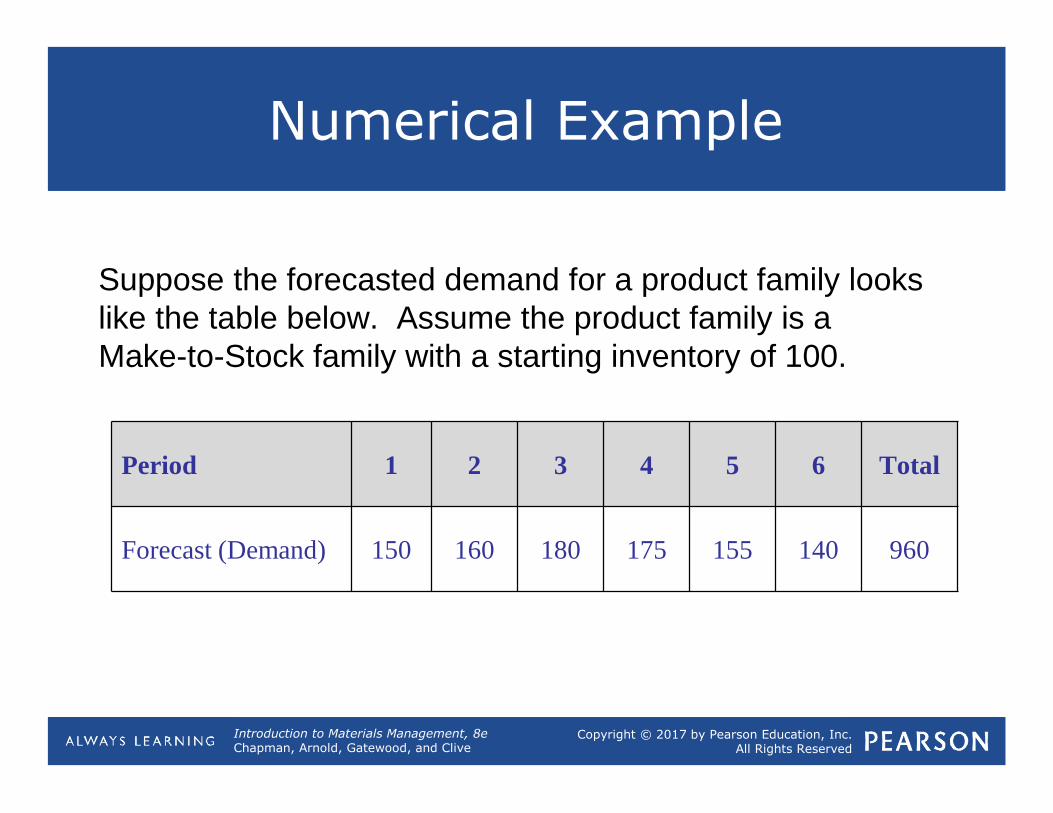
Numerical Example
Period 1 2 3 4 5 6 Total
Forecast (Demand) 150 160 180 175 155 140 960
Suppose the forecasted demand for a product family lookslike the table below. Assume the product family is aMake-to-Stock family with a starting inventory of 100.
Copyright © 2017 by Pearson Education, Inc.All Rights Reserved
Introduction to Materials Management, 8eChapman, Arnold, Gatewood, and Clive
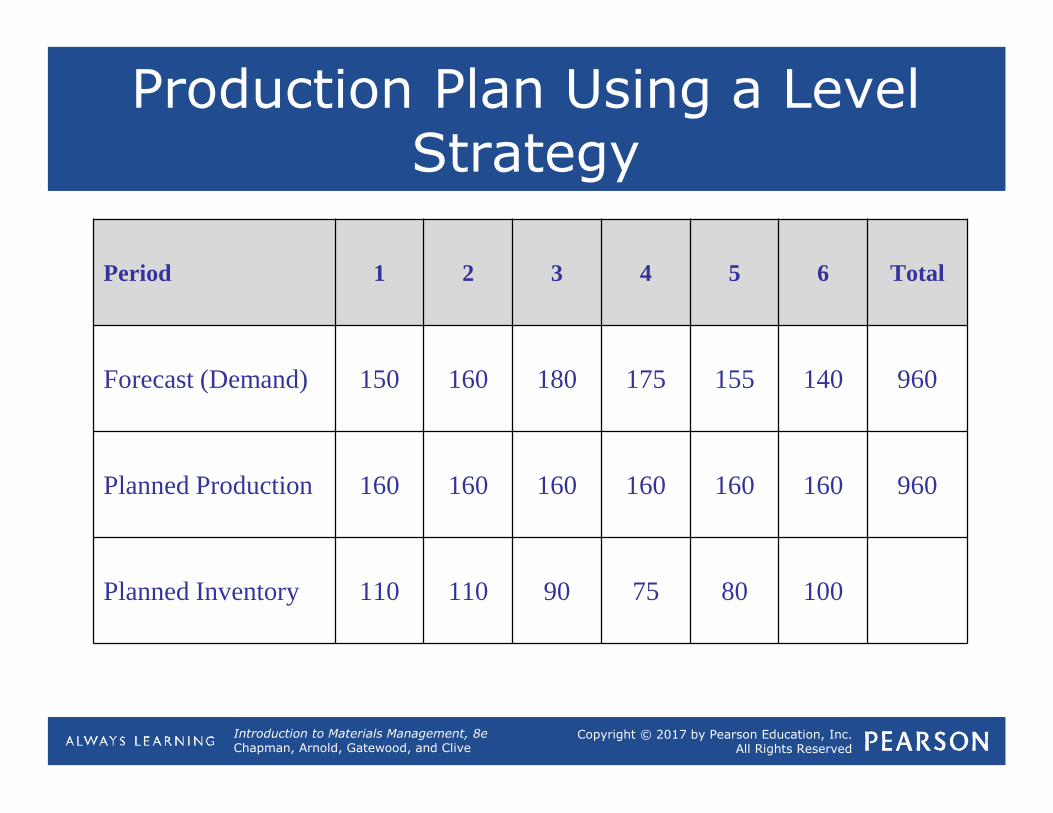
Production Plan Using a Level Strategy
Period 1 2 3 4 5 6 Total
Forecast (Demand) 150 160 180 175 155 140 960
Planned Production 160 160 160 160 160 160 960
Planned Inventory 110 110 90 75 80 100

Copyright © 2017 by Pearson Education, Inc.All Rights Reserved
Introduction to Materials Management, 8eChapman, Arnold, Gatewood, and Clive
Production Plan using a Chase Strategy
Period 1 2 3 4 5 6 Total
Forecast (Demand) 150 160 180 175 155 140 960
Planned Production 150 160 180 175 155 140 960
Planned Inventory 100 100 100 100 100 100
Copyright © 2017 by Pearson Education, Inc.All Rights Reserved
Introduction to Materials Management, 8eChapman, Arnold, Gatewood, and Clive
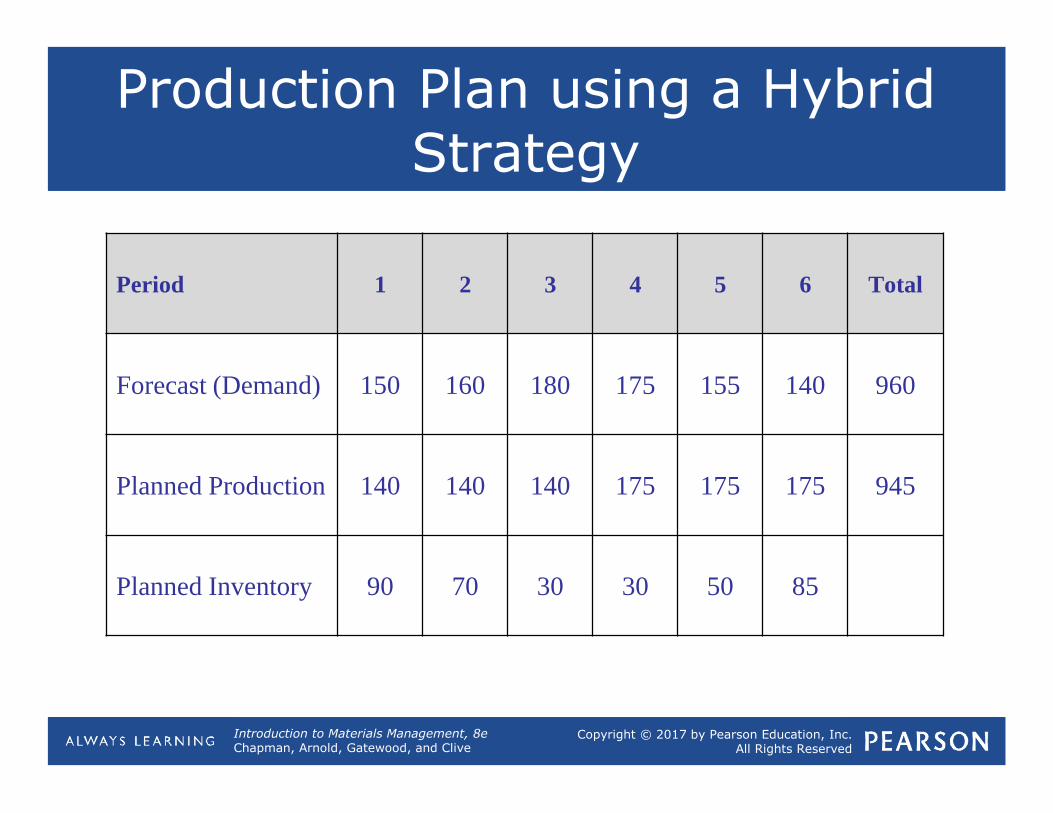
Production Plan using a Hybrid Strategy
Period 1 2 3 4 5 6 Total
Forecast (Demand) 150 160 180 175 155 140 960
Planned Production 140 140 140 175 175 175 945
Planned Inventory 90 70 30 30 50 85

Copyright © 2017 by Pearson Education, Inc.All Rights Reserved
Introduction to Materials Management, 8eChapman, Arnold, Gatewood, and Clive
Practice Problem
• Shawn’s Chimney Cleaning has new orders for
the next week of 4, 6, 2, 7 & 5 houses. He has 4
orders left over from last week and he would like
to start next week with only 3 customers waiting
for work.
• How many should he clean each day? Use a level
plan.
• Why use a level plan?

Copyright © 2017 by Pearson Education, Inc.All Rights Reserved
Introduction to Materials Management, 8eChapman, Arnold, Gatewood, and Clive
Make-to-Order Production Plans
• Products made to customer specifications
• The customer is willing to wait for completion
• Generally products more expensive to make
and/or store
• Often several options offered
• Company often uses a backlog of unfilled
customer orders rather than inventory

Teaching Notes for Introduction to Materials Management, 7e 5
Meridian water PuMPs
Chapter 2 Case Study Teaching NotesThis case is a fairly simple case to work on analytically, yet can provide the basis for a good discussion about the trade-offs involved with making a good production plan or Sales and operations plan. While there are clearly differences in the financial results of the possible plans, there are clearly nonfinancial issues that can and should be discussed in order to give students a better overall perspective involved with this important planning process. Here are sample solutions to the assignment questions:
1. Developing a level production plan is fairly easy. The total demand for the six months is 4650 units. Since the current inventory is 50 and the target inventory for the end of the six month is 25, we reduce the required production for the six months to 4625 (4650–25). Dividing the 4625 by the six months, we would be required to make 771 pumps per month. Dividing the 771 by 25 (the number of pumps one worker can make in one month), we would need 30.8 workers. Rounding that to 31 workers, we have the following result:
■■ We need to hire 11 workers (there are currently 20, and we need 31)■■ There is an upfront cost of $1100 ($100 hiring cost for each worker)■■ The monthly production will be 775 (31 workers × 25 pumps per worker)■■ The inventory at the end of month 1 will be 225 (production of 775 plus existing
inventory of 50 = 825, then subtract the production of 600)
Month 1 2 3 4 5 6
Demand 600 750 1000 850 750 700
Production 775 775 775 775 775 775
Inventory 225 250 25 –50 –25 50
Inventory cost $1125 $1250 $125 $0 $0 $250
The total inventory cost is $2750The total hiring cost is $1100The total extra cost of the level plan is $2750 + $1100 = $3850There are several qualitative issues that can and should be discussed here. Three of the more important ones may be as follows:
■■ There are two months when shortages appear. There is no indication how custom-ers will react. For example, if the customers are willing to wait for one to two months, then certainly there will at least be some loss of goodwill. There is a high probability that customers would not be willing to wait if they could obtain the product from a competitor (given that water pumps are a common product, this is highly likely). In that case a real financial cost is the loss of profit from those lost sales, and potentially some permanent loss of those dis appointed customers. At a minimum, there is likely to be some cost in filling the backorders.
■■ As indicated in the case, such shortages also require sales people to make addi-tional visits to customers to calm their anger. Such visits might cost some real dollars and also create some anger and discouragement within the sales staff.
■■ There is an assumption that the newly hired 11 people will be able to produce a full production (25 pumps per month) immediately. Most production jobs entail a learning curve, implying that the production of 775 total pumps in month 1 may be overly optimistic.
2. The chase plan is also fairly easy to develop. To create it, the assumption is made that the target inventory of 25 can be accomplished in the first month. To obtain the num-ber of people needed each month, the demand for that month is divided by 25 (the number of pumps one worker can make in one month). The only exception is the first month, when we assume that 25 units of demand can be taken from inventory to get to the target level immediately.
Z03_CHAP6323_08_SE_CASE_WEB.indd 5 12/1/15 4:00 PM
6 Case study
Month 1 2 3 4 5 6
Demand 600 750 1000 850 750 700
People Needed 23 30 40 34 30 28
People +/– 3 7 10 –6 –4 –2
Inventory 25 25 25 25 25 25
Hire/Layoff Cost $300 $700 $1000 $600 $400 $200
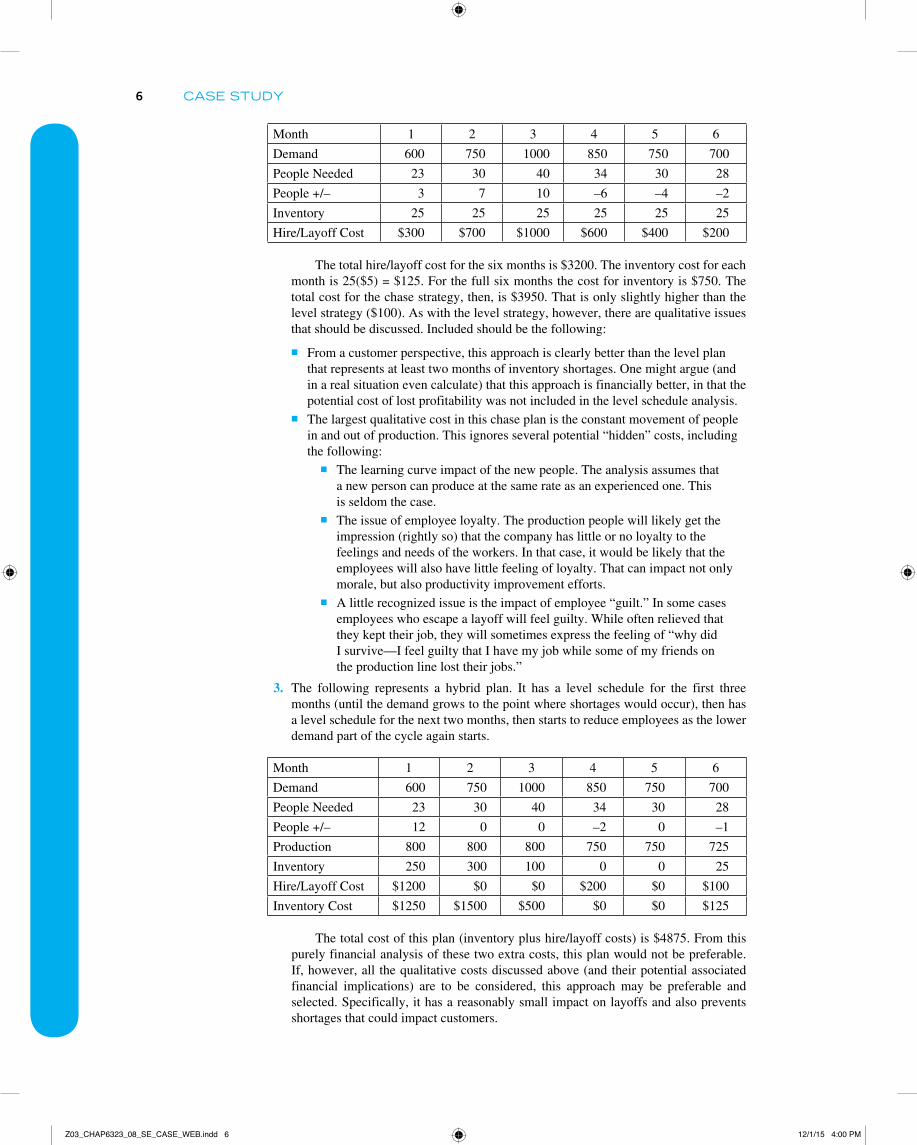
The total hire/layoff cost for the six months is $3200. The inventory cost for each month is 25($5) = $125. For the full six months the cost for inventory is $750. The total cost for the chase strategy, then, is $3950. That is only slightly higher than the level strategy ($100). As with the level strategy, however, there are qualitative issues that should be discussed. Included should be the following:
■■ From a customer perspective, this approach is clearly better than the level plan that represents at least two months of inventory shortages. One might argue (and in a real situation even calculate) that this approach is financially better, in that the potential cost of lost profitability was not included in the level schedule analysis.
■■ The largest qualitative cost in this chase plan is the constant movement of people in and out of production. This ignores several potential “hidden” costs, including the following:
■■ The learning curve impact of the new people. The analysis assumes that a new person can produce at the same rate as an experienced one. This is seldom the case.
■■ The issue of employee loyalty. The production people will likely get the impression (rightly so) that the company has little or no loyalty to the feelings and needs of the workers. In that case, it would be likely that the employees will also have little feeling of loyalty. That can impact not only morale, but also productivity improvement efforts.
■■ A little recognized issue is the impact of employee “guilt.” In some cases employees who escape a layoff will feel guilty. While often relieved that they kept their job, they will sometimes express the feeling of “why did I survive—I feel guilty that I have my job while some of my friends on the production line lost their jobs.”
3. The following represents a hybrid plan. It has a level schedule for the first three months (until the demand grows to the point where shortages would occur), then has a level schedule for the next two months, then starts to reduce employees as the lower demand part of the cycle again starts.
Month 1 2 3 4 5 6
Demand 600 750 1000 850 750 700
People Needed 23 30 40 34 30 28
People +/– 12 0 0 –2 0 –1
Production 800 800 800 750 750 725
Inventory 250 300 100 0 0 25
Hire/Layoff Cost $1200 $0 $0 $200 $0 $100
Inventory Cost $1250 $1500 $500 $0 $0 $125
The total cost of this plan (inventory plus hire/layoff costs) is $4875. From this purely financial analysis of these two extra costs, this plan would not be preferable. If, however, all the qualitative costs discussed above (and their potential associated financial implications) are to be considered, this approach may be preferable and selected. Specifically, it has a reasonably small impact on layoffs and also prevents shortages that could impact customers.
Z03_CHAP6323_08_SE_CASE_WEB.indd 6 12/1/15 4:00 PM

Teaching Notes for Introduction to Materials Management, 7e 7
4. There is only one hybrid approach presented. This question presents a great opportunity for students to present their own plans and discuss the pros and cons of each. A good discussion here can leave students with a much stronger perspective of the issues and advantages of developing good production plans.
williaMs 3d Printers
Chapter 2 Case Study Teaching NotesThis case has an advantage in that it can be used for discussing the strategic issues often surrounding the development of longer term S&OP planning, where additional capacity is possibly needed. But if students are not at a level where that is appropriate, then the case can be more simply used as a discussion of some of the options available for a company in this situation to use, and some of the pros and cons of each. You may find that even for students not familiar with strategic thinking that some may move in that direction based on their experience and basic logic.
The environment described and the issues facing the company are fairly common for a start-up organization in a rapidly growing market typical of the introduction phase of a prod-uct life cycle. You may wish to point out that often in such a market many small companies trying to enter the market is typical, but over time most will fail, either because of an inferior design, a lack of flexibility to understand the market, or the inability to find ways to grow in the market. As successful companies in the market grow, they are able to gain from the advantages of growth, including economies of scale. You may wish to point out that since the entire market is growing at this point, individual companies may experience growth without experiencing a lot of competitive pressure. This is because growth can occur without actually growing market share (assuming the company grows at the same rate at which the market grows). Later on in the life cycle when the market growth slows considerably, the competition between survivors will tend to increase as the only way they can obtain growth is through taking market share from another company. How much of a discussion of this you feel appropriate should be based on the background of the students. You can also refer them to the first few pages of Chapter 14 where the product life cycle is briefly discussed.
The case can be discussed without this life cycle discussion, focusing primarily on the key issue of dealing with longer range sales and operations planning (S&OP) in this kind of environment. It certainly can bring out many of the trade-offs inherent with the devel-opment of any S&OP process that almost any company has to go through, although in this case inventory does not seem to be a major problem (again somewhat typical in what ap-pears to be a make-to-order environment). The key trade-offs here appear to lie within the concepts of how to best manage rapidly growing sales forecasts. Specifically, they need to plan for longer range resources and how to pay for them.
Certainly, one alternative is for them to maintain their current size and only take or-ders that they can produce within their existing facility and staffing. Some students may wish to take that option, and could justify it by stating that it would allow the facility to only take orders with the highest possible profit margin. Given that the design for each order is apparently not standard, the price is likely not standard either. If they do negotiate price, it gives them the option of taking or not taking a particular order. Some compa-nies in this type of market will elect to take this approach, and it can work as the market matures if the company can successfully identify and defend a specific niche where they can provide good products and services. It is not clear that this would be the preferred ap-proach here, and certainly it would appear that the sales and marketing manager, at least, would need to be convinced. Also, if they stay small as the market matures, they may face other problems—the design of a product tends to become more standard as the market ma-tures, and also price becomes more sensitive. This type of discussion may be too advanced for your students, but asking them to consider what has happened in recent years to the product with which they may be familiar with may help—consider “smart” televisions, cell phones, and almost any other electronic device.
If the growth option is taken, then Pamela’s concerns need to be addressed. The deci-sion to grow the business needs to include a good plan as to how. As Pamela points out,
Z03_CHAP6323_08_SE_CASE_WEB.indd 7 12/1/15 4:00 PM

8 Case study
growth in the production area may need to appear something like a “step function,” where large “chunks” of production capacity are added. Smoothing out added production capac-ity would seem to be difficult here, although it should be pointed out (and some students may suggest) that sometimes smoothed addition of capacity can be obtained by subcon-tracting the work. If the discussion goes in this direction, student should be aware that in those cases, it is more difficult for the company to control the work, especially in terms of quality, but also cost and delivery. Still this may be a very attractive alternative for some students.
If they decide to grow internally with the “chunks” of capacity, they need to address that likely at first they would have an excess of capacity since the sales are less likely to grow in matching “chunks” of orders. Options possibly exist, however. One would be to offer other companies some of the added capacity for short-term subcontracting work. Another would be to build some inventory of more standard parts of the printers. The inventory option would mean even more added cost up front, but could allow them to postpone the next needed “chunk” of capacity assuming the market continues to grow. If the students are at a level where discussion of this option evolves some strategic points, you may wish to point out that addition of capacity in this early life cycle market often should lead the growth of demand. While that option tends to cost more in the short term, products in this type of market tend to be much more sensitive to delivery than they are to price, and the excess capacity (especially in a product with lots of design options) can help make delivery reliable, and they also tend to provide good margins (not being particularly price sensitive). On the other hand, facilities producing products in a more mature market tend to allow the addition of capacity to lag demand growth, preferring to use techniques such as working overtime and subcontracting as much as possible before turning to acquiring more capacity. The main point against adding a “chunk” of capacity is cost and the impact on profitability. Certainly, the concerns of the financial manager need to be considered, and it would be an important decision if the company wishes to forgo a profitability position for some time in the future to pay for the added capacity. Some students may point out that this may make them much more profitable in the future as they can serve more of the market. While that can be true, you need to point out that if growth continues, the company is likely to face a similar issue about adding even more capacity sometime in the future. Students should be made aware that these kinds of deci-sions must be made considering the overall strategy of the firm. They should be able to understand that even if you elect to forgo any detailed discussion around the life cycle and its characteristics.
aCMe water PuMPs
Chapter 3 Case Study Teaching NotesThe following is a master schedule using the case data. It is important to note that the projected balance ignores the forecast data for the first three weeks (because the demand time fence is 3 weeks), and from that point on the balance is computed from the larger of customer orders or forecast.
Period 1 2 3 4 5 6 7 8 9 10 11 12
Forecast 90 120 110 80 85 95 100 110 90 90 100 110
Cust. orders 105 97 93 72 98 72 53 21 17 6 2 5
Proj. Balance (25) 220 123 30 250 152 57 257 147 57 267 167 57
MPS 300 300 300 300
ATP 30 58 209 287
The order request for week 5 of 45 units should be no problem, as the ATP of 58 for week 4 covers it nicely.
At this point it might be helpful to teach students about ATP by challenging them with additional questions about future orders. For example,
Z03_CHAP6323_08_SE_CASE_WEB.indd 8 12/1/15 4:00 PM