production of biogas from poultry manure …umpir.ump.edu.my/11012/1/fkksa - choo wei chun...
TRANSCRIPT
III
PRODUCTION OF BIOGAS FROM POULTRY
MANURE WASTEWATER: OPTIMIZATION
CHOO WEI CHUN
Thesis submitted in partial fulfilment of the requirements
for the award of the degree of
Bachelor of Chemical Engineering (Biotechnology)
Faculty of Chemical & Natural Resources Engineering
UNIVERSITI MALAYSIA PAHANG
JANUARY 2015
© CHOO WEI CHUN (2015)
VIII
ABSTRACT
An exaggeration increment of population has led to depletion of energy resources. One
of the most effective solutions is to implement the uses of renewable energy sources. In
particular, biomass, which can be further converted into biofuel, is normally derived
from plants. However, it brings several drawbacks which may directly threaten the
sensitive species. To alleviate these, biogas production from poultry manure wastewater
was explored in the current work. Its usage to produce biogas was considered as a
triumph to the concept of waste-to-wealth. The main objective of this research study
was the optimization of biogas production from poultry manure wastewater by soil
mixed culture. The poultry manure collected was gone through characterization and pre-
treatment processes to remove excessive ammonia-N which cause inhibition to the
biogas production. The optimization was analyzed by central composite design (CCD).
Previous studies have screened out five processing parameters, which were agitation
speed, reaction time, substrate to inoculum ratio, process system and type of substrate.
Significantly, it had been identified that agitation speed and reaction time were the most
crucial parameters. The best screening condition obtained from previous studies was
120 rpm agitation speed and 3 days of reaction time. Consequently, there were two
factors involved in current research study, which are agitation speeds ranged from 100
rpm to 140 rpm; and reaction time ranged from 2 days to 5 days. The biogas production
was collected by water displacement experimental set up. In addition, chemical oxygen
demand (COD) value was determined using HACH DR5000 spectrophotometer with
the aid of COD digestion reactor. Lastly, the experiment was designed and analyzed by
Design Expert V7.0 software using response surface methodology (RSM). The biogas
production performance was evaluated on the basis of biogas yield from initial COD
and was found ranging from 0.49 to 4.37 mL/g COD. Quadratic model was well fitted
(R-squared>0.80) with a confidence level higher than 95 %. For validation run, the
optimum biogas production was using agitation: 120 rpm and reaction time: 3.3 days.
Under this condition, 4.45 mL/g COD of biogas yield was obtained. This counted for
5.82 % error from predicted models. It is recommended to construct a pilot study of
scale-up experiment for the optimization of biogas production under optimum
conditions obtained from this study.
IX
ABSTRAK
Populasi penduduk yang semakin meningkat telah menyebabkan penyusutan sumber
tenaga. Salah satu cara penyelesaian yang paling berkesan adalah dengan melaksanakan
penggunaan sumber tenaga boleh diperbaharui. Khususnya, biojisim, yang boleh terus
ditukar menjadi bahan api bio, biasanya diperolehi daripada tumbuhan. Walau
bagaimanapun, ia membawa beberapa kelemahan yang secara langsung boleh
mengancam beberapa spesies tumbuhan. Untuk mengatasi masalah ini, penghasilan
biogas daripada najis ayam akan diterokai dalam kerja kajian ini. Penggunaannya untuk
menghasilkan biogas akan dianggap sebagai kemenangan kepada konsep sisa kepada
kekayaan. Objektif utama kajian penyelidikan ini adalah pengoptimuman penghasilan
biogas daripada najis ayam oleh kultur tanah campuran. Najis ayam yang diperolehi
telah melalui proses pencirian dan pra-rawatan untuk mengurangkan ammonia-N yang
berlebihan yang akan menyebabkan perencatan untuk pengeluaran biogas.
Pengoptimuman telah dianalisis oleh Reka Bentuk Komposit Pusat (CCD). Kajian
sebelum ini telah disaringkan dengan lima parameter pemprosesan, iaitu kelajuan
pergolakan, masa tindak balas, nisbah substrat kepada inokulum, sistem proses dan jenis
substrat. Dengan ketara, ia telah dikenal pasti bahawa kelajuan pergolakan dan masa
tindak balas merupakan parameter yang paling penting. Keadaan penyaringan terbaik
yang diperolehi daripada kajian sebelum ini ialah kelajuan pergolakan dengan 120 rpm
dan masa tindak balas dengan 3 hari. Oleh yang demikian, terdapat dua faktor yang
terlibat dalam kajian penyelidikan semasa, iaitu kelajuan pergolakan antara 100 rpm
hingga 140 rpm; dan masa tindak balas antara 2 hari hingga 5 hari. Penghasilan biogas
telah dikumpulkan dengan teknik eksperimen anjakan air. Selain itu, nilai permintaan
oksigen kimia (COD) telah ditentukan dengan menggunakan spektrofotometer HACH
DR5000 dengan bantuan COD penghadaman reaktor. Akhir sekali, eksperimen telah
direka dan dianalisis oleh perisian Design Expert versi 7.0 menggunakan metodologi
permukaan tindak balas (RSM). Prestasi penghasilan biogas telah dinilai atas dasar hasil
biogas daripada COD awal dan didapati dari 0.49 untuk 4.37 mL/g COD. Model
kuadratik telah dipasang dengan baik (R-kuasa dua> 0.80) dengan tahap keyakinan
yang lebih tinggi daripada 95%. Untuk eksperimen pengesahan, penghasilan biogas
optimum adalah menggunakan pergolakan: 120 rpm dan tindak balas masa: 3.3 hari. Di
bawah keadaan ini, 4.45 mL/g COD hasil biogas diperolehi. Ini diambil kira untuk
kesilapan 5.82% daripada model yang diramalkan. Adalah disyorkan untuk membina
satu kajian perintis eksperimen meningkatkan skala untuk mengoptimumkan
pengeluaran biogas di bawah keadaan optimum yang diperolehi dari kajian ini .

X
TABLE OF CONTENTS
SUPERVISOR’S DECLARATION ....................................................................... IV STUDENT’S DECLARATION ............................................................................. V Dedication .......................................................................................................... VI ACKNOWLEDGEMENT ................................................................................... VII ABSTRACT ..................................................................................................... VIII ABSTRAK ......................................................................................................... IX TABLE OF CONTENTS ...................................................................................... X
LIST OF FIGURES ............................................................................................ XII LIST OF TABLES ............................................................................................. XIII LIST OF ABBREVIATIONS ............................................................................. XIV 1 INTRODUCTION ......................................................................................... 1
1.1 Motivation and statement of problem ................................................................ 1 1.2 Objectives ........................................................................................................... 2
1.3 Scope of this research ......................................................................................... 2
1.4 Main contribution of this work .......................................................................... 3 1.5 Organisation of this thesis .................................................................................. 3
2 LITERATURE REVIEW ................................................................................ 5
2.1 Introduction to Biogas ........................................................................................ 5
2.1.1 Importance of biogas .................................................................................. 5
2.1.2 Application of Biogas .................................................................................. 6
2.2 Feedstock for biogas production ........................................................................ 6
2.2.1 Poultry Manure Wastewater ....................................................................... 7
2.2.2 Municipal Solid Waste ................................................................................ 8
2.2.3 Agricultural wastes ..................................................................................... 9
2.3 Technique used for Biogas Production ............................................................ 10
2.3.1 Hydrolysis ................................................................................................. 11
2.3.2 Acidogenesis ............................................................................................. 12
2.3.3 Acetogenesis .............................................................................................. 13
2.3.4 Methanogenesis ........................................................................................ 14
2.4 Optimization Using RSM ................................................................................. 15
2.4.1 Central Composite Design ........................................................................ 16
2.4.2 Analysis of variance (ANOVA) ................................................................. 18
2.5 Factors Affecting Biogas Production ............................................................... 19
2.5.1 Effects of Mixing ....................................................................................... 19
2.5.2 Effects of Reaction Time ........................................................................... 20
2.5.3 Effects of Ratio of Substrate to Inoculum ................................................. 21
XI
2.5.4 Effects of Reactor Mode ............................................................................ 21
2.5.5 Effects of Type of Substrate ...................................................................... 22
2.5.6 Selection of factors for optimization ......................................................... 23
3 MATERIALS AND METHODS .................................................................... 24
3.1 Overview .......................................................................................................... 24 3.2 Collection of Sample ........................................................................................ 26 3.3 Preparation of Poultry manure wastewater ...................................................... 28 3.4 Characterization and Pre-treatment of substrates ............................................. 28
3.5 Preparation of inoculum ................................................................................... 29
3.6 Preparation of Sample ...................................................................................... 29
3.7 Design of Experiment (RSM) .......................................................................... 30 3.8 Laboratory Experimental Set Up ..................................................................... 31 3.9 Chemical Oxygen Demand (COD)-Vial Method Analysis ............................. 33 3.10 Validation experimental set up ......................................................................... 34
4 RESULTS AND DISCUSSION ..................................................................... 35
4.1 Characterization of substrates .......................................................................... 35
4.2 Optimization studies with CCD ....................................................................... 37 4.3 Statistical Analysis ........................................................................................... 38
4.4 Residuals Analysis and Diagnostic Plots ......................................................... 39
4.5 Main Effect Contribution ................................................................................. 41
4.6 Interaction of factors ........................................................................................ 45 4.7 Validation Experimental Results...................................................................... 47
4.8 Comparison of Biogas Yield from other researchers ....................................... 47
5 CONCLUSION ............................................................................................ 50
5.1 Conclusion........................................................................................................ 50 5.2 Future Research Recommendation .................................................................. 51
REFERENCES ................................................................................................... 52 APPENDICES ................................................................................................... 65
XII
LIST OF FIGURES
Figure 2.1: CM production on California poultry farm (Mullens et al., 2001) .............. 7
Figure 2.2: Municipal solid waste in Malaysia in 2013 (Eckard, 2013) ....................... 8
Figure 2.3: Sugarcane bagasse (Openpr.com, 2008) .................................................. 9
Figure 2.4: Step in AD (Hamilton and Ciolcosz, 2010). .......................................... 11
Figure 2.5: Common methanogenic bacteria in methane formation process (Eggeling et
al., 1986). .......................................................................................................... 15
Figure 2.6: Response surface plot. ........................................................................ 16
Figure 2.7: Central composite designs for the optimization of: (a) two variables and (b)
three variables. (●) Points of factorial design, (○) axial points and (□) central point. .. 17
Figure 3.1: Schematic process flow of the experiment............................................. 25
Figure 3.2: Chicken manure sample collection sites. ............................................... 26
Figure 3.3: Soil sample collection sites for pre-treatment purpose. ........................... 27
Figure 3.4: Soil sample collection sites for inoculum purpose. ................................. 27
Figure 3.5: Laboratory experimental set up. ........................................................... 32
Figure 3.6: Spectrophotometer HACH DR5000. .................................................... 33
Figure 3.7: COD digestion reactor HACH DRB200. ............................................... 34
Figure 4.1: Normal probability plot of residuals for biogas yield data. ...................... 40
Figure 4.2: Residuals versus predicted response plot for biogas yield data. ............... 41
Figure 4.3: Contour plot graph of optimization....................................................... 43
Figure 4.4: Model graph of optimization. .............................................................. 44
Figure 4.5: RSM Perturbation plot for biogas yield. ................................................ 44
Figure 4.6: Interaction plot of agitation and reaction time on biogas yield. ................ 46
XIII
LIST OF TABLES
Table 2.1: Biogas characteristics (Grant and Marshalleck, 2008) ............................... 5
Table 2.2: Production of agricultural wastes in year 1989 (Dewi and Siagian, 1992) .... 9
Table 2.3: Theoretical Methane content of biogas. .................................................. 23
Table 3.1: Test method for characterization of poultry manure wastewater. ............... 29
Table 3.2: Independent variables involved in Central Composite Design (CCD) ........ 30
Table 3.3: Preliminary optimization design of CCD in Design Expert V7.0 software. 31
Table 3.4: Validation experiment condition ........................................................... 34
Table 4.1: Characteristics of PMW and treated PMW. ............................................ 36
Table 4.2: Result of optimization of biogas yield in CCD. ....................................... 37
Table 4.3: Result for ANOVA. ............................................................................. 39
Table 4.4: Predicted and experimental values of the optimization parameter. ............ 47
Table 4.5: Comparison of biogas yield with other researchers. ................................. 49
XIV
LIST OF ABBREVIATIONS
AD Anaerobic digestion
AN Ammoniacal Nitrogen
ANOVA Analysis of variance
ASBR Anaerobic sequencing batch reactor
BOD Biochemical Oxygen Demand
CCD Central Composite Design
CHP Combined heat and power
CM Chicken manure
COD Chemical Oxygen Demand
DF Degree of freedom
FFD Full Factorial Design
F/M Food-to-microorganism ratio
GHG Greenhouse gases
HRT Hydraulic retention time
LSD Least Significant Difference
MSW Municipal solid waste
NPK Nitrogen: Phosphorus: Potassium ratio
OHPA Obligatory Hydrogen-Producing acetogens
OLR Organic Loading Rate
PMW Poultry Manure Wastewater
PS Peat soil
RSM Response Surface Methodology
S/I Substrate to inoculum ratio
SMC Soil mixed culture
SS Suspended solid
SW Soil water
Greek
parameter number
replicate number of central point
coded factor
R2 coefficient of determination
ei residuals
yi difference between the actual individual values
1
1 INTRODUCTION
1.1 Motivation and statement of problem
Biogas, a gas mixture produced by the decomposition of organic matter in anaerobic
condition, is introduced to act as an alternative renewable energy source (Ahn et al,
2010). It contains on an average distribution of 50-70% methane, 30-40% carbon
dioxide, 1-2% nitrogen, 5-10% hydrogen, trace amounts of hydrogen sulfide and water
vapor (Grant and Marshalleck, 2008).
The annual production of poultry and livestock manure on centralized farms (216,000
pigs per year, 15,000 beef per years and up to 4 million chickens per year) in Russia
overreached 700 million m3 and led to severe environmental issues such as foul odor
problems due to high levels of ammonia, attraction of rodents and pathogenic
microorganisms, runoff of phosphorus into water source and groundwater
contamination due to nitrate leaching (Kalyuzhnyi et al., 1998; Atuanya and Aigbirior,
2002). According to the Polish Act of 10 July 2007 on fertilizers and fertilizing, the
Construction Law (Journal of Laws of 2006, No. 156, item 1118), poultry farmers are
obliged to dispose a minimum of 70% of poultry manure on farms and store the manure
in sealed containers with capacity of at least four months of fertilizer production
(Borowski et al., 2014).The utilization of poultry manure wastewater to produce biogas
via anaerobic digestion can help to resolve the overwhelmed manure in farms (Sakar et
al., 2009).
The motivation of utilization of poultry manure for anaerobic digestion (AD) instead of
other manures to produce biogas is due to its high nutrient contents (Roeper et al., 2005).
According to FFTC Annual Report 2011 (2012), the approximate ratio value of
Nitrogen: Phosphorus: Potassium (NPK) on dry basis matter of dairy cow dung is 2.19:
1.37: 0.67%; for swine is 2.91: 2.85: 1.38%; and highest for poultry which is 4.34: 4.41:
2.24%, respectively. Although poultry manure can be characterize as one of the best
organic fertilizer sources, excessive implementation may lead to severe environmental
issues (Kalyuzhnyi et al., 1998).
In addition, the AD of biomass requires lower capital and operating cost as compared to
other renewable energy sources (Rao et al., 2010). This technology having great
2
potential in pathogen levels reduction, odor regulation and fertilizer value improvement
to alleviate both economic and environmental issues (Demirer and Chen, 2005). The
end products of AD are biogas and digestate. The methane concentrations contain in
biogas yield from AD of manure or biodegradable waste can be up to 80% in volume
whereas the digestate is a moist solid bringing fertilizer values (Demirbas et al., 2011).
As a bio-renewable energy source, biogas produced can be used to generate heat and
electricity (Angelidaki and Ahring, 1997).
In order to optimize this model with a number of interrelated parameters in one time,
RSM conducted by process modeling and optimization has been introduced (Rastegar et
al., 2011). RSM is an optimization method which collects a group of mathematical and
statistical techniques to define the relationships between the response and the
independent variables. It is divided into three major stages which are preliminary
determination of independent parameters and levels, selection of experimental design,
and graphical presentation of result analysis (Ba ş and Boyacı, 2007). Lastly, the
significance of the design model will be analysed by the coefficient of determination
(R2) from the analysis of variance (ANOVA) which determine the quality of the fit of
quadratic correlations (Amani et al., 2012).
1.2 Objectives
The main objective of this study is to optimize the production of biogas from poultry
manure wastewater.
1.3 Scope of this research
Chicken manure (CM) wastewater sample will be collected from local poultry manure
farm, before the pre-treatment process using soil mixed culture for Ammonia-N removal.
Then, sample will be diluted for COD testing. The optimum conditions for the
production of biogas from poultry manure wastewater will be determined using RSM.
CCD will be applied to investigate the effects of two independent variables, namely
agitation speed (rpm) and reaction time (days). Design Expert V7.0 will be used to
design the experiment and analyse the experimental data. Spectrophotometer namely
HACH DR5000 will be used to detect the COD of CM wastewater sample. The overall
process performance will be measured by the yield of the biogas produced.
3
1.4 Main contribution of this work
The significant contribution of this research was to minimize the problem of
inappropriate poultry manure wastewater management which cause negative impacts to
the environment by foul odour transmissions, attraction of infectious microorganisms
and runoff of nutrients into water sources (Kalyuzhnyi et al., 1998; Atuanya and
Aigbirior, 2002). Besides, biogas produced from AD is utilised worldwide to supply
secure and economical energy.
In households, utilization of methane-rich biogas is initially contributed to cooking and
lighting purpose in developing countries. The production of this renewable energy
source is of household-scale common digesters with 2-10 m3 volume which can only
accommodate household energy consumption (Surendra et al., 2014).
In industry, large-scale institutional biogas plants produce and purify biogas into bio-
methane for other end-use purposes. The burning of biogas in combined heat and power
(CHP) plants can generate electricity power supply for industrial and commercial areas.
The waste heat also can be used for heating, drying or in refrigeration machines.
Moreover, biogas can be used as fuel for natural gas vehicles by the decoupling of
production and utilisation (Lagerkvist et al., 2012). The leftover digestate waste
generated from AD can be used as bio-fertilizer for crops and plants in agricultural areas
to improve the soil fertility (Zhang et al., 2007).
1.5 Organisation of this thesis
The organization structure of the thesis after introductory part was outlined as follow:
Chapter 2 provided the importance and application together with its background
description on biogas and its applications in steam production, electricity generation,
vehicle fuel and chemical production. Furthermore, this chapter delineated the potential
of poultry manure wastewater in biogas production. Next, few potential feedstock for
biogas production were reviewed. Besides, the AD technique used for biogas production
from poultry manure wastewater includes hydrolysis, acidogenesis, acetogenesis and
methanogenesis were briefly explained. Moreover, the modeling technique, RSM, used
for optimization process with the aid of CCD in Design Expert Version 7.0 was
described in detail. The mathematical analysis, ANOVA which aims to check the
4
adequacy of model proposed also being discussed in the chapter. The factors affecting
biogas production, which including agitation speed, reaction time, substrate-to-
inoculum ratio, process system and type of substrate, were discussed in details with
justification. This chapter ended with the selection of factors for optimization in this
study.
Chapter 3 showed the methodology of the research work. It included the
characterization and pre-treatment method of substrates. Besides, this chapter reviewed
on the processes flow in AD experiment executed for biogas production from poultry
manure wastewater by using RSM experimental design. In addition, COD-vial method
analysis was described in details in this chapter. Next, validation run process also was
being included in this chapter.
Chapter 4 devoted to the results data obtained from the experiment with the discussion
as well as the comparison with other researchers. Besides, the characterization and pre-
treatment results were discussed in the beginning of this chapter. The adequacy of
proposed model was proved by mathematical analysis.
Chapter 5 summarized the research works covered in the body of this thesis includes a
comprehensive summary of the findings. The thesis ended with recommendations which
forecasting future works which might be developed in this work.
5
2 LITERATURE REVIEW
2.1 Introduction to Biogas
Biogas is a combustible mix of gases produced by AD of various forms of organic
matter such as energy crops biomass (i.e., sugarcane and cassava) and waste materials
(i.e., manure and sewage). Biogas is mainly composed of methane (CH4) and carbon
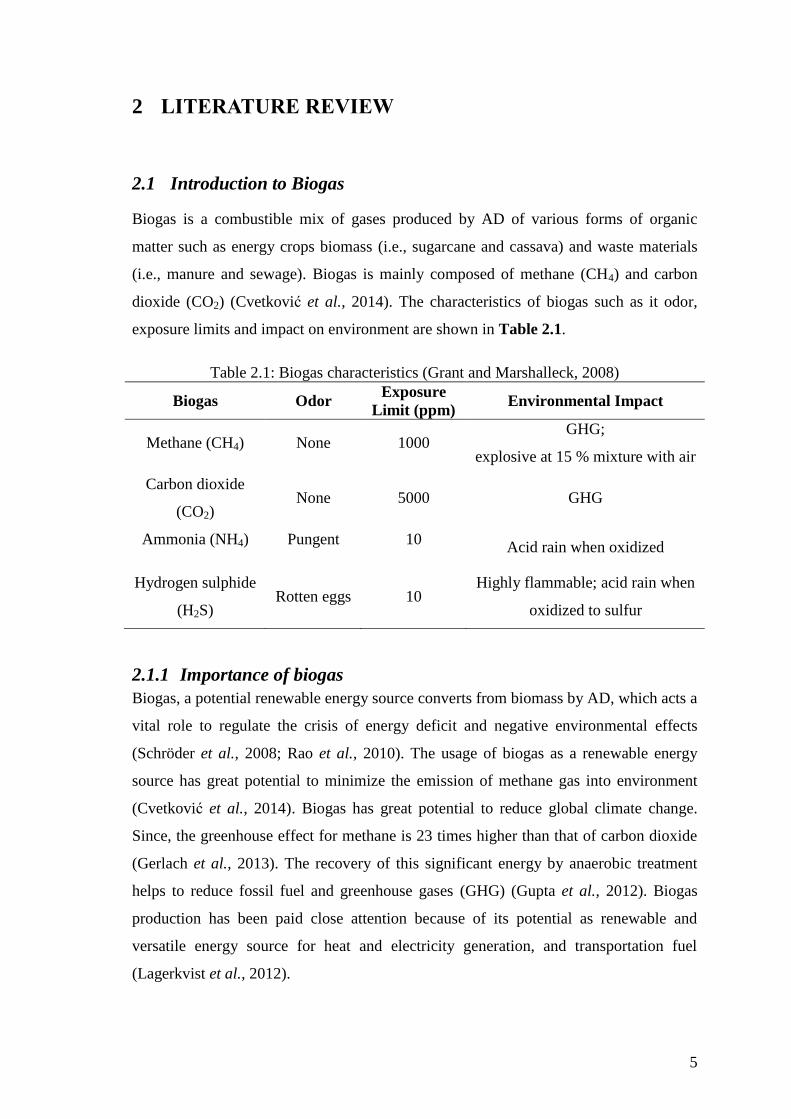
dioxide (CO2) (Cvetković et al., 2014). The characteristics of biogas such as it odor,
exposure limits and impact on environment are shown in Table 2.1.
Table 2.1: Biogas characteristics (Grant and Marshalleck, 2008)
Biogas Odor Exposure
Limit (ppm) Environmental Impact
Methane (CH4) None 1000 GHG;
explosive at 15 % mixture with air
Carbon dioxide
(CO2) None 5000 GHG
Ammonia (NH4) Pungent 10 Acid rain when oxidized
Hydrogen sulphide
(H2S) Rotten eggs 10
Highly flammable; acid rain when
oxidized to sulfur
2.1.1 Importance of biogas
Biogas, a potential renewable energy source converts from biomass by AD, which acts a
vital role to regulate the crisis of energy deficit and negative environmental effects
(Schröder et al., 2008; Rao et al., 2010). The usage of biogas as a renewable energy
source has great potential to minimize the emission of methane gas into environment
(Cvetković et al., 2014). Biogas has great potential to reduce global climate change.
Since, the greenhouse effect for methane is 23 times higher than that of carbon dioxide
(Gerlach et al., 2013). The recovery of this significant energy by anaerobic treatment
helps to reduce fossil fuel and greenhouse gases (GHG) (Gupta et al., 2012). Biogas
production has been paid close attention because of its potential as renewable and
versatile energy source for heat and electricity generation, and transportation fuel
(Lagerkvist et al., 2012).
6
2.1.2 Application of Biogas
Biogas can be utilized for four main areas viz., heat and steam production, electricity
generation, vehicle fuel, and ultimately as feedstock for chemicals production. Primarily,
the utilization of biogas in some developing countries only limited to cooking and
lighting purpose because of moderate biogas digester size (Surendra et al., 2014).
Biogas provides higher energy content in cooking than fire fueled by traditional solid
fuel resources. Lighting ranked second common usage of biogas right after cooking. In
some regions out of electrical grid connection, biogas is introduced using special gas
mantle lamps for lighting purpose (Singh and Sooch, 2004).
Besides, injection of upgraded biogas, named as biomethane, which meets stringent
quality standards into the electrical grid helps to prevent contamination of the grid. The
only biogas component that contributes as energy carrier is CH4 (Surendra et al., 2014).
The energy content for pure biomethane is approximate to be 10 kWh/m3 while that for
biogas with assumption of 60 % methane content is 6 kWh/Nm3 (Appels et al., 2008).
Biogas acts as an ideal fuel in CHP applications all around the world. The mechanism
of these combine engines is generated by the conversion of mechanical power into
electricity. Biogas can replace fossil fuels to drive natural gas vehicles after it is
upgraded to have same quality as natural gas. For example, in Pura, India, a biogas
project was implemented by the community in which a modified diesel engine and an
electrical generator were successfully powered by a biogas digester (Reddy, 2004).
2.2 Feedstock for biogas production
For biogas production from organic matter, its appropriate raw material must be suitable
for AD process. There are a variety of feedstock such as animal manure, municipal
wastewater and agricultural crops residues. The sustainability of biogas production must
consider on a few aspects include energy potential, environment, and economic
feasibility (Cvetković et al., 2014). In the following section, the review of various
feedstock was discussed.
7
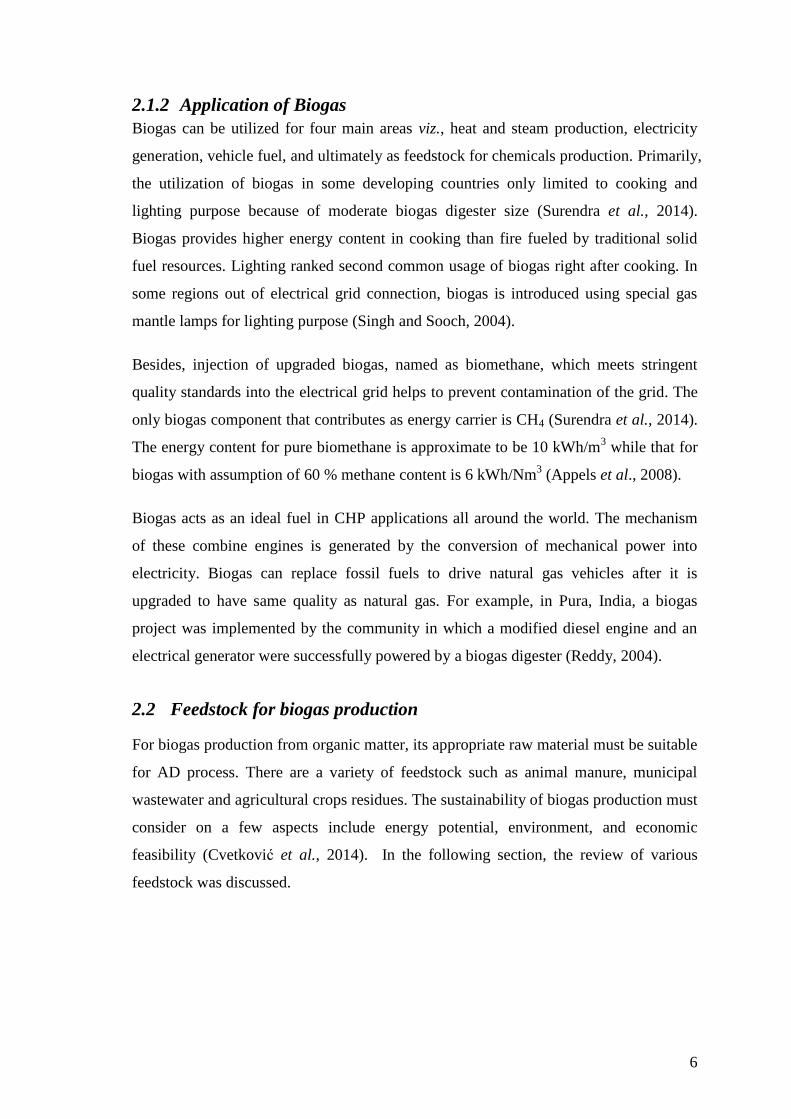
2.2.1 Poultry Manure Wastewater
Poultry manure wastewater is one of the most abundant biodegradable materials
accumulating in local poultry farming area and has good potential to produce biogas.
Generally, poultry manure includes faeces and urine excreted by chicken, which
contains high organic nutrients and has high fertilizer value on crops in agricultural
areas. The CM production in one poultry farm at California is illustrated in Figure 2.1
Figure 2.1: CM production on California poultry farm (Mullens et al., 2001)
A good management of this waste can augment high cost commercial fertilizers (Moreki
and Chiripasi, 2011). The tremendous expansion of poultry population is due to the
increasing demand for chicken products. As a side effect, the amount of poultry
excrement is also rising. An inappropriate disposal and treatment of these poultry
manure can cause spread of diseases, soil and groundwater pollution and risks the health
and environment (Roeper et al., 2005). Poultry manure is mainly categorized in solid,
slurry and wastewater. Collection of CM is commonly the mixture of solid form and
other chicken production residues (Haga, 2001).
Poultry manure is richer in biodegradable organic nutrient than other animal wastes
(Hill, 1983; Morris et al., 1975). The AD of fresh poultry manure will decrease the
process efficiency due to ammonia accumulation in high solid content, therefore the
treatment of poultry manure in its semi-solid state has been experimented (Bujoczek et
al., 2000).
8
2.2.2 Municipal Solid Waste
Municipal solid waste (MSW) is waste collected mainly from households, non-
hazardous solid waste from commerce and trade, offices and institutional establishment
including hospitals, wastes from market and yard, and even sweepings from streets
(Ogwueleka, 2009). Composition and quantity of MSW can be determined from the
living habits and standard of community. The quantification unit used for MSW is
expressed in kg/person/year, which indicating the waste generated per person in a year
(Cvetković et al., 2014).
Kiely (1997) defined solid wastes to include activities from human and animal and also
liquid wastes such as paints, old medicines and spent oils. This shows the possibility of
intermixing between both solid and liquid wastes. However, the study found the MSW
as largely static which emerged as one of the greatest challenges in its handling and
management. A proper disposal management can prevent many environmental problems
such as unpleasant odours and blockage of water drain ways which might further lead to
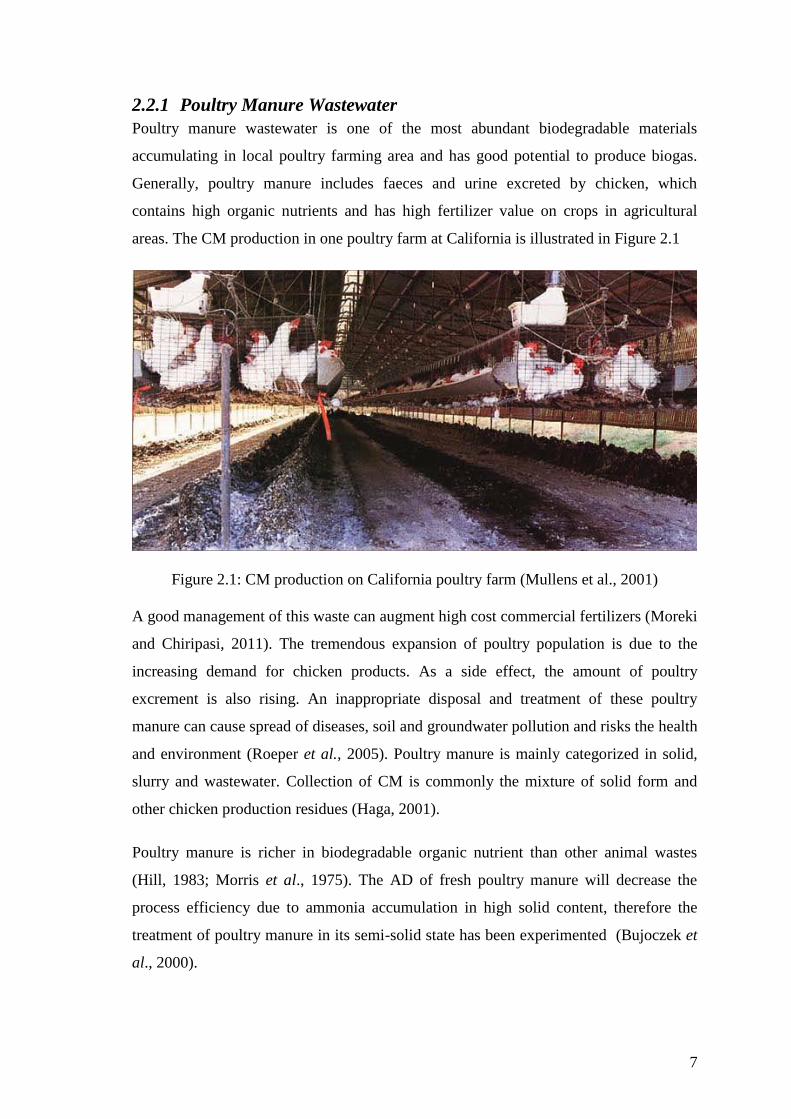
pollution and flooding respectively (Igoni et el., 2008). The example of one disposal
area of MSW in Malaysia is shown in Figure 2.2.
Figure 2.2: Municipal solid waste in Malaysia in 2013 (Eckard, 2013)
Conventionally, MSW disposal has been mainly managed by land filling. However, the
anthropogenic methane emission from the landfills waste has been identified as
essential contributor to global warming (Stocker et al., 2013). AD of MSW has been
9
emphasized as one of the acceptable treatment to reduce and stabilize solid waste
volume for biogas production (Stroot et al., 2001).
2.2.3 Agricultural wastes
Agricultural waste describes both organic and non-organic wastes produce on an
agriculture farm through various farming activities. Horticulture, dairy farming, seed
growing, grazing land, livestock breeding, nursery plots and woodlands are among the
examples of agricultural activities (Ashworth and Azevedo, 2009). Agricultural wastes
such as crop residues, wood and other plant residues are highly energy rich and
inexpensive for fermentation. Some of the famous substrate used for AD to produce
biogas includes sugarcane bagasse, rice straw, cassava waste, palm oil mill waste, and
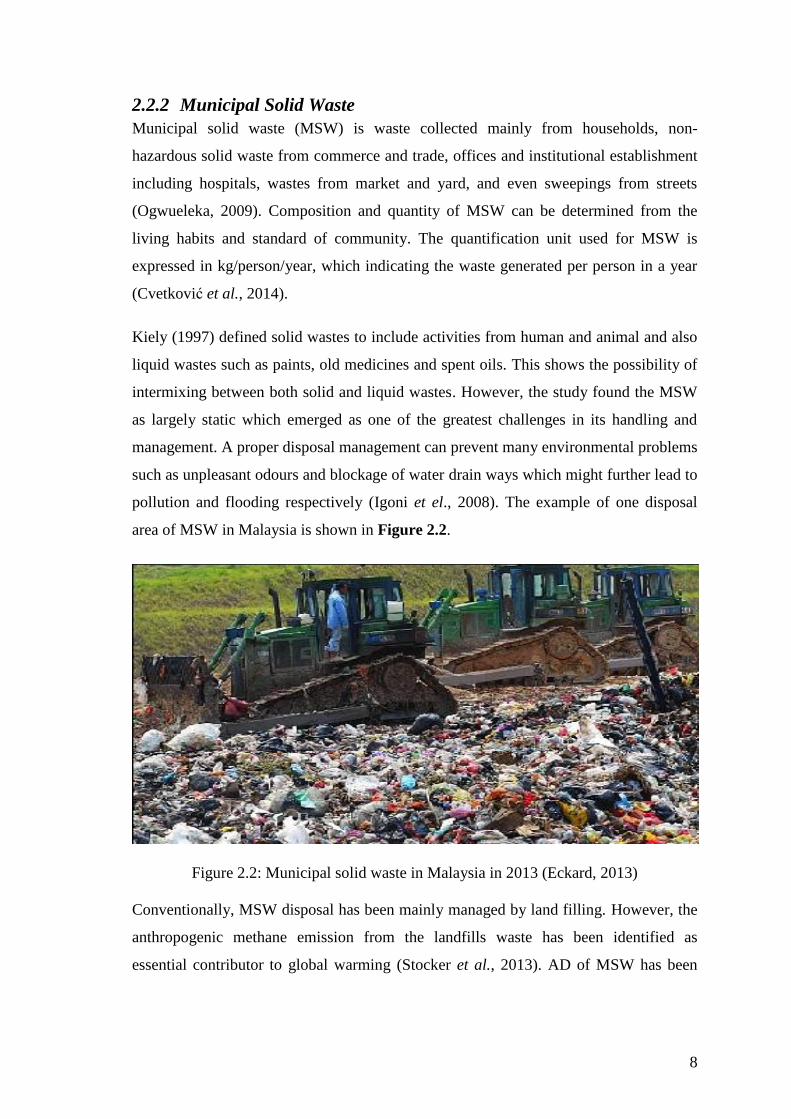
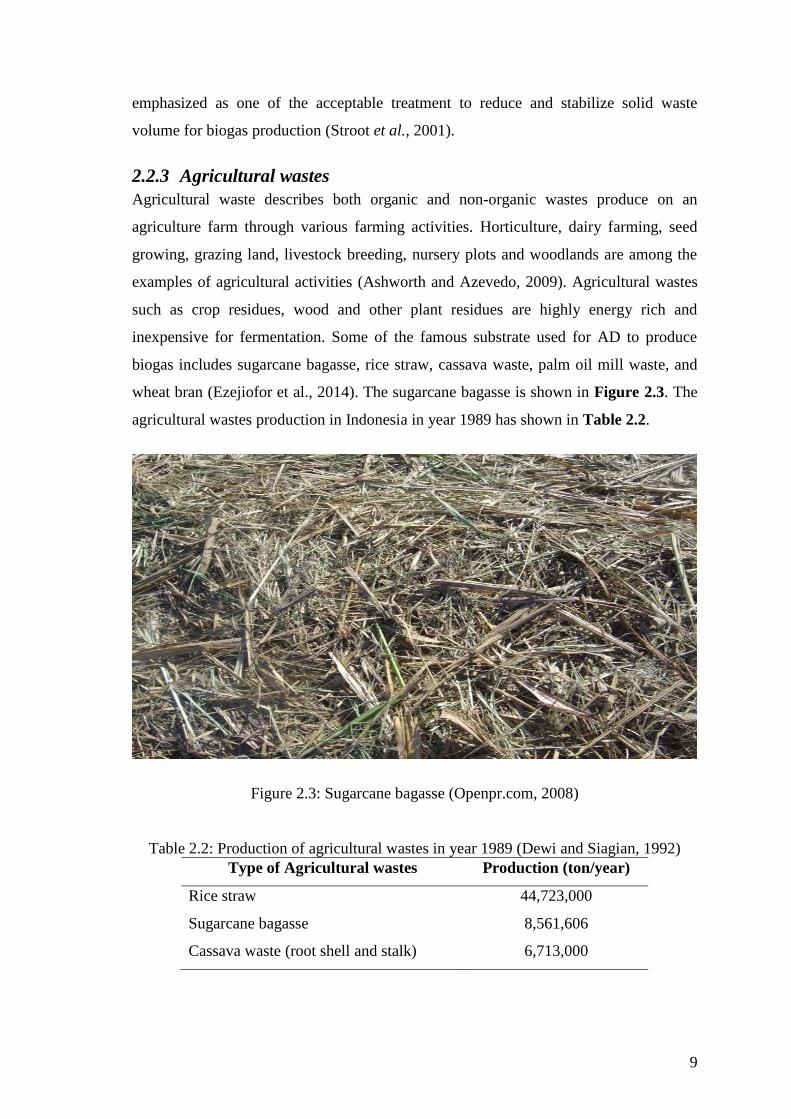
wheat bran (Ezejiofor et al., 2014). The sugarcane bagasse is shown in Figure 2.3. The
agricultural wastes production in Indonesia in year 1989 has shown in Table 2.2.
Figure 2.3: Sugarcane bagasse (Openpr.com, 2008)
Table 2.2: Production of agricultural wastes in year 1989 (Dewi and Siagian, 1992)
Type of Agricultural wastes Production (ton/year)
Rice straw 44,723,000
Sugarcane bagasse 8,561,606
Cassava waste (root shell and stalk) 6,713,000
10
The potentiality of agricultural wastes for biogas production can reduce environmental
pollution and also minimize the utilization of commercial energy source such as
kerosene and firewood. These can be proved via some examples of the process
applications for biogas production. Firstly is the cassava waste treatment to reduce
polluted river near tapioca starch industry. Secondly, the utilization of water hyacinth as
substrate for AD can solve Curug dam problem in Indonesia (Ishizuka et al., 2010).
The biogas production by AD of agricultural wastes is done via the synergistic action of
a consortium of hydrogenic, acidogenic, acetogenic and methanogenic bacteria
(Amigun et al., 2008). Although agricultural wastes are one of the potential feedstock
for AD to produce biogas, but it still possesses some limitations. The main problem
with AD of agricultural wastes is that it contains high cellulose levels, hemicellulose,
starch, lipids and proteins (Oliveira and Franca, 2009). This speciality and complexity
structure makes cellulose resistant to both biological and chemical treatments
(Taherzadeh and Karimi, 2008). The lignocelluloses degradation makes the hydrolysis
stage slower and rate limiting. Therefore, agricultural wastes substrate needs to practice
chemically or mechanically pre-treatment to ease the accessibility for microbial growth
in AD process (Ezejiofor et al., 2014).
2.3 Technique used for Biogas Production
AD is one of the advantageous and beneficial processes used for biogas production from
poultry manure (Sakar et al., 2009). Generally, the biogas production from AD using
the concept of biomethanation of animal manure yield principal gases viz., methane and
carbon dioxide (Rao et al., 2010). The biogas yield will depends on substrate mix and
several operating conditions such as incubation time and temperature (Olsson and
Fallde, 2014). Biogas production can reduce nuisance odors in agricultural farms
(Schröder et al., 2008). Beside the function of stabilization and deodorization of poultry
manure, AD also turns poultry manure, which initially acts as natural fertilizers into
easy-disposable organic fertilizers (Borowski et al., 2014). Biogas produced from AD
can be utilized as cooking gas and fuel, the digestate become bio-fertilizer and the
sludge component can used as a soil conditioner after dried (Zhang et al., 2007). AD is
a natural established bioconversion technology which follows a sequence of reactions
which are hydrolysis, acidogenesis, acetogenesis and methanogenesis (Poh and Chong,
11
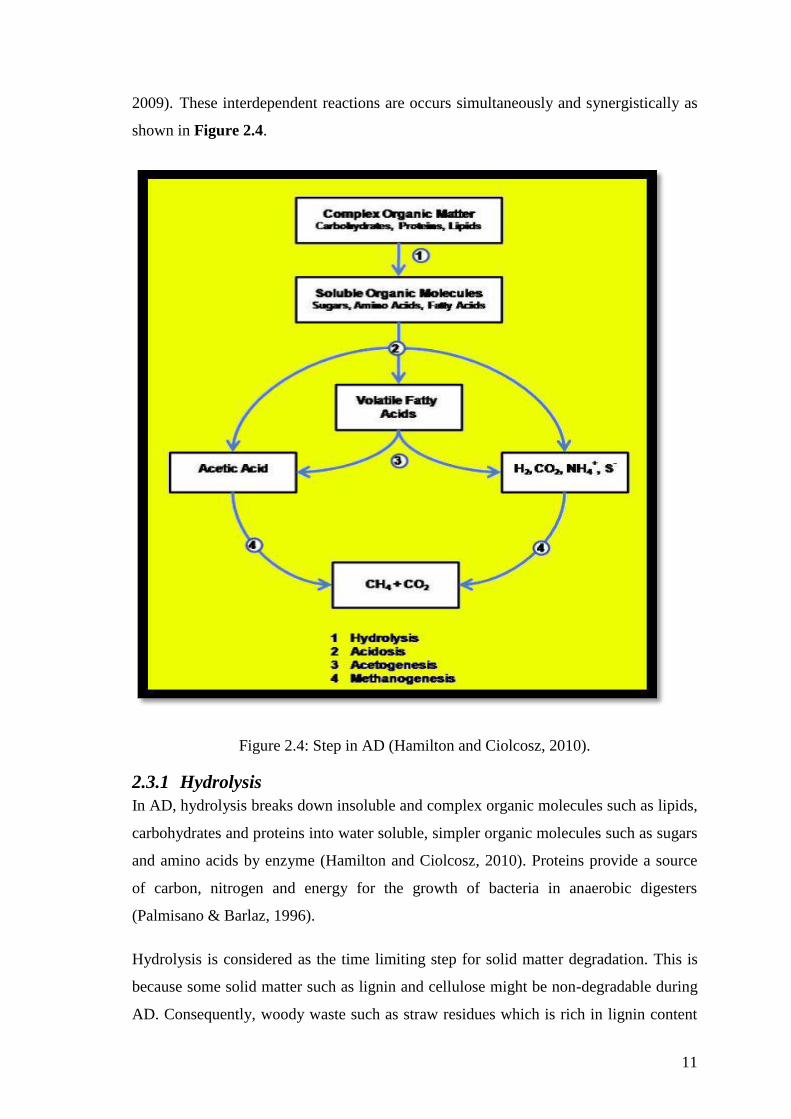
2009). These interdependent reactions are occurs simultaneously and synergistically as
shown in Figure 2.4.
Figure 2.4: Step in AD (Hamilton and Ciolcosz, 2010).
2.3.1 Hydrolysis
In AD, hydrolysis breaks down insoluble and complex organic molecules such as lipids,
carbohydrates and proteins into water soluble, simpler organic molecules such as sugars
and amino acids by enzyme (Hamilton and Ciolcosz, 2010). Proteins provide a source
of carbon, nitrogen and energy for the growth of bacteria in anaerobic digesters
(Palmisano & Barlaz, 1996).
Hydrolysis is considered as the time limiting step for solid matter degradation. This is
because some solid matter such as lignin and cellulose might be non-degradable during
AD. Consequently, woody waste such as straw residues which is rich in lignin content
12
is not an ideal feedstock to undergo AD process as its phenolic groups might be
inhibitory to the enzymes (Arsova, 2010). The other way round, acid development will
be fastening up if major content of easily degradable carbohydrates like glycogen or
starch in the substrate.
In this stage, the enzymes involved such as lipases, cellulase and protease are produced
by fermentative and hydrolytic bacteria (Arsova, 2010). These bacteria play important
role to depolymerize organic matter towards their monomer compounds. Basically,
extracellular lipases and phospholipases take the role to hydrolyze fats into glycerine,
alcohols and fatty acids (Dornack, 2012). Besides, proteolytic enzymes produced by
anaerobic bacteria are responsible to hydrolyze proteins to peptides, amino acids and
carbon dioxide (Palmisano & Barlaz, 1996).
An example of hydrolysis break down of organic waste into simple sugar, in this case
glucose is shown in equation (2.1) in which n indicates the stoichiometric coefficient of
respective compounds. On the other hand, degradation of proteins into their constituent
amino acid and lipids into long chain fatty acids are occur under similar reactions.
[C6H10O4]n+ 2nH2O → n[C6H12O6] + nH2 (2.1)
2.3.2 Acidogenesis
Acidogenesis then convert soluble organic molecules into volatile fatty acids. The
anaerobic fermentation happens by the combination of hydrolysis and acidogenesis
(Hamilton and Ciolcosz, 2010). In this stage, the acid formers microorganisms
transform hydrolytic products such as sugars, amino acids, alcohols and fatty acids into
simple organic acids. The fermentation products varying by the concentration of
intermediary bound hydrogen. A high pH values lead to reduced end products such as
propionic acid and butyric acid whereas a low pH values lead to an intensified
production of acetate, carbon dioxide and hydrogen (Palmisano & Barlaz, 1996).
Equation (2.2) and (2.3) shows the examples of typical acidogenesis reactions, where
glucose is transformed into ethanol and propionic acid, respectively (Ostrem, 2004).
Conversion of glucose to ethanol
C6H12O6 ↔ 2 CH3CH2OH + 2CO2 (2.2)
13
Conversion of glucose to propionic acid
C6H12O6 + 2H2 ↔ 2CH3CH2COOH + 2 H2O (2.3)
2.3.3 Acetogenesis
After that, in acetogenesis, the intermediate volatile fatty acids are further converted
into acetate and a gas composition of hydrogen, carbon dioxide, ammonia and hydrogen
sulfide by acetogenic bacteria (Hamilton and Ciolcosz, 2010). Basically, this pathway
of single acid forming stage aims to reduce biochemical oxygen demand (BOD) and
COD values. Generally, high pH values inhibit the growth rate of acetogenic bacteria.
Acetogenic bacteria are also known as obligatory hydrogen-producing acetogens
(OHPA) as they exhibit a metabolism of proton reduction and are mandatory dependent
on hydrogen removal (Arsova, 2010). Therefore, there is a close special symbiosis
between acetogenesis and methanogenesis to ensure the direct utilization of the
hydrogen developed.
Practically, some fermentation products such as alcohols, propionic acid and butyric
acid formed within this stage as a mechanism to remove accumulating electrons and
hydrogen. In this stage, some of the important reactions for the formation of acetic acid
are as follow, which are mainly from the conversion of glucose (equation 2.4), ethanol
(equation 2.5) and propionic acid (equation 2.6).
Conversion of glucose to acetic acid
C6H12O6 + 2H2O ↔ 2CH3COOH + 2CO2 + 4H2 (2.4)
Conversion of ethanol to acetic acid
CH3CH2OH + H2O ↔ CH3COOH + 2H2 (2.5)
Conversion of propionic acid to acetic acid
CH3CH2COOH + 2H2O ↔ CH3COOH + CO2 + 3H2 (2.6)
Hydrogen plays a crucial intermediary role in acetogenesis as all the acids conversion
happen under low hydrogen partial pressure condition. The thermodynamic feasibility
of acetogenesis is sustained by the presence of hydrogen scavenging bacteria
(hydrogenotrophs) which lowering the partial pressure of hydrogen (Ostrem, 2004).
14
Hydrogenotrophs are pH sensitive bacteria. Whenever the conditions within the
anaerobic digester result in a pH drop, hydrogen will be stored within propionic acid by
ecology response. This reversal of the reaction to achieve equilibrium can be explained
in Le Chatelier’s principle.
The health condition of an anaerobic digester is indicated by its low hydrogen
concentration. This is also the reason in which hydrogen only appears as a trace
component in biogas. Acetogenesis along with acidogenesis represents the transition
from soluble organic molecules to the methanogenic substrate.
2.3.4 Methanogenesis
In last stage which is methanogenesis, then substrate for methanogenic microorganisms
release biogas, which include methane and carbon dioxide as principal products
(Hamilton and Ciolcosz, 2010). Methane, the main component in biogas, is produced
through a syntrophic relationship between acetate-oxidizing bacteria and hydrogen-
utilizing methanogens (Arsova, 2010). Acetotrophic or acetoclastic methanogens
convert acetic acids to methane and carbon dioxide via decarboxylation of acetic acid as
shown in equation (2.7). The second type of anaerobic archaea is called
hydrogenotrophic or hydrolytic methanogens reduce carbon dioxide and hydrogen into
methane and water using H2 as electron donor as shown in equation (2.8) (O’Flaherty et
al., 2006; Hamilton and Ciolcosz, 2010).
Acetic acid cleavage
CH3COOH → CH4 + CO2 (2.7)
Carbon dioxide reduction
CO2 + 4H2 → CH4 + 2H2O (2.8)
Ordinarily, methanogenesis process occurs naturally in manures, agricultural fields and
aquatic sediments, and plays a vital role for the carbon cycle to sustain the ecosystem
(Arsova, 2010). Stabilization is said to be achieved when methane and carbon dioxide
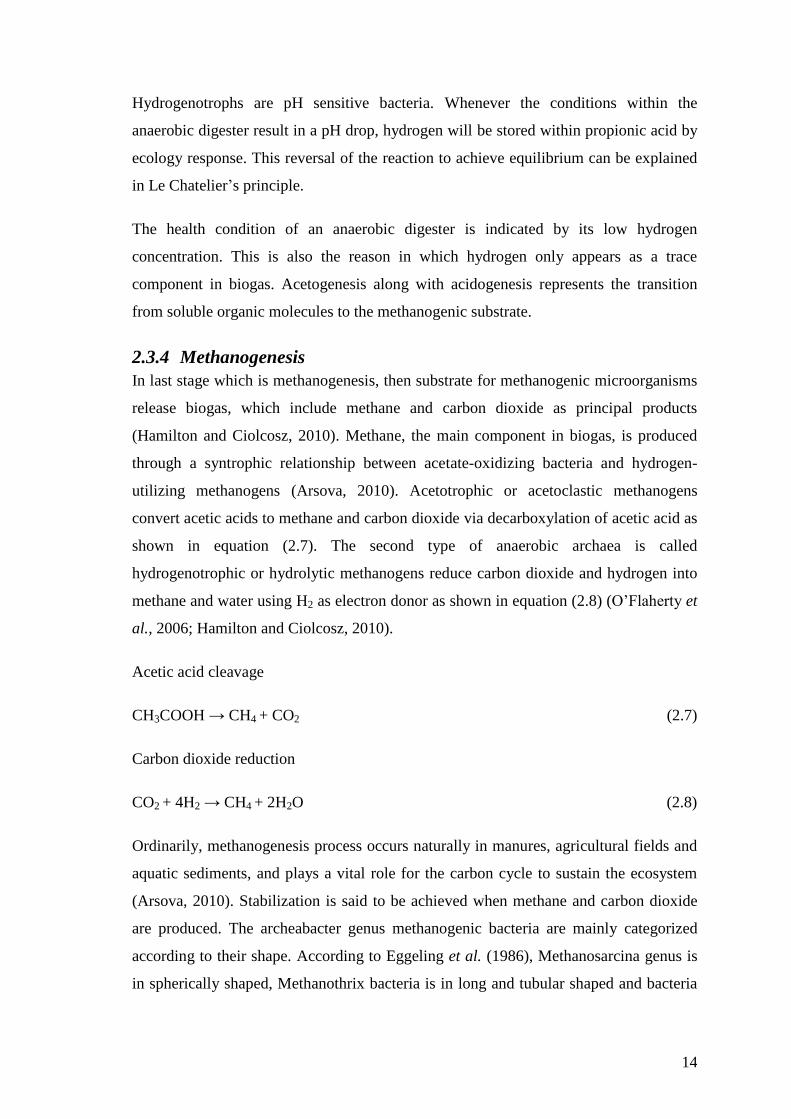
are produced. The archeabacter genus methanogenic bacteria are mainly categorized
according to their shape. According to Eggeling et al. (1986), Methanosarcina genus is
in spherically shaped, Methanothrix bacteria is in long and tubular shaped and bacteria
15
that catabolize furfural and sulfates appeared as short and curved rods as illustrated in
Figure 2.5.
Figure 2.5: Common methanogenic bacteria in methane formation process (Eggeling et
al., 1986).
2.4 Optimization Using RSM
RSM is a widely used modelling technique functioned to develop, improve and
optimize the response variable in the statistical design of experiments (Ba ş and Boyacı,
2007). RSM is applicable when a response of interest is influenced by several
parameters or variables and the objective is to optimize this response. It can be
expressed as
( ) (2.9)
where the response y depends on independent variables and , and the experimental
error denoted as .
16
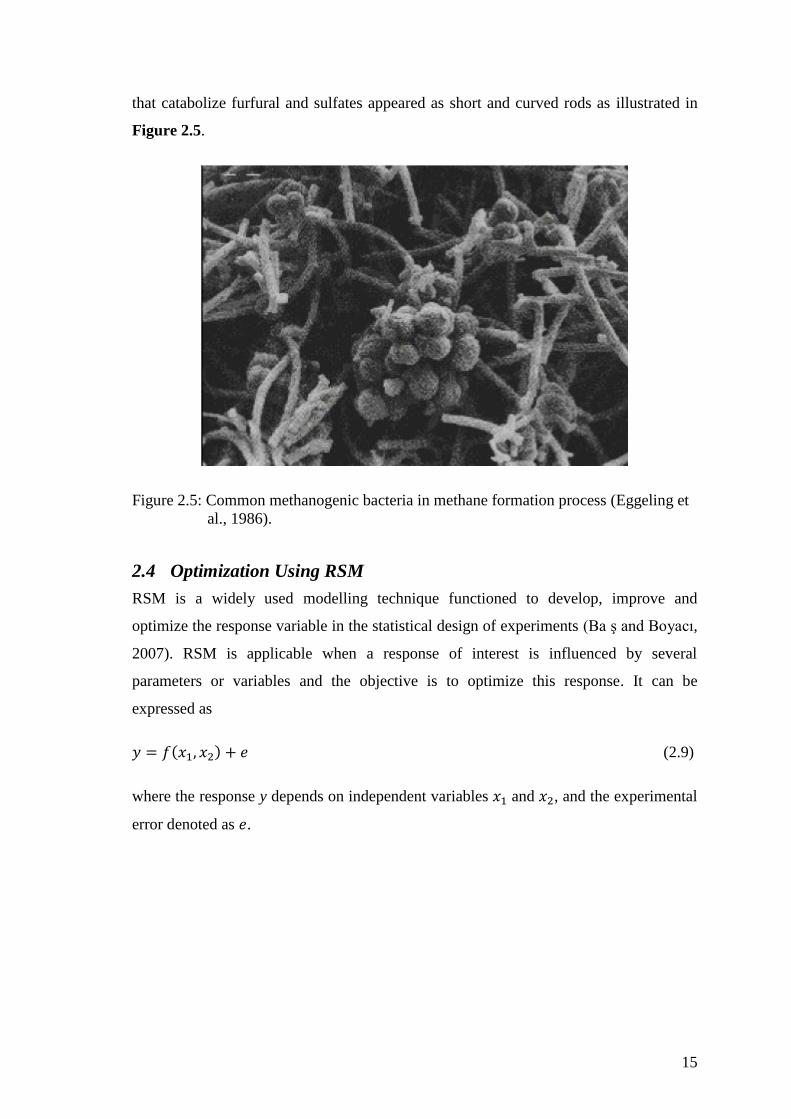
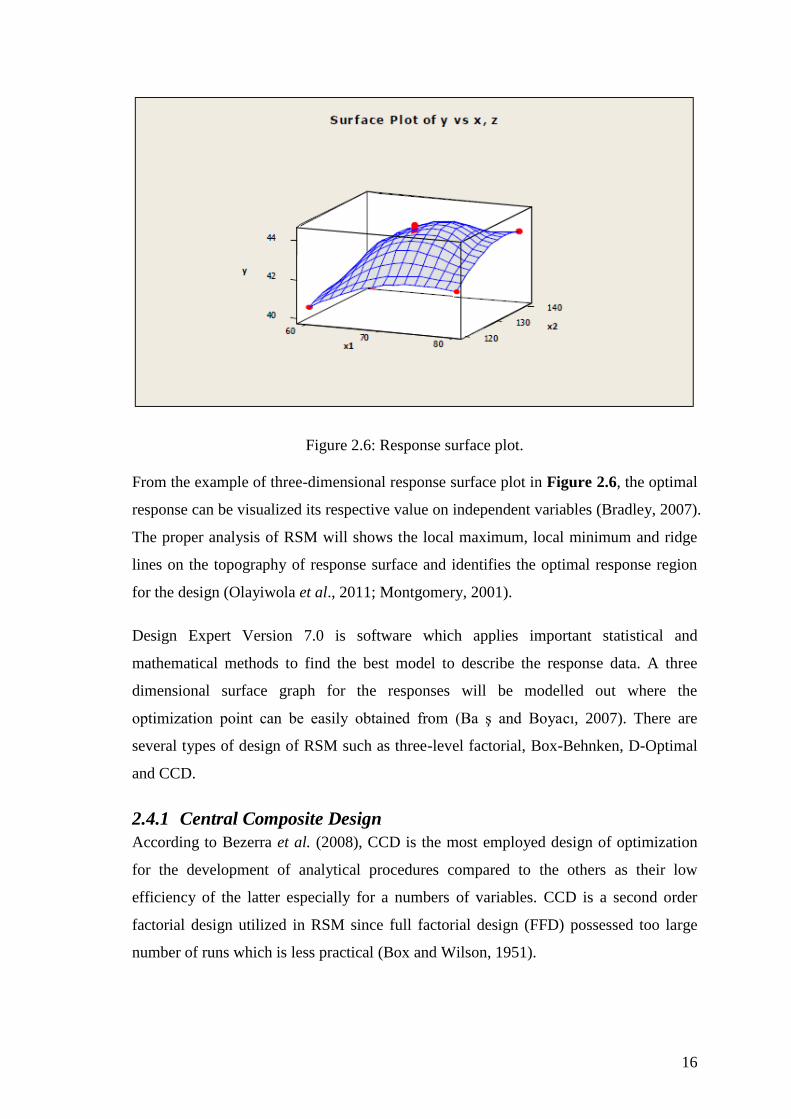
Figure 2.6: Response surface plot.
From the example of three-dimensional response surface plot in Figure 2.6, the optimal
response can be visualized its respective value on independent variables (Bradley, 2007).
The proper analysis of RSM will shows the local maximum, local minimum and ridge
lines on the topography of response surface and identifies the optimal response region
for the design (Olayiwola et al., 2011; Montgomery, 2001).
Design Expert Version 7.0 is software which applies important statistical and
mathematical methods to find the best model to describe the response data. A three
dimensional surface graph for the responses will be modelled out where the
optimization point can be easily obtained from (Ba ş and Boyacı, 2007). There are
several types of design of RSM such as three-level factorial, Box-Behnken, D-Optimal
and CCD.
2.4.1 Central Composite Design
According to Bezerra et al. (2008), CCD is the most employed design of optimization
for the development of analytical procedures compared to the others as their low
efficiency of the latter especially for a numbers of variables. CCD is a second order
factorial design utilized in RSM since full factorial design (FFD) possessed too large
number of runs which is less practical (Box and Wilson, 1951).