production efficiency sources of …ageconsearch.umn.edu/bitstream/126693/2/magalhaes.pdfproduction...
TRANSCRIPT

PRODUCTION EFFICIENCY SOURCES OF SETTLERS UNDER BRAZILIAN LAND REFORM IN NORTHEAST REGION
Marcelo Marques de Magalhães Professor, Universidade Estadual Paulista (UNESP), Campus Tupã, Av. Domingos da Costa Lopes 780,
Tupã-‐SP, CEP 17602-‐496, Brazil. Email: [email protected].
José Maria Ferreira Jardim da Silveira Professor, Universidade Estadual de Campinas (UNICAMP), Instituto de Economia, R. Pitagoras 353,
Campinas-‐SP, CEP 13083-‐857, Brazil. Email: [email protected].
Maristela Simões do Carmo Professor, Universidade Estadual Paulista (UNESP), Faculdade de Ciências Agronômicas,
Fazenda Lageado, Botucatu-‐SP, CEP 18600-‐000, Brazil. Email: [email protected].
Guilherme Berse Rodrigues Lambais MSc. Candidate, Economic Development, Universidade Estadual de Campinas (UNICAMP), Instituto de Economia, R. Pitagoras 353, Campinas-‐SP, CEP 13083-‐857, Brazil. Email: [email protected].
Selected Poster prepared for presentation at the International Association of Agricultural
Economists (IAAE) Triennial Conference, Foz do Iguaçu, Brazil, 18-‐24 August, 2012.
Copyright 2012 by Marcelo Marques de Magalhães, José Maria Ferreira Jardim da Silveira, Maristela Simões do Carmo, Guilherme Berse Rodrigues Lambais. All rights reserved. Readers may make verbatim copies of this document for non-‐commercial purposes by any means, provided that this copyright notice appears on all such copies.

2
PRODUCTION EFFICIENCY SOURCES OF SETTLERS UNDER
BRAZILIAN LAND REFORM IN NORTHEAST REGION
Marcelo Marques de Magalhães1 José Maria Ferreira Jardim da Silveira2
Maristela Simões do Carmo3 Guilherme Berse Rodrigues Lambais4
SUMMARY: The model of Brazilian land reform is based on settlements of families without
land, in unoccupied public lands, or by expropriation of unproductive estates. The market
assisted land reform programs are considered complementary instruments of land reform.
They are used to provide credit for land purchase by groups of landless farmers directly from
the land market. The aim of this paper was to measure the profit efficiency, considering two
different mechanisms of land access. In this paper, analysis of profit efficiency was performed
using the stochastic frontier analysis. The frontier of production was estimated based on
Cobb-Douglas production function. The data set represents the states: Bahia, Ceará,
Maranhão, Pernambuco and the north region of Minas Gerais. The overall efficiency
estimates were 0.3163. The efficiency estimates were 0.3678 for the farmers assigned by
expropriation, and 0.3537 for the farmers with market land access. The production showed
decreasing gains with the major partial elasticity for land. The positive efficiency effect
sources are: off-farm labor, collective labor, location in superior soil class county areas,
location in Maranhão and Ceará states, age of head of household, crops with irrigation or
flood, and use of machinery. The negative efficiency effect sources are: outer incomes and
family consumption of its own production.
Keywords: Land Reform, Stochastic Frontier Analysis, Production Efficiency.
1 Professor, Universidade Estadual Paulista, Campus Experimental de Tupã. Email: [email protected]. 2 Professor, Universidade Estadual de Campinas, Instituto de Economia. Email: [email protected]. 3 Professor, Universidade Estadual Paulista, Faculdade de Ciências Agronômicas. Email: [email protected]. 4 MSc. Candidate, Economic Development, Universidade Estadual de Campinas, Instituto de Economia. Email: [email protected].

3
PRODUCTION EFFICIENCY SOURCES OF SETTLERS UNDER
BRAZILIAN LAND REFORM IN NORTHEAST REGION
1 INTRODUCTION
Land reform remains a current topic in light of the tensions caused by the
concentration of land and lack of alternative employment for the population that still lives in
rural areas and depends on land access and working the land to survive. According to IBGE
(2006) data, approximately 13% of Brazilian rural establishments belong to land reform
settlements. The challenge is to turn land access into new job opportunities and new
possibilities for overcoming rural poverty, based on the best use of local capacity and
potential of rural communities. Land reform can increase economic efficiency by transferring
unused and unproductive lands to households with potential to put these resources into the
productive sphere.
The Northeast region of Brazil has the highest concentration of rural poverty in the
country, and is therefore a target of various programs of land redistribution, as the National
Institute of Colonization and Land Reform (INCRA), the National Program for Land Credit
(PNCF), and its pilot program, Cédula da Terra. There are municipalities like Crateús in the
hot semi-arid region of Ceará, with 37 land reform settlements, which justifies the results
reached by many authors, that this type of productive organization can cause a huge impact on
certain areas (Leite et al., 2004). It is a region where small-scale production undergoes a
double challenge: 1) create conditions to minimize the negative effect of climate on
production, 2) allow markets that emphasize the skills inherent in small production, or
strengthening marketing channels, making use of socioeconomic and cultural aspects of
family farming (Buainain et al., 2000).
Land reform policy in Brazil is performed by two complementary mechanisms of
access to land. The first refers to the expropriation of rural properties, which is the official
policy of agrarian reform in Brazil. The second refers to market assisted land access, which is
considered a land reform tool complementary to land redistribution.
The National Land Reform Program (PNRA) is based on the mechanism of
expropriation of unproductive estates for the settlement of landless families or small farmers,
in order to enforce the constitutional provision of the social function of land. The legislation

4
ensures compensation to the expropriated owners for the value of real estate. The families
settled on the land receive a donation for installation, housing, and access to credit via the
National Program for Family Agriculture (PRONAF) at subsidized rates and special
conditions. The National Institute of Colonization and Agrarian Reform (INCRA) is
responsible for the selection of the beneficiaries, setting boundaries of individual plots, and
deployment of productive and social infrastructure of the settlement (roads, schools, health
centers, etc.) Beneficiaries are considered emancipated after the implementation of
infrastructure, when the settlers are able to support themselves (Buainain et al., 2000).
Mechanisms of market assisted land access, including the Cédula da Terra Program,
provide credit to groups of landless farmers, to negotiate and acquire, together in associations,
their own properties. The beneficiaries are empowered to make decisions on the use of
funding resources, the strategy of distributing lots amongst the families, the use of individual
parcels and common lands; which state governments supervise. The state government
guarantees the settlers' ownership of the property, technical assistance for productive projects
and community investments. The land is acquired by a credit transaction, with payment terms
of 20 years, and minimum grace period of three years, which may be extended depending on
the regional agro-climatic constraints (Buainain et al., 2000).
To build a policy that could reduce rural poverty, access to land should be combined
with availability of resources and infrastructure, which is necessary due to the relations of
complementarity and synergy of productive assets, especially for small and under capitalized
farmers (De Janvry and Sadoulet, 1995; Alcântara, 2010).
The characteristics of property rights over the distributed assets are important to the
governance structure, which in turn affects the incentives for the development of productive
activities with efficiency and sustainability (Hart, 1997; Bardhan et al., 2001, Banerjee et al.,
2001). Having overcome the restrictions of land access, there is then the need for productive
development to overcome conditions of poverty. This leads to the discussion of performance
and production efficiency (Deaton, 1997).
The objective of this paper is to estimate the efficiency according to the mechanisms
of land access and evaluate the overall effect of sources of production efficiency of
beneficiary families of land reform. The dataset covered the states of Maranhão, Ceará,
Pernambuco, Bahia and northern Minas Gerais area. The analysis was performed using a
stochastic frontier analysis of production efficiency under the Cobb-Douglas functional form.
5
The next section of this paper presents the econometric specification of the stochastic
frontier model. The empirical application of the model is presented in section 3, which has the
variables used for the production factors, and the variables used to explain inefficiency
measurement. In section 4 we present a descriptive analysis of socioeconomic characteristics
beneficiaries for both mechanisms of land access. It is followed by a discussion of the results,
pointing out the main sources that affect production efficiency. The paper ends with a
conclusion about the expected differential effects, depending on the mechanisms of access to
land.
2 MODEL SPECIFICATION
The measurement of productive efficiency proposed by Farrell (1957) is considered
as a ratio between observed production and potential production obtained by optimizing
inputs and outputs. This optimization can be achieved by maximizing the production given a
quantity of inputs, or by minimizing the inputs given an observed output level. It may even be
the result of a combination of both.
Productive efficiency incorporates two components. The technical component refers
to the physical quantities of observed inputs and outputs. The allocative component refers to
the effect of prices on the combination of proportions of inputs and outputs. Allocative
efficiency refers to the ability of combining inputs and outputs in optimal proportions under
the prevailing prices. Productive efficiency refers to a situation in which technical and
allocative efficiencies are combined (Battese and Coelli, 1995; De Janvry and Sadoulet, 1995;
Vicente, 2002).
Stochastic frontier analysis was selected because it allows the comparison of
production efficiency among firms at a given point in time, considering both the estimated
differential efficiency and the random (residual) error, without the need to assume that firms
were operating at full technical efficiency.
The model of stochastic frontier production of Battese and Coelli (1995) was applied
only to one moment in time, which is a particular specification of the general model used for
panel studies. It can be specified as:
Yi = xiβ+ Vi −Ui( ) , i = 1,…,N (1)
where i refers to the ith production unity (firm);

6
Yi is the logarithm of output;
xi is the vector (1 x k) of the logarithm of inputs (land, labor and capital);
β= β0 ,β1,…,βK−1( ) is the vector (k x 1) of unknown parameters;
Vi represents the residual, considered independent and identically distributed (i.i.d.)
with distribution Vi~N(0,σV2 ) and;
Ui represents technical inefficiency and has distribution Ui~N+(mi,σU
2 ) , where
mi = ziδ and zi is the vector of variables representing the characteristics of the firm that can
influence the productive inefficiency (δ).
The maximum likelihood function is explained as a function of the variance of the
parameters of the model σ 2 =σU2 +σV
2 , in which the portion of variance that explains
inefficiency is defined as γ =σU2 (σU
2 +σV2 ) . The model yields a better fit when γ approaches
1, because most of the deviations of the frontier are explained by the component of technical
inefficiency (Ui).
A common criticism about stochastic frontier analysis is that there is not a prior
justification for assuming a particular distribution form for technical inefficiency effects (Ui).
Distribution problems are observed under zero-mode distributions like half-normal form.
Zero-mode distribution implies a bias toward low inefficiency levels, as most part of Ui tends
to be near zero (Coelli et al., 1998). In applying this model, it is assumed truncated-normal
distribution for the technical efficiency effects, which is a generalization of the half-normal
distribution (Stevenson, 1980). Truncated-normal distribution alleviates the problems of zero-
mode distributions, because it allows for a wider range of distributional forms, including non-
zero mode forms. This specification corresponds to Model 2 of Frontier 4.1 software, used to
estimate the parameters of the model (Coelli, 1996; Coelli and Henningsen, 2011).
In equation (1), Ui is the measure of inefficiency. The goal is to explain the model
efficiency (TEi) as a random component, which is determined by the ratio between the
observed production and the potential production frontier for each firm (TEi = Yi Yi* ). The
estimated technical efficiency is given by:
TEi = f (xi;β).exp(Vi −Ui ) [ f (xi;β).exp(Vi )]= exp(−Ui ) (2)
Stochastic frontiers are usually estimated on Cobb-Douglas functional form, but alternative
functional forms, like the quadratic transcendental logarithmic function (translog), have also been

7
used. Cobb-Douglas is easy to estimate, it is simple, however it brings with it restrictive properties. It
has constant input elasticities, constant returns to scale, and the elasticities of substitution are equal to
one. Translog form has been an interesting alternative to Cobb-Douglas because it imposes no
restrictions upon returns to scale or substitution possibilities, but it has the drawback of being
susceptible to multicollinearity and degree of freedom problems (COELLI et al., 1998).
3 EMPIRICAL APPLICATION
This study used part of the database produced by Buainain et al. (2002). The
database contains 1322 records, considering only beneficiaries of agrarian reform. There are
644 records relating to beneficiaries of the PCT program and 678 records relating to the
settlers of the INCRA program. Of this total, 1059 records were used, of which 512 represent
the beneficiaries of the PCT beneficiaries and 547 settlers of INCRA. The main reason for the
disposal of some records was the lack of information, particularly for the variables used in the
production function, cultivated area of the lot, labor and production costs. The data used
refers to the period of production between August 1999 and July 2000.
The empirical application of the model is built using variables that represent the
production function, considering the production as the dependent variable and the production
factors (land, labor and capital) as independent variables. It is also necessary to specify the
vector of variables used to capture the effects of the sources of inefficiency.
The production of the beneficiaries of land reform programs is characterized by a
composition of a diverse set of agricultural products. The variable used to represent the
production was the total value of agricultural production, in Brazilian Reais (R$). The main
crops grown were cassava, beans, rice, corn, peanuts, squash, cotton, coconut, cocoa, orange,
passion fruit, yams, cattle, goats, sheep, poultry and forages. The area used by farmers
represented the land factor, considering the areas planted with seasonal crops and permanent
areas of forestry farming, pasture, forage planting, and also small areas of the family's home
yard. Labor days were considered as working days applied to production, for the
aforementioned time period of August 1999 to July 2000. The use of capital was represented
by the costs of inputs, services, and other production costs.
The set of variables for the inefficiency term was constructed from variables that
represent: (i) the farmers of the group sample, in which INCRA identifies the beneficiaries of
expropriating land reform, and PCT identifies the beneficiaries of market assisted land

8
reform; (ii) the scale of production, to show the control of effects of scale on efficiency; (iii)
soil quality indicator; (iv) the production strategies in terms of composition of the productive
structure and income sources; (v) the technological components of production systems; (vi)
access to technical assistance and credit and (vii) human capital in terms of qualifying
characteristics of the workforce and the allocation of family labor.
The empirical model follows the original specification of Battese and Coelli (1995)
by applying the natural logarithm (base e). The production function for the Cobb-Douglas
stochastic frontier is defined as:
ln Yi( )= β0+β1ln Landi( )+β2ln Labori( )+β3ln Inputi( )+ Vi −Ui( ) (3)
where i refers to the ith production unit (firm);
Yi s the total value of agricultural production in Brazilian Reais (R$);
Landi is the total area used with temporary and permanent crops, pastures and other
areas of intensive farming (ha);
Labori refers to the number of working days during the whole year of production;
Inputi refers to expenses for variable inputs, in Brazilian Reais (R$);
ß0 to ß3 are the parameters to be estimated;
Vi is the component for the residual (random effects, measurement errors and errors
by omission of variables) and;
Ui captures the effects of variables associated with the technical inefficiency of
production.
The term for the technical inefficiency (Ui) is given by:
Ui =δ0 +δ1(PCTi )+δ2 (MGi )+δ3(MAi )+δ 4 (CEi )+δ5(BAi )+δ6 (UsedAreai )+δ 7(PSoilAi )+δ8(PSoilBi )+δ9 (PConsumptioni )+δ10 (PCollectiveProductioni )+δ11(PCollectiveLabori )+δ12 (POuterIncomei )+δ13(POffFarmLabori )+δ14 (Livestocki )+δ15(Machinesi )+δ16 (PurchasedSeedsi )+δ17(Fertilizersi )+δ18(Lowlandi )+δ19 (Irrigationi )+δ20 (Crediti )+δ21(TechAssistancei )+δ22 (Agei )+δ23(Schoolingi )+δ24 (LocalMigrationi )+δ25(StateMigrationi )
(4)
where i refers to the ith production unit (firm);

9
PCTi receives the value 1 for the beneficiaries of the Cédula da Terra program and 0
for the beneficiaries settled by land expropriation;
MGi receives a value of 1 for the state of Minas Gerais and 0 for others;
MAi receives the value 1 for the state of Maranhão and 0 for others;
CEi takes the value 1 for the state of Ceará and 0 for others;
BAi receives the value 1 for the state of Bahia and 0 for others;
UsedAreai refers to cropland, pastures, and other areas of farming (ha);
PSoilAi refers to the proportion of municipal land with better soil;
PSoilBi refers to the proportion of municipal land with medium quality soil;
PConsumptioni is the ratio of the value of production used for family consumption
and the total value of production;
PCollectiveProductioni is the ratio of the value of collective production and the total
value of production;
PCollectiveLabori is the ratio of working days used for collective activities and the
total days worked by the family during the whole production year;
POuterIncomei is the ratio between the amount of income earned in activities outside
the lot and settlement, and the total amount of income earned;
POffFarmLabori refers to the ratio of working days of activities off the lot and off
the settlement, and the total days worked by the family in during the whole production year;
Livestocki is assigned the value 1 for the presence of livestock and zero for absence;
Machinesi takes the value 1 for the use of mechanical force in production;
PurchasedSeedsi receives the value 1 for the use of purchased seeds;
Fertilizersi takes the value 1 for the use of fertilizers, in particular chemical
fertilizers;
Lowlandi assigned the value 1 for the cultivation conducted in lowland areas;
Irrigationi assigned the value 1 for irrigated;
Crediti registers the value 1 for those receiving credit, excluding the regular funding
of land reform programs;
TechAssistancei registers the value 1 if the beneficiary has received technical
assistance;
Agei refers to age of the head of household in years;
SchoolingYearsi represents the years of formal schooling of household head;

10
LocalMigrationi assigned the value 1 when there was migration between
municipalities but within the state, and 0 for the absence of migration;
StateMigrationi assigned the value 1 when there was migration between states, but
not within the state, and 0 for the absence of migration, and;
δ0 a δ25 are unknown scalar parameters, the coefficients of inefficiency to be
estimated.
The variables INCRAi (beneficiaries settled by the expropriation land reform), PEi
(State of Pernambuco) and PSoloCi (soils with low level of quality) were omitted to avoid
perfect multicollinearity (Verbeek, 2004).
The descriptive statistics for the set of variables used in the model are presented in
the next section.
4 DESCRIPTIVE STATISTICS
We proceed to the descriptive analysis of variables used in the model for both groups of
beneficiaries, PCT and INCRA (Table 1). Results refer to the production yield from August/1999 to
July/2000. The comparison between the characteristics of farmers under expropriation and market
assisted land access are based on statistical tests applied to the difference of distributions of means
(Mann Whitney Wilcoxon) and frequency (Chi-squared).
Considering the production factors, beneficiaries of the state led program by expropriation
(INCRA) did better on the total value of production (R$ 2426.14), which includes production for
consumption. They used larger area (7.61 hectares) and were more labor intensive (638.69 days of
labor per year). The beneficiaries of market assisted land access program (PCT) yielded R$ 1784.92,
using the average of 5.78 hectares and 557.30 labor days for the period 1999/2000 (Table 1).
The model has two proxy variables for environmental characteristics: state and soil quality.
The differences between PCT and INCRA proportions are larger in Maranhão (MA) and Ceará (CE).
Maranhão has higher proportion of INCRA settlers (20.66%) compared to the proportion observed of
PCT (15.04%). The inverse occurs in Ceará, where the proportion of PCT settlers is higher (36.33%)
than INCRA (26.69%). State led settlements (INCRA) occurred under higher frequency in counties
with higher proportion of soils of regular quality (36.00%), while market led settlements (PCT) were
more frequent in counties with higher proportion of soils of better quality (47.64%).
Collective projects were observed with lower intensity in the INCRA settlements as
compared to the PCT settlements. The proportion of labor days applied to collective activities was
7.93% for INCRA farmers and 15.07% for PCT beneficiaries. The part of collective production was

11
lower for state led settlers (11.28%) compared to the market led ones (18.14%).
The use of technology for production reveals lower production intensity for the state led
settlers. INCRA settlers had lower frequency of use of machines (25.05%); use of purchased seeds
(36.93%); use of chemical fertilizers (38.03%); lowland cropping (17.18%); and use of technical
assistance (35.83%). The production technology of PCT settlers was characterized by the use of
machines in 33.40% of the households; use of purchased seeds by 46.29% farmers; use of chemical
fertilizers by 45.70%; lowland cropping frequency of 22.27%; and 52.15% of farmers used technical
assistance.
Table 1: Average of production factors and inefficiency sources of beneficiaries of INCRA and PCT, 1999/2000.
Considering the characteristics of the head of household, the beneficiaries of the state led
program are slightly older (43.1 years) compared to the head of household under the market led
program (41.5 years).
MeanStandard Deviation Median Mean
Standard Deviation Median
Variable
PCT(n=512)
INCRA(n=547)
W p-value χ² p-value
Mann Whitney Wilcoxon Test χ² Test
Production value (R$) 1784.92 2473.93 1040.64 2426.14 4370.61 1144.29 130894 0.0062 - -Used area (ha) 5.78 6.12 4.00 7.61 8.11 4.22Labor days 557.30 430.84 448.50 638.69 440.85 561.00Costs (R$) 496.16 1047.97 172.65 558.54 1538.09 178.00
MG (proportion) 0.1016 0.3024 - 0.1316 0.3384 -MA (proportion) 0.1504 0.3578 - 0.2066 0.4052 -CE (proportion) 0.3633 0.4814 - 0.2669 0.4428 -BA (proportion) 0.2266 0.4190 - 0.1974 0.3984 -PE (proportion) 0.1582 0.3653 - 0.1974 0.3984 -
High quality soil (ratio of county area) 0.4764 0.3916 0.4387 0.3907 0.3181 0.3404Regular quality soil (ratio of county area) 0.2822 0.3499 0.1065 0.3600 0.3107 0.2819Low quality soil (ratio of county area) 0.2414 0.2927 0.0885 0.2493 0.2889 0.1469
Consumption (ratio of production) 0.5515 0.3233 0.5620 0.5427 0.3371 0.5476Collective production (ratio of production) 0.1507 0.2704 0.0000 0.0793 0.2096 0.0000Collective labor (ratio of labor days) 0.1814 0.2276 0.1000 0.1128 0.1859 0.0377Outer income (ratio of income) 0.3824 0.3391 0.3480 0.3483 0.3269 0.2905External labor (ratio of days) 0.1143 0.2080 0.0000 0.1020 0.1889 0.0000Livestock (proportion) 0.6113 0.4879 - 0.6984 0.4594 -
Animal labor (proportion) 0.0762 0.2655 - 0.0658 0.2482 -Machines (proportion) 0.3340 0.4721 - 0.2505 0.4337 -Purchased seeds (proportion) 0.4629 0.4991 - 0.3693 0.4831 -Fertilizers (proportion) 0.4570 0.4986 - 0.3803 0.4859 -Lowland cropping (proportion) 0.2227 0.4164 - 0.1718 0.3776 -Irrigation (proportion) 0.0469 0.2116 - 0.0420 0.2009 -
Technical assistance (proportion) 0.5215 0.5000 - 0.3583 0.4799 -Credit (proportion) 0.4844 0.5002 - 0.4534 0.4983 -
Local migration (proportion) 0.6602 0.4741 - 0.6965 0.4602 -Migration between states (proportion) 0.2695 0.4442 - 0.2340 0.4238 -Age of the head (years) 41.4981 10.8820 40.0000 43.0713 11.9792 42.0000Schooling of the head (years) 1.8398 2.1513 1.0000 1.6527 2.0497 1.0000
Age of the settlement (years) 2.0020 0.2382 2.0000 3.2102 1.2380 3.0000
Source: Original data from Buainain et al. (2002).
128139 0.0168 - -120077 0.0001 - -139827 0.9671 - -
- - 2.3122 0.1284- - 5.6716 0.0172- - 11.4123 0.0007- - 1.3448 0.2462- - 2.7770 0.0956
155367 0.0020 - -110461 0.0000 - -137910 0.6670 - -
142286 0.6501 - -164114 0.0000 - -169767 0.0000 - -147335 0.1388 - -143776 0.3911 - -
- - 8.8791 0.0029
- - 0.4312 0.5114- - 8.9458 0.0028- - 9.5473 0.0020- - 6.4105 0.0113- - 4.3257 0.0375- - 0.1453 0.7031
- - 28.6145 0.0000- - 1.0202 0.3125
- - 1.6049 0.2052- - 1.7747 0.1828
129457 0.0334 - -145913 0.2176 - -
57482 0.0000 - -
12
The development of agriculture projects is strongly affected by its own maturity. The
average for the age of projects area higher for INCRA, and one could expect a higher level of
development of these projects. INCRA settlements age range varies from 1 to 6 years, and PCT
program settlements are 3 years old at most. This issue was checked by the comparison of the
characteristics of INCRA settlers grouped according to the age of the projects – younger projects up to
3 years old, and older ones with more than 3 years. Considering production factors, farmers from older
projects used smaller areas for production and lower intensity of labor, with no difference of statistical
significance for production itself. Considering the sources of inefficiency, older settlements had higher
frequency of technical assistance and older farmers.
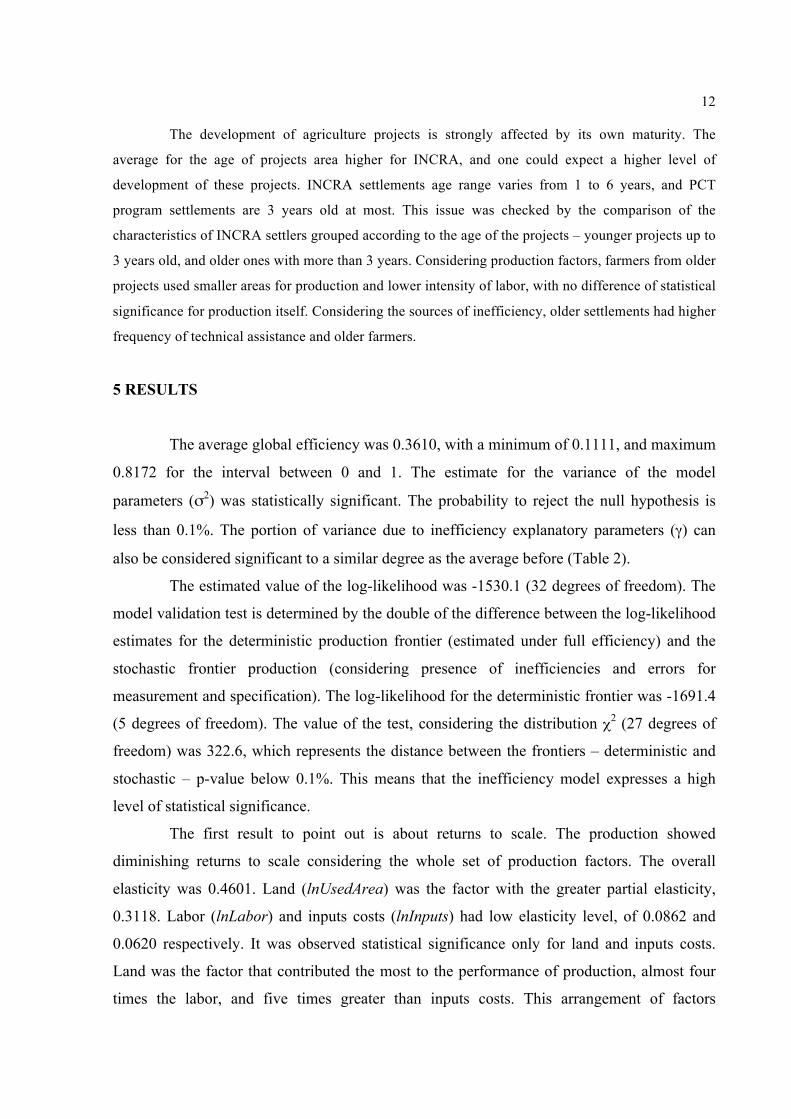
5 RESULTS
The average global efficiency was 0.3610, with a minimum of 0.1111, and maximum
0.8172 for the interval between 0 and 1. The estimate for the variance of the model
parameters (σ2) was statistically significant. The probability to reject the null hypothesis is
less than 0.1%. The portion of variance due to inefficiency explanatory parameters (γ) can
also be considered significant to a similar degree as the average before (Table 2).
The estimated value of the log-likelihood was -1530.1 (32 degrees of freedom). The
model validation test is determined by the double of the difference between the log-likelihood
estimates for the deterministic production frontier (estimated under full efficiency) and the
stochastic frontier production (considering presence of inefficiencies and errors for
measurement and specification). The log-likelihood for the deterministic frontier was -1691.4
(5 degrees of freedom). The value of the test, considering the distribution χ2 (27 degrees of
freedom) was 322.6, which represents the distance between the frontiers – deterministic and
stochastic – p-value below 0.1%. This means that the inefficiency model expresses a high
level of statistical significance.
The first result to point out is about returns to scale. The production showed
diminishing returns to scale considering the whole set of production factors. The overall
elasticity was 0.4601. Land (lnUsedArea) was the factor with the greater partial elasticity,
0.3118. Labor (lnLabor) and inputs costs (lnInputs) had low elasticity level, of 0.0862 and
0.0620 respectively. It was observed statistical significance only for land and inputs costs.
Land was the factor that contributed the most to the performance of production, almost four
times the labor, and five times greater than inputs costs. This arrangement of factors
13
highlights the marginal role of labor and inputs in production, revealing a strategy of use of
available land, and weak in labor and capital. However, the total elasticity under the unit
indicates that the relationship between inputs and production value is less than proportional,
so there is evidence that other variables may play an important role in production.
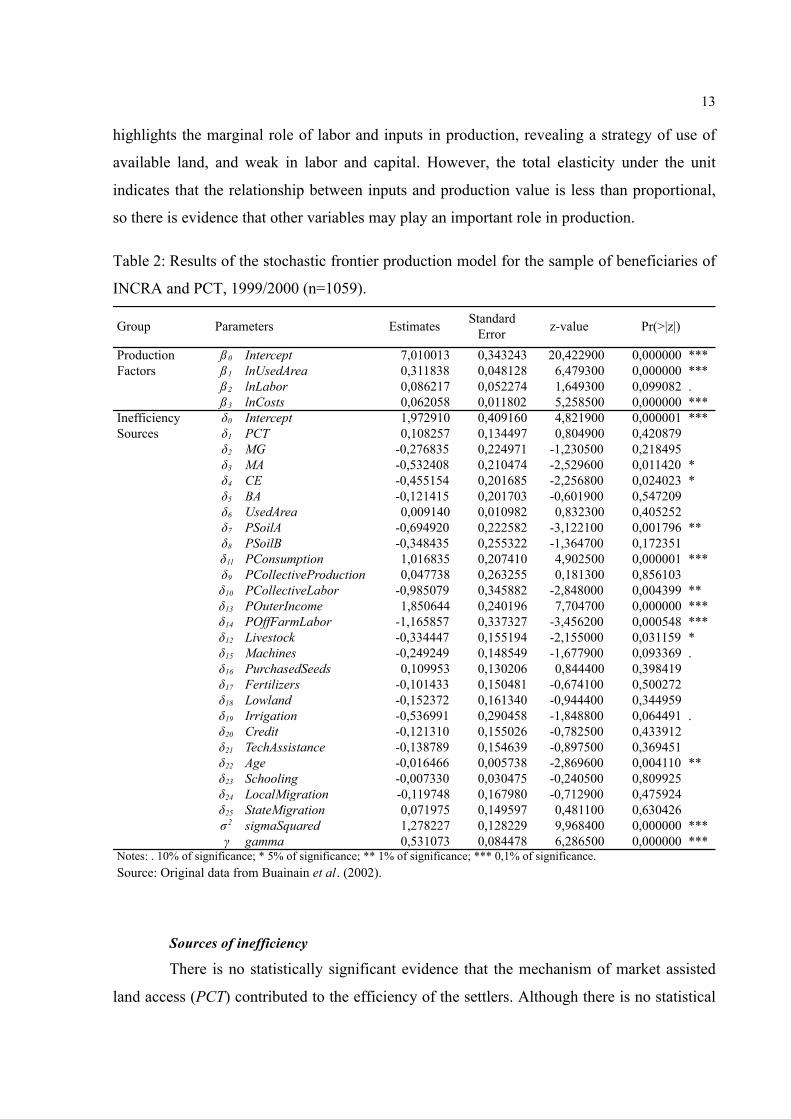
Table 2: Results of the stochastic frontier production model for the sample of beneficiaries of
INCRA and PCT, 1999/2000 (n=1059).
Sources of inefficiency
There is no statistically significant evidence that the mechanism of market assisted
land access (PCT) contributed to the efficiency of the settlers. Although there is no statistical
Group Estimates Standard Error z-value
ß0 Intercept 7,010013 0,343243 20,422900 0,000000 ***ß1 lnUsedArea 0,311838 0,048128 6,479300 0,000000 ***ß2 lnLabor 0,086217 0,052274 1,649300 0,099082 .ß3 lnCosts 0,062058 0,011802 5,258500 0,000000 ***δ0 Intercept 1,972910 0,409160 4,821900 0,000001 ***δ1 PCT 0,108257 0,134497 0,804900 0,420879δ2 MG -0,276835 0,224971 -1,230500 0,218495δ3 MA -0,532408 0,210474 -2,529600 0,011420 *δ4 CE -0,455154 0,201685 -2,256800 0,024023 *δ5 BA -0,121415 0,201703 -0,601900 0,547209δ6 UsedArea 0,009140 0,010982 0,832300 0,405252δ7 PSoilA -0,694920 0,222582 -3,122100 0,001796 **δ8 PSoilB -0,348435 0,255322 -1,364700 0,172351δ11 PConsumption 1,016835 0,207410 4,902500 0,000001 ***δ9 PCollectiveProduction 0,047738 0,263255 0,181300 0,856103δ10 PCollectiveLabor -0,985079 0,345882 -2,848000 0,004399 **δ13 POuterIncome 1,850644 0,240196 7,704700 0,000000 ***δ14 POffFarmLabor -1,165857 0,337327 -3,456200 0,000548 ***δ12 Livestock -0,334447 0,155194 -2,155000 0,031159 *δ15 Machines -0,249249 0,148549 -1,677900 0,093369 .δ16 PurchasedSeeds 0,109953 0,130206 0,844400 0,398419δ17 Fertilizers -0,101433 0,150481 -0,674100 0,500272δ18 Lowland -0,152372 0,161340 -0,944400 0,344959δ19 Irrigation -0,536991 0,290458 -1,848800 0,064491 .δ20 Credit -0,121310 0,155026 -0,782500 0,433912δ21 TechAssistance -0,138789 0,154639 -0,897500 0,369451δ22 Age -0,016466 0,005738 -2,869600 0,004110 **δ23 Schooling -0,007330 0,030475 -0,240500 0,809925δ24 LocalMigration -0,119748 0,167980 -0,712900 0,475924δ25 StateMigration 0,071975 0,149597 0,481100 0,630426σ 2 sigmaSquared 1,278227 0,128229 9,968400 0,000000 ***γ gamma 0,531073 0,084478 6,286500 0,000000 ***
Notes: . 10% of significance; * 5% of significance; ** 1% of significance; *** 0,1% of significance.Source: Original data from Buainain et al. (2002).
Parameters Pr(>|z|)
Production Factors
Inefficiency Sources
14
significance (p-value=0.4209) the positive sign indicates contribution to inefficiency
(0.1083). This result is also an indication that the complementary variable, which represents
land access by expropriation (INCRA), may have contributed negatively to the inefficiency.
In terms of geographical distribution, the parameters estimated for the states of
Minas Gerais (MG), Maranhão (MA), Ceará (CE) and Bahia (BA) indicate that there were
positive contributions to efficiency. The estimated parameters respectively
were: -0.2768, -0.5324, -0.4551 and -0.1214, with statistical significance for only Maranhão
and Ceará. Pernambuco (PE) contributed negatively to efficiency as expected, given its
complementary role for the model. The drought that hit several regions of Pernambuco during
the period of data collection (1999/2000) may explain, along with the problems of
governance, and the socioeconomic position of the beneficiaries of this state, having very low
levels of technical efficiency.
Soil quality in settlement projects municipalities was used to capture the effects of
environmental characteristics along with the indicators of states. The variables refer to the
proportion of the municipal area with three levels of soil quality – high, regular and low. The
variables – high quality and regular quality (PSoilA and PSoilB) – contributed negatively to
the inefficiency, -0.6949 and -0.3484 respectively, with significance only for high quality
soils.
The area used for crops and pastures was introduced in hectares, to capture the scale
effect on efficiency, which could be lost due to restrictions of the Cobb-Douglas function. The
estimated coefficient was near zero (0.0091), without significant effect on efficiency. On
average, farmers of PCT and INCRA occupied only 21.4% and 23.6% of the available
average area, estimated at 27.0 ha and 32.3 ha. Therefore the degree of effective use of the
land was not enough to develop economies of scale.
The outer income ratio and production for consumption, along with the low level of
occupation of the available area, give a set of evidences that agricultural production may not
be the main strategy for economic development of the settlers. It doesn’t underestimate its
role as the primary strategy to access the land though. Part of the explanation for the strategy
of subsistence production can also be linked to environmental factors, underdevelopment of
local markets, and restriction of access to local and regional markets; in particular due to lack
of infrastructure for storage of production, and precarious access to urban centers (De Janvry
and Sadoulet, 2004).

15
The strategy of supplementing income through outer income was the variable that
most contributed to inefficiency (1.8506), while off-farm labor was the variable that most
contributed to the efficiency (-1.1659), both with statistical significance. On one hand, the
shift of focus from the management and design of the lot can compromise the productive
efficiency; on the other hand, the off-farm labor can contribute to the experience of the farmer
and can integrate them into the market, contributing to the development of technical and
allocative efficiency (De Janvry and Sadoulet, 1995). While subsistence production is
important for the family’s food security, the focus of this strategy, coupled with the shift of
focus to generate additional income via activities outside of the settlement, can point to future
restriction of accumulation of capital necessary to overcome conditions of poverty through
agricultural production.
The portion of the value of production from collective production did not affect the
efficiency significantly, while the share of labor for the collective settlement activities
contributed to the development of technical efficiency (-0.9851).
The seemingly incoherent gap between the effects of obtained production against the
labor effort in collective activities may be the result of the allocation of surplus labor, but not
exactly in the search for income derived from the collective access to productive assets. For
beneficiaries of the PCT program, the share of production from collective activities (15.07%)
corresponded almost to the double of that obtained by the settlers of INCRA (7.93%). For the
proportion of work devoted to group activities, the proportions were 18.14% and 11.20%,
respectively for PCT and INCRA.
Livestock farming can play dual role in the production system. On the one hand, the
animals create a monetary reserve to face adverse conditions in the long run; on the other
hand, it also provides quick access to food in the short term, such as the production of milk
products. The negative sign of the variable indicated that the presence of livestock has
contributed to resolve the inefficiency (-0.3344).
The most significant effects of technology refer to irrigated cultivation (-0.5370) and
mechanical traction (-0.2492). The effects of lowland cultivation, chemical fertilizers, and
seeds purchased were not statistically significant. The variables for access to technical
assistance and credit also showed no statistically significant estimates. The estimated
parameter for the head of household age was significant (-0.0165). However, there was no
statistical significance for years of education, state and local migration.

16
There was no statistically significant difference observed between productive
efficiency for PCT and INCRA farmers. The value of the efficiency index observed for the
settlers of the PCT was 0.3537 and 0.3678 for farmers by INCRA (Table 2), and no statistical
significance for the difference (p(t)=0.2381). Figure 1 presents the distributions of efficiency
according to the mechanism of access to land.
Table 3: Estimated efficiency for the group of beneficiaries of PCT and INCRA, 1999/2000.
(a)
(b)
Figure 1: Distribution of beneficiaries according to efficiency mechanism and access to land, 1999/2000: (a) PCT (n=512), (b) INCRA (n=547).
Descriptive statistics of farmers near to the frontier
The differences between PCT and INCRA farmers near to the frontier were statistically
significant for a small set of variables, including state, use of fertilizers, use of technical assistance and
age of the settlement. Significant differences for the average efficiency estimates were not observed
Variable N Mean Standard Deviation
Dispersion (%)
Standard Error
Lower Bound (95%)
Upper Bound (95%)
PCT Efficiency 512 0,3537 0,1930 54,5581 0,0085 0,3369 0,3704INCRA Efficiency 547 0,3678 0,1968 53,5163 0,0084 0,3513 0,3844
PCT and INCRA Efficiency 1059 0,3610 0,1950 54,0225 0,0060 0,3492 0,3727
Source: Original data from Buainain et al. (2002).
PCT
Source: Original data from Buainain et al. (2002).Efficiency
Perc
enta
ge (%
)
0
5
10
0.0 0.2 0.4 0.6 0.8 1.0
INCRA
Source: Original data from Buainain et al. (2002).Efficiency
Perc
enta
ge (%
)
0
2
4
6
8
10
12
0.0 0.2 0.4 0.6 0.8 1.0
17
according to the land access mechanism (0.7291 for PCT and 0.7356 for INCRA).
The stratum of efficiency near to the frontier had no PCT settlers for the states of Minas
Gerais and Pernambuco. On the other hand, the frequency for INCRA settlers was 18.75% for Minas
Gerais and 12.50% for Pernambuco. For the state of Ceará, the proportion of farmers in the PCT
(61.90%) was greater than that of INCRA (21.88%).
The use of fertilizers was most often seen in the PCT group, in 76.19% of cases compared
with 31.25% for the group of farmers from INCRA. The proportion of farmers with access to technical
assistance was higher for the PCT group, 71.43% against 37.50% for the group of INCRA.
Although not a hallmark of farmers near the frontier considering the total sample, the
average age of the projects was higher for the settlers through expropriation (INCRA), 2.8 years
against 2.0 years of projects established through access to land through the market (PCT), virtually
reproducing a feature of the sample.
Near the frontier, the differences between the characteristics of the farmers according to the
access mechanism to the land tends to be lower when the comparison is made considering the set of
observations of the stratum of 95% lower values of efficiency or even for the whole set of values in
the sample. In conclusion, the degree of similarity between the farmers was higher.
6 CONCLUSION
The estimated average efficiency was 0.3163 for the overall set of farmers. The
index value for the PCT settlers was 0.3537, while for the INCRA settlers was 0.3678, with
no statistical significance for the difference between the two. This rejects the hypothesis of
differentiation in productive efficiency between the mechanisms of access to land by
expropriation and market assisted land access.
The production showed diminishing returns to scale considering the whole set of
production factors. Land was the factor that contributed the most to the performance of
production, almost four times the work and five times greater than production costs. This
arrangement of factors of production shows the marginal role of labor and inputs in
production, revealing a strategy of farming based on partial use of available land, low
intensity of labor and capital usage.
The sources of the efficiency offer a coherent explanation for the behavior of
efficiency as a function of the productive structure. The first result of the model confirms the
existence of inefficiency, indicating that there was a set of discriminating variables. The
variables that contributed negatively to the inefficiency, therefore positively for efficiency,
18
were the proportion of labor allocated to activities outside the settlement, the proportion of
labor allocated to group activities, the location of projects in municipalities with the largest
area of land with high soil quality, location of projects in the states of Maranhão and Ceará,
and age of the head of household. Irrigation and the use of machinery in productive activities
are variables in set of secondary level of statistical significance. The variables that contributed
negatively to efficiency were the proportion of outer income activities and proportion of the
value of production for family consumption.
Labor can be considered the resource more readily available and relatively
inexpensive in family production units, a prevalent feature of land reform beneficiaries.
Surplus labor, coupled with lack of financial resources to develop the available land, both are
marginally diminishing contribution to production. It may explain in part the reversal effects
on efficiency of the labor allocated to collective production inside the settlement and off-farm
activities. If the surplus labor would be allocated for their own production, the marginal
contribution to production could present a negative sign. The second striking feature of
production systems present in land reform settlements is the subsistence production for the
family, which contributed negatively to the efficiency of production. Production for home
consumption on the one hand is indispensable for the food security of the family and their
livelihoods. This means a composition of a production system in terms of products of low
elasticity of consumption, therefore, with limited incentives to expand production. Adding
precarious access to local markets due to limitations on transportation of production, or even
absence of local markets, diminishes incentives to increase production as well.
The inefficiency is not explained according to the mechanism of access to land;
however, individuals nearby the frontier have a set of characteristics that differentiate them
from others. Farmers near the efficiency frontier fully combine the intensification of
production relative to the absence of the main sources that contributed negatively to the
efficiency. On the one hand, production systems at the frontier are characterized by higher
production value, more intensive use of capital (inputs costs), a greater proportion of labor for
collective production, increased frequency of observations for livestock, use of machinery,
and cultivation in lowland and irrigated areas. Indicators of lower intensity of participation in
this stratum of producers were located in the state of Pernambuco, located in municipalities
where the proportion of the area was lower for soils of low quality and low rate of outer
incomes in the composition of total income.

19
Indicators of human capital, except for age of the head of household, are virtually
absent in terms of effects on efficiency. There were no significant effects for the years of
schooling, migration between municipalities within the state and migration between states.
The effects of the age of the head of household should be interpreted with care, in part
because they can carry the effects of age of the settlements itself.
The quality of the settlement projects was evaluated indirectly, according an
indicator of soil quality areas relative to the municipal agricultural area. The results obtained
indicate that positive effects on the efficiency were observed in the presence of high quality
soil, and farmers near the frontier are characterized by sitting in areas with lower proportion
of low quality soils. So there is indirect evidence that the quality of the projects makes a
difference considering the efficiency of the farmers.
There are limits to interpretation of the results, due to the adverse effects of the early
stages of projects, and due to incomplete conditions necessary for the settlements' full
development of productive activities. The results also show that there is room to grow, in
terms of scale, improving performance and productivity, and improving production
efficiency.
REFERENCES
ALCÂNTARA, D. P. R. Instituições, sistema financeiro e desenvolvimento econômico. 2010. 132 p. Thesis (Doctoral in Economics)-Instituto de Economia, Universidade Estadual de Campinas, Campinas, 2010.
BANERJEE, A.; GERTLER, P.; GHATAK, M. Transferência de poderes e eficiência: uma análise econômica de um programa de reforma do arrendamento de terras na Índia. In: TEÓFILO, E. et al. (orgs.) A economia da reforma agrária: evidências internacionais. Brasília: Núcleo de Estudos Agrários/ Ministério de Desenvolvimento Agrário, 2001. p. 233-290.
BARDHAN, P.; BOWLES, S.; GINTIS, H. Desigualdade de renda, restrição de requiza e desempenho econômico. In: TEÓFILO, E. et al. (orgs.) A economia da reforma agrária: evidências internacionais. Brasília: Núcleo de Estudos Agrários/ Ministério de Desenvolvimento Agrário, 2001. p. 161-232.
BATTESE, G. E.; COELLI, T. J. A model for technical inefficiency effects in a stochastic frontier production function for panel data. Empirical Economics, Heidelberg, v. 20, p. 325-332, 1995.
20
BUAINAIN, A. M. et al. Perfil dos beneficiários PCT e INCRA. 2001. 393 p. Research Report (FECAMP/UNICAMP and NEAD/MDA)-Fundação Economia de Campinas, Universidade Estadual de Campinas, Campinas, 2002.
COELLI, T. J. A guide to FRONTIER version 4.1: a computer program for stochastic frontier production and cost function estimation. CEPA Working Papers, University of New England, Armidale, NSW, v. 96, n. 8, p. 1-30, 1996.
COELLI, T. J.; HENNINGSEN A. Frontier: stochastic frontier analysis. R package version 0.997-2. 2011. 35 p. Disponível em: <http://CRAN.R-project.org/package=frontier>. Accessed in: Jan. 20th 2011.
COELLI, T. J.; RAO, D. S. P.; BATTESE, G. E. An introduction to efficiency and productivity analysis. Boston: Kluwer Academic Publishers, 1998. 274 p.
DE JANVRY, A.; SADOULET, E. Quantitative development analysis. Baltimore: The Johns Hopkins University Press, 1995. 397 p.
DE JANVRY, A.; SADOULET, E. Fitting the facts and capitalizing on new opportunities to redesign rural development in Latin America. In: CONGRESSO BRASILEIRO DE ECONOMIA E SOCIOLOGIA RURAL, 41., 2004, Cuiabá. Proceedings... Cuiabá: Sociedade Brasileira de Economia e Sociologia Rural, 2004. 18 p.
DEATON, A. The analysis of household surveys: a microeconometric approach to development policy. Washington, DC: World Bank, 1997. 479 p.
FARRELL, M. J. The measurement of production efficiency. Royal Statistical Society Journal Series A, London, v. 3, p. 253-281, 1957.
HART, O. Firms, contracts and financial structure. Oxford: Oxford University Press, 1997. 228 p.
IBGE. Comentários: Brasil agrário retratado pelo Censo Agropecuário 2006. In: Censo agropecuário 2006. 2006. 170 p. Link at: <http://www.ibge.gov.br/home/estatistica/ economia/agropecuaria/censoagro/brasil_2006/comentarios.pdf>. Accessed in: Sep. 10th 2010.
LEITE, S. P. et al. (coord.). Impactos dos assentamentos: um estudo sobre o meio rural brasileiro. São Paulo: Ed. Unesp, 2004. 391 p.
STEVENSON, R. E. Likelihood function for generalized stochastic frontier estimation. Journal of Econometrics, Amsterdam, v. 13, p. 57-66, 1980.
VERBEEK M. A guide to modern econometrics. 2. ed. Hoboken NJ: John Wiley & Sons, 2004. 429 p.
VICENTE, J. R. Pesquisa, adoção de tecnologias e eficiência na produção agrícola. São Paulo: APTA/SAASPESP, 2002. 150 p.