process simulation, unit operations design and cfd · pdf fileaspen technology may provide...
TRANSCRIPT

Process Simulation, Unit Operations Design and CFD
Flowsheet Simulation, Detailed Design and Operational Options
Mike Mendez
Aspen Technology, Houston, TX
April 2017

© 2015 Aspen Technology, Inc. All rights reserved 2
Disclaimer
Aspen Technology may provide information regarding possible future product
developments including new products, product features, product interfaces, integration,
design, architecture, etc. that may be represented as “product roadmaps.”
Any such information is for discussion purposes only and does not constitute a
commitment by Aspen Technology to do or deliver anything in these product roadmaps
or otherwise.
Any such commitment must be explicitly set forth in a written contract between the
customer and Aspen Technology, executed by an authorized officer of each company.

© 2015 Aspen Technology, Inc. All rights reserved 3
Topics
• Scope of Process Simulation
– Heat and Material Balances
– Equipment Selection and Sizing
– Cost Estimation
– Operations Support
• Engineering Work-process Discussion and
Demonstrations

© 2015 Aspen Technology, Inc. All rights reserved 4
Conceptual Design
Data and MethodsReactions
Heat and Material Balance, Flowsheet

© 2015 Aspen Technology, Inc. All rights reserved 5
What Equipment is Required?
Equipment Selection, Design and Cost Analysis
How Much Will it Cost?
What is the Right Size

© 2015 Aspen Technology, Inc. All rights reserved 6
Models in Process Operation and Optimization
ProcessModel
RTO
OperatorAdvisory
DecisionSupport
ProcessInferential
EquipmentMonitoring
DataReconciliation
OperatorTraining
Planning
Drive process closer to its constraints to increase profit
Track state of key equipment
Visualization & What-if analysis
Provide real-time operating advice
Use models as virtual sensorsClose mass &
energy balance
Teach engineers & operators how to run the plant
Use models to actualize planning models

© 2015 Aspen Technology, Inc. All rights reserved 7
Conceptual Design Workflow
• Identify the appropriate Physical Property Package
• Assess the quality of available VLE/LLE data
• Identify the best reaction sequences
• Select the most effective separation methods
• Develop the flowsheet and apply PINCH analysis
• Select equipment, size and do preliminary cost analysis

© 2015 Aspen Technology, Inc. All rights reserved 8
Select Components
Conceptual Design Workflow – Select Components

© 2015 Aspen Technology, Inc. All rights reserved 9
Other Special Types of Components
Ions and salts that react Polymers with MW Distribution

© 2015 Aspen Technology, Inc. All rights reserved 10
Design Workflow – Solid Components with PSD
Solid components may have particle size distribution (PSD)

© 2015 Aspen Technology, Inc. All rights reserved 11
Special Methods for Non-Conventional Components
C
O2
N2
H2
H2O
S
CL
……
?
• From “Substance” to molecules ?
• Thermodynamic Properties ?

© 2015 Aspen Technology, Inc. All rights reserved 12
Select Property Method
Suitable for Process or
Component Set
Conceptual Design Workflow – Select Properties Methods

© 2015 Aspen Technology, Inc. All rights reserved 13
Check for Physical Property
Parameters and Data for all
Key Components
Conceptual Design Workflow – Data Availability and Quality

© 2015 Aspen Technology, Inc. All rights reserved 14
Property Parameters Required for Mass and Energy Balance Simulations
If you
These parameters are
required
Enter them on this type of Methods |
Parameters form
Use the standard liquid
volume basis for any
flowsheet or unit operation
model specification
Standard liquid volume
parameters (VLSTD) Pure Component | Scalar
For simulations that involve
both mass and energy
balance calculations, you
must enter or retrieve from
the databanks these required
parameters:
This table gives further
information:
For simulations that involve
both mass and energy balance
calculations, you must enter or
retrieve from the databanks
these required parameters:
This table gives further
information:
For simulations that involve both mass and
energy balance calculations, you must
enter or retrieve from the databanks these
required parameters:
This table gives further information:
For simulations that involve both mass and energy balance calculations, you must enter or retrieve from
the databanks these required parameters:

© 2015 Aspen Technology, Inc. All rights reserved 15
Property Parameters Required for Mass and Energy Balance SimulationsThis table gives further information:
Enter or retrieve
this parameter For
On this type of Methods |
Parameters form
MW Molecular weight Pure Component | Scalar
PLXANT
Extended Antoine vapor
pressure model Pure Component | T-Dependent
CPIG or CPIGDP Ideal gas heat capacity model Pure Component | T-Dependent
DHVLWT or
DHVLDP Heat of vaporization model Pure Component | T-Dependent

© 2015 Aspen Technology, Inc. All rights reserved 16
• Supplement missing data with published data or DECHEMA
• Generate missing parameters from data using Data-Regression
• Estimate parameters from molecular structure as method of last resource
Properties from molecular structure
Conceptual Design Workflow - Supplement Missing Data

© 2015 Aspen Technology, Inc. All rights reserved 17
Conceptual Design Workflow - VLE / LLE Analysis
Residue Curves
T-xy diagram for BUTANOL/WATER
Liquid/vapor mole fraction, BUTANOL
Tem
pera
ture
, C
0.000 0.050 0.100 0.150 0.200 0.250 0.300 0.350 0.400 0.450 0.500 0.550 0.600 0.650 0.700 0.750 0.800 0.850 0.900 0.950 1.00092
93
94
95
96
97
98
99
100
101
102
103
104
105
106
107
108
109
110
111
112
113
114
115
116
117
118
x 1.0133 bar
y 1.0133 bar
Txxy Binary Diagram
Activity Coefficients at Infinite Dilution
Use binary and ternary
analysis tools to reveal
azeotropes, solubilities,
and VLLE boundaries

© 2015 Aspen Technology, Inc. All rights reserved 18
THE IMPORTANCE OF ACCURATE PROPERTY CALCULATIONS
Resulting % Error
Property %Error Equip. Size Equip. Cost
Thermal Conductivity 20 13 13
Specific Heat 20 6 6
Latent Heat of Vap. 15 15 15
Activity Coeff. 10
Sep. factor = 50 3 2
1.5 20 13
1.2 50 31
1.1 100 100
Diffusivity 20 6 4
100 40 23
Viscosity 50 10 10
Density 20 16 16
Surface Tension 20 9 9
(Ref. Advanced Process Engineering, AICHE, James Fair)

© 2015 Aspen Technology, Inc. All rights reserved 19
Conceptual Design Workflow - VLE / LLE Analysis
Activity Coefficient at Infinite Dilution
© 2015 Aspen Technology, Inc. All rights reserved 20
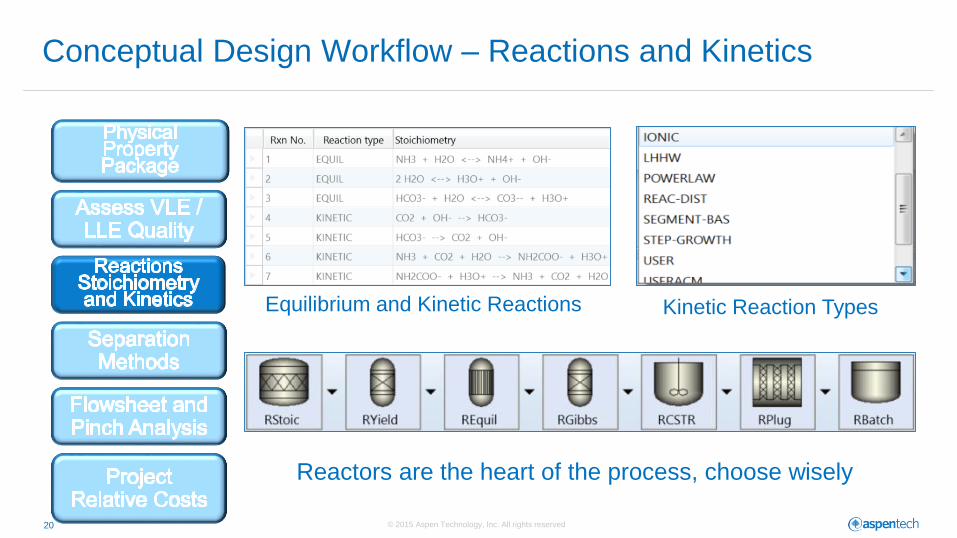
Conceptual Design Workflow – Reactions and Kinetics
Equilibrium and Kinetic Reactions Kinetic Reaction Types
Reactors are the heart of the process, choose wisely

© 2015 Aspen Technology, Inc. All rights reserved 21
Conceptual Design Workflow – Biological Reactors
Equilibrium and Kinetic Reactions Kinetic Reaction Types
Reactors are the heart of the process, choose wisely

© 2015 Aspen Technology, Inc. All rights reserved 22
Fermentation models require special methods
Conceptual Design Workflow – Biological Reactors
0
2
4
6
8
10
12
14
16
0 20 40 60 80
0
50
100
150
200
250
B
I
O
M
A
S
S
o
r
E
T
O
H
R
a
t
e
t, hours
S
U
G
A
R
o
r
E
T
H
A
N
O
L
Ethanol (g/L) Sugar (g/L) Biomass (g/L) ETOH Rate, g/L-hr

© 2015 Aspen Technology, Inc. All rights reserved 23
Logistic Model With Growth Associated Production of Ethanol
Conceptual Design Workflow – Biological Reactors

© 2015 Aspen Technology, Inc. All rights reserved 24
Conceptual Design Workflow - Separation and Purification
STRIPR
RECTIFR
BEERCOLPUMP
RECBTMS
RTRN
STRIPBTM
BCOVH
RECOVHD
FUSEL-O
S-1
BEER
BCBOTM
Distillation
EXTRACT (Extract) - Profiles Composition
Stage
WA
TER
MTB
E
CO2
1 2 3 4 50.00565
0.00570
0.00575
0.00580
0.00585
0.00590
0.00595
0.00600
0.00605
0.00610
0.00615
0.00620
0
2.50e-6
5.00e-6
7.50e-6
1.00e-5
1.25e-5
1.50e-5
1.75e-5
2.00e-5
2.25e-5
2.50e-5
2.75e-5
3.00e-5
3.25e-5
3.50e-5
3.75e-5
0.99380
0.99385
0.99390
0.99395
0.99400
0.99405
0.99410
0.99415
0.99420
0.99425
0.99430
0.99435
CO2
MTBE
WATER
EXTRACT
CO2
MTBE
L1
L2
Liquid-Liquid Extraction
Adsorption
CRYSTAL
HYDROCYC
DECANTER
63
CRYSTALS
10
SOLUTION
S4
63S6
S1
0
S8
S45
Crystallization
© 2015 Aspen Technology, Inc. All rights reserved 25
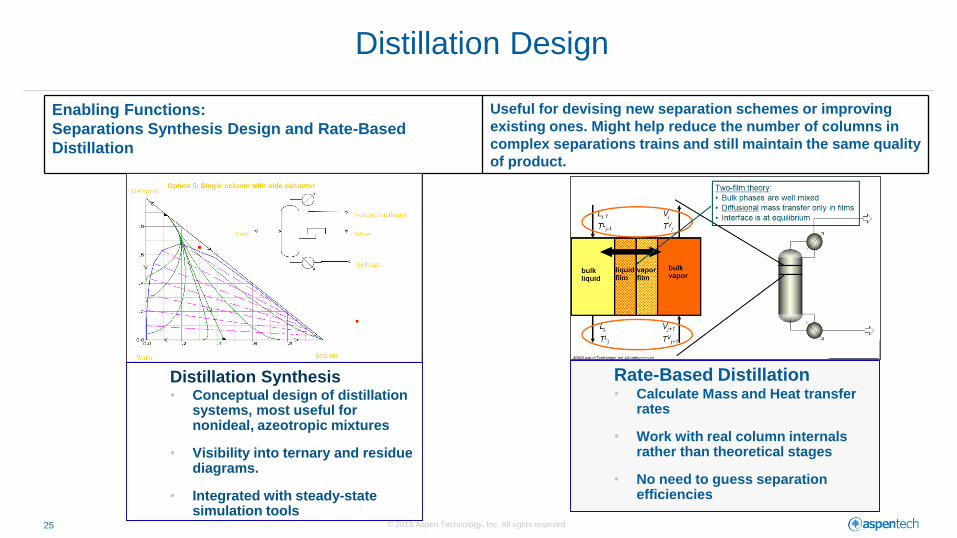
Distillation Design
Enabling Functions:
Separations Synthesis Design and Rate-Based
Distillation
Useful for devising new separation schemes or improving
existing ones. Might help reduce the number of columns in
complex separations trains and still maintain the same quality
of product.
Distillation Synthesis• Conceptual design of distillation
systems, most useful for nonideal, azeotropic mixtures
• Visibility into ternary and residue diagrams.
• Integrated with steady-state simulation tools
Rate-Based Distillation• Calculate Mass and Heat transfer
rates
• Work with real column internalsrather than theoretical stages
• No need to guess separation efficiencies

© 2015 Aspen Technology, Inc. All rights reserved 26
Conceptual Design Workflow – Flowsheeting and Pinch Analysis
DemethanizerDeethanizer C2-Splitter
Hydrogen
Gas from Furnace
Ethylene
EthaneEthane
To Depropanizer
Chiller 3Chiller 5 Chiller 1 Chiller 4 Chiller 2
Ethylene Plant Cold End Flowsheet
Pinch – Grand Composite Curve Pinch – Heat Exchanger Network

© 2015 Aspen Technology, Inc. All rights reserved 27
Conceptual Design Workflow – Heat Exchangers
Air CooledFired
Heater Plate
ExchangerPlate Fin
Shell & Tube
Shell & Tube
Mechanical
Heat Exchangers - Design, Rate and Simulate

© 2015 Aspen Technology, Inc. All rights reserved 28
Rigorous Exchanger Models in Flowsheet Simulations
Analyze Risk and Potential Operational Problems of Heat Exchangers
Exchanger Feasibility
Identify Operating Risks

© 2015 Aspen Technology, Inc. All rights reserved 29
Enabling Function
Dynamic response of systems (equipment and
controls)
Configure process control schemes that yield
more stable systems, and get you closer to
optimal operation.
Dynamic Simulation
prod
Time Hours
ST
RE
AM
S("
RE
CO
VH
D")
.Zm
n("
H2O
") lb
/lbS
TR
EA
MS
("R
EC
OV
HD
").Z
mn
("F
US
EL
") lb
/lb
ST
RE
AM
S("
RE
CO
VH
D")
.Zm
n("
ET
HA
NO
L")
lb/lb
ST
RE
AM
S("
RE
CO
VH
D")
.Zm
n("
CO
2")
lb/lb
0.0 0.2 0.4 0.6 0.8 1.0 1.2 1.4 1.6
0.84
0.86
0.88
0.9
0.92
0.94
0.0
0.00
:0.
020.
030.
040.
050.
060.
070.
080.
09
RECTIFIER
Time Hours
ST
RE
AM
S("
RE
CO
VH
D")
.Zm
n("E
TH
AN
OL"
) lb
/lb
0.4 0.9 1.4 1.9 2.4
0.85
0.86
0.87
0.88
0.89
0.9
0.91
0.92

© 2015 Aspen Technology, Inc. All rights reserved 30
Conceptual Design Workflow – Project Costs
Equipment Mapping Equipment Cost
Relative Project Cost

© 2015 Aspen Technology, Inc. All rights reserved 31
Activated Cost Project Summary

© 2015 Aspen Technology, Inc. All rights reserved 32
Capacity Scaling and Capital Costs with ASW
Cost estimation
results shown in ASW

© 2015 Aspen Technology, Inc. All rights reserved 33
Models for Uncertainty Quantification or Global Optimization
0
0.05
0.1
0.15
0.2
0.25
0.3
0.35
0.4
0.45
1 91
72
53
34
14
95
76
57
38
18
99
71
05
113
121
129
137
145
153
161
169
177
185
193
Rxn Conversion Variability
0
20
40
60
80
100
120
140
0
0.0
4
0.0
8
0.1
2
0.1
6
0.2
0.2
4
0.2
8
0.3
2
0.3
6
0.4
0.4
4
0.4
8
0.5
2
0.5
6
0.6
0.6
4
0.6
8
0.7
2
0.7
6
0.8
0.8
4
0.8
8
0.9
2
0.9
6 1
Rxn Conversion Frequency
RXT
FEED
PRD
Three Simultaneous Reactions
Uncertainty in Rxn Kinetic ParametersBatch Reactor

© 2015 Aspen Technology, Inc. All rights reserved 34
Model Automated with EXCEL to Find Local and Global Optima

© 2014 Aspen Technology, Inc. All rights reserved 35
Reliability, Availability and Maintenance

© 2015 Aspen Technology, Inc. All rights reserved 36
RAM Modeling

© 2015 Aspen Technology, Inc. All rights reserved 37
System and Reliability ModelingUtilizes Unit Histogram

© 2015 Aspen Technology, Inc. All rights reserved 38
System and Reliability ModelingPareto (Top 10)

© 2015 Aspen Technology, Inc. All rights reserved 39
RAM Modeling – Power/Cogen
• During the design phase of a power generation facility, our RAM Modeling was used to determine if a utility grid connection would provide adequate electrical reliability. This option was compared to one with self-generation. For these cases, the model determined that the utility grid did provide adequate reliability and that the additional cost of adding on-site generators was unnecessary. This proved to be a significant costsavings to the company.
• When designing a new steam generation facility, our RAM Modeling was used to determine the size and optimal number of steam boilers. After running several alternate cases with many different size differentials and configurations, the model landed on the most economical design that would provide the required level of reliability. This could be completed for any utility plant such as air compression, power generation, co-generation, or even water supply & treatment.
• During the operational phase of many utility plants, demands for electricity, stream, and instrument air often increase as the customer plants grow and increase production. Our RAM Modeling has been used to help evaluate many different de-bottleneck alternatives. When the desired reliability of each alternative is achieved, completing a cost analysis is an easy way to select the most economical solution. Some examples ofthis may include:
– Selecting a vendor for a new skid
– Installing stand-by generation or diesel backups
– Connecting to a standby utility header
– Improving site recovery methods.

© 2015 Aspen Technology, Inc. All rights reserved 40
Questions