proceedings open access inferences from structural … · proceedings open access inferences from...
TRANSCRIPT
PROCEEDINGS Open Access
Inferences from structural comparison: flexibility,secondary structure wobble and sequencealignment optimizationGaihua Zhang, Zhen Su*
From Proceedings of the Ninth Annual MCBIOS Conference. Dealing with the Omics Data DelugeOxford, MS, USA. 17-18 February 2012
Abstract
Background: Work on protein structure prediction is very useful in biological research. To evaluate their accuracy,experimental protein structures or their derived data are used as the ‘gold standard’. However, as proteins aredynamic molecular machines with structural flexibility such a standard may be unreliable.
Results: To investigate the influence of the structure flexibility, we analysed 3,652 protein structures of 137 uniquesequences from 24 protein families. The results showed that (1) the three-dimensional (3D) protein structures werenot rigid: the root-mean-square deviation (RMSD) of the backbone Ca of structures with identical sequences wasrelatively large, with the average of the maximum RMSD from each of the 137 sequences being 1.06 Å; (2) thederived data of the 3D structure was not constant, e.g. the highest ratio of the secondary structure wobble sitewas 60.69%, with the sequence alignments from structural comparisons of two proteins in the same familysometimes being completely different.
Conclusion: Proteins may have several stable conformations and the data derived from resolved structures as a‘gold standard’ should be optimized before being utilized as criteria to evaluate the prediction methods, e.g.sequence alignment from structural comparison. Helix/b-sheet transition exists in normal free proteins. The coilratio of the 3D structure could affect its resolution as determined by X-ray crystallography.
BackgroundThe best way to investigate the functions and mechan-ism of proteins at the molecular level is to obtain theirthree-dimensional (3D) structures [1-3]. However, it istime-consuming and expensive to determine proteinstructures by experimental methods and this has meantthat resolved protein structures have lagged greatlybehind known protein sequences [2,4]. Scientists havespent decades on protein structure prediction to acceler-ate the process of obtaining protein structures. Toadvance the progress of protein structure prediction,Critical Assessment of protein Structure Prediction(CASP) experiments have highlighted the shortcomings
in this field [1,5]. In general, the experimentally resolvedprotein structures, especially structures resolved byX-ray crystallography, and their derived data are used asthe criteria to evaluate the accuracy of methods of pro-tein structure prediction [1,6]. For example, to assessthe predicted 3D structures, structural comparisonswere performed between resolved structures and theirpredicted models, and root-mean-square deviation(RMSD) [7], TM-score [8], HBscore [1,9], GDT-HA orGDT-TS [1,5,7] were used to evaluate the difference.In fact, thermodynamics and kinetics dictate that pro-
tein structures are not static [10]. Work on enzyme cata-lytic mechanisms indicate that there are diverse steadyconformations for a single enzyme and they could coop-eratively change [11]. In addition, previous works hasshown that even under the same crystallization condi-tions, protein structures have marked variations [12,13].
* Correspondence: [email protected] Key Laboratory of Plant Physiology and Biochemistry, College ofBiological Sciences, China Agricultural University, Beijing 100094, People’sRepublic of China
Zhang and Su BMC Bioinformatics 2012, 13(Suppl 15):S12http://www.biomedcentral.com/1471-2105/13/S15/S12
© 2012 Zhang and Su; licensee BioMed Central Ltd. This is an open access article distributed under the terms of the CreativeCommons Attribution License (http://creativecommons.org/licenses/by/2.0), which permits unrestricted use, distribution, andreproduction in any medium, provided the original work is properly cited.
Thus the structure determined by X-ray crystallographymay be one of many conformations of a protein, and so itis inadequate to evaluate predicted models with limitedexperimental structures. Additionally, as proteins aredynamic machines [14,15] we can infer that their deriveddata should also not be unique. Secondary structure wob-ble has demonstrated that the secondary structure canchange and that there are limits to evaluation of proteinprediction accuracy [16,17].In the present study, some redundant data deposited in
PDB http://www.rcsb.org/[18] were collected to investigatethe characters of protein flexibility and evaluate its influ-ence on criteria for the assessment of work related tostructure prediction. At the 3D structural level, the maxi-mum RMSD of backbone Ca of two structures with identi-cal sequences could reach 5.43Å. At the secondarystructural level, we found helix/b-sheet transitions in nor-mal free proteins which had only been reported previouslyin prion or protein complexes [17,19-21]. Furthermore,with increasing resolution value, the ratio of the coil statein secondary structure increased. At primary structurallevel, the sequence alignments from structural compari-sons are variable in that there may be wrongly alignedsites in the datasets [22] that are used as criteria in thecomputational methods of sequence alignment. Then withanalysis of the characters of sequence alignments fromstructural comparison [e.g. secondary structure, evolution-ary distance (ED) and gaps] some suggestions for sequencealignment optimization were proposed.
Materials and methodsData collectionCD-HIT [23] was utilized for clustering the proteinsequences from the PDB database [18], the sequenceidentity threshold used was 0.99 as we tried to analysethe structures with few mutations, because these mutatedsites are in or around the functional important regionthat have often been altered by researchers in mechan-isms studies. HMMER3 was utilized to categorize theprotein family with an E-value cut-off of 0.0001 [24]. Thestructures were selected using the following rules:1. The sequential structures were determined by X-ray
crystallography with resolution < 3.5Å;2. There were > 4 structures for each identical
sequence;3. In each protein family, there were at least three
unique proteins.In general, structures with resolution < 2.5 Å are con-
sidered reliable. However, analysis of structures with lowresolution may supply some interesting informationabout protein flexibility. In the present study, 1,956 PDBentries were collected, with 1,588 having resolution <2.5 Å (Additional file 1: Figure S1 and Additional file 2).
Structures with identical sequences were defined as a‘structural group’. We obtained 3,652 structures from137 unique sequences and distributed in 24 proteinfamilies; and 62 structural groups contained mutations.The detailed protein families can be seen in Additionalfile 3; the PDB entries and mutation sites are shown inAdditional file 4. The structural folding types wereannotated by the SCOP 1.75 database [25] and shown inAdditional file 5. The functional divisions are shown inAdditional file 6. The dataset includes free proteins, pro-tein-ligand complexes and protein-protein complexes.
The flexibility of the protein structureTo analyse the flexibility of the 3D structure, TM-align[8] was utilized for structural comparisons. There were88,036 structural comparisons obtained within the samestructural group, which were utilized to indicate theflexibility of the 3D structure. There were 284,599 struc-tural comparisons obtained from comparisons betweenstructural groups within the same protein family, whichwere utilized to analyse the sequence alignmentvariation.
Secondary structure wobbleDSSP [26] was utilized to calculate the secondary struc-ture in investigation the secondary structure wobble.Then the secondary structures were translated intothree states: for ‘E’ to ‘E’, indicating b-sheet; for ‘H’, ‘I’and ‘G’ to ‘H’, indicating helix; and the others were to‘C’, indicating coil. We aligned all sequences derivedfrom structures in a group using MUSCLE [22] toexamine the secondary structure states of the equivalentsite. If one site had more than one secondary structurestate, it was called a secondary structure wobble [16].The wobble sites ratio was calculated using equation
1. The ‘Wobble Total’ was defined as the ratio of allwobble sites in a structural group. The ‘Wobble Single’was defined as the ratio of all wobble sites in two com-pared structures.To show that flexibility is a character of the proteins,
we selected structures for wobble analysis based onmany different requirements, e.g. without any differentligands, ions or other molecules.
Rw = Nw/Na × 100% (1)
Rw is the wobble sites ratio, Nw is the number of thewobble site and Na is the total number of protein sites.
Relationships between resolution and secondary structurewobbleThe resolution of the structures may also be determinedby their flexibility. Here, we investigated the relation-ships between resolution and wobble ratio. In brief, if
Zhang and Su BMC Bioinformatics 2012, 13(Suppl 15):S12http://www.biomedcentral.com/1471-2105/13/S15/S12
Page 2 of 9

there was a wobble site between two structures, the sec-ondary structure states were added to the equivalentcertain resolution values (the gradient value is 0.1 Å).After that the ratio of the coil state under a certainresolution set was calculated for all structures. Then thePearson’s correlation coefficient (PCC) between theresolution and the ratio of coil state was calculated.Finally, a linear relationship between resolution and coilratio was found. In addition, we checked the wobbleratio of structures with similar resolution.
Structural comparison and sequence alignment variationHere, we defined ‘group pairs’ as the results of the struc-tural comparison of two structural groups. The ‘grouppairs’ within the same family were utilized for sequencealignment variation analysis. If a site aligned the same resi-dues in all sequence alignments from group pairs, it wasdefined as a ‘common site’; or else defined as a ‘multi-site’.If a site aligned a gap in all the comparisons, it was definedas a “gap site”. We used equation 2 to calculate the ratio toreveal the sequence alignment variation.
Rx = Nx/Na × 100% (2)
Na is the average of the two proteins’ length; Nx is thenumber of common sites (Nc) or multi-sites (Nm) or gapsites (Ng); and Rx is the ratio of Nx to Na, Rc corre-sponds to Nc, Rm to Nm, and Rg to Ng.
Sequence alignment and secondary structureThe sequence alignment based on structural comparisonwas not unique, so that we tried to optimize them. Thesecondary structure is usually used to help the sequencealignment and so we calculated the ratio of the second-ary structure states of the three alignment states (com-mon, gap and multi sites) for each family. For thewobble sites, if there were two secondary structurestates in one site, then we added 0.5 to equivalent sec-ondary structure state number. Finally, we calculatedthe average of these ratios.
ED comparisonIn theory, high structural similarity corresponds to lowED. RMSD and TM-score were utilized to measure thestructural similarity. In each of the group pairs, two pairsof sequence alignments were selected based on the maxi-mum and minimum of RMSD and TM-score. Equation 3was utilized for ED calculation between the alignedsequences Sx and Sy which contain n aligned sites [27].
ED(SxSy) = [1−2×
n∑
iMSxiSyi
n∑
iMSxiSxi +
n∑
iMSyiSyi
]× 100 (3)
MSxiSyi is the score of the ith aligned residues pairs inSx and Sy followed the score matrix BLOSUM62. MSxiSxiand MSyiSyi are similar to MSxiSyi , but with the ith sitepairs of Sx or the ith site pairs of Sy, respectively. ED(SxSy) is the ED of sequences Sx and Sy.
Gaps of the exceptions in the ED comparisonFor the above ED comparison, some pairs’ sequence align-ments were not consistent with the hypothesis. Therefore,we further analysed the gaps difference of these excep-tions. Firstly, the residues without aligned residues onboth ends of the sequence alignment were deleted.Secondly, the number of gap-opening and gap-extensionwere counted. Thirdly, we compared the number of gapsof these exceptions in the ED comparison.
Statistical analysisIn this study, all statistical analyses were carried outusing the statistical package R [28]. The PCC analysisand classical regression were done with the cor.test andlm function respectively. Chi-square tests for calculationof significant differences were done using the chisq.testfunction.
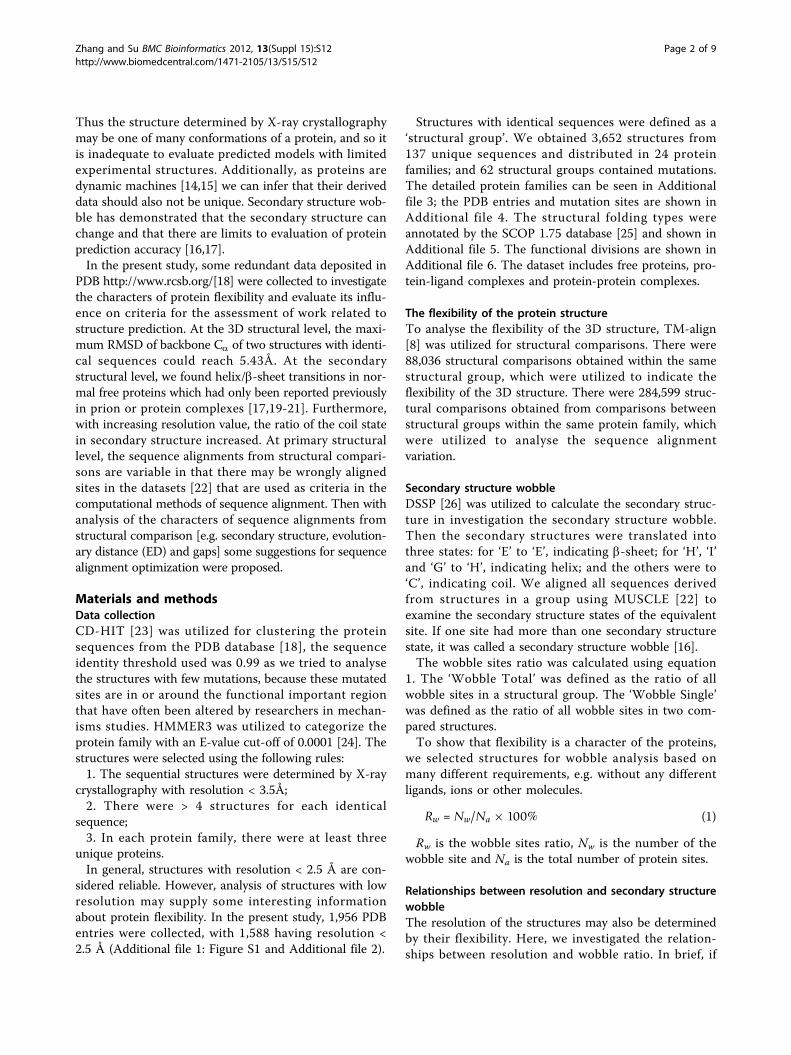
Results and discussionProtein structure flexibilityProtein structures are flexible [14,15]. The maximumRMSDs and the equivalent minimum TM-scores withinthe structural groups are shown in Figure 1A. The maxi-mum RMSD was 5.43Å (2BCX: A [29] and 2IX7: B [30])and most of their equivalent residues were not at the sameposition. The average of the maximum RMSD of the 137groups was 1.06 Å; for the 62 structural groups with muta-tions the average of the maximum RMSD was 1.03 Å,while for the remaining 75 structural groups was 1.08 Å.Combining the RMSD distributions of the groups with orwithout mutations, showed that the few mutations had lit-tle effect on global 3D structure. The scale of the struc-tural groups can also affect the RMSD and TM-score(Figure 1A). In addition, ions, ligands and other proteinscould cause more structural changes (data not shown).Two structures with identical sequence (PF01048) are
compared in Figure 1B; the structural changes betweenthe regular secondary structural segments could lead thestructures to be clearly different to each other. The 3Dtopological structures were still conserved.Except the impact of extrinsic factors, proteins are
intrinsic not static, even when arrayed in a crystal [13].The process to obtain structural data by X-ray crystallo-graphy would determine that the protein molecule isarrayed in an orderly pattern in the crystal for signalamplification and enhancement. The structural datafrom the experiment may be the last conformationbefore the protein crystal was froze in liquid nitrogen;
Zhang and Su BMC Bioinformatics 2012, 13(Suppl 15):S12http://www.biomedcentral.com/1471-2105/13/S15/S12
Page 3 of 9
however, at room temperature, the protein may trans-form from one conformation to another. Thus if weassess predicted models by structural comparison with alimited number of resolved structures, the result may beunreliable. Since the crystallization conditions of theresolved structures were known, we could use theseparameters in molecular dynamic (MD) simulation andcollect conformations with high RMSD but little energydifference to build a structural set as criteria.
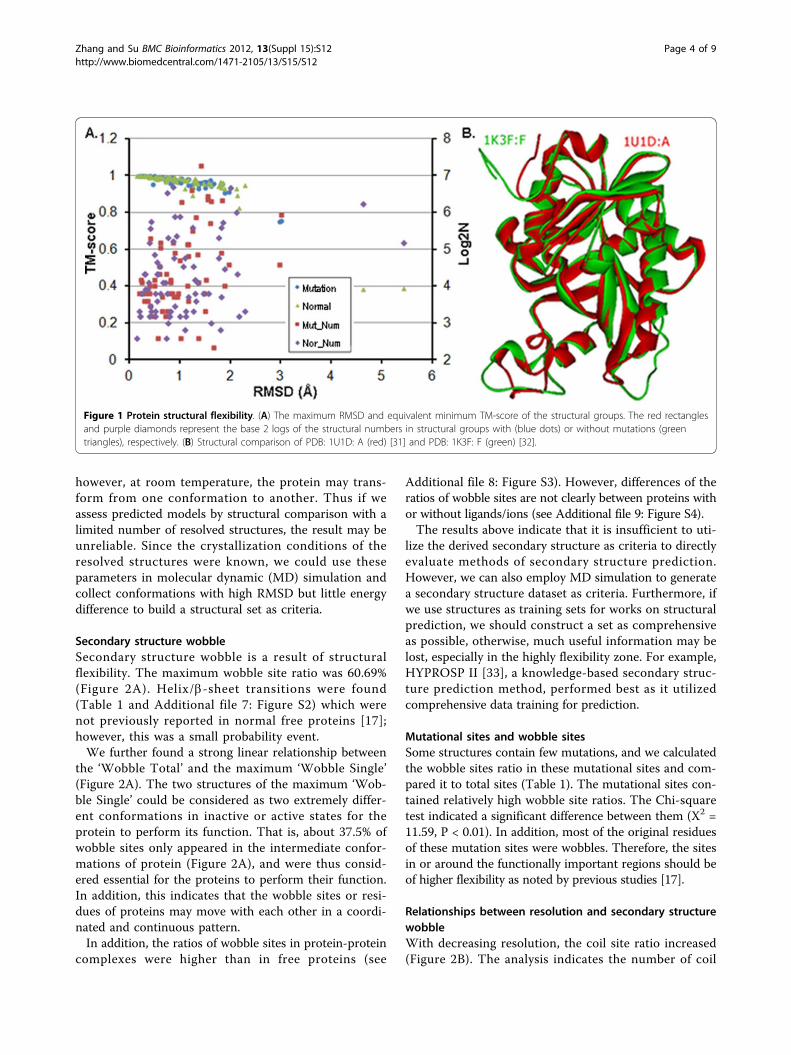
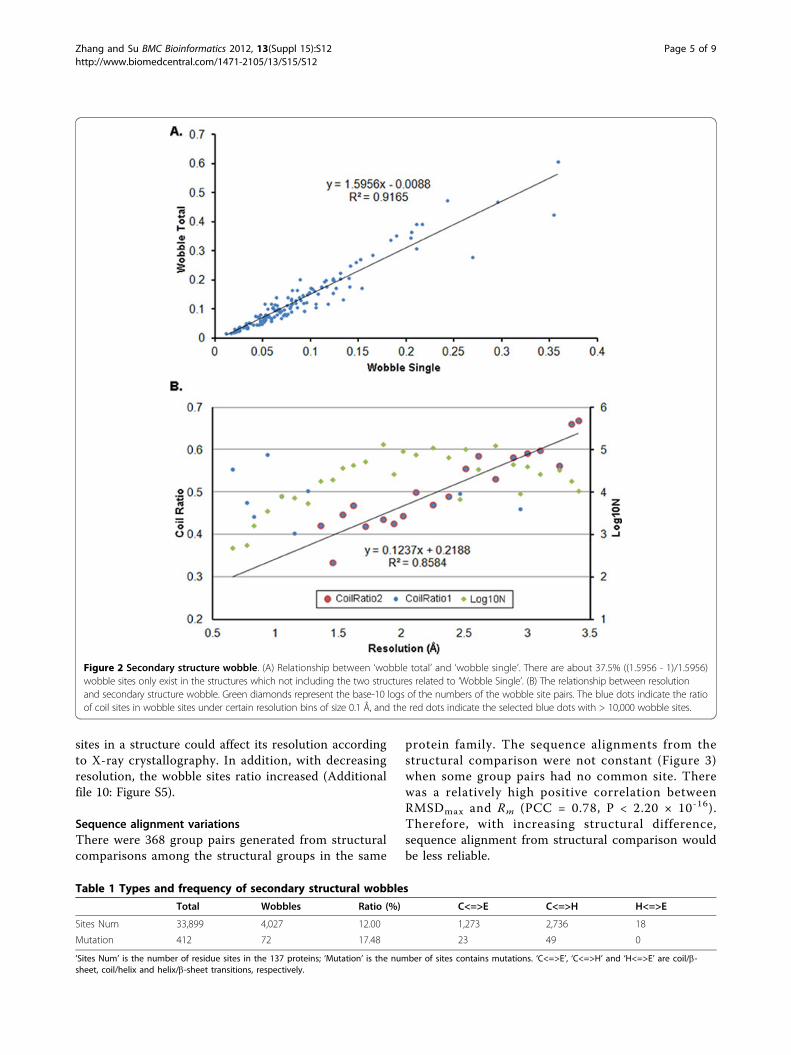
Secondary structure wobbleSecondary structure wobble is a result of structuralflexibility. The maximum wobble site ratio was 60.69%(Figure 2A). Helix/b-sheet transitions were found(Table 1 and Additional file 7: Figure S2) which werenot previously reported in normal free proteins [17];however, this was a small probability event.We further found a strong linear relationship between
the ‘Wobble Total’ and the maximum ‘Wobble Single’(Figure 2A). The two structures of the maximum ‘Wob-ble Single’ could be considered as two extremely differ-ent conformations in inactive or active states for theprotein to perform its function. That is, about 37.5% ofwobble sites only appeared in the intermediate confor-mations of protein (Figure 2A), and were thus consid-ered essential for the proteins to perform their function.In addition, this indicates that the wobble sites or resi-dues of proteins may move with each other in a coordi-nated and continuous pattern.In addition, the ratios of wobble sites in protein-protein
complexes were higher than in free proteins (see
Additional file 8: Figure S3). However, differences of theratios of wobble sites are not clearly between proteins withor without ligands/ions (see Additional file 9: Figure S4).The results above indicate that it is insufficient to uti-
lize the derived secondary structure as criteria to directlyevaluate methods of secondary structure prediction.However, we can also employ MD simulation to generatea secondary structure dataset as criteria. Furthermore, ifwe use structures as training sets for works on structuralprediction, we should construct a set as comprehensiveas possible, otherwise, much useful information may belost, especially in the highly flexibility zone. For example,HYPROSP II [33], a knowledge-based secondary struc-ture prediction method, performed best as it utilizedcomprehensive data training for prediction.
Mutational sites and wobble sitesSome structures contain few mutations, and we calculatedthe wobble sites ratio in these mutational sites and com-pared it to total sites (Table 1). The mutational sites con-tained relatively high wobble site ratios. The Chi-squaretest indicated a significant difference between them (X2 =11.59, P < 0.01). In addition, most of the original residuesof these mutation sites were wobbles. Therefore, the sitesin or around the functionally important regions should beof higher flexibility as noted by previous studies [17].
Relationships between resolution and secondary structurewobbleWith decreasing resolution, the coil site ratio increased(Figure 2B). The analysis indicates the number of coil
Figure 1 Protein structural flexibility. (A) The maximum RMSD and equivalent minimum TM-score of the structural groups. The red rectanglesand purple diamonds represent the base 2 logs of the structural numbers in structural groups with (blue dots) or without mutations (greentriangles), respectively. (B) Structural comparison of PDB: 1U1D: A (red) [31] and PDB: 1K3F: F (green) [32].
Zhang and Su BMC Bioinformatics 2012, 13(Suppl 15):S12http://www.biomedcentral.com/1471-2105/13/S15/S12
Page 4 of 9
sites in a structure could affect its resolution accordingto X-ray crystallography. In addition, with decreasingresolution, the wobble sites ratio increased (Additionalfile 10: Figure S5).
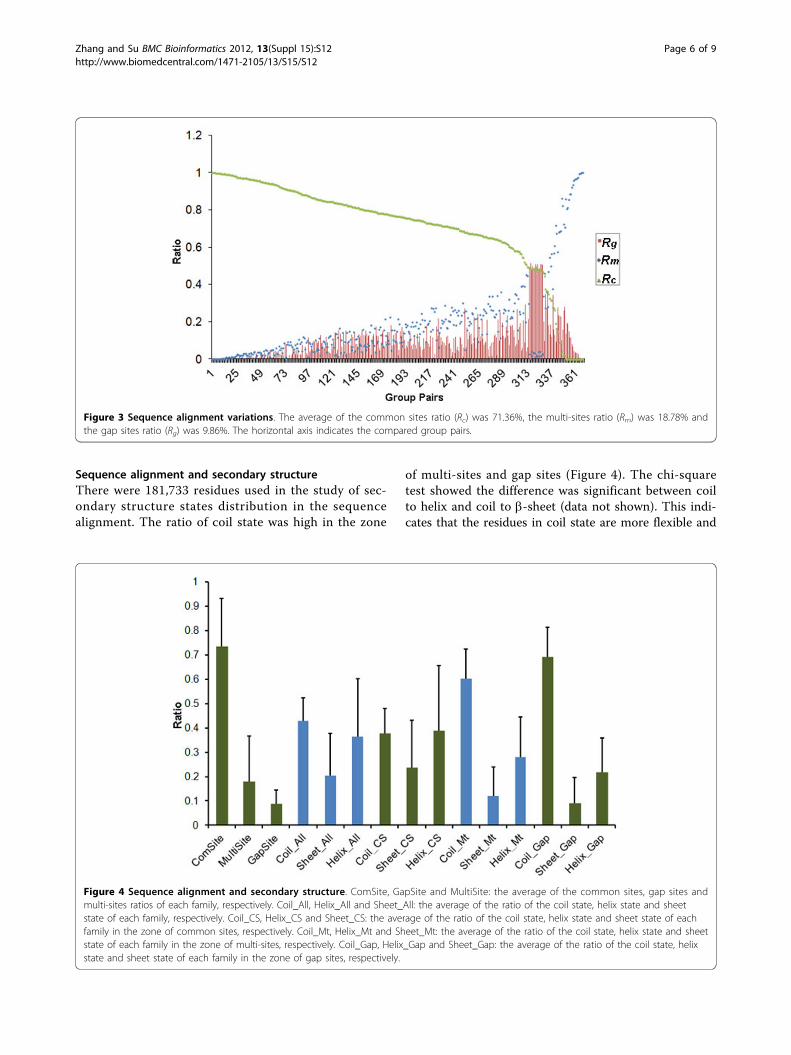
Sequence alignment variationsThere were 368 group pairs generated from structuralcomparisons among the structural groups in the same
protein family. The sequence alignments from thestructural comparison were not constant (Figure 3)when some group pairs had no common site. Therewas a relatively high positive correlation betweenRMSDmax and Rm (PCC = 0.78, P < 2.20 × 10⁻¹⁶).Therefore, with increasing structural difference,sequence alignment from structural comparison wouldbe less reliable.
Figure 2 Secondary structure wobble. (A) Relationship between ‘wobble total’ and ‘wobble single’. There are about 37.5% ((1.5956 - 1)/1.5956)wobble sites only exist in the structures which not including the two structures related to ‘Wobble Single’. (B) The relationship between resolutionand secondary structure wobble. Green diamonds represent the base-10 logs of the numbers of the wobble site pairs. The blue dots indicate the ratioof coil sites in wobble sites under certain resolution bins of size 0.1 Å, and the red dots indicate the selected blue dots with > 10,000 wobble sites.
Table 1 Types and frequency of secondary structural wobbles
Total Wobbles Ratio (%) C<=>E C<=>H H<=>E
Sites Num 33,899 4,027 12.00 1,273 2,736 18
Mutation 412 72 17.48 23 49 0
’Sites Num’ is the number of residue sites in the 137 proteins; ‘Mutation’ is the number of sites contains mutations. ‘C<=>E’, ‘C<=>H’ and ‘H<=>E’ are coil/b-sheet, coil/helix and helix/b-sheet transitions, respectively.
Zhang and Su BMC Bioinformatics 2012, 13(Suppl 15):S12http://www.biomedcentral.com/1471-2105/13/S15/S12
Page 5 of 9
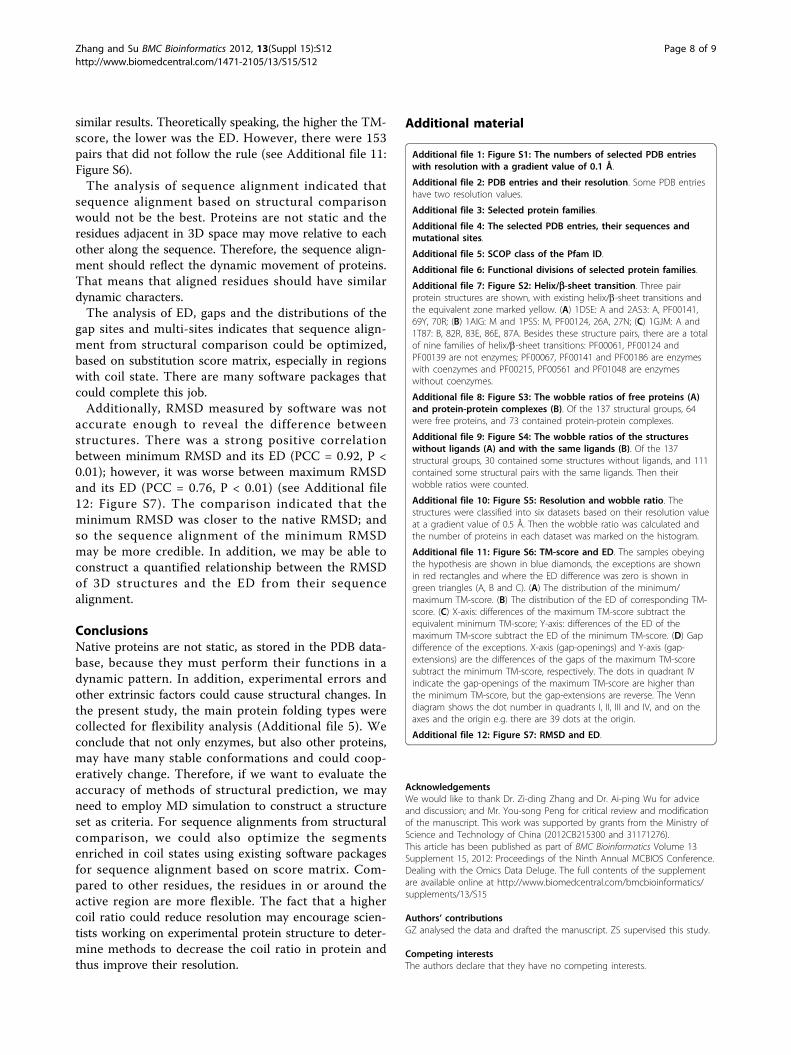
Sequence alignment and secondary structureThere were 181,733 residues used in the study of sec-ondary structure states distribution in the sequencealignment. The ratio of coil state was high in the zone
of multi-sites and gap sites (Figure 4). The chi-squaretest showed the difference was significant between coilto helix and coil to b-sheet (data not shown). This indi-cates that the residues in coil state are more flexible and
Figure 3 Sequence alignment variations. The average of the common sites ratio (Rc) was 71.36%, the multi-sites ratio (Rm) was 18.78% andthe gap sites ratio (Rg) was 9.86%. The horizontal axis indicates the compared group pairs.
Figure 4 Sequence alignment and secondary structure. ComSite, GapSite and MultiSite: the average of the common sites, gap sites andmulti-sites ratios of each family, respectively. Coil_All, Helix_All and Sheet_All: the average of the ratio of the coil state, helix state and sheetstate of each family, respectively. Coil_CS, Helix_CS and Sheet_CS: the average of the ratio of the coil state, helix state and sheet state of eachfamily in the zone of common sites, respectively. Coil_Mt, Helix_Mt and Sheet_Mt: the average of the ratio of the coil state, helix state and sheetstate of each family in the zone of multi-sites, respectively. Coil_Gap, Helix_Gap and Sheet_Gap: the average of the ratio of the coil state, helixstate and sheet state of each family in the zone of gap sites, respectively.
Zhang and Su BMC Bioinformatics 2012, 13(Suppl 15):S12http://www.biomedcentral.com/1471-2105/13/S15/S12
Page 6 of 9

we could refine the sequence alignment of segmentsenriched in coil state.
ED, gaps and sequence alignment optimizationThere were 368 pairs sequence alignments for compari-son analysis based on RMSD. In theory, the lower theRMSD, the lower was the ED. The distribution of maxi-mum/minimum RMSDs and EDs are shown in Figure5A and 5B, respectively. However, there were 108 pairsthat did not follow this rule. The difference between
RMSDs and equivalent EDs are shown in Figure 5C.Compared to the samples obeying the theoreticalhypothesis, the ED difference of the exceptions weresmaller. For the exceptions, the difference in the num-ber of gap-openings and gap-extensions is shown in Fig-ure 5D, this shows that most of the sequencealignments with minimum RMSD had less gaps, andespecially gap-extensions.At the same time, we analysed 368 pairs of sequence
alignments, selected based on TM-score, and obtained
Figure 5 RMSD and ED. The samples obeying the theoretical hypothesis are shown in blue diamonds, the exceptions are shown in redrectangles and where the ED difference was zero is shown in green triangles (A, B and C). (A) The distribution of the minimum/maximumRMSD. (B) The distribution of the ED of corresponding RMSD. (C) X-axis: differences of the maximum RMSD subtract the equivalent minimumRMSD; Y-axis: differences of the ED of the minimum RMSD subtract the ED of the maximum RMSD. (D) Gap difference of the exceptions. X-axis(gap-openings) and Y-axis (gap-extensions) are the differences of the gaps of the minimum RMSD subtract the maximum RMSD, respectively.The dots in quadrant IV indicate the gap-openings of the minimum RMSD are higher than the maximum RMSD, but the gap-extensions arereverse. The Venn diagram shows the dot number in quadrants I, II, III and IV, and on the axes and the origin e.g. there are 31 dots at the origin,32 dots in quadrant of III and 12 dots in quadrant of IV.
Zhang and Su BMC Bioinformatics 2012, 13(Suppl 15):S12http://www.biomedcentral.com/1471-2105/13/S15/S12
Page 7 of 9
similar results. Theoretically speaking, the higher the TM-score, the lower was the ED. However, there were 153pairs that did not follow the rule (see Additional file 11:Figure S6).The analysis of sequence alignment indicated that
sequence alignment based on structural comparisonwould not be the best. Proteins are not static and theresidues adjacent in 3D space may move relative to eachother along the sequence. Therefore, the sequence align-ment should reflect the dynamic movement of proteins.That means that aligned residues should have similardynamic characters.The analysis of ED, gaps and the distributions of the
gap sites and multi-sites indicates that sequence align-ment from structural comparison could be optimized,based on substitution score matrix, especially in regionswith coil state. There are many software packages thatcould complete this job.Additionally, RMSD measured by software was not
accurate enough to reveal the difference betweenstructures. There was a strong positive correlationbetween minimum RMSD and its ED (PCC = 0.92, P <0.01); however, it was worse between maximum RMSDand its ED (PCC = 0.76, P < 0.01) (see Additional file12: Figure S7). The comparison indicated that theminimum RMSD was closer to the native RMSD; andso the sequence alignment of the minimum RMSDmay be more credible. In addition, we may be able toconstruct a quantified relationship between the RMSDof 3D structures and the ED from their sequencealignment.
ConclusionsNative proteins are not static, as stored in the PDB data-base, because they must perform their functions in adynamic pattern. In addition, experimental errors andother extrinsic factors could cause structural changes. Inthe present study, the main protein folding types werecollected for flexibility analysis (Additional file 5). Weconclude that not only enzymes, but also other proteins,may have many stable conformations and could coop-eratively change. Therefore, if we want to evaluate theaccuracy of methods of structural prediction, we mayneed to employ MD simulation to construct a structureset as criteria. For sequence alignments from structuralcomparison, we could also optimize the segmentsenriched in coil states using existing software packagesfor sequence alignment based on score matrix. Com-pared to other residues, the residues in or around theactive region are more flexible. The fact that a highercoil ratio could reduce resolution may encourage scien-tists working on experimental protein structure to deter-mine methods to decrease the coil ratio in protein andthus improve their resolution.
Additional material
Additional file 1: Figure S1: The numbers of selected PDB entrieswith resolution with a gradient value of 0.1 Å.
Additional file 2: PDB entries and their resolution. Some PDB entrieshave two resolution values.
Additional file 3: Selected protein families.
Additional file 4: The selected PDB entries, their sequences andmutational sites.
Additional file 5: SCOP class of the Pfam ID.
Additional file 6: Functional divisions of selected protein families.
Additional file 7: Figure S2: Helix/b-sheet transition. Three pairprotein structures are shown, with existing helix/b-sheet transitions andthe equivalent zone marked yellow. (A) 1DSE: A and 2AS3: A, PF00141,69Y, 70R; (B) 1AIG: M and 1PSS: M, PF00124, 26A, 27N; (C) 1GJM: A and1T87: B, 82R, 83E, 86E, 87A. Besides these structure pairs, there are a totalof nine families of helix/b-sheet transitions: PF00061, PF00124 andPF00139 are not enzymes; PF00067, PF00141 and PF00186 are enzymeswith coenzymes and PF00215, PF00561 and PF01048 are enzymeswithout coenzymes.
Additional file 8: Figure S3: The wobble ratios of free proteins (A)and protein-protein complexes (B). Of the 137 structural groups, 64were free proteins, and 73 contained protein-protein complexes.
Additional file 9: Figure S4: The wobble ratios of the structureswithout ligands (A) and with the same ligands (B). Of the 137structural groups, 30 contained some structures without ligands, and 111contained some structural pairs with the same ligands. Then theirwobble ratios were counted.
Additional file 10: Figure S5: Resolution and wobble ratio. Thestructures were classified into six datasets based on their resolution valueat a gradient value of 0.5 Å. Then the wobble ratio was calculated andthe number of proteins in each dataset was marked on the histogram.
Additional file 11: Figure S6: TM-score and ED. The samples obeyingthe hypothesis are shown in blue diamonds, the exceptions are shownin red rectangles and where the ED difference was zero is shown ingreen triangles (A, B and C). (A) The distribution of the minimum/maximum TM-score. (B) The distribution of the ED of corresponding TM-score. (C) X-axis: differences of the maximum TM-score subtract theequivalent minimum TM-score; Y-axis: differences of the ED of themaximum TM-score subtract the ED of the minimum TM-score. (D) Gapdifference of the exceptions. X-axis (gap-openings) and Y-axis (gap-extensions) are the differences of the gaps of the maximum TM-scoresubtract the minimum TM-score, respectively. The dots in quadrant IVindicate the gap-openings of the maximum TM-score are higher thanthe minimum TM-score, but the gap-extensions are reverse. The Venndiagram shows the dot number in quadrants I, II, III and IV, and on theaxes and the origin e.g. there are 39 dots at the origin.
Additional file 12: Figure S7: RMSD and ED.
AcknowledgementsWe would like to thank Dr. Zi-ding Zhang and Dr. Ai-ping Wu for adviceand discussion; and Mr. You-song Peng for critical review and modificationof the manuscript. This work was supported by grants from the Ministry ofScience and Technology of China (2012CB215300 and 31171276).This article has been published as part of BMC Bioinformatics Volume 13Supplement 15, 2012: Proceedings of the Ninth Annual MCBIOS Conference.Dealing with the Omics Data Deluge. The full contents of the supplementare available online at http://www.biomedcentral.com/bmcbioinformatics/supplements/13/S15
Authors’ contributionsGZ analysed the data and drafted the manuscript. ZS supervised this study.
Competing interestsThe authors declare that they have no competing interests.
Zhang and Su BMC Bioinformatics 2012, 13(Suppl 15):S12http://www.biomedcentral.com/1471-2105/13/S15/S12
Page 8 of 9
Published: 11 September 2012
References1. Read RJ, Chavali G: Assessment of CASP7 predictions in the high
accuracy template-based modeling category. Proteins 2007,69(Suppl 8):27-37.
2. Zhang Y: Protein structure prediction: when is it useful? Curr Opin StructBiol 2009, 19(2):145-155.
3. Baker D, Sali A: Protein structure prediction and structural genomics.Science 2001, 294(5540):93-96.
4. Chandonia JM, Brenner SE: The impact of structural genomics:expectations and outcomes. Science 2006, 311(5759):347-351.
5. Xu D, Zhang J, Roy A, Zhang Y: Automated protein structure modeling inCASP9 by I-TASSER pipeline combined with QUARK-based ab initiofolding and FG-MD-based structure refinement. Proteins 2011,79(Suppl 10):147-160.
6. Izarzugaza JM, Grana O, Tress ML, Valencia A, Clarke ND: Assessment ofintramolecular contact predictions for CASP7. Proteins 2007,69(Suppl 8):152-158.
7. Zemla A: LGA: A method for finding 3D similarities in protein structures.Nucleic Acids Res 2003, 31(13):3370-3374.
8. Zhang Y, Skolnick J: TM-align: a protein structure alignment algorithmbased on the TM-score. Nucleic Acids Res 2005, 33(7):2302-2309.
9. McDonald IK, Thornton JM: Satisfying hydrogen bonding potential inproteins. J Mol Biol 1994, 238(5):777-793.
10. Han JH, Batey S, Nickson AA, Teichmann SA, Clarke J: The folding andevolution of multidomain proteins. Nat Rev Mol Cell Biol 2007,8(4):319-330.
11. Hammes GG, Benkovic SJ, Hammes-Schiffer S: Flexibility, diversity, andcooperativity: pillars of enzyme catalysis. Biochemistry 2011,50(48):10422-10430.
12. Dodson G, Verma CS: Protein flexibility: its role in structure andmechanism revealed by molecular simulations. Cell Mol Life Sci 2006,63(2):207-219.
13. Judge RA, Jacobs RS, Frazier T, Snell EH, Pusey ML: The effect oftemperature and solution pH on the nucleation of tetragonal lysozymecrystals. Biophys J 1999, 77(3):1585-1593.
14. van der Kamp MW, Schaeffer RD, Jonsson AL, Scouras AD, Simms AM,Toofanny RD, Benson NC, Anderson PC, Merkley ED, Rysavy S, et al:Dynameomics: a comprehensive database of protein dynamics. Structure2010, 18(4):423-435.
15. Kanelis V, Forman-Kay JD, Kay LE: Multidimensional NMR methods forprotein structure determination. IUBMB Life 2001, 52(6):291-302.
16. Huang JT, Wang MT: Secondary structural wobble: the limits of proteinprediction accuracy. Biochem Biophys Res Commun 2002, 294(3):621-625.
17. Gromiha MM, Saranya N, Selvaraj S, Jayaram B, Fukui K: Sequence andstructural features of binding site residues in protein-protein complexes:comparison with protein-nucleic acid complexes. Proteome Sci 2011,9(Suppl 1):S13.
18. Berman HM, Westbrook J, Feng Z, Gilliland G, Bhat TN, Weissig H,Shindyalov IN, Bourne PE: The Protein Data Bank. Nucleic Acids Res 2000,28(1):235-242.
19. Prusiner SB, Scott MR, DeArmond SJ, Cohen FE: Prion protein biology. Cell1998, 93(3):337-348.
20. Lee C, Yu MH: Protein folding and diseases. J Biochem Mol Biol 2005,38(3):275-280.
21. Norrby E: Prions and protein-folding diseases. J Intern Med 2011,270(1):1-14.
22. Edgar RC: MUSCLE: multiple sequence alignment with high accuracy andhigh throughput. Nucleic Acids Res 2004, 32(5):1792-1797.
23. Li W, Godzik A: Cd-hit: a fast program for clustering and comparing largesets of protein or nucleotide sequences. Bioinformatics 2006,22(13):1658-1659.
24. Finn RD, Mistry J, Tate J, Coggill P, Heger A, Pollington JE, Gavin OL,Gunasekaran P, Ceric G, Forslund K, et al: The Pfam protein familiesdatabase. Nucleic Acids Res 2010, , 38 Database issue: D211-222.
25. Andreeva A, Howorth D, Chandonia JM, Brenner SE, Hubbard TJ, Chothia C,Murzin AG: Data growth and its impact on the SCOP database: newdevelopments. Nucleic Acids Res 2008, , 36 Database issue: D419-425.
26. Hooft RW, Sander C, Scharf M, Vriend G: The PDBFINDER database: asummary of PDB, DSSP and HSSP information with added value. ComputAppl Biosci 1996, 12(6):525-529.
27. Vicatos S, Reddy BV, Kaznessis Y: Prediction of distant residue contactswith the use of evolutionary information. Proteins 2005, 58(4):935-949.
28. Dessau RB, Pipper CB: “R"–project for statistical computing. Ugeskr Laeger2008, 170(5):328-330.
29. Maximciuc AA, Putkey JA, Shamoo Y, Mackenzie KR: Complex ofcalmodulin with a ryanodine receptor target reveals a novel, flexiblebinding mode. Structure 2006, 14(10):1547-1556.
30. Houdusse A, Gaucher JF, Krementsova E, Mui S, Trybus KM, Cohen C:Crystal structure of apo-calmodulin bound to the first two IQ motifs ofmyosin V reveals essential recognition features. Proc Natl Acad Sci USA2006, 103(51):19326-19331.
31. Bu W, Settembre EC, el Kouni MH, Ealick SE: Structural basis for inhibitionof Escherichia coli uridine phosphorylase by 5-substitutedacyclouridines. Acta Crystallogr D Biol Crystallogr 2005, 61(Pt 7):863-872.
32. Morgunova E, Mikhailov AM, Popov AN, Blagova EV, Smirnova EA,Vainshtein BK, Mao C, Armstrong Sh R, Ealick SE, Komissarov AA, et al:Atomic structure at 2.5 A resolution of uridine phosphorylase from E.coli as refined in the monoclinic crystal lattice. FEBS Lett 1995,367(2):183-187.
33. Lin HN, Chang JM, Wu KP, Sung TY, Hsu WL: HYPROSP II–a knowledge-based hybrid method for protein secondary structure prediction basedon local prediction confidence. Bioinformatics 2005, 21(15):3227-3233.
doi:10.1186/1471-2105-13-S15-S12Cite this article as: Zhang and Su: Inferences from structuralcomparison: flexibility, secondary structure wobble and sequencealignment optimization. BMC Bioinformatics 2012 13(Suppl 15):S12.
Submit your next manuscript to BioMed Centraland take full advantage of:
• Convenient online submission
• Thorough peer review
• No space constraints or color figure charges
• Immediate publication on acceptance
• Inclusion in PubMed, CAS, Scopus and Google Scholar
• Research which is freely available for redistribution
Submit your manuscript at www.biomedcentral.com/submit
Zhang and Su BMC Bioinformatics 2012, 13(Suppl 15):S12http://www.biomedcentral.com/1471-2105/13/S15/S12
Page 9 of 9