proceedings of the ninth international conference on ... filee-mail: [email protected] patricia...
TRANSCRIPT

Advances in Intelligent Systems and Computing 286
Proceedings of the Ninth International Conference on Dependability and Complex Systems DepCoS-RELCOMEX. June 30 – July 4, 2014, Brunów, Poland
Wojciech Zamojski · Jacek MazurkiewiczJarosław Sugier · Tomasz WalkowiakJanusz Kacprzyk Editors

Advances in Intelligent Systems and Computing
Volume 286
Series editor
Janusz Kacprzyk, Polish Academy of Sciences, Warsaw, Polande-mail: [email protected]
For further volumes:
http://www.springer.com/series/11156

About this Series
The series “Advances in Intelligent Systems and Computing” contains publications on theory,applications, and design methods of Intelligent Systems and Intelligent Computing. Virtually alldisciplines such as engineering, natural sciences, computer and information science, ICT, eco-nomics, business, e-commerce, environment, healthcare, life science are covered. The list of top-ics spans all the areas of modern intelligent systems and computing.
The publications within “Advances in Intelligent Systems and Computing” are primarilytextbooks and proceedings of important conferences, symposia and congresses. They cover sig-nificant recent developments in the field, both of a foundational and applicable character. Animportant characteristic feature of the series is the short publication time and world-wide distri-bution. This permits a rapid and broad dissemination of research results.
Advisory Board
Chairman
Nikhil R. Pal, Indian Statistical Institute, Kolkata, Indiae-mail: [email protected]
Members
Rafael Bello, Universidad Central “Marta Abreu” de Las Villas, Santa Clara, Cubae-mail: [email protected]
Emilio S. Corchado, University of Salamanca, Salamanca, Spaine-mail: [email protected]
Hani Hagras, University of Essex, Colchester, UKe-mail: [email protected]
László T. Kóczy, Széchenyi István University, Gyor, Hungarye-mail: [email protected]
Vladik Kreinovich, University of Texas at El Paso, El Paso, USAe-mail: [email protected]
Chin-Teng Lin, National Chiao Tung University, Hsinchu, Taiwane-mail: [email protected]
Jie Lu, University of Technology, Sydney, Australiae-mail: [email protected]
Patricia Melin, Tijuana Institute of Technology, Tijuana, Mexicoe-mail: [email protected]
Nadia Nedjah, State University of Rio de Janeiro, Rio de Janeiro, Brazile-mail: [email protected]
Ngoc Thanh Nguyen, Wroclaw University of Technology, Wroclaw, Polande-mail: [email protected]
Jun Wang, The Chinese University of Hong Kong, Shatin, Hong Konge-mail: [email protected]

Wojciech Zamojski · Jacek MazurkiewiczJarosław Sugier · Tomasz WalkowiakJanusz KacprzykEditors
Proceedings of the NinthInternational Conferenceon Dependability andComplex SystemsDepCoS-RELCOMEX.June 30 – July 4, 2014,Brunów, Poland
ABC

EditorsWojciech ZamojskiInstitute of Computer Engineering, Control
and RoboticsWrocław University of TechnologyWrocławPoland
Jacek MazurkiewiczInstitute of Computer Engineering, Control
and RoboticsWrocław University of TechnologyWrocławPoland
Jarosław SugierInstitute of Computer Engineering, Control
and RoboticsWrocław University of TechnologyWrocławPoland
Tomasz WalkowiakInstitute of Computer Engineering, Control
and RoboticsWrocław University of TechnologyWrocławPoland
Janusz KacprzykPolish Academy of SciencesSystems Research InstituteWarsawPoland
ISSN 2194-5357 ISSN 2194-5365 (electronic)ISBN 978-3-319-07012-4 ISBN 978-3-319-07013-1 (eBook)DOI 10.1007/978-3-319-07013-1Springer Cham Heidelberg New York Dordrecht London
Library of Congress Control Number: 2014939038
c© Springer International Publishing Switzerland 2014This work is subject to copyright. All rights are reserved by the Publisher, whether the whole or part of thematerial is concerned, specifically the rights of translation, reprinting, reuse of illustrations, recitation, broad-casting, reproduction on microfilms or in any other physical way, and transmission or information storageand retrieval, electronic adaptation, computer software, or by similar or dissimilar methodology now knownor hereafter developed. Exempted from this legal reservation are brief excerpts in connection with reviewsor scholarly analysis or material supplied specifically for the purpose of being entered and executed on acomputer system, for exclusive use by the purchaser of the work. Duplication of this publication or partsthereof is permitted only under the provisions of the Copyright Law of the Publisher’s location, in its cur-rent version, and permission for use must always be obtained from Springer. Permissions for use may beobtained through RightsLink at the Copyright Clearance Center. Violations are liable to prosecution underthe respective Copyright Law.The use of general descriptive names, registered names, trademarks, service marks, etc. in this publicationdoes not imply, even in the absence of a specific statement, that such names are exempt from the relevantprotective laws and regulations and therefore free for general use.While the advice and information in this book are believed to be true and accurate at the date of publication,neither the authors nor the editors nor the publisher can accept any legal responsibility for any errors oromissions that may be made. The publisher makes no warranty, express or implied, with respect to the materialcontained herein.
Printed on acid-free paper
Springer is part of Springer Science+Business Media (www.springer.com)

Preface
We are pleased to present the proceedings of the Ninth International Conferenceon Dependability and Complex Systems DepCoS-RELCOMEX, which took placein a beautiful Brunow Palace, Poland, from 30th June to 4th July, 2014.
Started in 2006, DepCoS – RELCOMEX is a conference organized annuallyby the Institute of Computer Engineering, Control and Robotics (CECR) fromWroc�law University of Technology. Its roots go nearly 40 years back to the her-itage of the other two cycles of events: RELCOMEX (1977 – 89) and Microcom-puter Schools (1985 – 95) which were organized by the Institute of EngineeringCybernetics (the previous name of CECR) under the leadership of prof. Woj-ciech Zamojski, now also the DepCoS chairman. In this volume of “Advancesin Intelligent and Soft Computing” we would like to present results of researchon selected problems of complex systems and their dependability. Effects of theprevious DepCoS events were published in volumes 97, 170 and 224 of this series.
Today’s complex systems are integrated unities of technical, information, orga-nization, software and human (users, administrators and management) resources.Complexity of such systems comes not only from their involved technical andorganizational structures built on hardware and software resources but mainlyfrom complexity of information processes (processing, monitoring, management,etc.) realized in their specific environment. In operation of such wide-rangingand diverse systems their resources are dynamically allocated to ongoing tasksand the rhythm of system events (incoming and/or ongoing tasks, decisions ofa management subsystem, system faults, “defense” system reactions, etc.) maybe considered as deterministic or/and probabilistic event stream. Security andconfidentiality of information processing introduce further complications intothe modelling and evaluation methods. Diversity of the processes being realized,their concurrency and their reliance on in-system intelligence often significantlyimpedes construction of strict mathematical models and calls for application ofintelligent and soft computing methods.
Dependability is the modern approach to reliability problems of contemporarycomplex systems. It is worth to underline the difference between the two terms:system dependability and system reliability. Dependability of systems, especially
VI Preface
computer systems and networks, is based on multi-disciplinary approach to the-ory, technology, and maintenance of the systems working in a real (and very oftenunfriendly) environment. Dependability concentrates on efficient realization oftasks, services and jobs by a system considered as a unity of technical, informa-tion and human assets, while “classical” reliability is more restrained to analysisof technical system resources (components and structures built from them).
Presenting our conference proceedings to the broader audience we would liketo express the sincerest thanks to all the authors who have chosen to describetheir research here. It is our hope that the communicated results will help infurther developments in complex systems design and analysis aimed at improvingtheir dependability. We believe that the selected contributions will be interestingto all scientists, researchers, practitioners and students who work in these fieldsof science.
Concluding this brief introduction we must emphasize the role of all review-ers who took part in the evaluation process and whose contribution helped torefine the contents of this volume. Our thanks go to, in alphabetic order, SalemAbdel-Badeeh, Andrzej Bia�las, Frank Coolen, Manuel Gil Perez, Zbigniew Huzar,Jacek Jarnicki, Vyacheslav Kharchenko, Mieczys�law M. Kokar, Alexey Lastovet-sky, Marek Litwin, Jan Magott, Istvan Majzik, Jacek Mazurkiewicz, KatarzynaM. Nowak, Yiannis Papadopoulos, Oksana Pomorova, Krzysztof Sacha, RuslanSmeliansky, Janusz Sosnowski, Jaros�law Sugier, Victor Toporkov, Carsten Trini-tis, Tomasz Walkowiak, Max Walter, Bernd E. Wolfinger, Marina Yashina, IrinaYatskiv, Wojciech Zamojski, and W�lodzimierz Zuberek.
The Editors
Ninth International Conference onDependability and Complex Systems
DepCoS-RELCOMEX
organized by
Institute of Computer Engineering, Control and Robotics,Wroc�law University of Technology
under the auspices of prof. Tadeusz Wi ↪eckowski, Rector
Brunow Palace, Poland, June 30 – July 4, 2014
Programme Committee
Wojciech Zamojski (Chairman) Wroc�law University of Technology, PolandSalem Abdel-Badeeh Ain Shams University Abbasia, Cairo, EgyptAli Al-Dahoud Al-Zaytoonah University, Amman, JordanGeorge Anders University of Toronto, CanadaArtem Adzhemov Technical University of Communications
and Informatics, Moscow, RussiaW�lodzimierz M. Baranski Wroc�law University of Technology, PolandAndrzej Bia�las Institute of Innovative Technologies EMAG,
Katowice, PolandDariusz Caban Wroc�law University of Technology, PolandKrzysztof Cios Virginia Commonwealth University, Richmond,
USAFrank Coolen Durham University, UKAntonio Ferrari University of Aveiro, PortugalFrancesco Flammini University of Naples “Federico II”, Napoli, ItalyManuel Gill Perez University of Murcia, SpainJanusz Gorski Gdansk University of Technology, PolandZbigniew Huzar Wroc�law University of Technology, PolandIgor Kabashkin Transport and Telecommunication Institute,
Riga, LatviaJanusz Kacprzyk Polish Academy of Sciences, Warsaw, PolandAndrzej Kasprzak Wroc�law University of Technology, PolandVyacheslav S. Kharchenko National Aerospace University “KhAI”,
Kharkov, UkraineMieczys�law M. Kokar Northeastern University, Boston, USAKrzysztof Ko�lowrocki Gdynia Maritime University, PolandLeszek Kotulski AGH University of Science and Technology,
Krakow, PolandHenryk Krawczyk Gdansk University of Technology, Poland

VIII Ninth International Conference on Dependability
Alexey Lastovetsky University College Dublin, IrelandMarek Litwin ITS Polska, Warsaw, PolandJan Magott Wroc�law University of Technology, PolandIstvan Majzik Budapest University of Technology
and Economics, HungaryJacek Mazurkiewicz Wroc�law University of Technology, PolandKatarzyna M. Nowak Objectivity Bespoke Software Specialists
Sp. z o.o., Wroc�law, PolandYiannis Papadopoulos Hull University, UKOksana Pomorova Khmelnitsky National University, UkraineEwaryst Rafaj�lowicz Wroc�law University of Technology, PolandNikolay Rogalev Moscow Power Engineering Institute
(Technical University), RussiaKrzysztof Sacha Warsaw University of Technology, PolandMiros�law Siergiejczyk Warsaw University of Technology, PolandRuslan Smeliansky Moscow State University, RussiaCzes�law Smutnicki Wroc�law University of Technology, PolandJanusz Sosnowski Warsaw University of Technology, PolandJaros�law Sugier Wroc�law University of Technology, PolandRyszard Tadeusiewicz AGH University of Science and Technology,
Krakow, PolandVictor Toporkov Moscow Power Engineering Institute
(Technical University), RussiaCasten Trinitis Technische Universitat Munchen, GermanyTomasz Walkowiak Wroc�law University of Technology, PolandMax Walter Siemens, GermanyBernd E. Wolfinger University of Hamburg, GermanyMarina Yashina Moscow Technical University of
Communication and Informatics, RussiaIrina Yatskiv Transport and Telecommunication Institute,
Riga, LatviaJan Zarzycki Wroc�law University of Technology, PolandW�lodzimierz Zuberek Memorial University, St.John’s, Canada
Organizing Committee
Wojciech Zamojski (Chairman)W�lodzimierz M. BaranskiMonika BobnisJacek MazurkiewiczJaros�law SugierTomasz Walkowiak

Contents
Framework for the Distributed Computing of the ApplicationComponents . . . . . . . . . . . . . . . . . . . . . . . . . . . . . . . . . . . . . . . . . . . . . . . . . . . . 1Razvan-Mihai Aciu, Horia Ciocarlie
Analysis of Statistical Characteristics of User Arrival Processto the Testing Service . . . . . . . . . . . . . . . . . . . . . . . . . . . . . . . . . . . . . . . . . . 13Artem Adzhemov, Nikolay Albov, Irina Sineva
The Role of Enterprise Social Networking (ESN) on Business:Five Effective Recommendations for ESN . . . . . . . . . . . . . . . . . . . . . . . 23Saeed M. Alqahtani, Sultan Alanazi, Derek McAuley
Dependability and Safety Analysis of ETCS Communicationfor ERTMS Level 3 Using Performance Statecharts andAnalytic Estimation . . . . . . . . . . . . . . . . . . . . . . . . . . . . . . . . . . . . . . . . . . . . 37Tomasz Babczynski, Jan Magott
Entropy-Based Internet Traffic Anomaly Detection: A CaseStudy . . . . . . . . . . . . . . . . . . . . . . . . . . . . . . . . . . . . . . . . . . . . . . . . . . . . . . . . . . . 47Przemys�law Berezinski, Jozef Pawelec, Marek Ma�lowidzki,Rafa�l Piotrowski
A Formal Approach for Preventive Maintenance WorkloadBalancing . . . . . . . . . . . . . . . . . . . . . . . . . . . . . . . . . . . . . . . . . . . . . . . . . . . . . . . 59Ammar Bessam
Computer Support for the Railway Safety ManagementSystem – Requirements Analysis . . . . . . . . . . . . . . . . . . . . . . . . . . . . . . . 69Andrzej Bia�las
Computer Support for the Railway Safety ManagementSystem – First Validation Results . . . . . . . . . . . . . . . . . . . . . . . . . . . . . . . 81Andrzej Bia�las
X Contents
Reductions of Operators in Java Mutation Testing . . . . . . . . . . . . . . 93Ilona Bluemke, Karol Kulesza
An Approach for Planning and Analysis of the SewageSanitary Networks Using Some Calculation Formulas andComputer Simulation . . . . . . . . . . . . . . . . . . . . . . . . . . . . . . . . . . . . . . . . . . . 103Lucyna Bogdan, Grazyna Petriczek, Jan Studzinski
Mathematical Model of Task Scheduling in EducationalCloud . . . . . . . . . . . . . . . . . . . . . . . . . . . . . . . . . . . . . . . . . . . . . . . . . . . . . . . . . . . 115Agata Brzozowska, Jerzy Greblicki
Optimization and Control of Transport Processes in theDistributed Systems . . . . . . . . . . . . . . . . . . . . . . . . . . . . . . . . . . . . . . . . . . . . 123Alexander Buslaev, Mikhail Volkov
On Some Resources Placement Schemes in the 4-DimensionalSoft Degradable Hypercube Processors Network . . . . . . . . . . . . . . . . 133Jan Chudzikiewicz, Zbigniew Zielinski
Efficient Training of Context-Dependent Neural Nets withConjugate Gradient Algorithms . . . . . . . . . . . . . . . . . . . . . . . . . . . . . . . . 145Piotr Ciskowski
Analysis of Mutation Operators for the Python Language . . . . . . 155Anna Derezinska, Konrad Ha�las
Deterministic Schedule of Task in Multiprocessor ComputerSystems with Higher Degree of Dependability . . . . . . . . . . . . . . . . . . 165Mieczyslaw Drabowski, Edward Wantuch
Using Simulation to Evaluate Dynamic Systems with Weibullor Lognormal Distributions . . . . . . . . . . . . . . . . . . . . . . . . . . . . . . . . . . . . . 177Ernest Edifor, Neil Gordon, Martin Walker, Yiannis Papadopoulos
FSM Simulation of Cryptographic Protocols Using AlgebraicProcessor . . . . . . . . . . . . . . . . . . . . . . . . . . . . . . . . . . . . . . . . . . . . . . . . . . . . . . . 189Alexander Frolov, Alexander Vinnikov
Disturbance Injection in Dependability Assessment of AndroidApplications . . . . . . . . . . . . . . . . . . . . . . . . . . . . . . . . . . . . . . . . . . . . . . . . . . . . 199Piotr Gawkowski, Maciej Su�lek
Approximate Algorithm for Fast Capacity Provisioning inWANs with Trade-Off between Performance and Cost underBudget Constraint . . . . . . . . . . . . . . . . . . . . . . . . . . . . . . . . . . . . . . . . . . . . . . 211Mariusz Gola, Adam Czubak

Contents XI
Evolution of Software Quality Models in Context of theStandard ISO 25010 . . . . . . . . . . . . . . . . . . . . . . . . . . . . . . . . . . . . . . . . . . . . 223Oleksandr Gordieiev, Vyacheslav Kharchenko, Nataliia Fominykh,Vladimir Sklyar
Model Checking of UML Activity Diagrams in LogicControllers Design . . . . . . . . . . . . . . . . . . . . . . . . . . . . . . . . . . . . . . . . . . . . . . 233Iwona Grobelna, Micha�l Grobelny, Marian Adamski
Impact of Selected Java Idioms on Source Code Maintainability– Empirical Study . . . . . . . . . . . . . . . . . . . . . . . . . . . . . . . . . . . . . . . . . . . . . . 243Bogumi�la Hnatkowska, Anna Jaszczak
Quantification of Temporal Fault Trees Based on Fuzzy SetTheory . . . . . . . . . . . . . . . . . . . . . . . . . . . . . . . . . . . . . . . . . . . . . . . . . . . . . . . . . 255Sohag Kabir, Ernest Edifor, Martin Walker, Neil Gordon
Analysis of Physical Layer Model of WLAN 802.11g DataTransmission Protocol in Wireless Networks Used byTelematic Systems . . . . . . . . . . . . . . . . . . . . . . . . . . . . . . . . . . . . . . . . . . . . . . 265Zbigniew Kasprzyk, Mariusz Rychlicki
Web Systems Availability Assessment Considering Attacks onService Configuration Vulnerabilities . . . . . . . . . . . . . . . . . . . . . . . . . . . 275Vyacheslav Kharchenko, Alaa Mohammed Abdul-Hadi,Artem Boyarchuk, Yurij Ponochovny
A Recommender System Based on Content Clustering Usedto Propose Forum Articles . . . . . . . . . . . . . . . . . . . . . . . . . . . . . . . . . . . . . . 285Urszula Kuzelewska, Ewa Guziejko
Simple Measure of Network Reliability Using the Variance ofthe Degree Distribution . . . . . . . . . . . . . . . . . . . . . . . . . . . . . . . . . . . . . . . . 293Ho Tat Lam, Kwok Yip Szeto
CDM: A Prototype Implementation of the Data Mining JDMStandard . . . . . . . . . . . . . . . . . . . . . . . . . . . . . . . . . . . . . . . . . . . . . . . . . . . . . . . 303Piotr Lasek
Confidential Transportation of Data on the Technical State ofFacilities . . . . . . . . . . . . . . . . . . . . . . . . . . . . . . . . . . . . . . . . . . . . . . . . . . . . . . . . 313Dariusz Laskowski, Piotr �Lubkowski
Test of the Multimedia Services Implementation inInformation and Communication Networks . . . . . . . . . . . . . . . . . . . . . 325Piotr �Lubkowski, Dariusz Laskowski
Unified Approach to Network Systems Multicriteral Analysis . . . 333Jacek Mazurkiewicz

XII Contents
A Comparison of Forecasting Methods for Ro-Ro Traffic:A Case Study in the Strait of Gibraltar . . . . . . . . . . . . . . . . . . . . . . . . . 345Jose Antonio Moscoso Lopez, J.J. Ruiz-Aguilar, I. Turias, M. Cerban,M.J. Jimenez-Come
Partial Blur: Model, Detection, Deblurring . . . . . . . . . . . . . . . . . . . . . 355Dmytro Peleshko, Mariya Rashkevych, Andriy Klyuvak, Yuriy Ivanov
Software Support for Common Criteria Security DevelopmentProcess on the Example of a Data Diode . . . . . . . . . . . . . . . . . . . . . . . 363Dariusz Rogowski
Increasing Performance of SMS Based Information Systems . . . . 373Mariusz Rychlicki, Zbigniew Kasprzyk
Internet-Based Production Monitoring and Reporting . . . . . . . . . . 383Krzysztof Sacha, Wojciech Pikulski
Reliability Analysis of a Two-Stage Goel-Okumoto andYamada S-shaped Model . . . . . . . . . . . . . . . . . . . . . . . . . . . . . . . . . . . . . . . . 393Ioannis G. Sideratos, Agapios N. Platis, Vasilis P. Koutras,Nicholas Ampazis
Reliability Assessment of Cooperation and Replacement ofSurveillance Systems in Air Traffic . . . . . . . . . . . . . . . . . . . . . . . . . . . . . . 403Miros�law Siergiejczyk, Karolina Krzykowska, Adam Rosinski
Swarm Intelligence Metaheurisics Application in the Diagnosisof Transformer Oil . . . . . . . . . . . . . . . . . . . . . . . . . . . . . . . . . . . . . . . . . . . . . . 413Anis Smara, M’hana Bouktit, Ahmed Boubakeur
Performance Aspect of SaaS Application Based onTenant-Based Allocation Model in a Public Cloud . . . . . . . . . . . . . . 423Wojciech Stolarz, Marek Woda
Low Cost FPGA Devices in High Speed Implementations ofKeccak-f Hash Algorithm . . . . . . . . . . . . . . . . . . . . . . . . . . . . . . . . . . . . . . . 433Jaros�law Sugier
Distributed Time Management in Wireless Sensor Networks . . . . 443Tomasz Surmacz, Bartosz Wojciechowski, Maciej Nikodem,Mariusz S�labicki
Heuristic Cycle-Based Scheduling with Backfilling forLarge-Scale Distributed Environments . . . . . . . . . . . . . . . . . . . . . . . . . . 455Victor Toporkov, Anna Toporkova, Alexey Tselishchev,Dmitry Yemelyanov, Petr Potekhin
Contents XIII
Behavior of Web Servers in Stress Tests . . . . . . . . . . . . . . . . . . . . . . . . 467Tomasz Walkowiak
The Impact of Reconfiguration Time on the Dependability ofComplex Web Based Systems . . . . . . . . . . . . . . . . . . . . . . . . . . . . . . . . . . . 477Tomasz Walkowiak, Dariusz Caban
Propagation Losses in Urban Areas . . . . . . . . . . . . . . . . . . . . . . . . . . . . . 489Marian Wnuk, Leszek Nowosielski
Web Service for Data Extraction from Semi-structured DataSources . . . . . . . . . . . . . . . . . . . . . . . . . . . . . . . . . . . . . . . . . . . . . . . . . . . . . . . . . 499Marina V. Yashina, Ivan I. Nakonechnyy
Investigation of System Reliability Depending on SomeSystem Components States . . . . . . . . . . . . . . . . . . . . . . . . . . . . . . . . . . . . . 511Elena Zaitseva, Vitaly Levashenko, Miroslav Kvassay
Model Fusion for the Compatibility Verification of SoftwareComponents . . . . . . . . . . . . . . . . . . . . . . . . . . . . . . . . . . . . . . . . . . . . . . . . . . . . 521W.M. Zuberek
Author Index . . . . . . . . . . . . . . . . . . . . . . . . . . . . . . . . . . . . . . . . . . . . . . . . . . . 531
CDM: A Prototype Implementation of the Data Mining JDMStandard . . . . . . . . . . . . . . . . . . . . . . . . . . . . . . . . . . . . . . . . . . . . . . . . . . . . . . .Piotr Lasek
Erratum
E1
W. Zamojski et al. (eds.), Proceedings of the Ninth International Conference DepCoS-RELCOMEX, Advances in Intelligent Systems and Computing 286,
1
DOI: 10.1007/978-3-319-07013-1_1, © Springer International Publishing Switzerland 2014
Framework for the Distributed Computing of the Application Components
Razvan-Mihai Aciu and Horia Ciocarlie
Department of Computer and Software Engineering, “Politehnica” University of Timisoara Blvd Vasile Parvan, Nr. 2, Postcode 300223, Timisoara, Romania
[email protected], [email protected]
Abstract. Writing real world distributed applications is a challenging task. Even if well known models or powerful frameworks such as MapReduce or HADOOP are employed, the complexity of the aspects involved, such as specific programming and data models, deployment scripts or a hard debugging process are enough to require many working hours or even make the entire process unsuitable for practical purposes. For applications which need some of their own components to be computed in a distributed manner, a generic model incurs an unnecessary overhead and makes the whole development slower. We propose a MapReduce framework which automatically handles all the distributed computing tasks such as computing resources abstraction, code deployment, objects serialization, remote invocations and synchronizations with only a minimal coding overhead. With only minimal constructions dependable distributed components can be developed and run on heterogeneous platforms and networks. The presented results confirm the performance of the proposed method.
Keywords: distributed computing, serialization, synchronization, invocation.
1 Introduction
Today resource intensive applications can run on networks starting from a few computers and reaching thousands of dedicated servers organized in clouds or grids. The internet also brings the possibility to run applications on global scale networks, many of them forming resources, known as Volunteer Computing Networks [1]. There are many processing resources, which can be used by an application. Network computers, microprocessor cores and GPUs can be used to compute laborious tasks in parallel [2]. However, each of these resources require special handling such as writing threads for CPU cores, kernels for GPUs and serialization/invocation protocols for network resources. From the application level, each resource executes some code to process inputs and to generate outputs. It should be possible to design a construction, which abstracts computing resources in a generic way. In Java such construction can be a common adapter interface between the application logic and the specific resources. The Java basics to run threads on microprocessor cores are the class Thread and the interface Runnable [3]. There are no standard equivalents of these for network

2 R.-M. Aciu and H. Ciocarlie
computing resources or for GPU cores [4], which imposes challenging tasks for the programmers who want to make use of all available resources, especially if the applications are to be run on ad-hoc, loosely coupled, heterogeneous networks [5].
The current frameworks employ for distributed computing auxiliary components like application servers, Interface Description Language (IDL) compilers, libraries for serialization, network resources discovery, communication protocols and deployment [6]. If we want to execute in a distributed manner application components, the role of some of the above components can be replaced by standard functionality such as Java serialization and generics. Another approach is to use programming languages with strong distributed programming capabilities, such as Erlang [7] but this poses interfacing problems when the cooperation with modules written in mainstream languages is needed. With our Java framework we try to implement a representative package of a HADOOP cluster [8] functionality, when the distributed computing is needed only for application own components, tailoring it for a simplified and transparent usage of local and remote computing resources, using small to medium heterogeneous networks.
As the distributed applications are generally the ones which require a lot of processing power [9], we want to be sure that every resource is fully used. This is why in our tests we use scalability and resources load balancing as fundamental metrics to evaluate our results [10]. The ease of use and the available features are equally important for the adoption of our algorithm and framework in production.
2 Algorithm Overview
Our algorithm and framework handles CPU cores and network resources in a generic way and it can also be extended to GPU cores. All the required low level tasks are performed automatically by the framework and the programmer needs only to concentrate on the application logic.
Fig. 1. An image with 3500 spheres rendered with our test program
If we have to render a high resolution complex 3D image as in Fig. 1, using an arbitrary sized computer network, we can divide the image in sufficiently large parts to justify parallel processing when compared with the added network overhead and send

Framework for the Distributed Computing of the Application Components 3
these parts to the available computers when they are idle. This is the best approach for heterogeneous networks or for when the computers number can change in time.
The workload must be divided in pieces, which will be process on the available resources and the partial results will be received and assembled. This follows the well known MapReduce model [11], on which the Map phase is represented by the distributed computations and the Reduce phase is represented by the assembly of the received results back on the application. The algorithm in pseudocode is represented in Fig. 2:
(1) var sd:Scheduler
(2) sd=new Scheduler(computeClass,initData,destination) (3) for piece=every piece of the workload (4) sd.addInvocation(destinationPosition,piece) (5) sd.waitForAll() (6) assemble_received_results()
Fig. 2. Algorithm pseudocode
An invocation is a task scheduled for execution on an abstracted computing resource, local or remote. The Scheduler is a framework component, responsible for the handling of all low level details involved on the distributed computing. On its initialization, the Scheduler needs a class which implements the required computation (computeClass), a constant global data which will be passed at the initialization of all distributed computations (initData) and a holder for results (destination).
The method addInvocation executes asynchronously and it enqueues an invocation to the invocations list. Every invocation has the data needed to perform its computation (piece) and an abstract place in destination (destinationPosition) where the results are returned. When invocations are enqueued, the Scheduler starts to create worker threads, each one connected to a computing resource.
The framework provides a special server to which the workers connect. Every computer which takes part in computation must have a running server on it. The worker threads get invocations from queue, run them on their computing resource and return the results. For this, the Scheduler must first deploy the necessary code (computeClass and all its dependencies) to the remote computers and also initData. These are sent only once, no matter how many invocations will run on that computer. The code deployment is done by using a specialized class loader and for data a serialization engine must be employed. In our implementation we use the standard Java serialization framework.
After all the workload parts are scheduled, the method waitForAll is used to wait until all the computations are performed and the results are retrieved. When the results are received, they will be assembled according to the application logic. These are all the necessary steps. The details needed in a traditional distributed application, like network discovery, code deployment, serialization and synchronizations are abstracted from the application logic. Moreover, the computing resources are also abstracted, so the application can automatically make use of any resource, such as local microprocessor cores or network computers.
In our example, every image line is an invocation, so for a 2000 lines image we have 2000 invocations. The initial data is the scene itself (including output resolution,

4 R.-M. Aciu and H. Ciocarlie
observer position, view angles), because these are invariants. There is no defined order for invocations processing, so their results need to be stored in order to be assembled in the right order in the final image. The computeClass is a class derived from a special interface (provided by framework), which handles the actual image line computation. This class and all its dependencies will be deployed to network and it will be run in a distributed manner. The destinationPosition is the index in the vector of image lines where the invocation result will be put. The piece is an invocation specific data, in our example the vertical angle for each image line.
3 Detailed Description for Framework
The in-depth description gives for each step involved in the algorithm the full extent of the options and customizations that can be made, the required framework support, the suggestions regarding the implementation on different platforms.
A. Network setup
Every computer, which is part in the distributed computing process, must run a specialized server. This server allows queries regarding its version and available computing resources. A server allows a maximum number of concurrent connections at most equal with its number of computing resources. The scheduler creates a worker thread only if there is a server with available connections and once the connection is established between the worker and the server, it remains open until all jobs end or until an exception occurs. In this way a computer core is assigned to a single worker in order to fully use all the resources and in the same time to minimize kernel threads switching. This model works well for small to medium networks, with a top of simultaneous open sockets of around some thousands. It is also preferred when the application is on a private network, which cannot be directly accessed from outside.
For larger networks an alternate model can be used, based on regular queries (pings) to the servers to which computations were sent, in order to check the status and retrieve results. In this case there is no bound in regard to the maximum open sockets number, because a socket would exist only during a query.
To address unsecure, regulated or volunteer networks, additional requirements must be observed: application & server authentication, communication encryption, possibility to set upper bounds on the usage of the server resources and security policies to access file system, network or other security or privacy sensitive functions.
B. The distributed executable code
The application components, which are designed to run in a distributed manner (computeClass from Fig. 2) must implement the following interface:
(1) public interface Distributed (2) <InitData,Index,RunData,RetType>{ (3) boolean dInit(final InitData initData); (4) RetType dRun(final Index idx,RunData runData); (5) }
Fig. 3. The Distributed interface

Framework for the Distributed Computing of the Application Components 5
Through the framework, Java generics are employed to ensure type safety. Every server connection creates its own instance of computeClass so at maximum on a server can be as much computeClass instances as its total cores number.
Method dInit is called only once, when the new instance is created. It returns true if the initialization was successful and the worker can use the new instance. The argument initData is the same for all invocations and must invariable. The newly created instance will be used for all computations from that worker. In this way it becomes possible for computeClass to keep state information between invocations, such as for caching partial computations. The order or the number of invocations handled by this particular instance is not specified.
Method dRun is called for every invocation. The argument idx is an abstract index in the destination. It can be anything: an index into a vector or a key into a map. It keeps track of the results order. It must be unique for every invocation. Our test application uses the image lines indexes as idx. The argument runData is used to pass specific arguments for each invocation. On success, dRun returns a newly created object with the computation result. If dRun returns null, an error is signaled.
The classes which implement Distributed cannot have a common memory area (like static variables), because they can run on different hosts. This requirement can be enforced at runtime by analyzing the used members and their dependencies.
C. The scheduler instantiation
The Scheduler class is provided by the framework. It has the following signature:
public class Scheduler<InitData,Index,RunData,RetType>
The generic parameters InitData, Index, RunData and RetType were described in section III.A. Scheduler has both a static and a non-static constructor. The static constructor is used for automatic system wide initializations, such as network discovery. This check is made once, at the application start. Taking into account the dynamic nature of the network, which allows computers to be added or removed any time, subsequent resource checks are also possible, started by the programmer or automatically performed at specific intervals of time. The non-static constructor for Scheduler has the following signature:
public Scheduler(final Class<?> distributedClass, final InitData initData, Destination<Index,RetType> dst)
The argument distributedClass is the class representation of the distributed class. Its code and all its dependencies are sent to the available servers to be run remotely. This class implements the interface Distributed, so it can be called in a standard way. In languages with full reflection such as Java or C#, the serialization of a class description and its methods code can be achieved using the provided standard API.
The argument initData is the initial constant data, to be used at the initialization of each distributed workers. It is sent to every server only once.
The argument dst is the destination of the distributed computations results. The interface Destination is detailed in Fig. 4 and it defines an abstract destination.

6 R.-M. Aciu and H. Ciocarlie
(1) public interface Destination<Index,RetType>{ (2) void set(Index idx,RetType ret); (3) }
Fig. 4. The Destination interface
When a call to dRun finishes, the result is sent back and the method set of dst is called with the destination index and the computation result. The destination class can have different behaviors, according to the application logic. If all the computations results must be retrieved first (as in our example) then the destination can be a thin wrapper over an array or collection class. If the computations results can be processed separately, the call to set can directly encapsulate the processing of each result.
D. The invocations and the workers An invocation is a computation scheduled for execution. It is added to the invocations list with the Scheduler method addInvocation:
public void addInvocation(Index idx,RunData runData)
The argument idx is the result index in dst. The argument runData is the specific data necessary for this computation. The method addInvocation runs asynchronously, so it does not block the application loop. It puts the invocation in an invocations list.
If all the existent workers are busy and there are more available computing resources, addInvocation creates a new worker to process the newly added invocation. A worker is a thread created by Scheduler which handles all the communications with a specific resource. A worker does not compute invocations, but it only sends them to the associated resource, receive their results and put them in destination. As such, a worker thread consumes very few resources and there can be thousands of workers.
First, on its creation, a worker connects to a resource and locks it for itself. After that an instance of distributedClass is created remotely and the initData is passed to its dInit method. This instance will be kept alive during the worker’s life. After that, the worker takes invocations from list and sends their data (idx and runData) to the associated resource. There, the data is passed to the dRun method of the distributedClass instance, it is computed and the result is returned.
The errors caused by the application logic itself are signaled back with exceptions. On errors caused by the network the worker first tries to reconnect and if it fails it informs the framework to check if the remote server is still available. If the remote server cannot be discovered, it is removed from the available servers list. If the worker cannot reconnect, it will shut down itself. In this case the current invocation will be put back to the invocations list, in order to be processed by another worker.
E. The end of the distributed computations
After all the invocations were scheduled, the application has two choices to wait for their completion. The easier choice is to call the Scheduler method waitForAll:
public void waitForAll()
This is a blocking method, which waits for the completion of all invocations, including the ones from the invocations list and the ones currently running. When waitForAll returns, it is guaranteed that all the invocations were computed and the

Framework for the Distributed Computing of the Application Components 7
results were passed to destination. The other choice is to manually check for completion, using the following methods of Scheduler:
public int getAddedInvocationsNb()
public int getCompletedInvocationsNb()
The method getAddedInvocationsNb returns the total number of invocations added to the scheduler using addInvocation. The method getCompletedInvocationsNb returns the number of the invocations, which were already successfully computed. By using these two methods, the application knows the scheduled invocations status.
When all the invocations are computed, the scheduler stops all worker threads. A worker signals to the associated server to free the remote resources and ends.
4 Theoretical Model
The model analyzes the theoretical execution time which can be achieved with our algorithm, both on local cores and on network. Different factors are taken into consideration, such as remote connections startup time and network speed. In the case of heterogeneous networks, different hardware configurations lead to different computation times. More than that, not all the invocations require the same amount of time. In our example, an image line with more spheres intersections is rendered slower than one with fewer spheres.
We define the invocation average computation time (TA) metric as the total computation time (TT) averaged to the total number of invocations (IT). We consider a hardware reference (HR) and TT is a function of if it. TA= TT(HR)/IT. TT is considered for only one core on a specific configuration. In that case: TT(HR)= TA*IT.
For any computer, we define relative speedup to the hardware reference (S), where S is a function of the other hardware: S(Hi)= TT(Hi)/TT(HR). When the application is run simultaneously on multiple independent cores, the total computation time is the maximum time of the partial computations: TT=max(TTi). We have:
TT=max(TA*Si*Ii) (1)
Where Si is S(Hi) and Ii is the number of invocations run on that specific core. If the application runs on network, for every invocation we define a remoting overhead time (TO) given by the data serialization and the network speed when the parameters are sent and when the results are received. There is also a connection setup time (TC) necessary to establish the socket connection, to run the server handler for the connection and to dispose all these when the worker ends. In that case (1) becomes:
TT=max( (TA*Si+TO)*Ii+TC) (2)
On the optimal case, if we have IT cores so every invocation will run on its own core, (2) becomes:
TT=max(TA*Si+TO+TC) (3)
As TO+TC is constant, from (1) and (3) it can be seen that the optimal case is when every core runs only one invocation, so the TO*Ii becomes TO. In that case, every available core is used and in the same time the network traffic and the associated serialization overhead is reduced to minimum. This can be achieved by having a

8 R.-M. Aciu and H. Ciocarlie
number of invocations equal with the available cores (the optimum case), or by having very intensive invocations, so most of the time will be spent in computations (the TA*Si term), with only a short percentage of time spent in network related tasks.
The above conclusions are true when the resources are reliable (the invocations succeed). Else, it is more advantageous to have lighter invocations (as computing time), so their re-computation would be cheaper.
5 Practical Results
The algorithm and framework were tested both in a computer network and on a computer with a quad core microprocessor. Two important metrics were especially evaluated. First is the total speedup when new resources are added. This metric also gives a good evaluation if it is advantageous for a certain application to use more resources, taking into account other factors like their economic costs. The other metric is the workload distribution on each computing resource – this is important to evaluate the ability of the algorithm to distribute the workload on the existing resources, especially in the case of heterogeneous networks. In our tests we also tried different operating systems and Java implementations in order to assess how they are working with our framework. For all tests we used an application which renders the image from Fig. 1 with a resolution of 2000x2000 pixels. An invocation is made from an image line, so we had 2000 invocations. At every test a fresh server was run in order to clear the cached remote classes to have similar startup conditions.
A. Tests on a computer network
We used a wired network of 10+1 computers, with Intel® Core™ 2 [email protected] CPU, running Kubuntu 8.04 on 64 bits, with Java HotSpot Server VM 1.6.0_06. One computer was used only for the base application and the invocations were allowed to run only on the other computers, in order to obtain homogenous results from all involved resources. We started with one computer and on each iteration we added new computers, measuring the relative speedup to the case of only one. As each microprocessor has two cores, finally we had 20 cores to run our invocations. The speedup is shown in Fig. 5 and the workload on every core is shown in Fig. 6.
Fig. 5. Speedup on network

Framework for the Distributed Computing of the Application Components 9
From Fig. 5 it can be seen that on a small number of computers, the speedup is close to the optimum. The experimental results for 2-5 computers show a performance slightly over the theoretical model due to external factors which influence the measurements of small time intervals, like the variance of the network traffic.
When the computers number grows, the speedup is lower because the computations finished very quickly (around 1s) and other factors like the network discovery and sockets and threads management (the TC component from the theoretical model) counted for a bigger part from the total run time.
The workload distribution was close to the optimum (the case with equal amount of invocations run on every core). The average percent difference on all cores was maximum 1.03% for all test runs and the maximal percent difference of a core workload from the optimum was 2.8%.
Fig. 6. Workload on each core on network
Tests on a Computer Cores We used a computer with Intel® Core™ 2 QUAD [email protected] CPU, running Windows Vista Business SP2 on 32 bits, with Java HotSpot Client VM 1.7.0_11-b21. This computer has four cores. We started by allowing the invocations to run on only one core and on each iteration we added new cores. The speedup is shown in Fig. 7 and the workload on every core is shown in Fig. 8.
Fig. 7. Speedup on a computer
It can be seen from Fig. 7 that on running on local cores the speedup is very close to the optimum. Only on the 4th core there is a somewhat larger (0.09%) difference to the optimum. This is due to the fact that this core also needs to run the main application
10 R.-M. Aciu and H. Ciocarlie
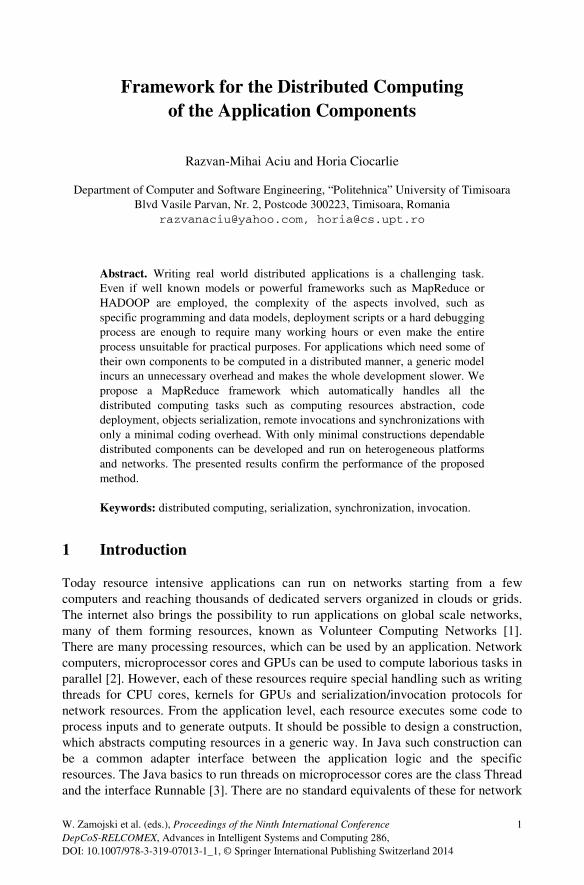
(the scheduler and all the synchronization code). This result shows that the scheduler and all its associated threads (the workers) are consuming very few resources, as they mainly only send the invocations parameters and wait for results.
Fig. 8. Workload on each core on a computer
The workload distribution between the different cores had a maximum percent difference from the optimum of 0.6% (due to the different load on the last thread) and the average percent difference on all test runs was maximum 0.4%.
6 Conclusion
The proposed algorithm and framework makes possible to use automatically deployed application classes as distributed components. The framework abstracts the resources such as local CPU cores and computers from heterogeneous networks and it allows the programmer to use them transparently, in a uniform manner. The framework is suitable for many types of applications. It works well for languages which run on virtual machines, such as Java or C#, but with some restrictions it can be used for languages compiled to native code and without advanced reflection, such as C/C++.
The framework usage is very simple. In the first step the programmer needs to implement the Distributed interface on the class he wants to execute in a distributed manner. In the second step, the programmer adds invocations to a scheduler. From this point, all the distributed tasks such as network management, serialization, deployment and synchronization are automatically performed.
We provided a Java implementation for framework. From the practical results it can be seen the algorithm is scalable, both in term of local cores and network computers and it provides a good load-balancing, by uniformly distributing the tasks to all the available resources. In all tests the framework was proved to be dependable and the final result was provided even on the occurrence of network errors. Our algorithm and framework open many research directions and we consider developing them further to use GPU cores, to improve the overall reliability on errors and to interoperate with other distributed computing frameworks.
Framework for the Distributed Computing of the Application Components 11
References
1. Fedak, G.: Desktop Grid Computing. Chapman and Hall/CRC (2012), doi:10.1201/b12206-16
2. Feinbube, F.: Programming models for parallel heterogeneous computing. In: Proceedings of the 5th Ph.D. Retreat of the HPI Research School on Service-Oriented Systems Engineering (2011)
3. Lea, D.: Concurrent Programming in Java: Design Principles and Patterns. Addison-Wesley Professional (2003) ISBN-10: 0-201-31009-0
4. Espeland, H., Beskow, P.B., Stensland, H.K., Olsen, P.N., Kristoffersen, S., Griwodz, C., Halvorsen, P.: P2G: A framework for distributed real-time processing of multimedia data. In: 40th International Conference on Parallel Processing Workshops, ICPPW (2011)
5. Krasic, C., Saubhasik, M., Goel, A., Sinha, A.: Fair and timely scheduling via cooperative polling. In: EuroSys (2009)
6. Pop, F., Grigoras, M.V., Dobre, C., Achim, O., Cristea, V.: Load-balancing metric for service dependability in large scale distributed environments. Scalable Computing: Practice and Experience 12(4), 391–401 (2011)
7. Armstrong, J.: Programming Erlang: Software for a Concurrent World, 1st edn. (2007) 8. Kiran, M., Kumar, A., Mukherjee, S., Ravi Prakash, G.: Verification and Validation of
MapReduce Program Model for Parallel Support Vector Machine Algorithm on Hadoop Cluster. IJCSI International Journal of Computer Science Issues 10(3(1)) (2013)
9. Beloglazov, A., Abawajy, J., Buyya, R.: Energy-aware resource allocation heuristics for efficient management of data centers for cloud computing. Future Generation Computer Systems 28 (2012)
10. Pandey, S., Buyya, R.: Scheduling workflow applications based on multi-source parallel data retrieval in distributed computing networks. The Computer Journal (2012)
11. Lämmel, R.: Google’s MapReduce programming model – Revisited. Science of Computer Programming 70(1) (2008)

W. Zamojski et al. (eds.), Proceedings of the Ninth International Conference DepCoS-RELCOMEX, Advances in Intelligent Systems and Computing 286,
13
DOI: 10.1007/978-3-319-07013-1_2, © Springer International Publishing Switzerland 2014
Analysis of Statistical Characteristics of User Arrival Process to the Testing Service
Artem Adzhemov, Nikolay Albov, and Irina Sineva
Moscow Technical University of Communication and Informatics, 8a Aviamotornaya St., Moscow, Russia, 111024
{asa,iss}@mtuci.ru, [email protected]
Abstract. As a part of e-Learning system the testing service allows to measure students’ skills. In order to design testing service it is necessary to study interaction between a student as the user of service and the testing service. We measure and analyze the time between requests and the testing service. By using KS-method we fit the measurement results to the theoretical probability distribution. The conducted analysis shows that the use of a normal model for analyzed data is not suitable. It is found that the inter-request time distribution is the log-logistic distribution. The estimates of the distribution parameters will be suitable for all such interactions between the user and the testing service. The homogeneity hypothesis for inter-request times is verified. The nonparametric Kruskal-Wallis test is applied as a homogeneity test. Then in order to aggregate observations into larger groups the cluster analysis of the log-logistic distribution parameters is carried out. The following methods of the cluster analysis are used: an agglomerative hierarchical clustering method and a k-means method. The results of our study can be used for the modeling of computer-based testing service.
Keywords: inter-request times, think-times, distribution fitting, log-logistic distribution, KS-method, Kruskal-Wallis test, cluster analysis, e-Learning, testing service.
1 Introduction
Information and communication technologies (ICTs) have essentially expanded the list of services offered to the people. Today the new technologies are closely connected with the computer and are widely used. Such as: e-Learning, e-Medicine, e-Government, e-Commerce etc.
Recent developments in ICTs, such as the Internet and World Wide Web, enable increased production and dissemination of information across geographical boundaries. We are witnesses of formation of the new world – the world in which the person widely uses computer in the everyday activity. The virtual world created by the people should correspond to the real-life world. Each subject in the virtual world should have a prototype in the real world. For example, the dialogue in the real world corresponds to the chat in the virtual-world.

14 A. Adzhemov, N. Albov, and I. Sineva
Moreover, additional ICTs present the new possibility that in the real world does not exist. Such as: hyperlinks, personal time-table, selecting the teacher in the real-time etc.
Now it is easy to find different types of educational portals in the Internet that introduce different types of services that cover all area of human life. Some of them introduce only the access to the electronic document, others present interactive educational service. These services are different only in the process of interaction between the user and the system. These types of services have various graphic design and different algorithm of interaction with users. Depending on a required document users can access to services in different ways. That results in different workload on the server resource.
The given paper deals with the investigation of test or quiz systems which are widely used in e-learning system. There are different types of computer-based testing system. In this paper we analyze partially adaptive computer-based testing system. For optimal design of computer-based testing system it is necessary to do researches of workload on such system. We characterize user behavior in terms of inter-request time or think-time. As the information transfer time over network is much less than the user think-time we consider that the time between a request and user think time is approximately equal. Although arrival process can be described in more details, the inter-request time is the main characteristic of such process. The statistical analysis of aggregated arrival process to the testing service was previously described by the authors in [8]. The statistics obtained in our research can be used in the future as parameters for analytic and simulation models describing such traffic. Also the results of analysis can be used to evaluate the performance of test service, improve the network management and plan test service capacity. The time between two consequent requests to user test system depends on user subjective qualities: knowledge level, his mental and physical condition at the time of testing, the complexity of the test.
The system under consideration consists of an assessment engine and an item bank. The assessment engine includes software and hardware which are necessary to create a test. An item bank stores tests. The engine uses the bank to generate a test. Test-takers can request and answer an item or skip it and then go to the next item. In this test system there is the following limitation: the time limit is established by the test designer.
2 Background
The following statistical hypotheses were tested during data analysis:
1) The hypothesis of the homogeneity of users inter-request time distribution within the group.
2) The hypothesis of inter-request time distribution for each user test session.
To determine the distribution which is best fitted to experimental data we use the Kolmogorov-Smirnov Goodness-of-Fit Test [1]. The Kolmogorov-Smirnov (K-S) test is useful in deciding if a sample comes from a population with a specific continuous
Analysis of Statistical Characteristics of User Arrival Process to the Testing Service 15
distribution. We use several distributions in order to check which one would fit the inter-request time better. In this paper, the significance level is considered as the degree of closeness of the analyzed data sets to the theoretical probability distribution. Significance level with value less than 0.05 indicates that the tested data is significantly different from the hypothesized distribution. The obtained high significance level allows using the results of the research as a probabilistic model for the same interaction. We use the maximum likelihood estimation (MLE) method to evaluate the parameters of the distributions. For the examination of homogeneity among grouped data a Kruskal–Wallis test [1, 6] is conducted due to asymmetric inter-request time distribution. The Kruskal–Wallis test is a nonparametric method that compares the medians of two or more samples to determine if the samples have come from different populations. The check for homogeneity provides valuable information about the groups taking the test, individual tests. It should be noted that only the requests to test service were analyzed and the technical implementation of the test system was ignored.
Probability distributions were chosen looking on the type of histograms constructed on empirical data and based on other well-known works of the study of traffic and information about user think time. The student’s think time is well modeled with logarithmic type of distributions. Logarithmic dependence is observed in a number of studies, for example, the log-logistic distribution for length of HTTP request and idle time between messages [2]; the log-normal distribution for characterization of some network metrics [3], the log-normal distribution for reading time - the interval between two consecutive Web page requests [4], the lognormal distribution for the test item response time [5].
3 Data Analysis
In this section we discuss data analysis. Let’s consider several groups of students getting quiz during one academic year. Three groups of students in three different disciplines such as humanities, technology and natural science were chosen to take tests during the session.
The humanities test will be discussed in more details as an example of study design. Fifteen students took part in this test. The test set consisted of 64 test items. The test duration was 45 minutes, or an average of about 0.7 minutes per one test item. The number of observations for each user was from 64 to 86. We calculated basic statistics data. As a result we got the following statistics: sample mean from 11.8 to 28 seconds, sample median from 9.9 to 20.5 seconds, the value of the asymmetry coefficient from 3.1 to 7.3. According to this statistics it can be assumed that the data is heterogeneous, and furthermore it is proved by the exact calculations.
The study of observations resulted in several patterns of temporal students’ behavior. The behavior patterns are listed below: 1) time distribution is grouped around the mean value with a positive coefficient of asymmetry and rare observations exceeding the mean value more than three sigma; 2) time distribution is grouped around the mean value with a positive coefficient of asymmetry observations without exceeding the mean value more than three sigma.

16 A. Adzhemov, N. Albov, and I. Sineva
3.1 Student Behavior Patterns
Let us consider the first pattern of students’ behavior. As we have noted above that student think time is close to inter-arrival time so in further reasoning we will assume they are the same. The student takes test without skipping test items and spends an average time needed for thinking. This time is close to the average time on all observations for a given student. This think time distribution has a positive skewness due to the fact that on some test items students spend more time. This kind of behavior is observed in two variants: the first variant occurs when one observation exceeds the average for all observations. Such type of observation is usually found at the end of the test session. The second variant can be observed in several places of the test session. Figure 1 shows one data set that contains this type of observation. It is clear that there is only one value greater than 200 seconds. This value is a statistical outlier. However, it should be noted that the exclusion of such observation from the data set does not significantly affect the results of the analysis. Exclusion of these observations from the analyzed data set may result in loss of correctness of the model of users’ behavior.
Fig. 1. Box-and-Whisker plot for a single set of observations with outlier
In the second pattern of students’ behavior the variability of think time values isn’t very large. Such type of users skips fewer test items during the test session. At the time of the analysis a rare observation was found to which we could not find distribution. For example, such type of students whose think time was between the consequently requests had multimodal time distribution. This can be explained by the fact that students spend different time on different test questions. For example, we found one observation where the user answer time lay in the range between twenty and forty seconds and observed small series of intervals when student skipped the test question.
Analysis of Statistical Chara
3.2 Statistical Data Ana
During the analysis data ofstudent requests for test itwere found. Our choice of that most of the observationthan the sample median. Tha normal model for descrdistribution functions sevlognormal, Weibull, Gammdistribution of extreme valuwas best fitted for our modthe log-logistic distributionand proven on the basis of gthe log-logistic distribution
( )f xσ
=
The distribution (1) dep
variance in terms of these p
E
2( ) [Var X e μ= Γ
This distribution is also
( )expα μ= is a scale pa
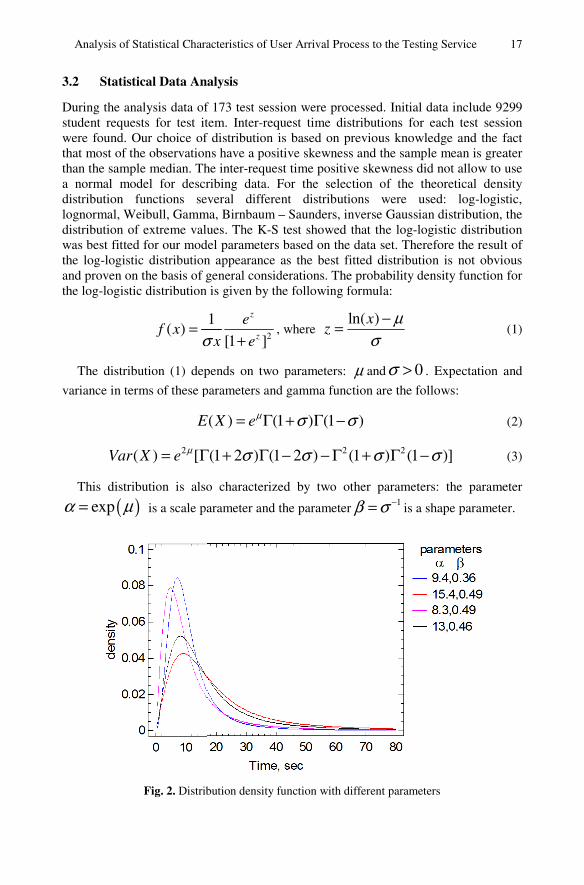
Fig. 2. Distrib
acteristics of User Arrival Process to the Testing Service
alysis
f 173 test session were processed. Initial data include 92tem. Inter-request time distributions for each test sessf distribution is based on previous knowledge and the fns have a positive skewness and the sample mean is greahe inter-request time positive skewness did not allow to ribing data. For the selection of the theoretical denveral different distributions were used: log-logis
ma, Birnbaum – Saunders, inverse Gaussian distribution, ues. The K-S test showed that the log-logistic distributel parameters based on the data set. Therefore the resul
n appearance as the best fitted distribution is not obvigeneral considerations. The probability density functionis given by the following formula:
2
1
[1 ]
z
z
e
x eσ +, where
ln( )xz
μσ
−=
pends on two parameters: μ and 0σ > . Expectation
parameters and gamma function are the follows:
( ) (1 ) (1 )E X eμ σ σ= Γ + Γ −
2 2(1 2 ) (1 2 ) (1 ) (1 )]σ σ σ σΓ + Γ − − Γ + Γ −
o characterized by two other parameters: the parame
arameter and the parameter 1β σ −= is a shape paramete
bution density function with different parameters
17
299 sion fact ater use
nsity stic, the
tion lt of ious
n for
(1)
and
(2)
(3)
eter
er.

18 A. Adzhemov, N. Albov, and I. Sineva
The density distribution function with different parameters is shown on Figure 2. These distribution parameters were obtained from performed cluster analysis of distribution parameters characterizing the humanities discipline.
The significance levels (p-value) of 0.14 to 0.98 were obtained by testing hypothesis about the log-logistic distribution. The estimates of the parameters for log-logistic distribution were respectively in the range 7.8 ÷19 (α) and 0.3 ÷ 0.57 (β).
3.3 Cluster Analysis
All observations were checked for homogeneity in order to further aggregation into larger groups. Nonparametric Kruskal-Wallis tests were conducted on the observations to verify homogeneity assumptions. Subsequently we found that the observations belonging to the group were not homogeneous. Then we used the clustering analysis [7] to search for homogeneous groups. An agglomerative hierarchical clustering method and a non-hierarchical iterative clustering or so called k-means method were used. For the agglomerative hierarchical clustering we used various methods to create the cluster: nearest neighbors, furthest neighbor, centroid, median, Ward method, group average. The Euclidean squared distance was used for k-means method. The K-means cluster analysis was applied to the following data: sample mean, sample median, sample standard deviation. As a result, the smallest number of subgroups was found using the Ward method. Quadratic Euclidean distance as the distance between objects for Ward method was used. Table 1 shows centroids that were obtained after clustering the data. Figure 3 shows a scatter plot with two clustering parameters: sample mean and standard deviation. It should be noted that cluster structure is not sensitive for options of clustering procedure.
Table 1. Cluster centroids for humanities discipline
Cluster number Sample mean
Sample median
Sample standard deviation
1 12.3438 8.93687 10.2152
2 25.1784 15.5503 36.1014
3 15.6277 7.30692 25.7327
4 18.5948 12.5352 20.3671
For each subgroup homogeneity of Kruskal-Wallis test and K-S test for checking
compliance with the log-logistic distribution were conducted. While checking the homogeneity of the subgroups we found out four subgroups with p-values 0.2573, 0.0952, 0.3485 and 0.6493 respectively. K-S test provides log-logistic distributions as the most appropriate for different clusters. More precisely results looks as follows: the first subgroup - p-value is 0.688982 , distribution parameters - = 9.43511 , = 0.361293, the second subgroup - p-value is 0.561375 , distribution parameters - = 15.3688 , = 0.49033 , and the third subgroup - p- value is 0.0741992,

Analysis of Statistical Characteristics of User Arrival Process to the Testing Service 19
Fig. 3. Cluster analysis scatter plot
distribution parameters - = 8.2932, = 0.490662; the fourth subgroup - p-value is 0.29225, distribution parameters = 12.97, = 0.464609.
Figure 4 shows a graph of the theoretical density distribution function and histogram. The data are resulted from the clustering process for the first subgroup. Good correspondence between theoretical density distribution function and observed data is obvious.
Further let us consider this analysis in the same way that was described above, but for other groups. The groups were the following: two groups in the humanities took the test consisting of the same questions and the same time limit that the test described above. Restrictions for the test for three groups in the technical discipline were the following: test duration of 30 minutes and 15 test questions. The test for three groups in the natural science discipline had the following restrictions: test duration of 45 minutes and 22 test questions. The number of observations was varied from 64 to 161 for the test on the humanities, from 15 to 120 for the technical discipline, from 26 to 155 for the natural science discipline. The analysis showed that data was described by log-logistic distribution. Only 2.5 % of the observations did not fit the log-logistic distribution. Out of the remaining observations p-value exceeded 0.2 in 97% of cases. It also turned out that the parameters of the log-logistic distribution for the natural sciences and the technical disciplines exceeded the respective parameter for the humanities discipline. One observation from the humanities did not fit the log-logistic distribution due to bimodal data.
Then the data were clustered. On the first step of clustering, several similar observations were grouped into subsets. The Parameters of distribution were used as the objects for the cluster analysis. The Ward method of the cluster analysis was used in this step. As a result, four subgroups were obtained. On the second clustering step we applied the k-means algorithm to the cluster subgroups. Figure 5 shows a scatter plot of the two clustering parameters: parameter alpha and parameter beta.

20 A. Adzhemov, N. Al
Fig. 4. Lo
Table 2. The
C
1
2
3
lbov, and I. Sineva
og-logistic distribution for the first subgroup
Fig. 5. Two-step cluster analysis
e clustering results of the distribution parameters
Cluster number parameter
parameter
14.2718 0.452209
26.2297 0.783483
64.1761 0.458037

Analysis of Statistical Characteristics of User Arrival Process to the Testing Service 21
As a result of the analysis we obtained three clusters. Only the humanities discipline belongs to the first cluster. Six distribution parameters characterizing the technical discipline and eight distribution parameters characterizing the natural sciences belong to the second cluster. Six parameters characterizing tests on the technical discipline and four parameters characterizing tests on the natural sciences belong to the third cluster. Table 2 shows centroids of the obtained cluster.
4 Conclusion
After conducting this research we have come to the following conclusion. All students in each group are significantly heterogeneous. Each student has its own strategy for taking the test session, which is one of the reasons for heterogeneity of the group. We consider that there is not enough data to apply limiting laws of probability theory here and it would be a mistake to use the normal distribution in this case.
The inter-request time for a single user is widely varied and can be significantly larger than average inter-request time. It can be used for determination of the test time.
After applying the cluster analysis the number of homogeneous subgroups is varied from 4 to 12.
Among several probability distributions we could find that the log-logistic probability distribution was the best model for observation data. Although the log-normal distribution was good for our data but p-values obtained from K-S test showed the priority of the log-logistic distribution.
Performed analysis proves that the distribution parameter depends on the type of discipline. This parameter is minimal for the humanities and increases for the technical and natural discipline.
References
1. Hollander, M., Wolfe, D.A.: Nonparametric statistical methods. John Wiley & Sons, NY (1999)
2. Zhao, G., Shan, Q., Xiao, S., Xu, C.: Modeling web browsing on mobile internet. IEEE Communications Letters 15, 1081–1083 (2011)
3. Downey, A.B.: Lognormal and Pareto distributions in the Internet. Computer Communications 28, 790–801 (2005)
4. Shuai, L., Xie, G., Yang, J.: Characterization of HTTP behavior on access networks in Web 2.0. In: International Conference on Telecommunications, ICT 2008, pp. 1–6. IEEE (2008)
5. Van der Linden, W.J.: A lognormal model for response times on test items. Journal of Educational and Behavioral Statistics 31, 181–204 (2006)
6. Kvam, P.H., Vidakovic, B.: Nonparametric statistics with applications to science and engineering. John Wiley & Sons (2007)
7. Kaufman, L., Rousseeuw, P.J.: Finding groups in data: an introduction to cluster analysis. John Wiley & Sons (2005)
8. Albov, N.Y., Adzhemov, A.S.: Statistical analysis of incoming traffic of applications for testing services of information and education resources. Elektrosvjaz’ 4, 28–30 (2012) (in Russian)

W. Zamojski et al. (eds.), Proceedings of the Ninth International Conference DepCoS-RELCOMEX, Advances in Intelligent Systems and Computing 286,
23
DOI: 10.1007/978-3-319-07013-1_3, © Springer International Publishing Switzerland 2014
The Role of Enterprise Social Networking (ESN) on Business: Five Effective Recommendations for ESN
Saeed M. Alqahtani, Sultan Alanazi, and Derek McAuley
University of Nottingham, School of Computer Science {psxsa22,psxsa16,derek.mcauley}@nottingham.ac.uk
Abstract. The growth of social networking over the recent past has been phe-nomenon and business gains and opportunities generated by social networking sites such as Facebook, MySpace, LinkedIn and Tweeter among others, indicate the potential of social networking to help achieve business outcomes and en-hance the conduciveness of contemporary working environments. The chal-lenge of generating the gains and opportunities presented by social networking into the enterprises lies in developing effective frameworks and strategies that are essential in facilitating enterprise social networking (ENS) successfully. The aim of this study is to analyze and investigate the spread of social networking in the workplace in order to determine how a social network influences business and society, as well as how we can reshape and/or guide the ENS to a more ef-ficient future business environment. Then, recommendation systems for an ESN system will be proposed.
Keywords: ESN, Social Networking, Business, Recommendation Systems.
1 Introduction
Social networks have provided a fertile ground to not only socialize with millions of people across the globe on a personal level, but also, it has generated a global plat-form on which technologically savvy entrepreneurs, enterprises, firms and institu-tions, be it small or large, private or public and profit or non-profit making to create consumer global awareness of their existence. Moreover, it assists potential and exist-ing customers on what they have to offer, presenting their selling and unique points and having the capacity to penetrate new global markets that would have otherwise been impossible to do or very costly to develop and implement [1]. Primarily, the social media has altered almost all aspects of our lives as indicated by Barlow & Thomas [2].
Social networking in the workplace is a new phenomenon that firms and institu-tions in the present day that are brave and risk takers are adopting in a bid to capital-ize on the strategic benefits. These benefits of social enterprises generate and particu-larly in their efforts to enhance teamwork, develop healthier interrelations and empower, inspire and encourage its labour forces to be productive, committed,
24 S.M. Alqahtani, S. Alanazi, and D. McAuley
accountable, satisfied in their jobs and more importantly to make them take ownership of the organization’s strategic goals and objectives. The social media is such a com-prehensive organizational tool, which can easily be used as public relations tool that can be used by the firm or institution to improve their public image and reputation as discussed by Klososky [3].
As noted by Barlow & Thomas, the social networks have evolved the communica-tion landscape, which has eradicated the need for physical meetings that eat into a firm’s time and resources that would now be used in enhancing production capacity and has developed virtual offices that allows employees to work anytime and any-where [2]. According to Klososky, social media offers an element of immediacy, relevance, information flow, connectivity and broadness that lacks in virtually all other social technologies or other forms of media for that matter [3]. Communication in organizational setups has predominantly been one way, with information flowing from the top management to the lower organizational structures and not vice versa but social networking has set in to alter and reassess the hierarchical approach adopted in relation to organizational communication as highlighted by Butler [1]. Despite the great potential and extensive benefits that social networking generates for contempo-rary firms and institutions, there is a lack of research which has been carried out to analyze and investigate its spread in workplace. This forms the basis of this study, which is to analyze and investigate the spread of social networking in the workplace in order to determine how a social network influences business and society, as well as how one can reshape and/or guide the Enterprise Social Network (ESN) to a more efficient future business environment.
The contribution of this research would help resolve doubts on the effectiveness of social networking to enhance business systems and operations, which help in ensuring the business goals, objectives, mission and vision, are effectively and efficiently achieved. In this study we firstly present a background of ESN influence which cov-ers extensively a literature review on three key concepts. In section (3) we have pre-sented how this study has been investigated. In section (4), (5), we have highlighted in detail the findings, analysis and discussions of the research study by providing the questionnaire analysis, interview analysis, discussion. In section (6), we have listed the most effective recommendation systems for those firms and institutions that seek to implement ESN successfully. Finally, a summary in the conclusion section will be outlined while presenting results further discussing recommendations for future work.
2 Related Work
Modern businesses and institutions are engulfed in stiff business and market competi-tion that is coupled with shifting political, technological, ecological, economical, legal, financial, cultural and social factors that makes the market and business envi-ronments unpredictable [4]. Due to advancement in technology, and advancement in communication and transport infrastructures, the modern customer is more informed and therefore, has a high bargaining power than they originally and more and more businesses are coming up, with the two elements combined together causing a
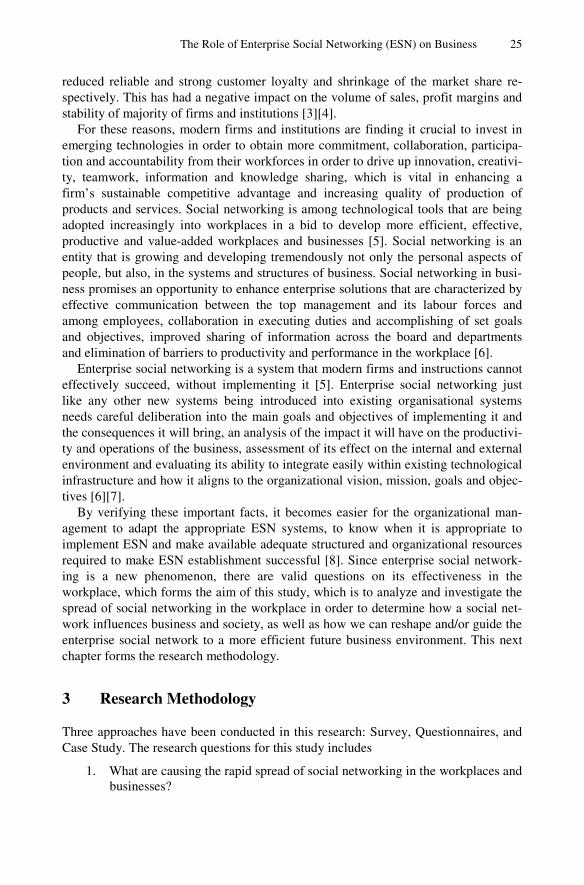
The Role of Enterprise Social Networking (ESN) on Business 25
reduced reliable and strong customer loyalty and shrinkage of the market share re-spectively. This has had a negative impact on the volume of sales, profit margins and stability of majority of firms and institutions [3][4].
For these reasons, modern firms and institutions are finding it crucial to invest in emerging technologies in order to obtain more commitment, collaboration, participa-tion and accountability from their workforces in order to drive up innovation, creativi-ty, teamwork, information and knowledge sharing, which is vital in enhancing a firm’s sustainable competitive advantage and increasing quality of production of products and services. Social networking is among technological tools that are being adopted increasingly into workplaces in a bid to develop more efficient, effective, productive and value-added workplaces and businesses [5]. Social networking is an entity that is growing and developing tremendously not only the personal aspects of people, but also, in the systems and structures of business. Social networking in busi-ness promises an opportunity to enhance enterprise solutions that are characterized by effective communication between the top management and its labour forces and among employees, collaboration in executing duties and accomplishing of set goals and objectives, improved sharing of information across the board and departments and elimination of barriers to productivity and performance in the workplace [6].
Enterprise social networking is a system that modern firms and instructions cannot effectively succeed, without implementing it [5]. Enterprise social networking just like any other new systems being introduced into existing organisational systems needs careful deliberation into the main goals and objectives of implementing it and the consequences it will bring, an analysis of the impact it will have on the productivi-ty and operations of the business, assessment of its effect on the internal and external environment and evaluating its ability to integrate easily within existing technological infrastructure and how it aligns to the organizational vision, mission, goals and objec-tives [6][7].
By verifying these important facts, it becomes easier for the organizational man-agement to adapt the appropriate ESN systems, to know when it is appropriate to implement ESN and make available adequate structured and organizational resources required to make ESN establishment successful [8]. Since enterprise social network-ing is a new phenomenon, there are valid questions on its effectiveness in the workplace, which forms the aim of this study, which is to analyze and investigate the spread of social networking in the workplace in order to determine how a social net-work influences business and society, as well as how we can reshape and/or guide the enterprise social network to a more efficient future business environment. This next chapter forms the research methodology.
3 Research Methodology
Three approaches have been conducted in this research: Survey, Questionnaires, and Case Study. The research questions for this study includes
1. What are causing the rapid spread of social networking in the workplaces and businesses?

26 S.M. Alqahtani, S. Alanazi, and D. McAuley
2. What are the negative and positive implications of the increased spread of social networking?
3. What are the impact social networks have on business and the society in general?
4. How can ESN successfully be implemented in the workplace in order to generate effective, efficient and productive enterprise solutions?
By evaluating and measuring the traffic of visitors that visit or frequent a site, it would be help and essential to assess the effectiveness and adequacy of the marketing and advertising strategies used in social networking, which can then be transferred to ESN. A case study on one real company that has implemented ESN and an active social networking site such as Facebook to analyze the trend of visitors on the site, the services they consume has been used. This will help in establishing means of reshaping ESN adopted in workplaces. In this study, there were primary and secondary data, the main data will be collected using questionnaires for the survey, focus group discussions for the case study and online polling. Secondary data will be collected from peer-reviewed journals, textbooks and records of established firms that have implemented ESN. Focus group discussions techniques was appropriate for this study in order to their ability to verify validity of findings collected from quantitative research methods, they allow the researcher to observe the respondents, ask and seek clarifications.
The population samples for this study are respondents aged above 14 years of age from schools, office set-ups, and regular people at public places. The number of res-pondents will range from a quota of two thousand five hundred people that comprise of 750 employees, who frequently use social networking in their personal lives and not professionally, 250 top managers who frequently use social networking for per-sonal reasons and not for business purposes, 10 line managers working in a real firm that has implemented enterprise social networking and 200 employees from different organizational structures within the real firm that has implemented enterprise social networking, 750 respondents used in the internet polling and 740 respondents of ordi-nary people at public places. In order to get correct data, each questionnaire will be authorized from the respective agent such as cases of data collected from employees the data will be certified by the manager, in cases of university students the data will be certified by the head of the department, and in cases of school students the teacher will certify the data provided by the student. This is how correct and reliable research can be undertaken. Once the data is collected, there are certain criterions to include and exclude the participant. This research will include how ESN can be improved to help businesses. Therefore young people such as school students are not able to pro-vide the advice in this context; therefore, their response will have low importance as compare to those who are directly linked with the company such as office employees, businessmen, and all other people are directly involved with any business matters.
4 Results and Discussion
4.1 Results
The questionnaire questions were developed based on three key issues of social networking identified in this study. These includes the spread of social networking,
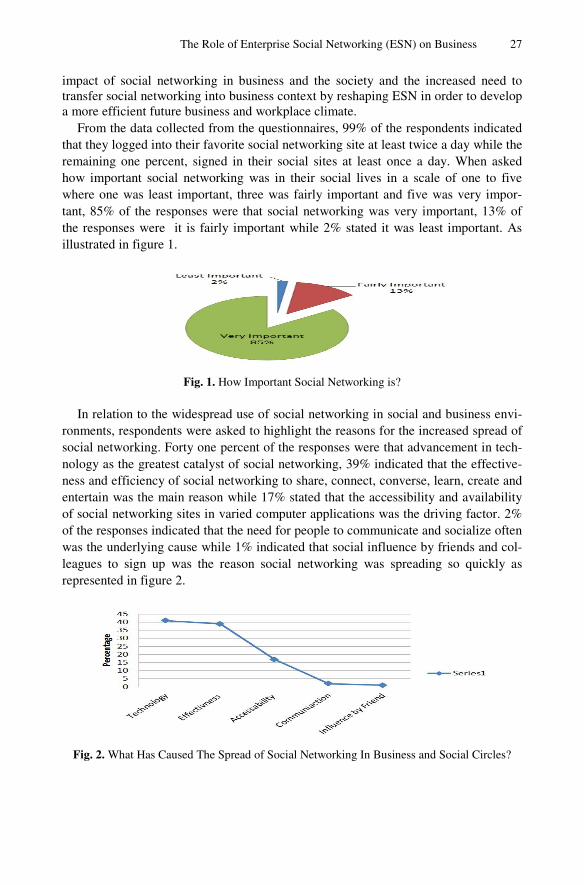
The Role of Enterprise Social Networking (ESN) on Business 27
impact of social networking in business and the society and the increased need to transfer social networking into business context by reshaping ESN in order to develop a more efficient future business and workplace climate.
From the data collected from the questionnaires, 99% of the respondents indicated that they logged into their favorite social networking site at least twice a day while the remaining one percent, signed in their social sites at least once a day. When asked how important social networking was in their social lives in a scale of one to five where one was least important, three was fairly important and five was very impor-tant, 85% of the responses were that social networking was very important, 13% of the responses were it is fairly important while 2% stated it was least important. As illustrated in figure 1.
Fig. 1. How Important Social Networking is?
In relation to the widespread use of social networking in social and business envi-ronments, respondents were asked to highlight the reasons for the increased spread of social networking. Forty one percent of the responses were that advancement in tech-nology as the greatest catalyst of social networking, 39% indicated that the effective-ness and efficiency of social networking to share, connect, converse, learn, create and entertain was the main reason while 17% stated that the accessibility and availability of social networking sites in varied computer applications was the driving factor. 2% of the responses indicated that the need for people to communicate and socialize often was the underlying cause while 1% indicated that social influence by friends and col-leagues to sign up was the reason social networking was spreading so quickly as represented in figure 2.
Fig. 2. What Has Caused The Spread of Social Networking In Business and Social Circles?
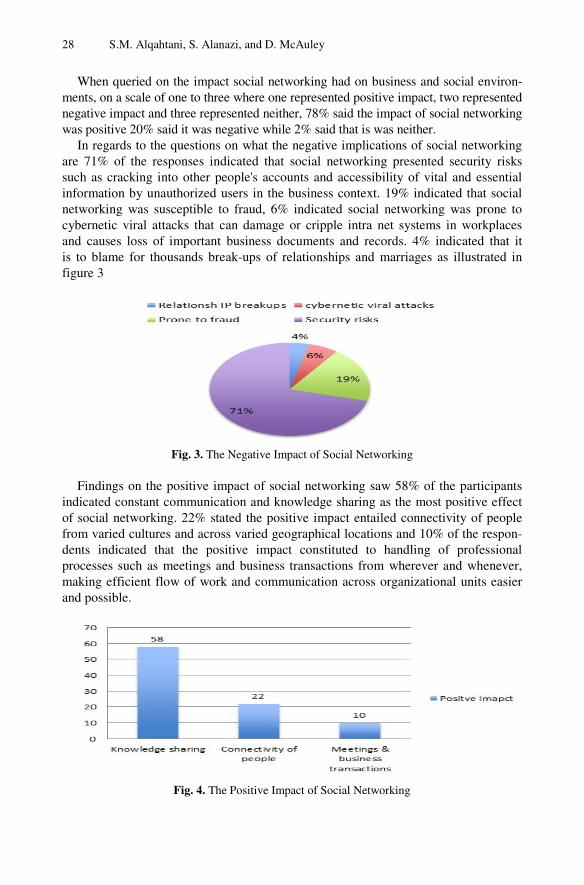
28 S.M. Alqahtani, S. Alanazi, and D. McAuley
When queried on the impact social networking had on business and social environ-ments, on a scale of one to three where one represented positive impact, two represented negative impact and three represented neither, 78% said the impact of social networking was positive 20% said it was negative while 2% said that is was neither.
In regards to the questions on what the negative implications of social networking are 71% of the responses indicated that social networking presented security risks such as cracking into other people's accounts and accessibility of vital and essential information by unauthorized users in the business context. 19% indicated that social networking was susceptible to fraud, 6% indicated social networking was prone to cybernetic viral attacks that can damage or cripple intra net systems in workplaces and causes loss of important business documents and records. 4% indicated that it is to blame for thousands break-ups of relationships and marriages as illustrated in figure 3
Fig. 3. The Negative Impact of Social Networking
Findings on the positive impact of social networking saw 58% of the participants indicated constant communication and knowledge sharing as the most positive effect of social networking. 22% stated the positive impact entailed connectivity of people from varied cultures and across varied geographical locations and 10% of the respon-dents indicated that the positive impact constituted to handling of professional processes such as meetings and business transactions from wherever and whenever, making efficient flow of work and communication across organizational units easier and possible.
Fig. 4. The Positive Impact of Social Networking
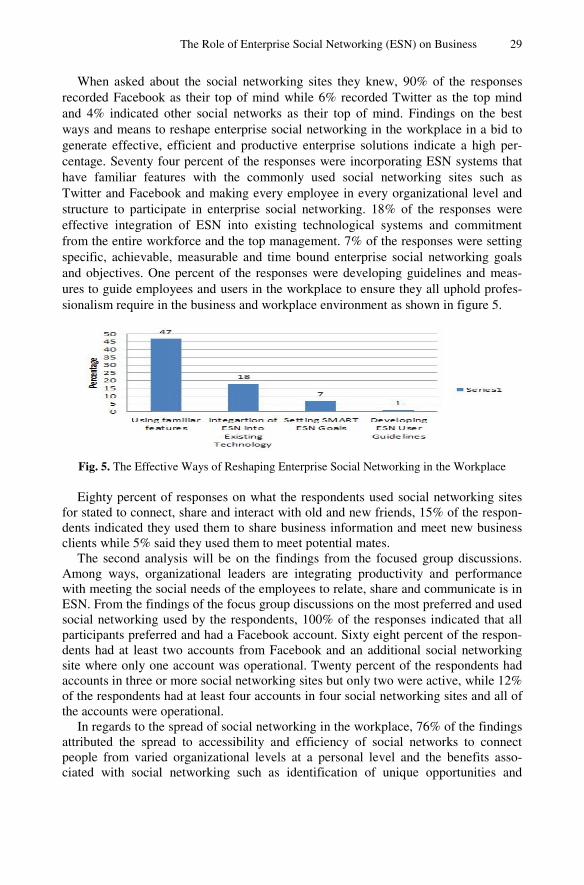
The Role of Enterprise Social Networking (ESN) on Business 29
When asked about the social networking sites they knew, 90% of the responses recorded Facebook as their top of mind while 6% recorded Twitter as the top mind and 4% indicated other social networks as their top of mind. Findings on the best ways and means to reshape enterprise social networking in the workplace in a bid to generate effective, efficient and productive enterprise solutions indicate a high per-centage. Seventy four percent of the responses were incorporating ESN systems that have familiar features with the commonly used social networking sites such as Twitter and Facebook and making every employee in every organizational level and structure to participate in enterprise social networking. 18% of the responses were effective integration of ESN into existing technological systems and commitment from the entire workforce and the top management. 7% of the responses were setting specific, achievable, measurable and time bound enterprise social networking goals and objectives. One percent of the responses were developing guidelines and meas-ures to guide employees and users in the workplace to ensure they all uphold profes-sionalism require in the business and workplace environment as shown in figure 5.
Fig. 5. The Effective Ways of Reshaping Enterprise Social Networking in the Workplace
Eighty percent of responses on what the respondents used social networking sites for stated to connect, share and interact with old and new friends, 15% of the respon-dents indicated they used them to share business information and meet new business clients while 5% said they used them to meet potential mates.
The second analysis will be on the findings from the focused group discussions. Among ways, organizational leaders are integrating productivity and performance with meeting the social needs of the employees to relate, share and communicate is in ESN. From the findings of the focus group discussions on the most preferred and used social networking used by the respondents, 100% of the responses indicated that all participants preferred and had a Facebook account. Sixty eight percent of the respon-dents had at least two accounts from Facebook and an additional social networking site where only one account was operational. Twenty percent of the respondents had accounts in three or more social networking sites but only two were active, while 12% of the respondents had at least four accounts in four social networking sites and all of the accounts were operational.
In regards to the spread of social networking in the workplace, 76% of the findings attributed the spread to accessibility and efficiency of social networks to connect people from varied organizational levels at a personal level and the benefits asso-ciated with social networking such as identification of unique opportunities and

30 S.M. Alqahtani, S. Alanazi, and D. McAuley
Fig. 6. Reasons for Spread of Social Networking
knowledge sharing. 18% indicated the spread was as a result of the human need to communicate, share and relate constantly while 4% indicated the ease in transfer of social networking systems into the workplace and cost effectiveness of social net-works.
Benefits generated by social networking recorded from the focus group discussions amounted to 80% of the responses being elimination of barriers to productivity, in-creased collaboration and sharing, which generates creativity and innovativeness among workers, 10% of the responses being increased participation by employees and a further 10% indicating the ease in access of valuable and dynamically updated information.
In relation to the best techniques to guide enterprise social networking at the workplace, 80% of the responses were developing effective groundwork and compre-hensive ESN implementation strategies and fostering commitment from all stakehold-ers. Fifteen percent of the responses were development of quantifiable and realistic ESN goals and development of guiding principles and ideals to direct employees on use of ESN professionally. Five percent indicated development of ESN systems with familiar features adopted from commonly used social networking sites used to attract and retain users and fit them into ESN.
Fig. 7. The Effective Ways of Reshaping ESN
Eight percent of the responses on the questions of negative consequences of social networking at workplaces were time wasting. Ten percent indicating security threats such as accessibility of sensitive information to unauthorized persons and spread of malicious information that can cause emotional and psychological harm to employees, 3% indicating disintegration of strong family and social ties as people are engaged on virtual relationships than real life relationships. 2% indicating spread of security threats such as viruses that can corrupt computer systems at work.

The Role of Enterprise Social Networking (ESN) on Business 31
Fig. 8. How Firms Utilize Social Networking in the Workplace
When asked on whether the companies they worked for used social networking for any business reasons 50% of the responses indicated they did while the rest indicted they did not. For those that used social networking in their companies for personal reasons, 65% of them indicated that they used it to promote their products and servic-es to exiting and potential customers. Fifteen percent indicated that they used them to get and analyze reviews and feedback from their customers, 10% indicated they used social networking to conduct business research while 10% indicated they fused them to create awareness about their company, products and services.
4.2 Discussion
The research findings have provided adequate information covering the three key issues identified from the literature reviewed, which are the rapid spreads of social networking, the great impact social networks have on business and the society. In addition, the increased need to transfer social networking into business by reshaping ESN in order to develop a more efficient future business and workplace climate.
As noted from the findings, spread of social networking in the workplace is an accu-mulation of factors that ranges from its ability to meet the human need to connect, con-sume and share information among like-minded users. Cost effectiveness in using social networks, increased benefits associated with productivity, engagement, collaboration, knowledge sharing, ability to continually work and operate business issues from any-where and anytime thus, eradicating the importance of meetings and office settings and the increased ease in access of valuable and dynamically updated information by em-ployees and the top management. However, majority of respondents associated the spread of social networking in the workplace with spread of risks such as viruses, nega-tive publicity caused by spread of malicious rumors as indicated by [9].
Social networking systems fitted effectively in the workplaces helps organizations in tracking the movements of their top performing accounts, analyze and understand the needs of the customer and thus be in a position to produce and deliver quality products and services that effectively and efficiently meet the changing demands, needs and expectations of the customer. This is made possible by posting on-line surveys in ESN sites to examine the attitudes, feedback and views of the customers as highlighted by [10]. the findings indicate that social networking helps develop more productive workforces associated with the employee's ability to share more, know more, collaborate more and know each other from different departments and organi-zational levels, findings which are supported by [11]. Nevertheless, the findings high-light significant concerns by respondents on the negative impact of social networking

32 S.M. Alqahtani, S. Alanazi, and D. McAuley
in the workplaces such as time wasting, increased susceptibilities to security risks where vital information falls on wrong hands and malicious rumors and misinforma-tion is spread jeopardizing the reputation of the firm or its workforces. On social lev-el, criminal offenders such as child molesters and sexual offenders have lured their victims using fictitious names and profiles in social networking sites , trapping unsus-pecting victims [12]. Nevertheless, David et. al (2012) indicates that implementing ESN from an informed and proactive stance will help limit the risks developed by enterprise social networking and help firms in staying relevant, attracting and retain-ing sustainable and productive employees [13].
The most significant variable that majority of the respondents indicated as the most effective strategy in reshaping ESN to help develop more efficient business and workplace environments is development of ESN systems with familiar features adopted from social networking sites commonly such as Facebook. Among familiar features that are consistent among social networking sites and can easily fit into ESN systems includes creation of personalized profiles, which are used to find and locate past, current and prospective personal and business contacts. Development of security measures that safeguard users from interactions with persons they do not know or they would not want to connect with, social status, creation of personalized home pages that helps in linkage of like-minded users, features that allow addition, removal of contacts and features that allow users to post comments, comment and share infor-mation, videos and pictures.
Findings from the research that employees need to be guided on how and when to use ESN echoes sentiments mentioned in the literature review and supported by [14]. This entails development of policies and regulations guiding employees in the workplace on how they represent themselves as professionals on enterprise social networking, which involves posting business related updates and uploading business appropriate photos, files and videos. This is important because enterprise social net-working represents a corporate environment and should be handled as such. As Goo-dall et al. (2009) suggests, information made available on the enterprise social net-working impacts on the perceptions and attitudes of people about the company [15]. This is echoed by Greenleaf (2010) who mentions that effective employees should know what to post in the social networking site and what not to [16] .
5 Recommendations and Conclusion
5.1 Recommendations
This chapter offers effective recommendations for those firms and institutions that seek to implement enterprise social networking successfully and for those that have already implemented and would want to ensure the implementation process remains successful.
5.1.1. Align the ESN Goals with the Goals of the Business and those of Employees ESN is the wonder drug that organizational leaders having been looking for to cure organizational aliments such as fragmented interrelationship among team members
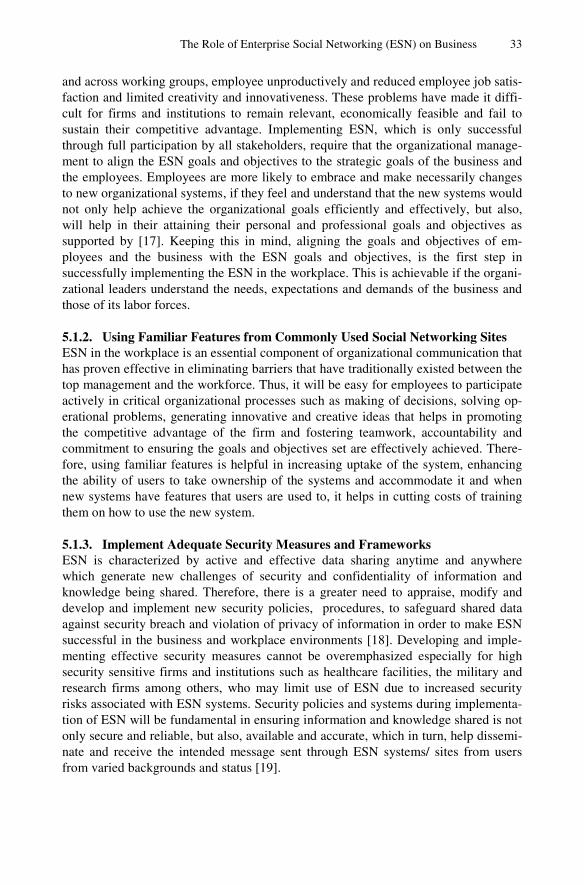
The Role of Enterprise Social Networking (ESN) on Business 33
and across working groups, employee unproductively and reduced employee job satis-faction and limited creativity and innovativeness. These problems have made it diffi-cult for firms and institutions to remain relevant, economically feasible and fail to sustain their competitive advantage. Implementing ESN, which is only successful through full participation by all stakeholders, require that the organizational manage-ment to align the ESN goals and objectives to the strategic goals of the business and the employees. Employees are more likely to embrace and make necessarily changes to new organizational systems, if they feel and understand that the new systems would not only help achieve the organizational goals efficiently and effectively, but also, will help in their attaining their personal and professional goals and objectives as supported by [17]. Keeping this in mind, aligning the goals and objectives of em-ployees and the business with the ESN goals and objectives, is the first step in successfully implementing the ESN in the workplace. This is achievable if the organi-zational leaders understand the needs, expectations and demands of the business and those of its labor forces.
5.1.2. Using Familiar Features from Commonly Used Social Networking Sites ESN in the workplace is an essential component of organizational communication that has proven effective in eliminating barriers that have traditionally existed between the top management and the workforce. Thus, it will be easy for employees to participate actively in critical organizational processes such as making of decisions, solving op-erational problems, generating innovative and creative ideas that helps in promoting the competitive advantage of the firm and fostering teamwork, accountability and commitment to ensuring the goals and objectives set are effectively achieved. There-fore, using familiar features is helpful in increasing uptake of the system, enhancing the ability of users to take ownership of the systems and accommodate it and when new systems have features that users are used to, it helps in cutting costs of training them on how to use the new system.
5.1.3. Implement Adequate Security Measures and Frameworks ESN is characterized by active and effective data sharing anytime and anywhere which generate new challenges of security and confidentiality of information and knowledge being shared. Therefore, there is a greater need to appraise, modify and develop and implement new security policies, procedures, to safeguard shared data against security breach and violation of privacy of information in order to make ESN successful in the business and workplace environments [18]. Developing and imple-menting effective security measures cannot be overemphasized especially for high security sensitive firms and institutions such as healthcare facilities, the military and research firms among others, who may limit use of ESN due to increased security risks associated with ESN systems. Security policies and systems during implementa-tion of ESN will be fundamental in ensuring information and knowledge shared is not only secure and reliable, but also, available and accurate, which in turn, help dissemi-nate and receive the intended message sent through ESN systems/ sites from users from varied backgrounds and status [19].
34 S.M. Alqahtani, S. Alanazi, and D. McAuley
5.1.4. Maintain Professionalism When Using ESN Systems
ESN violates the traditional system of a business where the corporate component of the business does not interrelate with the personal component of the stakeholders. Although ESN is more of a socially-engineered concept, the organizational leaders should develop formal structures to guide and remind the labor forces using the ESN Therefore, ESN users should adhere to set ESN regulations, observe legal constraints, understand the intricacies of international property in relation to the messages and information they publish on the ESN sites. Maintaining professionalism on ESN in the workplace ensures that users are still able to adhere to their professional code of ethics and comply with organizational, rules, laws and guidelines, which are impor-tant in maintaining order and control over flow of work and operational processes. Additionally, it is a key in sustaining the confidence of the customer in the ability of the firm or institution to produce and deliver professional solutions that they may require.
However, professionalism when using ESN systems is realizable by controlling and managing the type of messages and information, which is shared or posted on the personalized profiles and regulating the type of audios, videos and pictures uploaded on the ESN systems. Moreover, the kind of language used in forums, discussions, and meetings held over enterprise social networking systems. According to Foster et al. (2009), sharing and productivity will improve even more when each employee is ac-cessible from anywhere and anytime [20]. This is achievable by making ESN availa-ble in commonly used technological devices such as mobile phones and IPads. In addition, being choosy with what to follow or who to accept invites from, making meaningful real-time feeds and focusing on information, documents and insights that will enhance work performance and productivity.
5.1.5. Commitment Commitment entails stakeholders within and exterior to the firm being dedicated to ensuring the ESN goals and objectives that are aligned to business strategies and effectively and efficiently achieved. Every successful venture in workplace and busi-ness environments rides on the commitment offered by the stakeholders and success-ful implementation of ESN in the workplace is no different. In implementing ESN, commitment from the top management and all users is vital in making the process viable and successful. Foster et al. (2009) mention that it is important that all partici-pants are devoted to seeing the ESN implementation process succeed regardless of who has initiated the process [20].
5.2 Conclusion and Future Work
From the study, the rapid spread of social networking in the workplace is associated with ease in access of social networking services in cost effective tools such as mobile phones, the core need of people to relate as social beings, an effective means of de-veloping and sustaining contacts with old and new contacts and the immediacy of sending and receiving information over social networking systems. Furthermore, the potential of social networking to contribute to quality life, identify unique

The Role of Enterprise Social Networking (ESN) on Business 35
opportunities, linking diverse people from all fronts internationally and the ability to share insights and perspectives, which are essential components of continuous learning, innovation, creativity and enhancing one’s ability to respond to change positively.
The positive impact of social networks in the business and the society overrides its negative implications, which only amount to security risks that can be effectively and efficiently be mitigated by reviewing and constant revising of ESN security policies and guidelines. Among the positive impact of social networking verified by the study is the ability to use social networking sites to mobilize and lobby support for social, political and economical agendas, enhancement of the concept of community as people from varied backgrounds globally who have mutual goals, interests, visions and mission are able to start and maintain contact and relate with one another regard-less of the distance that separates them and improved communication and knowledge sharing among team members and across different working groups.
What is more, elimination of barriers to productivity, increased collaboration from all quotas of the firm, elimination of boundaries among the workforce in varied orga-nizational structures and enhanced value associated by creativity and innovativeness linked with ESN. By understanding the spread of social networking and the impact it has on business and the society has provided a framework for developing effective strategies for successful implementation of ESN in the workplace in order to develop efficient future workplace and business climates.
As indicated by the research findings and the literature reviewed, effective imple-mentation of ESN is achievable by fostering commitment from all stakeholders in ESN implementation process, developing comprehensive ESN implementation strate-gies whose goals are aligned to the business goals, developing effective security measures to protect data shared within and between enterprises, maintaining profes-sionalism while using ESN and adopting familiar features commonly used in Social sites into ESN systems. Despite the comprehensive approach adopted by this study, further research are required to investigate additional risks that are generated by ESN in the workplace and how organizations can effectively govern ESN.
References
1. Butler, M., Butler, D.L., Chester, J.: Enterprise Social Networking and Collaboration. Martin Butler Research Limited (2010)
2. Barlow, M., Thomas, D.B.: The executive’s guide to enterprise social media strategy: how social networks are radically transforming your business, vol. 42. John Wiley & Sons (2010)
3. Klososky, S.: Enterprise Social Technology: Helping Organizations Harness the Power of Social Media, Social Networking, Social Relevance. Greenleaf Book Group (2011)
4. Meyer, P.: From Workplace to Playspace: innovating, learning and changing through dynamic engagement. Wiley.com (2010)
5. Van Fleet, D.D., Van Fleet, E.W.: The violence volcano: Reducing the threat of workplace violence. IAP (2010)
6. Powell, J.: 33 Million people in the room: How to create, influence, and run a successful business with social networking. Que Publishing (2009)

36 S.M. Alqahtani, S. Alanazi, and D. McAuley
7. Bernal, J.: Web 2.0 and social networking for the enterprise: Guidelines and examples for implementation and management within your organization. Pearson Education (2009)
8. Newman, A., Thomas, J.: Enterprise 2.0 Implementation. McGraw Hill Professional (2008)
9. Coombs, W.T.: Ongoing crisis communication: Planning, managing, and responding. Sage Publications (2011)
10. Van Winkelen, C., McKenzie, J.: Knowledge Works: The Handbook of Practical Ways to Identify and Solve Common Organizational Problems for Better Performance. Wi-ley.com (2011)
11. Flemming, L.E.: Reading Keys. Cengage Learning (2013) 12. Lusted, M.A.: Social Networking: MySpace, Facebook, and Twitter. ABDO (2011) 13. David, M., Sutton, C.D.: Social research: The basics. Sage (2004) 14. Butterfield, J.: Professionalism: Soft Skills for a Digital Workplace. Cengage Learning,
Singapore (2010) 15. Goodall, S., Goodall Jr, H.L., Schiefelbein, J.: Business and Professional Communica-
tion in the Global workplace. Cengage Learning (2009) 16. Greenleaf, C.: The Unwritten Rules of the Workplace: A Guide to Etiquette and Attire
for Businessmen. Emerald Book (Distributor), Sidney (2009) 17. Shanks, G., Seddon, P.B., Willcocks, L.: Second-wave enterprise resource planning sys-
tems: Implementing for effectiveness. Cambridge University Press (2003) 18. Badke, W.: Research strategies: Finding your way through the information fog. iUni-
verse (2012) 19. von Hellens, L., Nielsen, S., Beekhuyzen, J.: Qualitative case studies on implementation
of enterprise wide systems. IGI Global (2005) 20. Foster, G., Meehan, J., Mason, C., Meehan, K.: Management for social enterprise. Sage
Publications (2009)

W. Zamojski et al. (eds.), Proceedings of the Ninth International Conference DepCoS-RELCOMEX, Advances in Intelligent Systems and Computing 286,
37
DOI: 10.1007/978-3-319-07013-1_4, © Springer International Publishing Switzerland 2014
Dependability and Safety Analysis of ETCS Communication for ERTMS Level 3
Using Performance Statecharts and Analytic Estimation
Tomasz Babczyński and Jan Magott
Institute of Computer Engineering, Control and Robotics, Wrocław University of Technology Wybrzeże Wyspiańskiego Street 27, 50-370 Wrocław, Poland {tomasz.babczynski,jan.magott}@pwr.wroc.pl
Abstract. Dependability and safety in European Rail Traffic Management Sys-tem (ERTMS) level 3 are influenced by quality of localisation of trains and communication. In the paper, dependability and safety of European Train Con-trol System (ETCS) communication for ERTMS level 3 is considered. In ERTMS level 3, traffic is controlled by so called moving block that is associ-ated with the distance between subsequent trains. Relationship between prob-ability of emergency train braking as a function of distance between subsequent trains is studied. In the study, the following parameters are taken into account: train speed, emergency braking distance, train length, position localization er-ror, random variable of emergency braking and stopping times, parameters of transmission between trains and radio block centres, processing time in these centres. In order to find this relationship, the following methods: performance statecharts based and analytic estimation have been proposed. Quality of these methods is investigated.
Keywords: ETCS communication and operation, performance statecharts, Monte-Carlo simulation.
1 Introduction
Dependability and safety parameters in Europe railway domain are specified in stan-dards [5,6]. According to standard [9]: “dependability is the collective term used to describe the availability performance and its influencing factors: reliability perform-ance, maintainability performance and maintenance support performance”. Safety levels are characterized by tolerable hazard rate for Safety Integrity Levels (SIL) [6].
European Rail Traffic Management System (ERTMS) is the European standard for train control and command systems, which is intended to unify all European systems and to enhance cross-border interoperability. European Train Control System (ETCS) is a part of the ERTMS. The ETCS is based on radio communication. There are three levels of ERTMS, with level 3 as the highest. At this level, all important information is exchanged between trains and trackside coordination unit so-called radio block centres (RBCs) via GSM-R (rail GSM communication). A train needs to receive

38 T. Babczyński and J. Magott
so-called movement authorities from the RBC in order to continuously run at high speed. Data processing on board the train and in the RBCs, and radio communication link are crucial factors for safety and efficient operation. Train localization, speed, and integrity information is prepared on board the train, and reported from train to RBC at regular intervals. This enables the RBC to declare the track space behind the train clear which is used in moving block operation mode. It is the main difference when comparing with fixed track blocks used in traditional train traffic.
Dependability and safety are influenced by quality of localization of railway vehi-cles [4] and communication [7,8,13,14,15]. In ERTMS level 3, train traffic is controlled using moving block that is connected with the distance between two subse-quent trains.
The relationship between probability of train stopping as a function of distance be-tween subsequent trains, for given train and ETCS communication parameters, is studied in the paper.
The problem investigated in the paper is as follows. Input (parameters of moving block mode communication and operation): Train speed, Emergency braking distance, Train length, Position localization error, Random variable of emergency braking and stopping time, Probability of incorrect transmission from train to RBC and from RBC to train, Random variable of duration time of correct transmissions from train to RBC and from RBC to train, Processing time in RBC. Output: Probability of stopping as a function of distance between subsequent trains.
The above problem has been studied in the papers [14,15]. Our study is based on parameters from these papers.
Petri nets [3,11,14,15], and statecharts or state machines [8,10,13,14] are often used in dependability or safety analysis of ERTMS systems. The examples of other modelling languages used in dependability or safety analysis are fault trees and Bayesian networks [7]. Petri nets are formal tool with strong theoretical foundations that are used in expressing the concurrent activities of complex systems. Statecharts or state machines are one of fourteen diagrams of Unified Modelling Language (UML). UML is the standard modelling language in software development. In paper [14], state machines are used as modelling language, while Petri net tool is used for formal verification. In paper [8], application of StoCharts (derived from statecharts) in reliability analysis of train radio communications in ETCS level 3 is presented. How-ever, the transformation of the model given in StoCharts into model in MoDeST is required. The last is specification language enriched with facilities to model timed and/or stochastic systems. In paper [12], usefulness of statecharts in safety analysis has been shown.

Dependability and Safety Analysis of ETCS Communication for ERTMS 39
Our goal is to use one language for modelling and analysis. Therefore, perform-ance statecharts [1] are applied in the paper.
In papers [8,13,14,15], in order to solve dependability or safety problems, simula-tion experiments are performed or linear equation systems are solved. Performance statechart tool [1] finds the solution by Monte-Carlo simulation.
Additionally, the analytical estimation of the probability of stopping as a function of distance between subsequent trains is given in the paper, and its accuracy is veri-fied. This estimation is expressed by simple formula.
Structure of the paper is as follows. Performance statecharts are recalled in Section 2. Performance statechart model for ETCS communication and operation is given in next section. Analytic estimation of the probability that a train is stopped after emer-gency breaking is presented in Section 4. For the performance statechart model, this probability obtained by simulation is given in Section 5. In the same section, the esti-mation of this probability is given too, and estimation accuracy is evaluated. Finally, there are conclusions.
2 Performance Statecharts
The performance statecharts formalism is defined in details in the work [1]. Here, only main syntactic constructs will be characterized. First, a definition of statecharts (without time) will be shown, and then a definition of performance statecharts, which contains the definition of statecharts.
Statechart [1] is a higraph defined as a six tuple:
S = <BoxN, childB, typeB, defaultB, ArcN, Arc>, where: (1)
─ BoxN is finite set of state names, which are nodes of the graph depicted as round-edged rectangles named boxes.
─ childB ⊆ BoxN × BoxN is hierarchy relation: <b1, b2>∈childB means that b2 is a "child" of "father" b1. Set BoxN with relation childB defines a tree of states <BoxN,childB>. The root r of the tree has no parents, leaves have no childs.
─ typeB : BoxN → {PRIM, XOR, AND} is a function which assign a type to each box. The root r is of type XOR (an sequential automaton), the leaves are of type PRIM, and other boxes may be either of type XOR or AND (state with orthogonal sub-states).
─ defaultB : BoxN → 2BoxN is the partial function that gives the default for each box. The default for a XOR box is a set with exactly one box of its children (an initial state of the automaton), while the default for an AND box is the set of all its chil-dren. The default for a PRIM box is the empty set.
─ ArcN is a finite set of names for arcs. BoxN ∩ ArcN =∅. ─ Arc ⊆ BoxN × ArcN × BoxN is the set of arcs. An arc α∈Arc is a triple <b1,a,b2>
with source(α) = b1, and target(α ) = b2, and name(α) = a. It is assumed that arcs are uniquely identified by arc names. Arcs depict transitions between states.
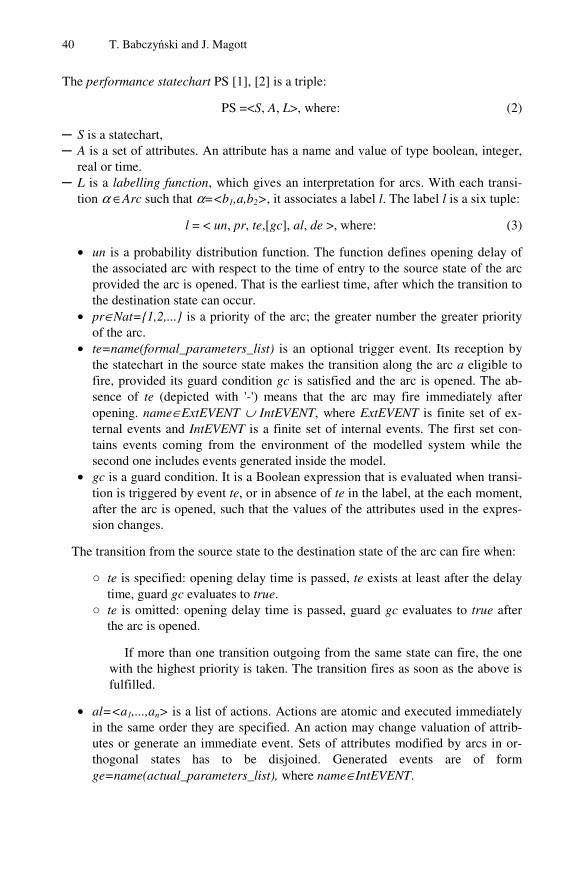
40 T. Babczyński and J. Magott
The performance statechart PS [1], [2] is a triple:
PS =<S, A, L>, where: (2)
─ S is a statechart, ─ A is a set of attributes. An attribute has a name and value of type boolean, integer,
real or time. ─ L is a labelling function, which gives an interpretation for arcs. With each transi-
tion α ∈Arc such that α=<b1,a,b2>, it associates a label l. The label l is a six tuple:
l = < un, pr, te,[gc], al, de >, where: (3)
• un is a probability distribution function. The function defines opening delay of the associated arc with respect to the time of entry to the source state of the arc provided the arc is opened. That is the earliest time, after which the transition to the destination state can occur.
• pr∈Nat={1,2,...} is a priority of the arc; the greater number the greater priority of the arc.
• te=name(formal_parameters_list) is an optional trigger event. Its reception by the statechart in the source state makes the transition along the arc a eligible to fire, provided its guard condition gc is satisfied and the arc is opened. The ab-sence of te (depicted with '-') means that the arc may fire immediately after opening. name∈ExtEVENT ∪ IntEVENT, where ExtEVENT is finite set of ex-ternal events and IntEVENT is a finite set of internal events. The first set con-tains events coming from the environment of the modelled system while the second one includes events generated inside the model.
• gc is a guard condition. It is a Boolean expression that is evaluated when transi-tion is triggered by event te, or in absence of te in the label, at the each moment, after the arc is opened, such that the values of the attributes used in the expres-sion changes.
The transition from the source state to the destination state of the arc can fire when:
○ te is specified: opening delay time is passed, te exists at least after the delay time, guard gc evaluates to true.
○ te is omitted: opening delay time is passed, guard gc evaluates to true after the arc is opened.
If more than one transition outgoing from the same state can fire, the one with the highest priority is taken. The transition fires as soon as the above is fulfilled.
• al=<a1,...,an> is a list of actions. Actions are atomic and executed immediately in the same order they are specified. An action may change valuation of attrib-utes or generate an immediate event. Sets of attributes modified by arcs in or-thogonal states has to be disjoined. Generated events are of form ge=name(actual_parameters_list), where name∈IntEVENT.

Dependability an
• de is a list of delayedwhere gei=name(actuand pdfi is a probabilieration of the event gegiven arc.
The opening delay of thewithin a state b1 (like do immediate and delayed evinitiated during passing be
3 Performance Staand Operation
We analyse the same scenarail, as the authors of the checks its integrity and deteof the status message, takesent through the GSM-R merrors, the message can bemission takes the exponen450[ms]. Next, the RBC prtask is 500[ms] long and afule again (with the same errfollowing train waits for ththe long time, the situationbraking procedure is initiatthe exponential random tim
The deadline used for wwhich ensures the safe stostops (or lost its integrity) imreceived previously. The de
d Safety Analysis of ETCS Communication for ERTMS
internal events of the form <<ge1, pdf1>, ..., <gen, pdfn
ual_parameters_list) is a delayed event, name∈IntEVENity distribution function, which determines the time of gei in the future with respect to the time of passing along
e arc α=<b1,a,b2> is introduced to model some activiactions in UML) before its exiting through the arc a. T
vents are introduced to model results of actions, which etween boxes through the arc a.
atechart Model for ETCS Communication
ario of two trains following one of the other on the sapapers [14, 15], see Fig. 1. The first train automatica
ermines its position. This task, together with the prepares the time of 5[s]. Next, the worked up status messag
module to the nearest RBC. Due to the possible transmiss lost with the probability of 1,88%. The successful trantially distributed random time with the mean valueepares the authority message for the succeeding train. Tfter it the prepared message is sent using the GSM-R mror rate and transmission time as in the previous case). The consequent messages. If the message lacks to come n becomes hazardous and due to this fact the emergeted. After the emergency stop the train is immobilized
me with mean value of 15[min] (900[s]).
Fig. 1. Distances used in eq. (4)
waiting for the authority message is calculated as the vaopping of the second train in the case when the first mmediately after sending the message that the second treadline is determined from the following equation, (Fig. = −
41
n>>, ENT, gen-
the
ities The are
ame ally ring e is sion ans-e of This
mod-The for
ency for
alue one rain 1):
(4)