proceedings of the 1 master project symposium on ... · (hirarc) process published by malaysian...
TRANSCRIPT

Editors:Dr. Hayati @ Habibah Abdul Talib
Dr. Fatimah SalimDr. Roslina MohammadDr. Sa’ardin Abdul Aziz
Dr. Siti Armiza Mohd Aris
utmrazakschool.utm.my
Proceedings of the1 Master Project
Symposium on Occupational
Safety & Health
stProceedings of the1 Master Project
Symposium on Occupational
Safety & Health
st
PROCEEDINGS OF THE 1st
MASTER PROJECT SYMPOSIUMON OCCUPATIONAL SAFETY
AND HEALTH
13 – 15th DECEMBER 2016UNIVERSITI TEKNOLOGI MALAYSIA
KUALA LUMPUR
ISBN: 978-967-13383-6-0
ii
Copyright © 2017 by UTM Razak School. All rights reserved.
No part of this publication may be reproduced, distributed, or transmitted in any formor by any means, including photocopying, recording, or other electronic ormechanical methods, without the prior written permission of the publisher, except inthe case of brief quotations embodied in critical reviews and certain other non-commercial uses permitted by copyright law. For permission requests, write to thepublisher, addressed “Attention: Permissions Coordinator,” at the address below.
Published by:UTM Razak School of Engineering and Advanced TechnologyUniversiti Teknologi MalaysiaLevel 7, Razak TowerJalan Sultan Yahya Petra, 54100 Kuala LumpurMALAYSIAhttp://razakschool.utm.my
First Printing, April 2017Printed in Malaysia
iii
Editors:
Dr. Hayati @ Habibah Abdul TalibDr. Fatimah SalimDr. Roslina MohammadDr. Sa’ardin Abdul AzizDr. Siti Armiza Mohd Aris
Associate Editors:
Dr. Habibah @ Norehan Hj. HaronDr. Mohd Nabil MuhtazaruddinDr. Nor Raihana Mohd AliDr. Rahimah MuhamadDr. Samira Albati KamaruddinDr. Shamsul SaripDr. Sharifah Alwiah Syed Abd. RahmanDr. Siti Zura A. Jalil @ Zainuddin

iv
About Master Project Symposium
The 1st Master Project Symposium was held on 13-15 December 2016 for Semester 1Session 2016/2017 at Menara Razak, Universiti Teknologi Malaysia (UTM) KualaLumpur. This symposium is organized every semester by Master Project Committee,UTM Razak School of Engineering and Advanced Technology to fulfil therequirement of Masters of Occupational Safety and Health.
This symposium aims to provide a platform for students to share their researchprocesses and outcomes among UTM Razak School members and at the same timereceive inputs from the audience to improve their research. Students are exposed tovarious Occupational Safety and Health management issues by identifying the currentissues in their workplaces and addressing the issue through their research.
The papers presented in the symposium are compiled into proceedings to share theresearch conducted by the students and findings that related to the current practices ofmany of the industries in Malaysia. An index of keywords from all papers is includedat the end of the proceedings. All participants and readers can enjoy reading theproceedings and gain inspirations for further research and application into educationand practice.

v
Contents
Towards the Development of a Standardized HIRARC Guidelines forRoyal Malaysian Navy Ships’ Galley
Ahmad Amal Abdul Hamid and Nor Mawati Mohd Shariff
1
Physical Disorder among Network Operation Center Workers atTelekom Malaysia in Cyberjaya
Ahmad Hafiz Bin Mustapha1 and Mohd Yusof Bin Md. Daud
8
Risk of Musculoskeletal Disorder for General Durability TestDriver
Ahmad Miski Mohamad Nor and Fatimah Salim
15
Level of Parents’ Awareness on Children’s Safety at Public PlaygroundTaman Tasik Titiwangsa
Ahmad Nasaruddin Ishaudin and Maslin Masrom
24
Evaluation of Musculoskeletal Disorders among Computer UsersAhmad Salihin Arshada and Nor Fazilah Mohd Hashim
33
Sharp Injury Awareness among Cleaners at Tuanku Mizan MilitaryHospital
Ajit Pall Singh and Shreeshivadasan Chelliapana
41
Health Impact of Long Hours Driving on MINDEF DriversAudry Ramadass, Siti Zura A. Jalil and Nelidya Md Yusoff
49
Prevalence of Computer Visual Syndrome among Employee inMalaysian Software Testing Board
Farah Bazilah Baidilleh and Shamsul Sarip
56
Occupational Safety Training Framework for Illiterate MigrantWorking at Construction Site
Felicia Motiboi and Morina Abdullah
63
Radiation Safety Awareness among Workers in Battery ManufacturerCompany
Khairul Nizam Ali and Siti Zura A.Jalil
73
Immediate Effects of Outdoor Military Firing ExerciseKritharan A/L Suprniom and Norazmein Abdul Raman
80
Long Evacuation Time during Fire Drill among Workers at MenaraTM
Marziyana Abu Bakar, Nelidya Md. Yusoff and Siti Zura A. Jalil
84
Penilaian Mengenai Isu Beg Sekolah Berat Dalam Kalangan GuruMohd Faisal Jamaludin dan Saárdin Abdul Aziz
91
Occupational Stress Effect On Job Satisfaction in Department ofOrthopaedic and Traumatology, Hospital Kuala Lumpur
Mohd Zahid Ismail, Raihana Mohd Ali, Mohd Nabil Muhtazaruddinand Khairullina Khalid
101
vi
Musculoskeletal Disorders Concerns in Workers Handling DrinkingWater Dispensers at the Fabrication Yard
Sharmeela Maira Khairul, Hazilah Mad Kaidi and Norliza Mohd Noor
110
Safety Awareness during Energy Audit at Main Switchboard RoomSiti Maisarah Haron, Nurul Aini Bani, and Siti Armiza Mohd Aris
119
Occupational Stress on Military Personnel in Boat Squadron,Semporna Sabah
Mohd Erry Dul and Mohd Azlan Suhot
129
Risk of Insecticides Exposure on Foggers in Jabatan Kesihatan NegeriKedah
Mohd Faiz Itam, Astuty Amrin and Roslina Mohammad
135
Falls from Vehicle Associated with Slip and Trip Hazards at the FuelDistribution Terminal
Muhammad Akmal Hanzah and Samira Albati Kamaruddin
141
Perception of Wearing Hearing Protection Device among MaintenancePersonnel in MiG-29 Jet Fighter Fleet
Muhammad Syafiq Fikry Rosley and Kamilah Radin Salim
148
Occupational Safety Awareness among Science Centre EmployeesNur Fakhrin Nordin and Nor Mawati Mohd Shariff
156
Community Preparedness and Response towards Disaster in IskandarPuteri Johor
Mohd Zainoor Annuar Mohd Zain and Sallehuddin Muhamad
166
Occupational Stress Management among SU-30MKM MaintenancePersonnel in Gong Kedak Air Base
Mohd Zulfadli Mahdi and Khairur Rijal Jamaludin
173
Factors Influencing Sharp Injury Reporting Among HealthcareWorkers in Hospital Melaka
Nur Farhana Hamzah and Nik Hasnaa Nik Mahmood
185
Work-Related Low Back Pain among Maintenance Technician ofFighter Jet
Nur Izzaidah Ghazali and Roslina Mohammad
196
The Influences of Safety Behaviour and Safety Practice at Klang ValleyConstruction Site
Raudhah Bt Haji Bahrin and Hayati Habibah Abdul Talib
208
Index 214
Proceedings of the 1st Master Project Symposium on Occupational Safety and Health13-15th December 2016
1
Towards the Development of a StandardizedHIRARC Guidelines for Royal Malaysian
Navy Ships’ GalleyAhmad Amal Abdul Hamid*a and Nor Mawati Mohd Shariffb
UTM Razak School of Engineering and Advanced Technology, Universiti TeknologiMalaysia, 54100 Jalan Sultan Yahya Petra, Kuala Lumpur, Malaysia
*[email protected], [email protected]
Abstract – This study addressed the issue of accidents and injuries among the Cooksworking in the Royal Malaysian Navy (RMN) ships’ galley. Now, there are no standardguidelines published by RMN management in terms of Occupational Safety and Health(OSH) for that specific compartment. Cooking in the galley aboard a ship is differentcompared to in a normal land-based kitchen in terms of workplace environment and natureof work. This is because RMN ships’ galleys are sway platform, often small with limitedaccess and operate 24/7. This result in accidents and injuries related to OSH aspect in theship’s galley occurring regularly. Over the period of 2010 – 2015, a total number of 61accident and injury cases were recorded during food preparation among Navy Cooks. Hencethis study undertook to identify the possible hazards and associated risks pertaining tocooking activities by conducting Hazard Identification, Risk Assessment and Risk Control(HIRARC) process published by Malaysian Department of Safety and Health (DOSH). Itsought to investigate the trends of most common accidents and injuries in the galleyincluding scald and burn, body part pain, slips, trips and fall, cuts and stabs, foodpoisoning, fire and smoke suffocation. By conducting proper HIRARC, key hazards wereidentified and their associated risks were assessed so that appropriate risk control can bedetermined to manage risks accordingly. It is anticipated that the findings of this study willprovide invaluable information to recommend and develop a standard HIRARC Guidelinesthat can be practically and effectively used for every squadron of RMN ships’ galley. NavyCooks are also expected to directly benefit as a more comprehensive safety precautionaboard will improve their safety and produce a conducive work environment in the galley.
Keywords: Royal Malaysian Navy, OSH, Galley, HIRARC
1.0 INTRODUCTION
A ‘galley’ is a naval term referring to a specific compartment on board ship which isused for cooking and preparing food daily. Therefore, a galley is a kitchen, whichis designed in compact and typical style with longitudinal units and overheadcabinets to make the best use of limited space on board ships. Galleys are also
Proceedings of the 1st Master Project Symposium on Occupational Safety and Health13-15th December 2016
2
designed to cater for the rolling and heaving (sway) nature of the ship, making themmore resistant to the movement effects of the ship. It can be considered as one of themost hazardous workplace aboard, after the engine room and ammunition store.Hazard in a galley can come from many sources such as workplace environment,energy, manual handling, biological and chemical factors.
Cooking activity aboard a floating vessel is different compared to in a normal land-based kitchen. This is because ships are unstable moving platform, and everyactivity is affected by the motion of the ship. There are many concerns on thepotential of occupational hazards that arise in the galley such as pots and panssliding on the stove and counter, and items that slip and fall causing bruising andinjuries. Workers lifting unstable loads are at greater risk of back injury comparedto workers lifting stable loads [1]. Occupational health is influenced byindividuals, tasks, and other people in the workplace [2].
According to Jeong [3], accidents during food preparation are caused mainly bymachine and tools (86.7%), and most victims were injured in the forms of gettingcaught in and between objects (45.7%) or with cuts, amputations and punctures(43.9%). Furthermore, cooking utensils and caldron are behind 55.4% of theaccidents and 73.3% of the accidents during heated cooking processes revealedproblems with abnormal temperature. Also, accidents during handling or storingingredients and serving are most commonly in the forms of slips and falls.Furthermore, scalds and burns are also common injuries that happen in the galley.Burns are defined as tissue reaction to injury due to heat, chemicals, or radiation andare commonly encountered in forensic practice [4].
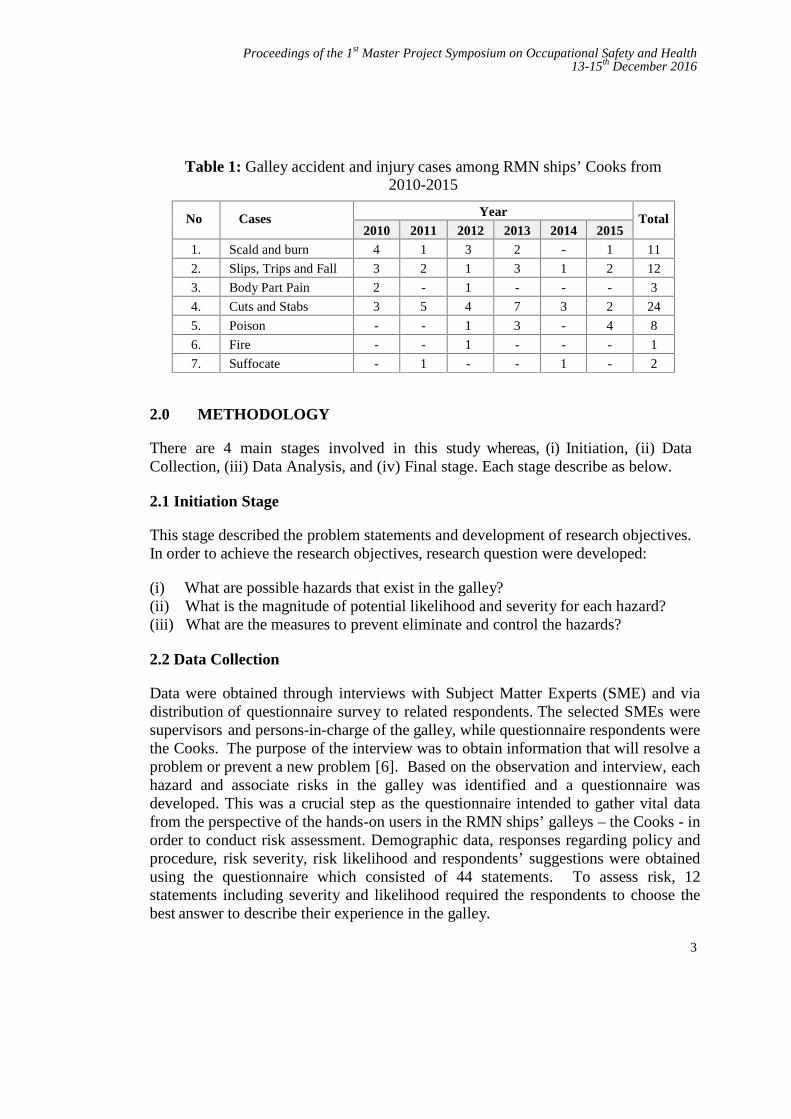
Currently, there is no standard guideline that practised in the RMN ships’ galley.This is probably due to the fact that the Malaysian Armed Forces (including theRoyal Malaysian Navy) is excluded from the OSHA 1994 (Act 514). However,throughout the years of 2010-2015, many accidents and injuries related to OSHaspects have been reported in RMN ships’ galley. An accident is an unplannedevent that causes some kind of harm [5]. The accidents statistics are shown in theTable 1 below:
Hence, every RMN ship’s galley should have an applicable references related to theOSH requirement. This researcher believes that it can be fulfilled by developing astandard guideline that may be applied and practised by the Navy Cooks in thegalley. In order to develop the guidelines, there must be a proper approach for theprocess by conducting Hazard Identification, Risk Assessment and Risk Control(HIRARC) process. With HIRARC, one will be able to identify possible hazardsassociated to cooking activities in the galley, analyze and assess their associated risksand apply suitable control measures.
Proceedings of the 1st Master Project Symposium on Occupational Safety and Health13-15th December 2016
3
Table 1: Galley accident and injury cases among RMN ships’ Cooks from2010-2015
No Cases Year Total2010 2011 2012 2013 2014 2015
1. Scald and burn 4 1 3 2 - 1 11
2. Slips, Trips and Fall 3 2 1 3 1 2 12
3. Body Part Pain 2 - 1 - - - 3
4. Cuts and Stabs 3 5 4 7 3 2 24
5. Poison - - 1 3 - 4 8
6. Fire - - 1 - - - 1
7. Suffocate - 1 - - 1 - 2
2.0 METHODOLOGY
There are 4 main stages involved in this study whereas, (i) Initiation, (ii) DataCollection, (iii) Data Analysis, and (iv) Final stage. Each stage describe as below.
2.1 Initiation Stage
This stage described the problem statements and development of research objectives.In order to achieve the research objectives, research question were developed:
(i) What are possible hazards that exist in the galley?(ii) What is the magnitude of potential likelihood and severity for each hazard?(iii) What are the measures to prevent eliminate and control the hazards?
2.2 Data Collection
Data were obtained through interviews with Subject Matter Experts (SME) and viadistribution of questionnaire survey to related respondents. The selected SMEs weresupervisors and persons-in-charge of the galley, while questionnaire respondents werethe Cooks. The purpose of the interview was to obtain information that will resolve aproblem or prevent a new problem [6]. Based on the observation and interview, eachhazard and associate risks in the galley was identified and a questionnaire wasdeveloped. This was a crucial step as the questionnaire intended to gather vital datafrom the perspective of the hands-on users in the RMN ships’ galleys – the Cooks - inorder to conduct risk assessment. Demographic data, responses regarding policy andprocedure, risk severity, risk likelihood and respondents’ suggestions were obtainedusing the questionnaire which consisted of 44 statements. To assess risk, 12statements including severity and likelihood required the respondents to choose thebest answer to describe their experience in the galley.
Proceedings of the 1st Master Project Symposium on Occupational Safety and Health13-15th December 2016
4
2.3 Data Analysis
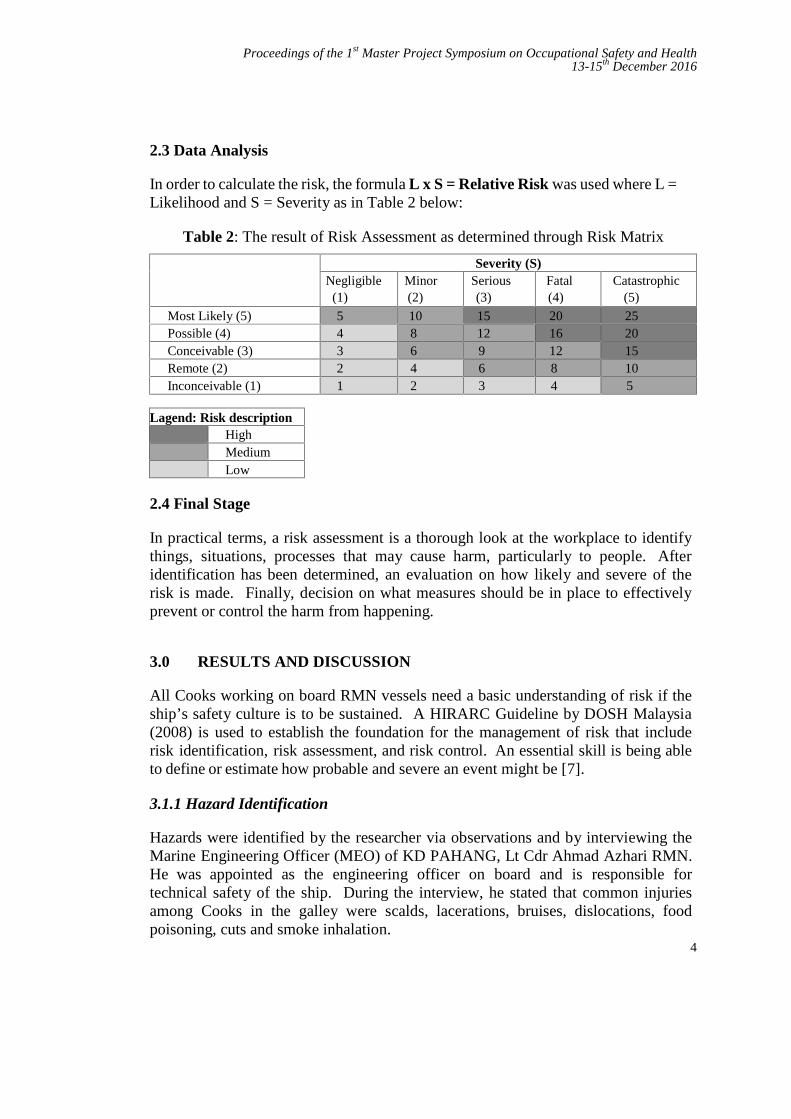
In order to calculate the risk, the formula L x S = Relative Risk was used where L =Likelihood and S = Severity as in Table 2 below:
Table 2: The result of Risk Assessment as determined through Risk Matrix
Likelihood (L)Severity (S)
Negligible(1)
Minor(2)
Serious(3)
Fatal(4)
Catastrophic(5)
Most Likely (5) 5 10 15 20 25Possible (4) 4 8 12 16 20Conceivable (3) 3 6 9 12 15Remote (2) 2 4 6 8 10Inconceivable (1) 1 2 3 4 5
Lagend: Risk descriptionHighMediumLow
2.4 Final Stage
In practical terms, a risk assessment is a thorough look at the workplace to identifythings, situations, processes that may cause harm, particularly to people. Afteridentification has been determined, an evaluation on how likely and severe of therisk is made. Finally, decision on what measures should be in place to effectivelyprevent or control the harm from happening.
3.0 RESULTS AND DISCUSSION
All Cooks working on board RMN vessels need a basic understanding of risk if theship’s safety culture is to be sustained. A HIRARC Guideline by DOSH Malaysia(2008) is used to establish the foundation for the management of risk that includerisk identification, risk assessment, and risk control. An essential skill is being ableto define or estimate how probable and severe an event might be [7].
3.1.1 Hazard Identification
Hazards were identified by the researcher via observations and by interviewing theMarine Engineering Officer (MEO) of KD PAHANG, Lt Cdr Ahmad Azhari RMN.He was appointed as the engineering officer on board and is responsible fortechnical safety of the ship. During the interview, he stated that common injuriesamong Cooks in the galley were scalds, lacerations, bruises, dislocations, foodpoisoning, cuts and smoke inhalation.
Proceedings of the 1st Master Project Symposium on Occupational Safety and Health13-15th December 2016
5
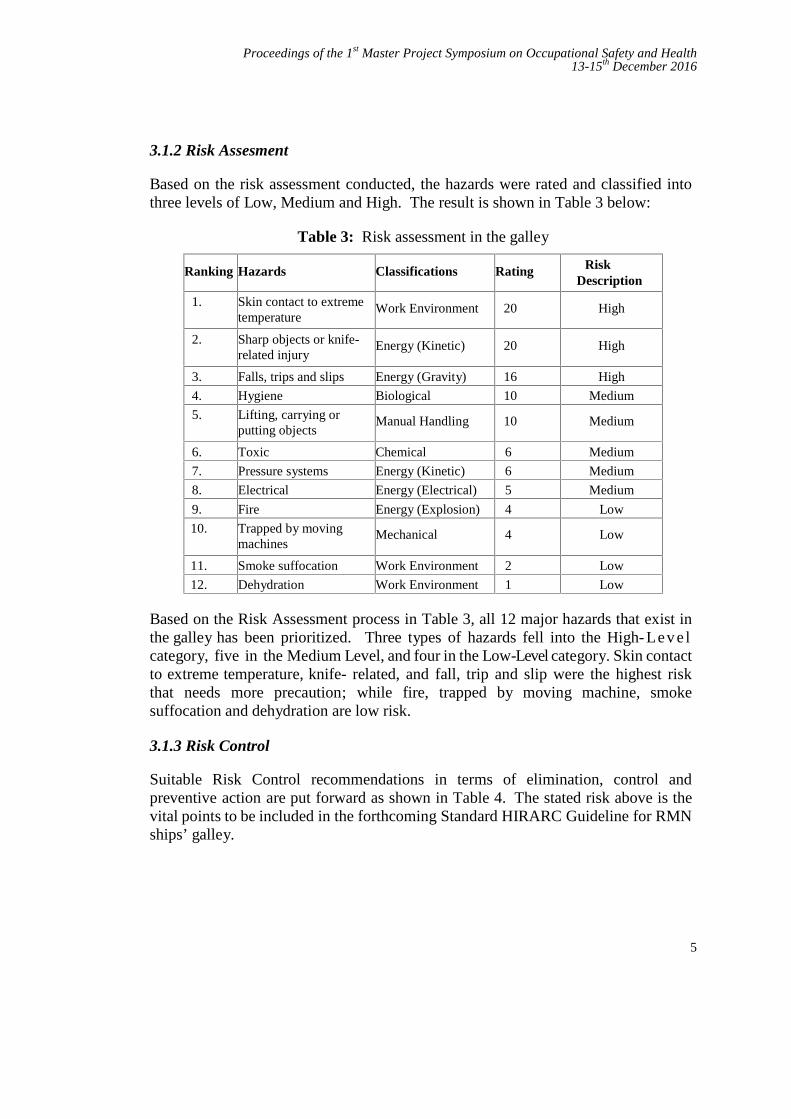
3.1.2 Risk Assesment
Based on the risk assessment conducted, the hazards were rated and classified intothree levels of Low, Medium and High. The result is shown in Table 3 below:
Table 3: Risk assessment in the galley
Ranking Hazards Classifications Rating RiskDescription
1. Skin contact to extremetemperature
Work Environment 20 High
2. Sharp objects or knife-related injury
Energy (Kinetic) 20 High
3. Falls, trips and slips Energy (Gravity) 16 High
4. Hygiene Biological 10 Medium
5. Lifting, carrying orputting objects
Manual Handling 10 Medium
6. Toxic Chemical 6 Medium
7. Pressure systems Energy (Kinetic) 6 Medium
8. Electrical Energy (Electrical) 5 Medium
9. Fire Energy (Explosion) 4 Low
10. Trapped by movingmachines
Mechanical 4 Low
11. Smoke suffocation Work Environment 2 Low
12. Dehydration Work Environment 1 Low
Based on the Risk Assessment process in Table 3, all 12 major hazards that exist inthe galley has been prioritized. Three types of hazards fell into the High- Lev e lcategory, five in the Medium Level, and four in the Low-Level category. Skin contactto extreme temperature, knife- related, and fall, trip and slip were the highest riskthat needs more precaution; while fire, trapped by moving machine, smokesuffocation and dehydration are low risk.
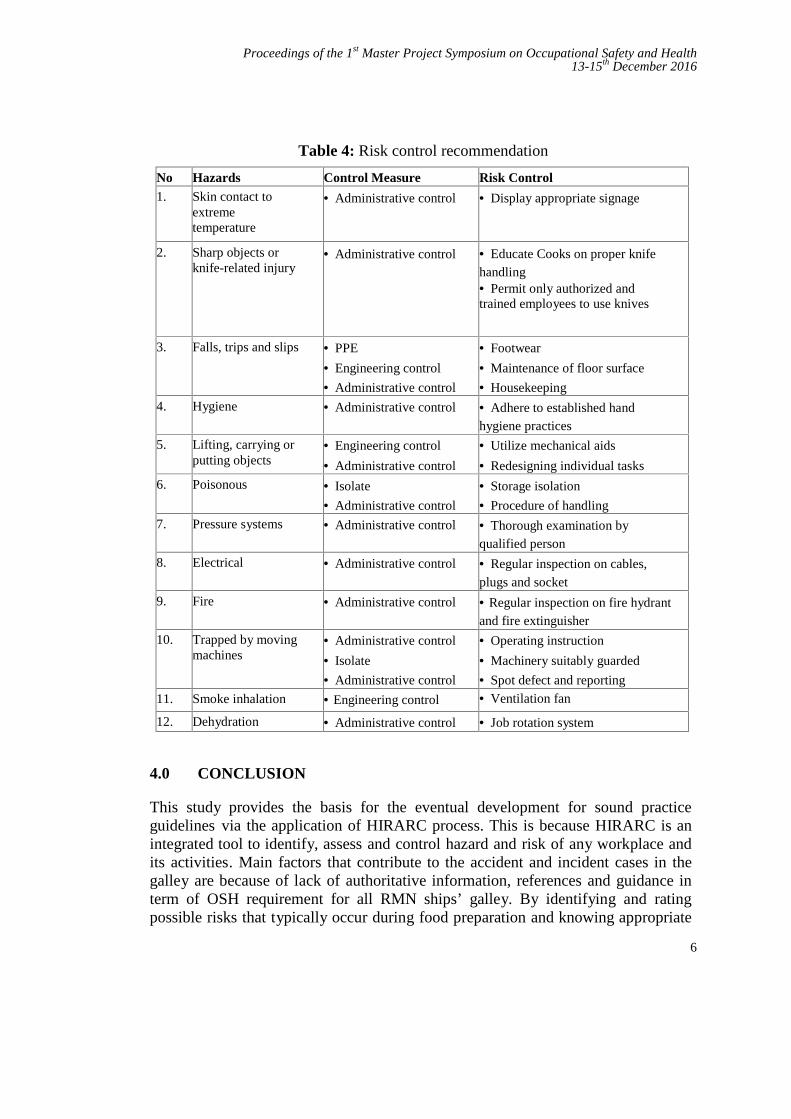
3.1.3 Risk Control
Suitable Risk Control recommendations in terms of elimination, control andpreventive action are put forward as shown in Table 4. The stated risk above is thevital points to be included in the forthcoming Standard HIRARC Guideline for RMNships’ galley.
Proceedings of the 1st Master Project Symposium on Occupational Safety and Health13-15th December 2016
6
Table 4: Risk control recommendation
No Hazards Control Measure Risk Control1. Skin contact to
extremetemperature
Administrative control Display appropriate signage
2. Sharp objects orknife-related injury
Administrative control Educate Cooks on proper knifehandling Permit only authorized andtrained employees to use knives
3. Falls, trips and slips PPE
Engineering control
Administrative control
Footwear
Maintenance of floor surface
Housekeeping
4. Hygiene Administrative control Adhere to established handhygiene practices
5. Lifting, carrying orputting objects
Engineering control
Administrative control
Utilize mechanical aids
Redesigning individual tasks
6. Poisonous Isolate
Administrative control
Storage isolation
Procedure of handling
7. Pressure systems Administrative control Thorough examination byqualified person
8. Electrical Administrative control Regular inspection on cables,plugs and socket
9. Fire Administrative control Regular inspection on fire hydrantand fire extinguisher
10. Trapped by movingmachines
Administrative control
Isolate
Administrative control
Operating instruction
Machinery suitably guarded
Spot defect and reporting
11. Smoke inhalation Engineering control Ventilation fan
12. Dehydration Administrative control Job rotation system
4.0 CONCLUSION
This study provides the basis for the eventual development for sound practiceguidelines via the application of HIRARC process. This is because HIRARC is anintegrated tool to identify, assess and control hazard and risk of any workplace andits activities. Main factors that contribute to the accident and incident cases in thegalley are because of lack of authoritative information, references and guidance interm of OSH requirement for all RMN ships’ galley. By identifying and ratingpossible risks that typically occur during food preparation and knowing appropriate
Proceedings of the 1st Master Project Symposium on Occupational Safety and Health13-15th December 2016
7
risk control, a proper standardized guideline can be developed accordingly for use inthe galley.
Related with this, it seems that HIRARC process is the best risk management practicefor RMN to adopt. By applying HIRARC to the context of RMN, particularly toRMN ships’ galley, it is possible to put in place measures that will improve onconcerns relating to OSH. It is anticipated that the stated risks identified will be thevital points to be included into the Standard HIRARC Guideline for ships’ galley thatthis researcher thinks the RMN should have. Its strict implementation may help toreduce and even eliminate the possibility for accidents occurring during foodpreparation on board RMN ships.
Hence, it is timely that RMN management considers upgrading the existing SOP(Standard Operating Procedure) it is currently using by introducing HIRARCprocess, and eventually developing a Standard HIRARC Guidelines for RMN ships’galley.
REFERENCES
[1] Pinto, V.J., et al. “Assessment of engineering controls designed for handlingunstable loads: An electromyography assessment”. International Journal ofIndustrial Ergonomics, 2013. 43(2): p. 181-186.
[2] Brown, L.W. and J.C. Quick Workplace Health, in Encyclopedia ofMental Health (Second Edition), H.S. Friedman, Editor. 2016, AcademicPress: Oxford. p. 387-394.
[3] Jeong, B.Y. “Cooking processes and occupational accidents in commercialrestaurant Kitchens”. Safety Science, 2015. 80: p. 87-93.
[4] Ong, B.B. and N. Milne. Injury, Fatal and Nonfatal: Burns and Scalds, inEncyclopedia of Forensic and Legal Medicine (Second Edition), J. Payne-James and R.W. Byard, Editors. 2016, Elsevier: Oxford. p. 173-181.
[5] Schudel, D., J.E. McLaughlin, and C.M. Selavka, HEALTH AND SAFETYIncluding Risk Assessment A2 - Siegel, Jay A, in Encyclopedia of ForensicSciences. 2000, Elsevier: Oxford. p. 1041-1048.
[6] Baker, B.D. and B.P. Gilbride, 32 - Interviewing, in SecuritySupervision and Management (Fourth Edition). 2015, Butterworth-Heinemann. p. 411-423.
[7] Crutchfield, N. and J. Roughton, Chapter 10 - Risk Management Principles,in Safety Culture. 2014, Butterworth-Heinemann: Oxford. p. 199-212.
Proceedings of the 1st Master Project Symposium on Occupational Safety and Health13-15th December 2016
8
Physical Disorder among Network OperationCenter Workers at Telekom Malaysia in
Cyberjaya
Ahmad Hafiz Bin Mustapha1,a and Mohd Yusof Bin Md. Daud2,b
1Telekom Malaysia Berhad, Cyberjaya TMIT Complex, 63000 Selangor, Malaysia2UTM Razak School of Engineering and Advanced Technology, Universiti
Teknologi Malaysia, 54100 Jalan Sutan Yahya Petra, Kuala Lumpur, Malaysiaaa_afizm @yahoo.com, [email protected]
Abstract - Physical Disorder have been common complaints among workers involved instatic work or tasks requiring the repetitive motion of the upper limbs and prolongedcomputer work. Call Center working environment workers are the one group which mayimpact on chronic physical disorder problems. Therefore, the aim of this study was to assessphysical disorder risk in work environment among Network Operation Center (NOC)workers. This was a survey study conducted among 50 workers and ROSA assessment among44 workers in NOC Telekom Malaysia, Cyberjaya. NOC workers who had experience jobsmore than 1 year, working time at 8 hours to 12 hours per days. Data were collected byusing following methods which are observation, questionnaire and Rapid Office StrainAssessment (ROSA) which measured the sitting posture, workstation (chair height, pandepth, armrests, and back support), computer (monitor, mouse and keyboard), telephone andduration of spending time for each posture or activity. From ROSA, there were 4 levels ofergonomics risk classification (low, medium, high, very high). The results of this studyshowed that the NOC workers at 2 level of risk (high and very high). This study was done todetermine the prevalence of physical disorder and associated factors among NOC workers.
Keywords: Physical Disorder, Call Center, Work Environment, Network Operation Center (NOC),ROSA
1.0 INTRODUCTION
Network Operation Centre known as NOC is responsible for maintaining networkelements, systems and security which all network services and products rides on.NOC is not only responsible of the network elements but also all the services andsystems that are interconnects. NOC play the crucial role to perform technicalanalysis of system issues and outages as they occur across customer enterprisenetworks. This individual then performs research to troubleshoot and resolve theissue or depending upon complexity escalates the issue to higher level systemsadministrators and network engineers. The NOC workers must be able to prioritize
Proceedings of the 1st Master Project Symposium on Occupational Safety and Health13-15th December 2016
9
remediation of issues in 24 x 7 environments with curial uptime requirement.Located in Cyberjaya Selangor, NOC is operate for 24 hours daily with 150employees and divided into group with 50 employees for every shift. The workingenvironment similar as call centre which the daily routine interfacing with computerand telephone whilst simultaneously using display screen equipment. In the variouspositions, associated employees are required to spend a large amount of timeinterfacing with computers, as well as on the telephone whilst simultaneously usingdisplay screen equipment, while seated at their table. Some of the more commonoffice related physical disorders are Shoulder, Neck, Carpal Tunnel Syndrome, tenniselbow and lower back strain. Such disorders are often aggravated further with theoffice desk and chair set-up and design. The discipline of ergonomics is designed toaddress, and hopefully mitigate such issues by examining the relationship betweenhumans and their work.
2.0 METHODOLOGY
A. Study Design: Cross sectional design was adopted to study the prevalence ofPhysical Disorder among the Network Operation Center (NOC) workers inCyberjaya which working in call center environment.
B. Subjects: The NOC Workers (N=50) working at Telekom Malaysia located inIDC Complex of Cyberjaya formed the population of this study.
C. Inclusion Criteria: The criterion for including the samples in to this studyincludes: Age (20-55 years), duration of working hours (8 to 12 hours daily),working experience (1 to 32 years) and those who are willing to participate in thestudy.
D. Methodology: A Questionnaire was designed by keeping in view of the nature ofcall center work environment and its work-related potential to get physical disorderproblems. With respect to the Musculoskeletal Health Problems, only the primarymusculoskeletal complaints of the subjects were taken into consideration for thepurpose to this study. Questionnaires were distributed to 50 participants and ROSAassessment done for 44 participants. All the data was analyzed with SPSS softwarever. 22 using appropriate statistical tests. P-value of less than 0.05 was taken assignificant.
3.0 RESULTS AND DISCUSSION
Demographic for this study shows 50 NOC workers were male 62% and female 38%were between the ages of 25-52 years old. All NOC workers had work experience
Proceedings of the 1st Master Project Symposium on Occupational Safety and Health13-15th December 2016
10
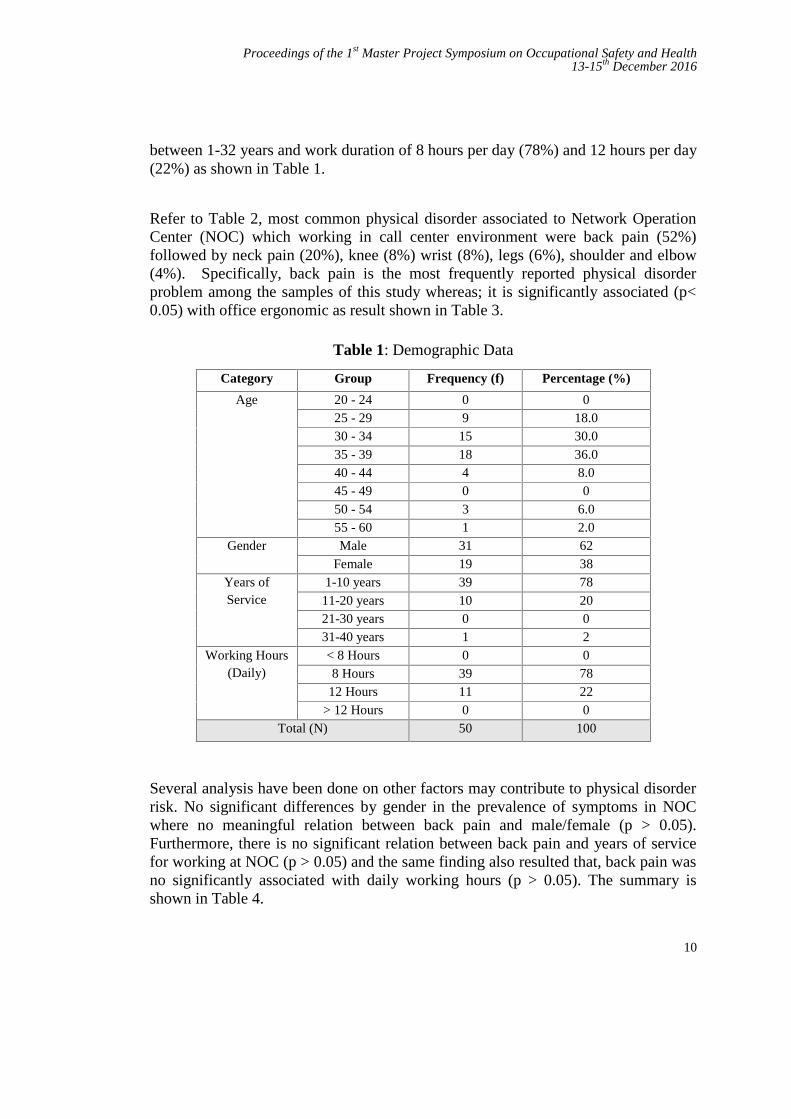
between 1-32 years and work duration of 8 hours per day (78%) and 12 hours per day(22%) as shown in Table 1.
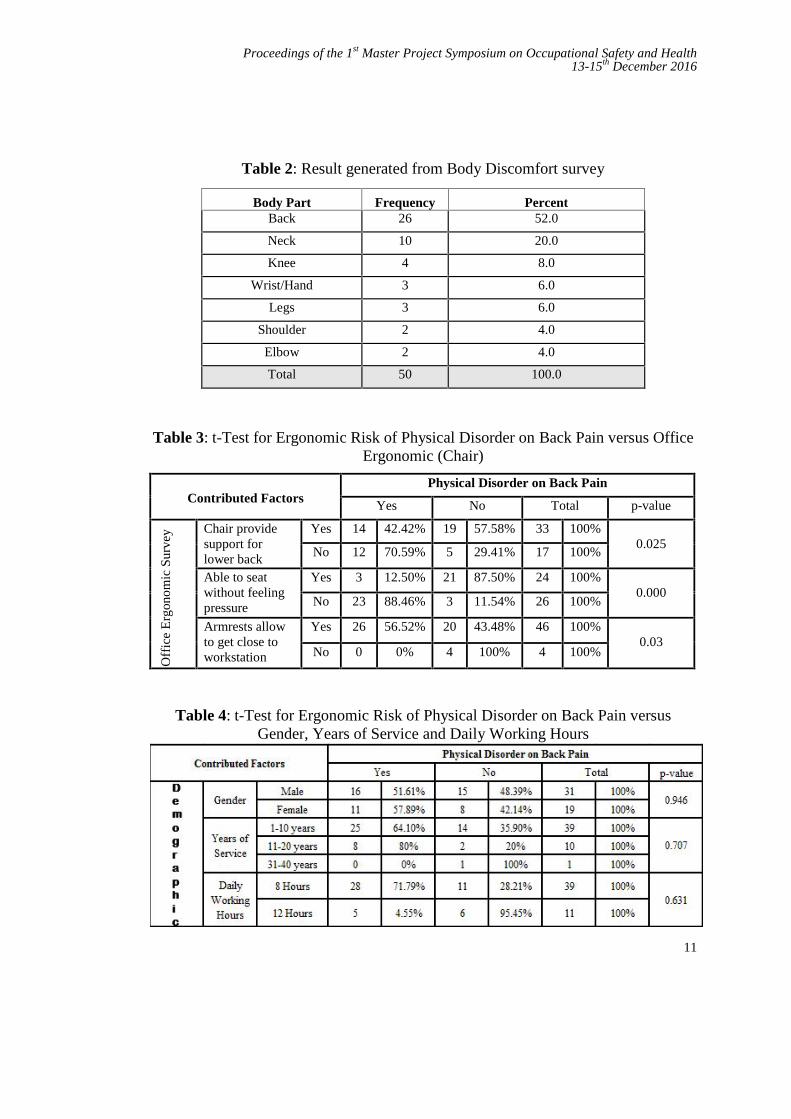
Refer to Table 2, most common physical disorder associated to Network OperationCenter (NOC) which working in call center environment were back pain (52%)followed by neck pain (20%), knee (8%) wrist (8%), legs (6%), shoulder and elbow(4%). Specifically, back pain is the most frequently reported physical disorderproblem among the samples of this study whereas; it is significantly associated (p<0.05) with office ergonomic as result shown in Table 3.
Table 1: Demographic Data
Category Group Frequency (f) Percentage (%)
Age 20 - 24 0 025 - 29 9 18.030 - 34 15 30.035 - 39 18 36.040 - 44 4 8.045 - 49 0 050 - 54 3 6.055 - 60 1 2.0
Gender Male 31 62Female 19 38
Years ofService
1-10 years 39 7811-20 years 10 2021-30 years 0 031-40 years 1 2
Working Hours(Daily)
< 8 Hours 0 08 Hours 39 78
12 Hours 11 22> 12 Hours 0 0
Total (N) 50 100
Several analysis have been done on other factors may contribute to physical disorderrisk. No significant differences by gender in the prevalence of symptoms in NOCwhere no meaningful relation between back pain and male/female (p > 0.05).Furthermore, there is no significant relation between back pain and years of servicefor working at NOC (p > 0.05) and the same finding also resulted that, back pain wasno significantly associated with daily working hours (p > 0.05). The summary isshown in Table 4.
Proceedings of the 1st Master Project Symposium on Occupational Safety and Health13-15th December 2016
11
Table 2: Result generated from Body Discomfort survey
Body Part Frequency PercentBack 26 52.0
Neck 10 20.0
Knee 4 8.0
Wrist/Hand 3 6.0
Legs 3 6.0
Shoulder 2 4.0
Elbow 2 4.0
Total 50 100.0
Table 3: t-Test for Ergonomic Risk of Physical Disorder on Back Pain versus OfficeErgonomic (Chair)
Contributed FactorsPhysical Disorder on Back Pain
Yes No Total p-value
Off
ice
Erg
onom
ic S
urve
y Chair providesupport forlower back
Yes 14 42.42% 19 57.58% 33 100%0.025
No 12 70.59% 5 29.41% 17 100%
Able to seatwithout feelingpressure
Yes 3 12.50% 21 87.50% 24 100%0.000
No 23 88.46% 3 11.54% 26 100%
Armrests allowto get close toworkstation
Yes 26 56.52% 20 43.48% 46 100%0.03
No 0 0% 4 100% 4 100%
Table 4: t-Test for Ergonomic Risk of Physical Disorder on Back Pain versusGender, Years of Service and Daily Working Hours
Proceedings of the 1st Master Project Symposium on Occupational Safety and Health13-15th December 2016
12
4.0 CONCLUSION
This study aimed to evaluate the presence of risk factors for physical disorder in anoffice of Network Operation Center (NOC) in Telekom Malaysia Cyberjaya usingthe questionnaire and Rapid Assessment Office Strain method (ROSA). Analysisfrom the questionnaire by using SPSS, the significant factor associated with backpain risk were office ergonomic furniture on chair provide lower back support, ableto seat without feeling pressure and armrest allows to get close to workstation.Finding from ROSA, this study showed that most of the NOC workers were exposedto a high ergonomics risk. For prevention of physical disorders risk, there should beergonomics training for workers to be aware of ergonomics factors in the officeworkplace.
The training must be provided by the management. Besides that, the design of theworkstations should be improved based on the ergonomics principles since the mainfactors contributed to physical disorder risk is on office ergonomic furnitureespecially chairs. Finally, to expose employees on the importance of take short breakand simple exercise while working at workstation.
ACKNOWLEDGEMENTS
The authors would like to express the greatest appreciation and utmost gratitude toTelekom Malaysia Cyberjaya, UTM Razak School of Engineering & AdvancedTechnology and Universiti Teknologi Malaysia (UTM) for all support given inmaking the study a success.
REFERENCES
[1] ANSI Z-365. “Control of work-related cumulative trauma disorders: part 1upper extremities”- working draft, New York, NY, ANSI, 1994.
[2] Bhuyar P, Banerjee A, Pandve H, Patil A, Rajan S, Chaudhury S. Mental,physical and social health problems of call centre workers. Ind PsychiatryJ. 2008;17:21–5.
[3] ANSI Z-365. Control of work-related cumulative trauma disorders: part 1upper extremities- working draft, New York, NY, ANSI, 1994.
[4] Bhuyar P, Banerjee A, Pandve H, Patil A, Rajan S, Chaudhury S. Mental,physical and social health problems of call centre workers. Ind PsychiatryJ. 2008;17:21–5.
[5] Carpal Tunnel Syndrome Fact Sheet. Retrieved April 2011, from NationalInstitute of Neurological Disorders and Stroke:http://www.ninds.nih.gov/disorders/ carpal_tunnel/detail_carpal_tunnel.htm

Proceedings of the 1st Master Project Symposium on Occupational Safety and Health13-15th December 2016
13
[6] Chaffin, D.B. and Park, K.S. “A longitudinal study of low back pain asassociated with occupational lifting factors.” American Industrial HygieneAssociation Journal. 34: 513-525, 1973.
[7] Hannif, Z., & Lamm, F. Precarious Employment in the New Zealand CallCentre Industry. Labour, Employment and Work in New Zealand, 2004. 14.
[8] Hannif, Z., & Lamm, F.Occupation Health and Safety in the NewZealand Call Centre Industry ESC Working Paper No 2005/8 Retrieved 3rdMarch, 2006, Hignett S, McAtamney L. Rapid Entire Body Assessment(REBA). 2005
[9] Hoekstra E, Hurell J, Swanson N Evaluation of work-related musculoskeletaldisorders andjob stress among teleservice centre representatives. AppliedOccupational and Environmental Hygiene. 1995 10: 812-817.
[10] Hoekstra E, Hurell J, Swanson N. Evaluation of work-related musculoskeletaldisorders and ob stress among teleservice centre representatives. AppliedOccupational and Environmental, 1995
[11] Isabelle Imbard, Dominique Ardiet, Alain Bergeret. Working conditions incall-centers, the impact on employee health: a transversal study. Part II;International Achieves Occupational Environmental Health; 2009, 82:pp747–756.
[12] Kumar S. Theories of musculoskeletal injury causation. Ergonomics 4: 17–47. 2004
[13] Hygiene 10: 812-817.Khalil, T.M., Abdel-Moty, E.M., Rosomoff, R.S., &Rosomoff, H.L. Ergonomics in Back Pain: A guide to prevention andrehabilitation. New York, NY.: Van Nostrand Reinhold. 1993.
[14] Leino P & Magni G. Depressive and distress symptoms as predictors of lowback pain, neck shoulder pain and other musculoskeletal morbidity: A 10-year follow- up of metal industry employees. Pain, 1993, 53 (1): 89-94.
[15] McAtamney L, Corlett EN. RULA: a survey method for the investigation ofwork- related upper limb disorders.
[16] Montante, J. Cumulative Trauma Disorders. National Safety News, March,46.1994.
[17] Putz-Anderson, V. Cumulative Trauma Disorders: A Manual forMusculoskeletal Diseases of the Upper Limbs. Bristol, PA.: Taylor andFrancis Inc. 1988.
[18] Sprigg, Christine A., Phoebe R. Smith, and Paul R. Jackson. PsychosocialRisk Factorsin Call Centres: an Evaluation of Work Design and Well-being.2003.
[19] Smith MJ & Bayehi AD “Do ergonomic improvements increase computerworkers’ productivity? An intervention study in a call center” Ergonomics46(1-3), pp3-18. 2003.
[20] SPSS Base System User’s Guide SPSS Inc, Chicago, Illinois. 1990[21] Suri S, Rizvi S. Mental health and stress among call center employees. J
Indian Acad Appl Psychol.2008;34:215–20.

Proceedings of the 1st Master Project Symposium on Occupational Safety and Health13-15th December 2016
14
[22] Sudhashree VP, Rohit K, Shrinivas K. Issues and concerns of health amongcall centre employees. Int J Occup Environ Med. 2005;9:129–32.
[23] Tayyari, F., Smith, J. L. Occupational Ergonomics. New York, NY.:Chapman & Hall. 1997.
[24] Taylor P, Bain P. An assembly line in the head: Work and employee relationsin the call centre. Ind Relat J. 1999; 30:101–17.
Proceedings of the 1st Master Project Symposium on Occupational Safety and Health13-15th December 2016
15
Risk of Musculoskeletal Disorder for GeneralDurability Test Driver
Ahmad Miski Mohamad Nora and Fatimah Salimb
UTM Razak School of Engineering and Advanced Technology, UniversitiTeknologi Malaysia, 54100 Jalan Sultan Yahya Petra, Kuala Lumpur, Malaysia
[email protected], [email protected]
Abstract – Prevalence of Musculoskeletal Disorder (MSD) is common among occupationaldriver, including General Durability (GD) test drivers. The most common MSD problem foroccupational drivers is on low back and upper extremity such as neck and shoulder. InPROTON, there were severe MSD recorded among GD test drivers. There were also verbalcomplaints on minor MSD among GD test drivers. Therefore, the risk of MSD among GDtest drivers must be evaluated and methods to control the risk should be identified. This studyimplemented Hazard Identification, Risk Assessment and Risk Control (HIRARC) process inaddressing the issue. Hazards that could contribute MSD to GD test drivers were identifiedusing qualitative and quantitative methods. There were four main hazards which are wholebody vibration, long hour driving, seat feel and support and strenuous work. The dominantfactor for the prevalence of MS is whole body vibration with 14 GD test drivers (82.4%)relate whole body vibration with MSD that they had. Risk assessment had been done for seatfeel and support criteria. It is measured by using Body Pressure Measurement and NordicMusculoskeletal Questionnaire. Risk control methods had been constructed for all four typesof hazards that were identified by using Hierarchy of Risk Control. Among the listed controlmeasures, administrative control methods do seem as viable options due to cost effective, noconflict on design and test requirement and easy to deliver.
Keywords: Musculoskeletal Disorder, Body Pressure Measurement, Nordic MusculoskeletalQuestionnaire, Hazard Identification, Risk Assessment, Risk Control, Automotive Seat
1.0 INTRODUCTION
Occupational driver is a person employed or self-employed person which requiresthe employee to drive a vehicle as part of his work such as forklifts, car, truck, bus,race car or etc. [1]. Occupational driving is known to be a high-risk activity. Apartfrom the risk of fatalities resulted from the vehicle accident; the occupational driversalso have the possibility of disabling injury such as Musculoskeletal Disorder(MSD). The most common MSD for Occupational Drivers are on Low Back andUpper Extremity such as neck and shoulder [2-4].

Proceedings of the 1st Master Project Symposium on Occupational Safety and Health13-15th December 2016
16
In PROTON, there is 1 case on the prevalence of severe MSD (low back pain)recorded among General Durability test drivers. Meanwhile, there are also few verbalcomplaints on the prevalence of MSD (minor aches and pain) received from GD testdrivers. Prevalence of MSD on GD test drivers can be caused by various factors.Therefore, there is a need to evaluate the risk of Musculoskeletal Disorder forGeneral Durability test drivers and propose methods to control it.
General Durability (GD) test is a complete vehicle test. The testing program wasdone by driving activity towards specific test distance and performed by the testdrivers. According to PROTON Test Standard, General Durability test accumulatedriving mileage up to 100,000 kilometres which approximate to 6 months testduration. General Durability test were done in public road and PROTON’s provingground which involve driving activities done by the GD test drivers.
Figure 1: Influencing factors for MSD among occupational drivers
As described in Figure 1, there are 7 influencing factors that could contribute toMSD among occupational drivers. 6 of it are occupational factors. This research willidentify influencing occupational factors for MSD among GD test drivers throughhazard identification process. Then assess the risk that arises from an influencingfactor, which is on seat comfort and support criteria. And finally propose controlmethods to reduce risk of MSD among GD test drivers.
2.0 METHODOLOGY
2.1 Hazard Identification
Qualitative research method such as interview and observation will be used onHazard Identification for GD test drivers work activities. Types of hazards are
Proceedings of the 1st Master Project Symposium on Occupational Safety and Health13-15th December 2016
17
identified based on Figure 1, which are Influencing Factors for MSD amongOccupational Driver. Assessment of the hazards purposely to justify the existence ofthe hazards within work activity of GD test drivers that could contribute toprevalence of MSD. Only occupational hazards will be assessed, which representsidentification of workplace hazards for GD Test Drivers. Among occupationalhazards that will be identified are long hour driving, whole body vibration, seatcomfort and support and, strenuous work.
2.1.1 Interview Method
A structured interview will be conducted with close response answers. The interviewis conducted on 17 members of Durability Group which actively involved in GDtesting activity. Analysis of data will be using Quasi-Statistical method. Interviewsdata are analyzed using descriptive analysis which calculates frequency of selectionsfor respective answers.
2.2.2 Observation Method
Observation method does include workplace inspection, work activity observationand work instrument (vehicle) evaluation. Workplace inspection inspected roadsurfaces that are used for GD test. Work activity observation observed for anystrenuous works or manual works that were done by GD test drivers. Workinstrument evaluation includes evaluation of seat support and comfort parameter andvehicle ride comfort between three different car models which are; Proton Iriz,Perodua Myvi and Volkswagen Polo.
2.2 Risk Assessment
Risk assessment will be using semi qualitative approach. The construct of semi-qualitative risk assessment is by using Likelihood and Severity Rating to obtain riskrating and risk level. Likelihood rating will be determined using experimentalmethod which is Body Pressure Measurement. Severity rating will be determinedusing quantitative method which is Nordic Musculoskeletal Questionnaire.
2.2.1 Body Pressure Measurement
Sample size of 10 test subjects was selected among PROTON staff to be measuredtheir body pressure distribution. Measurement will be done for each anthropometricgroup of 50th percentile female (155.9 cm) and 99th percentile male (183.5cm) basedon stature height [5] Body pressure measurement is conducted using Body PressureMeasurement System (BPMS) provided by Tekscan Inc. Measuring equipmentconsist of two pressure mat placed respectively on seat cushion (lower mat) and alsoseat back (upper mat). Make and model of the pressure mat is Tekscan Comformat.

Proceedings of the 1st Master Project Symposium on Occupational Safety and Health13-15th December 2016
18
There are a total of 1024 pressure sensels. Each pressure sensel is in 1 X 1 cm sizeand combined in a 32 X 32 cm sensor area for each pressure mat.
Lower and upper mat were placed respectively on seat cushion and seat back.Measurements were taken with the test subjects in driving posture. The test subject isallowed to do slight adjustments on the tested seat to allow for seating in their mostcomfortable posture [6]. Measurement will be done on PROTON Iriz driver’s seatwith synthetic leather upholstery.
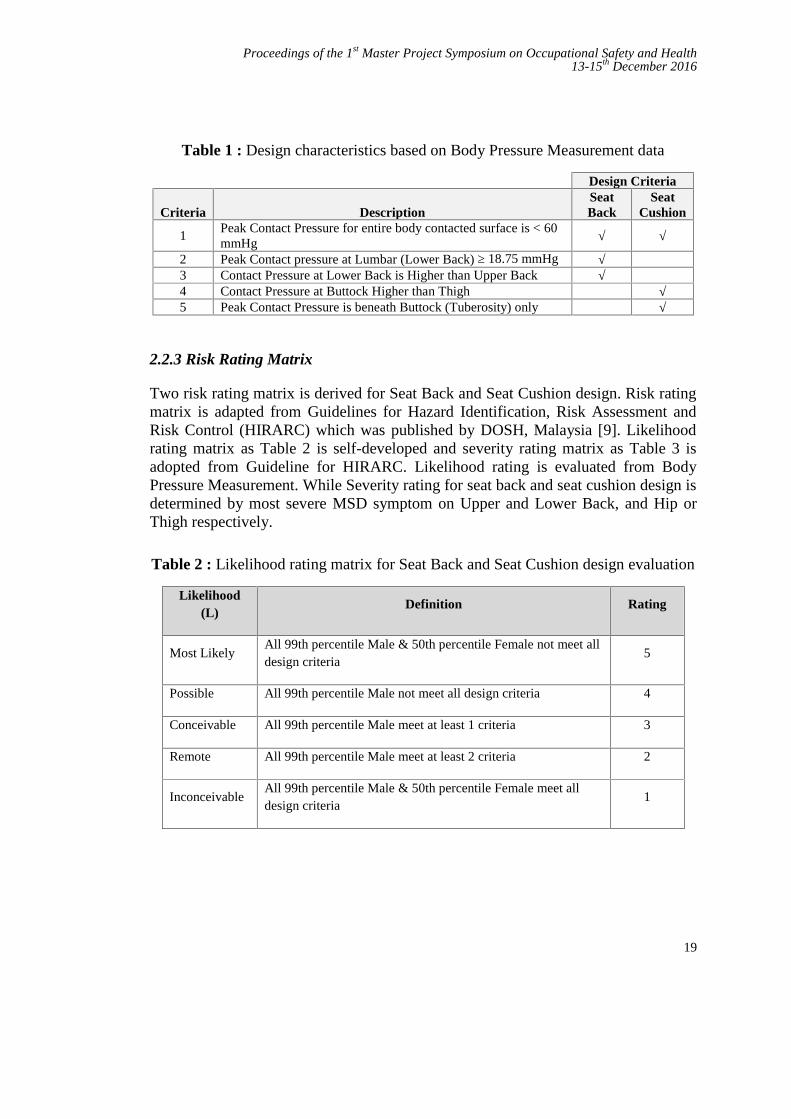
Recording and processing of the data will be done by ConforMat Research 7.20software. Data that will be extracted are values of Contact Pressure (Pave) and PeakContact Pressure (Ppeak). Recorded data will be viewed in Two Dimensional (2-D)contour with Fixed Area Averaging displays [7]. Extracted data are classified bydifferent body parts as per Figure 2 [8]. Pressure scale is set at 0 to 60 mmHg. Asdescribed in Table 1, there are 5 characteristics of seat comfort and support that willbe tested based on evaluation of seat comfort and support for seat cushion and seatback design.
Figure 2 : Box size for body pressure data analysis
2.2.2 Nordic Musculoskeletal Questionnaire (NMQ)
Respondents for NMQ consist of 17 GD test drivers. NMQ will be used to obtainhistory of MSD problem among GD test drivers. The questions are constructed withSingle Response set of answers. Questionnaires data are analysed using descriptiveanalysis which calculates frequency of selections for respective answers.
Proceedings of the 1st Master Project Symposium on Occupational Safety and Health13-15th December 2016
19
Table 1 : Design characteristics based on Body Pressure Measurement data
Design Criteria
Criteria DescriptionSeatBack
SeatCushion
1Peak Contact Pressure for entire body contacted surface is < 60mmHg √ √
2 Peak Contact pressure at Lumbar (Lower Back) ≥ 18.75 mmHg √3 Contact Pressure at Lower Back is Higher than Upper Back √4 Contact Pressure at Buttock Higher than Thigh √5 Peak Contact Pressure is beneath Buttock (Tuberosity) only √
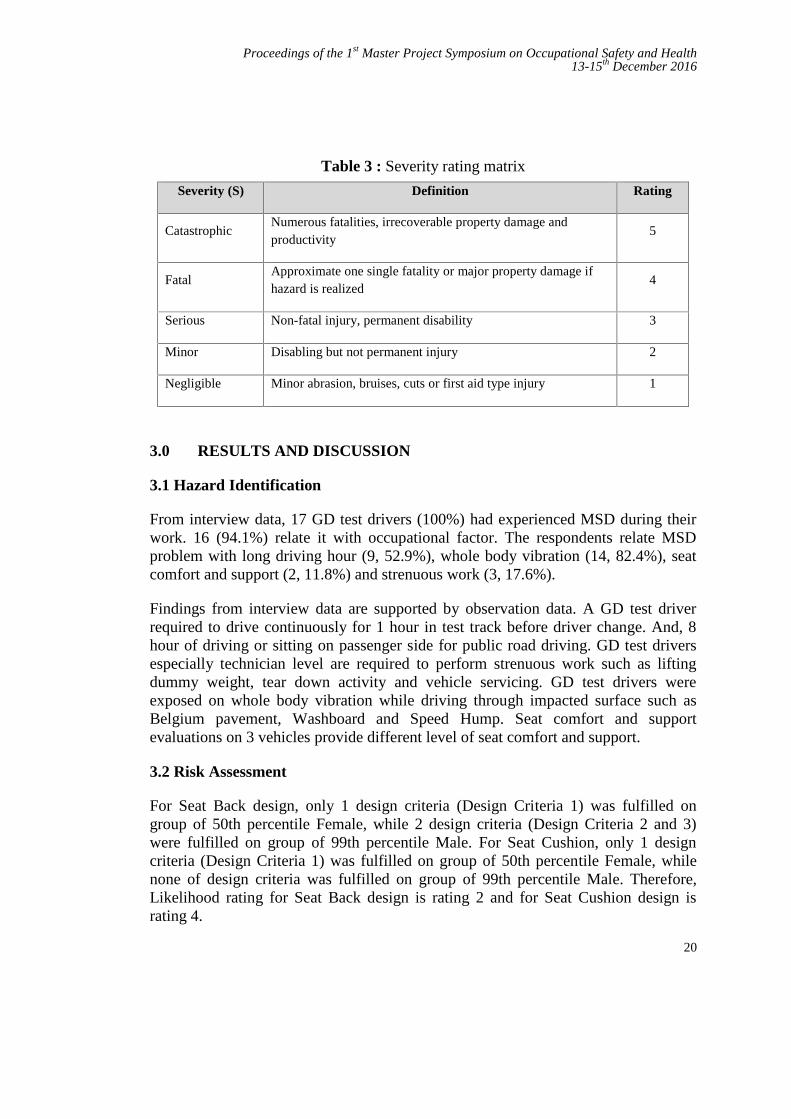
2.2.3 Risk Rating Matrix
Two risk rating matrix is derived for Seat Back and Seat Cushion design. Risk ratingmatrix is adapted from Guidelines for Hazard Identification, Risk Assessment andRisk Control (HIRARC) which was published by DOSH, Malaysia [9]. Likelihoodrating matrix as Table 2 is self-developed and severity rating matrix as Table 3 isadopted from Guideline for HIRARC. Likelihood rating is evaluated from BodyPressure Measurement. While Severity rating for seat back and seat cushion design isdetermined by most severe MSD symptom on Upper and Lower Back, and Hip orThigh respectively.
Table 2 : Likelihood rating matrix for Seat Back and Seat Cushion design evaluation
Likelihood(L)
Definition Rating
Most LikelyAll 99th percentile Male & 50th percentile Female not meet alldesign criteria
5
Possible All 99th percentile Male not meet all design criteria 4
Conceivable All 99th percentile Male meet at least 1 criteria 3
Remote All 99th percentile Male meet at least 2 criteria 2
InconceivableAll 99th percentile Male & 50th percentile Female meet alldesign criteria
1
Proceedings of the 1st Master Project Symposium on Occupational Safety and Health13-15th December 2016
20
Table 3 : Severity rating matrix
Severity (S) Definition Rating
CatastrophicNumerous fatalities, irrecoverable property damage andproductivity
5
FatalApproximate one single fatality or major property damage ifhazard is realized
4
Serious Non-fatal injury, permanent disability 3
Minor Disabling but not permanent injury 2
Negligible Minor abrasion, bruises, cuts or first aid type injury 1
3.0 RESULTS AND DISCUSSION
3.1 Hazard Identification
From interview data, 17 GD test drivers (100%) had experienced MSD during theirwork. 16 (94.1%) relate it with occupational factor. The respondents relate MSDproblem with long driving hour (9, 52.9%), whole body vibration (14, 82.4%), seatcomfort and support (2, 11.8%) and strenuous work (3, 17.6%).
Findings from interview data are supported by observation data. A GD test driverrequired to drive continuously for 1 hour in test track before driver change. And, 8hour of driving or sitting on passenger side for public road driving. GD test driversespecially technician level are required to perform strenuous work such as liftingdummy weight, tear down activity and vehicle servicing. GD test drivers wereexposed on whole body vibration while driving through impacted surface such asBelgium pavement, Washboard and Speed Hump. Seat comfort and supportevaluations on 3 vehicles provide different level of seat comfort and support.
3.2 Risk Assessment
For Seat Back design, only 1 design criteria (Design Criteria 1) was fulfilled ongroup of 50th percentile Female, while 2 design criteria (Design Criteria 2 and 3)were fulfilled on group of 99th percentile Male. For Seat Cushion, only 1 designcriteria (Design Criteria 1) was fulfilled on group of 50th percentile Female, whilenone of design criteria was fulfilled on group of 99th percentile Male. Therefore,Likelihood rating for Seat Back design is rating 2 and for Seat Cushion design israting 4.
Proceedings of the 1st Master Project Symposium on Occupational Safety and Health13-15th December 2016
21
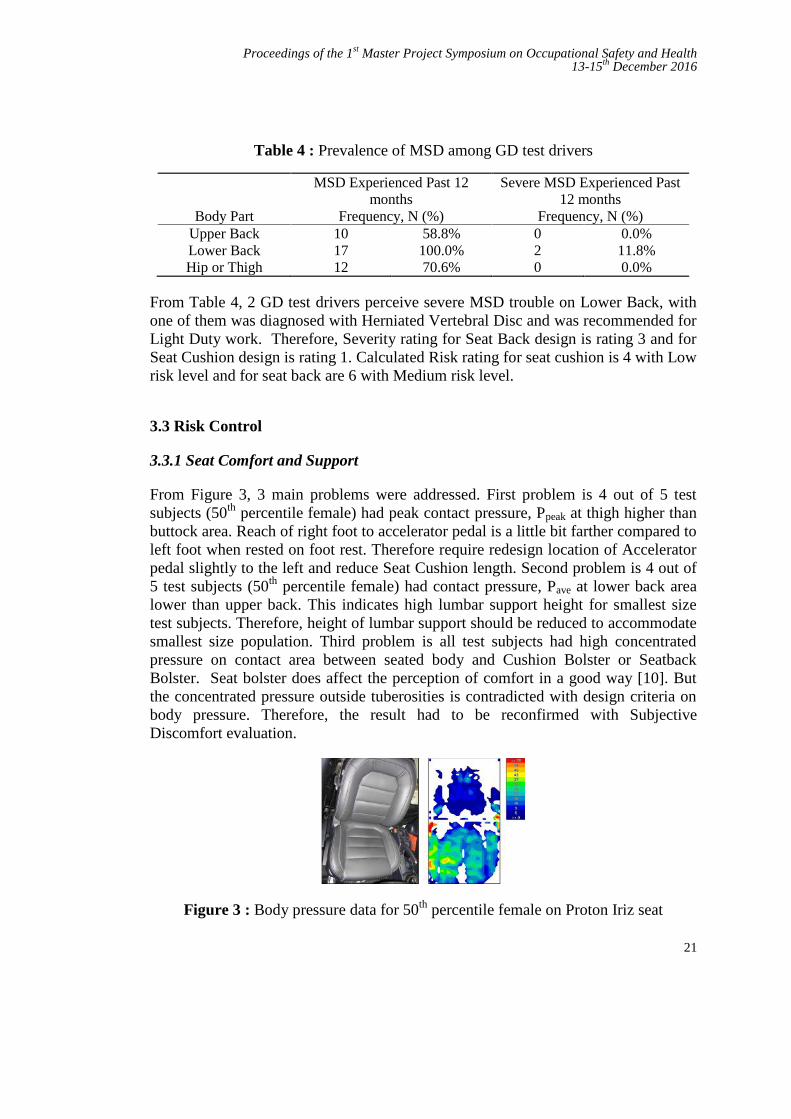
Table 4 : Prevalence of MSD among GD test drivers
MSD Experienced Past 12months
Severe MSD Experienced Past12 months
Body Part Frequency, N (%) Frequency, N (%)Upper Back 10 58.8% 0 0.0%Lower Back 17 100.0% 2 11.8%Hip or Thigh 12 70.6% 0 0.0%
From Table 4, 2 GD test drivers perceive severe MSD trouble on Lower Back, withone of them was diagnosed with Herniated Vertebral Disc and was recommended forLight Duty work. Therefore, Severity rating for Seat Back design is rating 3 and forSeat Cushion design is rating 1. Calculated Risk rating for seat cushion is 4 with Lowrisk level and for seat back are 6 with Medium risk level.
3.3 Risk Control
3.3.1 Seat Comfort and Support
From Figure 3, 3 main problems were addressed. First problem is 4 out of 5 testsubjects (50th percentile female) had peak contact pressure, Ppeak at thigh higher thanbuttock area. Reach of right foot to accelerator pedal is a little bit farther compared toleft foot when rested on foot rest. Therefore require redesign location of Acceleratorpedal slightly to the left and reduce Seat Cushion length. Second problem is 4 out of5 test subjects (50th percentile female) had contact pressure, Pave at lower back arealower than upper back. This indicates high lumbar support height for smallest sizetest subjects. Therefore, height of lumbar support should be reduced to accommodatesmallest size population. Third problem is all test subjects had high concentratedpressure on contact area between seated body and Cushion Bolster or SeatbackBolster. Seat bolster does affect the perception of comfort in a good way [10]. Butthe concentrated pressure outside tuberosities is contradicted with design criteria onbody pressure. Therefore, the result had to be reconfirmed with SubjectiveDiscomfort evaluation.
Figure 3 : Body pressure data for 50th percentile female on Proton Iriz seat

Proceedings of the 1st Master Project Symposium on Occupational Safety and Health13-15th December 2016
22
3.3.2 Whole Body Vibration
Risk of MSD from whole body vibration can be reduced by lowering exposure timeby reducing driving time. Besides that, optimum vibration isolation from suspensionsystem had to be designed and tuned to prioritize on comfort level. Finally, seatdesign need to utilize advance seat cushion materials which have higher vibrationdampening properties and also other innovative solution on seat design such asfloating seat system [11-12].
3.3.3 Long Driving Hour and Strenuous Work
To reduce risk of MSD from long driving hour and strenuous work, AdministrativeControl methods is the most viable. Among administrative control methods that weresuggested are training and briefing to promote awareness on correct work posture,reduce driving time and suggest for short periodical break within long driving time,promote healthy lifestyle and perform light stretching prior start of work and duringperiodical break.
4.0 CONCLUSION
HIRARC process had been completed for GD test drivers work activities. Four maintypes of hazard that would contribute to MSD among GD test drivers were obtainedthrough hazard identification which is long hour driving, Whole Body Vibration,inadequate seat comfort and support, and strenuous work. Highest responses indicateprevalence of MSD may result from Whole Body Vibration. Risk assessment hadbeen done in term of inadequate seat comfort and support hazard and found out thatthe tested seat (Proton Iriz) have Medium Risk level of MSD from Seat Back designand Low Risk level of MSD from Seat Cushion design. Risk control method hadbeen developed to reduce risk of MSD among GD test drivers. Only options ofAdministrative Control method is possible to be implement immediately.
REFERENCES
[1] Newnam, Sharon A., and Barry Watson. “Work-Related Driving Safety inLight Vehicle Fleets: A Review of Past Research and the Development of anIntervention Framework.” Safety Science, (2011) 49 (3): 369–381.
[2] Akinpelu, A. O., O. O. Oyewole, A. C. Odole, and R. O. Olukoya.“Prevalence of Musculoskeletal Pain and Health Seeking Behaviour amongOccupational Drivers in Ibadan, Nigeria.” African Journal of BiomedicalResearch 14 (May 2011): 89–94.
[3] Alperovitch-Najenson, Deborah, Yoav Santo, Youssef Masharawi, MichalKatz-Leurer, Diana Ushvaev, and Leonid Kalichman. “Low Back Pain

Proceedings of the 1st Master Project Symposium on Occupational Safety and Health13-15th December 2016
23
among Professional Bus Drivers: Ergonomic and Occupational-Psychosocial Risk Factors.” The Israel Medical Association Journal :IMAJ 12, 1. (2010): 26–31.
[4] Bawa, MukeshSuresh, and Manissha Srivastav. “Study the EpidemiologicalProfile of Taxi Drivers in the Background of Occupational Environment,Stress and Personality Characteristics.” Indian Journal of Occupational andEnvironmental Medicine, (2013), 17 (3).
[5] Karuppiah, Karmegam, Mohd Sapuan Salit, Mohd Yusof Ismail, NapsiahIsmail, Shamsul Bahri Mohd Tamrin, Mohana Krishnan Gobalakrishnan,Seetha Palanimuthu, and Thiyagu Palaniandy. “Anthropometry ofMalaysian Young Adult”. Journal of Human Ergology, (2011), 40 (1-2): 37–46.
[6] Chae, Songyi, Gyouhyung Kyung, and Kyunghyun Nam. “MeasuringDrivers’ Dynamic Seating Experience Using Pressure Mats.” In Design, UserExperience, and Usability: Part 2, edited by A Marcus (Ed.), 368–75.2011.
[7] Kyung, Gyouhyung. “An Integrated Human Factors Approach to Design andEvaluation of the Driver Workspace and Interface: Driver Perceptions,Behaviors, and Objective Measure.” Virginia Polytechnic Institute andState University. 2008.
[8] Kyung, Gyouhyung, and Maury A. Nussbaum. “Driver Sitting Comfort andDiscomfort (Part II): Relationships with and Prediction from InterfacePressure.” International Journal of Industrial Ergonomics, 2008, 38 (5– 6):526–38.
[9] Department of Occupational Safety and Health Malaysia. 2008. Guidelinesfor Hazard Identification, Risk Assessment and Risk Control (HIRARC).
[10] Coelho, Denis A, and Sven Dahlman. “A Pilot Evaluation of Car Seat SideSupport: Leading to a Redefinition of the Problem.” Internationa Journal ofIndustrial Ergonomics, 1999, 24: 201–10.
[11] Wada, Hiroshi, Yoshinori Toyota, Akio Horie, Takayuki Sasaki, ChitoshiSuzuki, and Hiroki Fukuda. “Automotive Seating Foams with ExcellentRiding Comfort Prepared by a Novel Polypropylene Glycol.” PolymerJournal, 2008, 40 (9): 842–45.
[12] Yabe, Kengo, Toru Inagaki, and Takashi Kondo. “Adoption of Floating Seatin a Vehicle to Reduce Seat Vibration.” In SAE 2015 World Congress &Exhibition. 2015.
Proceedings of the 1st Master Project Symposium on Occupational Safety and Health13-15th December 2016
24
Level of Parents’Awareness on Children’sSafety at Public Playground Taman Tasik
TitiwangsaAhmad Nasaruddin Ishaudin a and Maslin Masrom b
UTM Razak School of Engineering and Advanced Technology, Universiti TeknologiMalaysia, 54100 Jalan Sultan Yahya Petra, Kuala Lumpur, Malaysia
[email protected], [email protected]
Abstract – Playground is one of the best places in providing the essential experiences forchildren’s physical activities, health and growth as it provides adequate facilities and playopportunities. Since most public playgrounds are developed on open space, parentsshould be concerned on the surrounding environment and should aware on the safety andhealth of their children. Thus, the aim of this study is to determine the level of parents’awareness on children’s safety and health at the public playground in relation to thephysical environment, social environment, and safety and security. The methodologyadopted in this study is via distribution of survey questionnaires to 220 participants andobservation on the behaviour of the parents and children at the playground. The focus is toparents with children under 15 years old visiting the public playground at Taman TasikTitiwangsa, Kuala Lumpur. The data is analysed via quantitative analysis using IBM SPSSsoftware. The results of the study revealed that majority of parents, regardless of genderand ethnic background, are aware about the safety and health of their children at theplayground and they are satisfied with the conditions of the facilities provided. Althoughparents are aware of safety and health at public playground, the study also reveals thatthere is no safety management system establish by the park management which couldprovide safety guidance and safety precautionary measures to the parents’ visitingthe playground with their children. The authority concerned should also develop a safetypolicy that provides regulations and guidelines to enhance parents’ awareness andconscientiousness towards safety and health at the public playground.
Keywords: Public Playground; Parents; Children; Safety Awareness; Guidelines
1.0 INTRODUCTION
Playgrounds are great assets for many communities in Malaysia. The place providesa gathering place where children can have fun and parents alike can get opportunityto socialise amongst them. If there are children in the playground we often seelaugh and cry, climb and fall, running and swinging, playing tag and hide-and-seek,where a few bruises and scratches will be part of the scenario. According toS.A.F.E. Research, playground injuries are the leading cause of injury to children
Proceedings of the 1st Master Project Symposium on Occupational Safety and Health13-15th December 2016
25
ages 5 to 14 years old [1]. It is estimated that one-third of playground-relateddeaths and 75 percent of playground equipment-related injuries occur on publicplayground. In Malaysia, it is estimated that the Emergency and TraumaDepartments has treated around 10,000 to 15,000 children ages 14 and younger forplayground injuries annually, half of these injuries are severe resulted inhospitalisation and costs millions for medical, legal and liability, pain and suffering,and work loss expenses [2].
There are issues related to safety and no matter how happy the children areenjoying their play, they are still vulnerable to the unsafe conditions of theplayground [3]. If we spent just one hour on the playground, there is a goodchance that we will see a child cry. Unknowingly, accident can happen andthe children can become hurt or severely injured. One of the main reasons forinjuries at the playground is the lack of active surveillance by the children’s parent[4]. Parental concerns about a child’s safety have been recognized as one of themajor reasons why parents restrict their child's independent mobility [5]. Safetyconcern is more in parents with younger children than parents with older children.Parents have to be more vigilant, supervise their children and be aware of safety andsecurity related issues at playground. Parents should elevate their awarenessabout safety and should have positive attitude towards accident prevention.Parents can also help to avoid any untoward incidents that can cause harm to theirchildren by highlighting the safety and security issues to the relevant authorities.
The objectives of this study are, this study was to investigate the level of parents’awareness on safety of their children at the public playground. This study is togauge the level of parents’ awareness on the physical aspect of the playground,how they feel about the condition of the facilities provided, how comfortable are theparents on the maintenance and servicing of the equipment, housekeeping of thesurrounding areas, condition of barricades, walkways, waterways, ponds, etc. Thesecond objective is to examine the level of awareness among genders and amongdifferent main ethnic groups in Malaysia on how they perceive safety at theplayground and whether the parents are comfortable with the safety aspect at theplayground. Finally, to propose a guide on safety awareness that could helpprevent children injuries at playground. By having the guidelines we could impressparents to be more passive towards child safety and to create the playgroundenvironment as a good place to play and enjoy without harm and worry. Inaddition, the government should step in to develop a policy on safety awarenessthat could help prevent children injuries at playground. This presents a clearmessage to governments for widespread support of additional investment in childaccident prevention.
Proceedings of the 1st Master Project Symposium on Occupational Safety and Health13-15th December 2016
26
2.0 LEVEL OF PARENTS AWARENESS ON CHILDREN SAFETY
In this research, three issues related to safety at public playground were identified,such as, physical environment, social environment, and, safety and security.
2.1 The Physical Environment
In B.E. Saelens research, mentioned that the presence of good physical environmenti.e. playground features are the factors that parents rate as important condition indetermining parents’ satisfaction when they bring their children to the publicplayground [6]. Being children, they like to do all kinds of activities and they donot know whether the equipment provided at the playground is safe to use. HowardA.W. also mentioned that majority of accidents happen at public playgrounds, oftendue to compromised safety standards by both the manufacturer of playgroundequipment and those responsible for constructing and maintaining the playground[7].
2.2 The Social Environment
Public playgrounds not only help develop quick problem solving ability in children,but also increase their interaction both physically and socially. In the past fewdecades, social fears have been pervasive and this explains the restriction ofmovement of children by their parents [8]. Because of the exposure to anti-socialbehaviour, such as fear of drug addiction, kidnapping and rape and also concernabout strangers, parents would not permit their children to go alone to the localplayground [9]. Valentine G. and McKendrick J. state that 70% of parents, whohave eight to eleven years old children, were worried about social problem and roadtraffic as major restrictions for children’s active free-play [10]. If a child is seenusing the playground facilities unsupervised and in a dangerous manner, othersshould cast an eye to take a look out and warn the child of the child unsafe act.Other parents should not take a blind bit of notice that nothing untoward wouldhappen.
2.3 Safety and Security
Yeen O. I., in the Star Online report, mentioned that whilst the park playgroundprovides a place to have fun, to do physical exercise and recreational activities, thepark can be a dangerous place to children if safety is ignored [11]. GillValentine and John McKendrik, in their research conducted in North-West England,was concluded that the most significant influence on children’s access toindependent play is not the level of public provision of play facilities but parentanxieties about children’s safety [10]. Children tend to play everywhere and playwith everything without thinking about safety when unsupervised. There are parents
Proceedings of the 1st Master Project Symposium on Occupational Safety and Health13-15th December 2016
27
that are not fear of letting their children play unsupervised. They seemed not waryabout issues relating to safety and security such as fears of ‘stranger danger’ i.e.about cases of child abduction [12].
3.0 RESEARCH FRAMEWORK
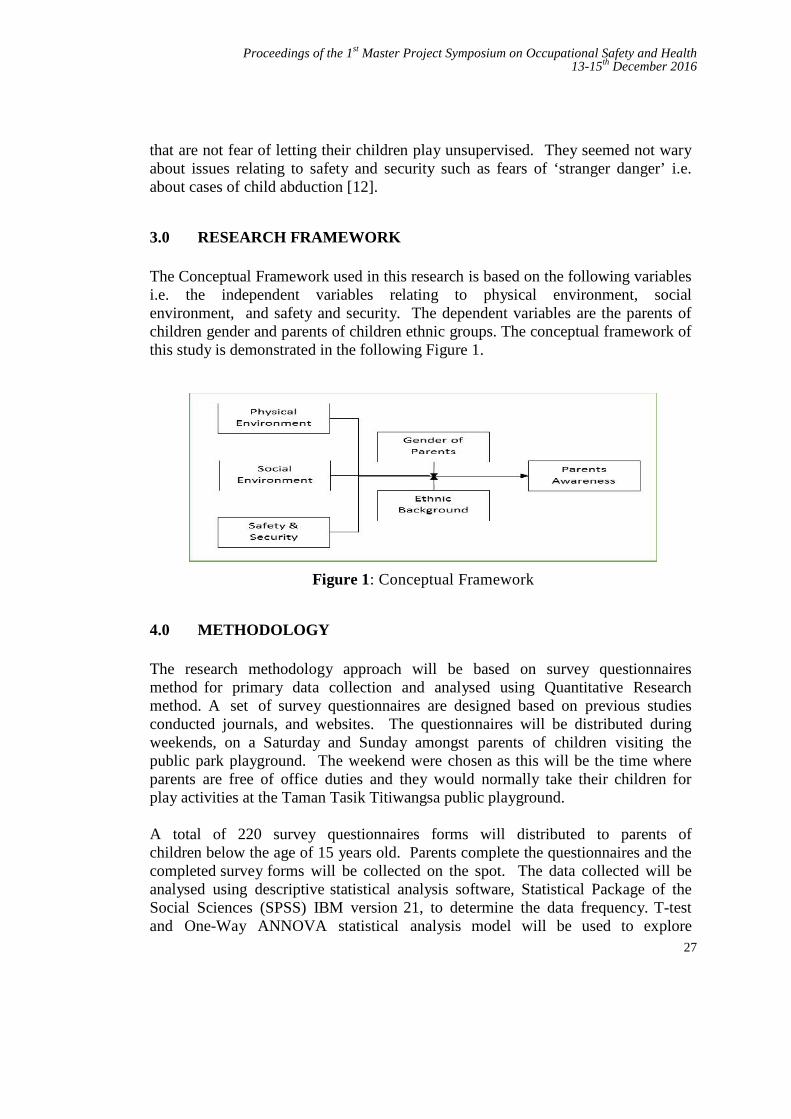
The Conceptual Framework used in this research is based on the following variablesi.e. the independent variables relating to physical environment, socialenvironment, and safety and security. The dependent variables are the parents ofchildren gender and parents of children ethnic groups. The conceptual framework ofthis study is demonstrated in the following Figure 1.
Figure 1: Conceptual Framework
4.0 METHODOLOGY
The research methodology approach will be based on survey questionnairesmethod for primary data collection and analysed using Quantitative Researchmethod. A set of survey questionnaires are designed based on previous studiesconducted journals, and websites. The questionnaires will be distributed duringweekends, on a Saturday and Sunday amongst parents of children visiting thepublic park playground. The weekend were chosen as this will be the time whereparents are free of office duties and they would normally take their children forplay activities at the Taman Tasik Titiwangsa public playground.
A total of 220 survey questionnaires forms will distributed to parents ofchildren below the age of 15 years old. Parents complete the questionnaires and thecompleted survey forms will be collected on the spot. The data collected will beanalysed using descriptive statistical analysis software, Statistical Package of theSocial Sciences (SPSS) IBM version 21, to determine the data frequency. T-testand One-Way ANNOVA statistical analysis model will be used to explore
Proceedings of the 1st Master Project Symposium on Occupational Safety and Health13-15th December 2016
28
perceived environment based on the physical environment, social environment,and safety and security issues to determine the level of parents’ awarenesswith respect to children safety at public playground. The survey result will bepresented in the form of tables, pie charts, bar charts etc.
5.0 RESULTS AND DISCUSSION
The study involved the descriptive statistical analysis based on the opinions andviews obtained from parents or guardians at the public playground Taman TasikTitiwangsa, Kuala Lumpur. The methodology adopted in this study is viadistribution of survey questionnaires to 220 participants and observation on thebehaviour of the parents and children at the playground.
The focus is on parents with children under 15 years old visiting the publicplayground with their children. The data is analysed via quantitative analysis wereperformed using the Statistical Package IBM SPSS Version 21. Data analysis byinferential involves the use of statistical methods mean i.e. Independent T-test tocompare gender differences and ANOVA tests to determine the relationship anddifferences between the variables based on hypotheses and the research questions.Reliability test was applied on the three independent variables i.e. PhysicalEnvironment, Social Environment, and Safety and Security using theCronbach’s Alpha Coefficient. The test will show the relationship between thethree independent variables and how the variables would agree with one another.
Based on the results computed, the Cronbach’s Alpha for overall reliability of theinstrument used to determine the Parent’s Safety Awareness exceeds = 0.70which is an acceptable reliability level. The reliability of the questionnaires usedin the research was Excellent. The findings also reveal that parents’ awareness onchildren safety with respect to each independent variable at the public playgroundwas high. Based on the overall results of the statistical analysis in relation to thethree independent environmental factors, the findings show that overall parents’safety awareness was at Medium High level.
As derived from the data analysis, the three elements of environmental issues aswell as the overall parents’ awareness on safety are all equally satisfying. Each ofthe environments share the same concern on the safety at the public playground.Although there are some things where parents have control and can take protectivemeasures (for example, watching their children climbing, and the like), however,there are several other reasons why parents may feel helpless to protect theirchildren.

Proceedings of the 1st Master Project Symposium on Occupational Safety and Health13-15th December 2016
29
Based on Objective No. 2, the researcher analysed the relationship and determinethe level of parents’ awareness on children safety at the children’s playground basedon gender and race. A hypothesis to determine whether there is a significancedifference between the parents’ awareness on children safety at the children’splayground based on gender showed that there is no significant difference betweengenders relating to parents’ awareness on children safety. Further, the studyproceeded to determine the level of parents’ awareness on children safety at thechildren’s playground in respect of differences among ethnic group. Using One-way analysis of variance, i.e. One-way ANOVA test, reveals that the hypothesisfails to reject as there is no significant difference regarding parents’ awareness onchildren safety between the ethnic groups.
Findings of the study reveal that the level of parents’ awareness on children’ssafety at public playground is above the mean value and parents are seemed tobe aware of the safety and security issues. They display concern on theirchildren’s safety and they take note of the physical environment, social environmentand safety and security issues at the public playground. Most parents feelcomfortable when they are in the vicinity of well-maintained public playgroundsand the play equipment is in good and well-kempt condition. They seemed to becomfortable with the safety and security of the surroundings and their child couldventure around the playground safety as there are also other parents and children atthe playground. However, in reality, some parents confess that they are not ableto keep a watchful eye on their children all the time whilst they are at the publicplayground. This is the most common response when asked why some parents mayfind it hard to protect their children at all times in order to prevent accidental injuryto their children. Lack of awareness or knowledge about the causes of accidents isthe frequent response given to prevent accidental injury.
Safety awareness among manufacturers of playground facilities is evident in theimprovement of the design and provisions for safety of the equipment as can beenseem from the many equipment at Taman Tasik Titiwangsa. The park managementalso needs to undertake various initiatives to improve the facilities and enhancethe surrounding landscape. The park management also needs to be aware about theneed for safety surfacing of the playground flooring, and improve the depthrequired to adequately cushion the impact of a child’s fall to the surface as evidentfrom the current situation of the public playground. It appears that the playgroundis no longer safer than ever. In 2008, the Kuala Lumpur City Council (DBKL) hasinitiated a master development blueprint to reorganize and improve theconditions of recreational parks in Kuala Lumpur in order to enhance livelihoodof city dwellers with good recreational park.
Proceedings of the 1st Master Project Symposium on Occupational Safety and Health13-15th December 2016
30
6.0 CONCLUSION
This paper presents the importance of safety at playground and outlined thatmajority of parents are satisfied with the adequacy of public play opportunities fortheir children through which the children can develop physically, mentally andsocially. Based on the research findings about safety at the public playgroundTaman Tasik Titiwangsa, most parents’ level of awareness about safety of theirchildren were more than satisfactory. The results of the study revealed thatmajority of parents, regardless of gender and ethnic background, are satisfied withthe facilities provided and they are aware about safety and health of their children atthe playground.
The study and observation notes revealed that parents perceive the elements of goodmaintenance of the playground facilities, good housekeeping of the green space,adequate sign board, adequate separation and effective physical barriers in the formof hedges between the playground boundary and the lake in the park in protectingchildren from accidents and injuries.
The priority concerns of safety awareness among parents with regards to safetyof their children at the public playground should be increased rather than beingmoderately satisfied with what are provided. Parents’ level of awareness on safetyof the play facilities, condition of the equipment and the maintenance, as well ashousekeeping at the playground should be given due concerned and not just beingsatisfied with whatever that is available if there is a playground and the children canenjoy. There are parents who claimed that they find it difficult to watch andprotect their children all the time when they are at the public playground.
Lack of safety and health awareness or knowledge about the causes of accidentson the public playground is some of the identified responses given by the parents inpreventing accidental injury. Parents seem unaware of hazards at publicplayground especially when using the play equipment but they show more concernwith the children safety and security being kidnapped rather than getting injured.However, this has yet to be ascertained and can be pursued in future research.
Most importantly, parents should increase their awareness about safety at thechildren playground and should have a positive attitude towards accidentprevention. Having a positive attitude among parents, no matter what gender theyare and whichever race they belong to, most injuries involving children can beavoided.
Manufacturer of playground equipment should be responsible to design theplayground facilities with the characteristics of child safety in mind and themanagement of the playground must ensure safety regulations apply to all
Proceedings of the 1st Master Project Symposium on Occupational Safety and Health13-15th December 2016
31
playgrounds. This role should be taken seriously by the manufacturer andplayground management in ensuring the instructions on the safety of children isclear.
In spite of parents’ awareness on children safety at public playground, the authorityconcerned should also develop a policy that provides guidelines to enhanceparents’ awareness and conscientiousness towards safety and health at the publicplayground. Safety of children is not only the responsibility of parents, but it isalso the responsibility of non-governmental organizations (NGOs) and governmentagencies involved in child safety initiatives. Government should step in to developa policy on safety awareness that could help prevent children injuries atplayground. This presents a clear message to governments for widespread supportof additional investment in child accident prevention. With proper guidelines, wouldenable parents to take safety and health issues seriously.
REFERENCES
[1] S.A.F.E. Research, Safe at Play. Par . 2. http://www.safeatplay.or/research.html 2016.
[2] Chan Li Jin,. Make Sure the Children are Safe When They’re Having. TheStar Online. June 8, 2011: par 11 http://www.thestar.com.my/lifestyle/features/2011/06/08/ 2011
[3] European Consumer Safety Association.. Parents’ Perceptions of ChildSafety – A 14 Country Study. European Child Safety Alliance, P.O Box75169, 1070 AD Amsterdam, The Netherlandshttp://www.childsafetyeurope.org/ publications/info/ 200
[4] PPj, P.P. Certified Playground Safety Inspector. Certified PlaygroundInspector Course. http://www.ppj.gov.my/CPSI-2015.pdf. 2015.
[5] Veitch. J., S. Bagley, K. Ball and J. Salmon,. Where do children usuallyplay? A qualitative study of parents' perceptions of influences on children'sactive free-play. Health and Place, 12(4): 383-393. 2006
[6] Brian E. Saelens, et.al Measuring Physical Environments of Parks andPlaygrounds: EAPRS Instrument Development and Inter-Rater Reliability”.Journal of Physical Activity and Health, 2006, 3, Suppl 1, S190-S207.
[7] Howard, A.W. Keeping children safe: Rethinking how we design oursurroundings. CMAJ: Canadian Medical Association Journal = Journal DeL’association Medical Canadienne, 2010. 182(6), 573-578.doi: 10.1503/cmaj.080162
[8] Prezza, M., F.R. Alparone, C. Cristallo and S. Luigi, Parental perception ofsocial risk and of positive potentiality of outdoor autonomy for children:The development of two instruments. Journal of Environmental Psychology,2005, 25(4): 437-453.
Proceedings of the 1st Master Project Symposium on Occupational Safety and Health13-15th December 2016
32
[9] Blakely, K., Parent’s conception of urban danger and relationship tochildren’s access to their neighborhood. Unpublished doctoraldissertation, City University of New York, Graduate School and UniversityCenter. 1993
[10] Gill V. and John M. Children’s Outdoor Play: Exploring Parental ConcernsAbout Children’s Safety and the Changing Nature of Childhood.Geoforum, Vol. 28, No. 2 pp. 219-235, 1997
[11] Oh Ing Yeen, More should be done to make our playgrounds safer. TheStar Online, May 2014.
[12] Stokes, M. A., Stranger Danger: Child Protection and Parental Fears in theRisk Society. Amsterdam Social Science, 2009, Vol. 1(3): 6-24.
Proceedings of the 1st Master Project Symposium on Occupational Safety and Health13-15th December 2016
33
Evaluation of Musculoskeletal Disordersamong Computer Users
Ahmad Salihin Arshada and Nor Fazilah MohdHashim,b
UTM Razak School of Engineering and Advanced Technology, Universiti TeknologiMalaysia, 54100 Jalan Sultan Yahya Petra, Kuala Lumpur, Malaysia
[email protected], [email protected]
Abstract –In the modern era of computer usage, prevalence of work-relatedmusculoskeletal disorders (MSDs) have become the common ergonomic problems amongcomputer users. Evaluation of musculoskeletal disorders (MSDs) among computer users cancreate action to reduce musculoskeletal disorders. As continuity of previous researcheson musculoskeletal disorders (MSDs), the aim of the research was to evaluate risk factorsof musculoskeletal disorders (MSDs) among computer users by Nordic questionnaireand Rapid Office Strain Assessment (ROSA) methods. This research was conductedamong 246 computer users in Universiti Sains Islam Malaysia (USIM). The data wereanalysed in Statistical Package for Social Sciences (SPSS) version 21. The results of Nordicquestionnaire showed that the most prevalence of musculoskeletal disorders (MSDs) amongcomputer users in the case study area were in the body regions of neck (19.9%), upper back(19.5%), and shoulder (17.4%) respectively more than in other body regions. Based on theresults of ROSA, 77.2% of the computer work stations in the case study area were atmedium risk level, which was acceptable but serve as notification to improve the workstations.
Keywords: Computer User, Musculoskeletal Disorders, Nordic Questionnaire, Rapid OfficeStrain Assessment
1.0 INTRODUCTION
The amount of computer use has increased dramatically in the past 2 decades. It hasbecome common tool especially in office environment. Nowadays, many companiesdepend on computer technology to complete many tasks with fewer employeesand time (1). Computer is used frequently by user to complete tasks like minimizedocumentation, storage big data, create proper filing and so on. In relation tocomputer use and ergonomic, previous researches have shown that most computerusers are likely to experience musculoskeletal discomforts. Some parts of the bodycan be affected during or after working with computers, especially neck, shoulder,back, hands and wrists. Musculoskeletal disorders, muscle disorders, tendons,peripheral nerves, joints, bones, ligaments and blood vessels are the result of

Proceedings of the 1st Master Project Symposium on Occupational Safety and Health13-15th December 2016
34
unsuitable posture, repetitive motion and others related. These disorders can lead tothe symptoms such as pain, tingling and numbness. These symptoms amongcomputer users at office can reduce time effective work and production costs andincrease compensation for work (2). A combination of ergonomic risk factors such asworkstation design, awkward posture, repetitive movements, static postures, workinglong hours without rest breaks and psychological factors are linked tomusculoskeletal disorders (MSDs).
In this matter, ergonomic risk assessment can effectively help to identify the mostimportant computer use risk factors. Two main methods used for ergonomic riskassessment in the field of computer workstation ergonomics are Nordic questionnaireand Rapid Office Strain Assessment (ROSA). Nordic questionnaire was developedfrom a project funded by the Nordic Council of Ministers. The aim was todevelop and test a standardized questionnaire methodology allowing comparisonof low back, neck, shoulder and general complaints for use in epidemiologicalstudies (3). ROSA is a method developed by academicians from universities atCanada, which is a picture-based postural targeting screening tool for quantifyingexposure to risk factors for office worker (4). In research of MSDs and computerworkstation ergonomics, both methods can be used as risk assessment todetermine action for change based on related problems. Ergonomic interventionssuch as computer workstation redesign, occupational gym programs, and computerworkstation ergonomics guideline can help to solve these problems. With theergonomic interventions, risk factors of MSDs among office workers can be reducedand computer workstation ergonomics can be achieved.
2.0 METHODOLOGY
This cross-sectional study was conducted on 246 computer users, among 687administrative staff in Universiti Sains Islam Malaysia (USIM). The number ofparticipants to participate was considered according to the formula (5) below:
= ( − )( − ) + ( − )
Data collection tools were standardised Nordic questionnaire and Rapid Office StrainAssessment (ROSA) checklist. Section A of Nordic questionnaire comprises
S = Required Sample sizeX = Z value (e.g. 1.96 for 95% confidence level)
N = Population SizeP = Population proportion (expressed as decimal) (assumed to be 0.5 (50%)d = Degree of accuracy (5%), expressed as a proportion (.05); It is margin of error
Proceedings of the 1st Master Project Symposium on Occupational Safety and Health13-15th December 2016
35
demographic profile of respondents which are work department, gender and age.Section B is on respondents’ profile related to computer use such as computer usetime, rest break, work experience related to computer use, and physical exercise.Section C is on musculoskeletal disorders (MSDs), or musculoskeletal complaints inbody regions. In section C, respondents choosing ‘Yes’ rather ‘No’ participated inquestion of the prevalence of MSDs in the past 12 months. Severity and frequencylevel of pain for body regions which were neck, shoulder, arm, elbow, hand andwrist, upper back, lower back, hip, thigh, knee and feet were each divided into 3categories to be ticked by the respondents. Severity level of pain was 1=Mild pain(barely noticeable, without interrupting with work activities), 2= Moderate pain(without interrupting work activities), and 3= Severe pain (interrupting workactivities). Frequency level of pain was 1=1-2 times per year, 2=1-2 times permonth (certain months), and 1-2 times per week/everyday (certain weeks/days).Then, body discomfort level, which represented MSDs, was produced by severitylevel multiplied with frequency level. Body discomfort level 3,4,6, and 9 wereconsidered and included in the final analysis of the prevalence of MSDs.
Rapid Office Strain Assessment (ROSA) checklist, an ergonomic risk assessmentmethod to quantify exposure of risk factor related to computer workstation, wasused to attain score for each subsection of computer workstation, which weresubsection A-Chair, subsection B- Monitor and Telephone, subsection C-Mouse andKeyboard, and ROSA final score. In subsection A-Chair, total score of Chair Heightand Pan Depth are combined, and matched with total score of Arm Rest and BackSupport, based on ROSA scoring chart, to receive score of subsection A-Chair. Ascore of -1 will be assigned if the worker spends less than 1 hour a day in the chairthroughout the day. If the worker spends 1-4 hours a day the duration score is 0. Ifthe worker spends more than 4 hours a day in the chair, the duration score will be+1. Duration score is added to score of the chair score to receive final subsection A-chair score. In subsection B-Monitor and Telephone, total score of monitor is addedto duration score, and then matched with total score of telephone and duration score.In subsection C-mouse and keyboard, total score of mouse is added to durationscore, and then matched with total score of keyboard and duration score. SubsectionB and C are matched to receive total score of peripherals and monitor. Finally,subsection A-chair is matched with peripherals and monitor to receive final ROSAscore. Score from 1 to 2 is considered as low risk and acceptable. Score from 3to 5 is considered as moderate risk, still tolerable but serve as notification area. Scoreof higher than 5 is considered as high risk and need ergonomic intervention in termof computer workstation.
3.0 RESULTS AND DISCUSSION
246 respondents filled the Nordic questionnaire, and were assessed by RapidOffice Strain Assessment (ROSA) method. Demographic and work characteristics
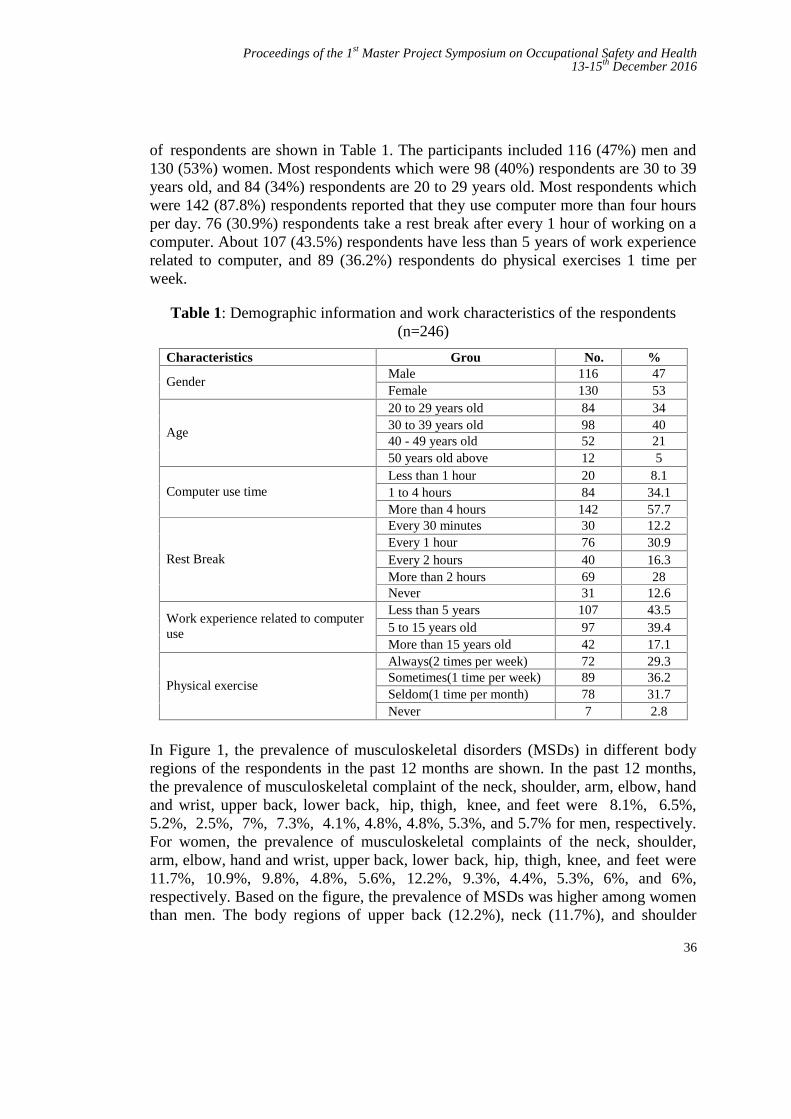
Proceedings of the 1st Master Project Symposium on Occupational Safety and Health13-15th December 2016
36
of respondents are shown in Table 1. The participants included 116 (47%) men and130 (53%) women. Most respondents which were 98 (40%) respondents are 30 to 39years old, and 84 (34%) respondents are 20 to 29 years old. Most respondents whichwere 142 (87.8%) respondents reported that they use computer more than four hoursper day. 76 (30.9%) respondents take a rest break after every 1 hour of working on acomputer. About 107 (43.5%) respondents have less than 5 years of work experiencerelated to computer, and 89 (36.2%) respondents do physical exercises 1 time perweek.
Table 1: Demographic information and work characteristics of the respondents(n=246)
Characteristics Groups
No. %
GenderMale 116 47Female 130 53
Age
20 to 29 years old 84 3430 to 39 years old 98 4040 - 49 years old 52 2150 years old above 12 5
Computer use timeLess than 1 hour 20 8.11 to 4 hours 84 34.1More than 4 hours 142 57.7
Rest Break
Every 30 minutes 30 12.2Every 1 hour 76 30.9Every 2 hours 40 16.3More than 2 hours 69 28Never 31 12.6
Work experience related to computeruse
Less than 5 years 107 43.55 to 15 years old 97 39.4More than 15 years old 42 17.1
Physical exercise
Always(2 times per week) 72 29.3Sometimes(1 time per week) 89 36.2Seldom(1 time per month) 78 31.7Never 7 2.8
In Figure 1, the prevalence of musculoskeletal disorders (MSDs) in different bodyregions of the respondents in the past 12 months are shown. In the past 12 months,the prevalence of musculoskeletal complaint of the neck, shoulder, arm, elbow, handand wrist, upper back, lower back, hip, thigh, knee, and feet were 8.1%, 6.5%,5.2%, 2.5%, 7%, 7.3%, 4.1%, 4.8%, 4.8%, 5.3%, and 5.7% for men, respectively.For women, the prevalence of musculoskeletal complaints of the neck, shoulder,arm, elbow, hand and wrist, upper back, lower back, hip, thigh, knee, and feet were11.7%, 10.9%, 9.8%, 4.8%, 5.6%, 12.2%, 9.3%, 4.4%, 5.3%, 6%, and 6%,respectively. Based on the figure, the prevalence of MSDs was higher among womenthan men. The body regions of upper back (12.2%), neck (11.7%), and shoulder
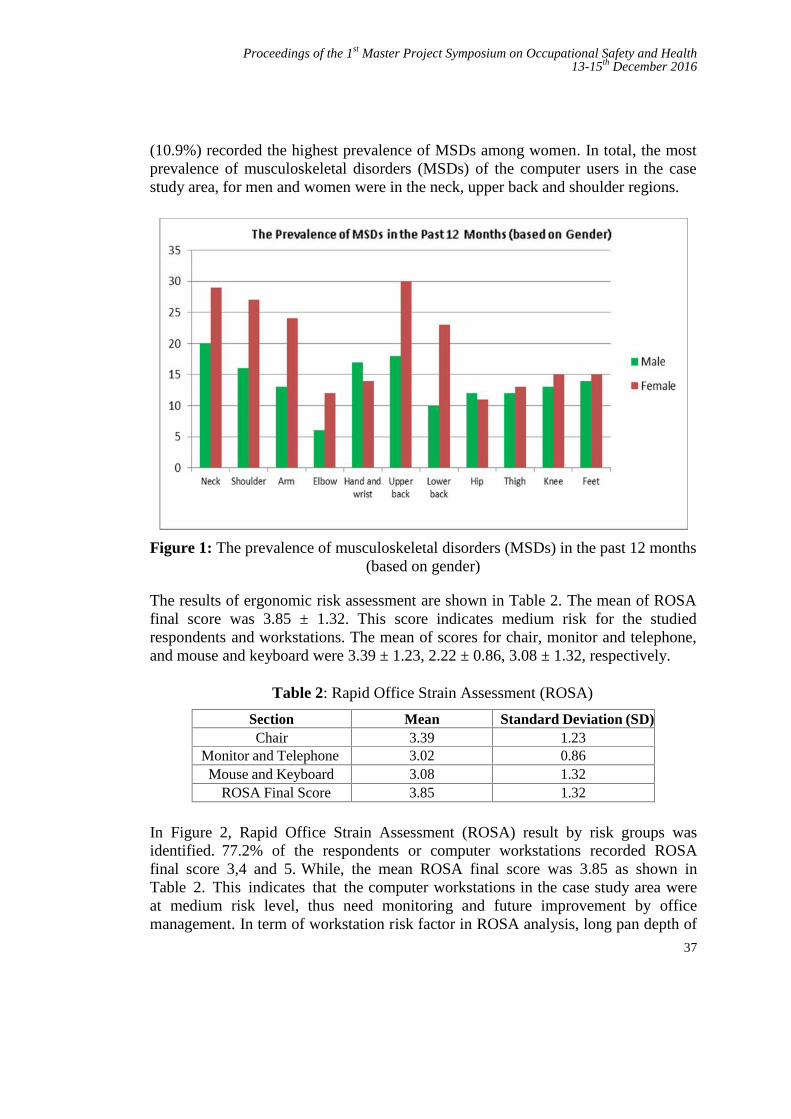
Proceedings of the 1st Master Project Symposium on Occupational Safety and Health13-15th December 2016
37
(10.9%) recorded the highest prevalence of MSDs among women. In total, the mostprevalence of musculoskeletal disorders (MSDs) of the computer users in the casestudy area, for men and women were in the neck, upper back and shoulder regions.
Figure 1: The prevalence of musculoskeletal disorders (MSDs) in the past 12 months(based on gender)
The results of ergonomic risk assessment are shown in Table 2. The mean of ROSAfinal score was 3.85 ± 1.32. This score indicates medium risk for the studiedrespondents and workstations. The mean of scores for chair, monitor and telephone,and mouse and keyboard were 3.39 ± 1.23, 2.22 ± 0.86, 3.08 ± 1.32, respectively.
Table 2: Rapid Office Strain Assessment (ROSA)
Section Mean Standard Deviation (SD)Chair 3.39 1.23
Monitor and Telephone 3.02 0.86Mouse and Keyboard 3.08 1.32
ROSA Final Score 3.85 1.32
In Figure 2, Rapid Office Strain Assessment (ROSA) result by risk groups wasidentified. 77.2% of the respondents or computer workstations recorded ROSAfinal score 3,4 and 5. While, the mean ROSA final score was 3.85 as shown inTable 2. This indicates that the computer workstations in the case study area wereat medium risk level, thus need monitoring and future improvement by officemanagement. In term of workstation risk factor in ROSA analysis, long pan depth of
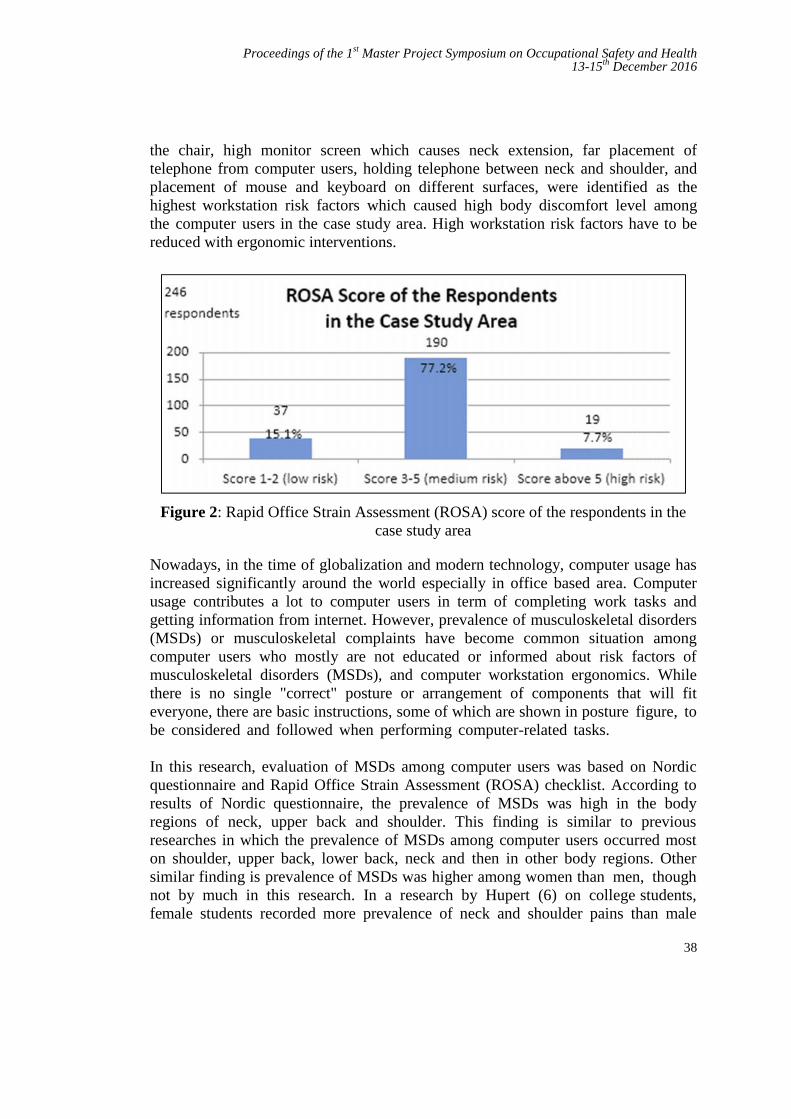
Proceedings of the 1st Master Project Symposium on Occupational Safety and Health13-15th December 2016
38
the chair, high monitor screen which causes neck extension, far placement oftelephone from computer users, holding telephone between neck and shoulder, andplacement of mouse and keyboard on different surfaces, were identified as thehighest workstation risk factors which caused high body discomfort level amongthe computer users in the case study area. High workstation risk factors have to bereduced with ergonomic interventions.
Figure 2: Rapid Office Strain Assessment (ROSA) score of the respondents in thecase study area
Nowadays, in the time of globalization and modern technology, computer usage hasincreased significantly around the world especially in office based area. Computerusage contributes a lot to computer users in term of completing work tasks andgetting information from internet. However, prevalence of musculoskeletal disorders(MSDs) or musculoskeletal complaints have become common situation amongcomputer users who mostly are not educated or informed about risk factors ofmusculoskeletal disorders (MSDs), and computer workstation ergonomics. Whilethere is no single "correct" posture or arrangement of components that will fiteveryone, there are basic instructions, some of which are shown in posture figure, tobe considered and followed when performing computer-related tasks.
In this research, evaluation of MSDs among computer users was based on Nordicquestionnaire and Rapid Office Strain Assessment (ROSA) checklist. According toresults of Nordic questionnaire, the prevalence of MSDs was high in the bodyregions of neck, upper back and shoulder. This finding is similar to previousresearches in which the prevalence of MSDs among computer users occurred moston shoulder, upper back, lower back, neck and then in other body regions. Othersimilar finding is prevalence of MSDs was higher among women than men, thoughnot by much in this research. In a research by Hupert (6) on college students,female students recorded more prevalence of neck and shoulder pains than male

Proceedings of the 1st Master Project Symposium on Occupational Safety and Health13-15th December 2016
39
students. Similarly, office workers in China encountered the highest prevalence ofMSDs in the neck (7). More prevalence for women is due to the different physicaland physiological body of women. Small size body and low muscle mass women arecommon causes of more cases of MSDs in women ratio to men. Related to all riskfactors, model summary in the regression analysis indicates that combination of riskfactors of gender, age, computer use time, rest break, computer work experience,physical exercise as well as computer workstation cause 31.8% or 1/3 of theprevalence of MSDs of the computer users in the case study area. Other 2/3 of theprevalence of MSDs was arguably from other external factors like pregnancy forwomen, sport activities, illness, diseases and others related.
In term of Rapid Office Strain Assessment (ROSA) method, while there wererespondents who recorded scores higher than 5, which are at high risk level, as awhole ROSA scores were from 3 to 5 which are at medium risk level. Thisfinding indicates computer workstations in the case study area were in notificationlevel, in which ROSA score and MSDs could increase if no proper action taken byrelated management. Management can take initiative like changing damagedworkstation, or encouraging employees to exercise for health aspect. Ergonomicintervention like changing computer workstation is not a must for ROSA score atmedium risk level, but prevention is better than cure.
4.0 CONCLUSION
This research paper presents an analysis on evaluation of musculoskeletal disorders(MSDs) among computer users at office area, by using Nordic Questionnaire andRapid Office Strain Assessment (ROSA) checklist. A number of previous researchesavailable shows that the field of musculoskeletal disorders (MSDs) is wide spreadand has positive prospect in the development of future research on evaluation ofmusculoskeletal disorders and how to reduce it. ROSA method is quite new inrecent years and in the future with modern technology available nowadays, therecould be new and sophisticated method to counter musculoskeletal disorders(MSDs). In the case study area which was Universiti Sains Islam Malaysia (USIM),the prevalence of musculoskeletal disorders (MSDs) was at medium level.Ergonomic interventions such as office ergonomics training, computer workstationredesign, provision of
guidelines are not compulsory for medium risk level, but can be considered bymanagement to prevent potential increased musculoskeletal disorders (MSDs) in thefuture, and are supposed to be conducted for several number of high riskworkstations immediately.
Proceedings of the 1st Master Project Symposium on Occupational Safety and Health13-15th December 2016
40
REFERENCES
[1] Alexis Writing The Advantages of Organizational Skills 2016.http://smallbusiness.chron.com/advantages-organizational-skills-276.html.Chron.
[2] Amit Bhattacharya, James D. McGlothlin Occupational Ergonomics: Theoryand Applications. CRC Press; 2008. 3(2):210-12, 2011.
[3] Joanne O. Crawford The Nordic Musculoskeletal QuestionnaireOccupational Medicine, 2007, 300–301
[4] Michael Sonne, Dino L.Villalta, David M. Andrews Development andEvaluation of an Office Ergonomic Risk Checklist : Rapid Office StrainAssessment (ROSA). Applied Ergonomics 2012. 43(1), 98-108
[5] Robert V. Krejcie and Daryle W. Morgan Determining Sample For ResearchActivities 1970.
[6] Hupert N, Amick BC, Fossel AH, et al. Upper Extremity MusculoskeletalSymptoms and Functional Impairment associated with Computer Useamong College Students. 2004 Work: 23: 85-93
[7] Wu S, He L, Li J, et al. Visual display terminal use increases the prevalenceand risk of work-related musculoskeletal disorders among Chinese officeworkers: a cross-sectional study. J Occup Health: 5434-43. 2012
Proceedings of the 1st Master Project Symposium on Occupational Safety and Health13-15th December 2016
41
Sharp Injury Awareness among Cleaners atTuanku Mizan Military Hospital
Ajit Pall Singh and Shreeshivadasan Chelliapana
UTM Razak School of Engineering and Advanced Technology, Universiti TeknologiMalaysia, 54100 Jalan Sultan Yahya Petra, Kuala Lumpur, Malaysia
Abstract – Sharp Injuries are one of major risk factors for blood-borne pathogeninfections (BBPs) at Tuanku Mizan Military Hospital. The study examines the prevalence ofsharp injury among cleaners at Tuanku Mizan Military Hospital doing the cleaning andcollecting sharps wastes from the dressing areas, wards and further more look intoawareness understanding among cleaners and developing a Standard Operating Proceduresfor cleaners while handling sharp objects for preventing these injury. Using a descriptivecross sectional study was conducted between Jun and September 2016. A self-administeredquestionnaire was distributed to 80 respondent cleaners from different wards at thehospital who were selected proportionate to the sample frame. A checklist was used toobserve medical sharps wastes management practices at the hospital. Focus groupdiscussions were held with healthcare workers to obtain in-depth information on the rootcauses of medical sharps injuries at the hospital. Data were entered into Microsoft SoftwareAccess database and analysis was done by use of Statistical Package for Social Sciences(SPSS), version 16. It was found that 76.6% of the cleaners were aware sharp injuryhazards. 1(1.2%) cleaner out of the 80 cleaners had needle prick injury. Needle Prickinjuries are common risk factors among the cleaners in Tuanku Mizan Military Hospital.For the effective prevention of these injuries, holding workshops, trainings and increasingcleaners' awareness and skills to face these risks can be effective in mitigating the risk ofinjuries and also reporting of needle prick injury & sharp injury will help to review thehandling procedures from time to time.
Keywords: Needle Stick, Sharp Injuries, Awareness, Cleaning Work
1.0 INTRODUCTION
Injuries caused due to needles are very common in hospitals. Needles accidentallypuncture the skin, leading to blood borne pathogenic diseases. The cleaners who arein hazardous environment are those who are injured in disposing of activity orcollecting the clinical waste from wards, labs and mortuary. The contaminatedneedles and sharps handling involves in tying up and carrying plastic bags disposalto the clinical waste bins, moving the clinical waste bins to the collectionpoint & cleaning up clinical waste spillage. The needles that have been disposed in

Proceedings of the 1st Master Project Symposium on Occupational Safety and Health13-15th December 2016
42
HOSPITAL TUANKU MIZAN
No Type of Accident Year 2012 -20151 Needle Prick 412 Slip & Fall 73 Hit By Vehicle 34 Lifting Heavy Large Waste Disposal Bins 1
clinical bins and at times needles have been thrown in the plastic bags which cancause needle stick injuries. Needle injuries are important and common occupationalinjury that occurs among cleaners and have an impact to the cleaners viatransmission of blood borne pathogens (BBP) [1, 2].
Syringes used in hospitals are sharp and commonly used once [3]. Even thoughdoctors, nurses, health care auxiliaries, hospital maintenance team and patients arethe main concern, but cleaners are the last person that is never looked in [4].Medicalsharps injuries have been recognized as one of the occupational hazards amonghealth care workers. Needle prick injuries is one of the most reported events atTuanku Mizan Military Hospital. An average of two accidental sharps injuriesamong health care workers have been reported every month (Incident statistic 2012-2015). A great deal of anxiety (often out of proportion) can arise and at the sametime the rights of the patient who was the source of infection should not becompromised.
Table 1: Number of the Accidents among cleaners in Tuanku Mizan Hospitalfrom 2012 – 2015
Sharps injury may cause a number of potentially fatal infections with blood-borne pathogens. Stringer stated that when infected by needles, the risk can behigh depending on the quantity of virus present in the blood of the source person atthe time of the injury, the depth of the injury and the volume of body fluidsbreaching the cutaneous barrier. Stringer et al, (2001). He further mentioned that thedonning of gloves may reduce the amount of solution introduced into the woundbecause the needle may lose half its volume on the glove surface. Occupationalexposures should be considered urgent medical events to ensure timelyadministration of post exposure prophylaxis. Unfortunately, some of the cleaners inTuanku Mizan Military Hospital do not report their injuries to their supervisors. It iseither because they do not know where to report or are just ignorant to the dangersof the injury and fear of disciplinary action for negligence on the part of thehealth care workers.
Sharps injuries are preventable and under the Occupational Safety and Health Act1994 (OSHA), employers, employees and self-employed persons have a duty to caretowards their own safety and health, and that of others in their workplace. The
Proceedings of the 1st Master Project Symposium on Occupational Safety and Health13-15th December 2016
43
cleaners working in a hospital environment are exposed to various sharp hazards.Some of these sharp objects may be contaminated and pose a serious threat to healthor even life. However, all sharp hazards, whether contaminated or not, need to giveserious attention and all cleaners must be made aware of such hazards and takeproactive actions to avoid injuries. All cleaners are given proper training before theyare employed at Tuanku Mizan Military Hospital. They are given a comprehensiveOccupational, Safety, Health and Environment training. Due to the so called humanfactor, the cleaners become complacent and from time to time they need to be madeaware of these hazards and ensure that they are always paying attention to theirsafety especially from sharp injuries. The purpose of this study is to investigate theunderstanding of sharp injury awareness among cleaners at Tuanku Mizan MilitaryHospital.
2.0 METHODOLOGY
Tuanku Mizan Military Hospital was selected as the area of research to perform thestudy and the target population is those who are prone to acquire Sharp Injury.Based on the demographic data obtained from the hospital, the categorization ofstaff is done. In this descriptive research questionnaire is used as the tool for datacollection; and 80 samples were selected by using probability samplingtechnique in which stratified simple random technique is used. A questionnairewas distributed among the cleaners. This was a descriptive cross sectional studydesign conducted by means of pretested, structured, self-administeredquestionnaires, focus group discussions, key informant interviews andobservation checklist.
In this study, Tuanku Mizan Military Hospital was taken for the study site and thecleaning workers at the hospital, being the study among the healthcare workers. Thestudy focused on the occupational risks of exposure to medical sharps, the frequencyand severity of the medical sharp injuries, the factors that contribute tothe occurrence of the medical sharp injuries and the measures the hospital has put inplace to control and manage the sharps injuries.The questionnaire addressed aspectsrelated to the research objective. The actual questionnaire that will be used in thisstudy consists a total of 26 questions which is divided into 5 parts (Part A, Part B,Part C, Part D & Part E) and content of open and closed ended question. Thequestionnaire is in two languages that is in English and Bahasa Melayu. The questionrevolved around:
Demography data Awareness on Needle prick/Sharp injury occurrence as occupational hazard Causes & determinants of needle prick/ Sharp injury Needle prick /sharps injury and related hazards. Preventive Measures on sharp Injury Hazards
Proceedings of the 1st Master Project Symposium on Occupational Safety and Health13-15th December 2016
44
3.0 RESULTS
A total of 76.6% of the cleaners had good knowledge status while 24.4% indicated apoor knowledge status. Table and Figure 4.1 showed that most of therespondents which were 63.8% (n=51) have working experience between eleven tofourteen years, followed by respondents who had worked less than one year, whichis 3.8% (n=3) also 26% (n=26) of respondents who worked for more than sixyears to ten years. The main respondents totalling 69 (86.2%) were female cleaners,while 11 (13.8%) were male. Most of the cleaners were educated up to SPMlevel. A total of 64 (80%) of the respondents worked for 5-8 hours daily. All the 80respondents have attended Safety induction and cleaning induction training duringtheir first day of work.The last part of respondents demographic data shows that outof the 80 respondents, 1 (1.2%) had been pricked and suffered needle prick orsharp injury.To assess the respondents’ current state of awareness, there are a totalof 3 items that needed to be answered. Seventy eight (97.5%) of the cleanersresponded that the type of sharp object that they handle during cleaning in their dailyjob were used needles.All the respondents are aware on the common diseasesassociated with the needle prick /sharp injury.
All the 80 respondents are aware of HIV/AIDS disease. As for Hepatitis (HBV) , 63(78.8%) respondents knew about this disease and 17 (21.2%) respondent did notknow about HBV disease. Similarly for for Hepatitis (HCV), 70 (87.5%)respondents knew about this disease and 10 (12.5%) respondent did not know aboutHCV disease. Most of the respondents 51 (63.8%) had attended their training within1 to 3 years ago and remainder respondents 29 (36.2%) r e p l i e d that they hadreceived t h e i r training 1 year ago.
The identification of the colour code of the sharp injury, in which all the 80respondents answered the yellow bin and this shows that the respondent is aware oftype of bins. There are three shifts; (Morning, Evening and Night) as shown in figure4.5. All the 80 respondents were involved in Shift works. Total of 20 (52%)respondents complained of sleep disturbance in the night due to extra shift work forovertime. Total 40 (42%) respondents had responded respectively that exhaustion innight (16), evening (12) & morning (12). Total of 17 (3%) had responded Generaldistress, respectively 15 in morning, 1 in night and 1 evening. All the 66 (82.5%)respondents had responded yes that they are aware of the risk from a sharp injury,especially needle prick and they are aware of the magnitude of the risk being high.Fourteen (17.5%) had responded that they are not aware of the risk of the sharpinjury. About 66% thought they were at risk of getting infected from sharp injuryduring daily cleaning work at the Hospital. The Needle prick is the highestpercentage of respondents 65% had responded. The most common work carried outis handling garbage sharp bin as responded. Following staff training programmeson injection and sharp safety was the common available measures (84%) taken by
Proceedings of the 1st Master Project Symposium on Occupational Safety and Health13-15th December 2016
45
the cleaners. Up to 86.3% of the injured respondents took immediate action aftersharp injury by cleaning the site with antiseptic.
4.0 DISCUSSION
In the present study, 82.5% cleaners knew that sharp injuries result in transmission ofblood- borne diseases through the passage of Hepatitis B virus (HBV), Hepatitis Cvirus (HCV) and HIV, the participants believed that Hepatitis B caries the greaterrisk of transmission. In general, the analysis of cleaners indicates that they have afairly good level of knowledge about needle stick injury. Regarding theawareness of cleaner’s management of sharp injury, the overall average percentageof correct answer was 1.6%. From the feedback from 80 respondents, 29/80 (56%)respondents believed that most of the injuries occurred during disposal a garbagebags. The study also showed that cuts from sharp objects and needle stick injurieswere high among cleaners. The overall awareness of cleaners is high as perknowledge management of needle stick. The result of this study shows two- third ofthe cleaners acquired good knowledge status on indication for sharp injury,however, one- third of the cleaners still needs to gain more information orknowledge about appropriate handling needles and sharps. Sharps injuries arepreventable and under the Occupational Safety and Health Act 1994 (OSHA),employers, employees and self-employed persons have a duty of care towardstheir own safety and health, and to that of others in their workplace. Therefore,comprehensive programs should be implemented to reduce these injuries.
The result may be due to the system of mentor mentee practices in Tuanku MizanHospital. Cleaners who have never attended any training on needle prick and sharpinjury awareness can learn from their supervisors who have attended training andmore knowledge in the prevent ion of needle stick and sharp injury. As aresponsible organization that is doing the cleaning services at Tuanku Mizan MilitaryHospital, the company is responsible to ensure the safety and health of its workerswho is doing the cleaning work. As the type of needle pricking effect is chronic, inthe short run the organization may not be dealing with a legal suit, however, in thelong run the organization may be responsible to deal with the problem raised
by the affected workers’ health of having HIV, Hepatitis B & C. Cleaning servicesbusiness in the hospital has a very stringent process in evaluating the Health,Safety and Environment (HSE) of any contractors providing a service in thissector. This becomes one of the critical evaluation criteria during the evaluationprocess. One fatality enough to make a company HSE performance merit behindthe competitors which will result to be disqualified in any bidding participated.During the work phase as stipulated in the HSE contract, the HSE requirement hasbeen put as the first priority before executing any job.
Proceedings of the 1st Master Project Symposium on Occupational Safety and Health13-15th December 2016
46
5.0 RECOMMENDATION
The cleaning agency which is doing cleaning at Tuanku Mizan Military Hospitalneed to review the effectiveness of the existing induction training conducted to theworkers. This includes the content, frequency of training and refresher course. Thecontent conducted should emphasize on a few of past accident cases and how thosecan be prevented if a few steps could have been taken. The workers should also beaware of their responsibility to take care of safety and this not lies on the safetyofficer at site. The frequency of training should be reviewed in term of the natureof the job involved by the workers and risk associated with it’s the nature of thecleaning hospital work, this task is conducted by trained cleaner worker; Cleaning aswith other areas of health and safety requires a good management system to:-helpidentify the problem area; aid decision making on what to do; how to act on thedecisions made; and to check that the steps taken have been effective. An effectivemanagement system should include: Procedures for maintenance of floors andequipment for guidance. Training and supervision to be given all new workers.To increase awareness among cleaners about importance of needle prick and sharpinjury, it is suggested cleaner to report any accidents or incidents to their supervisors.It is also good have review programs to validate the effectiveness of effectiveness ofcontrol programs put in place. The review programs generally will be conductedannually and after any accident/incident. This would be tool used by themanagement in displaying its commitment on safety and health. This will beundertaken after a proper investigation is done. The effectiveness will be measuredthough.
6.0 CONCLUSION
This study can be concluded that needle prick and sharp injuries are important andcontinuing cause of exposure to serious and fatal diseases among cleaners. Greatercollaborative efforts by all stake holder are needed to prevent needle stick and sharpinjuries as they can cause serious injuries.. This research was administered among 80cleaners who are doing cleaning work at cleaning the ICU, Morturery and Wards;therefore, one could argue that the findings are not necessarily a generalization of allcleaners’ level of awareness and knowledge about the same. There should becontinuing development and evaluation, proper method of needle devices have safetyfeatures and also proper method of disposing needle and sharps. Monitoring systemssuch as key performance index (KPI) are also needed to provide accurate informationon the magnitude of needle prick and sharp injuries and trends over time, potentialrisk factors, emerging new problems and effectiveness of interventions in allhealthcare settings. There should be an essential need for further continuoustraining and awareness to improve and update the knowledge of the needle prick andsharp injury. It is duty of the cleaning company management to host well designseminars for its supervisors, safe work method practices during cleaning and
Proceedings of the 1st Master Project Symposium on Occupational Safety and Health13-15th December 2016
47
disposal, clinical wastes and workshops for upper management staff to lead byexample and make sure safety of its cleaners during carry their daily workactivity in a hospital. It can be seen that even in the cleaning industry, though onthe surface it may seem an easy to handle industry, it certainly has its own hazardswhich can have direct consequences. The most important thing is to identify thesehazards and find ways and means to eliminate or control these hazards. The risksmust be assessed and appropriate control measures introduced. These controlmeasures must be constantly and continuously reviewed for their continuedeffectiveness. The top management must be fully committed in Safety & Healthand the workers to safeguard their own Safety & Health.
REFERENCES
[1] Pruss-Ustun A, Rapiti E, Hutin Y: Estimation of the global burden ofdiseaseattributable to contaminated sharps injuries among health-careworkers. Am JInd Med 2005, 8(6):482–490.
[2] National Institute for Occupational Safety and Health: NIOSH Alert:preventing needlestick injuries in health care settings [DHHS (NIOSH)Publication No. 2000–108]. Cincinnati, OH: U.S. Department of Health andHuman Services;1999.
[3] Ilyas M: Hospital and Biomedical Waste Management. Community Medicine&Public Health. 5th ed. Karachi: Time Publishers; 2000:621–623.
[4] Park K: Hospital Waste Management. Park’s Textbook of Preventive andSocialMedicine. 18th ed. India: BanarsidasBhanot; 2007:596.
[5] Yacoub R, Al Ali R, Moukeh G, Lahdo A, Mouhammad Y, Nasser M:Hepatitis B vaccination status and needlestick injuries among healthcareworkersin Syria. J Glob Infect Dis 2010, 2(1):28–34.
[6] Sharps injury information. [http://www.isips.org/sharps.shtml][7] Adams, D. Needlestick and sharps injuries: practiceupdate. Nursing Standard,
2012. 26(37), 49-57.[8] Azadi, A., Anoosheh, M., &Delpisheh, A. Frequencyand barriers of under
reported needlestick injuries amongstIranian nurses, a questionnairesurvey. Journal of Clinical Nursing, 2011. 20(3-4), 488-493
[9] Cho, E., Lee, H., Choi, M., Park, S. H., Yoo, I. Y., & Aiken, L.H. Factorsassociated with needlestick and sharpinjuries among hospital nurses: A cross-sectionalquestionnaire survey. International journal of nursing studies, 2013.50(8), 1025-1032.
[10] Elverson, C. A., &Samra, H. A. Overview ofStructure, Process, and Outcomeindicators of Quality in Neonatal Care, New born and Infant NursingReviews, 2012. 12(3),154-161.
[11] Hoffmann, C., Buchholz, L., & Schnitzler, P. Reduction of needle stickinjuries in healthcare personnel at university hospital using safety devices.
Proceedings of the 1st Master Project Symposium on Occupational Safety and Health13-15th December 2016
48
JOccup Med Toxicol, 2013. 8(8), 20.[12] Lee, J. J., Kok, S. H., Cheng, S. J., Lin, L. D., & Lin, C. P. Needle stick
and sharps injuries among dental health care workers at a universityhospital. Journal of the Formosan Medical Association, 2014. 113, 227-233.
[13] Ng YW, Hassim IN. Needle sticks injury among medical personnel inAccident and Emergency Department of two teaching hospitals. Med JMalaysia. 2007;62(1):9–12.
[14] Mehdi Jahangiri 1, Akbar Rostamabadi 2, Naser Hoboubi 3,*, Neda TadayonAli. Soleimani Needle Stick Injuries and their Related Safety Measuresamong Nurses in a University Hospital, Shiraz, Iran. March 2016 Volume 7,Issues 1, p1-88.
Proceedings of the 1st Master Project Symposium on Occupational Safety and Health13-15th December 2016
49
Health Impact of Long Hours Drivingon MINDEF Drivers
Audry Ramadass,a, Siti Zura A. Jalilb and Nelidya Md Yusoff c
UTM Razak School of Engineering and Advanced Technology, Universiti TeknologiMalaysia, 54100 Jalan Sultan Yahya Petra, Kuala Lumpur, Malaysia
[email protected] , b [email protected], c [email protected]
Abstract – This paper discusses the health impact of long hours driving on MalaysiaMinistry of Defence (MINDEF) driver. The work environment for the profession as militarydriver poses many challenges including driving long hours, often under tight workingschedules and all weather conditions. The majority of the driver face challenges such as longhours worked on the driving due to tight working schedules, and short-time spent at homethat can increase major health problems obesity, low work performance and life balance andalso workplace health injuries. The contributing factor of this parameter is tight workingschedule, repetition schedule, medical report, shortage number of driver, number ofaccident, high driver turnover. The questionnaire (statistical analysis) and interview(thematic analysis) techniques were applied in this study. The Pearson-correlationcoefficient was used for the analysis and the result shows that exercise, nutrition, stress,social relationship and family, ergonomic and workplace injuries attribute has a significantpositive relationship with long hours driving health impact to MINDEF Driver. Therefore,Malaysia Armed Forces should be included fitness to drive policies in the organizationoverall Occupational Health Policy. The interaction of the nature of military driver and tightworking schedule, long hours driving and health impact are presented as well in this study.
Keywords: Long Hours Driving, Obesity, Workplace Injury, Work and Life Balance, Health Impact,Transportation.
1.0 INTRODUCTION
Health problem due long hours driving is common phenomena, especially in thetransportation sector. In response to this issue, Occupational Safety and Health Act1994 Section 17 (1) have the principal objective of providing for the prevention ofharm to employees at work. The requirement of long hours driving schedule ofmilitary drivers in MINDEF makes difficult for the drivers to obtain a good qualityof life and health care. The immediate result of long working hours is fatigue, whichwill affect individual productivity and quality assessment.
The concept of fatigue is difficult to define and measure, however it generally couldbe determined by self-report [1]. Generally, the correlation technique is applied for
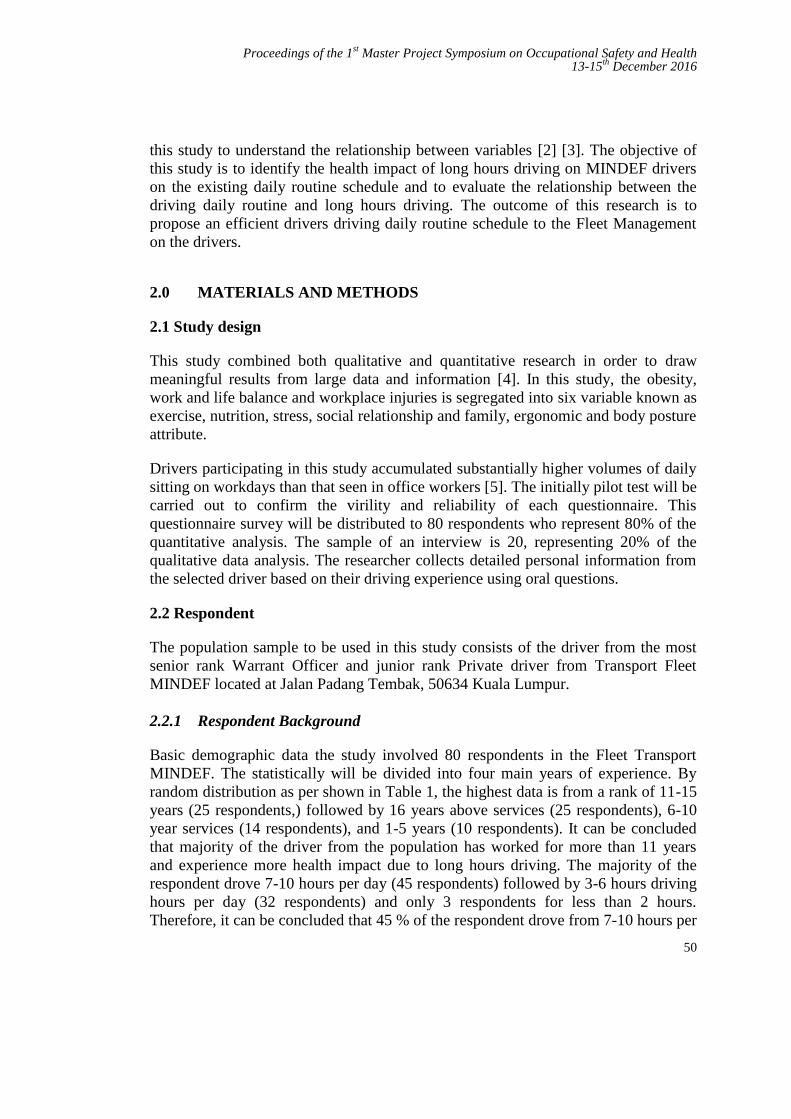
Proceedings of the 1st Master Project Symposium on Occupational Safety and Health13-15th December 2016
50
this study to understand the relationship between variables [2] [3]. The objective ofthis study is to identify the health impact of long hours driving on MINDEF driverson the existing daily routine schedule and to evaluate the relationship between thedriving daily routine and long hours driving. The outcome of this research is topropose an efficient drivers driving daily routine schedule to the Fleet Managementon the drivers.
2.0 MATERIALS AND METHODS
2.1 Study design
This study combined both qualitative and quantitative research in order to drawmeaningful results from large data and information [4]. In this study, the obesity,work and life balance and workplace injuries is segregated into six variable known asexercise, nutrition, stress, social relationship and family, ergonomic and body postureattribute.
Drivers participating in this study accumulated substantially higher volumes of dailysitting on workdays than that seen in office workers [5]. The initially pilot test will becarried out to confirm the virility and reliability of each questionnaire. Thisquestionnaire survey will be distributed to 80 respondents who represent 80% of thequantitative analysis. The sample of an interview is 20, representing 20% of thequalitative data analysis. The researcher collects detailed personal information fromthe selected driver based on their driving experience using oral questions.
2.2 Respondent
The population sample to be used in this study consists of the driver from the mostsenior rank Warrant Officer and junior rank Private driver from Transport FleetMINDEF located at Jalan Padang Tembak, 50634 Kuala Lumpur.
2.2.1 Respondent Background
Basic demographic data the study involved 80 respondents in the Fleet TransportMINDEF. The statistically will be divided into four main years of experience. Byrandom distribution as per shown in Table 1, the highest data is from a rank of 11-15years (25 respondents,) followed by 16 years above services (25 respondents), 6-10year services (14 respondents), and 1-5 years (10 respondents). It can be concludedthat majority of the driver from the population has worked for more than 11 yearsand experience more health impact due to long hours driving. The majority of therespondent drove 7-10 hours per day (45 respondents) followed by 3-6 hours drivinghours per day (32 respondents) and only 3 respondents for less than 2 hours.Therefore, it can be concluded that 45 % of the respondent drove from 7-10 hours per
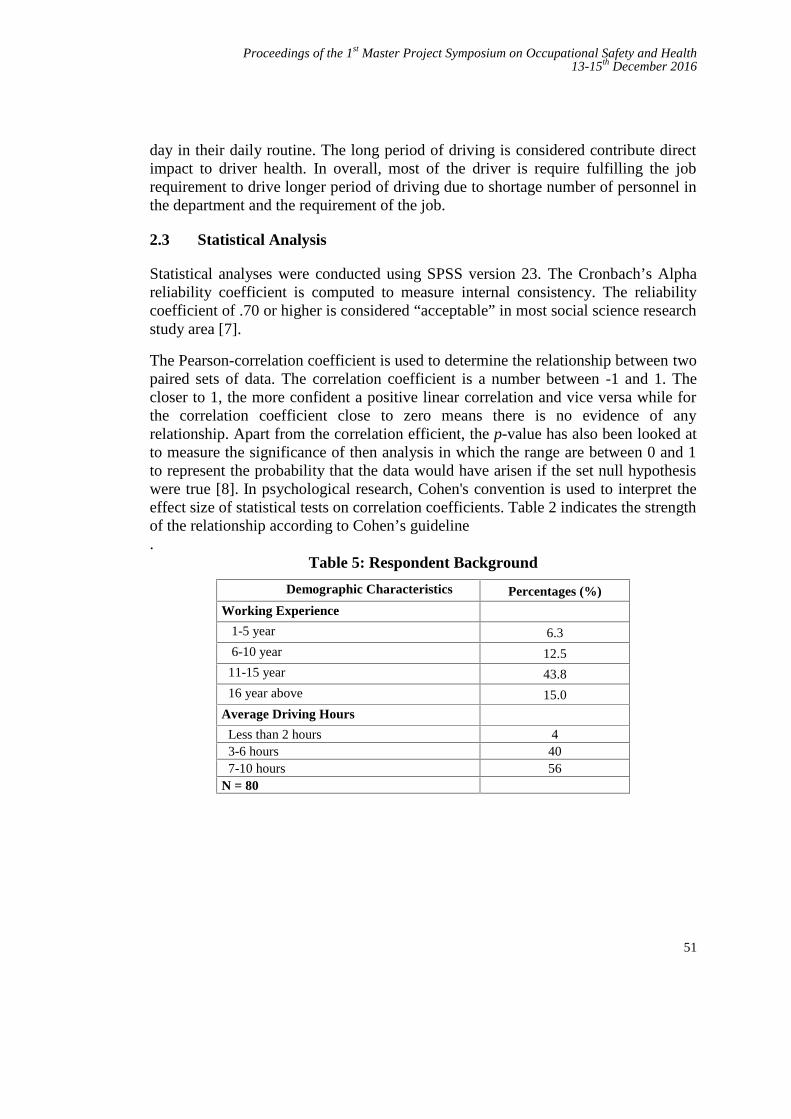
Proceedings of the 1st Master Project Symposium on Occupational Safety and Health13-15th December 2016
51
day in their daily routine. The long period of driving is considered contribute directimpact to driver health. In overall, most of the driver is require fulfilling the jobrequirement to drive longer period of driving due to shortage number of personnel inthe department and the requirement of the job.
2.3 Statistical Analysis
Statistical analyses were conducted using SPSS version 23. The Cronbach’s Alphareliability coefficient is computed to measure internal consistency. The reliabilitycoefficient of .70 or higher is considered “acceptable” in most social science researchstudy area [7].
The Pearson-correlation coefficient is used to determine the relationship between twopaired sets of data. The correlation coefficient is a number between -1 and 1. Thecloser to 1, the more confident a positive linear correlation and vice versa while forthe correlation coefficient close to zero means there is no evidence of anyrelationship. Apart from the correlation efficient, the p-value has also been looked atto measure the significance of then analysis in which the range are between 0 and 1to represent the probability that the data would have arisen if the set null hypothesiswere true [8]. In psychological research, Cohen's convention is used to interpret theeffect size of statistical tests on correlation coefficients. Table 2 indicates the strengthof the relationship according to Cohen’s guideline.
Table 5: Respondent Background
Demographic Characteristics Percentages (%)
Working Experience
1-5 year 6.3
6-10 year 12.5
11-15 year 43.8
16 year above 15.0
Average Driving Hours
Less than 2 hours 43-6 hours 407-10 hours 56
N = 80

Proceedings of the 1st Master Project Symposium on Occupational Safety and Health13-15th December 2016
52
Table 5: Cohen’s Guidelines
Effect Size Cohen
.10 Small
.30 Moderate
.50 Large
2.4 Thematic Analysis
Thematic analysis can be described as an independent qualitative descriptive method.The thematic analysis assists the researcher for recognizing, analyzing and reportingpatterns (themes) information collected [6]. The feedback from the respondent willbe studied and categorized according to the three main themes. The group of driverswas interview face to face to gather opinions and information on their previousexperience long hours driving impact on their health. The three main themes asfollows:
i. Themes 1 : Obesity.ii. Themes 2 : Work and Life Balance.
iii. Themes 3 : Workplace Injuries.
3.0 RESULTS AND DISCUSSION
The relationship between six variables of exercise, nutrition, stress, socialrelationship and family, ergonomic and body posture with long hours driving isstudied using correlation analysis. Prior to correlation analysis, the Cronbach’s Alphareliability coefficient is computed and found as .843, suggesting relatively highinternal consistency. The strong outcome of Cronbach Alpha indicates a significantresult of correlation.
According to Cohen’s Guidelines in Table 2, the correlation test for all six variablesof exercise, nutrition, stress, social relationship and family, ergonomic and bodyposture attribute are positive. Figure 1 shows the correlation results. It is found thatthe stress has a highest relationship to long hours driving (r = .800). The result showsthat majority of the driver feel sleepy or drowsy during driving because of non-adequate amount of sleeping hour every night. They drive more than 8 hours daily,sometimes without break and with additional of pressure due to the road trafficcondition. Previous study shows that stress was rated as the third most importanthealth risk factor among drivers [9]. Driver has been deployed 24 hours and assignedfor the same task could cause stress among them.
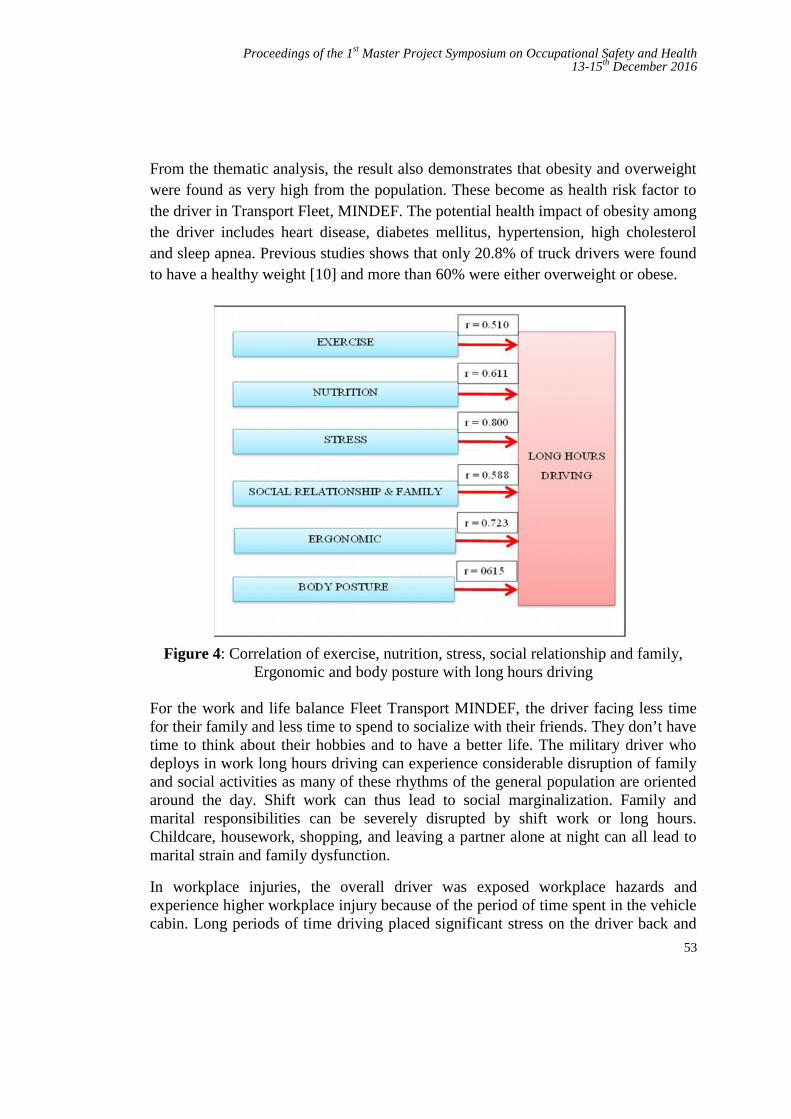
Proceedings of the 1st Master Project Symposium on Occupational Safety and Health13-15th December 2016
53
From the thematic analysis, the result also demonstrates that obesity and overweightwere found as very high from the population. These become as health risk factor tothe driver in Transport Fleet, MINDEF. The potential health impact of obesity amongthe driver includes heart disease, diabetes mellitus, hypertension, high cholesteroland sleep apnea. Previous studies shows that only 20.8% of truck drivers were foundto have a healthy weight [10] and more than 60% were either overweight or obese.
Figure 4: Correlation of exercise, nutrition, stress, social relationship and family,Ergonomic and body posture with long hours driving
For the work and life balance Fleet Transport MINDEF, the driver facing less timefor their family and less time to spend to socialize with their friends. They don’t havetime to think about their hobbies and to have a better life. The military driver whodeploys in work long hours driving can experience considerable disruption of familyand social activities as many of these rhythms of the general population are orientedaround the day. Shift work can thus lead to social marginalization. Family andmarital responsibilities can be severely disrupted by shift work or long hours.Childcare, housework, shopping, and leaving a partner alone at night can all lead tomarital strain and family dysfunction.
In workplace injuries, the overall driver was exposed workplace hazards andexperience higher workplace injury because of the period of time spent in the vehiclecabin. Long periods of time driving placed significant stress on the driver back and
Proceedings of the 1st Master Project Symposium on Occupational Safety and Health13-15th December 2016
54
neck where the driver need to focus on the driving. In addition, the findings of thisstudy suggest that factor leading to whole body vibration, back pain, upperextremities, arms and knees pain. The driver accumulated a substantially highervolume of daily sitting on daily routine compared to office workers [11]. Thesefindings show that the impact of long hours driving on the driver has largely beenoverlooked by the Fleet management. Therefore, Malaysia Armed Forces should beincluded fitness to drive policies in the organization overall Occupational HealthPolicy.
4.0 CONCLUSION
This study highlighted the health impact of long hours driving. A significantly highcorrelation is shown on exercise, nutrition, stress, social relationship and family,ergonomic and workplace injuries with long hours driving health impact to MINDEFdriver. This shows a clear relationship between long hours driving and driver healthespecially in the transportation fields. The findings indicate that obesity, work andlife balance and workplace injuries will lead to lack of safety aspect and may causean accident. The profession as military driver can be described as a most high riskjob where most of the driver experience health problem due to the work culture. Therequirement to fulfill the working schedules and workloads pressure make the driverdifficult to gained better health quality. As the stress shows a highest correlation,further studies are needed to assess the impact of stress on driver safety.
REFERENCES
[1] Anne Spurgeon, J. M. H., Cary L Cooper. Health And Safety ProblemsAssociated With Long Working Hours: A Review Of The Current Position.1997.
[2] Sparks, K., Cooper, C., Fried, Y., & Shirom, A. The effects of hours of workon health: a meta‐analytic review. Journal of occupational andorganizational psychology, 1997. 70(4), 391-408.
[3] Faragher, E. B., Cass, M., & Cooper, C. L. The Relationship Between JobSatisfaction and Health: A Meta-Analysis. Occupational andEnvironmental Medicine, 2005 .62(2), 105-112.
[4] Diane P.Keating, B. S. T. H.. The Development Survey Methodology. 2010[5] Morris, J. N., & Crawford, M. D. Coronary heart disease and physical activity
of work. British Medical Journal, 1958. 2(5111), 1485.[6] Vaismoradi, M., Turunen, H., & Bondas, T. Content Analysis and Thematic
Analysis: Implications For Conducting A Qualitative Descriptive Study.Nursing & Health Sciences, 2013. 15(3), 398-405.
[7] Gliem, R. R., & Gliem, J. A. Calculating, Interpreting, And ReportingCronbach’s Alpha Reliability Coefficient For Likert-Type Scales. 2003.
Proceedings of the 1st Master Project Symposium on Occupational Safety and Health13-15th December 2016
55
[8] Fenton, N., & Neil, M. Risk Assessment and Decision Analysis With BayesianNetworks: CRC Press. 2012.
[9] Krueger, G. P., Belzer, M., Alvarez, A., Knipling, R., Husting, E., Brewster,R., & Siebert, J.. Health and Wellness Of Commercial Drivers. The DomainOf Truck And Bus Safety Research, 2007 117, 58-91.
[10] Sangaleti, C. T., Trincaus, M. R., Baratieri, T., Zarowy, K., Ladika, M. B.,Menon, M. U., Bortolotto, L. A. Prevalence Of Cardiovascular Risk FactorsAmong Truck Drivers In The South Of Brazil. BMC Public Health,2014.14(1), 1.
[11] Smith, L., Hamer, M., Ucci, M., Marmot, A., Gardner, B., Sawyer, A., Fisher,A. Weekday and weekend patterns of objectively measured sitting, standing,and stepping in a sample of office-based workers: The Active BuildingsStudy. BMC Public Health, 2015.15(1), 1.
Proceedings of the 1st Master Project Symposium on Occupational Safety and Health13-15th December 2016
56
Prevalence of Computer Visual Syndromeamong Employee in Malaysian Software
Testing Board
Farah Bazilah Baidilleha and Shamsul Saripb
UTM Razak School of Engineering and Advanced Technology, Universiti TeknologiMalaysia, 54100 Jalan Sutan Yahya Petra, Kuala Lumpur, Malaysia
[email protected], [email protected]
Abstract – The expanding use of visual display terminal (VDT) unit has raise a concerningissues on the potential health effects. Major issues related to the VDT includes the effect ofprolonged visual interaction with display content in terms of eye and other muscular fatigueand deterioration that emanates from VDTs. The study revealed the most prevalencesymptoms was found to be neck, back and shoulder pain followed by eye strain, glare lightsensitivity, overall bodily fatigue or tiredness, dry or watery eyes, headache during or afterworking at the computer, night vision worsen after computer use, difficulty focusing (far tonear), blurred near vision, burning eyes, burning, itching or red eyes (distant to nearand back), ‘halos’ appear around object on the computer screen and double vision. Onaverage, 72% of respondents spending 5 to 8 hours on computer at work and almost 90% ofthem are having uninterrupted use of computer for more than one hour. However, ongeneral, most of respondents takes breaks every 1 to 2 hours (83%). Therefore, basedon the response on action taken to overcome the symptoms experienced, indicates thatthey do practiced all of the actions that may help in reducing the CVS. Yet considering thelack of awareness among majority of the respondents age ranging between 25 to 36years, it can be concluded that much emphasis is required to expose them to the risk ofCVS and steps in reducing the risk. It is suggested to integrate the existing action andprecautions with current developing technologies such as the implementation of automaticcomputer use break system and a schedule stretching reminder on computer apart fromhaving the workspace area to be redesign.
Keywords: Computer Visual Syndrome, Visual Display Terminal Unit, Software Professionals, VisualFatigue
1.0 INTRODUCTION
Around 45 to 70 million people spend lots of time facing the VDT unit on a dailybasis. VDT unit also known as computer screen has become common in today’ssociety. However, over the time, studies have found there are several health relatedsymptoms associated with the use of computers [1]. Million new cases of people
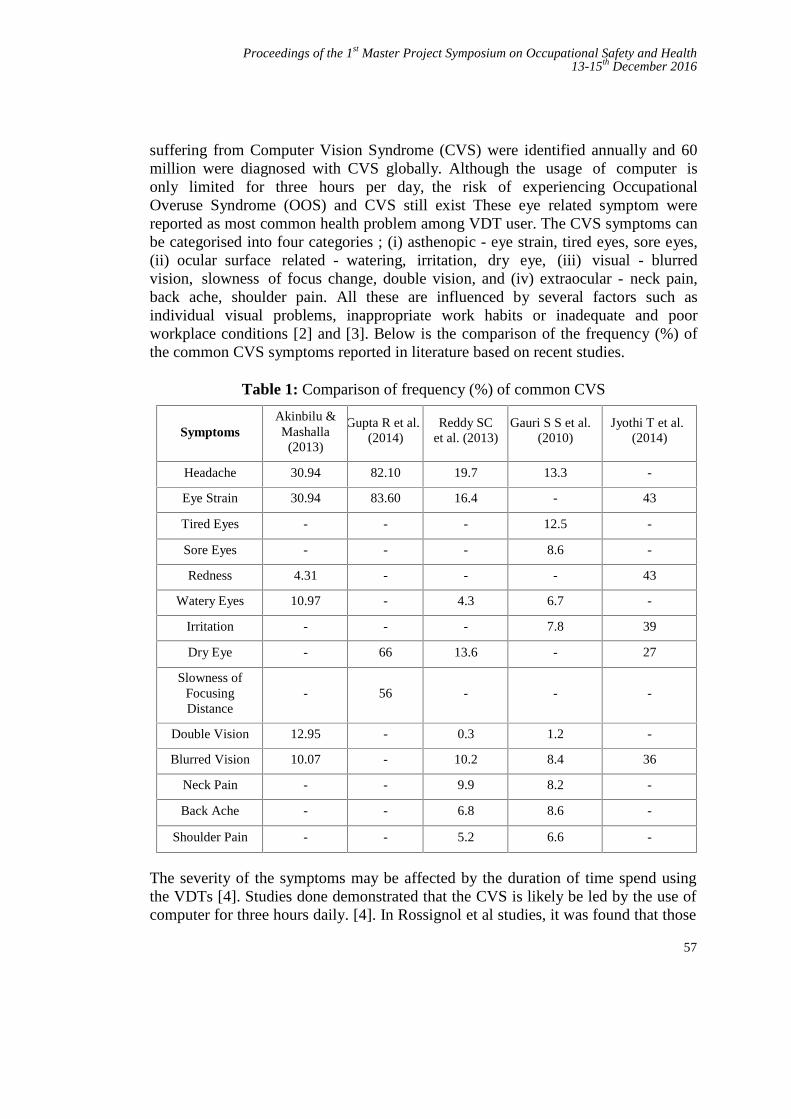
Proceedings of the 1st Master Project Symposium on Occupational Safety and Health13-15th December 2016
57
suffering from Computer Vision Syndrome (CVS) were identified annually and 60million were diagnosed with CVS globally. Although the usage of computer isonly limited for three hours per day, the risk of experiencing OccupationalOveruse Syndrome (OOS) and CVS still exist These eye related symptom werereported as most common health problem among VDT user. The CVS symptoms canbe categorised into four categories ; (i) asthenopic - eye strain, tired eyes, sore eyes,(ii) ocular surface related - watering, irritation, dry eye, (iii) visual - blurredvision, slowness of focus change, double vision, and (iv) extraocular - neck pain,back ache, shoulder pain. All these are influenced by several factors such asindividual visual problems, inappropriate work habits or inadequate and poorworkplace conditions [2] and [3]. Below is the comparison of the frequency (%) ofthe common CVS symptoms reported in literature based on recent studies.
Table 1: Comparison of frequency (%) of common CVS
SymptomsAkinbilu &Mashalla
(2013)
Gupta R et al.(2014)
Reddy SCet al. (2013)
Gauri S S et al.(2010)
Jyothi T et al.(2014)
Headache 30.94 82.10 19.7 13.3 -
Eye Strain 30.94 83.60 16.4 - 43
Tired Eyes - - - 12.5 -
Sore Eyes - - - 8.6 -
Redness 4.31 - - - 43
Watery Eyes 10.97 - 4.3 6.7 -
Irritation - - - 7.8 39
Dry Eye - 66 13.6 - 27
Slowness ofFocusingDistance
- 56 - - -
Double Vision 12.95 - 0.3 1.2 -
Blurred Vision 10.07 - 10.2 8.4 36
Neck Pain - - 9.9 8.2 -
Back Ache - - 6.8 8.6 -
Shoulder Pain - - 5.2 6.6 -
The severity of the symptoms may be affected by the duration of time spend usingthe VDTs [4]. Studies done demonstrated that the CVS is likely be led by the use ofcomputer for three hours daily. [4]. In Rossignol et al studies, it was found that those
Proceedings of the 1st Master Project Symposium on Occupational Safety and Health13-15th December 2016
58
spending time more than four hours daily working on VDT are more prevalent ofCVS. Complaints on eyestrain and sore eyes are the most common [5].
Stella et al and Cole in their studies concluded that the screen contrast, duration ofwork in front of computers, computer work place illumination, viewing distance andangles, reflection on screen and workplace ergonomics have significant effect incausal of CVS symptoms to VDT user [6]. The improper eye level betweencomputer screen and VDT users have influence a complaints on asthenopia alsoknown as eye strain [7]. Reddy SC et al. study agreed to the importance of having aproper eye level in between computer screen and VDT users since they found thesignificant there was significant reduction in symptoms of CVS between studentswho viewed the computer screen below eye level than those who viewed the screenat or above the eye level [8].
2.0 METHODOLOGY
2.1 Materials and Method
The strategy chosen to integrate different component in this research scope is byidentifying the relation between the CVS at MSTB. This is to ensure the researchproblem is address effectively. Essentially, the design is done by developingunderstanding of the prevalence of the CVS among software professionals andpreparing plan for some intervention process. This research will be conductedquantitatively whereby data from survey will be collected. Through surveyconducted, the questions will reflect the prevalence of the CVS apart from obtainingthe respondents awareness on the health problem faced by them as consequences ofprolong exposure of VDT unit. This quantitative method is chosen to collect data dueto its flexibility to gain result regardless differences in demographics background.
2.1.1 Population and sample
The study population included both male and female adults (18 to 60 years)working at MSTB. Based on Sample Size Determination Using Krejcie and MorganTable, the research will be conducted to 44 people. They are consists of employee inProject and Operations group, Internal Technical Group, Finance and Admin,Quality Assurance and Capability Development. The questionnaires will bedistributed to all targeted respondents whereby all of them works on a normalworking hours and roughly spend time in front of the VDT not less than 5 hoursper day. A pilot study was conducted among 20 of the sample population and thequestionnaire will be edited for easy understanding by the respondents for realsurvey to be conducted.
Proceedings of the 1st Master Project Symposium on Occupational Safety and Health13-15th December 2016
59
2.1.2 Questionnaires
A structured questionnaire was developed. Questions on symptoms of CVS wereadapted from a previous study done by Gangamma et al. This is to ensure all thecritical area to be considered in order to get the right answer for issue is capturedduring the survey such as presence of pain in and around the eyes, headache, blurrednear vision, blurred distant vision, dry eyes, sore/irritated eyes, red eyes, excessivetearing, double vision, symptoms of CVS. The questionnaires were structured into 3different parts as follow;
i. Part 1 – Sociodemographic demographic data of respondents (Age, Gender,Role), Occupational history (Duration of employments, working hours)
ii. Part 2 –Effects of prolongs exposure towards VDT unit and improperworking conditions. (Symptoms of visual problem, duration of computer use)
iii. Part 3 – Awareness on the importance of ergonomics workingenvironment and perspective on managing the risk of CVS
The symptom scores were ranked on intensity rating as 0 = none or asymptomatic, 1= very mild, 2 = mild, 3 = moderate, 4 = intense, and 5 = very intense. Thesubjects were asked to state the occurrence of symptom and specify the hours atwhich they did VDT work, performed other work, or took breaks. Symptoms wereentered in to statistical analysis using this intensity rating scale.
2.1.3 Data Analysis
Data was analyzed using Statistical Package for Social Science (SPSS) Software,version 20. Descriptive data were presented as percentage, frequency or as mean ±deviations. Significance of association was tested using Chi square for categoricalvariables and t-test for continuous variables.
3.0 RESULTS AND DISCUSSION
The strategy chosen to integrate different component in this research scope is byidentifying the relation between the CVS at MSTB. A total of 44 respondentsconsisting of 22 males and 22 females participated in the survey conducted for thisstudy. Most of the respondents were from the group age of 26 to 35 years. Thestudy reveals quite a low level of awareness of CVS whereby only 31% of therespondents are aware of the term CVS itself despite of all of them experiencingmost of the CVS symptoms. The most common symptoms recorded was neck, backand shoulder pain with a mean of 3.64 followed by eye strain (3.45), glare lightsensitivity (3.54), Overall bodily fatigue or tiredness (3.41), Dry or watery eyes(3.14), Headache during or after working at the computer (3.11), Night visionworsen after computer use (3.02), Difficulty focusing (far to near) (2.61), Blurred
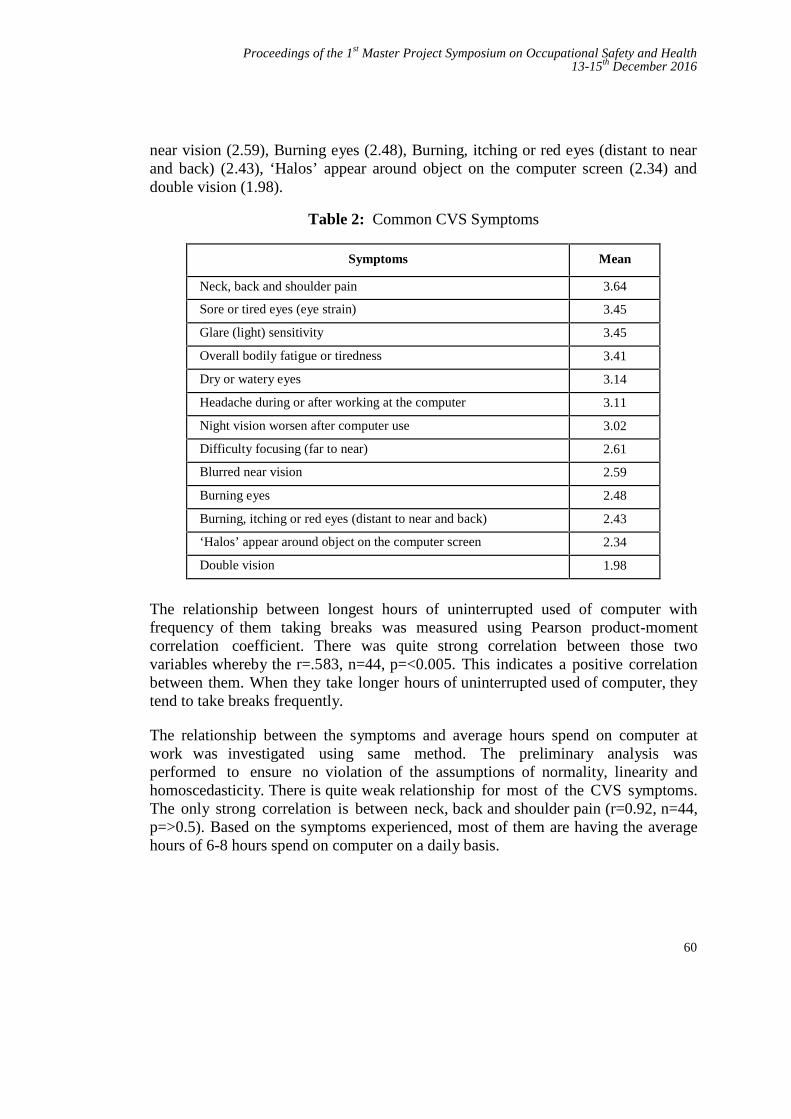
Proceedings of the 1st Master Project Symposium on Occupational Safety and Health13-15th December 2016
60
near vision (2.59), Burning eyes (2.48), Burning, itching or red eyes (distant to nearand back) (2.43), ‘Halos’ appear around object on the computer screen (2.34) anddouble vision (1.98).
Table 2: Common CVS Symptoms
Symptoms Mean
Neck, back and shoulder pain 3.64
Sore or tired eyes (eye strain) 3.45
Glare (light) sensitivity 3.45
Overall bodily fatigue or tiredness 3.41
Dry or watery eyes 3.14
Headache during or after working at the computer 3.11
Night vision worsen after computer use 3.02
Difficulty focusing (far to near) 2.61
Blurred near vision 2.59
Burning eyes 2.48
Burning, itching or red eyes (distant to near and back) 2.43
‘Halos’ appear around object on the computer screen 2.34
Double vision 1.98
The relationship between longest hours of uninterrupted used of computer withfrequency of them taking breaks was measured using Pearson product-momentcorrelation coefficient. There was quite strong correlation between those twovariables whereby the r=.583, n=44, p=<0.005. This indicates a positive correlationbetween them. When they take longer hours of uninterrupted used of computer, theytend to take breaks frequently.
The relationship between the symptoms and average hours spend on computer atwork was investigated using same method. The preliminary analysis wasperformed to ensure no violation of the assumptions of normality, linearity andhomoscedasticity. There is quite weak relationship for most of the CVS symptoms.The only strong correlation is between neck, back and shoulder pain (r=0.92, n=44,p=>0.5). Based on the symptoms experienced, most of them are having the averagehours of 6-8 hours spend on computer on a daily basis.
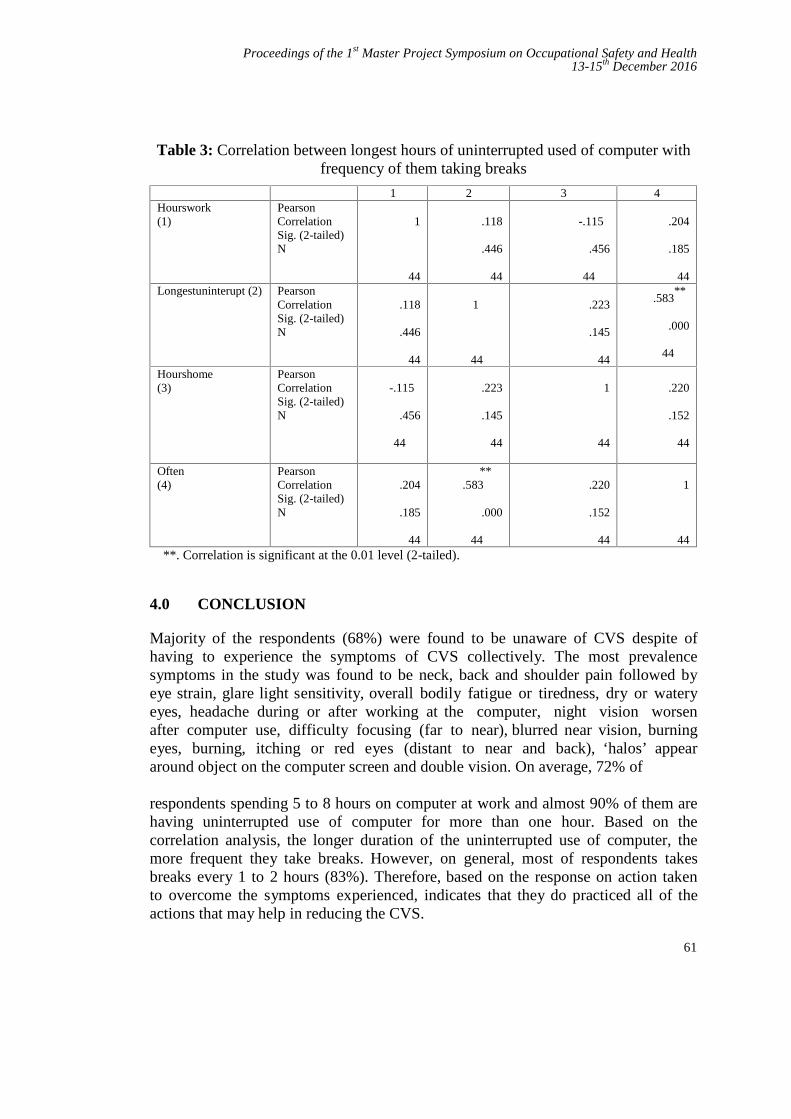
Proceedings of the 1st Master Project Symposium on Occupational Safety and Health13-15th December 2016
61
Table 3: Correlation between longest hours of uninterrupted used of computer withfrequency of them taking breaks
1 2 3 4Hourswork(1)
PearsonCorrelationSig. (2-tailed)N
1
44
.118
.446
44
-.115
.456
44
.204
.185
44Longestuninterupt (2) Pearson
CorrelationSig. (2-tailed)N
.118
.446
44
1
44
.223
.145
44
.583**
.000
44
Hourshome(3)
PearsonCorrelationSig. (2-tailed)N
-.115
.456
44
.223
.145
44
1
44
.220
.152
44
Often(4)
PearsonCorrelationSig. (2-tailed)N
.204
.185
44
**.583
.000
44
.220
.152
44
1
44**. Correlation is significant at the 0.01 level (2-tailed).
4.0 CONCLUSION
Majority of the respondents (68%) were found to be unaware of CVS despite ofhaving to experience the symptoms of CVS collectively. The most prevalencesymptoms in the study was found to be neck, back and shoulder pain followed byeye strain, glare light sensitivity, overall bodily fatigue or tiredness, dry or wateryeyes, headache during or after working at the computer, night vision worsenafter computer use, difficulty focusing (far to near), blurred near vision, burningeyes, burning, itching or red eyes (distant to near and back), ‘halos’ appeararound object on the computer screen and double vision. On average, 72% of
respondents spending 5 to 8 hours on computer at work and almost 90% of them arehaving uninterrupted use of computer for more than one hour. Based on thecorrelation analysis, the longer duration of the uninterrupted use of computer, themore frequent they take breaks. However, on general, most of respondents takesbreaks every 1 to 2 hours (83%). Therefore, based on the response on action takento overcome the symptoms experienced, indicates that they do practiced all of theactions that may help in reducing the CVS.
Proceedings of the 1st Master Project Symposium on Occupational Safety and Health13-15th December 2016
62
REFERENCES
[1] J., Akinbinu T. R. and Mashalla Y. Impact of computer technology onhealth: Computer Vision Syndrome (CVS). Medical Practice andReview, Vol. 5(3). 2014. doi:10.5897/mpr.2014.0121
[2] F Mocci, A Serra, G A Corrias. Psychological factors and visual fatigue inworking with video display terminals. Occup Environ Med. 2001.
[3] Courtin, R., Pereira, B., Naughton, G., Chamoux, A., Chiambaretta, F.,Lanhers, C., & Dutheil, F. Prevalence of dry eye disease in visual displayterminal workers: a systematic review and meta-analysis. BMJOpen, 2016. 6(1), e009675. doi: 10.1136/bmjopen-2015-009675
[4] Bali, Jatinder, Neeraj, Naveen, & Bali, RenuThakur. Computer visionsyndrome: A review. Journal of Clinical Ophthalmology and Research,2014. 2(1), 61. doi: 10.4103/2320-3897.122661
[5] Mark Rosenfi eld, Regina Gurevich, Elizabeth Wickware, Marc Lay,Computer Vision Syndrome: Accomodative & Vergence Facility.Journal of Behavioural Opthamology. 2010.
[6] Stella C. Chiemeke Member, IAENG, Allen E. Akhahowa and Olajire B.Ajayi. Evaluation of Vision-Related Problems amongst Computer Users:A Case Study of University of Benin, Nigeria. Proceedings of the WorldCongress on Engineering 2007
[7] Helland, M., Horgen, G., Kvikstad, T. M., Garthus, T., & Aaras, A. Willmusculoskeletal, visual and psychosocial stress change for visual display unit(VDU) operators when moving from a single-occupancy office to an officelandscape? Int J Occup Saf Ergon, 2008. 14(3), 259-274. doi:10.1080/10803548.2008.11076765
[8] Reddy SC, Low CK, Lim YP, Low LL, Mardina F, Nursaleha MP. Computervision syndrome: a study of knowledge and practices in university students.Nepal J Ophthalmol, 2013. 5
Proceedings of the 1st Master Project Symposium on Occupational Safety and Health13-15th December 2016
63
Occupational Safety Training Framework forIlliterate Migrant Working at Construction
SiteFelicia Motiboia and Morina Abdullahb
UTM Razak School of Engineering and Advanced Technology, Universiti TeknologiMalaysia, 54100 Jalan Sultan Yahya Petra, Kuala Lumpur, Malaysia
[email protected], [email protected]
Abstract –The number of illiterate migrant workers in Malaysia is increasing by numbersand this offer challenges to construction industry. Unable to understand the safe workprocedures can cause unwanted incident. The major factor of this problem is that theseworkers did not receive the appropriate training in order for them to perform their worksafely. Occupational safety training is important to help them understand standard operatingprocedures, potential hazards, appropriate protective measures and proper responses tounplanned, and undesired events. The objectives of this study is to investigate the issuesamong the construction site workers for not compliance to the safety procedures; to identifywhat is the weaknesses in the existing safety training and to propose the safety trainingframework for the site workers in the construction industry. Data collection of study is basedon quantitative method such as close ended format questionnaires. This study providesenhancement in occupational safety training framework to illiterate workers.
Keywords: Construction Industry, Occupational Safety Training, Civil and Structure, IlliterateMigrant Worker
1.0 INTRODUCTION
In Malaysia, construction industry plays important role in the development of acountry and also a career opportunity for the people. However, construction industrycontributes to the highest fatality of construction worker which is recorded byDepartment of Occupational Safety and Health, compare to other sector [1]. Lack ofknowledge, training, and supervision can cause accident at the workplace due to theerror of judgement and carelessness during perform work task [2]. The number ofilliterate migrant workers in the construction industry faced challenges such asincrease in work related injuries and fatalities [3]. The factor of work injuries is dueto lack of understanding of the training given to them for example recognise the

Proceedings of the 1st Master Project Symposium on Occupational Safety and Health13-15th December 2016
64
safety and health signage(s) [4]. This is where, education and training has asignificant role to the attitude of occupational safety.
In Malaysia, increasing numbers of migrant workers is caused by shortage of labourand poor participation from local people. Therefore, the construction industry has todepend on foreign manpower to meet the demand of the country. Foreign labourswho came to work here, did not attend formal training when they arrived in Malaysiaand this is another factor that contributes to accidents on site [5]. Common safetyproblems at the most construction site are often related to less training of the job task.Studies showed that workers who lacked opportunities to receive relevant traininghad limited knowledge of occupational safety [10] and will not comply to worksafety. Effective training involves changing perception, attitudes, and behaviours andconsequently the way people conduct themselves at work [11]. In conducting thetraining for the workers, consideration must be made such as the content of learning,the goal of learning, the methods and location of learning and the subsequentcertification processes [12]. Effective safety training can lower accident rates, butthere are several challenges associated with safety training that need to be overcomeby construction companies. The major challenge is the language barrier experiencedby non-English speaking workers which lead to not fully understand the trainingprocedures given to them[13].
2.0 METHODOLOGY
The research is based on quantitative research. Questionnaires are conducted at theworking site. The target populations are the site workers at the civil construction sitewith the total number196 site workers.
2.1 Data Collection
The constructed questionnaires questions are distributed to the targeted group (civil& structure workers). The respondents are assisted by the foreman and supervisor intranslating the questionnaires especially to the illiterate workers.
2.2 Instrument and Data Analysis
The survey questionnaires include Bipolar, Dichotomous, Likert and Rating Scalequestions especially for the closed ended questions. To maximise the understandingof respondents the survey was intentionally kept brief and simple.
2.2.1 Descriptive analysisSPSS software was applied in determining the number of demographic data about theworkers. All analysis is descriptive (mode/mean/frequency).
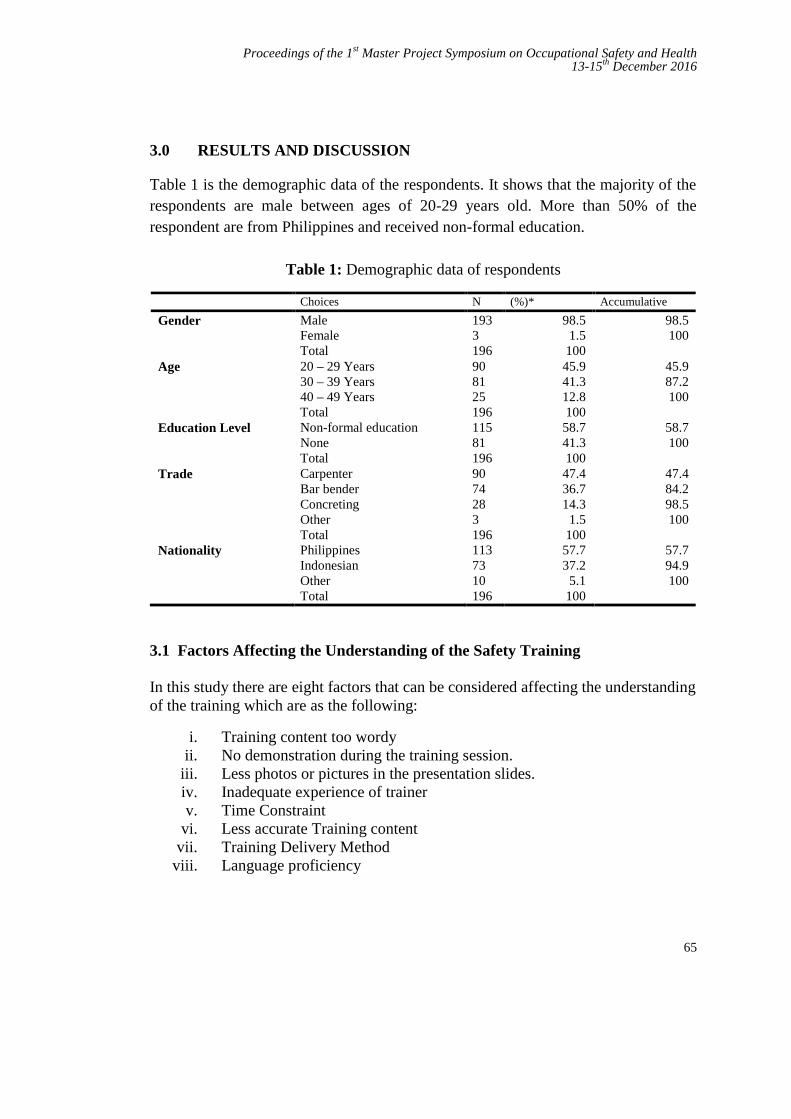
Proceedings of the 1st Master Project Symposium on Occupational Safety and Health13-15th December 2016
65
3.0 RESULTS AND DISCUSSION
Table 1 is the demographic data of the respondents. It shows that the majority of therespondents are male between ages of 20-29 years old. More than 50% of therespondent are from Philippines and received non-formal education.
Table 1: Demographic data of respondents
Choices N (%)* Accumulative
Gender MaleFemaleTotal
1933196
98.51.5
100
98.5100
Age 20 – 29 Years30 – 39 Years40 – 49 YearsTotal
908125196
45.941.312.8100
45.987.2100
Education Level Non-formal educationNoneTotal
11581196
58.741.3100
58.7100
Trade CarpenterBar benderConcretingOtherTotal
9074283196
47.436.714.3
1.5100
47.484.298.5100
Nationality PhilippinesIndonesianOtherTotal
1137310196
57.737.2
5.1100
57.794.9100
3.1 Factors Affecting the Understanding of the Safety Training
In this study there are eight factors that can be considered affecting the understandingof the training which are as the following:
i. Training content too wordyii. No demonstration during the training session.
iii. Less photos or pictures in the presentation slides.iv. Inadequate experience of trainerv. Time Constraint
vi. Less accurate Training contentvii. Training Delivery Method
viii. Language proficiency
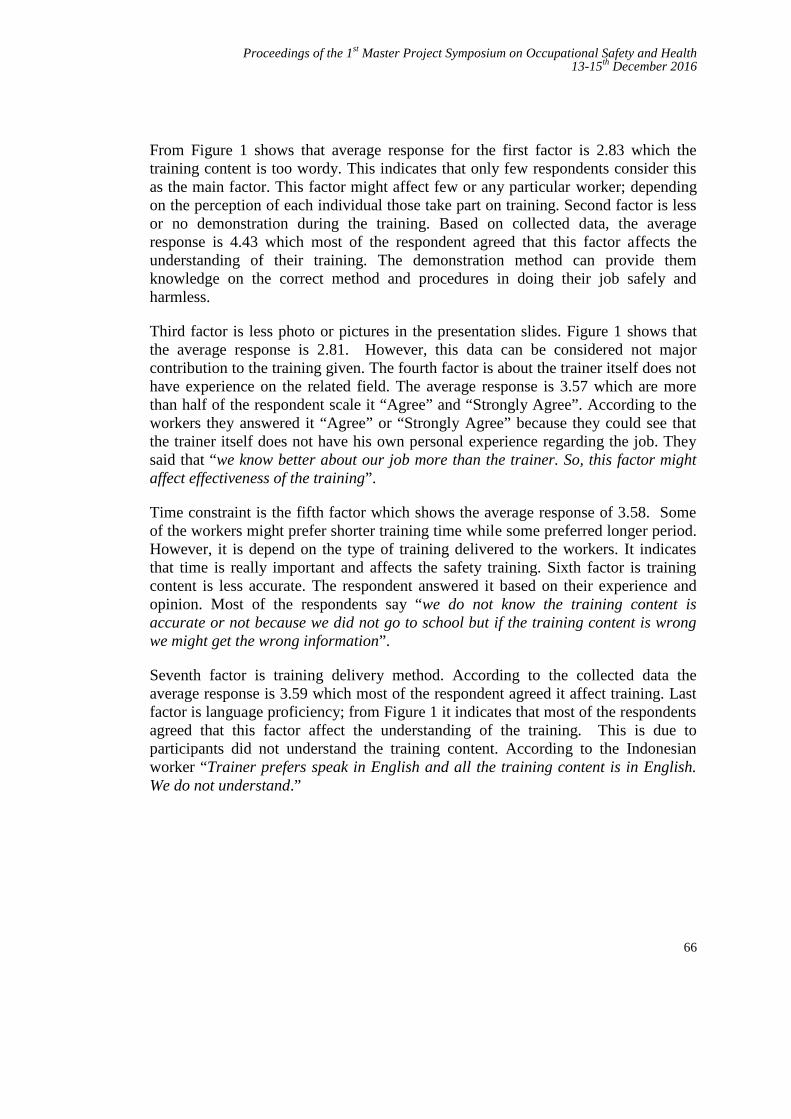
Proceedings of the 1st Master Project Symposium on Occupational Safety and Health13-15th December 2016
66
From Figure 1 shows that average response for the first factor is 2.83 which thetraining content is too wordy. This indicates that only few respondents consider thisas the main factor. This factor might affect few or any particular worker; dependingon the perception of each individual those take part on training. Second factor is lessor no demonstration during the training. Based on collected data, the averageresponse is 4.43 which most of the respondent agreed that this factor affects theunderstanding of their training. The demonstration method can provide themknowledge on the correct method and procedures in doing their job safely andharmless.
Third factor is less photo or pictures in the presentation slides. Figure 1 shows thatthe average response is 2.81. However, this data can be considered not majorcontribution to the training given. The fourth factor is about the trainer itself does nothave experience on the related field. The average response is 3.57 which are morethan half of the respondent scale it “Agree” and “Strongly Agree”. According to theworkers they answered it “Agree” or “Strongly Agree” because they could see thatthe trainer itself does not have his own personal experience regarding the job. Theysaid that “we know better about our job more than the trainer. So, this factor mightaffect effectiveness of the training”.
Time constraint is the fifth factor which shows the average response of 3.58. Someof the workers might prefer shorter training time while some preferred longer period.However, it is depend on the type of training delivered to the workers. It indicatesthat time is really important and affects the safety training. Sixth factor is trainingcontent is less accurate. The respondent answered it based on their experience andopinion. Most of the respondents say “we do not know the training content isaccurate or not because we did not go to school but if the training content is wrongwe might get the wrong information”.
Seventh factor is training delivery method. According to the collected data theaverage response is 3.59 which most of the respondent agreed it affect training. Lastfactor is language proficiency; from Figure 1 it indicates that most of the respondentsagreed that this factor affect the understanding of the training. This is due toparticipants did not understand the training content. According to the Indonesianworker “Trainer prefers speak in English and all the training content is in English.We do not understand.”

Proceedings of the 1st Master Project Symposium on Occupational Safety and Health13-15th December 2016
67
Figure 1: Average response for not fully understanding the training
Figure 2 is the average response on questionnaires about the training evaluation.Most of respondents agreed that training is important to improve safety compliance.Respondents scale the effectiveness of the two-way communication; feedback anddialogue is important to enhance the safety knowledge of the workers. Evidently,average response is 4.43 which most of the respondents agreed that a two-waycommunication is important to enhance knowledge. Respondents also preferred moreanimation in the presentation slides which can enhance understanding of theparticipants. This agreed with the average response of 4.43 from the respondentswhich, they strongly agreed that animation can make them understand better of thetraining content. In understanding the content of the training lead to developing safetyculture such as changing perception, attitude and behaviours of the workers.
Last question is language barrier among non-Malay speaking worker could intervenethe safety learning during the training. Based on collected data, average response is4.23 which respondents agreed that non Malay speaking worker may difficult tounderstand the training content. However, some of the Filipino workers those staymore than 5 years in Sabah could understand and speak Malay language. They justcould not able to read and write.
[CATEGORY NAME],[VALUE]
[CATEGORY NAME],[VALUE]
[CATEGORY NAME],[VALUE]
[CATEGORY NAME],[VALUE]
[CATEGORY NAME],[VALUE]
[CATEGORY NAME],[VALUE]
[CATEGORY NAME],[VALUE]
[CATEGORY NAME],[VALUE]

Proceedings of the 1st Master Project Symposium on Occupational Safety and Health13-15th December 2016
68
Figure 2: Average response of training evaluation
3.2 Characteristics of Effective Training Practices
The data given in Figure 1 and Figure 2 can be short listed to three major factors innot fully understanding the occupational safety training which are:
i. More demonstration on the content training topics.ii. Provide more animation on the content
iii. Conduct two-way communication during the training session
Studies showed that incorporating examples into the training module will help tofacilitate the learning concept and enhance skills in particular field [6]. The examplesare referred to objects, events and illustrations that can elaborate more about thespecific impression to make the participant understand better about the trainingmodule [7]. This statement agreed to most of the respondents said that lessdemonstration during the training will result in less understanding of the trainingcontent.
It is important the training content with more illustrations in order for the trainer tounderstand its affects safety related performances [8]. Figure 2 the average responsesof the respondents agreed that animation will enhance their understanding. As anexample, during the bar bending activity, workers are involved with machineries (barbender machine). It is important to animate the moving machine and show whathappen to the worker if not following the correct steps such as, ‘what will happen ifthe fingers are trapped between the moving parts of machine?’ This can make theworkers be more careful during bending iron bar. Another incident can be alsoanimated showing the exploding machine. This incident can show to the worker howto respond during the accident and teach them to use suitable Personal ProtectiveEquipment (PPE). Illiterate worker may difficult to understand wordy content oflearning modules so it is important to show them moving picture. Showing videos or

Proceedings of the 1st Master Project Symposium on Occupational Safety and Health13-15th December 2016
69
animated pictures is another teaching method and learning experience from verbalskill to performance skill [9].
Apart from hands-on demonstration and animated training, two way communicationsbetween trainer and participants play important role. Two way communications arecritical factor in influencing the transferability of the training content. Theparticipants have the opportunity to showcase their ability and understanding [14].Two-way communications promote productive dialogue and improve relationshipbetween trainer and participants. Consequently, participants can foster genuineconversation among each other [15].
3.3 Occupational Safety Training Framework
Figure 3 is the proposed framework of the safety training for illiterate worker. Safetytraining is required whenever the work activity is risky [16]. It is very important forthe management to establish training program whether the training should be heldannually or based on workers’ need. Employers are required to provide safetyprogram inclusive training program based on Guidelines on Occupational Safety andHealth Management System (DOSH Guidelines).
On occupational safety training module, the trainer should be concise with objectivesor goals of the training that to be achieved [17]. Safety training module is based onworkers’ need. As mention in paragraph 3.1, language proficiency is another mainreason for not fully understands the safety training. Therefore, management shouldprovide translator to those illiterate migrant workers. As mention in paragraph 3.2 theteaching method such as hands-on demonstration, animation and dialogue couldenhance the understanding of the worker regarding the training. Lastly from theframework are the implementation of training and eventually the continuousimprovement of the safety training.
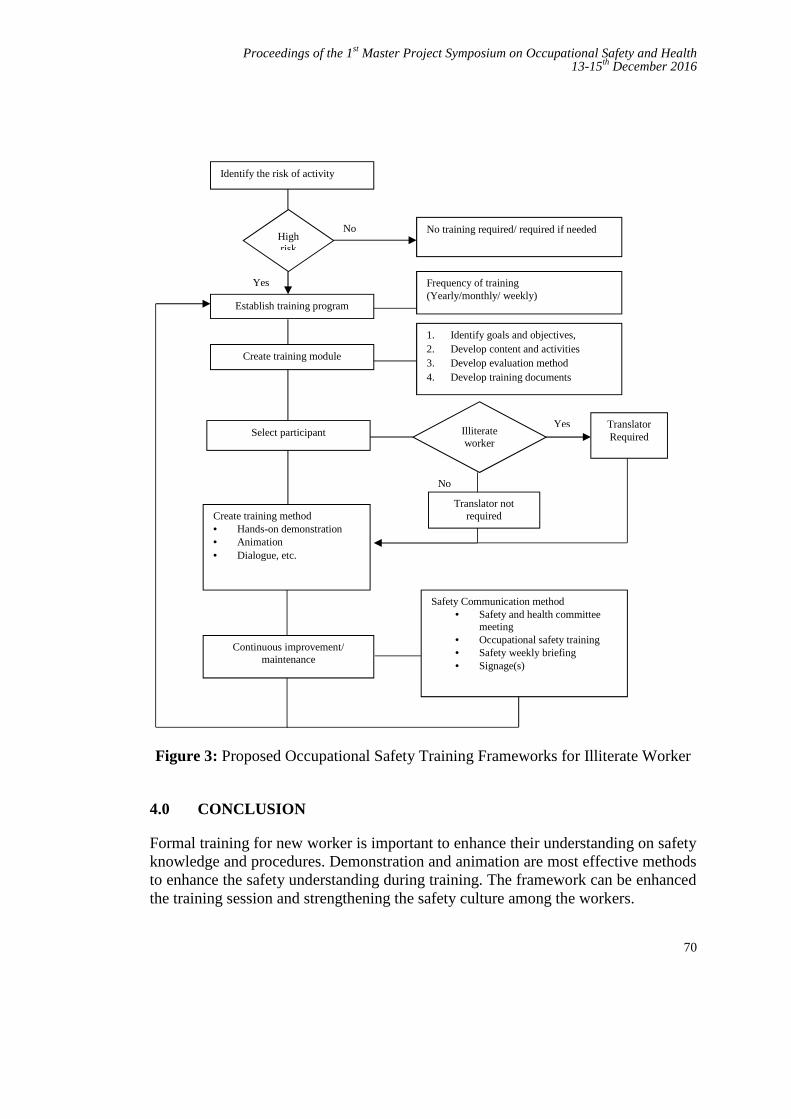
Proceedings of the 1st Master Project Symposium on Occupational Safety and Health13-15th December 2016
70
Figure 3: Proposed Occupational Safety Training Frameworks for Illiterate Worker
4.0 CONCLUSION
Formal training for new worker is important to enhance their understanding on safetyknowledge and procedures. Demonstration and animation are most effective methodsto enhance the safety understanding during training. The framework can be enhancedthe training session and strengthening the safety culture among the workers.
Create training method Hands-on demonstration Animation Dialogue, etc.
No
Translator notrequired
Continuous improvement/maintenance
Safety Communication method Safety and health committee
meeting Occupational safety training Safety weekly briefing Signage(s)
Illiterateworker
Select participantYes Translator
Required
Identify the risk of activity
Establish training program
Highrisk
No training required/ required if neededNo
Yes Frequency of training(Yearly/monthly/ weekly)
Create training module
1. Identify goals and objectives,2. Develop content and activities3. Develop evaluation method4. Develop training documents
Proceedings of the 1st Master Project Symposium on Occupational Safety and Health13-15th December 2016
71
REFERENCES
[1] Department of Occupational Safety and Health Malaysia, 2016.[2] Sawacha, E., Naoum, and Fong, D., 1999. Factors Affecting Safety
Performance on Construction Site. International Journal of ProjectManagement 17(5), pp. 309-315.
[3] Vazquez, R. F. and Stalnaker, C. K., 2004. Latino Workers in theConstruction Industry: Overcoming the Language Barrier Improves Safety.Professional Safety 24, pp. 12-134
[4] Hinze, J. W., 2006. Construction Safety. New Jersey: Prentice Hall.[5] Ahmad Z, S., Mohamed, S. F., and M. Yusuf, Z., 2012. Construction Skilled
Labour Shortage-The Challenges in Malaysia Construction Site. OntarioInternational Development Agency. OIDA International Journal ofSustainable Development 04 (05), pp. 99-107.
[6] Taylor, M. A., Wirth, O., Olvina, M. and Alvero, A. M., 2016. ExperimentalAnalysis of using Examples and Non-examples in Safety Training. Journal ofSafety Research 59, pp. 97-104.
[7] Merill, M. D., Tennyson, R. D., and Posey, L. O., 1992. Teaching Concept.Second Edition. Engle-wood, Cliff, Nj: Educational Technology Publications.
[8] Wan, M., 2014. Incidental Trainer: A Reference Guide for Training Design,Development and Delivery. 1st Edition. Taylor & Francis Group. Boca Raton,Florida.
[9] Blume, B. D., Ford, J. K., Baldwin, T. T. and Huang, J. L., 2010. Transfer ofTraining: A meta-analytic Review. Journal of Management, 36, pp. 1065-1105.
[10] Fu, C., Zhu, M., Yu, T. S. I., and He, Y., 2013. Effectiveness of ParticipatoryTraining on Improving Occupational Health in small and Medium Enterprisesin China. International Journal of Occupational and Environment Health 19(02), pp. 85-90.
[11] Cordova, M., 2003. Effectiveness of Training Employees on OSHA’s newRecording Requirement to Avoid Liability: Employment Law Update.Engineering Construction and Architectural Management 3, pp. 232-245.
[12] Noone, S. M., 2005. Voluntary versus Mandatory Adult Learners:Implications for Trainers. New York. Engel LTd.
[13] Demirkesen, S. and Arditi, D., 2015. Construction Safety Personnel’sPerception of Safety Training Practices. International Journal of ProjectManagement 33, pp. 1160-1168.

Proceedings of the 1st Master Project Symposium on Occupational Safety and Health13-15th December 2016
72
[14] Huang, Y., Strawderman, L., Babski-Reeeves, K., Ahmed, S., and Salehi, A.,2014. Training Effectiveness and Trainee Performance in a VoluntaryTraining Program: Are Trainees Really Motivated?
[15] Besley, J. C., Dudo, A. D., Yuan, S. And Ghannam, N. A., 2016. QualitativeInterview with Science Communication Trainers about CommunicationObjectives and Goals. Science Communication. Vol. 39(3), pp. 356-381
[16] OSHA, 2015. Training Requirements in OSHA Standards. OccupationalSafety and Health Administration.
[17] Wilkins, J. R., 2011. Construction Worker’s Perceptions of Health and SafetyTraining Programmes. Construction Management and Economics 29, pp.1017-1026.
Proceedings of the 1st Master Project Symposium on Occupational Safety and Health13-15th December 2016
73
Radiation Safety Awareness among Workersin Battery Manufacturer Company
Khairul Nizam Alia and Siti Zura A.Jalilb
UTM Razak School of Engineering and Advanced Technology, Universiti TeknologiMalaysia, 54100 Jalan Sultan Yahya Petra, Kuala Lumpur, Malaysia
[email protected], [email protected]
Abstract – Radiation is the process in which energy is emitted as particles or waves,transmitted through an intervening medium and can be absorbed by another body. As abatteries manufacturer company, a number of x-ray machine had installed to detect anydefects encountered during their production process. These machines however transmittedradiation to the employees who are handling the machineries, directly or indirectly. As such,only authorized and trained workers are allowed to handle these machineries. In Malaysia,requirement on radiation safety training was stipulated in regulation 15(6) and 15(8) byAtomic Energy Licensing Act 1984 under Atomic Energy Licensing, Basic Safety ProtectionRadiation Protection, Regulations 2010. This paper addresses the issue on radiation safetyawareness among workers and suggested on developing the awareness training. Thisresearch is using a quantitative data through the questionnaire and had been distributed to59 respondents out of 60 radiation workers in the company. Once the data collected, it beingprocessed and analyzed using the following statistic: frequency, percentage and the SPSSpaired T-test. To examine reliability of the scale, Cronbach′s α was used. Based on theresult, it can be concluded that training is strongly required for the radiation workers in thiscompany and the radiation exposure elements on the regulatory requirement, types ofradiation, exposure level, dose rate, personal protective equipment (PPE) and STDprinciples (shielding, time and distance) needs to be addressed and highlighted with weakpoint accounted on exposure level, dose rate, training requirement and shielding elements
Keywords: Radiation safety awareness, radiation exposure element
1.0 INTRODUCTION
Radiation may be defined as energy traveling through space. An x-ray also known asx-radiation and travels through a medium or space. It was discovered by WilhelmConrad Röntgen on 1895 and received the first Nobel Prize in Physics for hisdiscovery. In general, there are number of regulations, consensus safety standards,and radiation protection guidelines governing the performance and use of radiationequipment. Only authorized and trained individuals are allowed to operate radiation-generating equipment and they must be adequately exposed and trained in radiation
Proceedings of the 1st Master Project Symposium on Occupational Safety and Health13-15th December 2016
74
safety. No proper training with limited knowledge level on the radiation exposurewill put the worker’s lives in danger.
This study proposes radiation safety awareness among workers at batterymanufacturer company, namely XYZ Company. XYZ Company produced 3 types ofbattery which commonly used in computer, power tool, smartphone, electronicdevices etc. 28 of x-ray machines installed by the company to support production.The machines are complied with the requirement and registered with Atomic EnergyLicensing Board (AELB). Currently, there are about 60 radiation workers involve inhandling and operating the x- ray machines in the factory. However, due to highturnaround number of employees and time constraint, there were no properintroductory or training being presented to the new workers and this has contributedto less awareness on radiation safety among the workers. Therefore, the radiationsafety awareness among the workers in this company is critical and this studyproposes the effective training contents based on elements that being ignored or lessconcern by the workers in the radiation safety.
2.0 BACKGROUND OF STUDY
Radiations used in the factory are hazardous to workers and member of public as it isable to penetrate the body [1]. In Malaysia, AELB was established in 1985 to ensuresafety, security and safeguarding peaceful on nuclear activities [2]. In addition,radiation protection in industrial radiography activities are governed by The AtomicEnergy Licensing Act 1984 (Act 304), and Regulations [3]. Only authorized andtrained individuals are allowed to operate radiation-generating equipment. They alsoneed continuous education and update on radiation safety [4]. With safety awarenessin place, it may encourage the workers to be more alert which lead to avoidence ofaccidents and incidents and minimize the impact (if happens).
3.0 METHODOLOGY
3.1 Operational Framework
Figure 1 shows the operational framework of the study that describes the sequence ofwork to develop awareness training content on radiation exposure among radiationworkers in XYZ Company.
3.2 Data Acquisition
This study is using quantitative research through the questionnaires. The NominalScale (A, B, C, D) is used for Part A which is on demographic data. Part B of thequestionnaires is using the Dichotomous Scale (Yes or No) to measure the variables

Proceedings of the 1st Master Project Symposium on Occupational Safety and Health13-15th December 2016
75
under investigation. To measure the internal consistency of variables selected, thisstudy is using the Cronbach’s Alpha coefficient. Ideally, the Cronbach’s Alphacoefficient of a scale should be above .7 [5]. The results from questionnaires wereprocessed and analyzed using the following statistic: frequency, percentage and theSPSS paired T-test. The conclusion will be based on data analysis generated from theprogram. Finally, a proper and relevant training contents on radiation exposure canbe developed by the parties concerned based on the weaknesses identified.
Figure 1: Operational framework of the research
4.0 RESULTS AND DISCUSSIONS
Quantitative methods were being used to emphasize the objective measurements andanalysis of data collected through questionnaires. Descriptive statistics is used tosummarize the data collection.
4.1 Reliability Statistics
As indicated in Table 1, the Cronbach’s Alpha for all the questions (excludingdemographic part) found to be good and reliable at .922
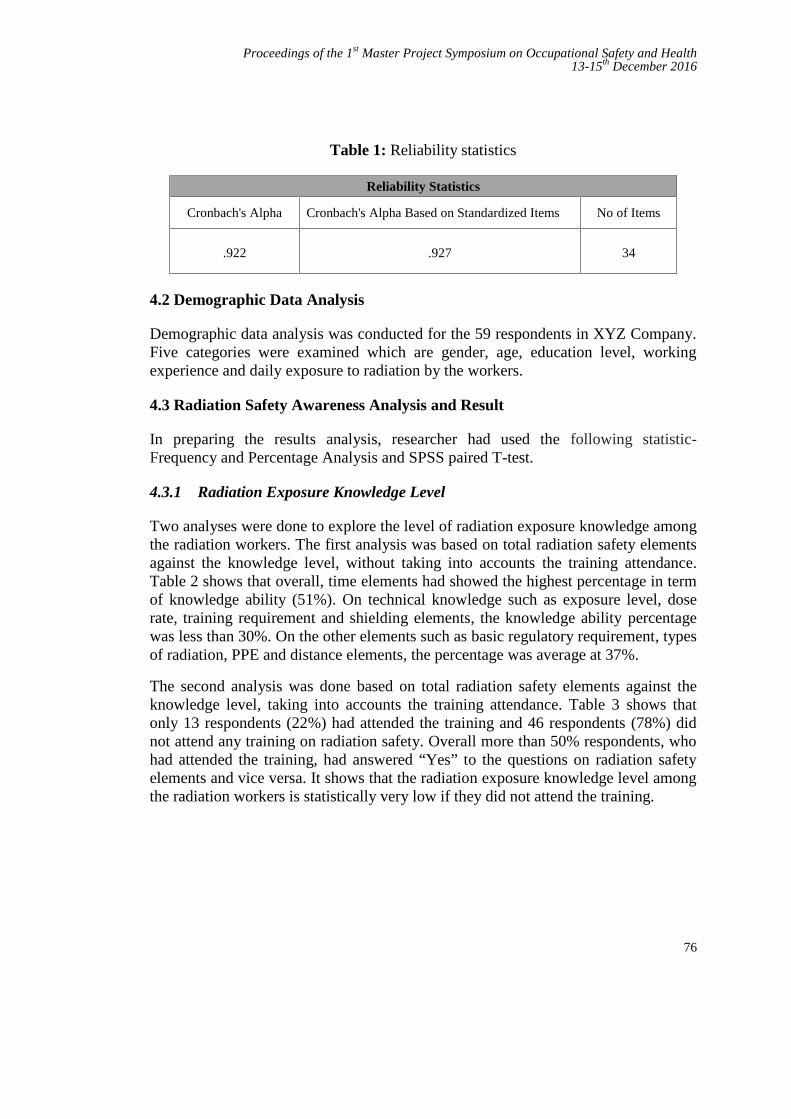
Proceedings of the 1st Master Project Symposium on Occupational Safety and Health13-15th December 2016
76
Table 1: Reliability statistics
Reliability Statistics
Cronbach's Alpha Cronbach's Alpha Based on Standardized Items No of Items
.922 .927 34
4.2 Demographic Data Analysis
Demographic data analysis was conducted for the 59 respondents in XYZ Company.Five categories were examined which are gender, age, education level, workingexperience and daily exposure to radiation by the workers.
4.3 Radiation Safety Awareness Analysis and Result
In preparing the results analysis, researcher had used the following statistic-Frequency and Percentage Analysis and SPSS paired T-test.
4.3.1 Radiation Exposure Knowledge Level
Two analyses were done to explore the level of radiation exposure knowledge amongthe radiation workers. The first analysis was based on total radiation safety elementsagainst the knowledge level, without taking into accounts the training attendance.Table 2 shows that overall, time elements had showed the highest percentage in termof knowledge ability (51%). On technical knowledge such as exposure level, doserate, training requirement and shielding elements, the knowledge ability percentagewas less than 30%. On the other elements such as basic regulatory requirement, typesof radiation, PPE and distance elements, the percentage was average at 37%.
The second analysis was done based on total radiation safety elements against theknowledge level, taking into accounts the training attendance. Table 3 shows thatonly 13 respondents (22%) had attended the training and 46 respondents (78%) didnot attend any training on radiation safety. Overall more than 50% respondents, whohad attended the training, had answered “Yes” to the questions on radiation safetyelements and vice versa. It shows that the radiation exposure knowledge level amongthe radiation workers is statistically very low if they did not attend the training.
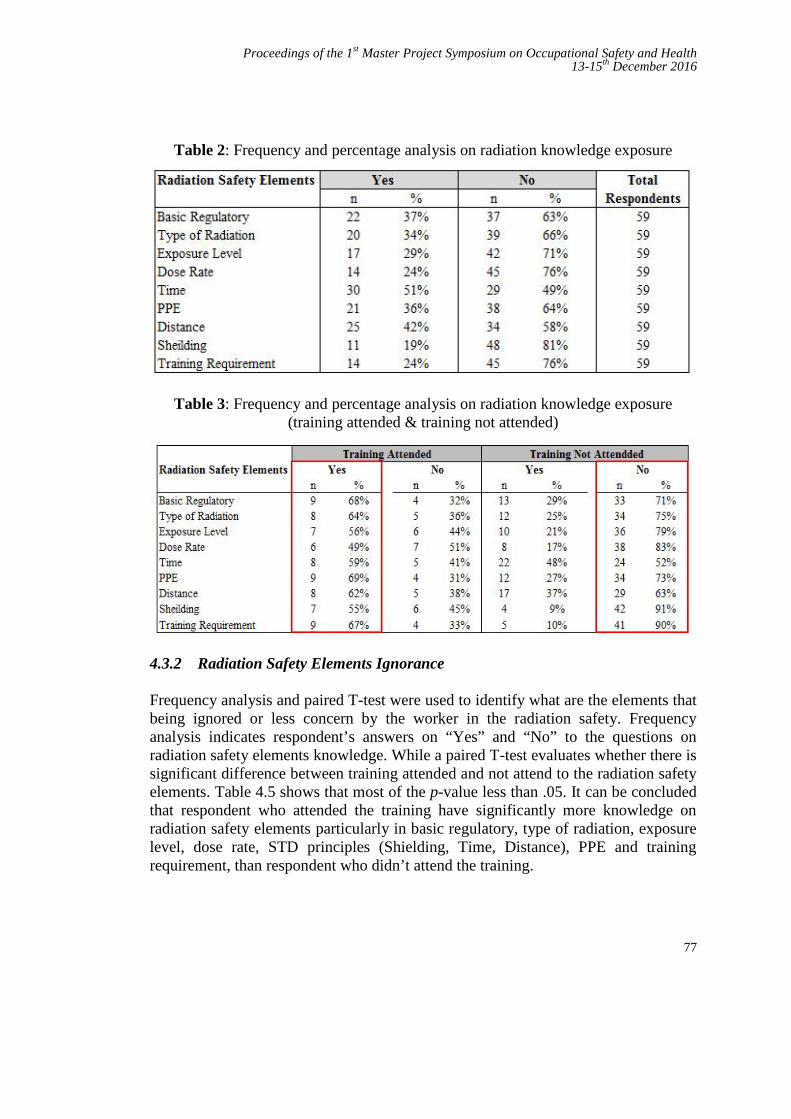
Proceedings of the 1st Master Project Symposium on Occupational Safety and Health13-15th December 2016
77
Table 2: Frequency and percentage analysis on radiation knowledge exposure
Table 3: Frequency and percentage analysis on radiation knowledge exposure(training attended & training not attended)
4.3.2 Radiation Safety Elements Ignorance
Frequency analysis and paired T-test were used to identify what are the elements thatbeing ignored or less concern by the worker in the radiation safety. Frequencyanalysis indicates respondent’s answers on “Yes” and “No” to the questions onradiation safety elements knowledge. While a paired T-test evaluates whether there issignificant difference between training attended and not attend to the radiation safetyelements. Table 4.5 shows that most of the p-value less than .05. It can be concludedthat respondent who attended the training have significantly more knowledge onradiation safety elements particularly in basic regulatory, type of radiation, exposurelevel, dose rate, STD principles (Shielding, Time, Distance), PPE and trainingrequirement, than respondent who didn’t attend the training.
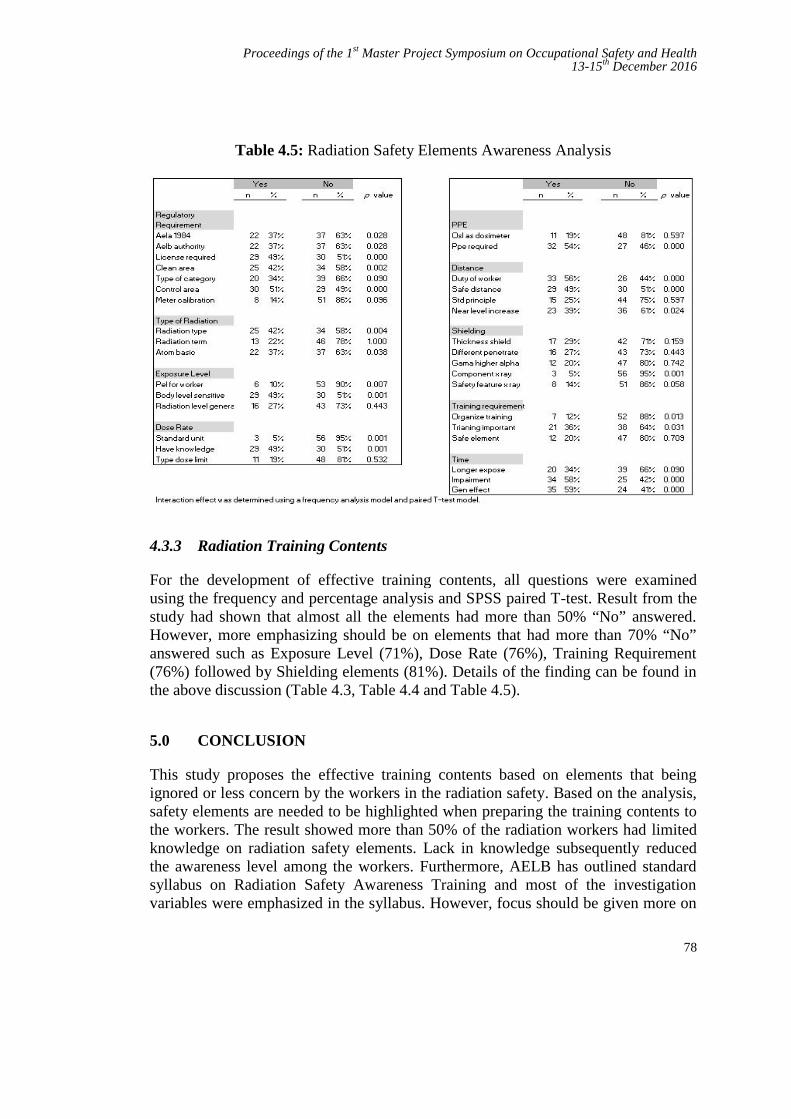
Proceedings of the 1st Master Project Symposium on Occupational Safety and Health13-15th December 2016
78
Table 4.5: Radiation Safety Elements Awareness Analysis
4.3.3 Radiation Training Contents
For the development of effective training contents, all questions were examinedusing the frequency and percentage analysis and SPSS paired T-test. Result from thestudy had shown that almost all the elements had more than 50% “No” answered.However, more emphasizing should be on elements that had more than 70% “No”answered such as Exposure Level (71%), Dose Rate (76%), Training Requirement(76%) followed by Shielding elements (81%). Details of the finding can be found inthe above discussion (Table 4.3, Table 4.4 and Table 4.5).
5.0 CONCLUSION
This study proposes the effective training contents based on elements that beingignored or less concern by the workers in the radiation safety. Based on the analysis,safety elements are needed to be highlighted when preparing the training contents tothe workers. The result showed more than 50% of the radiation workers had limitedknowledge on radiation safety elements. Lack in knowledge subsequently reducedthe awareness level among the workers. Furthermore, AELB has outlined standardsyllabus on Radiation Safety Awareness Training and most of the investigationvariables were emphasized in the syllabus. However, focus should be given more on
Proceedings of the 1st Master Project Symposium on Occupational Safety and Health13-15th December 2016
79
exposure level, dose rate, training requirement and shielding elements as thoseelements had showed the lowest knowledge ability among the others.
For the training attendance, this study also revealed that only 13 respondents (22%)had attended the training and 46 respondents (78%) had never attended any trainingon radiation safety. This is against the requirement by Atomic Energy Licensing Act(AELA) 1984 which requires an appropriate training to be given to each of radiationworker.
REFERENCES
[1] Ismail Bahari et al., Managing Radiation Safety : Guide For RadiationProtection Officers. Mc Graw Hill, 2007 : 28
[2] Zul Helmi Bin Ghazali. “Sustainable Management of Disused SealedRadioactive Sources.” IAEA International Workshop 11 – 15 October2010. Lisbon, Portugal, 2010, 2-3
[3] Code of Practice on Radiation Protection In Industrial Radiography.LEM/TEK/33 Rev. 1, 02 December 2008, Malaysia 2008 : 3
[4] E. Kiguli-Malwadde et al., “Radiation Safety Awareness Among Workersand Clientele at Mulogo Hospital, Kampala, Uganda”. East and CentralAfrican Journal of Surgery, 2006 : 49-51
[5] Julie Pallant, “A step by step guide to data analysis using IBM SPSS : SPSSSurvival Manual, 5th Edition”, Mc Graw Hill, 2013 : 101
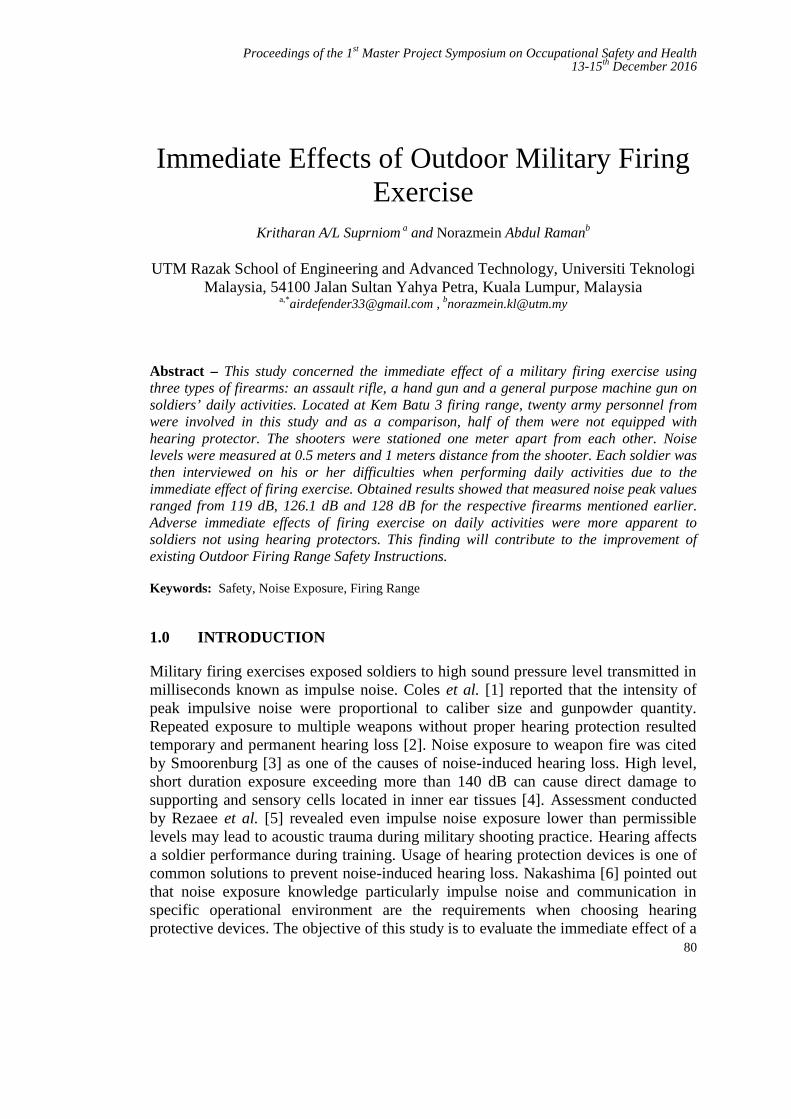
Proceedings of the 1st Master Project Symposium on Occupational Safety and Health13-15th December 2016
80
Immediate Effects of Outdoor Military FiringExercise
Kritharan A/L Suprniom a and Norazmein Abdul Ramanb
UTM Razak School of Engineering and Advanced Technology, Universiti TeknologiMalaysia, 54100 Jalan Sultan Yahya Petra, Kuala Lumpur, Malaysia
a,*[email protected] , [email protected]
Abstract – This study concerned the immediate effect of a military firing exercise usingthree types of firearms: an assault rifle, a hand gun and a general purpose machine gun onsoldiers’ daily activities. Located at Kem Batu 3 firing range, twenty army personnel fromwere involved in this study and as a comparison, half of them were not equipped withhearing protector. The shooters were stationed one meter apart from each other. Noiselevels were measured at 0.5 meters and 1 meters distance from the shooter. Each soldier wasthen interviewed on his or her difficulties when performing daily activities due to theimmediate effect of firing exercise. Obtained results showed that measured noise peak valuesranged from 119 dB, 126.1 dB and 128 dB for the respective firearms mentioned earlier.Adverse immediate effects of firing exercise on daily activities were more apparent tosoldiers not using hearing protectors. This finding will contribute to the improvement ofexisting Outdoor Firing Range Safety Instructions.
Keywords: Safety, Noise Exposure, Firing Range
1.0 INTRODUCTION
Military firing exercises exposed soldiers to high sound pressure level transmitted inmilliseconds known as impulse noise. Coles et al. [1] reported that the intensity ofpeak impulsive noise were proportional to caliber size and gunpowder quantity.Repeated exposure to multiple weapons without proper hearing protection resultedtemporary and permanent hearing loss [2]. Noise exposure to weapon fire was citedby Smoorenburg [3] as one of the causes of noise-induced hearing loss. High level,short duration exposure exceeding more than 140 dB can cause direct damage tosupporting and sensory cells located in inner ear tissues [4]. Assessment conductedby Rezaee et al. [5] revealed even impulse noise exposure lower than permissiblelevels may lead to acoustic trauma during military shooting practice. Hearing affectsa soldier performance during training. Usage of hearing protection devices is one ofcommon solutions to prevent noise-induced hearing loss. Nakashima [6] pointed outthat noise exposure knowledge particularly impulse noise and communication inspecific operational environment are the requirements when choosing hearingprotective devices. The objective of this study is to evaluate the immediate effect of a
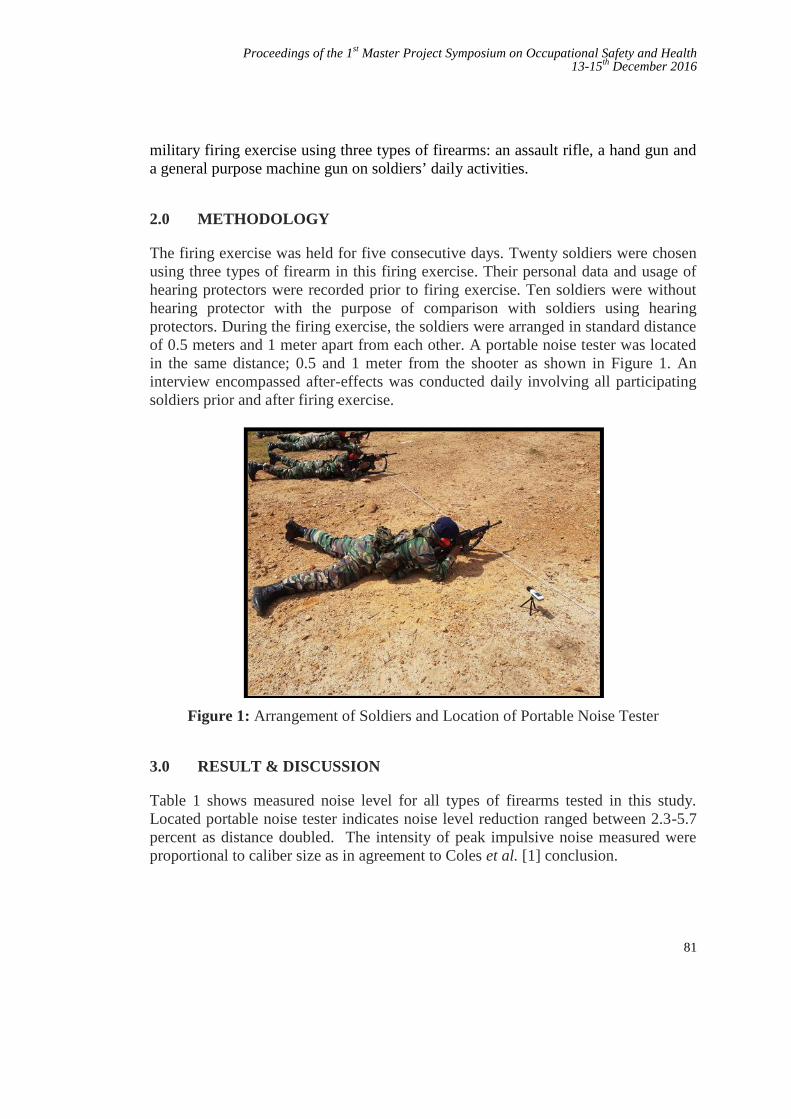
Proceedings of the 1st Master Project Symposium on Occupational Safety and Health13-15th December 2016
81
military firing exercise using three types of firearms: an assault rifle, a hand gun anda general purpose machine gun on soldiers’ daily activities.
2.0 METHODOLOGY
The firing exercise was held for five consecutive days. Twenty soldiers were chosenusing three types of firearm in this firing exercise. Their personal data and usage ofhearing protectors were recorded prior to firing exercise. Ten soldiers were withouthearing protector with the purpose of comparison with soldiers using hearingprotectors. During the firing exercise, the soldiers were arranged in standard distanceof 0.5 meters and 1 meter apart from each other. A portable noise tester was locatedin the same distance; 0.5 and 1 meter from the shooter as shown in Figure 1. Aninterview encompassed after-effects was conducted daily involving all participatingsoldiers prior and after firing exercise.
Figure 1: Arrangement of Soldiers and Location of Portable Noise Tester
3.0 RESULT & DISCUSSION
Table 1 shows measured noise level for all types of firearms tested in this study.Located portable noise tester indicates noise level reduction ranged between 2.3-5.7percent as distance doubled. The intensity of peak impulsive noise measured wereproportional to caliber size as in agreement to Coles et al. [1] conclusion.
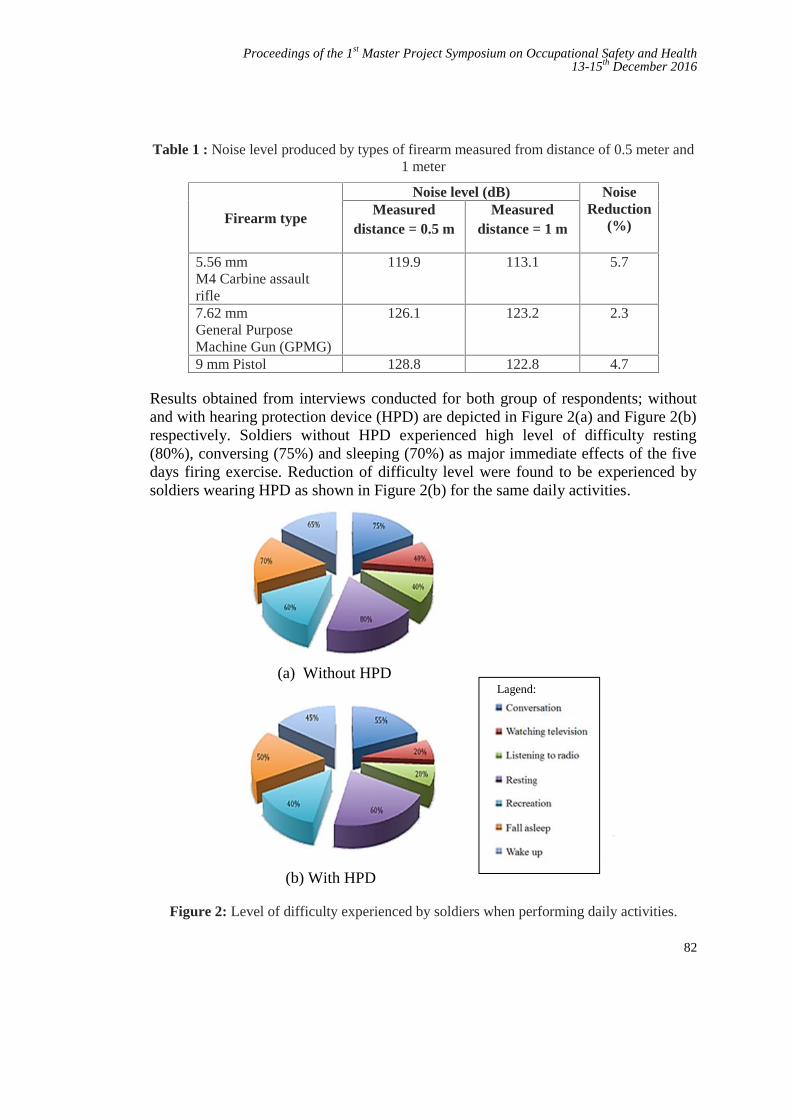
Proceedings of the 1st Master Project Symposium on Occupational Safety and Health13-15th December 2016
82
Table 1 : Noise level produced by types of firearm measured from distance of 0.5 meter and1 meter
Firearm type
Noise level (dB) NoiseReduction
(%)Measured
distance = 0.5 mMeasured
distance = 1 m
5.56 mmM4 Carbine assaultrifle
119.9 113.1 5.7
7.62 mmGeneral PurposeMachine Gun (GPMG)
126.1 123.2 2.3
9 mm Pistol 128.8 122.8 4.7
Results obtained from interviews conducted for both group of respondents; withoutand with hearing protection device (HPD) are depicted in Figure 2(a) and Figure 2(b)respectively. Soldiers without HPD experienced high level of difficulty resting(80%), conversing (75%) and sleeping (70%) as major immediate effects of the fivedays firing exercise. Reduction of difficulty level were found to be experienced bysoldiers wearing HPD as shown in Figure 2(b) for the same daily activities.
(a) Without HPDLagend:
(b) With HPD
Figure 2: Level of difficulty experienced by soldiers when performing daily activities.
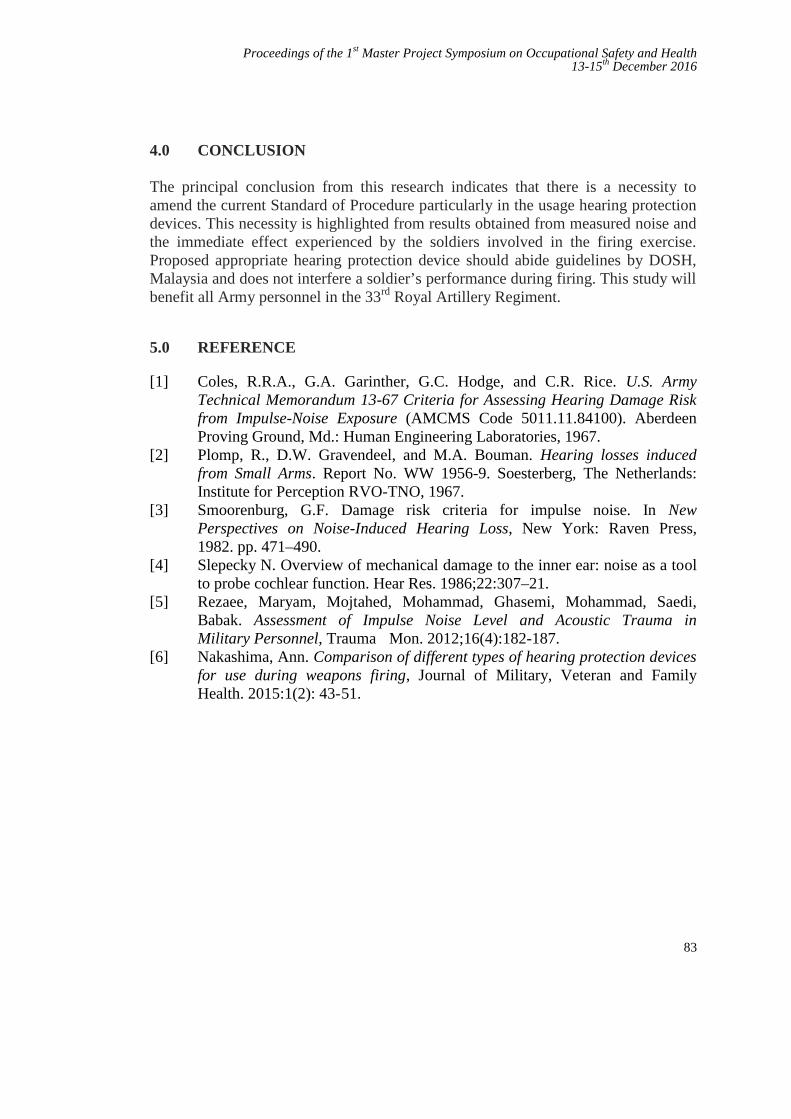
Proceedings of the 1st Master Project Symposium on Occupational Safety and Health13-15th December 2016
83
4.0 CONCLUSION
The principal conclusion from this research indicates that there is a necessity toamend the current Standard of Procedure particularly in the usage hearing protectiondevices. This necessity is highlighted from results obtained from measured noise andthe immediate effect experienced by the soldiers involved in the firing exercise.Proposed appropriate hearing protection device should abide guidelines by DOSH,Malaysia and does not interfere a soldier’s performance during firing. This study willbenefit all Army personnel in the 33rd Royal Artillery Regiment.
5.0 REFERENCE
[1] Coles, R.R.A., G.A. Garinther, G.C. Hodge, and C.R. Rice. U.S. ArmyTechnical Memorandum 13-67 Criteria for Assessing Hearing Damage Riskfrom Impulse-Noise Exposure (AMCMS Code 5011.11.84100). AberdeenProving Ground, Md.: Human Engineering Laboratories, 1967.
[2] Plomp, R., D.W. Gravendeel, and M.A. Bouman. Hearing losses inducedfrom Small Arms. Report No. WW 1956-9. Soesterberg, The Netherlands:Institute for Perception RVO-TNO, 1967.
[3] Smoorenburg, G.F. Damage risk criteria for impulse noise. In NewPerspectives on Noise-Induced Hearing Loss, New York: Raven Press,1982. pp. 471–490.
[4] Slepecky N. Overview of mechanical damage to the inner ear: noise as a toolto probe cochlear function. Hear Res. 1986;22:307–21.
[5] Rezaee, Maryam, Mojtahed, Mohammad, Ghasemi, Mohammad, Saedi,Babak. Assessment of Impulse Noise Level and Acoustic Trauma inMilitary Personnel, Trauma Mon. 2012;16(4):182-187.
[6] Nakashima, Ann. Comparison of different types of hearing protection devicesfor use during weapons firing, Journal of Military, Veteran and FamilyHealth. 2015:1(2): 43-51.
Proceedings of the 1st Master Project Symposium on Occupational Safety and Health13-15th December 2016
84
Long Evacuation Time during Fire Drillamong Workers at Menara TM
Marziyana Abu Bakara, Nelidya Md. Yusoffb and Siti Zura A. Jalilc
UTM Razak School of Engineering and Advanced Technology, Universiti TeknologiMalaysia, 54100 Jalan Sultan Yahya Petra, Kuala Lumpur, Malaysia
[email protected], [email protected], [email protected]
Abstract – The study purpose is to address Long evacuation time during fire drill amongworkers at Menara TM. The objective of this study is to identify the level of knowledge andawareness among workers, to determine factors of long evacuation time during the fire drillat Menara TM and to propose an improvement plan on reducing the evacuation time. Amajor issue with conducting pre-announced fire drills is that occupant or employees knowthat drills are not a real emergency alert and they have no sense of urgency to evacuate thebuilding. Occupants are still able to remain calm at their workplace and often to do not usethe designated emergency exits. This type of drill may put employees in harm's way shouldthey forget to use the designated emergency exits instead use the main entrances, which maynot be the quickest and safest evacuation if real fire emergency happen. Review of theliterature was done to identify the long evacuation factors. The contributing factors of thisstudy parameter are knowledge and awareness, human behaviour and guidance. Thequalitative and quantitative parameter was applied in this study. The results of correlationshows that knowledge awareness, human behaviour and guidance attribute have asignificant positive relationship with Long Evacuation Time during Fire Drill amongWorkers at Menara TM.
Keywords: High-rise building, fire awareness, safety knowledge, Fire Drill, evacuation guidance,human
1.0 INTRODUCTION
Menara TM is a tall building which required more than 45 minit to evacuate thebuilding. Fire Drill or Evacuation Drill is known as planned, schedule and expectedto employee with no element of surprise. Menara TM conducting 2 drills activity in ayear. The previous study shows the reasons that contribute to long evacuation timewhich is due to the lack of awareness with no sense of urgency. Besides, theoccupant are able to still remain calm and often do not use the designated emergencyexits during the fire drill. In addition, lack of information on fire drill such asunfamiliar occupant or visitors and limited physical condition such as disabled
Proceedings of the 1st Master Project Symposium on Occupational Safety and Health13-15th December 2016
85
person, handicapped and pregnant lady also contribute to long evacuation timeduring fire drill.
Facilitating employee relocation to a safe place is the primary strategy for the safetyof building occupants in emergency especially fires (Richard W. Bukowski, 2014).Escape routes in high-rise buildings are an essential element for emergency escape.Escape stairs are commonly designed with intermediate landing floors to connect twostaircases between the floor levels. Evacuation from building fire is essential and hasto be initiated as soon as the fire alarm is sounded or fire clues have been detected.They are two strong influences of important elements at the time of evacuation whichis occupant’s characteristics and building characteristic (Yahya Mohamad Yatim,2008). The objective of this research is to identify the level of knowledge andawareness among workers on during fire drill at Menara TM, to determine factors oflong evacuation time and finally to propose improvement plan of effective fire drillamong workers on at Menara TM.
2.0 MATERIAL AND METHOD
2.1 Study design
This study combined both qualitative and qualitative research that attempt toaccumulate the existing data (Diane P.Keating, 2010). At the end of the fire drillactivities, fire drill information such as date, time and other particular such as anyproblem encountered and those corrected or needing correction, alarm monitoringservice, answering service and the Fire Department were notified that drill activityhad concluded must be documented and keep on file (Jason D. Averill, 2010). Theinitially pilot test was carried out to confirm the reability of each questionnaire. Thequestionnaire survey distributed to n=120 which represent 96% the qualitativeanalysis. The sample of the interview is n=5 cover 4% of the quantitative dataanalysis.
2.2 Respondent
The population sample to be used in this study consist of the respondents selectedfrom a different level and different department from the upper level, middle level andlower level include TM workers and other tenants with total of 125 respondentlocated at Menara TM, Jalan Pantai Bharu, Kuala Lumpur.
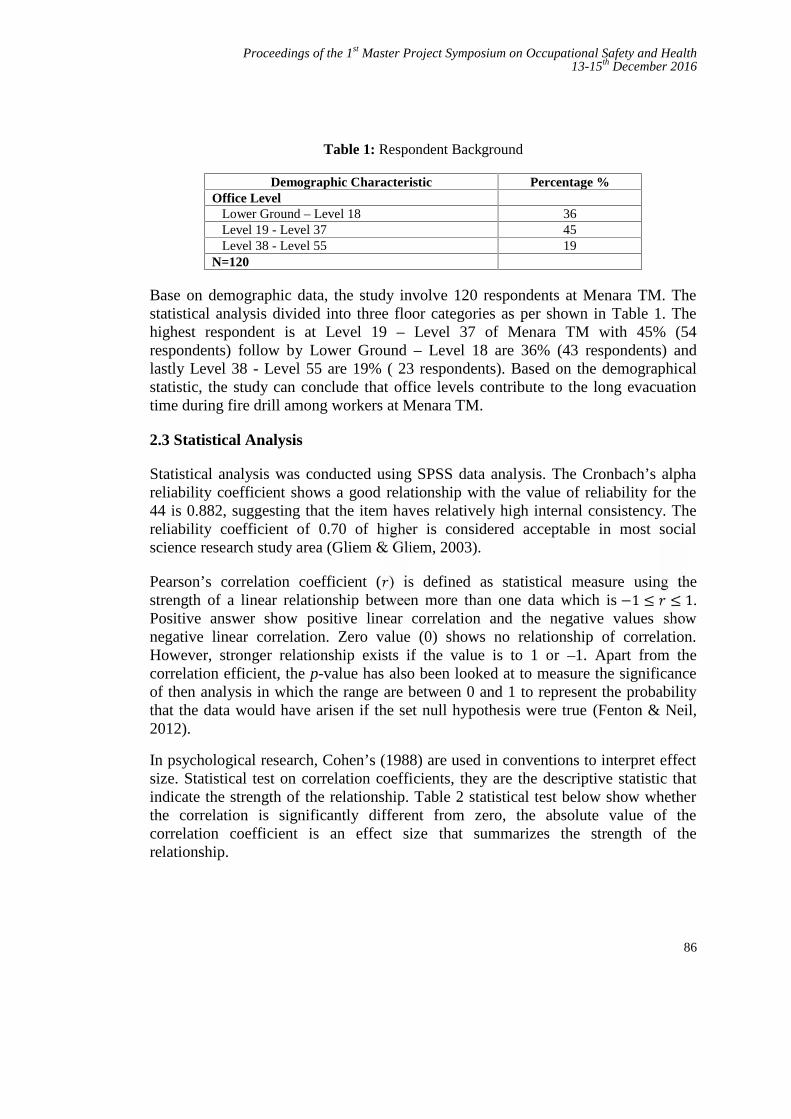
Proceedings of the 1st Master Project Symposium on Occupational Safety and Health13-15th December 2016
86
Table 1: Respondent Background
Demographic Characteristic Percentage %Office Level
Lower Ground – Level 18 36Level 19 - Level 37 45Level 38 - Level 55 19
N=120
Base on demographic data, the study involve 120 respondents at Menara TM. Thestatistical analysis divided into three floor categories as per shown in Table 1. Thehighest respondent is at Level 19 – Level 37 of Menara TM with 45% (54respondents) follow by Lower Ground – Level 18 are 36% (43 respondents) andlastly Level 38 - Level 55 are 19% ( 23 respondents). Based on the demographicalstatistic, the study can conclude that office levels contribute to the long evacuationtime during fire drill among workers at Menara TM.
2.3 Statistical Analysis
Statistical analysis was conducted using SPSS data analysis. The Cronbach’s alphareliability coefficient shows a good relationship with the value of reliability for the44 is 0.882, suggesting that the item haves relatively high internal consistency. Thereliability coefficient of 0.70 of higher is considered acceptable in most socialscience research study area (Gliem & Gliem, 2003).
Pearson’s correlation coefficient ( ) is defined as statistical measure using thestrength of a linear relationship between more than one data which is −1 ≤ ≤ 1.Positive answer show positive linear correlation and the negative values shownegative linear correlation. Zero value (0) shows no relationship of correlation.However, stronger relationship exists if the value is to 1 or –1. Apart from thecorrelation efficient, the p-value has also been looked at to measure the significanceof then analysis in which the range are between 0 and 1 to represent the probabilitythat the data would have arisen if the set null hypothesis were true (Fenton & Neil,2012).
In psychological research, Cohen’s (1988) are used in conventions to interpret effectsize. Statistical test on correlation coefficients, they are the descriptive statistic thatindicate the strength of the relationship. Table 2 statistical test below show whetherthe correlation is significantly different from zero, the absolute value of thecorrelation coefficient is an effect size that summarizes the strength of therelationship.
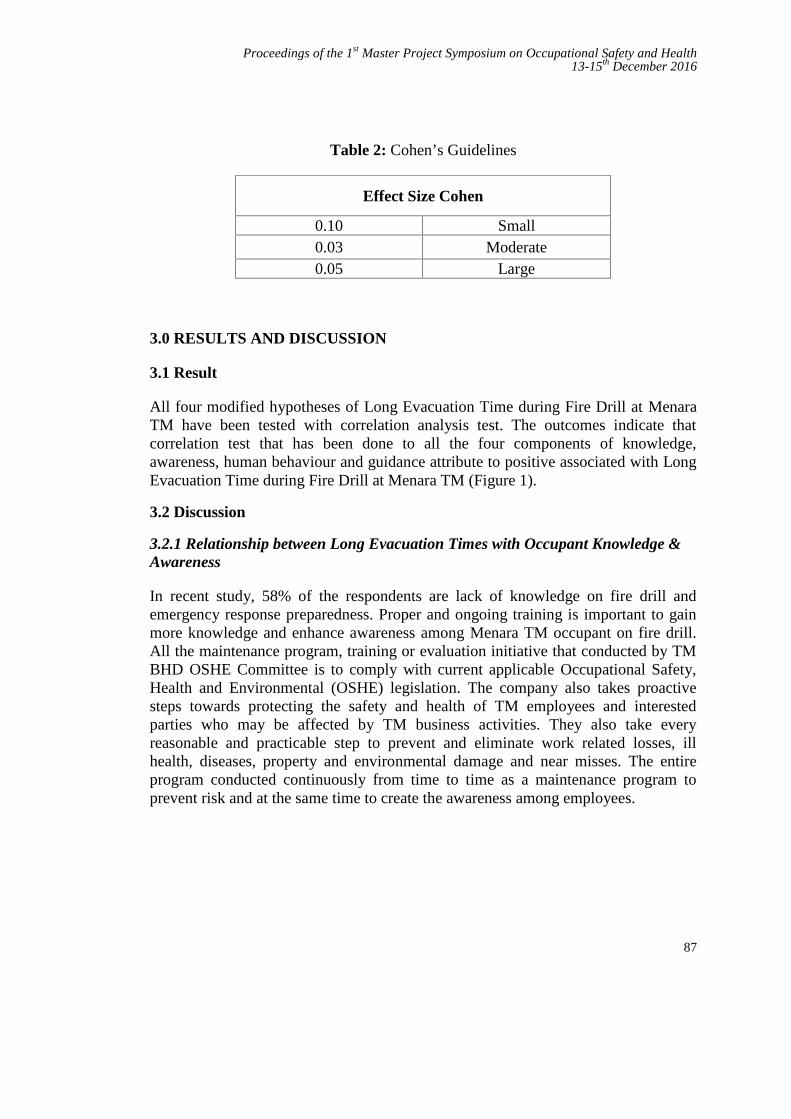
Proceedings of the 1st Master Project Symposium on Occupational Safety and Health13-15th December 2016
87
Table 2: Cohen’s Guidelines
Effect Size Cohen
0.10 Small0.03 Moderate0.05 Large
3.0 RESULTS AND DISCUSSION
3.1 Result
All four modified hypotheses of Long Evacuation Time during Fire Drill at MenaraTM have been tested with correlation analysis test. The outcomes indicate thatcorrelation test that has been done to all the four components of knowledge,awareness, human behaviour and guidance attribute to positive associated with LongEvacuation Time during Fire Drill at Menara TM (Figure 1).
3.2 Discussion
3.2.1 Relationship between Long Evacuation Times with Occupant Knowledge &Awareness
In recent study, 58% of the respondents are lack of knowledge on fire drill andemergency response preparedness. Proper and ongoing training is important to gainmore knowledge and enhance awareness among Menara TM occupant on fire drill.All the maintenance program, training or evaluation initiative that conducted by TMBHD OSHE Committee is to comply with current applicable Occupational Safety,Health and Environmental (OSHE) legislation. The company also takes proactivesteps towards protecting the safety and health of TM employees and interestedparties who may be affected by TM business activities. They also take everyreasonable and practicable step to prevent and eliminate work related losses, illhealth, diseases, property and environmental damage and near misses. The entireprogram conducted continuously from time to time as a maintenance program toprevent risk and at the same time to create the awareness among employees.
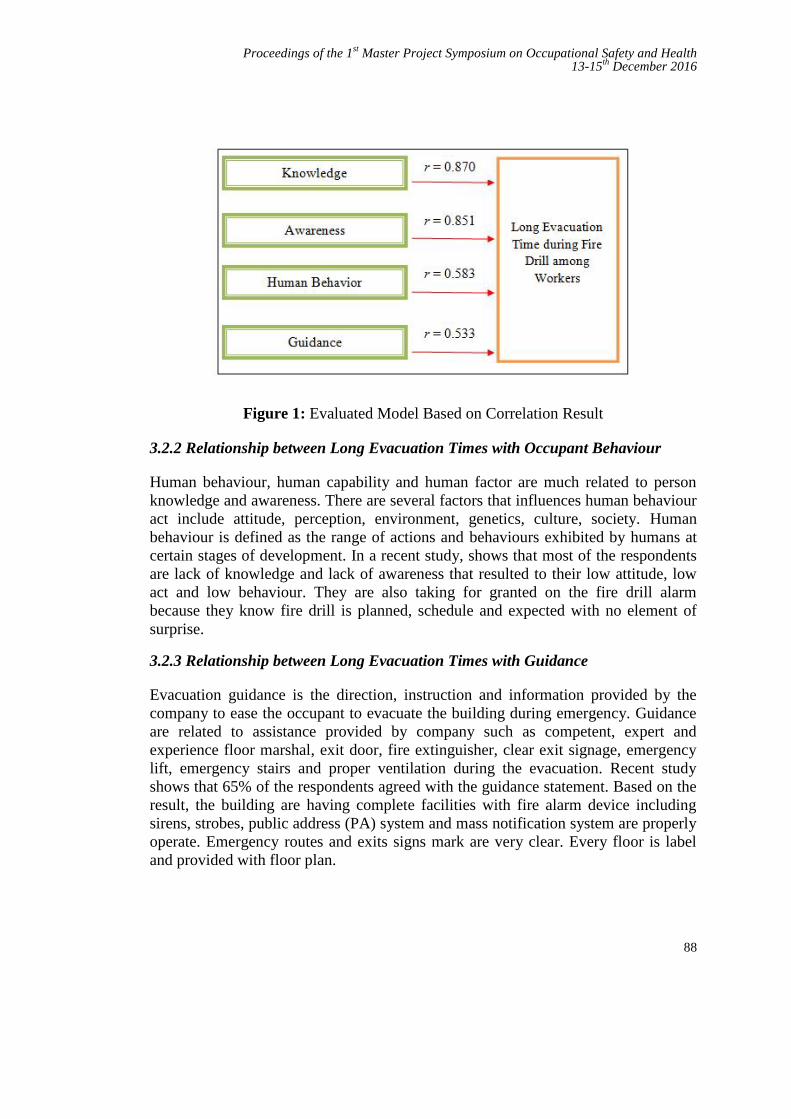
Proceedings of the 1st Master Project Symposium on Occupational Safety and Health13-15th December 2016
88
Figure 1: Evaluated Model Based on Correlation Result
3.2.2 Relationship between Long Evacuation Times with Occupant Behaviour
Human behaviour, human capability and human factor are much related to personknowledge and awareness. There are several factors that influences human behaviouract include attitude, perception, environment, genetics, culture, society. Humanbehaviour is defined as the range of actions and behaviours exhibited by humans atcertain stages of development. In a recent study, shows that most of the respondentsare lack of knowledge and lack of awareness that resulted to their low attitude, lowact and low behaviour. They are also taking for granted on the fire drill alarmbecause they know fire drill is planned, schedule and expected with no element ofsurprise.
3.2.3 Relationship between Long Evacuation Times with Guidance
Evacuation guidance is the direction, instruction and information provided by thecompany to ease the occupant to evacuate the building during emergency. Guidanceare related to assistance provided by company such as competent, expert andexperience floor marshal, exit door, fire extinguisher, clear exit signage, emergencylift, emergency stairs and proper ventilation during the evacuation. Recent studyshows that 65% of the respondents agreed with the guidance statement. Based on theresult, the building are having complete facilities with fire alarm device includingsirens, strobes, public address (PA) system and mass notification system are properlyoperate. Emergency routes and exits signs mark are very clear. Every floor is labeland provided with floor plan.
Proceedings of the 1st Master Project Symposium on Occupational Safety and Health13-15th December 2016
89
4.0 CONCLUSION
This study has highlighted that long evacuation time during fire drill among workersat Menara TM is due to low knowledge, lack of awareness, human behaviour andguidance factors. The company should focus and highlight on important of thetraining requirement. Safety and health training especially in fire safety wasimportant to prevent fires in the workplace and also concentrate on the basic essentialof fire prevention and protection. The finding indicates that most of the workers arelow knowledge and also lack of awareness on fire safety. This is very crucial tocompany and they should take preventive action to overcome the issue. By givingcontinuous training and monitoring on fire safety to workers in order to gain moreawareness and enhance their fire knowledge.
The outcome of this research is to propose an improvement plan on reducingevacuation time during fire drill at Menara TM. This research conducted to increasethe level of awareness on fire safety among occupant at Menara TM by givennecessary training and safety info. This research also conducted to set up safetyworking environment in order to enhance employee health, safety and performanceof work at Menara TM.
Objective one of the research which is to identify the level of knowledge andawareness among workers during fire drill at Menara TM was achieve. The researchhas found out that high response on low knowledge and low awareness level basedon the answer given from the questionnaires. 58% of the respondent is agreed andanother 21% strongly agree that they are still lack of awareness on fire safety. Hence,44% of the respondent agrees that they are still low knowledge and another 23%strongly agrees with lack of knowledge statement.
The second objective of the research which is to determine factors that affected tolong evacuation time during fire drill among workers at Menara TM also achieve. Toanswer second research objective, correlation analysis is use to evaluate therelationship between long evacuation time and factor. All four factors which areknowledge, awareness, human behaviour and guidance show positive result ofrelationship among them.
The third and last objective of the research which is to propose some improvementplan on to reduce long evacuation time during fire drill among workers at MenaraTM was recommended. The company should implement ongoing safety training andeducational program to create awareness and enhance knowledge among workers.These include Meet and Greet among safety team and workers, online training andinclude a lot of quiz on safety to give some safety foundation to all workers and alsoregular safety team building, safety workshop and monthly safety training.Otherwise, the company should train and select competence Marshall Floor to ease
Proceedings of the 1st Master Project Symposium on Occupational Safety and Health13-15th December 2016
90
the evacuation. Marshall Floor is one of the important team in order to direct andgiving info to the occupant to ease the evacuation during a fire drill. Marshall Floorselected must be well train and competent person. Finally company should strengthencompany regulation by forcing the workers on to follow safety standard procedure.
REFERENCES
[1] Yatim YM. An Analysis of The Effect of Staircase Intermediate LandingFloor on The Evacuation Time. Jurnal Alam Bina. 2008;3(12).
[2] Tharmarajan PAL. The Essential Aspects of Fire Safety Management inHigh-Rise Buildings: Universiti Teknology Malaysia; 2007.
[3] Song JDAW. Accounting for Emergency Response in Building Evacuation:Modeling Differential Egress Capacity Solutions. NAtional Institiute ofStandards Technology. 2007.
[4] M. Arja-Liisa Siikonen HH. Efficient Evacuation Methods In Tall Building.2002.
[5] Goverment DfCL. Fire and Rescue Authorities Operational Guidance: TSO(The Stationery Office); 2014.
[6] Chow NCWK. Fire Safety Requirements On Lift System For Evacuation inSupertall Buildings. International Journal on Engineering Performance-BasedFire Codes. 2011;10(2):17-23.
[7] NFZ et all. A Study on Problems Arises in Practicing Fire Drill in High RiseBuilding in Kuala Lumpur. Perak, Seri Iskandar University TeknologiMARA; 2014.
[8] MII et all. The Effectiveness of Emergency Response Plan in SpecialityChemicals Company in Malaysia: University Teknology Malaysia; 2014.
[9] ES et all. Fire Protection for High Rise Buildings. Victoria, Australia 2000.[10] AU et all. Development of Fire Risk Assesment Procedure For The
University Students' Hostel Building In Nigeria. The International Journal OfEngineering And Science (IJES). 2014;3(8):18-21.
[11] Akhter MS. Firefighters' view on Improving Fire Emergency Response: ACase Study of Rawalpindi. International Journal of Hunanities and SocialScience. 2014;4(7)(1).
[12] Chu, J. and Yeh, C. (2012). Emergency Evacuation Guidance Design forComplex Building Geometries, J.Infrastruct. Syst., 10.1061/(ASCE)IS.1943-555X.0000080, pp.288-296.
Proceedings of the 1st Master Project Symposium on Occupational Safety and Health13-15th December 2016
91
Penilaian Mengenai Isu Beg Sekolah BeratDalam Kalangan Guru
Mohd Faisal Jamaludina dan Saárdin Abdul Azizb
UTM Razak School of Engineering and Advanced Technology, Universiti TeknologiMalaysia, Jalan Sultan Yahya Petra, 54100 Kuala Lumpur, Malaysia
a,[email protected], [email protected]
Abstrak - Beg sekolah adalah komponen utama untuk membawa keperluan pelajar kesekolah. Namun sedemikian, beg sekolah boleh memudaratkan pelajar yang membawanyasekira beg tidak diuruskan dengan betul dengan mengambil kira berat dan cara membawabeg sekolah. Berat beg sekolah sering menjadi isu di media massa. Tujuan kajian inidijalankan adalah untuk mengenalpasti faktor-faktor dan tindakan yang diambil oleh guruterhadap isu berat beg sekolah. Kaedah penyelidikan yang dijalankan adalah kaedahtinjauan dimana set soal selidik telah dibangunkan dan diedarkan kepada 120 orang guru disekolah sekitar Pasir Gudang, Johor. Bagi menjelaskan lagi kewujudan isu beg sekolahberat ini, berat beg sekolah bagi pelajar sekolah sekitar Pasir Gudang direkodkan denganmenggunakan alat penimbang elektronik EXCEL berketepatan ±0.01kg untuk mengukurberat beg dan isi kandungannya yang dibawa oleh pelajar ke sekolah. Terdapat penemuandimana julat berat beg beserta isi kandungan adalah 2.55 kg – 5.73 kg dengan kadar purata4.30 kg bagi pelajar yang berusia sekitar tujuh hingga sembilan tahun yang mempunyaiberat badan diantara julat 16.9 kg – 37.7 kg dengan purata berat badan adalah 27.20 kg.Berat badan pelajar diukur dengan menggunakan penimbang OMRON berketepatan ±0.1kg.Nisbah berat beg pelajar yang ditemui adalah 8.80% hingga 30.3% berbanding berat badanmereka. Berat beg pelajar tidak boleh melebihi 15% daripada berat badan mereka.Dapatan kajian menunjukkan 57.26% peratus pelajar membawa berat beg melebihi 15%daripada berat badan mereka. Hasil daripada kajian ini, dicadangkan kepada semua pihakyang terlibat; pelajar, ibu bapa, guru dan pengurusan sekolah untuk memainkan peranandan bekerjasama untuk mengatasi masalah beg sekolah berat bagi menjamin tiada kesankesihatan yang tidak diingini. Pihak Kementerian Pendidikan Malaysia (KPM) dicadangkanuntuk menetapkan satu had berat beg sekolah yang mesti dipatuhi oleh semua pihak yangterlibat.
Kata kunci: Berat beg sekolah; Nisbah berat; Kementerian Pendidikan Malaysia
1.0 PENGENALAN
Apabila fasa persekolahan hampir bermula, perkara utama yang dibayangi oleh ibubapa dan pelajar adalah beg sekolah. Beg sekolah adalah komponen utama untukmelengkapkan satu hari sesi persekolahan dimana didalam beg sekolah akan terisi
Proceedings of the 1st Master Project Symposium on Occupational Safety and Health13-15th December 2016
92
segala keperluan sepanjang pelajar berada di sekolah. Ibu bapa disaran agar memilihbeg yang bersesuaian dan meneliti jadual waktu dan memastikan anak-anakmembawa buku yang dijadualkan sahaja. Kebanyakkan ibu bapa tidak mengambiltahu tentang berat beg sekolah anak mereka, isi kandungan beg sekolah danbagaimana anak mereka mengangkat, membawa atau memakai beg [1-2]. Gurumenjadi sasaran responden kajian kerana mereka adalah lebih dekat dengan pelajarsekolah dan guru adalah contoh terbaik kepada pelajar yang membawa beg sekolahdimana ia merupakan aktiviti harian bagi kebanyakan kanak-kanak.
Penyelidikan berkaitan beg sekolah berat di Malaysia telah dijalankan dalam usahauntuk mengenal pasti had berat beg yang selamat, namun masih tiada kata sepakatmengenai garis panduan berat beg [3-5]. Membawa beg sekolah berat telahmenimbulkan kesan sampingan yang berpanjangan dikalangan kanak-kanak yangsedang bersekolah [6]. Antara kesan membawa beg berat, ia akan mempengaruhigaya berjalan, kesihatan dan ketidakselesaan [7]. Sebahagian buku teks juga telahdibahagikan kepada dua jilid agar tidak terlalu tebal dan berat untuk dibawa kesekolah. Sekurangnya-kurangnya pihak yang berwajib bersikap responsif kepadapermasalahan ini. Terdapat peningkatan kepada saiz dan berat beg yang dibawa olehkanak-kanak apabila mereka membawa buku teks, buku rujukan, buku kerja, bukulatihan dan kamus [8]. Kebanyakkan pelajar membawa beg sekolah yang melebihi15% daripada berat badan mereka, meletakkan mereka kepada risiko untuk sakitbelakang dan kemudaratan. Berat beg sekolah yang melebihi 15% daripada beratbadan pelajar sekolah haruslah dielakkan [9].
Malaysia perlu mencontohi sepertimana yang dilaksanakan oleh negara India dannegara-negara lain yang memainkan peranan dalam membantu mengurangkanpenggunaan buku bercetak selari dengan peredaran teknologi dan maklumat [10].Cabaran baru di era teknologi maklumat dan komunikasi memerlukan penglibatanguru dan aktiviti pembelajaran sepenuhnya yang menjurus ke arah pengajaran danpembelajaran yang efektif serta menyokong persekitaran hijau[11].
2.0 KAEDAH KAJIAN
2.1 Pengukuran Berat Badan dan Berat Beg Sekolah Pelajar Tahap Satu diSekolah Sekitar Pasir Gudang
Pelajar tahap satu yang terlibat dikenalpasti untuk diambil data berat badan dan beratbeg sekolah mereka. Sekolah yang terlibat ialah sekolah kebangsaan di sekitar PasirGudang iaitu Sekolah Kebangsaan Kampung Kopok (SKKK), Sekolah KebangsaanTaman Cahaya Masai (SKTCM), Sekolah Kebangsaan Taman Cendana (SKTC),Sekolah Kebangsaan Taman Scientex (SKTS) dan Sekolah Kebangsaan Taman BukitDahlia (SKTBD).
Proceedings of the 1st Master Project Symposium on Occupational Safety and Health13-15th December 2016
93
2.1.2 Penimbang berat
Alat penimbang berat yang digunakan adalah jenama EXCEL untuk menimbangberat beg, manakala alat penimbang jenama OMRON digunakan untuk menimbangberat badan pelajar.
2.2 Edaran soal selidik kepada guru di Sekolah sekitar Pasir Gudang
Sebanyak 120 set soal selidik telah diedarkan kepada guru sekolah tahap satu, namunhanya 96% (n=115) yang dipulangkan semula kepada pengkaji. Jumlah keseluruhanguru yang mengajar tahap satu untuk kelima buah sekolah ini adalah 120 orang.Pecahan bilangan guru yang menjawab soal selidik adalah terdiri daripada 80 wanitadan 35 lelaki dengan purata umur 29.87 tahun.
2.2.1 Soal Selidik
Soal selidik diedarkan kepada guru tahap satu di sekolah terlibat adalah untukmenjawab objektif kajian iaitu mengenalpasti faktor-faktor yang menyumbangkepada berat beg sekolah dan mengenalpasti tindakan yang diambil oleh guruterhadap isu berat beg sekolah. Soal selidik terdiri daripada lima bahagian termasukdemografi, faktor yang menyumbang kepada berat beg sekolah, tindakan yangdiambil oleh guru terhadap faktor yang menyumbang beg sekolah dan pendapat gurubagi mengatasi beg sekolah berat.
3.0 KEPUTUSAN DAN PERBINCANGAN
3.1 Analisis Berat Beg Sekolah
Keseluruhan pelajar yang terlibat dalam proses mengumpulkan maklumat beratbadan pelajar dan berat beg sekolah adalah 124 orang yang terdiri daripada lima buahsekolah. Berikut adalah hasil dapatan yang menunjukkan SKTS terdiri daripada (n=25) 14 pelajar perempuan dan 11 pelajar lelaki, SKTBD terdiri daripada (n=25) 13pelajar perempuan dan 12 pelajar lelaki, SKTC terdiri daripada (n=25) 15 pelajarperempuan dan 10 pelajar lelaki, SKTCM terdiri daripada (n=24) 13 pelajarperempuan dan 11 pelajar lelaki, dan SKKK terdiri daripada (n=25) 13 pelajarperempuan dan 12 pelajar lelaki dengan julat umur antara tujuh hingga sembilantahun. Rajah 1 menunjukkan graf bar perbandingan bilangan pelajar perempuan danpelajar lelaki yang terlibat dengan kajian.
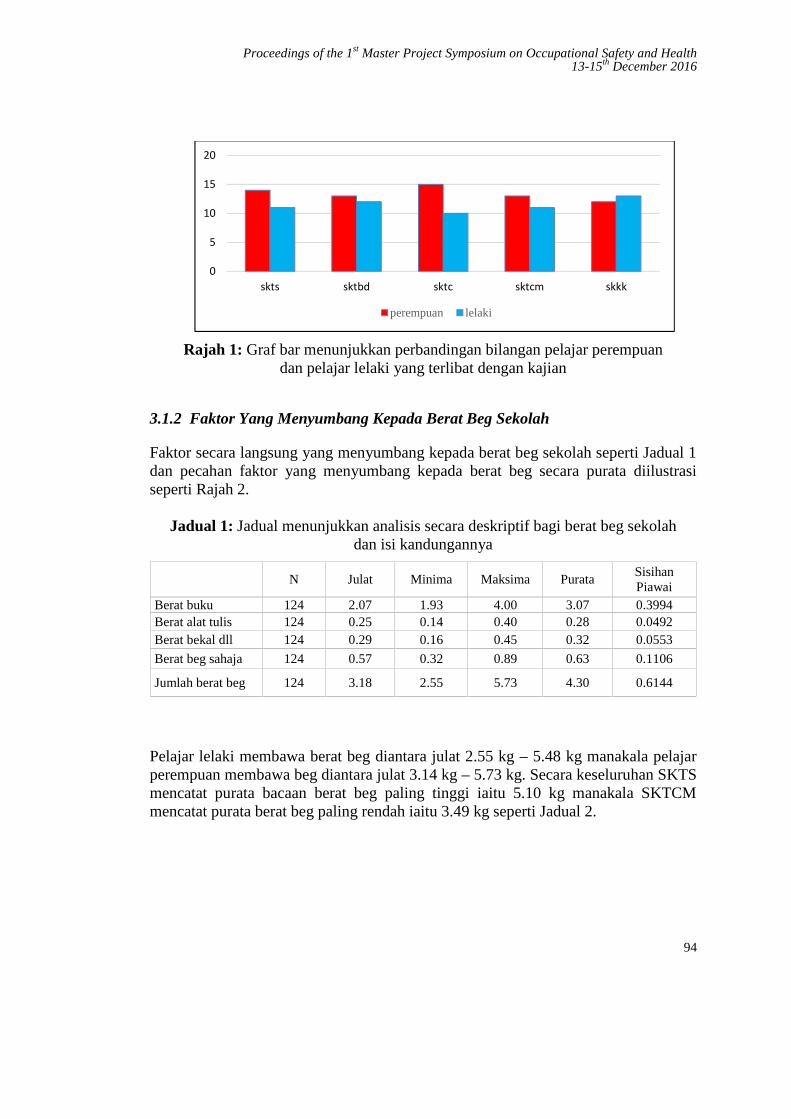
Proceedings of the 1st Master Project Symposium on Occupational Safety and Health13-15th December 2016
94
Rajah 1: Graf bar menunjukkan perbandingan bilangan pelajar perempuandan pelajar lelaki yang terlibat dengan kajian
3.1.2 Faktor Yang Menyumbang Kepada Berat Beg Sekolah
Faktor secara langsung yang menyumbang kepada berat beg sekolah seperti Jadual 1dan pecahan faktor yang menyumbang kepada berat beg secara purata diilustrasiseperti Rajah 2.
Jadual 1: Jadual menunjukkan analisis secara deskriptif bagi berat beg sekolahdan isi kandungannya
N Julat Minima Maksima PurataSisihanPiawai
Berat buku 124 2.07 1.93 4.00 3.07 0.3994Berat alat tulis 124 0.25 0.14 0.40 0.28 0.0492Berat bekal dll 124 0.29 0.16 0.45 0.32 0.0553
Berat beg sahaja 124 0.57 0.32 0.89 0.63 0.1106
Jumlah berat beg 124 3.18 2.55 5.73 4.30 0.6144
Pelajar lelaki membawa berat beg diantara julat 2.55 kg – 5.48 kg manakala pelajarperempuan membawa beg diantara julat 3.14 kg – 5.73 kg. Secara keseluruhan SKTSmencatat purata bacaan berat beg paling tinggi iaitu 5.10 kg manakala SKTCMmencatat purata berat beg paling rendah iaitu 3.49 kg seperti Jadual 2.
0
5
10
15
20
skts sktbd sktc sktcm skkk
perempuan lelaki
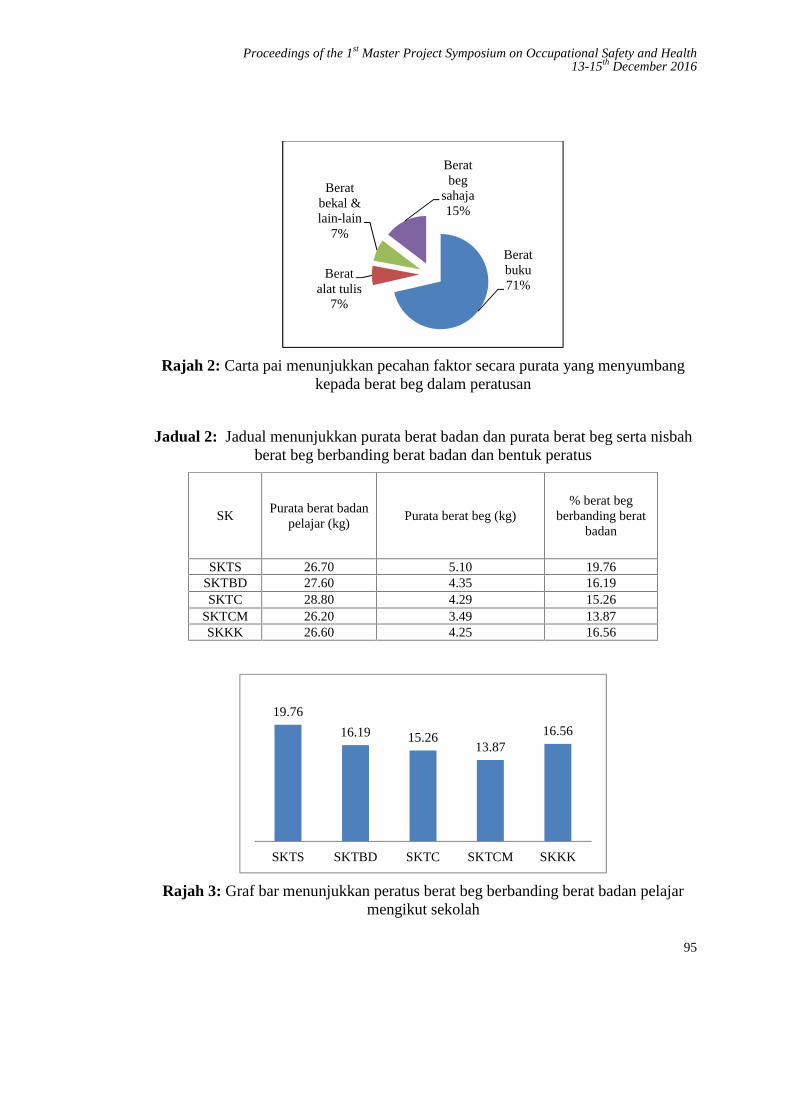
Proceedings of the 1st Master Project Symposium on Occupational Safety and Health13-15th December 2016
95
Rajah 2: Carta pai menunjukkan pecahan faktor secara purata yang menyumbangkepada berat beg dalam peratusan
Jadual 2: Jadual menunjukkan purata berat badan dan purata berat beg serta nisbahberat beg berbanding berat badan dan bentuk peratus
SKPurata berat badan
pelajar (kg)Purata berat beg (kg)
% berat begberbanding berat
badan
SKTS 26.70 5.10 19.76SKTBD 27.60 4.35 16.19SKTC 28.80 4.29 15.26
SKTCM 26.20 3.49 13.87SKKK 26.60 4.25 16.56
Rajah 3: Graf bar menunjukkan peratus berat beg berbanding berat badan pelajarmengikut sekolah
Beratbuku71%
Beratalat tulis
7%
Beratbekal &lain-lain
7%
Beratbeg
sahaja15%
19.76
16.19 15.2613.87
16.56
SKTS SKTBD SKTC SKTCM SKKK

Proceedings of the 1st Master Project Symposium on Occupational Safety and Health13-15th December 2016
96
3.2 ANALISIS SOAL SELIDIK
Hasil daripada kajian rintis yang dijalankan kepada sampel sebanyak 15 orang guru,prosedur Cronbach’ Alpha coefficient di gunakan untuk mengukur darjahkebolehpercayaan instrumen, dan nilai skala yang diperolehi adalah 0.773. Analisisdemografi dilaksanakan untuk mengenalpasti kumpulan responden mengikutpecahan berikut:-
3.2.1 Analisis demografi responden
Analisis demografi responden adalah seperti Rajah 4 hingga Rajah 6.
Rajah 4: Carta pai menunjukkan pecahan responden mengikut jantina dan umur
Rajah 5: Carta pai menunjukkan pecahan responden mengikut tempat bertugas dankelayakan

Proceedings of the 1st Master Project Symposium on Occupational Safety and Health13-15th December 2016
97
Rajah 6: Carta pai menunjukkan pecahan responden mengikut pengalaman mengajar
3.2.2 Bahagian A: Faktor secara tidak langsung yang menyumbang kepada beratbeg
Hasil analisis soal selidik yang diedarkan kepada guru-guru yang mengajar tahapsatu didapati antara faktor-faktor yang menyebabkan beg berat adalah harapan gurukepada pelajar untuk membawa semua buku berkaitan subjek yang diajar denganyang mencatat peratusan tertinggi iaitu 77%, diikuti dengan 72.2% guru bersetujupelajar didapati membawa buku, mainan atau peralatan yang tidak sepatutnya didalam beg sekolah mereka, 66.1% guru bersetuju yang pelajar tidak dibenarkanmeninggalkan buku di dalam kelas diikuti dengan 38.3% guru bersetuju mendendapelajar jika mereka tidak membawa buku yang hendak digunakan.
Rajah 7: Graf bar menunjukan faktor secara tidak langsung yang menyumbangkepada berat beg sekolah
77%
66.10%72.20%
38.30%
23%
33.90%27.80%
61.70%
0%
10%
20%
30%
40%
50%
60%
70%
80%
90%
A1 A2 A3 A4
Setuju
Tidak Setuju
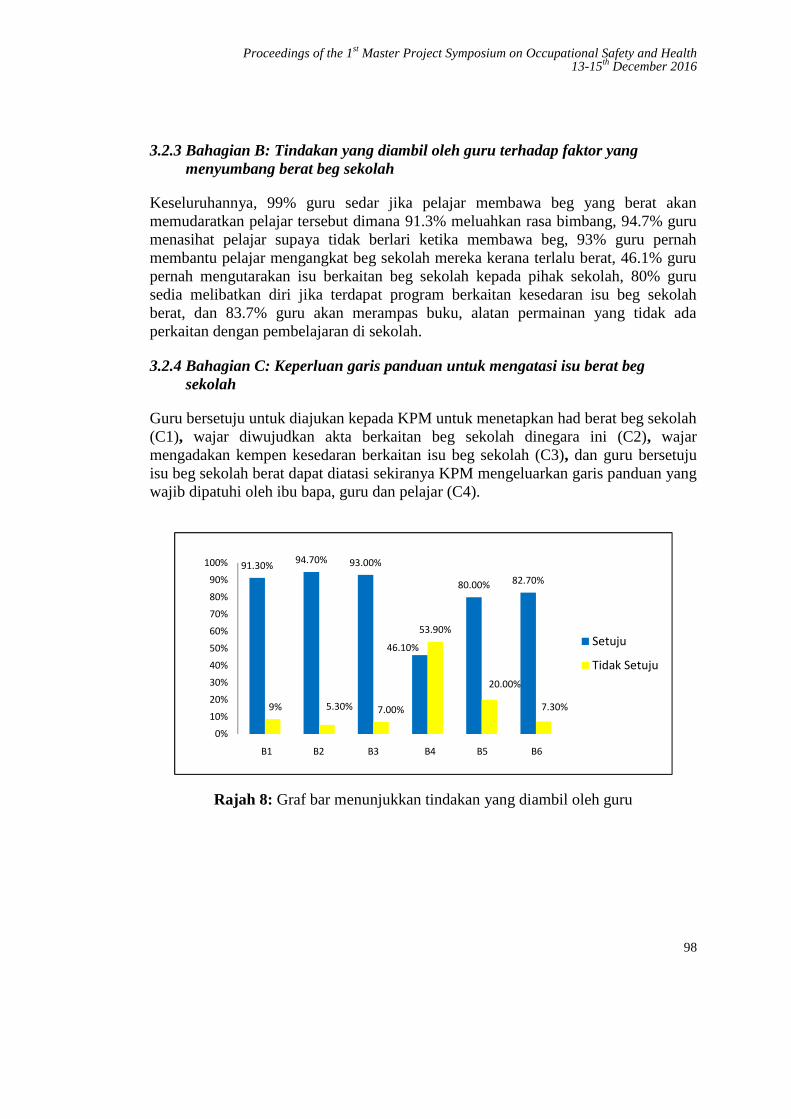
Proceedings of the 1st Master Project Symposium on Occupational Safety and Health13-15th December 2016
98
3.2.3 Bahagian B: Tindakan yang diambil oleh guru terhadap faktor yangmenyumbang berat beg sekolah
Keseluruhannya, 99% guru sedar jika pelajar membawa beg yang berat akanmemudaratkan pelajar tersebut dimana 91.3% meluahkan rasa bimbang, 94.7% gurumenasihat pelajar supaya tidak berlari ketika membawa beg, 93% guru pernahmembantu pelajar mengangkat beg sekolah mereka kerana terlalu berat, 46.1% gurupernah mengutarakan isu berkaitan beg sekolah kepada pihak sekolah, 80% gurusedia melibatkan diri jika terdapat program berkaitan kesedaran isu beg sekolahberat, dan 83.7% guru akan merampas buku, alatan permainan yang tidak adaperkaitan dengan pembelajaran di sekolah.
3.2.4 Bahagian C: Keperluan garis panduan untuk mengatasi isu berat begsekolah
Guru bersetuju untuk diajukan kepada KPM untuk menetapkan had berat beg sekolah(C1), wajar diwujudkan akta berkaitan beg sekolah dinegara ini (C2), wajarmengadakan kempen kesedaran berkaitan isu beg sekolah (C3), dan guru bersetujuisu beg sekolah berat dapat diatasi sekiranya KPM mengeluarkan garis panduan yangwajib dipatuhi oleh ibu bapa, guru dan pelajar (C4).
Rajah 8: Graf bar menunjukkan tindakan yang diambil oleh guru
91.30% 94.70% 93.00%
46.10%
80.00% 82.70%
9% 5.30% 7.00%
53.90%
20.00%
7.30%
0%10%20%30%40%50%60%70%80%90%
100%
Setuju
Tidak Setuju
B1 B2 B3 B4 B5 B6
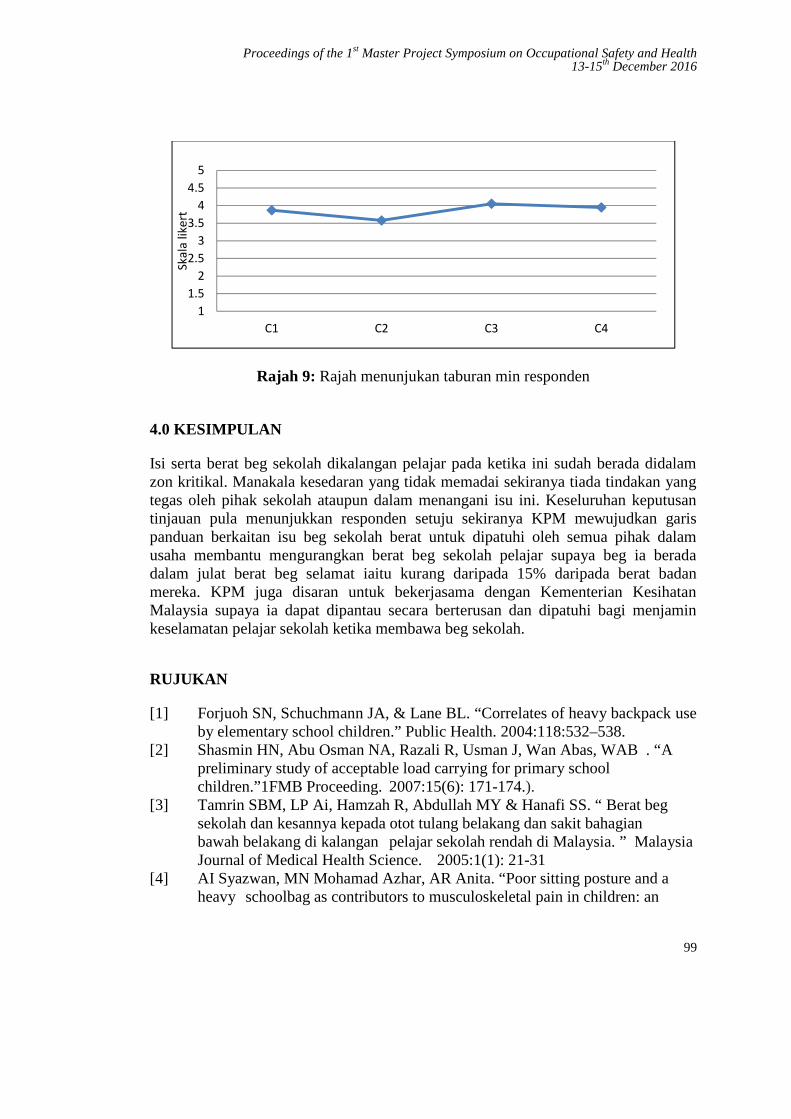
Proceedings of the 1st Master Project Symposium on Occupational Safety and Health13-15th December 2016
99
Rajah 9: Rajah menunjukan taburan min responden
4.0 KESIMPULAN
Isi serta berat beg sekolah dikalangan pelajar pada ketika ini sudah berada didalamzon kritikal. Manakala kesedaran yang tidak memadai sekiranya tiada tindakan yangtegas oleh pihak sekolah ataupun dalam menangani isu ini. Keseluruhan keputusantinjauan pula menunjukkan responden setuju sekiranya KPM mewujudkan garispanduan berkaitan isu beg sekolah berat untuk dipatuhi oleh semua pihak dalamusaha membantu mengurangkan berat beg sekolah pelajar supaya beg ia beradadalam julat berat beg selamat iaitu kurang daripada 15% daripada berat badanmereka. KPM juga disaran untuk bekerjasama dengan Kementerian KesihatanMalaysia supaya ia dapat dipantau secara berterusan dan dipatuhi bagi menjaminkeselamatan pelajar sekolah ketika membawa beg sekolah.
RUJUKAN
[1] Forjuoh SN, Schuchmann JA, & Lane BL. “Correlates of heavy backpack useby elementary school children.” Public Health. 2004:118:532–538.
[2] Shasmin HN, Abu Osman NA, Razali R, Usman J, Wan Abas, WAB . “Apreliminary study of acceptable load carrying for primary schoolchildren.”1FMB Proceeding. 2007:15(6): 171-174.).
[3] Tamrin SBM, LP Ai, Hamzah R, Abdullah MY & Hanafi SS. “ Berat begsekolah dan kesannya kepada otot tulang belakang dan sakit bahagianbawah belakang di kalangan pelajar sekolah rendah di Malaysia. ” MalaysiaJournal of Medical Health Science. 2005:1(1): 21-31
[4] AI Syazwan, MN Mohamad Azhar, AR Anita. “Poor sitting posture and aheavy schoolbag as contributors to musculoskeletal pain in children: an
11.5
22.5
33.5
44.5
5
C1 C2 C3 C4
Skal
a lik
ert
Proceedings of the 1st Master Project Symposium on Occupational Safety and Health13-15th December 2016
100
ergonomic school education intervention program. Journal of Pain Research2011:4 287–296
[5] American occupational Therapy Association. “Backpack Awareness: One ofMany Ways That Occupational Therapists Serve Students.” 2009 Availablefrom: http://www.aota.org/News/Consumer/Backpack08.aspx [Dicapai 6April 2016].
[6] Jing X. L., Youlian H. and Robinson P.D. “The Effect of load carriage onmovement kinematics and respiratory parameters in children duringwalking.” 2003 Springer-Verlag.
[7] Javadivala, Z., Allahverdipour, H., Dianat, I. and Bazargan,M. “Awareness ofParents about Characteristics of a Healthy School Backpack.” HealthPromotion Perspectives. 2012, 2,(2): 166-172.
[8] Barkhordari A., Ehrampoush M.H., Barkhordari M., Derakhshi F.,Barkhoradri M., Mirzaii M. “Assessment of School Backpack Weight andOther Characteristics in Elementary Schools, Yazd, Iran.” Journal ofCommunity Health Research. 2013; 2(1):2- 7.
[9] Khalil Al-Qato, A. “The Influence of Backpacks on Students backs A Cross-Sectional Study of Schools in Tulkarm District , An-Najah NationalUniversity”.2012.
[10] M. Marzuki, C. D. M. Asyraf, R. N. Ahmad B.L. “Effects of Backpack’sWeight on School Children – a Review.” National Symposium onAdvancements in Ergonomics and Safety 2009, 33-37, Perlis, Malaysia.
[11] Ambigapathy, P. Dan Shanti, B. “Technological Literacy for Adults: Insightsfrom Malaysia. dalam Kell, P., Shore, S. dan Singh, M. (ed).” AdultEducation 21st Century, New York, 2004.
Proceedings of the 1st Master Project Symposium on Occupational Safety and Health13-15th December 2016
101
Occupational Stress Effect On JobSatisfaction in Department of Orthopaedic and
Traumatology, Hospital Kuala Lumpur
Mohd Zahid Ismail 1,a, Raihana Mohd Ali1,b, Mohd Nabil Muhtazaruddin1,c andKhairullina Khalid2,d
1UTM Razak School of Engineering and Advanced Technology, UniversitiTeknologi Malaysia, 54100 Jalan Sultan Yahya Petra, Kuala Lumpur, Malaysia
2 Department of Orthopaedic & Traumatology, Hospital Kuala Lumpur,Jalan Pahang, 50586 Kuala Lumpur, Malaysia.
[email protected], [email protected], [email protected], [email protected]
Abstract – Occupational stress exists in all professions, but the health care workers appearto experience more stress at work compared to other professions. Various stressors used asvariables in this study coping of stressful conditions at the workplace that may causedeclination of job satisfaction among healthcare workers. This research investigated theeffects of occupational stress on healthcare workers’ job satisfaction in Department ofOrthopaedics and Traumatology, Hospital Kuala Lumpur (HKL), Malaysia. A survey wasconducted through the distribution of questionnaires to 250 respondents who were workingin Department of Orthopaedics and Traumatology, HKL. Statistical Package for the SocialSciences (SPSS) version 20 was used to analyse the gathered data via t-test, mean,frequency, ANOVA, correlation and linear regression techniques. The results indicated thatthe highest mean of the facet of stressor was job autonomy. Age, the current level inprofession and years of experience were statistically significant with occupational stress andjob satisfaction level. There was also a statistically significant negative impact ofoccupational stress on job satisfaction. For conclusion, this research contributed to the bodyof knowledge with the findings on the impact of occupational stress on job satisfaction. Theessential improvements could be taken through a revision on the organisation’s policyregarding occupational stressors in the department. By giving more attention towards themain contributing stressor (role in the organisation), the management team might mitigatethe impact of occupational stress on healthcare workers’ job satisfaction.
Keywords: Occupational stress, job satisfaction, orthopaedics, traumatology, healthcare workers
1.0 INTRODUCTION
Stress is not something new to the global community. Normally, stress will occurwhen someone is in particular circumstances with an unpleasant state of feeling.
Proceedings of the 1st Master Project Symposium on Occupational Safety and Health13-15th December 2016
102
They tend to focus on the undesirable state of mind and emotions. Hans Selye beganusing the term stress and became a pioneer in conducting a study of psychologicalstress in the 1950s [1]. Stress also has significant effects on individuals’ attitudes,behaviour, and interpersonal relationships and it is shaped by the combination ofnumerous factors [2]. In health care professions, the adverse effects of work stressnot only cause harsh complications for the state of workers’ well-being but alsodisturb the quality of patient care. The background of the occupational stress conceptfor healthcare workers which has various indicators such as substantial workload,poorly resourced work, conflicting patient care, conflicting administrativeresponsibilities, and heavy emotional demands [3].
According to Rosenthal and Alter [4], the demands of the workplace comprise bothoccupational-related and human-related variables. Occupational-related variablesinclude work schedules (shift work or irregular hours, rotating schedules), timeconstraints, machine-paced work, repetitive-routine or tedious goings-on; interactionwith the public; introvert or cooperative tasks; and manageable or unmanageabletasks. Healthcare workers also embrace hierarchical status; diverse responsibility foreach level; autonomy and decision-making power; and status. Stress contributorfactors may arise from unhealthy relationships with co-workers or superiors; unfairand conflicting management traits; inconsistent job demands; and extreme burdensprior to their position or under stimulation although support from colleagues orsuperiors may relieve their stress. A study carried out by Ulrich, Quan, Zimring,Joseph and Choudhary [5] found that the physical conditions and the environment inthe health institution itself such as poor lighting levels and auditory or visualdistractions could also affect healthcare workers effectiveness while performingcritical tasks such as dispensing medical prescriptions. Job satisfaction became oneof the most popular topics in psychology scholars and has been measured as a criticalfactor at hospitals in the provision of superior performance and high-quality services[15]. The main objective of this study is to examine the impact of occupational stresson job satisfaction of the healthcare workers in Department of Orthopaedic andTraumatology, HKL.
2.0 LITERATURE REVIEWS
2.1 Occupational Stress
For the purposes of this review, stress can be defined as a real or perceiveddisproportion between environmental requirements for survival and an individual’scapability to acclimatize to these demands [6-8]. In addition, Mateescu and Chraif [9]mentioned that acclimatization or adaptation is the challenge to deal with theproblem itself or with stressful emotions that are caused by the problem. In a recentstudy conducted by Rosenthal and Alter [4], the two main variables related tooccupational stress were occupational-related and human-related variables. In a study

Proceedings of the 1st Master Project Symposium on Occupational Safety and Health13-15th December 2016
103
carried by Kyriacou [10], he defined that occupational stress as the experience ofadverse emotional state such as frustration, worry, anxiety, and depression ascribedto the occupational-related stressor. Healthcare workers are exposed to various stressfactors; role conflict [11]; role ambiguity [12]; work overload [13, 14]; lack of jobautonomy [15, 16]; and career development stress [17]. Individual level stressors,which are the obvious variables of stress is one of the stressor components of theOrganizational Stress Research Model of Ivancevich and Matteson [18]. Thesestressors include work overload, role conflict, role ambiguity, career goaldiscrepancy, and responsibility for people.
2.2 Job Satisfaction
The basic assumption made by Fiori, Bollmann and Rossier [19] is that employeeswho are more likely to experience positive reactions (eustress) may better appreciatetheir carrier and have better job satisfaction. Similarly, employees who are morelikely to experience negative reactions (distress) may approach their place of workwith negative motivations and prone to be less job satisfaction. Scientific attentionhas focused on the toxic impacts of stress towards brain function, mental andphysical health [20]. Any form of change in an individual’s life involving stress willgive either positive or negative impact. Even though there is an indication thatexcessive stress of everyday life is a better predictor of human mental health andtheir well-being, previous studies pre- dominantly focused on traumatic events ormajor life incidents [8, 21].
Generally, employees’ physical and mental well-being can be recognized throughtheir job satisfaction level. Assessing employee satisfaction towards the job is acrucial element in retaining competent healthcare workers. Many healthcareproviders feel unfulfilled and unconvinced in jobs they anticipated in order to findsatisfaction. They have time constraints to do a quality job for patient care;continually expected to deliver fast and best service as they could, but have a lack ofauthority to overcome the undesirable circumstances; feel unappreciated andunderused of their skills. These factors lead to discouragement, staff turnover, andoverall disenchantment with career development in healthcare service [22].
3.0 METHODOLOGY
The variables for this study were derived from Organisational Stress Model ofIvancevich and Matteson [18]. The intra-organisation stressors were included intoresearch instrument which was adapted from Stress Diagnostic Survey (SDS).Adapted SDS instrument [18] consists 20 questions where can be divided into five(5) individual stressor namely work environment; professional and competencedevelopment; role in the organisation; job autonomy; and interpersonal relationship.Each stressor consists four (4) items. Job Satisfaction Survey (JSS) were used in

Proceedings of the 1st Master Project Symposium on Occupational Safety and Health13-15th December 2016
104
order to assess workers’ satisfaction. The JSS was developed by Spector [23] basedon the respondents from healthcare service background [24]. It consists of 36 itemswith nine individual subscale (facets) and each facet consists 4 items. The instrumentwas a Likert-scale from 1 (disagree very much) to 6 (agree very much).
A pilot test was conducted to 30 samples (11 medical doctors, 16 nurses and 3medical assistants) after Consent for Investigator Initiated Research (IIR) wasobtained from Medical Research Ethics Committee (MREC) and Clinical ResearchCentre (CRC), HKL. Based on the pilot study data, the Cronbach’s alpha was 0.89for SDS and 0.92 for JSS respectively. A full survey was commenced in November2016. The distribution of questionnaires to 250 respondents and 213 was returnedmade the response rate of 85.2%.
However, only 202 questionnaires were valid for data analyses, thus reduced theresponse rate to 81%. All respondents were provided with questionnaire set consistsof demographic survey, SDS [18], JSS, and written Participant Information Sheet(PIS) and Informed Consent Form (ICF) for this study. Respondents comprehendedand volunteered to participate. A computer software program (SPSS version 20) wasused as a tool to analyse acquired data with various analysis techniques.Respondents’ profile and contributing stressors were analysed via descriptivestatistical analyses of frequency, mean, t-test, ANOVA, correlation and regressiontechniques. Linear and multi-regression analyses were conducted in order to analysethe impact of occupational stress on job satisfaction.
4.0 DATA ANALYSES
The analysed respondents’ profile for this study showed various findings. Therespondents for this study were male (32%) and female (68%). There were four (4)groups of current level in profession; specialist (1%); medical doctor (16%); nurse(72%); and medical assistant (11%). For the age group, the majority of therespondents were in 26-35 years old (N=96, 48%) followed by 18-25 years old(N=66, 33%); 36-45 years old (N=28,14%); and 46-55 years old (N=12, 6%).Regarding years of experience among workers, it was divided into three (3)categories which were <5years (N=116, 57%); 6-10 years (N=46, 23%); and >10years (N=40, 20%).
There were three (3) categories occupational stress level of workers in thedepartment; low stress (N=1, 0.5%); moderate stress (N=196, 97%); and high stress(N=5, 2.5%). The majority of workers experience moderate occupational stress leveland female workers were found to experience higher stress (Mean=73.93) comparedto male workers (Mean=71.12). The data shows the job autonomy stressor becamethe highest mean compared to others (Mean=16.32). It was found that there werestatistically significant differences between occupational stress level and age (F (3, 198)
Proceedings of the 1st Master Project Symposium on Occupational Safety and Health13-15th December 2016
105
=5.02, p=0.00.); years of experience (F (2, 199) =10.41, p=0.00.); and current level inthe profession (F (3,198) =8.76, p=0.00).
The study divided job satisfaction into three categories which were satisfied (N=49,24%), ambivalent (N=137, 68%) and dissatisfied (N=16, 8%) with their job. Maleworkers reported slightly higher satisfaction (Mean=134.45) compared to femaleworkers (Mean=131.45). Another significant differences were found between jobsatisfaction level and age (F (3, 198) =4.02, p=0.01); years of experience (F (2, 199)
=9.14, p=0.00); and current level in profession (F (3, 198) =10.15, p=0.00). It had beenproven through correlation analysis, there was a significant negative relationshipbetween occupational stress and job satisfaction (r=-0.95). Through linear regressionanalysis, the occupational stress level was found to has a significant negative impacton job satisfaction. (β = -0.95, p<0.01).
5.0 DISCUSSION
Occupational stress variables used in the study were coherent with the studyconducted by several studies on occupational stress (Areekkuzhiyil, 2014; Caponetti,2012; Hassan Danial Aslam, Rossilah Jamil, & Tariq, 2014; Parker, 1983; Shahzad,Azhar, & Ahmed, 2013). On the other hand, job satisfaction variables used in thestudy also in line with several studies on job satisfaction dimension (Fesharaki et al.,2012; Gumus & Sahin, 2015; Skitsou et al., 2015; Watson, Thompson, & Meade,2007).
The results derived from this study found that the majority of respondentsexperienced moderate occupational stress level. This result might be influenced bynurses with less than 5 years of experience within age group of 18-35 (the majorityrespondents for the study). Through mean comparison analysis, it was found thatfemale workers were experienced higher stress level compared to male. Astatistically significant difference was found between occupational stress level andage, years of experience and current level in the profession. The study indicated thatyounger workers with less working experience and lower rank in their professionwere prone to the higher stress level. This result is consistent with a study done byBalakrishnamurthy and Shankar [25] in term of correlation between experience andstress level.
However, they found that age was not significantly affects stress level, whichcontradicts with the result of this study. The scoring key in SDS was ranged from 40to 99, indicates moderate stress level. When interpreting the data on moderate stresslevel group, there were several respondents who have a tendency to fall into higherstress level group. If the scoring key ranged between 40 to 90 for moderate stresslevel, the numbers of workers with high-stress level would increase from 5 to 26workers. In other words, the moderate stress level group consists of workers who
Proceedings of the 1st Master Project Symposium on Occupational Safety and Health13-15th December 2016
106
have a tendency towards high-stress level. Job autonomy was found to be the highestmean. This result is consistent with findings from Areekkuzhiyil (2014) butcontradicts with results found in a study done by Pisljar (2011), where job autonomyhas no evidence of interaction with occupational stress. The management now shouldconsider this stressor in planning new plan to promote lower stress level in theworkplace and stimulate their workers for higher job satisfaction. Other stressors alsocontributed to the level of occupational stress. In other words, the result of this studygave a better view for determining the contributing stressor to healthcare workers’stress level.
Regarding healthcare workers’ job satisfaction, the study highlighted that maleworkers were more satisfied with their job compared to female workers.Respondents’ age group of 18 to 45 years-old were ambivalent about their jobs andonly those who were in age group of 46 to 55 years-old were found to satisfied.Specialists and medical assistants were found satisfied instead of medical doctors andnurses who were ambivalent about their job. The study also indicates that theworkers with longer working experience were more satisfied compared to those withless experienced workers. In other words, the older workers with longer years ofexperience tend to be satisfied with their job. Furthermore, there were statisticallysignificance differences were found between job satisfaction level and age, years ofexperience and current level in the profession.
Results from the study pointed out that there was a statistically significant negativeimpact of occupational stress levels on job satisfaction among healthcare workers inDepartment of Orthopaedics and Traumatology, HKL (Beta = -0.95, p < 0.01). Asignificance negative correlation was also found between occupational stress and jobsatisfaction (r = -0.95, p < 0.01). This result designates that respondent whoexperienced higher levels of occupational stress normally would experience a lowerlevel of job satisfaction. The finding of this research supported by Alexopoulos et al.(2014) as they concluded that high-stress levels have an insightful negative effect onjob satisfaction. The job satisfaction was most affected by workers’ role inorganisation stressor (Beta= -0.34, p < 0.01). The analysis results revealed that allstressors used in this study have significant negative impacts towards job satisfaction.Chung and Chun (2015) also stated in their study that workplace stressors wereidentified as the main element caused the declination of job satisfaction. When aworker perceived significantly less stress, their perception of job satisfaction washigh [26].
6.0 CONCLUSION
Occupational stress level was found to have a significant negative impact on jobsatisfaction. The stressors of role in organisation appeared as the most affectingfactors on workers’ job satisfaction level. Furthermore, the job autonomy stressor
Proceedings of the 1st Master Project Symposium on Occupational Safety and Health13-15th December 2016
107
was found the highest mean compared to the other stressors. However, the findingsshowed that majority of healthcare workers in the department were experiencedmoderate stress level and ambivalent about their job satisfaction. The overall findingof occupational stress and job satisfaction level might be influence by middle-agednurses with less working experience.
The implication of the findings might contribute to the organisation in order toreview and improve their workers’ job satisfaction. The result of the study also mightcontribute to the body of knowledge, being a reference for future study and for thedepartment itself, in order to lessen occupational stress and to promote higher jobsatisfaction. The Department of Orthopaedic and Traumatology, HKL could createawareness on the workers’ role in the organisation and by giving more autonomy tothe workers. The management also might organise a systematic training on managingstress among the young and less experienced workers as they are more prone to thehigh occupational stress.
Regarding the limitation of the study, it did not investigate on the extra-organisational stressors that might influence the level of stress. There might be a timeconstraint for respondents to answer questionnaires as they were busy with theirroutine duties. Data gathered should have better results by giving more time forrespondents to give their most accurate answers. The answers might be manipulatedby the respondents due to their busy job function and working environment.
For the future study, it is recommended for the researchers not to be too particularwith respondents’ personal details. This requirement sometimes can create anxietyphenomenon among respondents. Thus, they might manipulate the answers. ForMREC, it is suggested to waive the requirement for ICF to be signed by respondentsfor future study if there is neither requirement for clinical nor experiments on humansubjects.
REFERENCES
[1] S. Szabo, Y. Tache, and A. Somogyi, “The legacy of Hans Selye and theorigins of stress research: A retrospective 75 years after his landmark brief“Letter” to the Editor# of Nature,” Informa Healthcare, vol. 15, no. 5, pp.472–478, 2012.
[2] K. Boyacı, F. Şensoy, K. D. Beydağ, and M. Kıyak, “Stress and StressManagement in Health Institutions,” Procedia - Social and BehavioralSciences, vol. 152, pp. 470-475, 10/7/, 2014.
[3] T. Pisljar, T. Van Der Lippe, and L. Den Dulk, “Health among hospitalemployees in Europe: A cross-national study of the impact of work stress andwork control,” Social Science & Medicine, vol. 72, no. 6, pp. 899-906, 3//,2011.
Proceedings of the 1st Master Project Symposium on Occupational Safety and Health13-15th December 2016
108
[4] T. Rosenthal, and A. Alter, “Occupational stress and hypertension,” Journalof the American Society of Hypertension, vol. 6, no. 1, pp. 2-22, 1//, 2012.
[5] R. Ulrich, X. Quan, C. Zimring, A. Joseph, and R. Choudhary, The Role ofthe Physical Environment in the Hospital of the 21st Century: A Once-in-a-Lifetime Opportunity, Health Design, 2004.
[6] M. Laal, “Job Stress Management in Nurses,” Procedia - Social andBehavioral Sciences, vol. 84, pp. 437-442, 7/9/, 2013.
[7] C. N. Othman, R. A. C. Lamin, and N. Othman, “Occupational Stress Indexof Malaysian University Workplace,” Procedia - Social and BehavioralSciences, vol. 153, pp. 700-710, 10/16/, 2014.
[8] S. Sur, and E. S. Ng, “Extending Theory on Job Stress: The InteractionBetween the “Other 3” and “Big 5” Personality Traits on Job Stress,” HumanResource Development Review, vol. 13, no. 1, pp. 79-101, March 1, 2014,2014.
[9] A. Mateescu, and M. Chraif, “The Relationship between Job Satisfaction,Occupational Stress and Coping Mechanism in Educational and TechnicalOrganizations,” Procedia - Social and Behavioral Sciences, vol. 187, pp.728-732, 5/13/, 2015.
[10] C. Kyriacou, “Teacher Stress: Directions for future research,” EducationalReview, vol. 53, no. 1, pp. 27-35, 2001/02/01, 2001.
[11] S. Sharma, “Occupational stress in the armed forces: An Indian armyperspective,” IIMB Management Review, vol. 27, no. 3, pp. 185-195, 9//,2015.
[12] Y. Chung, and J. Chun, “Workplace stress and job satisfaction among childprotective service workers in South Korea: Focusing on the buffering effectsof protective factors,” Children and Youth Services Review, vol. 57, pp. 134-140, 10//, 2015.
[13] J. Graham, A. J. Ramirez, S. Field, and M. A. Richards, “Job Stress andSatisfaction Among Clinical Radiologists,” Clinical Radiology, vol. 55, no. 3,pp. 182-185, 3//, 2000.
[14] D. Prosser, S. Johnson, E. Kuipers, G. Szmukler, P. Bebbington, and G.Thornicroft, “Perceived sources of work stress and satisfaction amonghospital and community mental health staff, and their relation to mentalhealth, burnout and job satisfaction,” Journal of Psychosomatic Research,vol. 43, no. 1, pp. 51-59, 7//, 1997.
[15] P. Trivellas, P. Reklitis, and C. Platis, “The Effect of Job Related Stress onEmployees’ Satisfaction: A Survey in Health Care,” Procedia - Social andBehavioral Sciences, vol. 73, pp. 718-726, 2/27/, 2013.
[16] A. Al-Meerza, S. F. Y. Al-Sayegh, L. M. Al-Sayrafy, E. M. Alkoot, M. K. El-Shazly, and M. I. Kamel, “Comparison of sources and expressions of stressamong hospital and primary health care physicians,” Alexandria Journal ofMedicine, vol. 48, no. 4, pp. 367-371, 12//, 2012.
Proceedings of the 1st Master Project Symposium on Occupational Safety and Health13-15th December 2016
109
[17] M. C. Santos, L. Barros, and E. Carolino, “Occupational stress and copingresources in physiotherapists: a survey of physiotherapists in three generalhospitals,” Physiotherapy, vol. 96, no. 4, pp. 303-310, 12//, 2010.
[18] J. M. Ivancevich, and M. T. Matteson, Stress and work: A managerialperspective, Tucker, GA: Scott, Foresman and Company, 1980.
[19] M. Fiori, G. Bollmann, and J. Rossier, “Exploring the path through whichcareer adaptability increases job satisfaction and lowers job stress: The role ofaffect,” Journal of Vocational Behavior, vol. 91, pp. 113-121, 12//, 2015.
[20] C. Blair, and C. C. Raver, “Poverty, Stress, and Brain Development: NewDirections for Prevention and Intervention,” Academic Pediatrics, vol. 16, no.3, Supplement, pp. S30-S36, 4//, 2016.
[21] P. Schönfeld, J. Brailovskaia, A. Bieda, X. C. Zhang, and J. Margraf, “Theeffects of daily stress on positive and negative mental health: Mediationthrough self-efficacy,” International Journal of Clinical and HealthPsychology, vol. 16, no. 1, pp. 1-10, 1//, 2016.
[22] S. A. Yafe, “Assessing Job Satisfaction Level Of Employees In A TertiaryCare Hospital: A Tool For Talent Retention,” International Journal ofMultidisciplinary Research, vol. 1, no. 2, pp. 494-507, 2011.
[23] P. E. Spector, “Measurement of human service staff satisfaction:Development of the Job Satisfaction Survey,” American Journal ofCommunity Psychology, vol. 13, pp. 693–713, 1985.
[24] M. Astrauskaite, R. Vaitkevicius, and A. Perminas, “Job Satisfaction Survey:A Confirmatory Factor Analysis Based on Secondary School Teachers'Sample,” International Journal of Business and Management, vol. 6, no. 5,pp. 41-50, 2011.
[25] C. Balakrishnamurthy, and S. Shankar, “Impact of Age And Level ofExperience On Occupational Stress Experienced By Non-Gazetted Officersof The Central Reserve Police Force,” Industrial Psychiatry Journal, vol. 18,no. 2, pp. 81-83, 2009.
[26] S. Gandhi, G. Sangeetha, N. Ahmed, and S. K. Chaturvedi, “Somaticsymptoms, perceived stress and perceived job satisfaction among nursesworking in an Indian psychiatric hospital,” Asian Journal of Psychiatry, vol.12, pp. 77-81, 12//, 2014.

Proceedings of the 1st Master Project Symposium on Occupational Safety and Health13-15th December 2016
110
Musculoskeletal Disorders Concerns inWorkers Handling Drinking Water Dispensers
at the Fabrication YardSharmeela Maira Khairul1,a, Hazilah Mad Kaidi2,b and Norliza Mohd Noor2,c
1Department of Environmental, Safety and Health, Module Fabrication Yard,32000 Lumut Perak, Malaysia
2UTM Razak School of Engineering and Advanced Technology, Universiti TeknologiMalaysia, Jalan Sultan Yahya Petra, 54100 Kuala Lumpur, Malaysia
[email protected], [email protected], [email protected]
Abstract – Assessment of the ergonomic risk factors as well as identification of the types ofMusculoskeletal Disorders (MSDs) amongst workers are crucial in identifying andimplementing the appropriate ergonomic intervention program which includes managementand engineering design to overcome this issue at the workplace. This research is conductedon the workers handling drinking water dispensers at the fabrication yard whom areexposed to MSDs risks due to performing tasks without proper ergonomic guidance andwork instructions. The objectives of this research are to identify the work-related MSDsamongst workers through Nordic Musculoskeletal Questionnaire (NMQ) and to assess theergonomic risk factors associate with their activities using Quick Exposure Check (QEC).The outcome of this research is to propose an ergonomic program which includesmanagement and engineering designs to overcome the MSDs at the work site. Through thesefindings and proposed intervention programs, a decrease in occupational injuries andabsenteeism amongst workers have anticipated as well as an increase in the efficiency of theworkers handling drinking water dispensers at the workplace.
Keywords: Musculoskeletal Disorders, Ergonomic Risk Factors, Nordic MusculoskeletalQuestionnaire, Quick Exposure Check
1.0 INTRODUCTION
Before the 18th century, MSDs were not recognized as having etiologic factors.Nevertheless, it was not until the 1970's that occupational factors were examinedusing epidemiologic methods, and the work-relatedness of these conditions beganappearing regularly in the International Scientific literature [1]. Since then, theawareness has increased dramatically and though more than 6000 scientific articleaddressing ergonomics in the workplace have been published [1].

Proceedings of the 1st Master Project Symposium on Occupational Safety and Health13-15th December 2016
111
Work-related MSDs amongst workers are the most common indicators leading tooccupational injuries and illnesses at the workplace. MSDs are defined asimpairments of the bodily structures, such as intervertebral discs, muscles, joints,tendons, ligaments, nerves, or the localized blood circulation system, in the back,wrists, elbows, arms, shoulders, neck, abdomen (e.g. hernia), hips, knees and legs,which are caused or aggravated primarily by the performance of work and by theeffects of the immediate environment in which work is carried out [2].
According to previous similar studies, workers performing industrial repetitive taskare highly exposed to the risk of MSDs problems [3,4,5,6]. MSDs related illnessesresults in low workers’ productivity and has the potential to cause lost time amongstworkers [7,8]. The objectives of this research are to identify the MSDs duringrepetitive Manual Material Handling (MMH) activities associated with handlingdrinking water, to assess the level of risk exposure to work-related MSDs risksduring repetitive activities, and to propose an interventional ergonomics program toreduce the work-related MSDs risks exposure. The findings of this research willguide the development of an effective ergonomic program at the workplace tominimize the exposure to the workers.
2.0 METHODOLOGY
There are many data collection methods that are available to determine the workplaceergonomic risk factors such as through interviews, medical records, self-administeredquestionnaires, physical examinations and video recordings. However, for thisresearch purpose, the data instruments which will be used for data collection are thestandardized NMQ and QEC.
2.1 Data Sampling
Forty selected workers and supervisors were gathered into smaller groups for eachdata collection session. Workers whom were illiterate or require translation on theNMQ and QEC questionnaires were assisted by their supervisors and translators.Afterwards, data is compiled and analysed to determine the types of MSDs and levelof intensity on the MSDs which are currently exposed to the workers. These workersvoluntarily participated in the exercise after they were informed of the aims andimprovement for their work nature. Workers previously affected by disease oraccident to the musculoskeletal system were dismissed from the exercise. Theassessed workers’ nationality was 55% Bangladeshi, 25% Pakistan, 10% Nepaleseand 10% Malaysian.
Proceedings of the 1st Master Project Symposium on Occupational Safety and Health13-15th December 2016
112
2.1.1 Nordic Musculoskeletal Questionnaire
The Standardized NMQ was developed from a project funded by the Nordic Councilof Ministers [9]. The aim was to develop and test standardized questionnaires ongeneral, low back and neck/shoulder musculoskeletal complaints for use inepidemiological studies [9].
For this research, the standardized NMQ were distributed to forty workers that weretasked to handle 2000 units of water dispensers daily from the beginning of shift at6.30 am until the end of shift at 6.30 pm. The process of handling water dispenser asper their job description involves the MMH tasks such as pushing, pulling,stretching, and bending as well as manually distributing the water dispensers atdesignation locations throughout the fabrication yard.
2.1.2 Quick Exposure Check
The QEC is used to assess the physical exposure of MSDs towards the workersthrough determining the risk factors and the level of intensity towards MSDs [10].The QEC questionnaires were given concurrently with the NMQ during the sessionswith the selected workers. Through the assessment and findings of the ergonomicrisk factors, this should lead to improvements of the workstations, working tools andequipment as well as an ergonomic work instruction to perform the tasks effectively.The QEC is also used to re-assess and determine the effectiveness of the workplaceimprovements in minimizing the work-related MSDs amongst workers.
2.2 Data Analysis
Once research data and information have been obtained through the NMQ and QECmethods, data obtained is transferred for statistical analysis using a statisticalprogram SPSS version 22 to assess the frequency of the variables in determiningwork-related MSDs symptoms and its ergonomic risk factors.
Through the data analysis, the prevalence rates of the MSDs symptoms and risks, aswell as exposure levels in the different parts of body regions of the workers, wereable to be identified and assessed. The types of MMH acts which contribute to thehighest number of MSDs were also determined. Thus, it is beneficial in determiningthe proper, appropriate and immediate recommendations to overcome this matter.
2.2.1 NMQ Analysis
The NMQ is categorised into 2 sections, where the first section is focused on generalquestionnaires of items identifying areas of the body causing musculoskeletalproblems. It is aided by body map to indicate nine symptoms sites – neck, shoulders,
Proceedings of the 1st Master Project Symposium on Occupational Safety and Health13-15th December 2016
113
upper back, elbows, low back, wrist/hands, hip/thighs, knees and ankles/feet [9]. Thissection also assesses whether respondents had any musculoskeletal trouble in the last12 months up to the last seven days.
The second section provided additional questions relating to the neck, shoulders andlower back focusing on functional impact at home and work as well as the durationof the problem. This section assesses whether respondents had any musculoskeletaltrouble within the last seven days.
2.2.2 QEC Analysis
The QEC uses checklist and score sheet that is completed by both the Assessor andWorkers. The Exposure level (E) is then calculated as percentage rate between thetotal exposure score (X) and the maximum total score (Xmax) [11]. The ActionLevels (AL) as shown in Table 1 for the exposure score is determine to enablecorrective/ preventive actions to be implemented.
E (%) = (X/Xmax)*100%
Table 1: Action Level IndicatorsAction Level (AL) Indications
AL 1 (E ≤ 40%) Indicates acceptable musculoskeletal loading
AL 2 (41% < E < 50%) Further investigation is needed and changes may berequired
AL 3 (51% < E < 70%) Investigation and changes required soonAL 4 (70% ≤ E) Investigation and change immediately required
3.0 RESULTS AND DISCUSSION
Based on the data collection and analysis through NMQ it was determined that themost prevalence of work-related MSDs amongst workers handling water dispenserswere in the regions of wrists/ hands (92.5%), shoulders (90%) and lower back(87.5%) as shown in Figure 1.
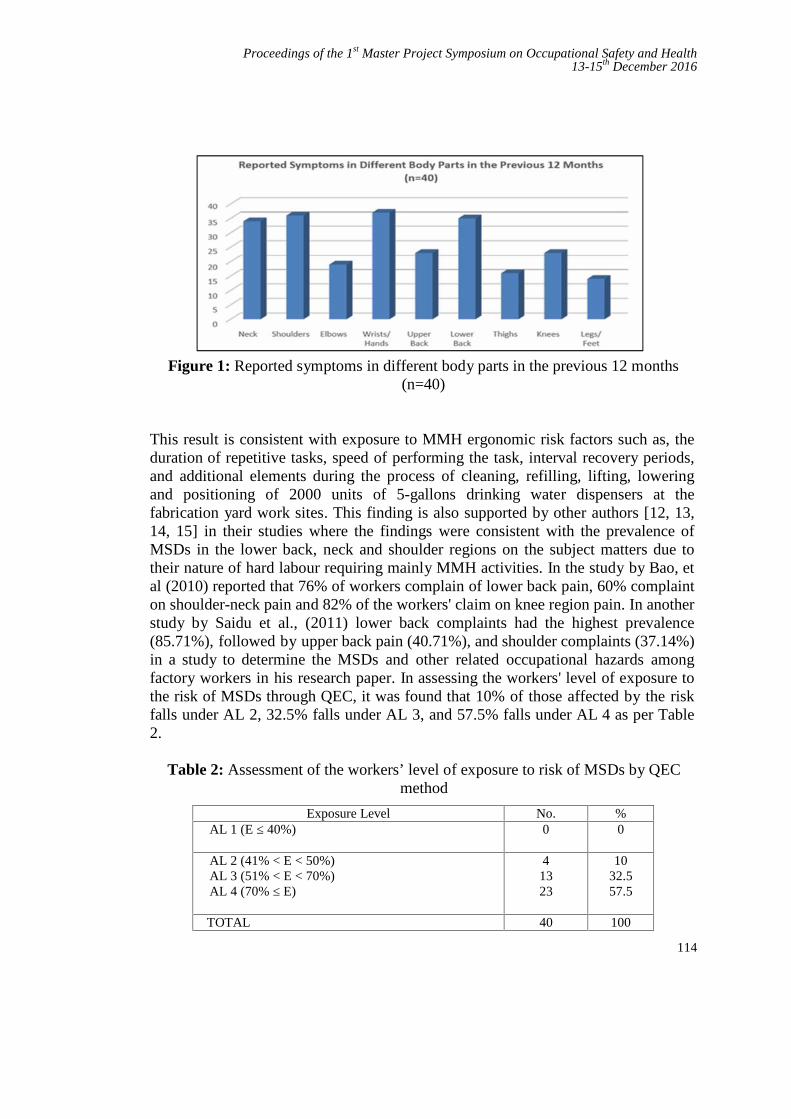
Proceedings of the 1st Master Project Symposium on Occupational Safety and Health13-15th December 2016
114
Figure 1: Reported symptoms in different body parts in the previous 12 months(n=40)
This result is consistent with exposure to MMH ergonomic risk factors such as, theduration of repetitive tasks, speed of performing the task, interval recovery periods,and additional elements during the process of cleaning, refilling, lifting, loweringand positioning of 2000 units of 5-gallons drinking water dispensers at thefabrication yard work sites. This finding is also supported by other authors [12, 13,14, 15] in their studies where the findings were consistent with the prevalence ofMSDs in the lower back, neck and shoulder regions on the subject matters due totheir nature of hard labour requiring mainly MMH activities. In the study by Bao, etal (2010) reported that 76% of workers complain of lower back pain, 60% complainton shoulder-neck pain and 82% of the workers' claim on knee region pain. In anotherstudy by Saidu et al., (2011) lower back complaints had the highest prevalence(85.71%), followed by upper back pain (40.71%), and shoulder complaints (37.14%)in a study to determine the MSDs and other related occupational hazards amongfactory workers in his research paper. In assessing the workers' level of exposure tothe risk of MSDs through QEC, it was found that 10% of those affected by the riskfalls under AL 2, 32.5% falls under AL 3, and 57.5% falls under AL 4 as per Table2.
Table 2: Assessment of the workers’ level of exposure to risk of MSDs by QECmethod
Exposure Level No. %AL 1 (E ≤ 40%) 0 0
AL 2 (41% < E < 50%)AL 3 (51% < E < 70%)AL 4 (70% ≤ E)
41323
1032.557.5
TOTAL 40 100
Proceedings of the 1st Master Project Symposium on Occupational Safety and Health13-15th December 2016
115
As the results of the study in assessing workers handling drinking water dispensersthrough the MMH processes of pushing, pulling, lifting, lowering and stretching, themost prevalence work-related MSDs were observed in the body regions of theshoulders, wrists/hands and lower back. This is in line with most studies on manualhandling with similar work scope which reported a similar prevalence of bodyregions MSDs. Looking at the data where 32.5% and 57.5% of the assessedworkers has an ergonomic risk factors of AL 3 and AL 4 respectively, this findingillustrate that there is a crucial need for an ergonomic risk factor interventionsprogram and technological advancement to assist the workers during their dailyactivities in handling the drinking water dispensers at the fabrication yard inpreventing further escalation of this matter.
3.1 Recommendations
3.1.1 Administrative Improvements
When discussing administrative improvements, it refers to the change or alteration inthe work process and the manner it is being performed. To ensure the effectivenessof the of the administrative improvements implemented at the workplace, continuousmonitoring is required by the management of the organization. Besides that,response and feedback from the workers on the effectiveness and efficiency of theimprovement are also crucial in determining its functionality and practicality.Amongst the suggested administrative improvement for this matter are;
i. Provide work instructions incorporating ergonomic methods of performingthe task.
ii. Provide variety in jobs to eliminate or reduce repetition.iii. Adjust work schedules, work pace, or work practices.iv. Provide recovery time (e.g., short rest breaks).v. Rotate workers through jobs that use different body parts.
vi. Training on manual handling processes to affected workers.
3.1.2 Engineering Improvements
Workers’ exposure to ergonomic risk factors can be minimized throughadministrative improvements as discussed earlier. However, workers may still bephysically exposed to the risk factors which may lead to occupational injuriesduring the job. Thus to overcome this matter, a more effective method is to entirelychange the work practices and methods which contribute to the ergonomic riskfactors. This can be materialized through putting in place appropriate engineeringcontrols and improvements on the method of performing the tasks such asrearranging, modifying, redesigning, providing or replacing tools, equipment,workstations, packaging, parts, processes, products, or materials.
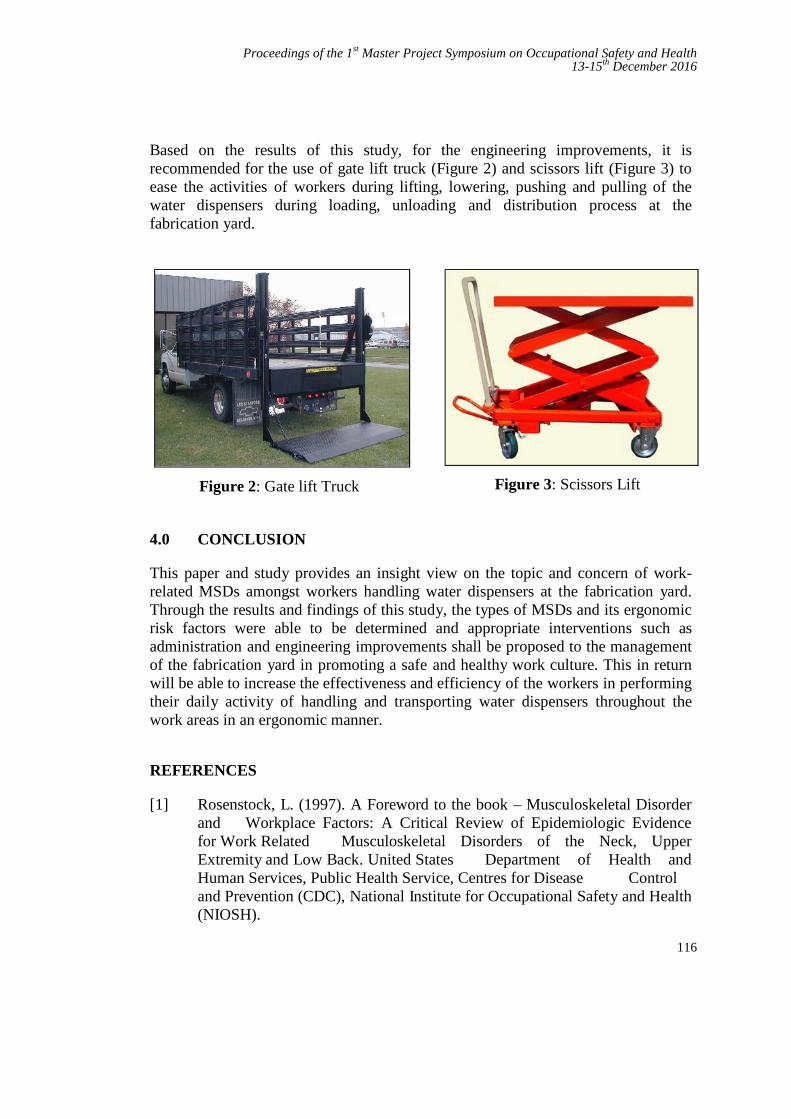
Proceedings of the 1st Master Project Symposium on Occupational Safety and Health13-15th December 2016
116
Based on the results of this study, for the engineering improvements, it isrecommended for the use of gate lift truck (Figure 2) and scissors lift (Figure 3) toease the activities of workers during lifting, lowering, pushing and pulling of thewater dispensers during loading, unloading and distribution process at thefabrication yard.
Figure 2: Gate lift Truck Figure 3: Scissors Lift
4.0 CONCLUSION
This paper and study provides an insight view on the topic and concern of work-related MSDs amongst workers handling water dispensers at the fabrication yard.Through the results and findings of this study, the types of MSDs and its ergonomicrisk factors were able to be determined and appropriate interventions such asadministration and engineering improvements shall be proposed to the managementof the fabrication yard in promoting a safe and healthy work culture. This in returnwill be able to increase the effectiveness and efficiency of the workers in performingtheir daily activity of handling and transporting water dispensers throughout thework areas in an ergonomic manner.
REFERENCES
[1] Rosenstock, L. (1997). A Foreword to the book – Musculoskeletal Disorderand Workplace Factors: A Critical Review of Epidemiologic Evidencefor Work Related Musculoskeletal Disorders of the Neck, UpperExtremity and Low Back. United States Department of Health andHuman Services, Public Health Service, Centres for Disease Controland Prevention (CDC), National Institute for Occupational Safety and Health(NIOSH).
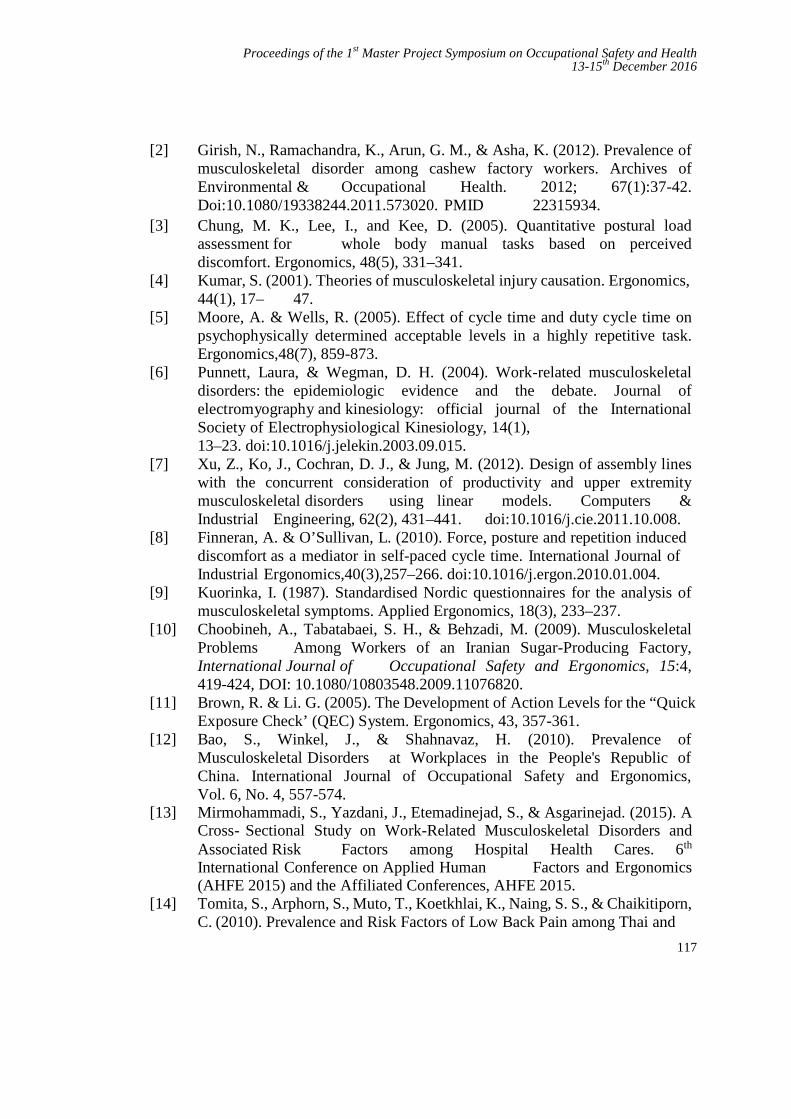
Proceedings of the 1st Master Project Symposium on Occupational Safety and Health13-15th December 2016
117
[2] Girish, N., Ramachandra, K., Arun, G. M., & Asha, K. (2012). Prevalence ofmusculoskeletal disorder among cashew factory workers. Archives ofEnvironmental & Occupational Health. 2012; 67(1):37-42.Doi:10.1080/19338244.2011.573020. PMID 22315934.
[3] Chung, M. K., Lee, I., and Kee, D. (2005). Quantitative postural loadassessment for whole body manual tasks based on perceiveddiscomfort. Ergonomics, 48(5), 331–341.
[4] Kumar, S. (2001). Theories of musculoskeletal injury causation. Ergonomics,44(1), 17– 47.
[5] Moore, A. & Wells, R. (2005). Effect of cycle time and duty cycle time onpsychophysically determined acceptable levels in a highly repetitive task.Ergonomics,48(7), 859-873.
[6] Punnett, Laura, & Wegman, D. H. (2004). Work-related musculoskeletaldisorders: the epidemiologic evidence and the debate. Journal ofelectromyography and kinesiology: official journal of the InternationalSociety of Electrophysiological Kinesiology, 14(1),13–23. doi:10.1016/j.jelekin.2003.09.015.
[7] Xu, Z., Ko, J., Cochran, D. J., & Jung, M. (2012). Design of assembly lineswith the concurrent consideration of productivity and upper extremitymusculoskeletal disorders using linear models. Computers &Industrial Engineering, 62(2), 431–441. doi:10.1016/j.cie.2011.10.008.
[8] Finneran, A. & O’Sullivan, L. (2010). Force, posture and repetition induceddiscomfort as a mediator in self-paced cycle time. International Journal ofIndustrial Ergonomics,40(3),257–266. doi:10.1016/j.ergon.2010.01.004.
[9] Kuorinka, I. (1987). Standardised Nordic questionnaires for the analysis ofmusculoskeletal symptoms. Applied Ergonomics, 18(3), 233–237.
[10] Choobineh, A., Tabatabaei, S. H., & Behzadi, M. (2009). MusculoskeletalProblems Among Workers of an Iranian Sugar-Producing Factory,International Journal of Occupational Safety and Ergonomics, 15:4,419-424, DOI: 10.1080/10803548.2009.11076820.
[11] Brown, R. & Li. G. (2005). The Development of Action Levels for the “QuickExposure Check’ (QEC) System. Ergonomics, 43, 357-361.
[12] Bao, S., Winkel, J., & Shahnavaz, H. (2010). Prevalence ofMusculoskeletal Disorders at Workplaces in the People's Republic ofChina. International Journal of Occupational Safety and Ergonomics,Vol. 6, No. 4, 557-574.
[13] Mirmohammadi, S., Yazdani, J., Etemadinejad, S., & Asgarinejad. (2015). ACross- Sectional Study on Work-Related Musculoskeletal Disorders andAssociated Risk Factors among Hospital Health Cares. 6th
International Conference on Applied Human Factors and Ergonomics(AHFE 2015) and the Affiliated Conferences, AHFE 2015.
[14] Tomita, S., Arphorn, S., Muto, T., Koetkhlai, K., Naing, S. S., & Chaikitiporn,C. (2010). Prevalence and Risk Factors of Low Back Pain among Thai and

Proceedings of the 1st Master Project Symposium on Occupational Safety and Health13-15th December 2016
118
Myanmar Migrant Seafood Processing Factory Workers in Samut SakornProvince, Thailand. Industrial Health, 2010, 48, 283–291.
[15] Saidu, I. A, Utti, V. A., Jaiyesimi, A. O., Rufa'i, A. A., Maduaqwu, S. M.,Onuwe, H. A., & Mohd Jajere, A. (2011). Prevalence of MusculoskeletalInjuries Among Factory Workers in Kano Metropolis, Nigeria,International Journal of Occupational Safety and Ergonomics, 17:1, 99-102

Proceedings of the 1st Master Project Symposium on Occupational Safety and Health13-15th December 2016
119
Safety Awareness during Energy Audit atMain Switchboard Room
SitiMaisarah Harona, Nurul Aini Banib and Siti Armiza Mohd Arisc
UTM Razak School of Engineering and Advance Technology, Universiti TeknologiMalaysia, 54100 Jalan Sultan Yahya Petra, Kuala Lumpur, Malaysia
[email protected], [email protected], [email protected]
Abstract - Arc flash is one of the workplace accidents happened in mostmanufacturing industry due to electric fault. Electric arc fault can occur if a personis interacting at very close proximity with the equipment in such a manner. Theexplosion of thermal temperature can cause injuries like damage hearing or brain,eyesight and burn. Therefore, this study is to identify the potential hazard duringenergy audit at main switchboard (MSB) and measure the level of safety awarenessthat has been practiced by the employees of Company A. The aim of the study is topropose effective safety program that can be implemented to increase safetyawareness among electrical employee. Questionnaires were developed anddistributed to the energy auditors in Company A. The results of the study showed that49% of the employees did not received any safety and health training due to their jobscope.
Keywords: Arc flash, energy audit, electrical hazards
1.0 INTRODUCTION
Arc flash is one of the workplace accident happened in most of manufacturingindustry. An arc flash hazard is known as “A hazardous condition associated with thepossible release of energy caused by an electric arc” [1].The release of electricalenergy with high voltage exists across gap between conductors known as arc flash[2]. Furthermore, any of these conditions of electrical fault can cause an explosionlikes employee is working very near with the energized conductors or circuits, movesnear or contact the equipment or equipment failure occurs. An explosion of thermaltemperature can exceed more than 5000 degrees [2]. The pressure waves fromexplosions can cause injuries like damage hearing and brain malfunction while aflash can damage eyesight and exposed to burn.
There are a few accidents due to an arc flash accident and it happened at BrookhavenNational Laboratory (BNL) on April 14, 2006 where in electrical panel an explosion
Proceedings of the 1st Master Project Symposium on Occupational Safety and Health13-15th December 2016
120
was happened during an electrical engineer closing a fused-disconnect switch. Hewas injured due to an arc flash [3]. The report state that an electrical engineer wasnot wearing appropriate PPE and his face and body was burned at first and seconddegree of burn. The National Fire Protection Association (NFPA) is Standard forElectrical Safety Requirements has been describing widely requirements in electricalequipment, Personal Protective Equipment (PPE), Lockout/Tagout system and safetytraining to protect worker from hazards but the employer cannot depend onprotective equipment only because it does not take a proper safety. Therefore, OSHAwas enforces NFPA 70E under the ‘General Duty Clause’ which needs employers toprepare a workplace that is safe and free from any hazards that can cause seriousphysical hazards or death [4]. According to this, training is needed and important.Generally the training needs to focus on skills of technical, instrumentation,procedures of safe operating and personal protective equipment, instruction onorganizational behaviour or individual that can influence workers and workersattitude [5]. There is a group of research shows that can influence on safe behaviourand the occurrence of accident is job and organizational level factors [6].
In this research study, energy auditors in company A are exposed to the arc flashhazard. An energy audit involves the process of inspection, survey and analysis ofenergy flows for energy conservation over a building. The technical auditors need totake energy load at Main Switch Board (MSB) and Sub-Switch Board (SSB) to knowthe energy flows. The chances of arc flash hazard are high due to limited spacebetween each 3 phase cable. Arc accident also can occur due to various causes suchas poorly installed equipment, natural aging of equipment, bad condition and faultyconnection due to corrosion [7].
1.1 The Importance of Awareness
An Occupational Safety and Health Act were established on 24th February 1994 [6].The objective of this act are to provide an occupational environment which isadapted to persons physiological and psychological needs, to secure the safety, healthand welfare against risks to safety or health arising from activities of person at workand other persons also [8]. it provides the framework rules to persuade and promotehigh standards for occupational safety and health to ensure that for establishing a safework environment are responsibility of employer and employees [9]. The safetymanagement system combines all elements in workplace that need concentration toensure a safe working environment and the level of security can be measure by safetypolicy, program safety, training, accident investigation and equipment personalprotective. Besides that, unsafe acts, unsafe conditions or a combination of both arethe factors that can causes of accident in the workplace. Therefore, Employer has toprovide safe work procedures for each work activity.
Human factors are the highest percentage which is more than 90% that contribute tothe workplace accident and this has been done thru a research [8]. Human factors

Proceedings of the 1st Master Project Symposium on Occupational Safety and Health13-15th December 2016
121
defines as personal, occupational, environment and organizational. The factors ofworkers that can causes into personal injuries are careless, apathy, boredom,temperament flirt and fight and not sensitive to the risk of accidents [6]. Meanwhileoccupational factors are machines that are not maintained periodically, poor design,lack of prevention equipment, not smooth in working environment, lights not in goodconditions, levels of noise very high, expose to the smoke and dust [6]. Anotherfactors is failure of management that cause from employers the level of supervisionof the accident is unsatisfactory, working hours excessive, insensitive to workerfatigue, do not provide an adequate training in the handling of equipment andmachines, not enforce the rules, insensitive to the complaints of employee, considerstrivial to safety and health job and are not willing to provide for the safety programand occupational health [8].
1.1.1 Understanding The Electrical Hazards
Electricity has been known to give a serious workplace hazards such as electricshock, burns, fire and explosion. Thus, in the following discusses on the workplacehazard that were addressed by the OSHA
A) Electrical Shock
Electrical shock is the physiological reaction or injury caused by electrical current. Itis happening when the current path completes by the person’s body. The differencein potential will allow the current to flow from one part of the body to another. Theseverity of effects depends on several factors:
Major factors of resistance are body resistance whether wet or dry skin Circuit voltage The quantity of current flowing through the body (determined by the body
resistance and system voltage) Path of Current to the body Area of electrical shock contact Duration of contact
Burns are most common shock related injury although the majority of electrocutionsare the result of ventricular fibrillation [10]. The immediate effects are musclecontraction, vital organs, pain, breathing, disorientation and death meanwhile forlong term the person who injured by electrical shock will have memory loss, nervousdisorders, chemical imbalances, damage to vital organs and sometimes fatal.
B) Electrical Arc Flash
The electrical arc flash produces light and heat and supplied with sufficient electricalenergy. Various studied are shows that burns due to arc flash are the serious
Proceedings of the 1st Master Project Symposium on Occupational Safety and Health13-15th December 2016
122
electrical injuries where they have a large number of records. The arc temperature orflash flame, the incident energy and the pressure developed by the arc or blast is thethree different causes due to arc flash. The flash flame and ignition of clothing arethe main focus that dealing with the arc temperature whiles the concentration moreon burning of skin. Refer to the Code of Federal Regulation, Occupational Safety andHealth (OSHA) state that safety related work practices should apply to preventelectrical shock or other injuries either indirect or direct electrical contacts. This referto the Arc Flash requirement that contained in NFPA 70E. The requirement in theNFPA 70E are switchboards, panel boards, industrial control panels and motorcontrol centres that are require examination, adjustment or maintenance should havedone by qualified persons.
C) Electrical Arc Blast
An electrical arc blast is the expansion of the rapid air caused by an electrical arc.The pressures from an arc are developed from two sources which are the expansionof the metal in boiling and vaporizing and the heating of the air by passage of the arcthrough it. Fragmented metal can be fly at high speed and molten causing from it isdue to the pressure from expanding copper vapor, where can injure or kill anyonewho standing nearby. Besides that, it can because burn injuries due to molten metalignite clothing.
2.0 METHODOLOGY
In this section, the methodology of the study is discussed. A survey was done to theemployer and the employee of Company A in order to discover the awareness level.The survey was based to their awareness of the following sub-section
2.1 Electrical Hazard Analysis
In NFPA 70E, the Standard for Electrical Safety in the Workplace contains therequirements for performing the analysis where include the Shock Hazard Analysisand the Flash Hazard Analysis. Arc flash hazard analysis will assist in identifying theapproach boundaries to understand the electrical shock and the electrical arc flashhazard protection. The Electrical Hazard Analysis is used to determine the Limited,Restricted and Prohibited Approach Boundaries.
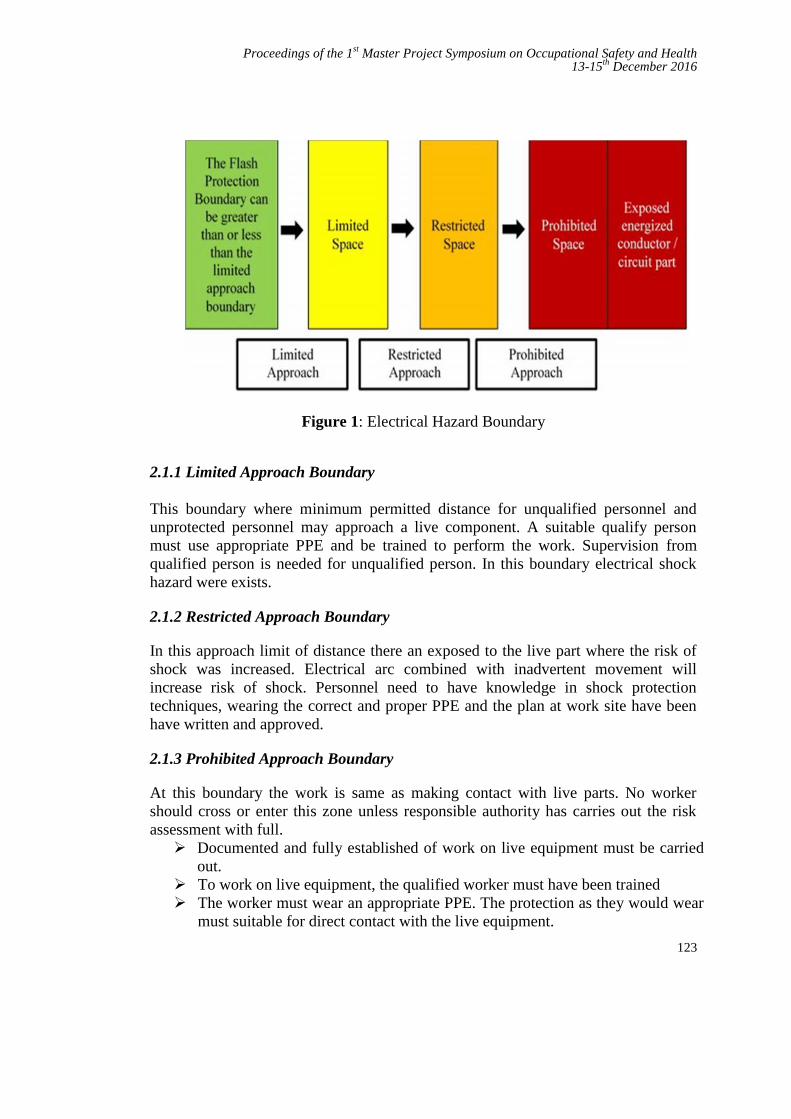
Proceedings of the 1st Master Project Symposium on Occupational Safety and Health13-15th December 2016
123
Figure 1: Electrical Hazard Boundary
2.1.1 Limited Approach Boundary
This boundary where minimum permitted distance for unqualified personnel andunprotected personnel may approach a live component. A suitable qualify personmust use appropriate PPE and be trained to perform the work. Supervision fromqualified person is needed for unqualified person. In this boundary electrical shockhazard were exists.
2.1.2 Restricted Approach Boundary
In this approach limit of distance there an exposed to the live part where the risk ofshock was increased. Electrical arc combined with inadvertent movement willincrease risk of shock. Personnel need to have knowledge in shock protectiontechniques, wearing the correct and proper PPE and the plan at work site have beenhave written and approved.
2.1.3 Prohibited Approach Boundary
At this boundary the work is same as making contact with live parts. No workershould cross or enter this zone unless responsible authority has carries out the riskassessment with full. Documented and fully established of work on live equipment must be carried
out. To work on live equipment, the qualified worker must have been trained The worker must wear an appropriate PPE. The protection as they would wear
must suitable for direct contact with the live equipment.
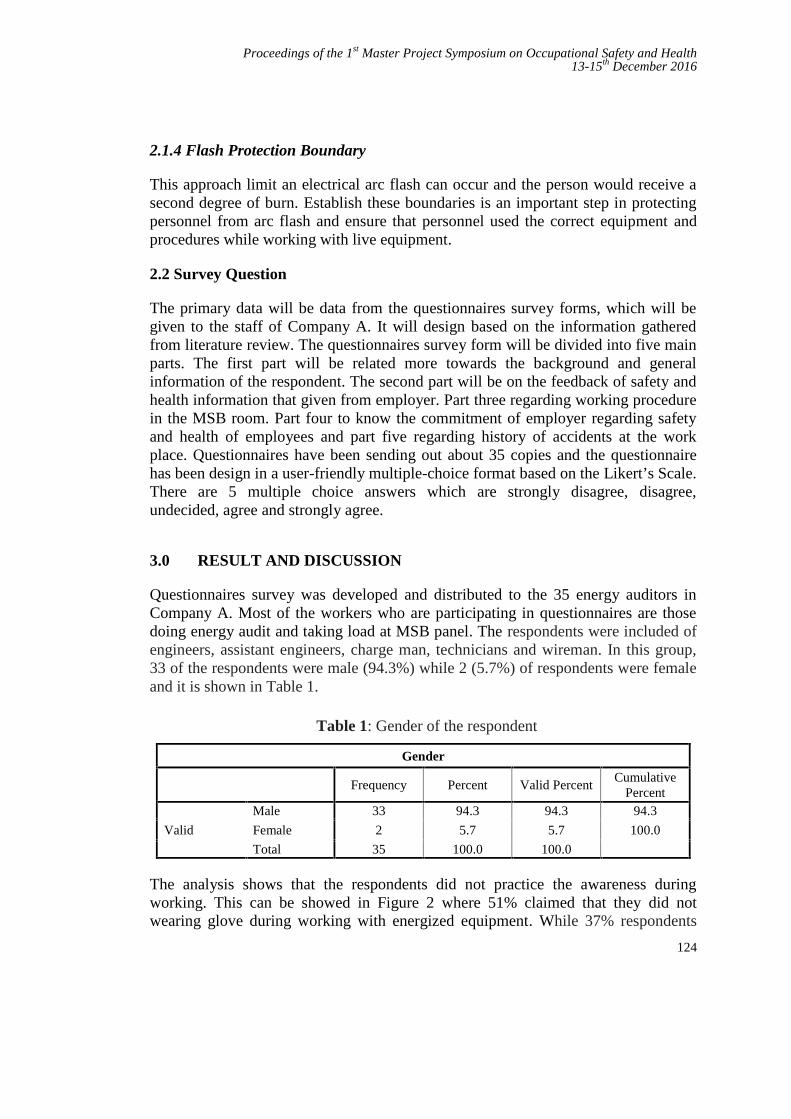
Proceedings of the 1st Master Project Symposium on Occupational Safety and Health13-15th December 2016
124
2.1.4 Flash Protection Boundary
This approach limit an electrical arc flash can occur and the person would receive asecond degree of burn. Establish these boundaries is an important step in protectingpersonnel from arc flash and ensure that personnel used the correct equipment andprocedures while working with live equipment.
2.2 Survey Question
The primary data will be data from the questionnaires survey forms, which will begiven to the staff of Company A. It will design based on the information gatheredfrom literature review. The questionnaires survey form will be divided into five mainparts. The first part will be related more towards the background and generalinformation of the respondent. The second part will be on the feedback of safety andhealth information that given from employer. Part three regarding working procedurein the MSB room. Part four to know the commitment of employer regarding safetyand health of employees and part five regarding history of accidents at the workplace. Questionnaires have been sending out about 35 copies and the questionnairehas been design in a user-friendly multiple-choice format based on the Likert’s Scale.There are 5 multiple choice answers which are strongly disagree, disagree,undecided, agree and strongly agree.
3.0 RESULT AND DISCUSSION
Questionnaires survey was developed and distributed to the 35 energy auditors inCompany A. Most of the workers who are participating in questionnaires are thosedoing energy audit and taking load at MSB panel. The respondents were included ofengineers, assistant engineers, charge man, technicians and wireman. In this group,33 of the respondents were male (94.3%) while 2 (5.7%) of respondents were femaleand it is shown in Table 1.
Table 1: Gender of the respondent
Gender
Frequency Percent Valid PercentCumulative
Percent
Valid
Male 33 94.3 94.3 94.3
Female 2 5.7 5.7 100.0
Total 35 100.0 100.0
The analysis shows that the respondents did not practice the awareness duringworking. This can be showed in Figure 2 where 51% claimed that they did notwearing glove during working with energized equipment. While 37% respondents

Proceedings of the 1st Master Project Symposium on Occupational Safety and Health13-15th December 2016
125
agree and 12% respondents were undecided. The reason for not wearing the gloves isbecause they had never attended any safety training. Meanwhile in Figure 3 showsthat 57% said they did not wear a long sleeve shirt during working. This also anotherfinding which showed that the employee did not follow the OSH procedure.
Figure 2: Wearing glove during working
Figure 3: Using long sleeve during working
Another result of safety awareness implementation is shown in Figure 4 whichshowed that 60% of respondents did not used the face shields when working in MainSwitchboard (MSB) room. OSHA has determined that PPE a good way to protectemployees because the arc flash incident can result from human error and also fromequipment that not functions in good and accident also can arise related to humanbehaviour. However, this has not being implemented by the employee in theCompany A.
6%
51%12%
31% StronglyDisagree
Disagree
Undecided
Agree
37%
20%
11%
26%
6% StronglyDisagree
Disagree
Undecided
Agree
Strongly Agree
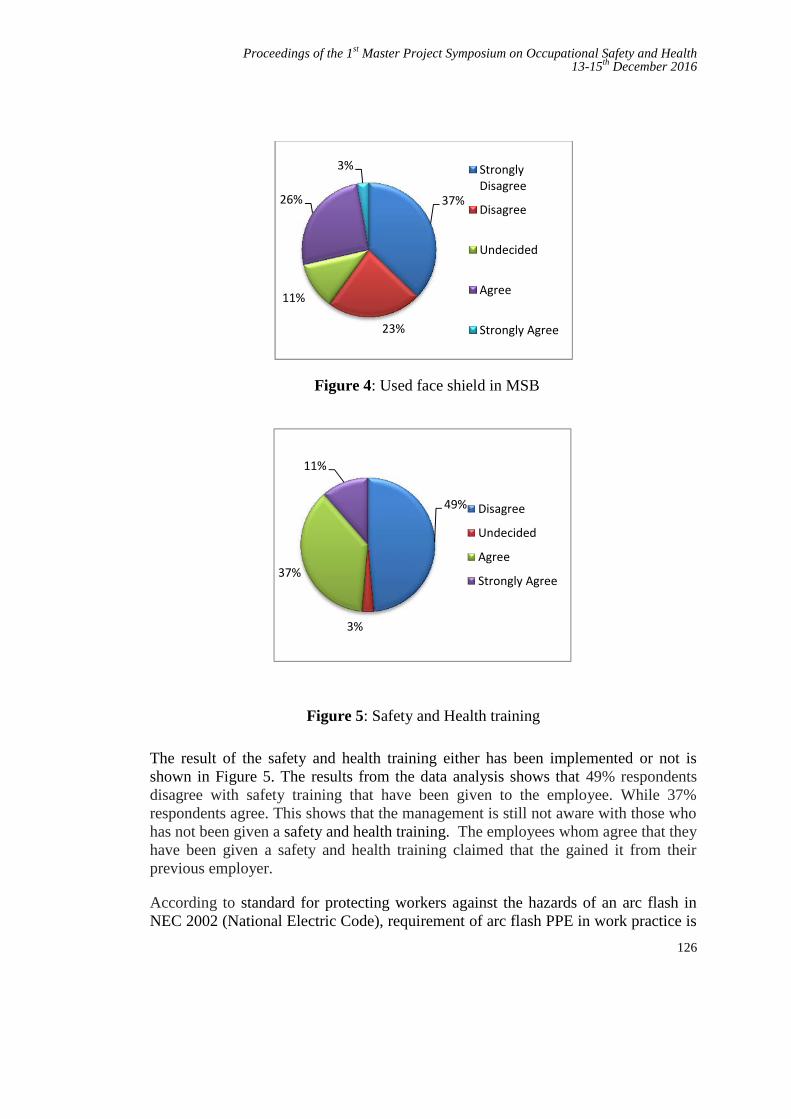
Proceedings of the 1st Master Project Symposium on Occupational Safety and Health13-15th December 2016
126
Figure 4: Used face shield in MSB
Figure 5: Safety and Health training
The result of the safety and health training either has been implemented or not isshown in Figure 5. The results from the data analysis shows that 49% respondentsdisagree with safety training that have been given to the employee. While 37%respondents agree. This shows that the management is still not aware with those whohas not been given a safety and health training. The employees whom agree that theyhave been given a safety and health training claimed that the gained it from theirprevious employer.
According to standard for protecting workers against the hazards of an arc flash inNEC 2002 (National Electric Code), requirement of arc flash PPE in work practice is
37%
23%
11%
26%
3% StronglyDisagree
Disagree
Undecided
Agree
Strongly Agree
49%
3%
37%
11%
Disagree
Undecided
Agree
Strongly Agree
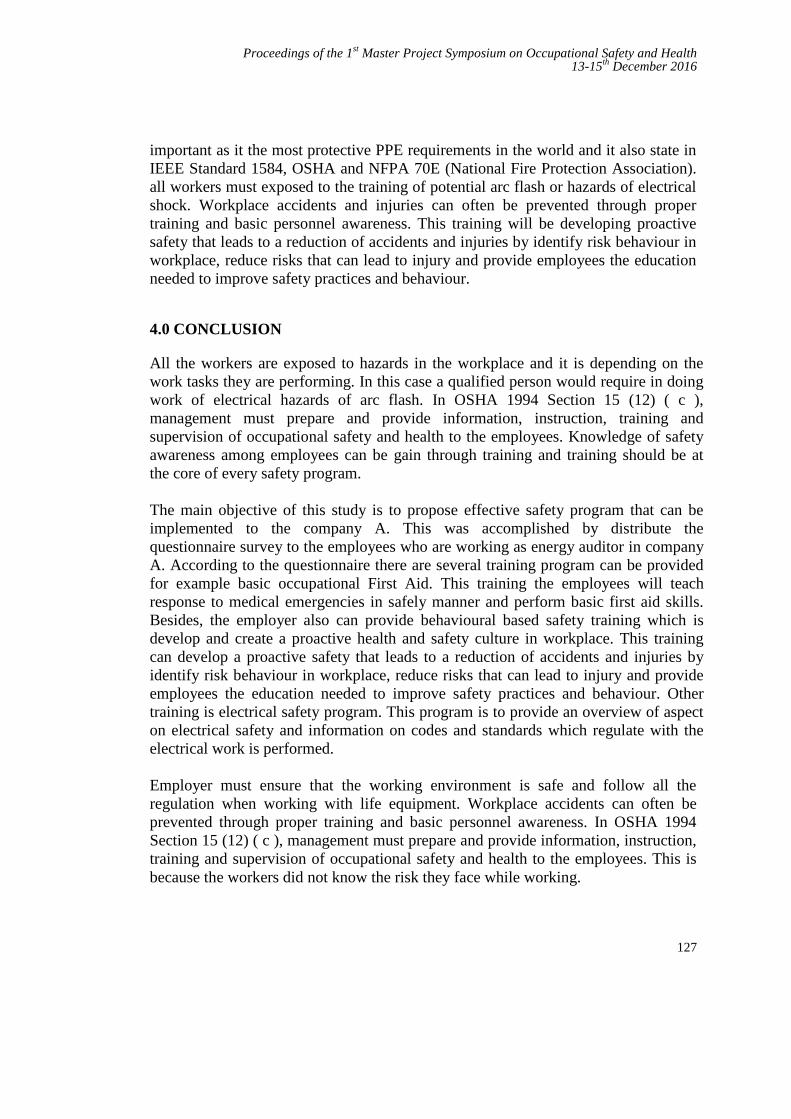
Proceedings of the 1st Master Project Symposium on Occupational Safety and Health13-15th December 2016
127
important as it the most protective PPE requirements in the world and it also state inIEEE Standard 1584, OSHA and NFPA 70E (National Fire Protection Association).all workers must exposed to the training of potential arc flash or hazards of electricalshock. Workplace accidents and injuries can often be prevented through propertraining and basic personnel awareness. This training will be developing proactivesafety that leads to a reduction of accidents and injuries by identify risk behaviour inworkplace, reduce risks that can lead to injury and provide employees the educationneeded to improve safety practices and behaviour.
4.0 CONCLUSION
All the workers are exposed to hazards in the workplace and it is depending on thework tasks they are performing. In this case a qualified person would require in doingwork of electrical hazards of arc flash. In OSHA 1994 Section 15 (12) ( c ),management must prepare and provide information, instruction, training andsupervision of occupational safety and health to the employees. Knowledge of safetyawareness among employees can be gain through training and training should be atthe core of every safety program.
The main objective of this study is to propose effective safety program that can beimplemented to the company A. This was accomplished by distribute thequestionnaire survey to the employees who are working as energy auditor in companyA. According to the questionnaire there are several training program can be providedfor example basic occupational First Aid. This training the employees will teachresponse to medical emergencies in safely manner and perform basic first aid skills.Besides, the employer also can provide behavioural based safety training which isdevelop and create a proactive health and safety culture in workplace. This trainingcan develop a proactive safety that leads to a reduction of accidents and injuries byidentify risk behaviour in workplace, reduce risks that can lead to injury and provideemployees the education needed to improve safety practices and behaviour. Othertraining is electrical safety program. This program is to provide an overview of aspecton electrical safety and information on codes and standards which regulate with theelectrical work is performed.
Employer must ensure that the working environment is safe and follow all theregulation when working with life equipment. Workplace accidents can often beprevented through proper training and basic personnel awareness. In OSHA 1994Section 15 (12) ( c ), management must prepare and provide information, instruction,training and supervision of occupational safety and health to the employees. This isbecause the workers did not know the risk they face while working.

Proceedings of the 1st Master Project Symposium on Occupational Safety and Health13-15th December 2016
128
REFERENCES
[1] Divinnie, M.D., J.K. Stacy, and A.C. Parsons, Arc Flash Mitigation UsingActive High-Speed Switching. IEEE Transactions on Industry Applications,2015. 51(1): p. 28-35.
[2] Tinsley, H.W. and M. Hodder, A practical approach to arc flash hazardanalysis and reduction. IEEE transactions on industry applications, 2005.41(1): p. 144-154.
[3] Gov, E., Type B Accident Investigation Reports Of The Arc Flash AtBrookhaven National Laboratory. 2006, Office Of The Association UnderSecretary For Envirinment, Health, Safety and Security.
[4] Kowalski-Trakofler, K. and E. Barrett, Reducing non-contact electric arcinjuries: An investigation of behavioral and organizational issues. Journal ofsafety research, 2007. 38(5): p. 597-608.
[5] LCKuan, K.K., Arc Fault Pressure Detector in Low Voltage Switchboard.International Journal of Scientific and Research Publications, 2013: p. 30.
[6] Idrus, D., et al., Level Of Awareness Of UTM Staff On Occupational SafetyAnd Health At The Work Place, in Fakulti Pengurusan dan PembangunanSumber Manusia. 2004, Universiti Teknologi Malaysia.
[7] Rafiin, M.A., Keselamatan Dan Kesihatan Di Malaysia - Kajian PematuhanPeraturan Di Syarikat Terpilih. 2005, Universiti Teknologi Malaysia: FakultiKejuruteraan Awam.
[8] Talib, M.F., Keprihatinan Pensyarah Terhadap Terhadap AmalanKeselamatan Bengkel Di ADTEC Batu Pahat, in Fakulti Pendidikan TeknikalDan Vokasional. 2014, Universiti Tun Hussein Onn Malaysia Batu Pahat,Johor.
[9] Neitzel, D.K. Controlling electrical hazards through effective riskmanagement. in Petroleum and Chemical Industry Conference (PCIC), 2011Record of Conference Papers Industry Applications Society 58th AnnualIEEE. 2011. IEEE.
[10] Thaker, M.N., B.N. Phadke, and P.D. Patel, The Effects of ElectricalHazards. Perception. 1: p. 369-374.
Proceedings of the 1st Master Project Symposium on Occupational Safety and Health13-15th December 2016
129
Occupational Stress on Military Personnel inBoat Squadron, Semporna Sabah
Mohd Erry Dul a and Mohd Azlan Suhot b
UTM Razak School of Engineering and Advanced Technology, Universiti TeknologiMalaysia, 54100 Jalan Sultan Yahya Petra, Kuala Lumpur, Malaysia
Abstract - We conducted a survey about the occupational stress on Military Personnel inBoat Squadron which based in Semporna Sabah. This study will show about the stress thatthe military personnel have been affected. The purpose of this study is to find the bestpractice on how to handling the stress at work place. The management has to play themain role in how to manage the stress. Base on title the area of study will be inBoat Squadron located in Semporna Sabah. Semporna is one of area in the East SabahSecurity Zone which known as ESSZone and a busy area with operational activities arebeing done at the sea.
Keywords: Occupational Stress, Military, Stress Management
1.0 INTRODUCTION
Joint Task Force 2 Headquarter is the main joint task force that base in East Sabah.It’s responsible for East Sabah operations for Malaysia Armed Forces. Its main roleis to keep the territory of East Sabah waters are save from any intruders orkidnappers and terrorist from making any unauthorized activities that willjeopardize the country and law. Joint Task Force 2 Headquarter is command byone-star general from Royal Malaysian Navy while Boat Squadron is command byan officer from Royal Malaysian Navy with rank Lieutenant Commander whichresponsible to advice and help in boats operations. Every detachment will have oneofficer rank Captain Malaysian Army or Lieutenant Royal Malaysian Navy anddirectly responsible on manning the detachment working smoothly with the boatsoperations and staff administrative.
Occupational stress has become major area of concern in the field of HumanResource Management in today’s competitive era. Apart from the stressors outsidethe organization, such as family-related stressors and individual stressors, there arevarious stressors affecting an employee, which are associated with the organizationitself [1]. Base on the statement over any work that we do will give stress. The
Proceedings of the 1st Master Project Symposium on Occupational Safety and Health13-15th December 2016
130
organization must assume their part in utilizing the best technique or approach tokeep any anxiety to the staff. Same at Boat Squadron, doing diligent work in EastSabah will offer anxiety to the staff. The everyday routine at Boat Squadron isabout the operations matters. Some of staff grumbled that they are pushed bytheir work.
2.0 METHODOLOGY
2.1 Research Design
The research will be conducting questionnaire among the military personnel. It willinvolve not only other rank staff but also the officer or higher authorities. For theResearch Objectives, the instruments that will use to get the information’s are byobservation and then provide questionnaire.
2.2 Operational Framework
The framework will go about answering the research questions that has been set bythe researcher. In the other words, operational framework is maps that give routes orsteps for conducting the research.
Base on the operational framework, the research will begin by understanding and toget input from the literature review which related to the research study. Find anyinformation’s, journals and articles that related to military operation areas andpersonnel. After study has been done on the literature review, we can relate with theorganization of Boat Squadron on factors that contributing stress and themanagement routines that affect the stress. To find the data next operation is to dothe data collecting by observation and questionnaire and. In this research the samplethat will use are only from the Boat Squadron in Semporna, Sabah. There will 40samples for the questionnaire and survey.
3.0 RESULTS AND DISCUSSION
3.1 Response Rate
Response rate is referring to the percentage of participants whom had answeredthe survey questionnaires in relation to the number of military personnel in thesample size. During the data collection, 40 military personnel in Semporna havebeen participating in this research about the occupational stress. Out of thisnumber, only 36 participants have returned the questionnaires that constitute of90% response rate as shown in the Table 1.

Proceedings of the 1st Master Project Symposium on Occupational Safety and Health13-15th December 2016
131
Table 1: Response Rate
Study Number ofquestionnaire
distributed
Responsereceived
Percentage Responsenot
received
Percentage
MainStudy 40 36 90% 4 10%
3.2 Demographic Data
Table 2: Statistical Summary of Questionnaire Respondents
Attributes Attributes Frequency( N = 36 )
Percentage
Age
26 – 33 years34 – 41 years42 – 49 years
Above 50 years old
141372
39%36%19%6%
Race
BajauMelayuDusunIban
MelanauMurutBugis
KadazanCina
RungusJawa
119432211111
31%25%11%8%6%6%3%3%3%3%3%
Gender Male 36 100%
Married StatusMarried
Not Married324
89%11%
Position
CoxswainNavigatorTechnician
Section LeaderClerk
Store man
2055411
56%14%14%11%3%3%

Proceedings of the 1st Master Project Symposium on Occupational Safety and Health13-15th December 2016
132
Rank
CorporalLeading HandAble Seaman
Lance CorporalChief Petty Officer
Petty Officer Sergeant
2064311
56%17%11%8%3%3%
Service Period
10 Years15 Years18 Years21 Years
89127
22%25%33%19%
Origin
SabahSarawak
PerakMelakaJohorKedah
2264111
61%17%11%3%3%3%
Total 36 100%
All the demographic data are correlated with the research that I have done whichcan contribute stress at workplace. The increasing of age can give more fatigue tothe person while doing any tasking and this will make them felt more pressure to dothe jobs that have been ordered. According to the tasking and operational area, BoatSquadron is more suitable for male military personnel because of the nature andstrength of the male gender than the female gender. Majority respondents aremarried and with this information we will know that they will have to leave thefamily behind and priority the work as military personnel. The position of coxswainand navigator are the most important position in the Boat Squadron and thesepositions are filled up by the rank of Corporal which from the results showed thisrank are the highest respondents answered. These two positions play the main rolein manning the boat for operational. These positions will have more tasking than theothers positions and can give them more fatigue and stress to the jobs.
The origin where the respondents come from and the race are not the criticalinfluence to the stress at workplace. Each of military personnel will have a period toserve outside their origin and after that they will transfer another unit to gainanother knowledge and experience. The respondents service periods showed thatmajority of them have served almost 18 years in the armed forces. This can tell thatthey only got 3 more years to go before finish the service in armed forces and whenthey finished the positions are empty and it takes too long to fill up back theirpositions. This is the factors that related to the less of man power which contributeto stress at workplace.
Proceedings of the 1st Master Project Symposium on Occupational Safety and Health13-15th December 2016
133
4.0 CONCLUSION
This paper had discussed the Occupational Stress on Military Personnel in BoatSquadron Semporna, Sabah. On the results the organization can use this research tohelp the organization on handling the stress problems among the military personnel.Besides that, the best practice that had been provided in this research can be doneinstantly and can get more feedback about the best practice that has been provided inthis research. Base on Chapter 4 the best practice is more welfare activities for lessstress at workplace. The top management can conduct more activities related towelfare for example family day for every quarter a year, organize sport activitiesmore frequent for high level of health and fitness and special appreciation oracknowledgement ceremony for the staff as a reward for them.
4.1 Future Works
Future Works for this paper is research continues on ergonomic awareness that cancontribute stress on military personnel. Boat Squadron working area are related to thesea area which can affect the ergonomic problems addition with the accommodationof the boat, sea state and the weather.
REFFERENCES
[1] Luthans, F. 2002. Organizational behaviour. McGraw Hill, Irwin.[2] Braunsberger, K., and Gates, R. 2009. Developing Inventories for Satisfaction
and Likert Scales in a Service Environment. Journal of Service Marketing,23(4), 219-225.
[3] C.R.Khotari. 2004. Research Methodology Methods & Techniques.India: College of Commerce, University of Rajasthan, Jaipur.
[4] Cameron, R., and Molina-Azorin,J.F. 2011. The Acceptance of MixedMethod in Business and Management Research. International Journal ofOrganizational Analysis, 19(3), 256-271.
[5] Cooper, D. R., and Schindler, P.S. 2006. Business Research Methods.McGraw-Hill Irwin.
[6] Kumar, R. 2011. Research Methodology : A Step by Step Guide for Beginners(3rd ed.): SAGE Publications Ltd.
[7] Ng, S. T., Skitmore, R. M., & Leung, T. K. C. 2005. Manageability of stressamong construction project participants. Engineering,Construction andArchitectural Management, 12(3), 264–282.
[8] Zeffane, R., & McLoughlin, D. 2006. Cooperation and stress: Exploring thedifferential impact of job satisfaction, communication and culture.Management Research News, 29(10), 618–631.
[9] National Institute for Occupational Safety and Health. Stress…at work.Centre for Disease Control and Prevention, DHHS (NIOSH) Publication

Proceedings of the 1st Master Project Symposium on Occupational Safety and Health13-15th December 2016
134
Number 99–101. 1999. <http://www.cdc.gov/niosh/docs/99-101/> Accessed21.12.11
Proceedings of the 1st Master Project Symposium on Occupational Safety and Health13-15th December 2016
135
Risk of Insecticides Exposure on Foggers inJabatan Kesihatan Negeri Kedah
Mohd Faiz Itam 1,a, Astuty Amrin2,b and Roslina Mohammad2,c
1Unit Kawalan Penyakit Bawaan Vektor, Jabatan Kesihatan Negeri KedahJalan Kuala Kedah, 05400 Alor Setar, Kedah, Malaysia
2UTM Razak School of Engineering and Advanced Technology, UniversitiTeknologi Malaysia, 54100 Jalan Sultan Yahya Petra, Kuala Lumpur, Malaysia
[email protected], [email protected], [email protected]
Abstract - Since the past few years, dengue cases has been increasing and becoming fearful,while, at the same time the Ministry of Health, Malaysia is also working to completelyeliminate malaria cases in Malaysia. To achieve this target, the Public Health Division isplaying a big role to ensure that these diseases could be controlled are not spreading to thecommunity. In order to achieve this target, one of the main activities is to control thetransmission of the diseases by the vector i.e. mosquitoes. Thus, the primary aim of this studyis to investigate the risk of insecticides exposure used in the vector control specifically incontrolling dengue and malaria among staffs in Jabatan Kesihatan Negeri Kedah. Thecommon insecticides used in the field were gathered and the effects of the insecticides to thehuman were reviewed. The effects were indicated by the level of cholinesterase measured ineach foggers and non-foggers after exposure to the insecticides especially typeorganophosphate by accumulating the cholinesterase data from each district taken in2014 and 2015. The cholinesterase levels o f a l l v ec tor un i t s t a f f i n 2015 werecompared with the 2014, as the baseline to determine the reduction of the cholinesteraselevel. Among all the respondents, only 7 person out of 167 samples (4.19%) who hadsignificant reduction in cholinesterase level in which between 15-50% with p-value of 0.766.For further analysis, among those who had significant reduction of 15-50%, a qualitativemethod by using telephone interview was performed. The results revealed that foggers whohad significant reduction in cholinesterase level between 15-50% were not wearingproper personal protective equipment (PPE) outlined in the guidelines and they are also notcertified and registered as a pesticide handlers.
Keywords: Fogger, Non-Fogger, Cholinesterase, Insecticide, Organophosphate, Pyrethroids
1.0 INTRODUCTION
Dengue is one of the fearful disease that lumbering Malaysian health. The numbersof cases keep increasing annually and become one of the public health issuesconcerned. In 2015, there are 120,836 cases reported in Malaysia compare to108,698 cases reported for the same period in 2014. There is an increment of 11.2%

Proceedings of the 1st Master Project Symposium on Occupational Safety and Health13-15th December 2016
136
or 12,138 cases. For the same period, there are 336 death compared to 215 death in2014, which is 56.3% increment (121 death). Dengue outbreak occurs almost everyday in most of the state in Malaysia. The most affected state with dengue outbreak isthe state of Selangor that took more than 60% of the total outbreak in Malaysia(Ministry of Health Malaysia). This number do not include the outbreak ofZika virus which is also caused by Aedes mosquitoes In 2015, there were120,836 cases reported in Malaysia compared to 108,698 cases reported for thesame period in 2014. There is an increment of 11.2% or 12,138 cases. For the sameperiod also, there were 336 deaths compared to 215 deaths in 2014, which is56.3% increment (121 deaths). In Kedah, there are 1,000 registered cases in 2015compared to 1,006 registered cases for the same period in 2014. There is adecrement of 0.6% (6 cases) with 14 mortality cases in 2015 compared to 6mortality cases in 2014.
As for the other mosquito-borne Flaviviruses, treatment for the uncomplicated Zikavirus infection focuses on symptoms. No Zika virus vaccine exists; thus, preventionand control measures center on avoiding mosquito bites, reducing sexualtransmission, and controlling the mosquito vector. Potentially effective methods ofprevention that are focused on reducing infections among pregnant women includeavoiding unnecessary travel to areas of ongoing Zika virus transmission, avoidingunprotected sexual contact with partners who are at risk for Zika virus infection(Update: Interim Guidelines for Health Care Providers Caring for Pregnant Womenand Women of Reproductive Age with Possible Zika Virus Exposure — UnitedStates, 2016) and using mosquito repellent, permethrin treatment for clothing [1],bed nets [2], window screens [3] [4] and air conditioning [5] [6].
The most effective A. aegypti vector control relies on an integrated approach thatinvolves elimination of A. aegypti mosquito breeding sites, application of larvicides,and application of insecticides to kill adult mosquitoes applied to most vector bornediseases. However, each of these approaches has substantial limitations.Communities are often mobilized to reduce A. aegypti breeding sites, but thisstrategy often fails, in part because of inconsistent participation among householdsand the presence of cryptic breeding sites in modern urban settings [7] [8]. Denguecontrol programs make extensive use of peridomestic insecticide spraying duringoutbreaks, but little evidence supports its efficacy as a single control intervention[9]. The application of larvicides [10] and indoor residual spraying [10] [11] hasbeen effective in some settings. Given these limitations, an integrated prevention andvector-control approach combined with timely detection of illness, communicationof up-to- date and correct information, and development of a rapid response thatinvolves the community are recommended [12]. Thus, main goal of this study is tosee the reduction of cholinesterase level of staffs after exposure to insecticides in2015 from the baseline reading in 2014 among foggers.

Proceedings of the 1st Master Project Symposium on Occupational Safety and Health13-15th December 2016
137
2.0 METHODOLOGY
2.1 Data collection
Cholinesterase levels of the staffs are requested through state vector control unit.Yearly cholinesterase level taken by each district from all vector control unit staff inthe district as a yearly screening. Data on the cholinesterase levels taken in 2014 and2015 were requested from each district. The cholinesterase level of 2014 was takenas the baseline.
2.2 Cholinesterase
Plasma cholinesterase is a liver acute-phase protein that circulates in the bloodplasma. It is found in central nervous system white matter, the pancreas, and theheart. It can be affected by many factors, including pregnancy, infection,and medical illness. Additionally, a patient's levels can vary up to 50% withrepeated testing.
Overexposure to organophosphate and carbamate insecticides can result incholinesterase inhibition. These pesticides combine with acetylcholinesterase atnerve endings in the brain and nervous system, and with other types of cholinesterasefound in the blood. This allows acetylcholine to build up, while protective levels ofthe cholinesterase enzyme decrease. The more cholinesterase levels decrease, themore likely symptoms of poisoning from cholinesterase inhibiting pesticides are toshow. The cholinesterase reduction was evaluated after being exposed to theinsecticides used in fogging activity by looking at the percentage reduction from thebaseline reading.
2.3 Reduction percentage of cholinesterase
In this study, the formula to determine the percentage of cholinesterase reduction isshown as the following:
= ℎ 2015 − ℎ 2014( ℎ 2014) × 100The foggers who had reduction between 15-50% are considered fall intosignificant reduction. Further analyses using a qualitative method through telephoneinterview were performed.
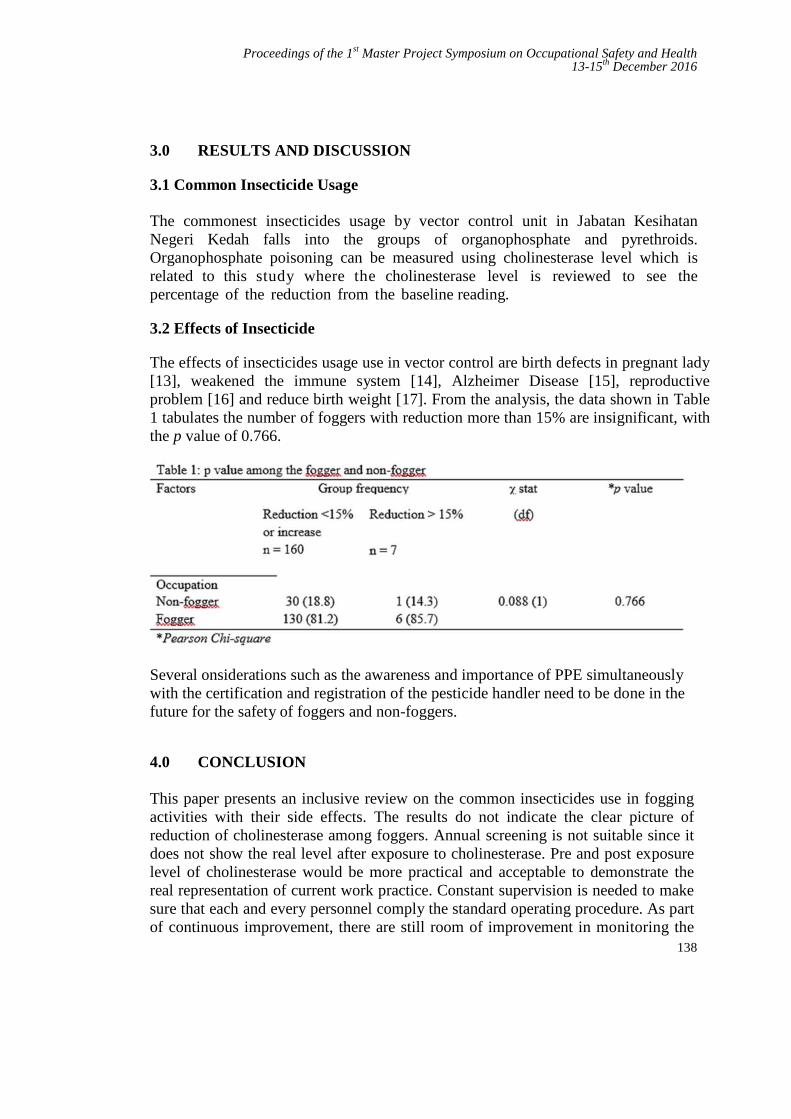
Proceedings of the 1st Master Project Symposium on Occupational Safety and Health13-15th December 2016
138
3.0 RESULTS AND DISCUSSION
3.1 Common Insecticide Usage
The commonest insecticides usage by vector control unit in Jabatan KesihatanNegeri Kedah falls into the groups of organophosphate and pyrethroids.Organophosphate poisoning can be measured using cholinesterase level which isrelated to this study where the cholinesterase level is reviewed to see thepercentage of the reduction from the baseline reading.
3.2 Effects of Insecticide
The effects of insecticides usage use in vector control are birth defects in pregnant lady[13], weakened the immune system [14], Alzheimer Disease [15], reproductiveproblem [16] and reduce birth weight [17]. From the analysis, the data shown in Table1 tabulates the number of foggers with reduction more than 15% are insignificant, withthe p value of 0.766.
Several onsiderations such as the awareness and importance of PPE simultaneouslywith the certification and registration of the pesticide handler need to be done in thefuture for the safety of foggers and non-foggers.
4.0 CONCLUSION
This paper presents an inclusive review on the common insecticides use in foggingactivities with their side effects. The results do not indicate the clear picture ofreduction of cholinesterase among foggers. Annual screening is not suitable since itdoes not show the real level after exposure to cholinesterase. Pre and post exposurelevel of cholinesterase would be more practical and acceptable to demonstrate thereal representation of current work practice. Constant supervision is needed to makesure that each and every personnel comply the standard operating procedure. As partof continuous improvement, there are still room of improvement in monitoring the
Proceedings of the 1st Master Project Symposium on Occupational Safety and Health13-15th December 2016
139
exposure of insecticides among foggers. Pre and post exposure of insecticidescreening among foggers is needed. Certification and registration of the foggers tohandle any insecticide is mandatory. This will ensure that the foggers will undergoproper training and well-versed regarding their jobs and the type of insecticides theyare dealing with. Continuous training and retreat courses should be givenperiodically to assure that their knowledge is always updated.
Acknowledgement
The authors would like to express the greatest appreciation and utmost gratitude toJabatan Kesihatan Negeri Kedah and UTM Razak School of Engineering &Advanced Technology and Universiti Teknologi Malaysia (UTM) for allsupport given in making the study a success.
REFERENCES
[1] Banks SD, Murray N, Wilder-Smith A, Logan JG. “Insecticide-TreatedClothes for the Control of Vector-Borne Diseases: A Review onEffectiveness and Safety”. Med Vet Entomol 2014;28:Suppl 1:14-25
[2] Lenhart A, Orelus N, Maskill R, Alexander N, Streit T, McCall PJ.“Insecticide-Treated Bednets to Control Dengue Vectors: PreliminaryEvidence from a Controlled Trial in Haiti.” Trop Med Int Health2008;13:56-67
[3] Manrique-Saide P, Che-Mendoza A, Barrera-Perez M, et al. “Use ofInsecticide-Treated House Screens to Reduce Infestations of Dengue VirusVectors, Mexico.” Emerg Infect Dis 2015;21:308-311
[4] Che-Mendoza A, Guillermo-May G, Herrera-Bojórquez J, et al. “Long-Lasting Insecticide-Treated House Screens and Targeted Treatment ofProductive Breeding- Sites for Dengue Vector Control in Acapulco,Mexico”. Trans R Soc Trop Med Hyg 2015;109:106-115
[5] Brunkard JM, Robles López JL, Ramirez J, et al. “Dengue FeverSeroprevalence and Risk Factors, Texas-Mexico border, 2004”. Emerg InfectDis 2007;13:1477-1483
[6] Reiter P, Lathrop S, Bunning M, et al. “Texas Lifestyle Limits Transmissionof Dengue Virus.” Emerg Infect Dis 2003;9:86-89
[7] Heintze C, Velasco Garrido M, Kroeger A. “What Do Community-BasedDengue Control Programmes Achieve? A Systematic Review of PublishedEvaluations.” Trans R SocTrop Med Hyg2007;101:317-325
[8] Barrera R, Amador M, Diaz A, Smith J, Munoz-Jordan JL, Rosario Y.“Unusual Productivity of Aedes aegypti in Septic Tanks and its ImplicationsFor Dengue Control”. Med Vet Entomol 2008;22:62-69
[9] Esu E, Lenhart A, Smith L, Horstick O. “Effectiveness of Peridomestic
Proceedings of the 1st Master Project Symposium on Occupational Safety and Health13-15th December 2016
140
Space Spraying with Insecticide on Dengue Transmission; SystematicReview.” Trop Med Int Health 2010;15:619-631
[10] Vazquez-Prokopec GM, Kitron U, Montgomery B, Horne P, Ritchie SA.“Quantifying the Spatial Dimension of Dengue Virus Epidemic SpreadWithin a Tropical Urban Environment.” PLoS Negl Trop Dis2010;4:e920-e920
[11] Paredes-Esquivel C, Lenhart A, Del Río R, et al. “The Impact of IndoorResidual Spraying of Deltamethrin on Dengue Vector Populations in thePeruvian Amazon.” Acta Trop 2016;154:139-144
[12] Adalja AA, Sell TK, Bouri N, Franco C. “Lessons Learned During DengueOutbreaks in the United States, 2001-2011”. Emerg Infect Dis 2012;18:608-614
[13] D. Lindhout. “Human Birth Defect Suspected from Malathion.” Departmentof Clinical Genetics, Erasmus University, Rotterdam. Department of ChildNeurology, University Hospital, Utrecht. Teratology, 1987, vol.36, p.7 (3).
[14] K E Rodgers, M H Grayson, C F Ware. “Inhibition of cytotoxic Tlymphocyte and natural killer cell-mediated lysis by O,S,S,-trimethylphosphorodithioate is at an early postrecognition step”. Journal ofImmunology 1988: vol.140, p.564
[15] Hayden, K.; Norton, M.; Darcey, D.; Ostbye, T.; Zandi, P.; Breitner, J. , E.A. ; Welsh- Bohmer, K. A. “Occupational exposure to pesticides increasesthe risk of incident AD”. Neurology 74 (19): 1524–1530. (2010)
[16] Howard, P.H. (ed.) Handbook of environmental fate and exposure data fororganic chemicals. Volume III. Pesticides. Chelsea, MI 1991: LewisPublishers.
[17] Rauch SA "Associations of Prenatal Exposure to Organophosphate PesticideMetabolites with Gestational Age and Birth Weight," Environmental HealthPerspectives, July 2012, Vol. 120, No. 7, 1055-1060.
Proceedings of the 1st Master Project Symposium on Occupational Safety and Health13-15th December 2016
141
Falls from Vehicle Associated with Slip andTrip Hazards at the Fuel Distribution
TerminalMuhammad Akmal Hanzaha and Samira Albati Kamaruddinb
UTM Razak School of Engineering and Advanced Technology, Universiti TeknologiMalaysia, 54100 Jalan Sultan Yahya Petra, Kuala Lumpur, Malaysia
[email protected], [email protected]
Abstract – Current statistic of falls from height (FFH) accidents in fuel distribution terminalshows the oil and gas industry is unsafe workplace. Falls from height accident are caused byunsafe act, unsafe conditions, and lacks of procedures, training, monitoring andenforcement. Based on literature review, there are six elements that caused FFH associatedwith slip and trip hazard (STH) among truck driver in distribution terminals. Questionnaireforms were used in the survey to obtain data from respondents who are mainly truck drivers.The questionnaire was verified through a pilot test. Level of safety awareness wasdetermined using the statistical package of SPSS and the result shows that two from the sixfactors showed the high mean score. They are identified as personal protective equipment(PPE), loading platform condition (LPC), weather condition (WC) and law and order (LO).The correlation between standard operation procedure (SOP) with FFH factors shows thatthe elements of LPC, VPA and WC need further revision and should be highlighted in newguideline compared to the other two elements that showing no correlation with SOP. Thenew guideline must be implemented in the selected fuel distribution terminal to avoid morerisk on truck driver regarding the STH of FFH.
Keywords: Fall from height, Unsafe workplace, Slip and trip guideline, Oil distribution terminal, Oiland gas industry
1.0 INTRODUCTION
Oil distribution terminals, which also called tank farms, installation terminals or oilterminals, can be defined as an industrial facility for storage of oil and orpetrochemical products. These products are usually transported to end users orfurther storage facilities. Falls from height (FFH) are the one of the biggest causes ofworkplace fatalities and major injuries [1-2]. The problems still occurred eventhough drivers followed the standard operation procedure (SOP) and properly usedrecommended personal protective equipment (PPE) for working at height.
Proceedings of the 1st Master Project Symposium on Occupational Safety and Health13-15th December 2016
142
According to Health and Safety Executive (HSE), UK [3], during working at height,truck drivers may fall due to slip and trip accident. Slips happen where there is toolittle friction or traction between the footwear and the walking surface. Normalreason for slips are wet or slick surfaces, intermittent spills, weather hazards, freeunanchored rugs or mats, flooring or other walking surfaces in which all zones arenot at the same level. While trips happened when foot collides (strikes, hits) an objectand caused a person lost the balance and suddenly fall. Regular causes of tripping areobstructed view, poor lighting, mess in your direction, wrinkled covering, revealedlinks, base drawers not being shut, uneven (strides, limits) walking surfaces.
About one third of workplace transport accidents caused by falls from vehicles in awide range of industries. An analysis of HSE accident data for ‘goods type vehicles’[4] suggested that at least one third of these accidents are initially caused by slip ortrip. In the study, a total of 448 accident reports were examined. Slipping before fallhas been identified causing at least 124 accidents, while a trip before the fall hascaused 16 accidents. This suggests that at least 31% of falls from vehicles (140accidents) were caused by a slip or trip. Walker also emphasised that 9% of incidentshappened when drivers were using steps. Furthermore, Mirza et al. [5] claimed thatfall at petrol station during cleaning from height, fall from wooden ladder, slipperyconditions at filling gantry due to minor leakages, fall from roof, oil spillages, waterleakages, snakebite cases, minor damages, maintenance issues, natural disasters/windstorms, law and order situation.
The aim of this research is to strengthen the existing guideline of working at heightamong truck drivers at fuel distribution terminals. The study plans to recommend animproved guideline of FFH associated with slip, trip and fall (STF) hazards tominimize accidents among professional drivers at fuel distribution terminals.
2.0 METHODOLOGY
The methodology starts with identifying the reported incidents in a fuel distributionterminal located in Klang Valley. Then the researcher observed on fuel truck driverworking routine during filling activities at the platform area. Based on the previousstudy by Health and Safety Executive (HSE) [6] and Mirza et al. [5] as well as theinitial observation, six factors of the FFH associated with STF hazards at the fuelterminal have been identified to be included in the questionnaire elements. Thefactors are personal protective equipment and footwear (PPE), loading platformcondition (LPC), vehicle platform activities (VPA), trip and driving shift (TDS),weather condition (WC) and law and order (LO). These six elements were includedin the questionnaire with five choices of answer from strongly agree to stronglydisagree Likert scale. At the beginning, 20 samples were collected as a pilot test toget reliability of the questions. After achieving more than 0.7 Cronbach’s alphavalue, the questionnaire were distributed to 175 respondents as a recommended
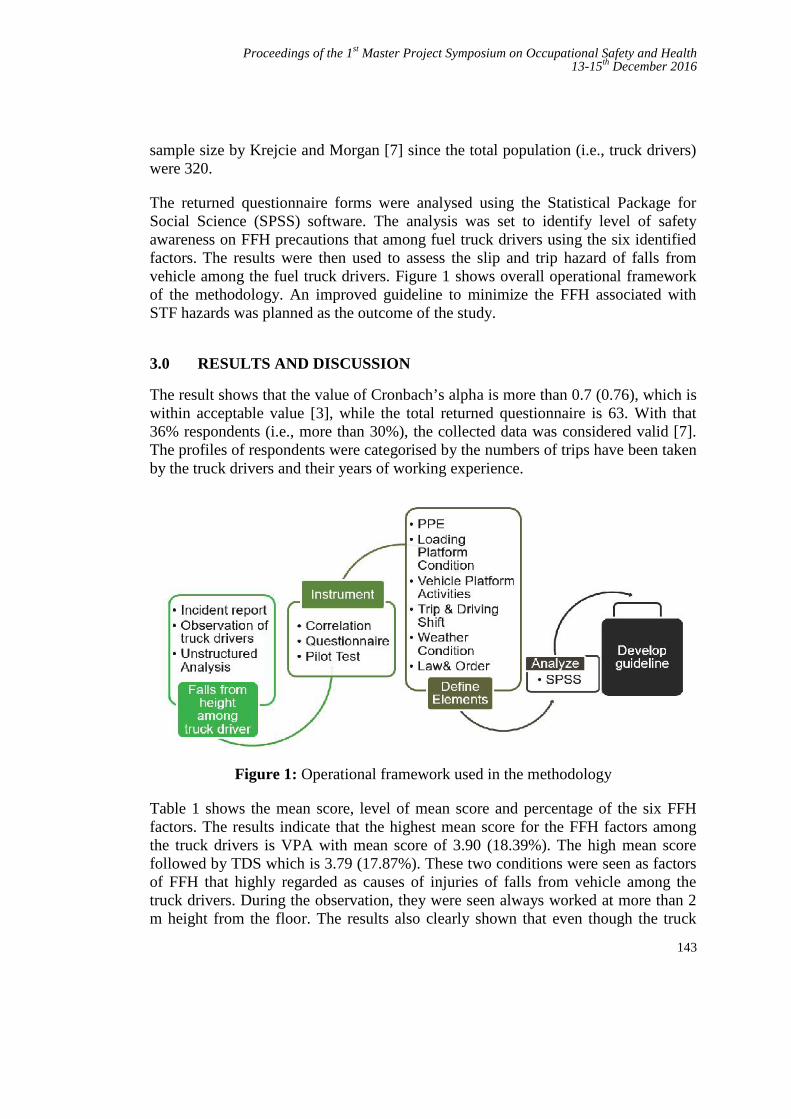
Proceedings of the 1st Master Project Symposium on Occupational Safety and Health13-15th December 2016
143
sample size by Krejcie and Morgan [7] since the total population (i.e., truck drivers)were 320.
The returned questionnaire forms were analysed using the Statistical Package forSocial Science (SPSS) software. The analysis was set to identify level of safetyawareness on FFH precautions that among fuel truck drivers using the six identifiedfactors. The results were then used to assess the slip and trip hazard of falls fromvehicle among the fuel truck drivers. Figure 1 shows overall operational frameworkof the methodology. An improved guideline to minimize the FFH associated withSTF hazards was planned as the outcome of the study.
3.0 RESULTS AND DISCUSSION
The result shows that the value of Cronbach’s alpha is more than 0.7 (0.76), which iswithin acceptable value [3], while the total returned questionnaire is 63. With that36% respondents (i.e., more than 30%), the collected data was considered valid [7].The profiles of respondents were categorised by the numbers of trips have been takenby the truck drivers and their years of working experience.
Figure 1: Operational framework used in the methodology
Table 1 shows the mean score, level of mean score and percentage of the six FFHfactors. The results indicate that the highest mean score for the FFH factors amongthe truck drivers is VPA with mean score of 3.90 (18.39%). The high mean scorefollowed by TDS which is 3.79 (17.87%). These two conditions were seen as factorsof FFH that highly regarded as causes of injuries of falls from vehicle among thetruck drivers. During the observation, they were seen always worked at more than 2m height from the floor. The results also clearly shown that even though the truck
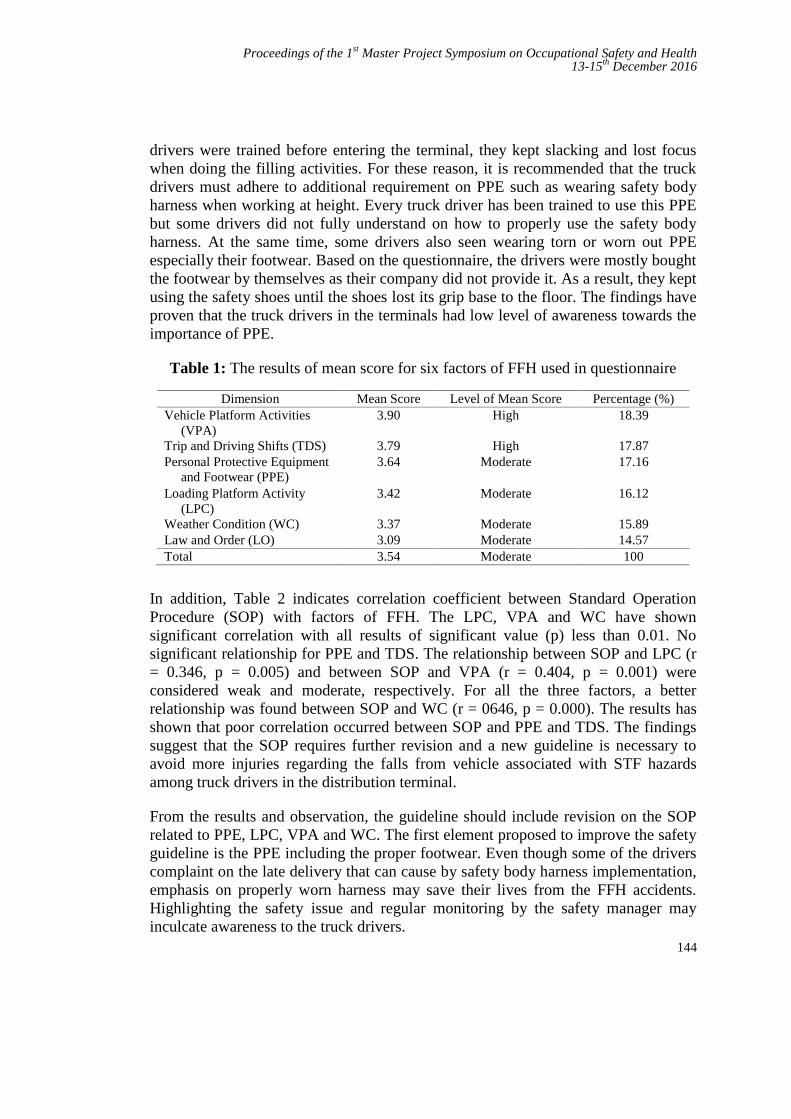
Proceedings of the 1st Master Project Symposium on Occupational Safety and Health13-15th December 2016
144
drivers were trained before entering the terminal, they kept slacking and lost focuswhen doing the filling activities. For these reason, it is recommended that the truckdrivers must adhere to additional requirement on PPE such as wearing safety bodyharness when working at height. Every truck driver has been trained to use this PPEbut some drivers did not fully understand on how to properly use the safety bodyharness. At the same time, some drivers also seen wearing torn or worn out PPEespecially their footwear. Based on the questionnaire, the drivers were mostly boughtthe footwear by themselves as their company did not provide it. As a result, they keptusing the safety shoes until the shoes lost its grip base to the floor. The findings haveproven that the truck drivers in the terminals had low level of awareness towards theimportance of PPE.
Table 1: The results of mean score for six factors of FFH used in questionnaire
Dimension Mean Score Level of Mean Score Percentage (%)Vehicle Platform Activities
(VPA)3.90 High 18.39
Trip and Driving Shifts (TDS) 3.79 High 17.87Personal Protective Equipment
and Footwear (PPE)3.64 Moderate 17.16
Loading Platform Activity(LPC)
3.42 Moderate 16.12
Weather Condition (WC) 3.37 Moderate 15.89Law and Order (LO) 3.09 Moderate 14.57Total 3.54 Moderate 100
In addition, Table 2 indicates correlation coefficient between Standard OperationProcedure (SOP) with factors of FFH. The LPC, VPA and WC have shownsignificant correlation with all results of significant value (p) less than 0.01. Nosignificant relationship for PPE and TDS. The relationship between SOP and LPC (r= 0.346, p = 0.005) and between SOP and VPA (r = 0.404, p = 0.001) wereconsidered weak and moderate, respectively. For all the three factors, a betterrelationship was found between SOP and WC (r = 0646, p = 0.000). The results hasshown that poor correlation occurred between SOP and PPE and TDS. The findingssuggest that the SOP requires further revision and a new guideline is necessary toavoid more injuries regarding the falls from vehicle associated with STF hazardsamong truck drivers in the distribution terminal.
From the results and observation, the guideline should include revision on the SOPrelated to PPE, LPC, VPA and WC. The first element proposed to improve the safetyguideline is the PPE including the proper footwear. Even though some of the driverscomplaint on the late delivery that can cause by safety body harness implementation,emphasis on properly worn harness may save their lives from the FFH accidents.Highlighting the safety issue and regular monitoring by the safety manager mayinculcate awareness to the truck drivers.
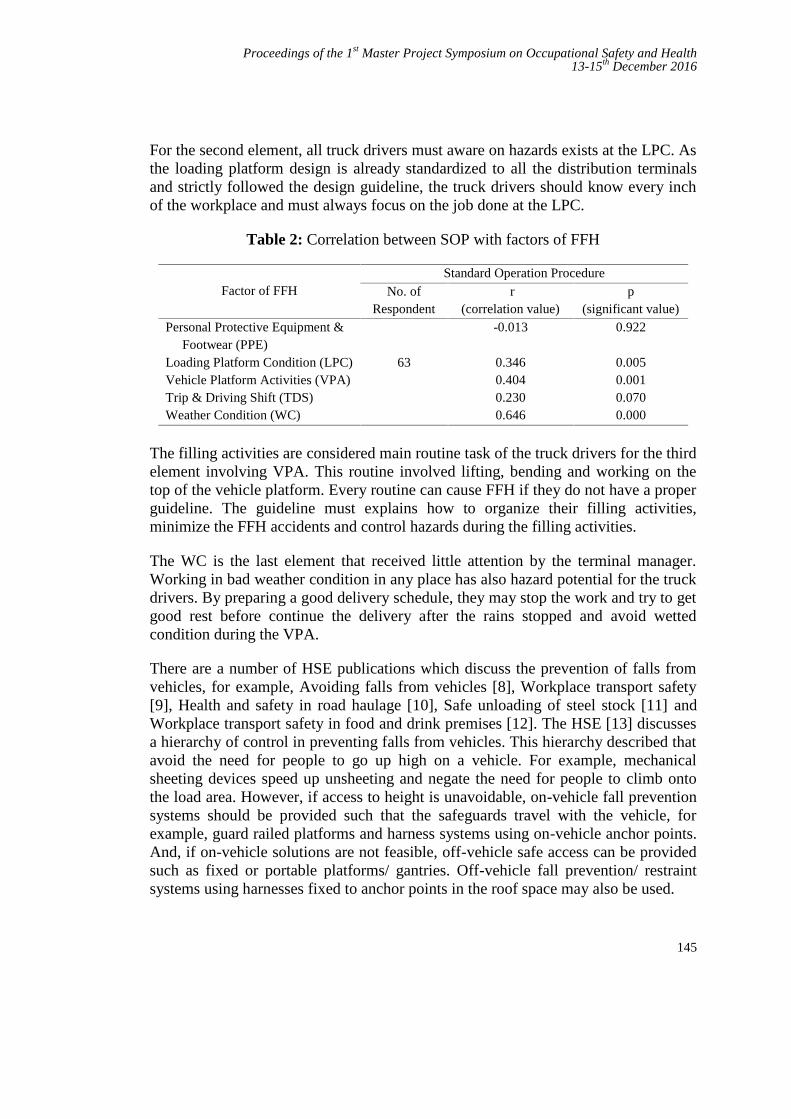
Proceedings of the 1st Master Project Symposium on Occupational Safety and Health13-15th December 2016
145
For the second element, all truck drivers must aware on hazards exists at the LPC. Asthe loading platform design is already standardized to all the distribution terminalsand strictly followed the design guideline, the truck drivers should know every inchof the workplace and must always focus on the job done at the LPC.
Table 2: Correlation between SOP with factors of FFH
Factor of FFHStandard Operation Procedure
No. ofRespondent
r(correlation value)
p(significant value)
Personal Protective Equipment &Footwear (PPE)
63
-0.013 0.922
Loading Platform Condition (LPC) 0.346 0.005Vehicle Platform Activities (VPA) 0.404 0.001Trip & Driving Shift (TDS) 0.230 0.070Weather Condition (WC) 0.646 0.000
The filling activities are considered main routine task of the truck drivers for the thirdelement involving VPA. This routine involved lifting, bending and working on thetop of the vehicle platform. Every routine can cause FFH if they do not have a properguideline. The guideline must explains how to organize their filling activities,minimize the FFH accidents and control hazards during the filling activities.
The WC is the last element that received little attention by the terminal manager.Working in bad weather condition in any place has also hazard potential for the truckdrivers. By preparing a good delivery schedule, they may stop the work and try to getgood rest before continue the delivery after the rains stopped and avoid wettedcondition during the VPA.
There are a number of HSE publications which discuss the prevention of falls fromvehicles, for example, Avoiding falls from vehicles [8], Workplace transport safety[9], Health and safety in road haulage [10], Safe unloading of steel stock [11] andWorkplace transport safety in food and drink premises [12]. The HSE [13] discussesa hierarchy of control in preventing falls from vehicles. This hierarchy described thatavoid the need for people to go up high on a vehicle. For example, mechanicalsheeting devices speed up unsheeting and negate the need for people to climb ontothe load area. However, if access to height is unavoidable, on-vehicle fall preventionsystems should be provided such that the safeguards travel with the vehicle, forexample, guard railed platforms and harness systems using on-vehicle anchor points.And, if on-vehicle solutions are not feasible, off-vehicle safe access can be providedsuch as fixed or portable platforms/ gantries. Off-vehicle fall prevention/ restraintsystems using harnesses fixed to anchor points in the roof space may also be used.
Proceedings of the 1st Master Project Symposium on Occupational Safety and Health13-15th December 2016
146
External duty holder may face problems in guaranteeing such equipment at sites. Theharness systems have to rely on good training, instruction and supervision. Smallerscale practical measures as described in HSE [13] have to consider the followingrequirement:
(1) Keep vehicle beds tidy to prevent trips (and slips).(2) Provide non-slip footwear to drivers.(3) Provide adequate steps to the cab and load area.(4) Use three points of contact when climbing up or down from vehicles.(5) Provide supervision to ensure fall precautions are actually taken.
Prevention of slip and trip also rely on good housekeeping, quality of flooring(walking surfaces), selection of appropriate footwear, and proper pace of walking arecritical for preventing fall accidents.
4.0 CONCLUSION
As a conclusion, four elements of the guideline of falls from vehicle associated withSTF hazards in distribution terminals have given priorities to be improved. Theguideline should be continually reviewed and updated. The common hazards of fallfrom vehicle used in the FFH study was the working condition more than 1.8 mheight. The safety of truck drivers working at height focuses on filling the manholewith oil on top of the vehicle. By implementing the new improved guidelineregarding working at heights the truck drivers are expected to be more aware on theFFH associated with STF hazards and they are educated to keep good safe workingenvironment in the fuel distribution terminal. In the future, this study could benefitthe organization while attracting all the truck drivers to adhere to the new improvedguideline.
REFERENCES[1] Lipscomb, Hester J., Judith Glazner, Jessica Bondy, Dennis Lezotte, and
Kenneth Guarini. "Analysis of text from injury reports improvesunderstanding of construction falls." Journal of occupational andenvironmental medicine 46, no. 11, 2004: 1166-1173.
[2] Al-Thani, Hassan, Ayman El-Menyar, Husham Abdelrahman, Ahmad Zarour,Rafael Consunji, Ruben Peralta, Mohammad Asim, Hany El-Hennawy,Ashok Parchani, and Rifat Latifi. "Workplace-related traumatic injuries:insights from a rapidly developing Middle Eastern country." Journal ofenvironmental and public health 2014 .
[3] Larson-Hall, Jenifer. “A guide to doing statistics in second language researchusing SPSS and r.” Routledge, 2015.
[4] Deborah Walker. Major accidents involving falls from goods vehicles. HSEField Operations Division, Safety Unit 2004.
Proceedings of the 1st Master Project Symposium on Occupational Safety and Health13-15th December 2016
147
[5] Ahmed, Mirza Munir, S. R. M. Kutty, Mohd Faris Khamidi, Idris Othman,and Azmi Mohd Shariff. "Hazard contributing factors classification for petrolfuel station." World Academy of Science, Engineering and Technology,International Journal of Civil, Environmental, Structural, Construction andArchitectural Engineering 6, no. 12, 2012: 1103-1114.
[6] Anita Scott, Mary Miller, and Kevin Hallas. “The underlying causes of fallsfrom vehicles associated with slip and trip hazards on steps and floors.”Health and Safety Executive, HSE Books 2006.
[7] Krejcie, Robert V., and Daryle W. Morgan. "Determining sample size forresearch activities." Educational and psychological measurement 30, no. 3,1970: 607-610.
[8] Health and Safety Executive. “Workplace transport topic inspection pack.”HSE Safety Unit 2004a.
[9] Health and Safety Executive. “Workplace transport safety: Guidance foremployers.” HSG136. HSE Books 1995.
[10] Health and Safety Executive. “Health and safety in road haulage.” INDG379,2003.
[11] Health and Safety Executive. “Safe unloading of steel stock.” INDG3132000.
[12] Health and Safety Executive. “Workplace transport safety in food and drinkspremises.” Food Information Sheet No.21 1999.
[13] Health and Safety Executive. “The assessment of pedestrian slip risk.” TheHSE Approach. Slips and Trips 1 2004b.
Proceedings of the 1st Master Project Symposium on Occupational Safety and Health13-15th December 2016
148
Perception of Wearing Hearing ProtectionDevice among Maintenance Personnel in
MiG-29 Jet Fighter FleetMuhammad Syafiq Fikry Rosleya and Kamilah Radin Salimb
UTM Razak School of Engineering and Advanced Technology, Universiti TeknologiMalaysia, 54100 Jalan Sultan Yahya Petra, Kuala Lumpur, Malaysia
[email protected], [email protected]
Abstract – Maintenance personnel in MiG-29 jet fighter fleet are exposed to noise levelgreater than 85 dB(A) which come from activities of aircraft taxiing, taking off, groundpower unit and aircraft engines during start up. Consequently, the risk of prevalence ofNoise-Induced Hearing Loss (NIHL) disease among the maintenance personnel hadincreased. However, NIHL can be prevented if Hearing Protection Device (HPD) is wearconsistently and effectively. Nevertheless, the consistency and effective use of HPD aredepending on the perception of wearing HPD. This research investigated the perception ofwearing HPD based on the influencing factors; demographic, knowledge, perceived benefits,perceived barriers, self-efficacy and interpersonal influence. Data from 91 samples werecollected by using questionnaires and document review was used to analyses the 5 yearsrecent record of safety programs in the Safety Log Book. The analysis of questionnaires viaSocial Package for Social Science (SPSS) revealed that overall perception level of wearingHPD was very high (M = 4.60, SD = 0.67) with percentage of 92%. There was no dominantfactor that leads to the prejudice of perception as all of the five influencing factors(excluding demographic) have high mean score and percentage (M more than 4, percentagemore than 80%). Based on t-test analysis, there is a statistically significant differencebetween educational background (MCE and Diploma) for perceived benefits. Other thanthat, there is also a statistically significant difference between years of service (0 to 7 yearsand more than 7 years) for self-efficacy and interpersonal influence. Overall, although themaintenance personnel had a good level of perception in wearing HPD but yet hearingconservation programs are still required to be implemented in the fleet as required byOccupational Safety and Health (2002).
Keywords: Hearing Protection Device, Noise-Induced Hearing Loss, Noise, Perception
1.0 INTRODUCTION
From the list of occupational hazards, noise is listed on the top three ranking invarious kind of working environment [1]. Any sound that has a sound pressure levelgreater than 85 dB (A) can be classified as noise for instance sound of aircraft take-off, construction and mining explosions
Proceedings of the 1st Master Project Symposium on Occupational Safety and Health13-15th December 2016
149
in a quarry site [2]. Many countries have their own maximum noise legislation. Forinstance, in United Kingdom (UK), the Control of Noise at Work Regulations hassets the Permissible Exposure Limit (PEL) of noise exposure to be at 85 dB (A) andHearing Protection Device (HPD) must be provided when noise level reaches 80 dB(A). The United States (US) Occupational Safety and Health Act (OSHA) has setsthe PEL of noise exposure to be at 90 dB(A), but hearing conservation program isstill required when the noise level has reaches 85 dB(A) [1]. In Malaysia, theOccupational Safety and Health Act and Regulations has stated that the PEL of noiseexposure is 85 dB(A) and HPD should be provided when noise level reaches 80dB(A) [3]. In the MiG-29 jet fighter fleet, noise from aircraft activities such as duringengine start-up, aircraft take-off and taxiing is the main risk of Noise InducedHearing Loss (NIHL) disease. However, it is almost impossible to eliminate the noisesource from Royal Malaysian Air Force (RMAF) aircrafts. Any modification onbuildings and facilities in order to block the noise source is very costly and canjeopardize the RMAF operations [4]. Therefore, wearing HPD is being implementedin the noisy working environment of the MiG-29 jet fighter fleet as this method iscost effective.
HPD such as ear plug and earmuff should be used temporarily until more effectivemeasures against noise exposure are established [5]. By wearing an earplug, noiseexposure level will be reduced by 25 dB to 35 dB whereas wearing an earmuff canreduce noise exposure level by 34 dB to 45 dB. However, it is recommended to wearboth earplug and earmuff as by wearing both it can reduced noise exposure level byanother 3 dB to 5 dB [6]. In addition, HPD also must be wear correctly andconsistently in order for the HPD to protect the workers from NIHL disease [7].NIHL can be described as a condition where the inner ear is permanently loss ofauditory acuity, particularly in the high-frequency range [8]. In pathological study,NIHL can be described as the loss of auditory sensory cells in cochlea [1]. In IndiaAir Force (IAF) base, 1000 personnel of various trades, age and exposure groupswere audio metrically surveyed. The result revealed that 229 of 1000 IAF members(22.9%) were affected by NIHL. This included 199 personnel of technical trades(19.9%) and 30 personnel of non-technical trades (3%) [9]. In year 2014, a study ofnoise hazard in No 20 Squadron of RMAF has found that 26 maintenance personnel(41.2%) from the total of 63 maintenance personnel were affected by the NIHLdisease [4]. These studies have shown that maintenance personnel in the air forcebase are affected with NIHL disease.
The risk of getting NIHL is influenced by the perception of wearing HPD where itdetermines worker’s behavior towards the use of HPD [10]. Several factors had beenlisted to influence the perception of using HPD. A study had summarized theinfluencing factors into three categories which are knowledge about the risk andpossible hazards produced by noise exposure, attitudes, beliefs and feelings withregards to the use of HPD and perceived safety culture and subjective norm [7].

Proceedings of the 1st Master Project Symposium on Occupational Safety and Health13-15th December 2016
150
Other researchers had stated that there are two factors that influenced the perceptionof wearing HPD which are modifying and cognitive-perceptual factors. Themodifying factors comprised of demographics and interpersonal factors.Demographics is a characteristics of the population which include gender, age,marital status, level of education, work type, years of working in noisy environment,ear conditions and results of hearing examination. Meanwhile, interpersonal factorsare an individual’s assumptions on other people’s attitudes such as perceptiontowards supervisor or co-workers in regards with the use of HPDs [6]. Thecognitive-perceptual factors comprised of benefits, barriers and self-efficacy [6].Perceived benefits can be described as the faith of gaining positive results, as aconsequence from the use of HPD and perceived barriers can be described asimaginations or perceptions of inconvenience or difficulties of an action. On theother hand, self-efficacy can be described as an evaluation of ability to organize andcarry out an action [11].
Based on those facts, this research studies the overall perception of wearing HPDamong maintenance personnel in MiG-29 jet fighter fleet. This research also attemptsto investigate the dominant factor that leads to the prejudice of perception towardsthe use of HPD. In addition, document review on the recent 5 years of safetyprograms which were recorded in the Safety Log Books was also performed todetermine the requirement of improving the wearing of HPD based on the guidelineof OSHA [13]. However, this paper will only discuss the perception of wearing HPDamong maintenance personnel in MiG-29 jet fighter fleet.
2.0 METHODOLOGY
A quantitative approach had been used to investigate the perception of wearing HPDamong maintenance personnel in MiG-29 jet fighter fleet. A sound level meter hadbeen used to collect noise data from noise sources and the noise data were plotted ona map used to portray noisy areas. A questionnaire set had been developed based onthe noise mapping to assess the maintenance personnel knowledge and otherinfluenced factors such as demographic, perceived benefits, perceived barriers, self-efficacy and interpersonal influence.
2.1 Sample Description
There are a total of 101 maintenance personnel who are involved directly and day-to-day in the maintenance works of MiG-29 jet fighter aircraft. The size of thepopulation of the maintenance personnel were taken only from the shift workers whoare exposed to high level of noise and required to use HPD during their normal shiftroutine. Based on the population, the research only required at least 80 samples toanswer the questionnaire sets [12].
Proceedings of the 1st Master Project Symposium on Occupational Safety and Health13-15th December 2016
151
2.2 Instrumentation
The instrumentation that was used to conduct this research was the closed type 5-Likert scale questionnaire. The questionnaire required an inclusion of noise map as itis a part of the questions that need to be answered by the samples in order to obtainthe required data for analysis. Therefore, a noise map was first developed before thequestionnaire set was constructed.
2.2.1 Noise Mapping
The noise data of engines start up activity was collected during Engine Ground Run(EGR) activity in the duration of 40 minutes. The EGR activity was performed at adedicated bay for EGR activity, located at the centre of all buildings. The noise datafor the EGR activity had been collected by using handheld method via Sound LevelMeter (Part No: BK 817) with the range of measurement from 30 dB (A) to 150 dB(A). In order to ensure the noise data were obtained accurately, the Sound LevelMeter was held at arm’s length and at the side of the body with the microphonepointed towards the source of the noise, thus reducing noise reflection [4]. Inaddition, the Sound Level Meter was calibrated before the noise data were collected.The noise was measured and locked at 8 points from the noise source once a steadyreading of 85 dB (A) were obtained. The data then were plotted on the map that wastaken from Real-Time Google Earth Satellite Imagery (refer to Appendix A).
2.2.2 Questionnaire
A closed type 5-Likert scale questionnaire was used to measure the six categories ofinfluencing factors namely; demographic, knowledge, perceived benefits, perceivedbarriers, self-efficacy and interpersonal influence. The questions for the firstinfluencing factor which is demographic required the respondents to give writtenanswers. The questions for the other five influencing factors required the respondentto answer based on the rating scale as 1 for strongly disagree, 2 for disagree, 3 for notsure, 4 for agree and 5 for strongly agree.
3.0 RESULTS AND DISCUSSION
A total of 101 questionnaires set were distributed to the overall population of 101maintenance personnel in MiG-29 jet fighter fleet. However, only 91 questionnairesets were returned back. Analysis was then carried out by using Statistical Package ofSocial Science (SPSS). The result for demographic factor is as shown in Table 1.
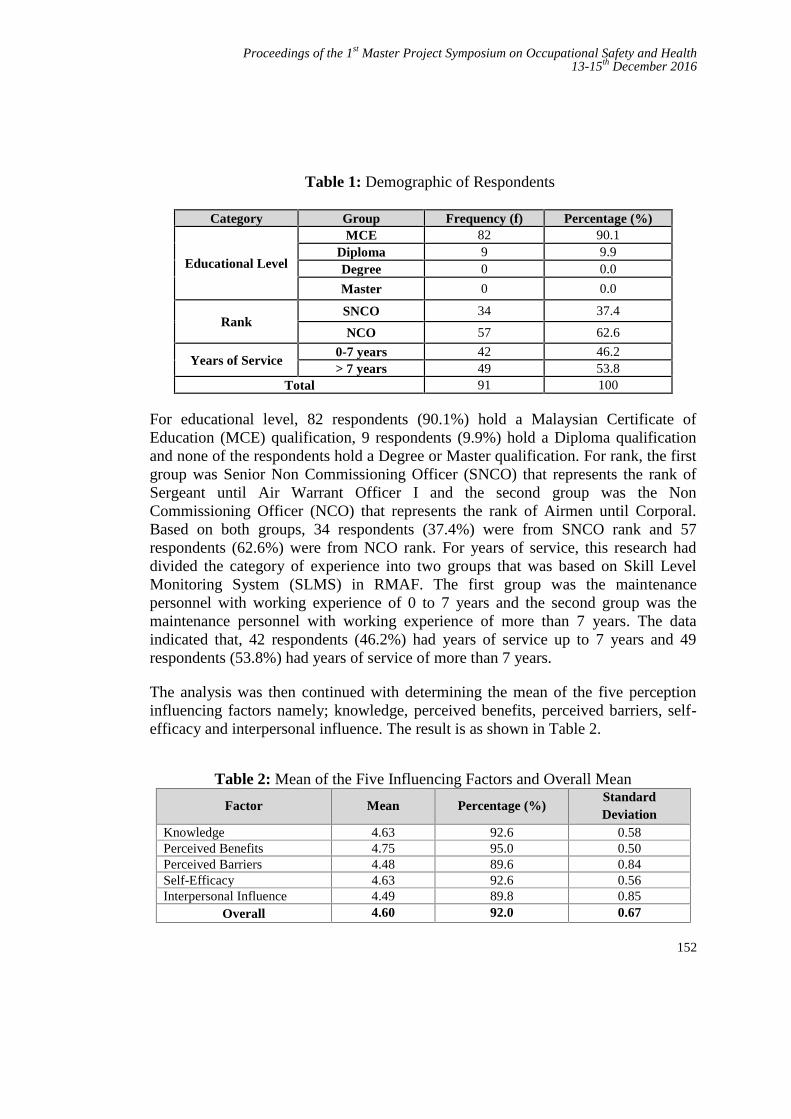
Proceedings of the 1st Master Project Symposium on Occupational Safety and Health13-15th December 2016
152
Table 1: Demographic of Respondents
Category Group Frequency (f) Percentage (%)
Educational Level
MCE 82 90.1Diploma 9 9.9Degree 0 0.0
Master 0 0.0
RankSNCO 34 37.4
NCO 57 62.6
Years of Service0-7 years 42 46.2> 7 years 49 53.8
Total 91 100
For educational level, 82 respondents (90.1%) hold a Malaysian Certificate ofEducation (MCE) qualification, 9 respondents (9.9%) hold a Diploma qualificationand none of the respondents hold a Degree or Master qualification. For rank, the firstgroup was Senior Non Commissioning Officer (SNCO) that represents the rank ofSergeant until Air Warrant Officer I and the second group was the NonCommissioning Officer (NCO) that represents the rank of Airmen until Corporal.Based on both groups, 34 respondents (37.4%) were from SNCO rank and 57respondents (62.6%) were from NCO rank. For years of service, this research haddivided the category of experience into two groups that was based on Skill LevelMonitoring System (SLMS) in RMAF. The first group was the maintenancepersonnel with working experience of 0 to 7 years and the second group was themaintenance personnel with working experience of more than 7 years. The dataindicated that, 42 respondents (46.2%) had years of service up to 7 years and 49respondents (53.8%) had years of service of more than 7 years.
The analysis was then continued with determining the mean of the five perceptioninfluencing factors namely; knowledge, perceived benefits, perceived barriers, self-efficacy and interpersonal influence. The result is as shown in Table 2.
Table 2: Mean of the Five Influencing Factors and Overall Mean
Factor Mean Percentage (%)StandardDeviation
Knowledge 4.63 92.6 0.58Perceived Benefits 4.75 95.0 0.50Perceived Barriers 4.48 89.6 0.84Self-Efficacy 4.63 92.6 0.56Interpersonal Influence 4.49 89.8 0.85
Overall 4.60 92.0 0.67

Proceedings of the 1st Master Project Symposium on Occupational Safety and Health13-15th December 2016
153
Based on Table 2, the overall mean and percentage is high with the mean of 4.6 (SD= 0.67) and percentage of 92%. Based on the scores, it can be stated that the overallperception of wearing HPD among maintenance personnel in MiG-29 jet fighter fleetis very high. This indicates that the maintenance personnel have no prejudice ofperception in wearing HPD and are able to wear HPD consistently and effectivelywhile working at noisy areas. In addition, no dominant factor that leads to theprejudice of perception is found as all of the five perception influencing factors havea high mean as well as high percentage. The lowest score is perceived barriers factorwith mean of 4.48 (SD = 0.84) and percentage of 89.6%.
Subsequently, a t-test analysis was performed to compare the factors of knowledge,perceived benefits, perceived barriers, self-efficacy and interpersonal influencescores with the three demographic factors namely; educational level, rank and yearsof service. The result indicates that there is a statistically significant differencebetween maintenance personnel that hold qualification of MCE (M = 4.77, SD =0.41) and Diploma (M = 4.51, SD = 0.62; t(89) = 1.721, p = 0.027) for perceivedbenefits. The result is shown in Table 3.
Table 3: Comparison between Perception Influencing Factors withEducational Level
PerceptionInfluencing
Factors
Educational LevelDegree
ofFreedom
(Df)
t-value
t-test(p/Sig)
MCE Diploma
Mean(M)
StandardDeviation
(SD)
Population(N)
Mean(M)
StandardDeviation
(SD)
Population(N)
PerceivedBenefits
4.77 0.41 82 4.51 0.62 9 89 1.721 0.027*
*Significant at p < 0.05
It also can be observed that there is a statistically significant difference betweenmaintenance personnel that have years of service 0 to 7 years (M = 4.53, SD = 0.54)and more than 7 years (M = 4.71, SD = 0.45; t (89) = -1.797, p = 0.010) for self-efficacy. In addition, there is also a statistically significant difference betweenmaintenance personnel that have years of service 0 to 7 years (M = 4.44, SD = 0.65)and more than 7 years (M = 4.53, SD = 0.69; t (89) = 1.419, p = 0.013) forinterpersonal influence. The result is shown in Table 4.
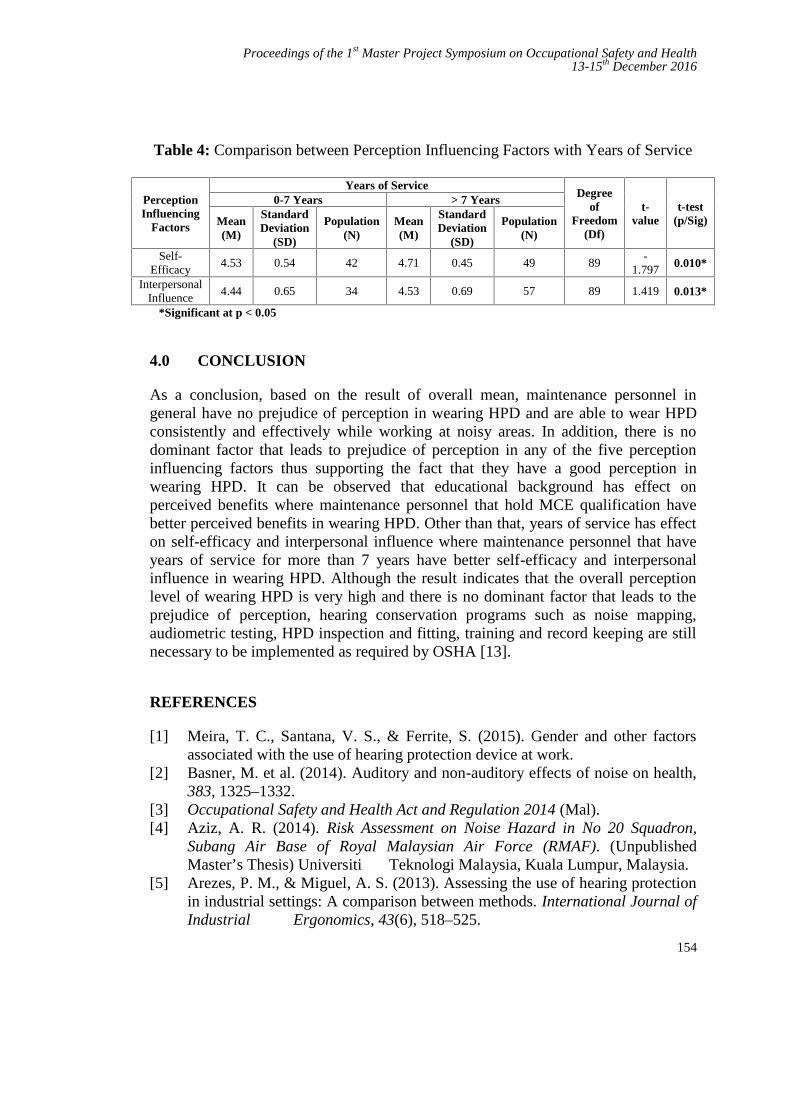
Proceedings of the 1st Master Project Symposium on Occupational Safety and Health13-15th December 2016
154
Table 4: Comparison between Perception Influencing Factors with Years of Service
PerceptionInfluencing
Factors
Years of ServiceDegree
ofFreedom
(Df)
t-value
t-test(p/Sig)
0-7 Years > 7 Years
Mean(M)
StandardDeviation
(SD)
Population(N)
Mean(M)
StandardDeviation
(SD)
Population(N)
Self-Efficacy
4.53 0.54 42 4.71 0.45 49 89-
1.797 0.010*
InterpersonalInfluence
4.44 0.65 34 4.53 0.69 57 89 1.419 0.013*
*Significant at p < 0.05
4.0 CONCLUSION
As a conclusion, based on the result of overall mean, maintenance personnel ingeneral have no prejudice of perception in wearing HPD and are able to wear HPDconsistently and effectively while working at noisy areas. In addition, there is nodominant factor that leads to prejudice of perception in any of the five perceptioninfluencing factors thus supporting the fact that they have a good perception inwearing HPD. It can be observed that educational background has effect onperceived benefits where maintenance personnel that hold MCE qualification havebetter perceived benefits in wearing HPD. Other than that, years of service has effecton self-efficacy and interpersonal influence where maintenance personnel that haveyears of service for more than 7 years have better self-efficacy and interpersonalinfluence in wearing HPD. Although the result indicates that the overall perceptionlevel of wearing HPD is very high and there is no dominant factor that leads to theprejudice of perception, hearing conservation programs such as noise mapping,audiometric testing, HPD inspection and fitting, training and record keeping are stillnecessary to be implemented as required by OSHA [13].
REFERENCES
[1] Meira, T. C., Santana, V. S., & Ferrite, S. (2015). Gender and other factorsassociated with the use of hearing protection device at work.
[2] Basner, M. et al. (2014). Auditory and non-auditory effects of noise on health,383, 1325–1332.
[3] Occupational Safety and Health Act and Regulation 2014 (Mal).[4] Aziz, A. R. (2014). Risk Assessment on Noise Hazard in No 20 Squadron,
Subang Air Base of Royal Malaysian Air Force (RMAF). (UnpublishedMaster’s Thesis) Universiti Teknologi Malaysia, Kuala Lumpur, Malaysia.
[5] Arezes, P. M., & Miguel, A. S. (2013). Assessing the use of hearing protectionin industrial settings: A comparison between methods. International Journal ofIndustrial Ergonomics, 43(6), 518–525.
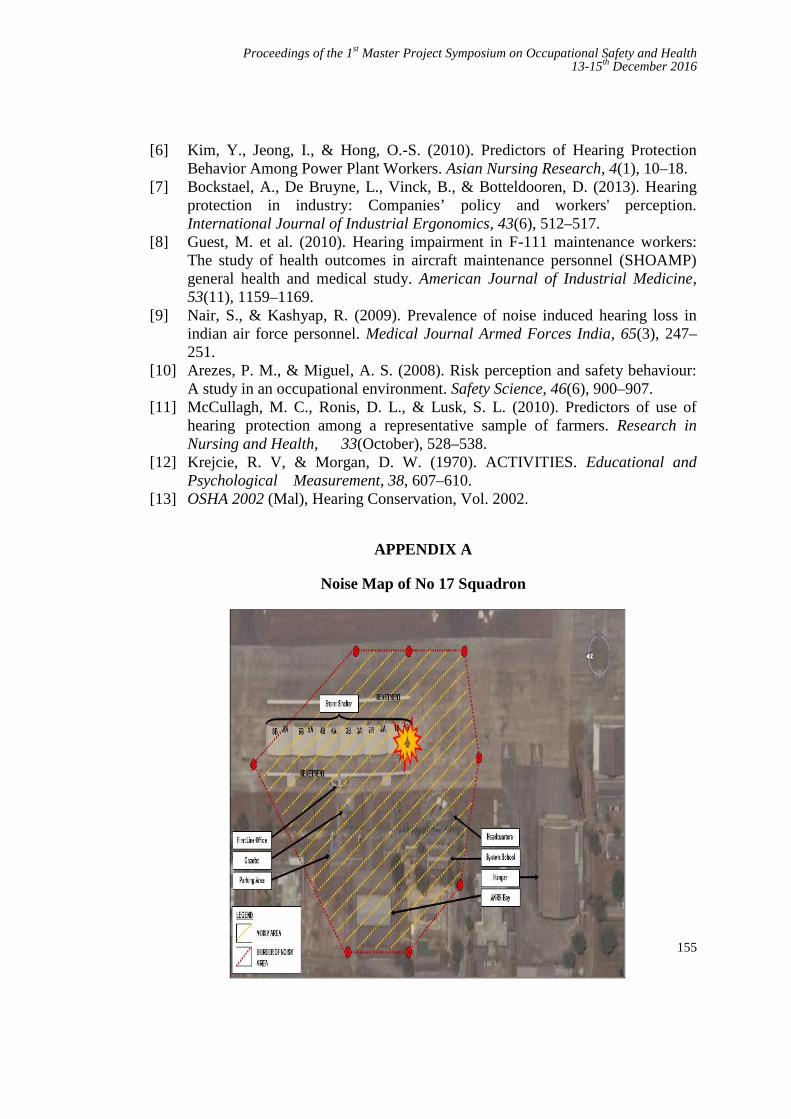
Proceedings of the 1st Master Project Symposium on Occupational Safety and Health13-15th December 2016
155
[6] Kim, Y., Jeong, I., & Hong, O.-S. (2010). Predictors of Hearing ProtectionBehavior Among Power Plant Workers. Asian Nursing Research, 4(1), 10–18.
[7] Bockstael, A., De Bruyne, L., Vinck, B., & Botteldooren, D. (2013). Hearingprotection in industry: Companies’ policy and workers' perception.International Journal of Industrial Ergonomics, 43(6), 512–517.
[8] Guest, M. et al. (2010). Hearing impairment in F-111 maintenance workers:The study of health outcomes in aircraft maintenance personnel (SHOAMP)general health and medical study. American Journal of Industrial Medicine,53(11), 1159–1169.
[9] Nair, S., & Kashyap, R. (2009). Prevalence of noise induced hearing loss inindian air force personnel. Medical Journal Armed Forces India, 65(3), 247–251.
[10] Arezes, P. M., & Miguel, A. S. (2008). Risk perception and safety behaviour:A study in an occupational environment. Safety Science, 46(6), 900–907.
[11] McCullagh, M. C., Ronis, D. L., & Lusk, S. L. (2010). Predictors of use ofhearing protection among a representative sample of farmers. Research inNursing and Health, 33(October), 528–538.
[12] Krejcie, R. V, & Morgan, D. W. (1970). ACTIVITIES. Educational andPsychological Measurement, 38, 607–610.
[13] OSHA 2002 (Mal), Hearing Conservation, Vol. 2002.
APPENDIX A
Noise Map of No 17 Squadron
Proceedings of the 1st Master Project Symposium on Occupational Safety and Health13-15th December 2016
156
Occupational Safety Awareness amongScience Centre Employees
Nur Fakhrin bin Nordin a and Nor Mawati bte Mohd Shariffb
UTM Razak School of Engineering and Advanced Technology, Universiti TeknologiMalaysia, 54100 Jalan Sultan Yahya Petra, Kuala Lumpur, Malaysia
[email protected], [email protected]
Abstract – This study was conducted to assess the level of awareness onoccupational safety among employees of a science centre in Kuala Lumpur. Thecentre is deemed to be vulnerable to safety issues as it engages many part-timers aspart of its manpower. This is because most of the part-timers are teenagers oryoung people who are generally viewed to have less experience, knowledge andtraining on recognizing hazards and safe work practices than their older full-timecounterparts. In order to address this concern, a survey to assess the level ofawareness regarding safety at the workplace was conducted on 97 respondentswhich included full time and part time employees. Data was collected using a 25-item Safety Awareness Measure which assessed respondents’ knowledge andawareness on occupational safety based on the dimensions of policy and procedure,training, tools and equipment, commitment and attitude, and working environment.The composite scores were then categorised into 3 levels of High (25-17),Intermediate (16-8) and Low (7-0) and analysed to determine the respondents’ levelof awareness towards occupational safety. There is no significant difference in levelof awareness between the two groups on overall awareness. However, there was asignificant difference in awareness levels for the dimensions (sections) of tools andequipment, and working environment with the part-timers earning lower totalsection score. Analysis for gender difference against the 5 sections showed thatfemale employees scored lower in tools and equipment. Further analysis alsoshowed that the number of safety training attended made a difference with regard tothe level of awareness and knowledge concerning tools and equipment. Thus, itcan be concluded the management of the science centre should increase or customisesafety training to cater the needs of the part-timers and female employees. Thecustomized program should allow the employees to be more hands-on on the use oftools and equipment. The organization should also make it compulsory for itspart-timer employees who return to work after more than 6 months away to attendrefresher courses.
Keywords: Occupational Safety, science centre, Policy & Procedure, Training, Tools & Equipment,
Proceedings of the 1st Master Project Symposium on Occupational Safety and Health13-15th December 2016
157
Commitment & Attitude, Working Environment, Full timers, Part timers,
1.0 INTRODUCTION
The awareness on Occupational Safety and Health (OSH) plays an important role inthe prevention of accidents and injuries at the workplace. Awareness of safetypractices is an important matter to both employers and employees in order toensure safety and reduce risk of accidents in the workplace. As such, when workersare made aware of the hazards in their workplace, this will – in part – likely serve asa motivator for them to pay attention to safety matters. According to ExpertAdvisory Panel on Occupational Health and Safety [1] increased knowledge oflegislated rights and responsibilities related to occupational safety among employeesis an important factor driving management and workers collaborations to improvesafety and reduce injuries. It is well accepted that workplaces that have positivesafety culture and climates have mechanisms in place to ensure that safety-relatedinformation are available and well-communicated to their employees so that they areaware and alert of safety practises [2].
Yet, reports from Department of Occupational Safety and Health Department(DOSH) [3] have shown otherwise. Although OSHA 1994 has existed inMalaysia for more than ten years, awareness of OSH remains relatively poor andthere is still a need to promote OSH knowledge and principles among all employeesand professionals [4]. Safety incidents at the workplace can happen at any time, andit can happen quickly and is often difficult to manage [5]. While in reality it isdifficult to achieve a no-accident target because of existing safety culture practicesin the communities in Malaysia [6], risk can be reduced through effectivepreventative measures such as by investing on safety equipment, appropriatetraining, and educating stakeholders on matters relating to safety. Theoretical modelsin health behaviour researches have shown that awareness is a key component ofmotivation to engage in health enhancing behaviours (or avoid unhealthybehaviours) [7]. It is said that the main causes of injuries in workplace areattributable to unsafe behaviour by some individuals who are not aware of the dangeror risk of an injury [5].
2.0 THE STUDY
The present study was conducted at a popular discovery centre that emphasises toeducate the public about the science and technology. The science centre receivesmany visitors who are interested to learn about the science of the petroleum industryin an interactive and hands-on way daily. Its emphasizes on the excitement oflearning by engaging visitors to explore, test, experiment, and discover the creativityand application of science around them. Hands-on exhibits and science
Proceedings of the 1st Master Project Symposium on Occupational Safety and Health13-15th December 2016
158
demonstrations are generally used to stimulate interest in science and technology,in particularly in conceptual science. These mini demonstrations include activitiesthat present potential hazards involving heat or pressure, corrosive materials,volatile or flammable chemical or mechanical devices and objects. As a result,safety is paramount and the staff at the centre need to be knowledgeable not only inperforming their duties, but also be aware of safety issues related to their tasks, suchas safe use of demonstration apparatus, and handling of chemicals. The sciencecentre has always considered safety as an imperative matter, especially because itsparent company has a zero tolerance safety policy. This is not just essential for thesafety of employees and visitors to the centre, but also in safeguarding the reputationand image of a government-link corporation.
Accidents may be rare and are preventable; however they can happen due to humanerror, ignorance or negligence. They can happen when the employees do not takecare of what they are doing, are not alert of what might go wrong, have not takenproper safety precautions, or are not aware of what to do during an incident. Asmany staff at the centre are involved in hands-on participation in sciencedemonstration, it is thus imperative that they are aware and alert of safety issuesinvolved when handling these potentially hazardous activities.
Other than employing 150 full-time staff, the centre also employs m a n y part-timee m p l o y e e s . Currently, the ratio of full-time to active part-time staff at thescience centre is 3:1. The part-timers are typically young adults in their early 20sand with some as young as 18 years old. Other than to assist in some administrativework, they are generally employed to engage with visitors that come to the centre.Their tasks vary from assisting the movement of the visitors to performing miniscience demonstrations which often involve some element of risk to safety.
Considering how important the issue of safety is, there is a valid concern that thescience centre may exposed to ‘delinquency’ of the young part-time staff that itregularly employs. Generally, young adults or teenagers are often viewed as easygoing, carefree and immature and are prone to careless acts due to their lack ofexperience and knowledge in life. Younger employees tend to be less experiencedthan their older counterparts and have less job knowledge, training, and skills. Youngworkers may also be less likely to recognize hazards and are less alert to unexpectedchanges that may jeopardise safety and health.
In a study that examined the safety and health awareness, there appears to beevidence that there is difference in the awareness level between categories of sciencelaboratory users. Baizura et al [8] found a difference in the level of safety awarenessbetween the staff (adults) and students (teenagers) where awareness among studentsis lower compared to the staff. It concluded that the adult staff members have moreexperience in handling the equipment safely and are more aware and alert of safety

Proceedings of the 1st Master Project Symposium on Occupational Safety and Health13-15th December 2016
159
compared to the students.
It is therefore worthwhile to examine on their level of awareness on occupationalsafety. Conclusively, this study set out to assess the level of a w a r e n e s s o foccupational safety a n d h e a l t h in terms of policy & procedure, training, tools& equipment, commitment & attitude, and working environment of both part-timeand full-time employees at the centre. The studied variables were picked aftercritical assumption based on similar studies [8, 2, 9], with consideration on thenature of operation at this particular science centre. Because of the variety of theemployees’ background, the study also looked into whether employees’demography has an influence on awareness of occupational safety.
3.0 METHODLOGY
A 25-item instrument was utilized to assess knowledge and measure awarenessregarding safety and health issue at the centre based on five dimensions adaptedfrom Ima Ilyani’s Safety in the Office questionnaire [13]. The instrument wasdeveloped with the assistance the science centre’s Health, Safety and Environment(HSE) officer and was referred to as the Safety Awareness Measure. It consists ofSection A (respondents’ demographic date) and Section B to Section F. Sectionwhich elicit responses from questions on Policy & Procedure, Training, Tools &Equipment, Commitment & Attitude and Working Environment. Thequestions asked were aimed to measure level of knowledge regarding safety as wellas harnessing the level of awareness related to it.
The Safety Awareness Measure, which was developed using Google Forms wasdistributed electronically to 150 part-time and full-time employees in theorganization via email and WhatsApp application. Completed response wascollected from 97 active employees, and therefore analysis is based on the 65%returned response. A response rate of 56% from part-time, and 46% from full-time employees. The response rate achieved was already considered good given themedium of distribution. Independent sample T-Test was run, and Levene’s Test wasconducted to ensure that the imbalance distribution of response from full-time andpart-time staff, which are 69 and 28 respectively, did not have any significant impacton the result of the study.
Employees’ level of awareness on safety is determined based on the compositescore achieved based on total number of correct responses from the 25-itemmeasure (Table 1).
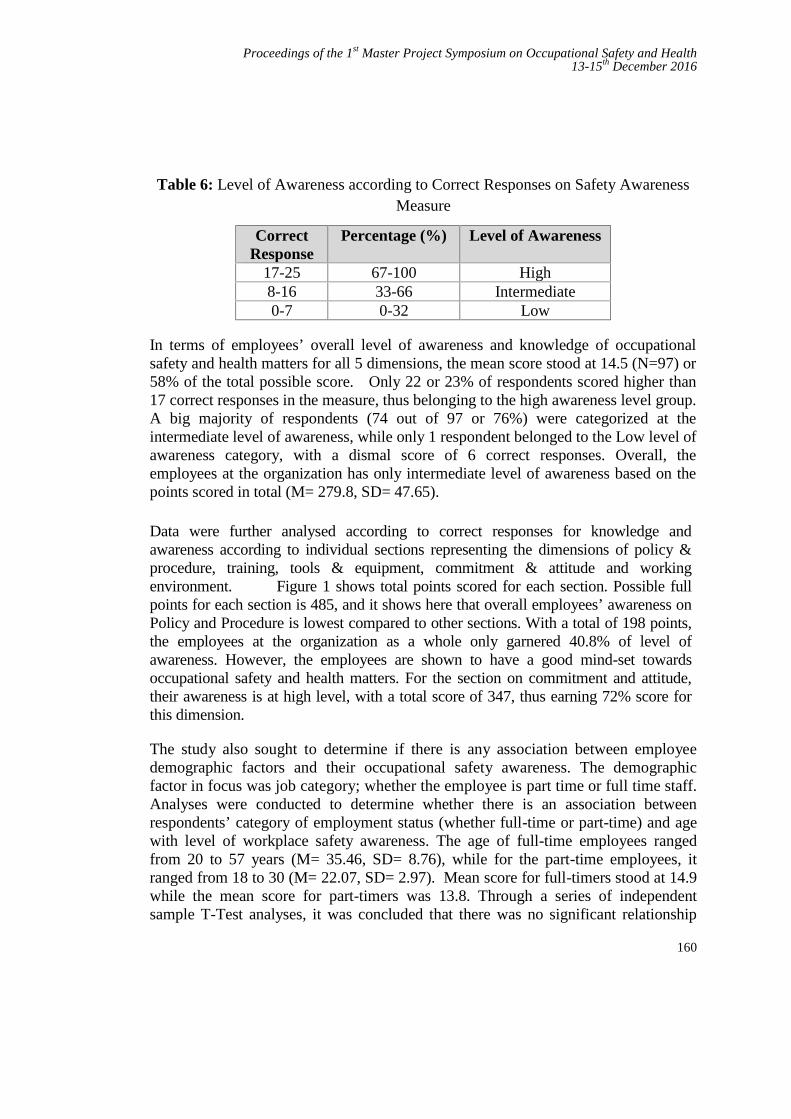
Proceedings of the 1st Master Project Symposium on Occupational Safety and Health13-15th December 2016
160
Table 6: Level of Awareness according to Correct Responses on Safety AwarenessMeasure
CorrectResponse
Percentage (%) Level of Awareness
17-25 67-100 High8-16 33-66 Intermediate0-7 0-32 Low
In terms of employees’ overall level of awareness and knowledge of occupationalsafety and health matters for all 5 dimensions, the mean score stood at 14.5 (N=97) or58% of the total possible score. Only 22 or 23% of respondents scored higher than17 correct responses in the measure, thus belonging to the high awareness level group.A big majority of respondents (74 out of 97 or 76%) were categorized at theintermediate level of awareness, while only 1 respondent belonged to the Low level ofawareness category, with a dismal score of 6 correct responses. Overall, theemployees at the organization has only intermediate level of awareness based on thepoints scored in total (M= 279.8, SD= 47.65).
Data were further analysed according to correct responses for knowledge andawareness according to individual sections representing the dimensions of policy &procedure, training, tools & equipment, commitment & attitude and workingenvironment. Figure 1 shows total points scored for each section. Possible fullpoints for each section is 485, and it shows here that overall employees’ awareness onPolicy and Procedure is lowest compared to other sections. With a total of 198 points,the employees at the organization as a whole only garnered 40.8% of level ofawareness. However, the employees are shown to have a good mind-set towardsoccupational safety and health matters. For the section on commitment and attitude,their awareness is at high level, with a total score of 347, thus earning 72% score forthis dimension.
The study also sought to determine if there is any association between employeedemographic factors and their occupational safety awareness. The demographicfactor in focus was job category; whether the employee is part time or full time staff.Analyses were conducted to determine whether there is an association betweenrespondents’ category of employment status (whether full-time or part-time) and agewith level of workplace safety awareness. The age of full-time employees rangedfrom 20 to 57 years (M= 35.46, SD= 8.76), while for the part-time employees, itranged from 18 to 30 (M= 22.07, SD= 2.97). Mean score for full-timers stood at 14.9while the mean score for part-timers was 13.8. Through a series of independentsample T-Test analyses, it was concluded that there was no significant relationship
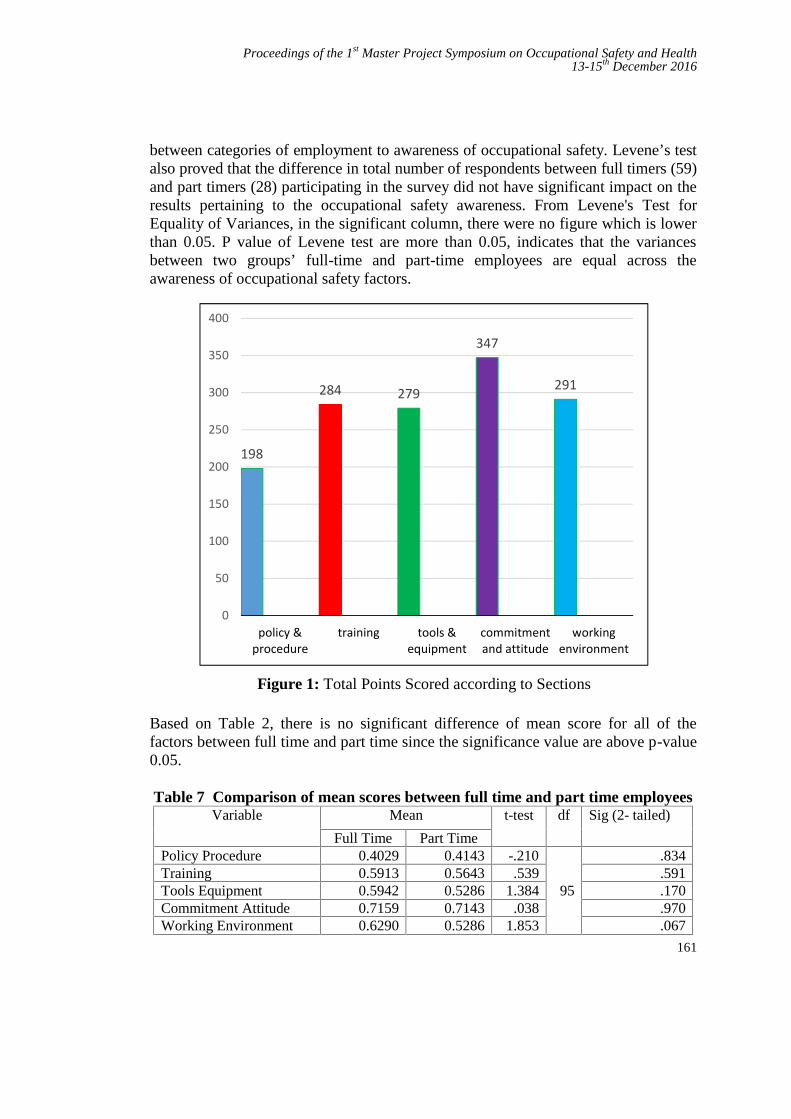
Proceedings of the 1st Master Project Symposium on Occupational Safety and Health13-15th December 2016
161
between categories of employment to awareness of occupational safety. Levene’s testalso proved that the difference in total number of respondents between full timers (59)and part timers (28) participating in the survey did not have significant impact on theresults pertaining to the occupational safety awareness. From Levene's Test forEquality of Variances, in the significant column, there were no figure which is lowerthan 0.05. P value of Levene test are more than 0.05, indicates that the variancesbetween two groups’ full-time and part-time employees are equal across theawareness of occupational safety factors.
Figure 1: Total Points Scored according to Sections
Based on Table 2, there is no significant difference of mean score for all of thefactors between full time and part time since the significance value are above p-value0.05.
Table 7 Comparison of mean scores between full time and part time employeesVariable Mean t-test df Sig (2- tailed)
Full Time Part TimePolicy Procedure 0.4029 0.4143 -.210
95
.834Training 0.5913 0.5643 .539 .591Tools Equipment 0.5942 0.5286 1.384 .170Commitment Attitude 0.7159 0.7143 .038 .970Working Environment 0.6290 0.5286 1.853 .067
198
284 279
347
291
0
50
100
150
200
250
300
350
400
policy &procedure
training tools &equipment
commitmentand attitude
workingenvironment
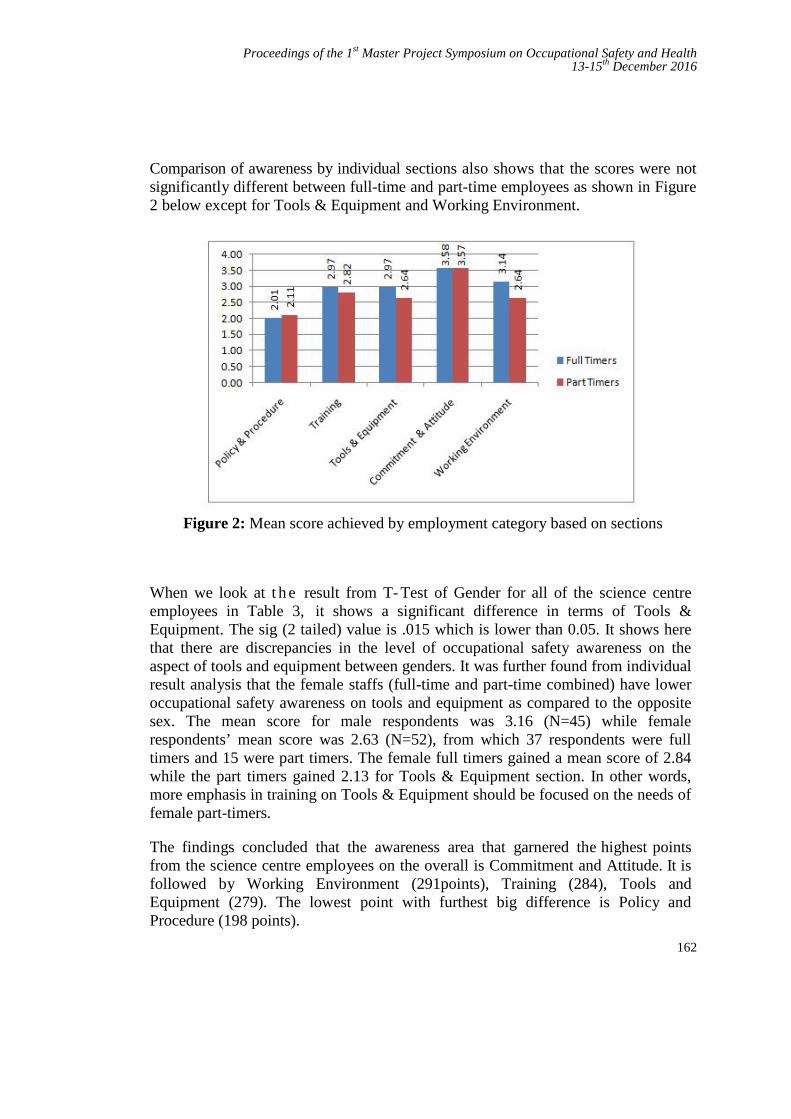
Proceedings of the 1st Master Project Symposium on Occupational Safety and Health13-15th December 2016
162
Comparison of awareness by individual sections also shows that the scores were notsignificantly different between full-time and part-time employees as shown in Figure2 below except for Tools & Equipment and Working Environment.
Figure 2: Mean score achieved by employment category based on sections
When we look at t h e result from T- Test of Gender for all of the science centreemployees in Table 3, it shows a significant difference in terms of Tools &Equipment. The sig (2 tailed) value is .015 which is lower than 0.05. It shows herethat there are discrepancies in the level of occupational safety awareness on theaspect of tools and equipment between genders. It was further found from individualresult analysis that the female staffs (full-time and part-time combined) have loweroccupational safety awareness on tools and equipment as compared to the oppositesex. The mean score for male respondents was 3.16 (N=45) while femalerespondents’ mean score was 2.63 (N=52), from which 37 respondents were fulltimers and 15 were part timers. The female full timers gained a mean score of 2.84while the part timers gained 2.13 for Tools & Equipment section. In other words,more emphasis in training on Tools & Equipment should be focused on the needs offemale part-timers.
The findings concluded that the awareness area that garnered the highest pointsfrom the science centre employees on the overall is Commitment and Attitude. It isfollowed by Working Environment (291points), Training (284), Tools andEquipment (279). The lowest point with furthest big difference is Policy andProcedure (198 points).
Proceedings of the 1st Master Project Symposium on Occupational Safety and Health13-15th December 2016
163
Tools and Equipment and Working Environment sections were respectively havedifference in mean score of 0.33 and 0.5 between the full timers and part timers withthe rest of the sections have lower difference in mean score.By looking at t-testresults testing whether demographic factors would have significant effect on thelevel of occupational safety, there is significant value when it comes to Tools &Equipment between Male and Female respondents.
Table 8 : t- Test of Gender Difference
Levene's Testfor Equality of
Variances t-test for Equality of Means
F Sig. t df
Sig.(2-
tailed)Mean
DifferenceStd. ErrorDifference
95% ConfidenceInterval of the
Difference
Lower Upper
PolicyProcedures
0.278 0.599 0.778 95 0.438 0.03821 0.04908-
0.05924 0.13565
0.776 91.573 0.44 0.03821 0.04925-
0.05962 0.13603
Training1.347 0.249 1.415 95 0.16 0.06393 0.04517
-0.02573 0.1536
1.402 88.42 0.164 0.06393 0.04559-
0.02666 0.15452
Tools &Equipment
0.19 0.664 2.47 95 0.015 0.10419 0.04219 0.02044 0.18794
2.467 92.638 0.015 0.10419 0.04223 0.02033 0.18805
Commitment&Attitude
0.306 0.581-
0.619 95 0.538 -0.0247 0.03992-
0.10395 0.05455-
0.614 89.266 0.541 -0.0247 0.04024-
0.10465 0.05524
WorkingEnvironment
0.029 0.865 0.165 95 0.869 0.00829 0.05013-
0.09122 0.1078
0.165 92.897 0.869 0.00829 0.05014-
0.09128 0.10786
4.0 CONCLUSION
The analysis of overall awareness level shows that the science centre employees areat an intermediate level of awareness on matters regarding occupational safety. Thefull-timer staff scored generally higher because they are better informed on thesafety matters because of the higher number of safety training they have attended,and because they are better-acquainted with the environment and the tools andequipment used in the premises. The scores for part-timer staff were slightlylower due to their lack or smaller amount of presence in the premises given theyonly come in during their semester break or weekends, as many are either studentsor are fully employed elsewhere. The full-time staffs also have more specifictraining for handling some safety related equipment such as the automated external

Proceedings of the 1st Master Project Symposium on Occupational Safety and Health13-15th December 2016
164
defibrillator (AED). However, the part-timers scored higher on awareness of Policy& Procedure, probably due to recent employment when the study was conducted.All part-time staffs are required to attend the first and major safety briefing duringtheir orientation program which exposes them to the Safety & Health Policy.
Because the organization is pursuing zero accidents and aspires to achieve highlevel of awareness in terms of occupational safety, it therefore falls to the HSEOfficer to conduct regular monthly briefing especially on matters related to Policy& Procedure with all employees. It would also be good to have a clearer andmore comprehensive Safety and Health Policy posted at more visible placesthroughout the premises. The current ones are less noticeable, to the point of beingalmost hidden. Safety training programs would be ones that allow the employees tobe more hands-on on the use of tools and equipment in the science centre for femaleemployees, especially if they are female part-time staff. Refresher courses shouldbe made compulsory for part-timers who return to work after more than 6 monthsabsence. Currently, the science centre only requires part-time staff to attendrefresher training only if they had not been active at the science centre for more than12 months.
REFERENCES
[1] National Institute of Occupational Safety and Health. Occupational Safetyand Health Act and Regulations Edition 2011, MDC Publisher Sdn .Bhd.,Kuala Lumpur, 2011.
[2] Ima Ilyani Ibrahim, Sarina Muhamad Noor, Noraini Nasirun and ZulaihaAhmad. Safety in The Office: Does It Matter to The Staff?. Procedia -Social and Behavioral Sciences no 50, pp. 730 – 740, 2012.
[3] DOSH. Laman Web Jabatan Keselamatan dan Kesihatan Pekerjaan. 1998.Retrieved from http://www.dosh.gov.my
[4] Lugah V, Ganesh B., Darus A, Retneswari M, Rosnawati M R, Sujatha D.Training of occupational safety and health: knowledge among healthcareprofessionals in Malaysia. Singapore Medical Journal, Vol 51, no 7, pp.586-592, 2010.
[5] Mohd Fairuz B Talib, Keprihatinan Pensyarah Terhadap AmalanKeselamatan Bengkel Di ADTEC Batu Pahat. Masters dissertation, UniversitiTun Jussein Onn Malaysia, 2014.
[6] Siti Naqiah Mohd Shaain, Noor. Raudhiah Abu Bakar and AzharuddinHashim, Faktor-Faktor Yang Mempengaruhi Kesedaran Pekerja TerhadapAmalan Keselamatan Pekerjaan: Kajian Kes Di Sebuah Syarikat Logistik.2015.Retrieved from http://www.kuis.edu.my/icomm/2nd/download/IC%20016.pdf
[7] Peter M. Smith, Ron Sunders., Marni Lifshen, Ollie Black, Morgan Lay and

Proceedings of the 1st Master Project Symposium on Occupational Safety and Health13-15th December 2016
165
F. Curtis Breslin, Anthony D. LaMontagne and Emile Tompa. TheDevelopment of a Conceptual Model and Self- Reported Measure ofOccupational Health and Safety Vulnerability. Accident Analysis andPrevention, no 82, pp. 234-243, 2015.
[8] Baizura Zubir, Fazidah Saad, Wan Faradiana Wan Maidin, Mohd RiduanJamaludin, Safety and Health Awareness among Staff and Students inWorkshop and Laboratory of an Engineering Technology UniversityCampus. International Journal of Engineering Research & Technology(IJERT), Vol 5, no 3, 2016.
[9] Hapriza bte Ashari, Durrishah Idrus, Fadilah Binti Zaini, Hamidah bte AbdRahman, Rossilah bte Jamil, Syaharizatul Noorizwan bte Muktar. KajianKesedaran Staf UTM Terhadap Keselamatan Dan Kesihatan Di TempatKerja, Jurnal Teknologi, Penerbit Universiti Teknologi Press, No 47, Dis.2007.
Proceedings of the 1st Master Project Symposium on Occupational Safety and Health13-15th December 2016
166
Community Preparedness and Responsetowards Disaster in Iskandar Puteri Johor
Mohd Zainoor Annuar Mohd Zaina and Sallehuddin Muhamadb
UTM Razak School of Engineering and Advanced Technology, Universiti TeknologiMalaysia, 54100 Jalan Sultan Yahya Petra, Kuala Lumpur, Malaysia
[email protected], [email protected]
Abstract – Community preparedness is vital to reduce the impact post-disaster. Theaim of this study is to gauge level of awareness on preparedness and response fromcommunity in Iskandar Puteri Johor. In this study, quantitative survey method wasused. Participants was recruited using convenience sampling with response rate 71%(n=107). Study in the Iskandar Puteri Johor indicates that majority of thepopulations in Taman Nusa Bayu were not ready when a disaster strike. Both genderand education level did not play a role in awareness towards disaster preparedness.The Malaysian community are not exposed to disaster preparedness training and lesssupport from various agencies, thus, a program to improve awareness and to makecommunity resilience is required.
Keywords: Disaster, Community, Preparedness, Response, DRR, CBDRM
1.0 INTRODUCTION
Iskandar Puteri is a new township development area in state of Johor which hassimilar blue-print as Putrajaya. The new township contributes to socio-economydevelopment to its state and nation. It hosts the state new administration office,education hub and tourism facilities like the Legoland Malaysia and the Hello KittyTown [1]. This economic region is currently being developed until the year 2025 [2].Most of natural disasters in Malaysia are resulted from the heavy rain [3]. Flood isthe major natural disaster in Malaysia which many communities that live along therivers face this problem [4]. As Iskandar Puteri is not surrounded by river, flood isnot a common threat to the community. Nevertheless, every year residents of theIskandar Puteri face with severe monsoon season as well as haze from neighboringcountry. Economic development in Iskandar Puteri however, could cause flash flood.Rapid economic development couples with climate change, alter the physicalstructure of the earth and may cause flood to occur anywhere without warning [5].

Proceedings of the 1st Master Project Symposium on Occupational Safety and Health13-15th December 2016
167
Community awareness is defined community that has information and knowledge onparticular subject that will enhance skills and behavior. Level of awareness can becategorized in the level of socio-economy, education, political surrounding and soon. According to Buckland & Rahman, community that had an experience withdisaster will be prepared to face new disaster [6]. Nevertheless, social media andnewspaper reported that the community response to flood in Kelantan was badwhereby the community will wait until last minute to evacuate.
Awareness on disaster to the community will allow community to independentlyresponse to any warning [7]. The challenge is the level of awareness in disaster inindustrial sector in some part of Malaysia is deteriorating, that might implicate to theawareness in that community. Three objective of this study, to identify communityperception on disaster risk, investigate the community awareness on preparednessand response during disaster and lastly to develop Community Emergency ResponseTeam.
2.0 METHODOLOGY
The area of the study is at Taman Nusa Bayu. This area is a newly developmenthousing estate. The population live here is estimated to 500 houses in phase A, B andC. The community is a middle income and educated background. This study isperformed by using quantitative survey method and the sampling strategy is using theconvenience sampling.
2.1 Instrument
A survey questionnaires was used to collect data for this study. The questionnaireswere adapted from Federal Emergency Management Agency [2]. It was purposelydeveloped to survey the American households on disaster preparedness since 2007.Originally, the questionnaire consists of 16 sections including demographicinformation.
For the purpose of this study, the amended version was reduced into 7 sections with atotal of 46 items. Section A, is about demographic information (3-items); section Bon perceive risk (4-items); section C perceive severity (4-items); section Dmotivators/ barriers (13-items); section E able to respond (7-items); section Fcommunity plans (7-items), and section G household preparedness (8-items).
2.2 Statistical Analysis
Descriptive statistic was used to determine the level of community awareness anddisaster preparedness. Chi-square test were performed to determine the correlation ofdisaster preparedness and independent variables. Consequently, a Phi Cramer’s V

Proceedings of the 1st Master Project Symposium on Occupational Safety and Health13-15th December 2016
168
test were performed to identify the strength of correlation that have been found fromchi-square test. All statistical analysis were performed using SPSS V.22.0.
3.0 RESULTS AND DISCUSSION
The survey has yield 71.2% response rate with total of 107 participants. The majorityof participants in this study are middle age between 25 to 44 years old, high educatedand not equally represented by gender.
The first objective of this study is to identify the community perception towardsdisaster risk that will affect to residents at Taman Nusa Bayu. Therefore, section B ofthe questionnaire has addressed on the participants’ perception on the risk of disasterin their community. The frequency table (Table 1) describing on the participants’perception on several disasters risk in Taman Nusa Bayu community.
Table 9: Disaster risk perception
Questionnaire Items Related to Disaster Risk Mean SD
Perceive Risk
Natural disaster will occur 3.26 0.87
Terrorism will occur 1.72 0.68
Hazardous materials accident will occur 2.36 0.69
Contagious disease outbreak will occur 3.31 0.98
Perceive Severity
A natural disaster, such as an earthquake, a hurricane, a flood 3.32 0.78
An act of terrorism, such as biological, chemical, radiological, orexplosive attack
1.50 0.60
A hazardous materials accident, such as a transportation accidentor a power plant accident
1.84 0.80
A highly contagious disease outbreak, such as a H1N1 fluepidemic (In 2009, text was changed from "bird flu epidemic" to"H1N1" during fielding due to the H1N1 outbreak)
3.53 1.0
Based on data presented in Table 1, the participants perceive that contagious diseaseoutbreak is the highest risk in the community among other types of disaster (mean =3.31, SD = 0.98). On the other hand, terrorism indicate the lowest risk perceived bythe participants with mean value 1.72 (SD = 0.68). The same pattern of response wasidentified when referring to the severity of disaster. Contagious disease outbreak wasindicated the most severe with mean score at 3.53 (SD = 1.0) among other types of
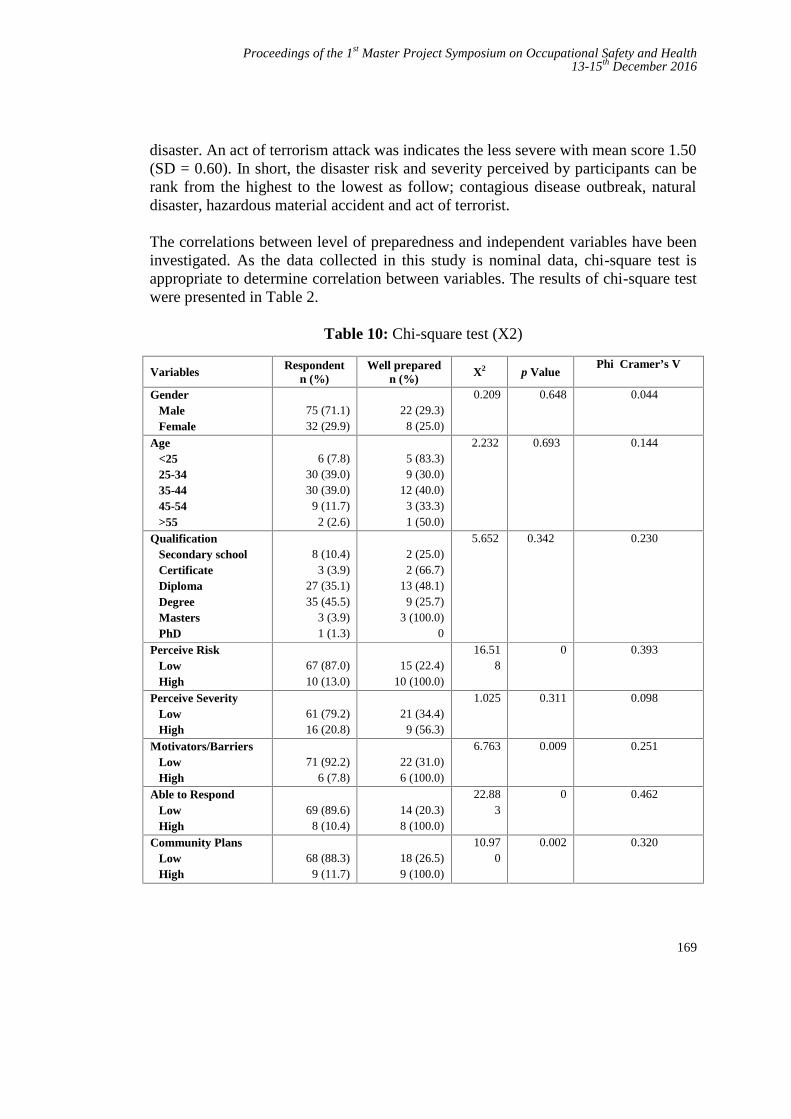
Proceedings of the 1st Master Project Symposium on Occupational Safety and Health13-15th December 2016
169
disaster. An act of terrorism attack was indicates the less severe with mean score 1.50(SD = 0.60). In short, the disaster risk and severity perceived by participants can berank from the highest to the lowest as follow; contagious disease outbreak, naturaldisaster, hazardous material accident and act of terrorist.
The correlations between level of preparedness and independent variables have beeninvestigated. As the data collected in this study is nominal data, chi-square test isappropriate to determine correlation between variables. The results of chi-square testwere presented in Table 2.
Table 10: Chi-square test (X2)
Variables Respondentn (%)
Well preparedn (%) X2 p Value
Phi Cramer’s V
GenderMaleFemale
75 (71.1)32 (29.9)
22 (29.3)8 (25.0)
0.209 0.648 0.044
Age<2525-3435-4445-54>55
6 (7.8)30 (39.0)30 (39.0)
9 (11.7)2 (2.6)
5 (83.3)9 (30.0)
12 (40.0)3 (33.3)1 (50.0)
2.232 0.693 0.144
QualificationSecondary schoolCertificateDiplomaDegreeMastersPhD
8 (10.4)3 (3.9)
27 (35.1)35 (45.5)
3 (3.9)1 (1.3)
2 (25.0)2 (66.7)
13 (48.1)9 (25.7)
3 (100.0)0
5.652 0.342 0.230
Perceive RiskLowHigh
67 (87.0)10 (13.0)
15 (22.4)10 (100.0)
16.518
0 0.393
Perceive SeverityLowHigh
61 (79.2)16 (20.8)
21 (34.4)9 (56.3)
1.025 0.311 0.098
Motivators/BarriersLowHigh
71 (92.2)6 (7.8)
22 (31.0)6 (100.0)
6.763 0.009 0.251
Able to RespondLowHigh
69 (89.6)8 (10.4)
14 (20.3)8 (100.0)
22.883
0 0.462
Community PlansLowHigh
68 (88.3)9 (11.7)
18 (26.5)9 (100.0)
10.970
0.002 0.320
Proceedings of the 1st Master Project Symposium on Occupational Safety and Health13-15th December 2016
170
There were no significant different relationship between participant disasterpreparedness and demographic variables that include gender, age and qualification.For independent variables, there are significant different relationship with disasterpreparedness for variables including participants’ perceive risk (p = 0),motivators/barriers (p = 0.009), able to respond (p = 0) and community plansawareness (p = 0.002). Only participants’ perceive severity of disaster risk indicatesno significant different relationship with disaster preparedness (p = 0.311).
Further, the strength of significant relationship found among variables was referred atphi Cramer’s V test. The interpretation was made using scale as follow; small = 0.01,medium = 0.30, large = 0.5. With the range between 0 and 1, the larger the value willindicate the stronger the relationship between two variables. Therefore, participants’ability to respond has a stronger relationship with their disaster preparedness (phi =0.462) while motivator/barrier indicate the weakest relationship (phi = 0.251).
Based on the result of this study, in order to gain awareness and preparedness toresponse towards disaster. Teams of community emergency response team need to beestablished. Commonly, all of newly housing estate has their own JKKK (JawatanKuasa Keselamatan Kampung) or Village Development and Security Committee. Inorder to get some initiative of allowance from the government, JKKK must beregister to Registry of Society (ROS) beforehand. These are the normal process fornew JKKK to be recognized. The suggestion is to put extra process on getting theapproval from ROS (Figure 1). JKKK is to establish Community EmergencyResponse Team (CERT) by adding a structure of CERT committee. Before going toROS, a new JKKK must come with a list of their own structure on CERT along withthe structure of JKKK before getting approval by ROS. This procedure requiredcooperation and hands-to-hands work between ROS and NADMA which is theagency of disaster management in Malaysia. In this scenario, NADMA to give aguideline to ROS on the simple structure of CERT. This will encourage eachcommunity that plan to have JKKK to do extra work by getting extra team likeCERT from their own community.

Proceedings of the 1st Master Project Symposium on Occupational Safety and Health13-15th December 2016
171
Figure 5: Development of CERT by JKKK
4.0 CONCLUSION
This paper presents a result of community in Iskandar Puteri towards disaster. Theyperception on disaster risk is most on pandemic not on natural disaster like flood,earthquake, hurricane or other disaster like terrorism nor industrial disaster. The testproven that the population in Taman Nusa Bayu is low in level awareness for thepreparedness and response during disaster. They are not well prepared. Further studyon disaster preparedness need to be conducted to community in all of the peninsularstate in Malaysia. This is inclusive to all area whether the area is disaster-prone ornot. The awareness should be instill start from school level to population in the entirenation. Malaysia is not isolated from disaster although we are leaving out of PacificRing of Fire.
REFERENCES
[1] Khalil, R. A. A., Johar, F., & Sabri, S. 2015. The Impact of New-buildGentrification in Iskandar Malaysia: A case study of Nusajaya. Procedia -Social and Behavioral Sciences, 202, 495–504.https://doi.org/10.1016/j.sbspro. 2015.08.192
[2] Osman, M. M., Bachok, S., & Rabe, N. S. 2015. Local Residents’ Perceptionon Socio-economic Impact of Iskandar Malaysia: An Example of UrbanRegeneration Program in Malaysia. Procedia - Social and Behavioral Sciences,170, 58–69. https://doi.org/10.1016/j.sbspro.2015.01.015
[3] Shaluf, I. M., & Ahmadun, F. R. 2006. Disaster types in Malaysia: anoverview. Disaster Prevention and Management, 15(2), 286–298.
Proceedings of the 1st Master Project Symposium on Occupational Safety and Health13-15th December 2016
172
https://doi.org/ 10.1108/ 09653560610659838[4] Zahari, R. K., & Ariffin, R. N. R. 2013. Community-Based Disaster
Management in Kuala Lumpur. Procedia - Social and Behavioral Sciences, 85,493–501. https://doi.org/10.1016/j.sbspro.2013.08.378
[5] Elias, Z., Hamin, Z., & Othman, M. B. 2013. Sustainable Management ofFlood Risks in Malaysia: Some Lessons from the Legislation in England andWales. Procedia - Social and Behavioral Sciences, 105, 491–497.https://doi.org/10.1016/j.sbspro.2013.11.052
[6] Buckland, J., & Rahman, M. 199). Community-based disaster managementduring the 1997 Red River Flood in Canada. Disasters, 23(2), 174–191.
[7] Shiwaku, K., Shaw, R., Kandel, R. C., Shrestha, S., & Dixit, A. 2006.Promotion of disaster education in Nepal: The role of teachers as changeagents. Int J Mass Emerg Disasters, 24(3), 403.
Proceedings of the 1st Master Project Symposium on Occupational Safety and Health13-15th December 2016
173
Occupational Stress Management amongSU-30MKM Maintenance Personnel in
Gong Kedak Air BaseMohd Zulfadli Mahdi *1,a and Khairur Rijal Jamaludin2,b
1UTM Razak School of Engineering and Advance Technology, Universiti TeknologiMalaysia, 54100 Jalan Sultan Yahya Petra, Kuala Lumpur, Malaysia
a,*[email protected], [email protected]
Abstract: In the Royal Malaysian Air Force, Engineering Department at GongKedak Air Base is responsible for operating and maintaining the fighter aircraft Su-30MKM. The aim of this study is to determine the level of stress and causes thatcontribute to the occupational stress problem among Su-30MKM maintenancepersonnel in Gong Kedak Air Base. The scope of this study involved the maintenancepersonnel from No 11 Squadron and Cawang Kejuruteraan in Gong Kedak Air Base.The questionnaires for the survey and interview were conducted and will be the maininstruments as to gather information and as to identify either those said variables arecorrelated or not correlated. The secondary information was collected from books,journals, magazines, and a few others. This study involved 132 Su-30MKMmaintenance personnel consisting of various ranks, age, gender, marital status,working experiences, education backgrounds, and incomes (gross and nett). Theresult of the study will determine the level of occupational stress among Su-30MKMmaintenance personnel and further identify the most important factors which canlead to the occupational stress among aircraft maintenance personnel in GongKedak Air Base. There are some methods due to contributing factors proposed inorder to reduce the occupational stress among Su-30MKM maintenance personnel.
Keywords: Occupational, stress management, maintenance
1.0 INTRODUCTION
The purposes of this paper are to evaluate the stress level and to identify the factorsthat contributed to the occupational stress among Su-30MKM maintenance personnelin Gong Kedak Air Base. Gulab & Sandhya Mehta, [1] in their study has identifiedcertain contributing factors for stress. They are classified under three categories;socio-economic including familial reasons, environmental/organisational, andmedical/ psychological causes.The causes of stress are known as stressors and there

Proceedings of the 1st Master Project Symposium on Occupational Safety and Health13-15th December 2016
174
are few categories of stress such as physical stressors, psychological stressors, andphysiological stressors. Nonetheless, there are a few ways to handle stress physically,psychologically, and additional recommendations. This paper will describe andidentify the stress level and contributing factors which lead to the stress problemamong Su-30MKM maintenance personnel in aviation working environment. Theaim for this study is to suggest several methods in stress management to ensure thesemaintenance personnel can cope with their stress during working environment. Stressmanagement is crucial for aviation personnel in order for them to be working in astress-free environment and later produce an optimum quality of work.
The project objective is to identify the current stress level and contributing factorsthat lead to the stress problem among Su-30MKM maintenance personnel in GongKedak Air Base. The goal for this study is to reduce the occupational stress levelamong maintenance personnel by proposing methods in stress management. Theobjectives of this paper are as follows; 1. To evaluate the occupational stress level onSu-30MKM maintenance personnel. 2. To identify the most factors that contributedto the occupational stress among Su-30MKM maintenance personnel. 3. To proposemethods in reducing the occupational stress among Su-30MKM maintenancepersonnel.
2.0 METHODOLOGY
2.1 Population
The population of a research as the study of a large group is concern in which aresearch is relevant and related. Significantly, the sample for this project is 132 outof the 213 Su-30MKM maintenance personnel which is the target population for thisparticular project. The unit of analysis for this research is the maintenance personnelwho are involved only in aircraft launching, rectification, and servicing at GongKedak Air Base.
2.2 Data Collection
According to the research framework, after determining the area of work study whichis selected at No 11 Squadron and Cawang Kejuruteraan in Gong Kedak Air Base,this paper will be carried out in order to find out why stress happens among thepersonnel and how to counter and reduce it. The result shows that two significantfactors faced by the top of the management in Gong Kedak Air Base are verbalcomplaints about stress and bad pattern of human resources depletion in term of earlyretirement among personnel.
Proceedings of the 1st Master Project Symposium on Occupational Safety and Health13-15th December 2016
175
2.3 Observation
Observation will be carried out at No 11 Squadron and Cawang Kejuruteraan inGong Kedak Air Base. This observation method will focus more on daily activities.Aircraft launching, rectification, and servicing are some of the instances of the dailyactivities done by the personnel. The main objective through this observation is tofind out the main factors that contributes to the occupational stress problems amongmaintenance personnel.
2.4 Questionnaire
The questionnaire will be divided into two types in order to fulfill the first andsecond research objectives. First type of questionnaire is adapted from ISMA StressQuestionnaire (International Stress Management Association 2013) in order tomeasure the stress level among personnel. Second objective will be achieved bydeveloping the questionnaire which focuses more on the factors that lead to theoccupational stress problem. The maintenance personnel will first be briefed aboutthe research objective, the purpose of the project and also the requirements of theassessment before conducting the questionnaire. All the respondents must beexplained especially in term of the aims of this project which are to find out the stresslevel and contributing factors that lead to the stress problem among Su-30MKMmaintenance personnel. Other than that, this questionnaire will hopefully be able totrigger suitable methods in order to manage the stress.
2.5 Data Analysis
Analysis is a research technique of making replicable and valid references from datato their context. As mentioned previously, data obtained from the questionnaire willbe analysed by using SPSS (version 17) software. Tables, drawing graphs, and alsooutput are going to be used as a mean of data analysis. Apart from that,representations like charts, pie charts, and others will be used and applied to confirmeasy and quick interpretation of data. Responses will also be conveyed inpercentages.
3.0 RESULTS
3.1 Stress Level among Personnel
The first phase of this paper is to identify the current stress level among maintenancepersonnel in Gong Kedak Air Base. Questionnaires on stress level were distributed to132 personnel and based on the results; most are exposed to high level of stress.

Proceedings of the 1st Master Project Symposium on Occupational Safety and Health13-15th December 2016
176
The total of 63.6% of maintenance personnel are exposed to high stress, 34.8%personnel are exposed to moderate stress, and only 1.6% of maintenance personnelare exposed to low stress.
3.2 Demographic Characteristic
The questionnaires were completed by 132 aircraft maintenance technician with totalresponse rate was 100%. From the data collection, majority (96.2%%) of therespondent were male while (3.8%) females, majority of them age group between 20– 29 years old (67.4%) while (32.6%) 30 – 49 years old., Education level at leastHigh School certificate (68.9%), had length of experience within 2 - 5 years.
3.3 Cause Factor lead to the Stress
Analysis on probable cause has been carried out based on four sub topics regardingto the occupational stress problem among maintenance personnel in Gong Kedak AirBase. The four sub topics are management, environment, human, and financial. inorder to identify the most probable cause that leads to the occupational stressproblem, both descriptive statistics on frequency, percentage, mean, and standarddeviation are used and applied to each response under the sub topic.
Table 1: Sress level among Su-30MKM maintenance personnel
ScoreLevel of stress Number of
respondentTotal Number of
respondentPercentages
≤ 4 Low stress 2
132
1.6%
5 - 13 Moderate stress 46 34.8%
14 High stress 84 63.6%
Total 132 100%
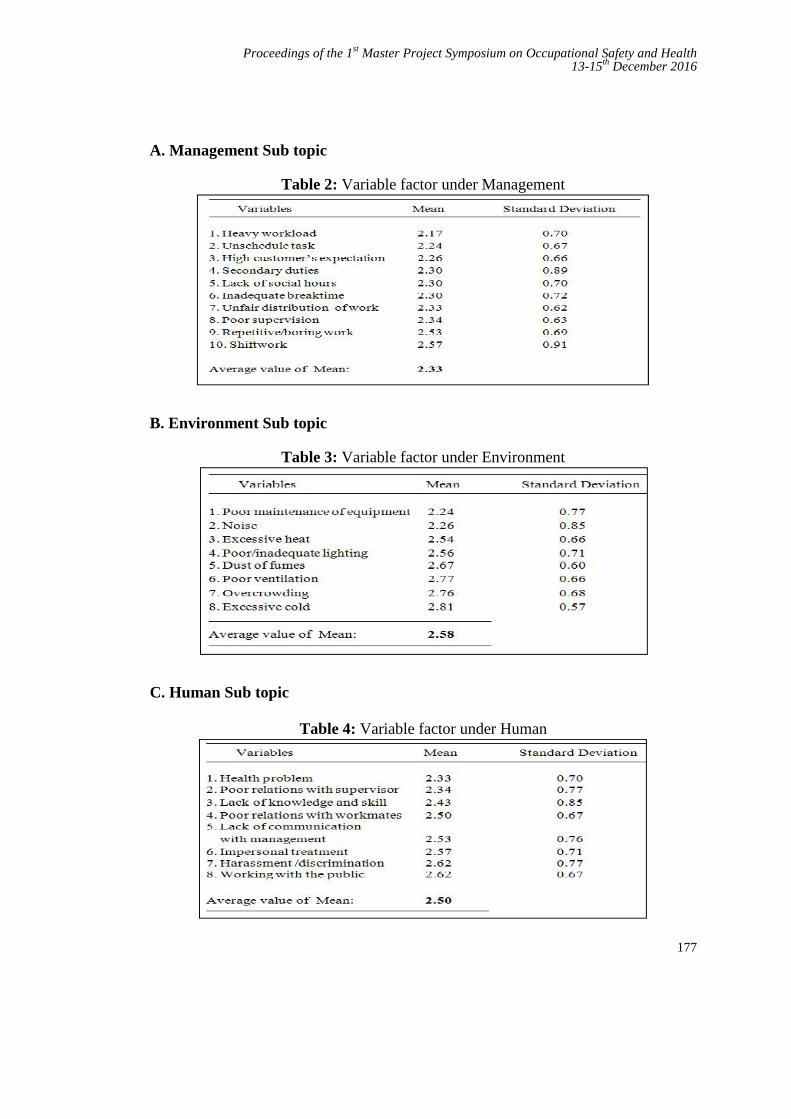
Proceedings of the 1st Master Project Symposium on Occupational Safety and Health13-15th December 2016
177
A. Management Sub topic
Table 2: Variable factor under Management
B. Environment Sub topic
Table 3: Variable factor under Environment
C. Human Sub topic
Table 4: Variable factor under Human
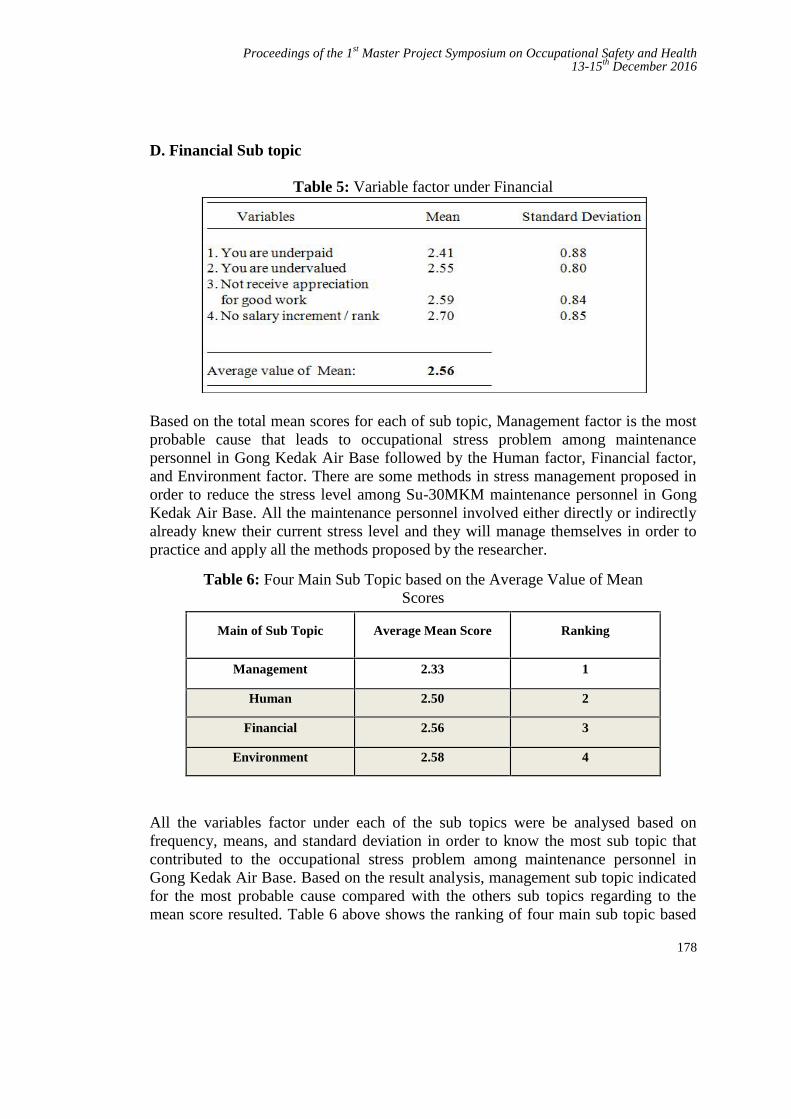
Proceedings of the 1st Master Project Symposium on Occupational Safety and Health13-15th December 2016
178
D. Financial Sub topic
Table 5: Variable factor under Financial
Based on the total mean scores for each of sub topic, Management factor is the mostprobable cause that leads to occupational stress problem among maintenancepersonnel in Gong Kedak Air Base followed by the Human factor, Financial factor,and Environment factor. There are some methods in stress management proposed inorder to reduce the stress level among Su-30MKM maintenance personnel in GongKedak Air Base. All the maintenance personnel involved either directly or indirectlyalready knew their current stress level and they will manage themselves in order topractice and apply all the methods proposed by the researcher.
Table 6: Four Main Sub Topic based on the Average Value of MeanScores
Main of Sub Topic Average Mean Score Ranking
Management 2.33 1
Human 2.50 2
Financial 2.56 3
Environment 2.58 4
All the variables factor under each of the sub topics were be analysed based onfrequency, means, and standard deviation in order to know the most sub topic thatcontributed to the occupational stress problem among maintenance personnel inGong Kedak Air Base. Based on the result analysis, management sub topic indicatedfor the most probable cause compared with the others sub topics regarding to themean score resulted. Table 6 above shows the ranking of four main sub topic based

Proceedings of the 1st Master Project Symposium on Occupational Safety and Health13-15th December 2016
179
on the average value of mean scores. The management factor triggered for the mostsub topic that contributed to the occupational stress problem among maintenancepersonnel in Gong Kedak Air Base which mean score (M = 2.33).
The interview between high stress level personnel was carried out in order to confirmand support the result by the quantitative method from the questionnaires. Based onthis result, the answers from the respondents (60%) revealed the management is themain factor that contributed to the high stress level in the organisation. The resultshows that personnel at average age 18 – 29 years old are highly exposed to the highstress in the work place. The result also shows that majority of personnel agree withthe early retirement among Su-30MKM maintenance personnel has related to theoccupational stress problem in the organisation.
Table 7: Result of the interview with the high stress level respondents
INTERVIEW WITH THE SU-30MKM MAINTENANCE PERSONNEL
(AGE 18 – 29 YEARS OLD)
RESPONDENT
(High stresslevel)
RANKSYMPTOM
‘KEY WORD’PROBABLE
CAUSEEARLY RETIREMENT
RELATED
1 KPL ‘Work load’ Management Yes
2 KPL‘Less of Senior
Rank’ Management Yes
3 KPL‘Not enough rest
timeManagement Yes
4 KPL‘Lack of
communication’ Human Yes
5 KPL ‘Additional tasking’ Management Not sure
6 LUK ‘Salary not enough’ Financial Yes
7 LUK ‘Less of man power’ Management Not sure
8 LUK‘Gap with the
senior’ Human Yes
9 LU‘Lack of
cooperation’ Human Not sure

Proceedings of the 1st Master Project Symposium on Occupational Safety and Health13-15th December 2016
180
4.0 DISCUSSION
The third objective of this paper is to propose method in reducing the occupationalstress among Su-30MKM maintenance personnel. In order to achieve the thirdobjective of this paper, a survey was conducted to the five of experience 1st linepersonnel from the others rank and two of 1st line Engineering Officer due toManagement factor that lead to the occupational stress problem in Gong Kedak AirBase.
Table 8: Methods in Reducing the Occupational Stress Level
MANAGEMENT
Variable Factor Method to Reduce The Occupational Stress
Heavy workload Prioritize the task
Unscheduled task Get organised and stick to the plan
High customer’s expectation Competency and maintenance skill level
Secondary duties Dare to delegate the task
Lack of social hours Create social activity
Inadequate break time and mealtime Allow flexi time and remote working time
Unfair distribution of work Set boundaries and stick to them
Poor supervision Lead by example
Repetitive and boring work Get up and moving
Shift work Minimise working on continuous night shift
Base on the present study by Charanjeev Singh et.al., [2] depicted the stress levels ofnursing students which resulted as severe stress (2.3%), moderate stress (63.6%) andmild (34.1%). The total of 63.6% of maintenance personnel exposed to the highstress, 34.8% exposed to the moderate stress, and only 1.6% of maintenancepersonnel exposed to the low stress. This two findings show the different pattern ofthe results which indicated that aircraft maintenance personnel in Gong Kedak AirBase are at high risk of suffering from work stress in the organisation due to thepercentage of high stress level.
10 LU ‘Less of leave’ Management Not sure

Proceedings of the 1st Master Project Symposium on Occupational Safety and Health13-15th December 2016
181
A previous survey of 1,299 employees from 37 organizations was conducted byDavid Lee [3] in order to find out the causative factors that lead to the stress amongemployees in the Article of Maine Employers' Mutual Insurance Company. In thatsurvey, the result shows that management and employees being rigid andunsupportive management were the main probable causes that contributed to thestress problem among the employees. In this paper, Management sub topic (M =2.33) triggered as a most contributing factor that lead to the stress problem amongthe aircraft maintenance personnel.
A survey by Sakshi Sharma [4] through questionnaire to the 415 Indian Armysoldiers found the occupational stressors in the Indian Army are due to the lack ofcontrol at work, role conflict, and also workload and job pressure. Heavy Workloadtriggered as a most aggravating factor contributed to the occupational stress problemamong the aircraft maintenance personnel in Gong Kedak Air Baase. Dixit [5], stressamong soldiers can be triggered even by the slightest change in their workplacewhether in their workload or everything surrounding them. The best way to reducethe work stress is by keep workload under control, communicate, and ask for help[6,7].
In this paper, there are 10 methods are proposed in reducing the stress level amongthe maintenance personnel regarding to the variable factors under the Managementsub topic. All the stress methods are Prioritize, Get organised and stick to the plan,Improve competency and maintenance skill level, Delegate the task, Create socialactivity, Allow flexi time and remote working time. Set boundaries and stick to them,Lead by example, Get up and moving, Minimise working on continuous night shift.
4.1 Suggestion on method in managing stress
The survey was conducted after the result analysis and findings were carried out asstated in Chapter 4. Based on the answer from all of respondents in the survey, thereare several suggestion that have been proposed due to the occupational stressproblem in Gong Kedak Air Base. All the suggestions are as below:
a. Manager in the Engineering Department must have a flexible working timefor personnel who have higher workload where they must be given an off-day whenever there is less maintenance activity.
b. Management must practice a balanced work life as a way to manage stress ofthe maintenance personnel where there is scheduled time for them toengage in sport activity, religious program, and other social activities.As current practice, Engineering Department at Gong Kedak Air Basehas already practised giving the rewards to the maintenance personnelwho show high working commitment every month in the name of ‘BestAirman of the Month’.

Proceedings of the 1st Master Project Symposium on Occupational Safety and Health13-15th December 2016
182
c. The management could organise and slot a talk session on how to controlstress at workplace. This is the way to give exposure to themaintenance personnel about the importance of stress management andcan also change their mentality to be stronger in facing all the tasks andworkload.
d. The number of manpower must be increased in order to cover all the tasksand workload either in the shift time or normal time. All the duties could bedelegated when the number of maintenance personnel increased.
e. The secondary duties could be given for those who are not involved directlyto the aircraft maintenance activities.
f. The management must assign an experienced supervisor in order to monitorall the schedule turn in shift and make sure all the process of duties delegatedare going well.
g. The management must build up monitoring system team led by anexperienced Engineering Officer and supervisor by trade as a member inorder to manage the fresh technician and tackle complex tasks. It will becomea heavy workload to fresh personnel if this issue is not countered.
h. One issue highlighted on the unbalanced task distribution which is not properdue to different trades of personnel. The load of work depends on the level ofproblem and what system and trade personnel to be involved. Some of theproblems can just be solved by single trade personnel and sometimes, theproblem can only be solved by the combination of multi trade personneldepending on the related system.
i. The management must ensure all the personnel upgrade their skill level to ahigher standard in order to ensure all the tasks can be fairly distributed to anymaintenance personnel in the organisation. Normally, only the skilfulpersonnel do a lot of jobs compared to the other personnel and this situationwill contribute to the occupational stress problem among the group of skilfulpersonnel.
j. Improve communication between management and maintenance personnel inorder to listen and identify the current problem faced by the personnel.Management must know their men and be fair with all personnel while givingyearly evaluation marks or any promotion. It is a positive reward and moraleto the skilful and hardworking personnel in the organisation.
Proceedings of the 1st Master Project Symposium on Occupational Safety and Health13-15th December 2016
183
4.2 Constraint and Limitation
There is some limitation to be described in this paper. This project is limited ingathering data like medical report on stressed personnel due to RMAF policy itself asa government sector. Other than that, the time to complete this paper is also alimitation for the researcher due to personal position as a 1st line Engineering Officerin the organisation and is always involved with the detachment or exercise outsidethe parent Air Base.
4.3 Application
This paper is suitable to be applied in other agencies and workplace area related withthe system management in the organisation such as in construction, engineeringapplication, and of course in the aviation field. All the finding methods in this papercan be practiced and applied to suit the system management in the organisation.Management in the work organisation can be used as a guidance and reference inorder to prevent and manage the stress level among employees in the organisation.
5.0 CONCLUSION
The methods in reducing the stress level among the maintenance personnel has beenproposed and discussed in this paper such as prioritize, get organised and stick to theplan, improve competency and maintenance skill level, delegate the task, createsocial activity, lead by example and so on. The others issue that related with theoccupational stress and work organisation has also been discussed which are in thesection significance of this paper.
In the application, there are few steps had been developed in order to avoid the stressamong the maintenance personnel in the working environment. Furthermore, thereare few information can be implemented and practiced by the organisation in order tomake sure their personnel feel happy and enjoy on the task given. Ultimately, it willreduce the verbal complaint about the stress problem and also early retirement amongthe Su-30MKM maintenance personnel and at the same time can increase theorganisation productivity.
Contribution of this project can be fully mentioned as well after all of the stressmethods are applied in the work organisation. The quality of life and work lifebalanced among the management personnel will be managed and ensured by themanagement in the organisation. All the methods in managing the occupational stresswill be endorsed and pulished to the Management of Engineering Department inGong Kedak Air Base.

Proceedings of the 1st Master Project Symposium on Occupational Safety and Health13-15th December 2016
184
REFERENCES
[1] Gulab and Sandhya Mehta (2015). A Review of Stress Management in IndianAir Force. International Journal of Science Technology andManagement, Vol. No. 4, Special Issue No. 01, November 2015, page 275.
[2] Charanjeev Singh, Sunita Sharma, Ravinder Kumar Sharma (2011). Level ofStress and cooping strategies used by nursing interns, Nursing and MidwiferyResearch Journal, 152-155.
[3] David Lee (2000). Managing Employee Stress and Safety - A guide tominimizing stress related cost while maximizing employee productivity.Article of Maine Employers' Mutual Insurance Company, 7.
[4] Sakshi Sharma (2015). Occupational Stress in the Armed Forces: An IndianArmy Perspective. Journal of IIMB Management Review, 187.
[5] K C Dixit (2016). Addressing Stress-Related Issues in Army. IDSAOccasional Paper No. 17. Institute for Defence Studies and Analysis,New Delhi, 6
[6] Jeremy Stranks (2005). Stress at Work, Management and Prevention. Book asa guide for managers, 142-143.
[7] Jain, A. K., & Cooper, C. L. (2012). Stress and Organisational CitizenshipBehaviour in Indian Business Process Outsourcing Organisations. IIMBManagement Review , 24, 155-163.
Proceedings of the 1st Master Project Symposium on Occupational Safety and Health13-15th December 2016
185
Factors Influencing Sharp Injury ReportingAmong Healthcare Workers in Hospital
MelakaNur Farhana Hamzah aand Nik Hasnaa Nik Mahmoodb
UTM Razak School of Engineering and Advanced Technology, Universiti TeknologiMalaysia, 54100 Jalan Sultan Yahya Petra, Kuala Lumpur, Malaysia
[email protected], [email protected]
Abstract - Prevalence of sharp injury is high in Hospital Melaka, with 25 per 1000healthcare worker being affected each year. However, according to World HealthOrganization, surveillance data tend to underestimate t rue rate of sharp injuriesbetween 18% and 70%. Various factors affecting reporting behaviour can be dividedinto organizational factors and health belief. The objective of the study is 1) todetermine the level of awareness and compliance on sharp injury reporting amonghealthcare workers in Melaka, 2) To identify the relationship between awareness onreporting, organizational factors and health belief with sharp injury-reporting behaviouramong healthcare workers, 3) To determine the impact of awareness on reporting,organizational factors and health belief with sharp injury reporting behaviour amonghealthcare workers. HCWs who reported sharp injury between 2011 and 2015 wereinvited to answers questionnaires pertaining these factors. Descriptive statistics, meanscores and multiple logistic regression were used for the analysis.
Keywords: sharp injury reporting, healthcare workers, health belief, organization safety climate
1.0 INTRODUCTION
Sharp injury is a significant occupational hazard among healthcare workers. Therisk control has shifted from personal approach to a complex integration safetyengineering and administrative organizational approach. In system-basedapproach, prevention of prevent sharp injuries among healthcare workers relies onreported data but often hampered by underreporting of cases among the healthcareworkers [1]-[6]. Surveillance data tend to underestimate true rate of sharp injuriesbetween 18% and 70% [7]. Healthcare workers who tend to not report theirsharp injury, often emphasized on negative aspects of reporting withoutundergoing the process of reporting itself [8].
Pfeiffer proposed a psychological framework of antecedents to healthcare workermotivation to report or not to report a sharp injury. Psychological antecedents are
Proceedings of the 1st Master Project Symposium on Occupational Safety and Health13-15th December 2016
186
divided into individual factors, organizational factors and reporting system itself[9]. There are fewer total accidents reported and lesser underreporting in a goodsafety climate [10]. Similar emphasis was seen in the presence of supervisorenforcement of safety [10], good co-worker support and positive peer pressure[11]-[14], minimal workload or less production pressure [2] [11] [15]. Bodencombining all these 3 factors: organization safety practice, staff adequacy and co-worker support in his study reported that good perception of safety practice is apredictor for reporting sharp injuries. Coworker support and staff adequacy hasonly substantial correlation [16]. The authors suggest that the other factorsmight have a complex interplay in stages of injury reporting.
Health Belief Model predicts factors at individual level and does not integrate otherexternal factors [4]. In magnet hospitals where all organizational factors arefavourable, decision to report relies on healthcare workers’ perception barrier[17]. Tabak reported that compliers have high level of knowledge on blood borneinfection, higher perception on susceptibility of contracting disease, severity ofdisease and benefit of reporting compare to non-compliers. Perception to reportingefficacy has greatest compliance with duty to report [18].
The authors address the importance of reporting sharp injuries as the vitalcomponent in promoting sharp safety among healthcare workers. Determiningfactors that affect a sustained injury to be reported is essential to encourageparticipation of healthcare workers to contribute their opinion, insight a n de x p e r i e n c e in t a i l o r i n g t h e p r e v e n t i o n program. This s t u d y i sd e s i g n e d t o s t u d y organizational factors and health belief factors thatinfluence healthcare workers to report a sustained sharp injury.
2.0 METHODOLOGY
2.1 Data
The questionnaire-based survey was conducted between September 2016 andNovember 2016. Name, age, gender, working duration, department and contactnumber were extracted from 329 OHU/SIS-II forms in Hospital Melaka. All 329subjects were contacted based on contact number given in the OHU/SIS-II formand invited to participate in this survey. Only 189 were contactable and 82responded. All 82 questionnaires were complete and included in the analysis.This is a 43.3% response rate representing 24% of total available data for reportedcases. Respondents were allowed to choose between paper-pencil and onlinequestionnaire.
Proceedings of the 1st Master Project Symposium on Occupational Safety and Health13-15th December 2016
187
2.2 Instruments and Measurements
Instrument was measured by Likert scale where 1= strongly disagree and 5=strongly agree. The safety practice was an 8-item scale adapted from OrganizationalPolicies and Practice Questionnaire measuring safety measures and managementat work place [19].
Perceived staff adequacy measurement was a 5-item scale based on the RevisedNursing Work Index by focusing on staff availability, adequate time to discusscases, skills nurturing and the need to cover duty out of job scope [20]. Perceiveco-worker support measurement was a 5-item scale based on Job ContentQuestionnaire measuring relationship and team works between doctors and nursesand availability of colleague support when needed [21]. Health belief measurementwas adapted from Rosenstock’s Health Belief Model (1959). This section consistsof 24 questions divided into 5 subtopics: perceived susceptibility of disease,perceived severity of disease, perceived benefit of reporting, perceiveddisadvantage of reporting, and overall maintenance of health [22]. Thecompliance to report a sustained sharp injury in the future was measured bylevel of compliance. This section consists of seven-item statements to assessworkers compliance to duty to report a sustained sharp injury in the futureadopted from Haridi [23]
2.3 Data Analysis
Reliability of the construct is assessed using Cronchbach Alpha Coefficient.Descriptive analysis was applied to characterize the frequency of distribution ofvariables. Demographic data and frequency tables were compiled from thereturned questionnaires. Level of awareness and compliance is described usingmean score, percentage divided in categories “Good”, “Moderate” and “Poor”.Using inferential statistics, the relationships between independent factors(awareness, organizational safety practice and health belief) with dependentvariable (level of compliance) were analysed by correlation and regressionanalysis at significant level p< 0.05. Frequency analyses and correlations areconducted using The Statistical Package for the Social Science (SPSS) Version23.
3.0 RESULTS AND DISCUSSION
3.1 Demography
Female healthcare workers reported more sharp injuries (68.7%) compared to32.7% male healthcare workers (Table 1). Those age less than 30 years oldmake up 79.3% the reported group. Doctors report most injuries (80.5%)
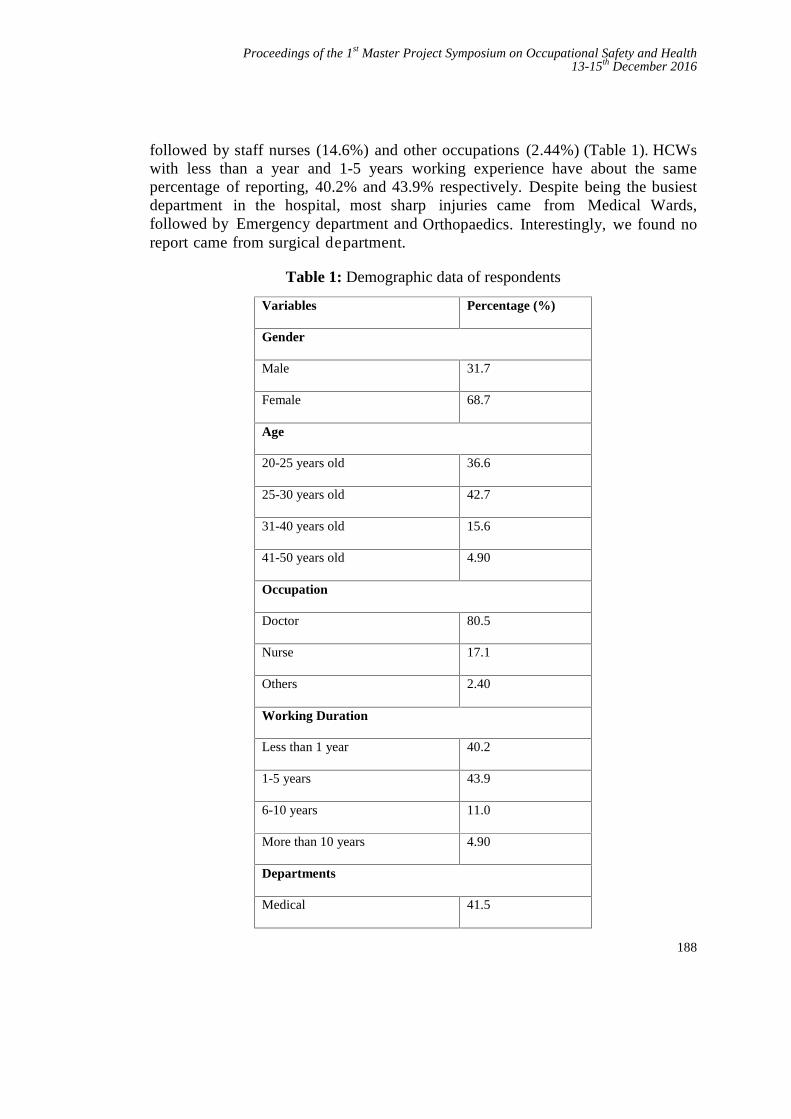
Proceedings of the 1st Master Project Symposium on Occupational Safety and Health13-15th December 2016
188
followed by staff nurses (14.6%) and other occupations (2.44%) (Table 1). HCWswith less than a year and 1-5 years working experience have about the samepercentage of reporting, 40.2% and 43.9% respectively. Despite being the busiestdepartment in the hospital, most sharp injuries came from Medical Wards,followed by Emergency department and Orthopaedics. Interestingly, we found noreport came from surgical department.
Table 1: Demographic data of respondents
Variables Percentage (%)
Gender
Male 31.7
Female 68.7
Age
20-25 years old 36.6
25-30 years old 42.7
31-40 years old 15.6
41-50 years old 4.90
Occupation
Doctor 80.5
Nurse 17.1
Others 2.40
Working Duration
Less than 1 year 40.2
1-5 years 43.9
6-10 years 11.0
More than 10 years 4.90
Departments
Medical 41.5
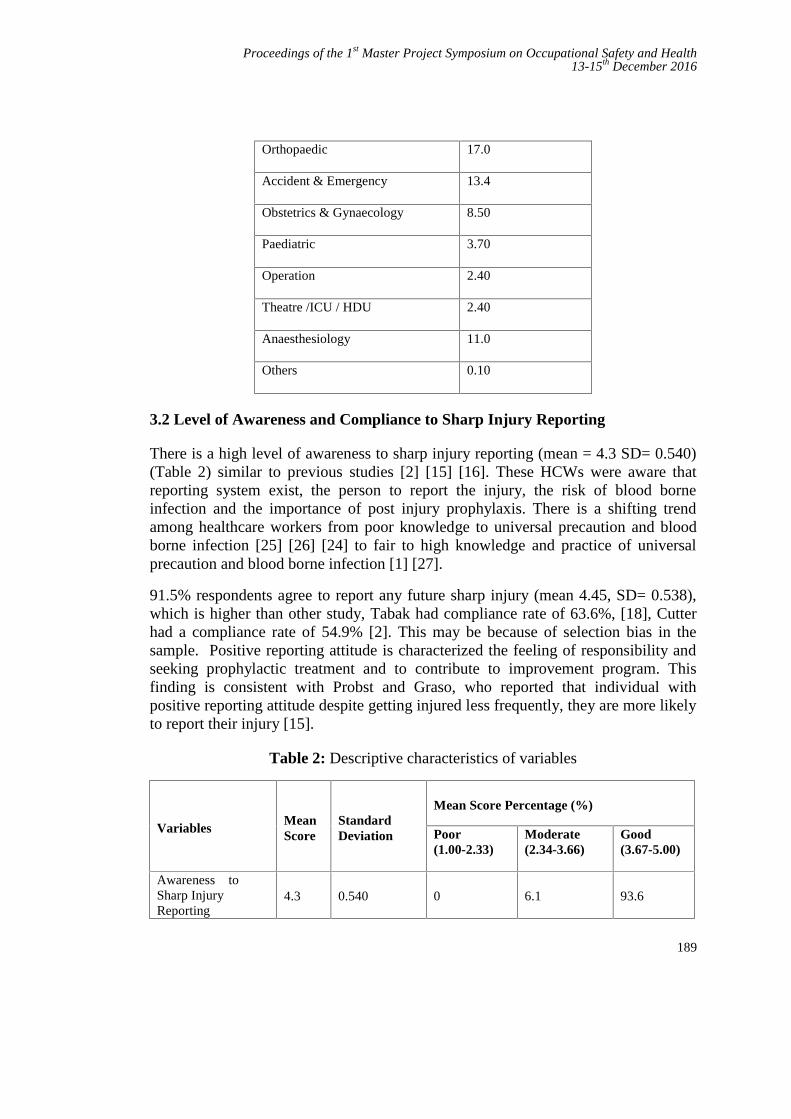
Proceedings of the 1st Master Project Symposium on Occupational Safety and Health13-15th December 2016
189
Orthopaedic 17.0
Accident & Emergency 13.4
Obstetrics & Gynaecology 8.50
Paediatric 3.70
Operation 2.40
Theatre /ICU / HDU 2.40
Anaesthesiology 11.0
Others 0.10
3.2 Level of Awareness and Compliance to Sharp Injury Reporting
There is a high level of awareness to sharp injury reporting (mean = 4.3 SD= 0.540)(Table 2) similar to previous studies [2] [15] [16]. These HCWs were aware thatreporting system exist, the person to report the injury, the risk of blood borneinfection and the importance of post injury prophylaxis. There is a shifting trendamong healthcare workers from poor knowledge to universal precaution and bloodborne infection [25] [26] [24] to fair to high knowledge and practice of universalprecaution and blood borne infection [1] [27].
91.5% respondents agree to report any future sharp injury (mean 4.45, SD= 0.538),which is higher than other study, Tabak had compliance rate of 63.6%, [18], Cutterhad a compliance rate of 54.9% [2]. This may be because of selection bias in thesample. Positive reporting attitude is characterized the feeling of responsibility andseeking prophylactic treatment and to contribute to improvement program. Thisfinding is consistent with Probst and Graso, who reported that individual withpositive reporting attitude despite getting injured less frequently, they are more likelyto report their injury [15].
Table 2: Descriptive characteristics of variables
VariablesMeanScore
StandardDeviation
Mean Score Percentage (%)
Poor(1.00-2.33)
Moderate(2.34-3.66)
Good(3.67-5.00)
Awareness toSharp InjuryReporting
4.3 0.540 0 6.1 93.6
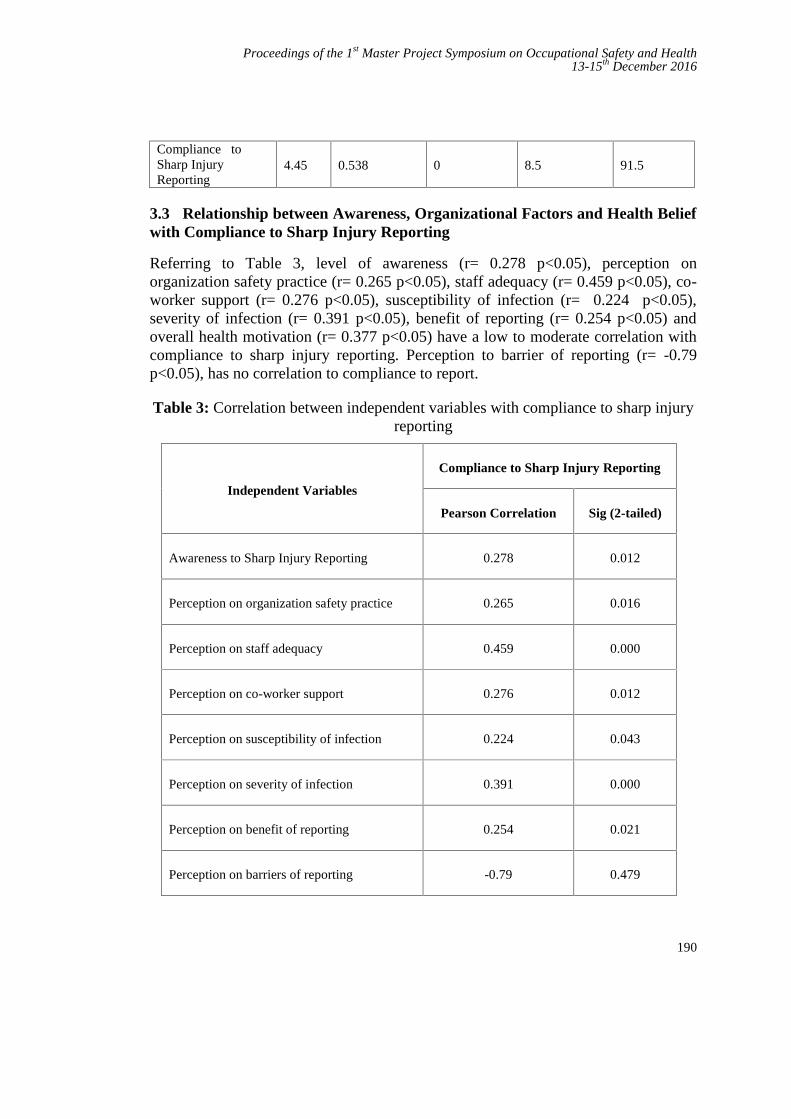
Proceedings of the 1st Master Project Symposium on Occupational Safety and Health13-15th December 2016
190
Compliance toSharp InjuryReporting
4.45 0.538 0 8.5 91.5
3.3 Relationship between Awareness, Organizational Factors and Health Beliefwith Compliance to Sharp Injury Reporting
Referring to Table 3, level of awareness (r= 0.278 p<0.05), perception onorganization safety practice (r= 0.265 p<0.05), staff adequacy (r= 0.459 p<0.05), co-worker support (r= 0.276 p<0.05), susceptibility of infection (r= 0.224 p<0.05),severity of infection (r= 0.391 p<0.05), benefit of reporting (r= 0.254 p<0.05) andoverall health motivation (r= 0.377 p<0.05) have a low to moderate correlation withcompliance to sharp injury reporting. Perception to barrier of reporting (r= -0.79p<0.05), has no correlation to compliance to report.
Table 3: Correlation between independent variables with compliance to sharp injuryreporting
Independent Variables
Compliance to Sharp Injury Reporting
Pearson Correlation Sig (2-tailed)
Awareness to Sharp Injury Reporting 0.278 0.012
Perception on organization safety practice 0.265 0.016
Perception on staff adequacy 0.459 0.000
Perception on co-worker support 0.276 0.012
Perception on susceptibility of infection 0.224 0.043
Perception on severity of infection 0.391 0.000
Perception on benefit of reporting 0.254 0.021
Perception on barriers of reporting -0.79 0.479
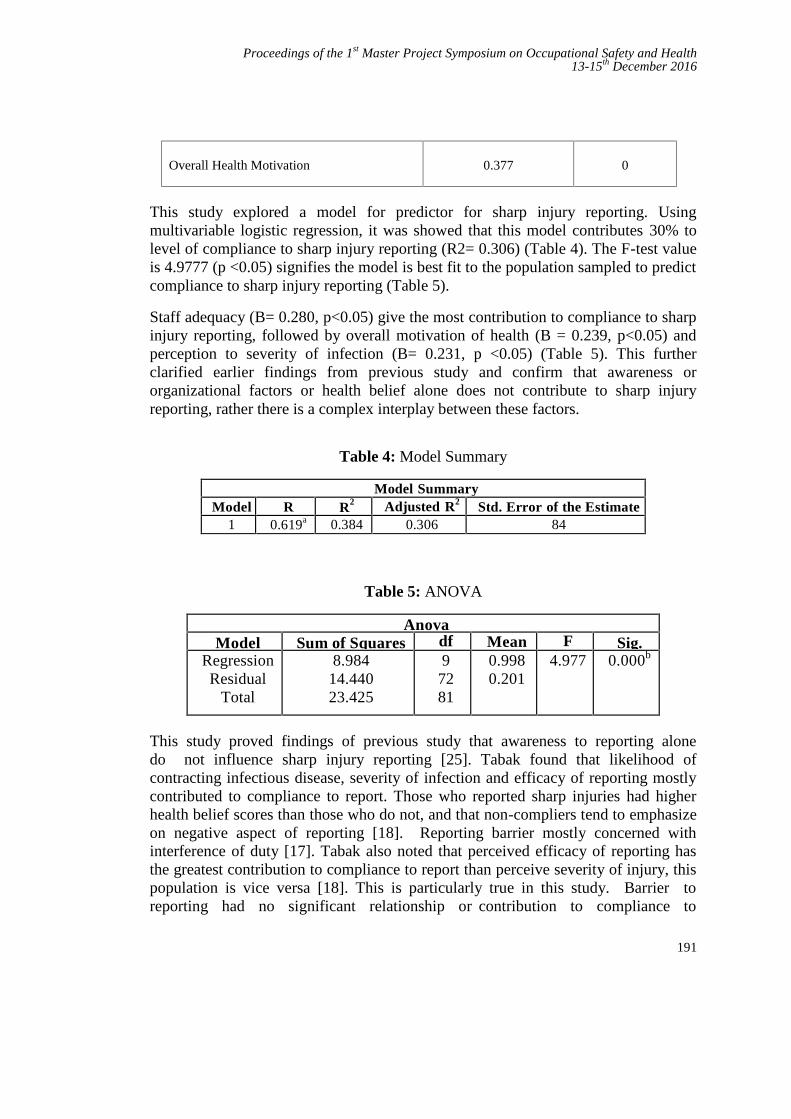
Proceedings of the 1st Master Project Symposium on Occupational Safety and Health13-15th December 2016
191
Overall Health Motivation 0.377 0
This study explored a model for predictor for sharp injury reporting. Usingmultivariable logistic regression, it was showed that this model contributes 30% tolevel of compliance to sharp injury reporting (R2= 0.306) (Table 4). The F-test valueis 4.9777 (p <0.05) signifies the model is best fit to the population sampled to predictcompliance to sharp injury reporting (Table 5).
Staff adequacy (B= 0.280, p<0.05) give the most contribution to compliance to sharpinjury reporting, followed by overall motivation of health (B = 0.239, p<0.05) andperception to severity of infection (B= 0.231, p <0.05) (Table 5). This furtherclarified earlier findings from previous study and confirm that awareness ororganizational factors or health belief alone does not contribute to sharp injuryreporting, rather there is a complex interplay between these factors.
Table 4: Model Summary
Model SummaryModel R R2 Adjusted R2 Std. Error of the Estimate
1 0.619a 0.384 0.306 84
Table 5: ANOVA
AnovaModel Sum of Squares df Mean
SquareF Sig.
RegressionResidual
Total
8.98414.44023.425
97281
0.9980.201
4.977 0.000b
This study proved findings of previous study that awareness to reporting alonedo not influence sharp injury reporting [25]. Tabak found that likelihood ofcontracting infectious disease, severity of infection and efficacy of reporting mostlycontributed to compliance to report. Those who reported sharp injuries had higherhealth belief scores than those who do not, and that non-compliers tend to emphasizeon negative aspect of reporting [18]. Reporting barrier mostly concerned withinterference of duty [17]. Tabak also noted that perceived efficacy of reporting hasthe greatest contribution to compliance to report than perceive severity of injury, thispopulation is vice versa [18]. This is particularly true in this study. Barrier toreporting had no significant relationship or contribution to compliance to
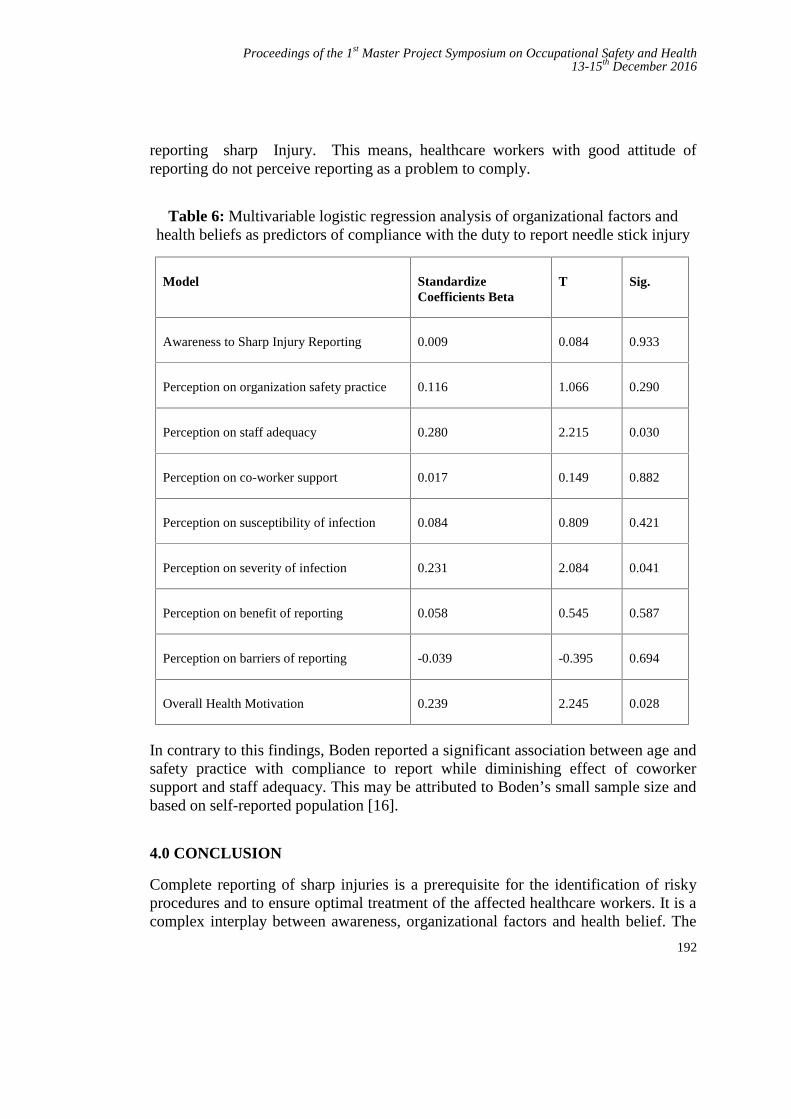
Proceedings of the 1st Master Project Symposium on Occupational Safety and Health13-15th December 2016
192
reporting sharp Injury. This means, healthcare workers with good attitude ofreporting do not perceive reporting as a problem to comply.
Table 6: Multivariable logistic regression analysis of organizational factors andhealth beliefs as predictors of compliance with the duty to report needle stick injury
Model StandardizeCoefficients Beta
T Sig.
Awareness to Sharp Injury Reporting 0.009 0.084 0.933
Perception on organization safety practice 0.116 1.066 0.290
Perception on staff adequacy 0.280 2.215 0.030
Perception on co-worker support 0.017 0.149 0.882
Perception on susceptibility of infection 0.084 0.809 0.421
Perception on severity of infection 0.231 2.084 0.041
Perception on benefit of reporting 0.058 0.545 0.587
Perception on barriers of reporting -0.039 -0.395 0.694
Overall Health Motivation 0.239 2.245 0.028
In contrary to this findings, Boden reported a significant association between age andsafety practice with compliance to report while diminishing effect of coworkersupport and staff adequacy. This may be attributed to Boden’s small sample size andbased on self-reported population [16].
4.0 CONCLUSION
Complete reporting of sharp injuries is a prerequisite for the identification of riskyprocedures and to ensure optimal treatment of the affected healthcare workers. It is acomplex interplay between awareness, organizational factors and health belief. The
Proceedings of the 1st Master Project Symposium on Occupational Safety and Health13-15th December 2016
193
main purpose of this study is to determine the factors that influence sharp injuryreporting among healthcare workers. The research study was focusing mainlywhether level of awareness, organizational factors and health belief have direct effecton compliance to reporting. There were positive relationships between independentvariables (awareness, organizational factors and health belief) and dependent variable(compliance to reporting) based on the correlation and regression analysis. Staffadequacy, perception to severity of blood borne infection and overall healthmotivation influence sharp injury reporting in this study. Ensuring adequate staffing,strengthening safety policy and committee and educating healthcare workers onsharp injuries as occupational hazard will help to improve rate of reporting.
REFERENCES
[1] Bhardwaj A, Sivapathasundaram N, Yusof MF, Minghat AH, Swe KMM,Sinha NK, “The Prevalence of Accidental Needle Stick Injury and theirReporting among healthcare Workers in Orthopaedic Wards in GeneralHospital Melaka, Malaysia”, Malaysia Orthopaedic Journal, 2014, Vol8,No.2.
[2] Cutter, J and S. Jordan, “The systems approach to error reduction:factors influencing inoculation injury reporting in the operating theatre”. JNurs Manag, 2013. 21(8): p. 989-1000.
[3] Heiko Himmelreich, Holger F.Rabenau, Matthias Rindermann, ChristophStepahn, Markus Bickel, Ingo MArzi, Sabine Wicker, “The Management ofNeedlestick Injuries”, Deutsches Arzteblatt International 2013; 110 (5): 61-7.
[4] Monica Galizzi, Petra Miesma, Laura Punnet, Craig Slatin, “InjuredWorkers Underreporting In Healthcare Industry: An Analysis UsingQuantitative, Qualitative and Observational Data”, Industrial Relations 49,No.1, 2010.
[5] Mohammad Tahir Yousafzai, Amna Rehana Siddiqui, Naveed Zafar Janjua,“Health Belief Model to Predict Sharps Injuries Among Health CareWorkers at First Level Care Facilities in Rural Pakistan”, American Journalof Industrial Medicine, 2014.
[6] K Vaz, D McGrowder, R Alexander-Lindo, L Gordon, P Brown, RIrving, “Knowledge, Awareness and Compliance with Universal Precautionsamong Health Care Workers at the University Hospital of the West Indies,Jamaica”, The International Journal of Occupation and EnvironmentalMedicine, Vol 1 No.4 October (2010).
[7] Elisabetta Rapiti, Annette Priuss-Ustun, Yvan Hutin,, “Sharp Injuries;Assessing the Burden of Disease From Sharp Injuries To HealthcareWorkers at National and Local Levels”, World Health OrganizationProtection of Human Environment Geneva 2005.
Proceedings of the 1st Master Project Symposium on Occupational Safety and Health13-15th December 2016
194
[8] Tahira M. Probst, Claudio Barbaranelli and Laura Petitta, “The Relationshipbetween Job Insecurity and Accident Underreporting: A test in TwoCountries”, Work & Stress 2013, Vol.27, No. 4, 383-402.http://dx.doi.org/10.1080/-2678373.2013.850756.
[9] Y Pfeiffer, T Manser, T Wehner, “Conceptualising barriers to incidentreporting: a psychological framework”, Qual Saf Health Caredoi:10.1136/qshc.2008.030445
[10] Tahira M. Probst, “Organizational Safety Climate and SupervisorSafety Enforcement: Multilevel Explorations of the Causes of AccidentUnderreporting”, Journal of Applied Psychology 2015, Vol 100, No. 6, 1899-1907.
[11] Derek R. Smith, Mutsuko Mihashi, Yukimi Shouyama, Fusayo Mouri,Nuriko Ishibashi, Tatsuya Ishitake, “Organizational Safety Climate and ItsRelationship with needlestick and Sharp Injuries among Japanese Nurses”,American Journal of Infection Control, September 2009, doi:10.1016/j.ajic.2008.11.004
[12] Glenn Pransky, Terry Snyder, Allard Dembe, Jay Himmelstein,1999,”Under- reporting of Work Related Disorders in The Workplace: ACase Study and Review of the Literature”, Ergonomics, 1999, Vol 42, no. 1,171- 182
[13] Lenore S. Azaroff, Charles Levenstein, David H. Wegman, “OccupationalInjury and Illness Surveillance: Conceptual Filters Explain Underreporting”,American Journal of Public Health, September 2002, Vol 92, No 9.
[14] Sean Tucker, Dayla Diekrager, Nuck Tuner, E. Kevin Kellaway, “WorkRelated Injury Reporting Among Young Workers: Prevalence, GenderDifferences and Explanation For Underreporting”, Journal of Safety Research50 (2014): 67-73.
[15] Tahira M. Probst, Maja Graso, “Pressure to Produce = Pressure to ReduceAccident Reporting”, Accident Analysis & Prevention, Volume 59, October2013, Pages 580-587.
[16] Boden LI, Petrofsky YV, Karen Hopcia, Gregory R. Wagner,Dean Hashimoto, “Understanding the Hospital Sharps Injury ReportingPathway”, American Journal of Industrial Medicine 58:282-289 (2015)
[17] Sharon Osborne, “Perceptions that Influence Occupational ExposureReporting”, AORN Journal, 2003. 78(2): p. 262-272.
[18] Tabak, N., A.M. Shiaabana, and S. Shasha, “The health beliefs of hospitalstaff and the reporting of needlestick injury”. J Clin Nurs, 2006. 15(10): p.1228-39
[19] Abdullah Aliff AW, Azhar MS, Zulraini J, Farhana Adila S, “OccupationalSharp Injury among Healthcare Workers in Hospital Melaka 2013 - 2015:ADescriptive Study”, Malaysian Journal of Public Health Medicine, Vol. 16(Suppl 4) 2016, 8th National Public Health Conference 2016, ManagingSociety in Combating Public Health Challenges, 2-4 August 2016, pg43.
Proceedings of the 1st Master Project Symposium on Occupational Safety and Health13-15th December 2016
195
[20] Aiken LH1, Patrician PA,“Measuring organizational traits of hospitals: theRevised Nursing Work Index”, Nurs Res. 2000 May-Jun;49(3):146-53.
[21] Kah Lee and Noor Hassim, 2005, “Implication of the Prevalence ofneedlestick Injuries in a General Hospital in Malaysia and Its Risk in ClinicalPractice”, Environmental Health and Preventive Medicne 10, 33-41, January2005.
[22] Ng and Noor Hassim, “Needlestick Injury among Medical Personnel inAccident and Emergency Department of Two Teaching Hospitals”, MedicalJournal Malaysia, Vol 62 No 1, March 2007.
[23] Hassan Kasim Haridi, Abdalmohsen Saud Al-Ammar, Moazzy Ibraheim Al-Mansour, 2016, “Compliance with infection control standard precautionsguidelines: a survey among dental healthcare workers in Hail Region,Saudi Arabia”, Journal of Infection Prevention April 27, 20161757177416645344, doi: 10.1177/1757177416645344.
[24] Santhna L.P, and Samsiah M, and Raja Lexshimi RG, and Ho S.E, andRoshdinom R, and Hamidah H, “Sharps injury in Hospital UniversitiKebangsaan Malaysia (HUKM): Experiences of health care workers andstudents”. Medicine & Health, 2 (1). pp. 86-92. ISSN1823-2140
[25] Hui-Ling Kerr, Nicola Stewart, Alistair Pace, Sherief Elsayed, ”Sharps injuryreporting amongst surgeons”, Ann R Coll Surg Engl 2009; 91: 430–432 doi10.1308/003588409X432194
[26] Muhammad Hanafiah Juni, Amir Aiman, Asma Nabilah, Ng J.H., Wong S.J,Faisal Ibrahim, “Perception Regarding Needle Stick and Sharp Injuriesamong Clinical Year Medical Students”, International Journal of PublicHealth and Clinical Sciences e-ISSN: 2289-7577. Vol. 2: No.1January/February 2015
[27] Kavitha Nagandla, Krishna Kumar, Amit Bhardwaj, Devalagan a/lMuthalagan, Chan Yhmin, Lee Wei Lun, Weng Wei Shi, Nurul Izzati B. AbdRazak, “Prevalence Of Needle Stick Injuries And Their UnderreportingAmong Healthcare Workers In The Department Of Obstetrics AndGynecology”. International Archives of Medicine, 2015, Vol.8 No.181, doi:10.3823/1780.
Proceedings of the 1st Master Project Symposium on Occupational Safety and Health13-15th December 2016
196
Work-Related Low Back Pain among MaintenanceTechnician of Fighter Jet
Nur Izzaidah Ghazalia and Roslina Mohammadb
UTM Razak School of Engineering and Advanced Technology, Universiti TeknologiMalaysia, 54100 Jalan Sultan Yahya Petra, Kuala Lumpur, Malaysia.
[email protected], [email protected]
Abstract - In Malaysia, the Royal Malaysia Air Force (RMAF) is responsible foroperating all jet fighters. It is maintained by the RMAF itself with the collaboration from acompany called MRO such as Aerospace Technology System Corporation Sdn Bhd (ATSC).The safety of a fighter jet is under the care of aircraft maintenance technicians, where theyneed to handle different kind of components. The aim of this study was to identify thefrequency of WRLBP and analyze the risk factors that contribute to WRLBP as well asdevelop a control measures towards reducing the risk factor among maintenance technicians.Eighty technicians were evaluated using modified Nordic Musculoskeletal Questionnaires(NMQ), modified Dutch Musculoskeletal Questionnaire (DMQ) and Social DemographicQuestionnaire (SDQ) and control measures questionnaire. Results of NMQ indicate thelower back as the most affected body region during 12 month with 58.8%. The mostaggravating related factors: awkward posture, lifting and forceful movement, heavy physicalwork and years of working. Getting someone to help when handle a heavy task/ component,system of work rotation and modify procedure of work task were the top three controlmeasures and should be considered for implementation.
Keywords: Work-related low back pain, Maintenance technician, Control measure, Physical riskfactor, Personal risk factor, Ergonomic.
1.0 INTRODUCTION
A fighter aircraft is a military aircraft designed primarily for air-to-air combat againstother aircraft, [1] which the main mission is to attack ground target, as opposed tobombers and attack aircraft. The speed, manoeuvrability, and its small size relative toother combat aircraft are the hallmark of a fighter. The main job of these personnel isto ensure the pilots are flying safely. Thousands of planes, jets and helicopters areflown all over the world every day, and the aircraft maintenance personnel areresponsible of the aircrafts’ safety and performance. Their demanding job, whichinvolved heavy physical work; lifting and forceful movement; awkward posture;repetition and static work posture; and many more in a long run can affect theirhealth and exposed them to WRLBP.
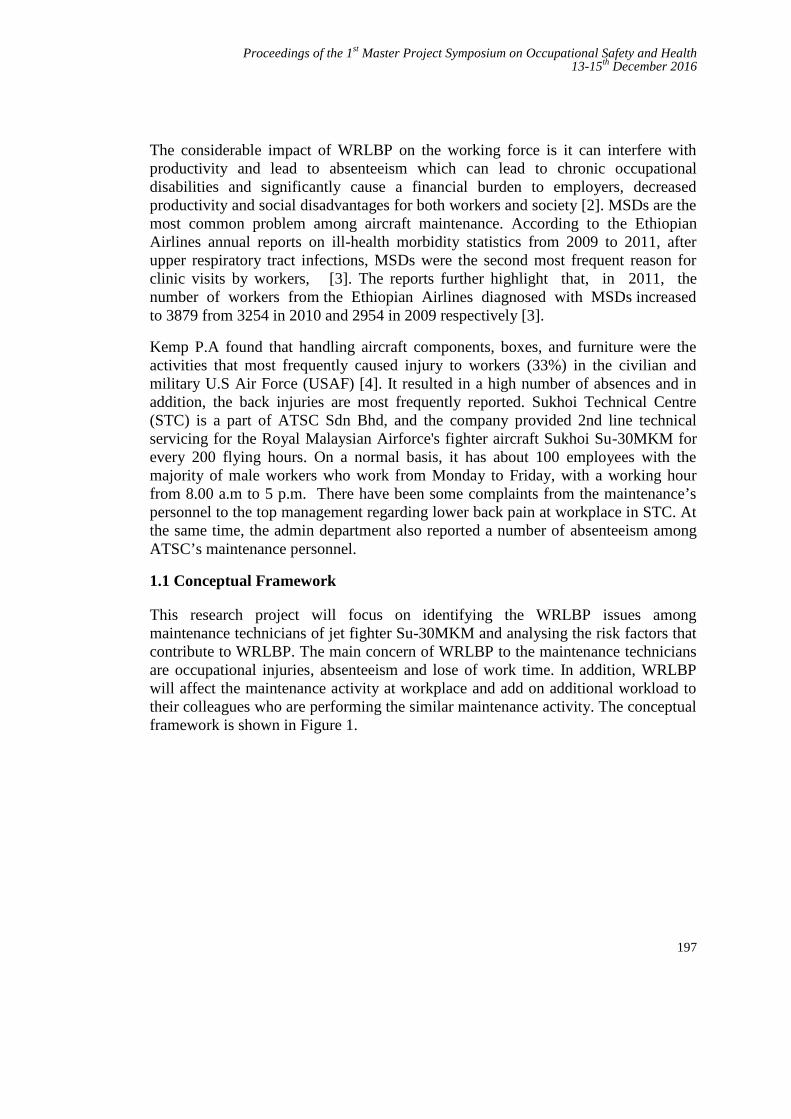
Proceedings of the 1st Master Project Symposium on Occupational Safety and Health13-15th December 2016
197
The considerable impact of WRLBP on the working force is it can interfere withproductivity and lead to absenteeism which can lead to chronic occupationaldisabilities and significantly cause a financial burden to employers, decreasedproductivity and social disadvantages for both workers and society [2]. MSDs are themost common problem among aircraft maintenance. According to the EthiopianAirlines annual reports on ill-health morbidity statistics from 2009 to 2011, afterupper respiratory tract infections, MSDs were the second most frequent reason forclinic visits by workers, [3]. The reports further highlight that, in 2011, thenumber of workers from the Ethiopian Airlines diagnosed with MSDs increasedto 3879 from 3254 in 2010 and 2954 in 2009 respectively [3].
Kemp P.A found that handling aircraft components, boxes, and furniture were theactivities that most frequently caused injury to workers (33%) in the civilian andmilitary U.S Air Force (USAF) [4]. It resulted in a high number of absences and inaddition, the back injuries are most frequently reported. Sukhoi Technical Centre(STC) is a part of ATSC Sdn Bhd, and the company provided 2nd line technicalservicing for the Royal Malaysian Airforce's fighter aircraft Sukhoi Su-30MKM forevery 200 flying hours. On a normal basis, it has about 100 employees with themajority of male workers who work from Monday to Friday, with a working hourfrom 8.00 a.m to 5 p.m. There have been some complaints from the maintenance’spersonnel to the top management regarding lower back pain at workplace in STC. Atthe same time, the admin department also reported a number of absenteeism amongATSC’s maintenance personnel.
1.1 Conceptual Framework
This research project will focus on identifying the WRLBP issues amongmaintenance technicians of jet fighter Su-30MKM and analysing the risk factors thatcontribute to WRLBP. The main concern of WRLBP to the maintenance techniciansare occupational injuries, absenteeism and lose of work time. In addition, WRLBPwill affect the maintenance activity at workplace and add on additional workload totheir colleagues who are performing the similar maintenance activity. The conceptualframework is shown in Figure 1.
Proceedings of the 1st Master Project Symposium on Occupational Safety and Health13-15th December 2016
198
Figure 1 : Conceptual Framework
2.0 METHODOLOGY
2.1 Subjects
A questionnaire based was carried out among ATSC maintenance personnel in GongKedak Airbase. Subjects eligibility criteria were as follows: worked no less than 12months, still actively performing maintenance activity and never had an accidentinvolving low back region. All subjects who met the eligibility criteria were selected.
2.2 Questionnaire
In this study, the data were obtained with questionnaire based on modified NordicMusculoskeletal Questionnaires (NMQ), modified Dutch MusculoskeletalQuestionnaire (DMQ), Social Demographic Questionnaire (SDQ) and controlmeasure towards reducing WRLBP and the actual situation of aircraft maintenancetechnician task.
A five section questionnaire was employed as a survey instrument. Section A areDemographics Questionnaire (SDQ), which covered question of age, gender, level ofeducation, numbers of working experience as maintenance personnel , numbers ofhours worked per day and how many days a week they worked. This section isdesigned to give information on the background of the respondent and their job. Thisinformation is important in order to know the respondent better.
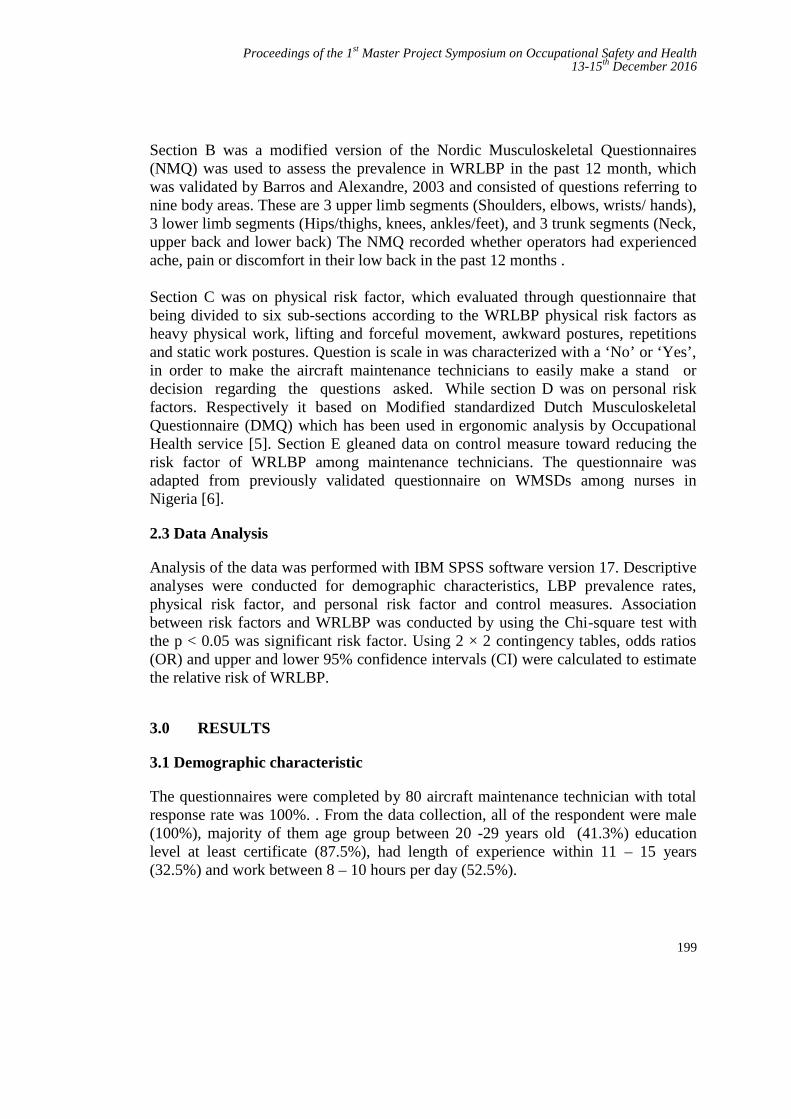
Proceedings of the 1st Master Project Symposium on Occupational Safety and Health13-15th December 2016
199
Section B was a modified version of the Nordic Musculoskeletal Questionnaires(NMQ) was used to assess the prevalence in WRLBP in the past 12 month, whichwas validated by Barros and Alexandre, 2003 and consisted of questions referring tonine body areas. These are 3 upper limb segments (Shoulders, elbows, wrists/ hands),3 lower limb segments (Hips/thighs, knees, ankles/feet), and 3 trunk segments (Neck,upper back and lower back) The NMQ recorded whether operators had experiencedache, pain or discomfort in their low back in the past 12 months .
Section C was on physical risk factor, which evaluated through questionnaire thatbeing divided to six sub-sections according to the WRLBP physical risk factors asheavy physical work, lifting and forceful movement, awkward postures, repetitionsand static work postures. Question is scale in was characterized with a ‘No’ or ‘Yes’,in order to make the aircraft maintenance technicians to easily make a stand ordecision regarding the questions asked. While section D was on personal riskfactors. Respectively it based on Modified standardized Dutch MusculoskeletalQuestionnaire (DMQ) which has been used in ergonomic analysis by OccupationalHealth service [5]. Section E gleaned data on control measure toward reducing therisk factor of WRLBP among maintenance technicians. The questionnaire wasadapted from previously validated questionnaire on WMSDs among nurses inNigeria [6].
2.3 Data Analysis
Analysis of the data was performed with IBM SPSS software version 17. Descriptiveanalyses were conducted for demographic characteristics, LBP prevalence rates,physical risk factor, and personal risk factor and control measures. Associationbetween risk factors and WRLBP was conducted by using the Chi-square test withthe p < 0.05 was significant risk factor. Using 2 × 2 contingency tables, odds ratios(OR) and upper and lower 95% confidence intervals (CI) were calculated to estimatethe relative risk of WRLBP.
3.0 RESULTS
3.1 Demographic characteristic
The questionnaires were completed by 80 aircraft maintenance technician with totalresponse rate was 100%. . From the data collection, all of the respondent were male(100%), majority of them age group between 20 -29 years old (41.3%) educationlevel at least certificate (87.5%), had length of experience within 11 – 15 years(32.5%) and work between 8 – 10 hours per day (52.5%).

Proceedings of the 1st Master Project Symposium on Occupational Safety and Health13-15th December 2016
200
Table 1: Descriptive information of respondents
Information Variables Percentage (%)Gender Male 100.0
Age 20-29 years old 41.330-39 years old 30.040-49 years old 21.350-59 years old 7.5
Level of education Certificate 87.5Diploma 11.3Degree 1.3
Years of working 1-5 years 21.36-10 years 28.811-15 years 32.5
Over 15 years 17.5Hours of working 5-8 hours 42.5
8-10 hours 52.510 hours and above 5.0
Table 2: Body part survey symptom
Body Region Frequency Percentage (%)Low back 47 58.8Shoulder 34 42.5Neck 30 37.5Upper back 30 37.5Knees 24 30.0Feet 21 26.3Hips/Tights 20 25.0Elbow 19 23.8Wrists/hands 17 21.3
3.2 Prevalence of WRLBP
According to questionnaire that being distribute to 80 aircraft maintenance personnel, theprevalence of Work-Related LBP during last 12 month was 59% (47/80) as shown in table2.
3.3 Physical risk factor
Table 3 showed the association of physical risk factor with WRLBP problem. . For physical
Proceedings of the 1st Master Project Symposium on Occupational Safety and Health13-15th December 2016
201
risk factor there is evidence to awkward posture (daily work required you to mildforward bending (>20°) (OR = 3.17, 95% CI1.13-8.90, P < 0.05) and kneeling whileperforming task (OR = 3.17, 95% CI1.13-8.90, P <0.05)); lifting and forceful movement(heavy components lifted without the assistance of a mechanical device (OR = 0.32, 95%CI0.12-0.88, P < 0.05) and pulling rather than pushing routinely used to move an object(OR = 0.23, 95% CI0.09-0.59, P < 0.05)) and heavy physical work (the tools sizeis not comfortable to hold/use (OR = 0.28, 95% CI0.11-0.75, P < 0.05)) towards WRLBPproblem.
Table 3: Physical risk factor or WRLBP among maintenance technicians
No Risk Factor No ofpersonnel
OR (95%CI)
p-value
HEAVY PHYSICAL WORK
1 Does the tools weight is too heavy?
No 22 10.698Yes 25 0.84 0.34-2.05
2 Does the tools size is not comfortable to hold/use?
No 25 10.010Yes 22 0.28 0.11-0.75
3 Are heavy components carried manually for a long distance?
No 26 10.638Yes 21 1.24 0.50-3.07
4 Does the weight of power tools create additional force?
No 28 10.075Yes 19 0.44 0.18-1.10
5Does extra usages of force are required in completing the task/work?
No 9 10.584Yes 38 1.35 0.46-3.97
LIFTING AND FORCEFUL MOVEMENT
6Are very heavy components lifted without the assistance of a mechanical device?
No 38 10.024Yes 9 0.32 0.12-0.88
7Is pulling rather than pushing routinely used to move an object?
No 36 10.020Yes 11 0.23 0.09-0.59
8Does the working condition involve lifting/lowering activities?
No 8 10.161Yes 39 2.12 0.73-6.14
9Does the working condition involve pushing/pulling activities?
No 7 10.292Yes 40 1.83 0.59-5.67
AWKWARD POSTURES
10Does your daily work required you to mild forward bending (>20°)?
No 8 1

Proceedings of the 1st Master Project Symposium on Occupational Safety and Health13-15th December 2016
202
No Risk Factor No ofpersonnel
OR (95%CI)
p-value
Yes 39 3.17 (1.13-8.90) 0.025
11Does your daily work required you to severe forward bending (>45°)?
No 16 10.463Yes 31 0.83 (0.44-2.81)
12Does your daily work required you to backward bending (>20°)?
No 28 10.858Yes 19 0.92 (0.37-2.27)
AWKWARD POSTURES
13 Does your daily work required you to twisting or lateral bending (>20°)?
No 14 10.151Yes 33 1.96 (0.78-4.97)
14 Does the job required perform task that involves long reaches with arms above shoulder height?
No 10 10.359Yes 37 1.61 (0.58-4.46)
15 Working surfaces is too high/ low
No 12 10.862Yes 35 1.09 (0.40-3.00)
16 Does the task require kneeling while performing it?
No 8 10.025Yes 39 3.17 (1.13-8.90)
17 Does the task require squatting while performing it?
No 11 10.071Yes 36 2.41 (0.92-6.33)
REPETITION
18 Does the job require doing the same motion over and over again?
No 8 10.091Yes 39 2.44 (0.85-6.97)
19 Do aircraft personnel perform motions constantly without short pause or break in between task?
No 34 10.586Yes 13 0.77 (0.29-2.01)
STATIC WORK POSTURES
20 Do routine task involve sitting for a long time?
No 25 10.510Yes 22 1.35 (0.55-3.34)
21 Do routine task involve standing for a long time?
No 17 1
Yes 30 1.47 (0.59-3.64)
22 Are routine task done without change the position of the work style?
No 27 10.405Yes 20 1.48 (0.59-3.74)
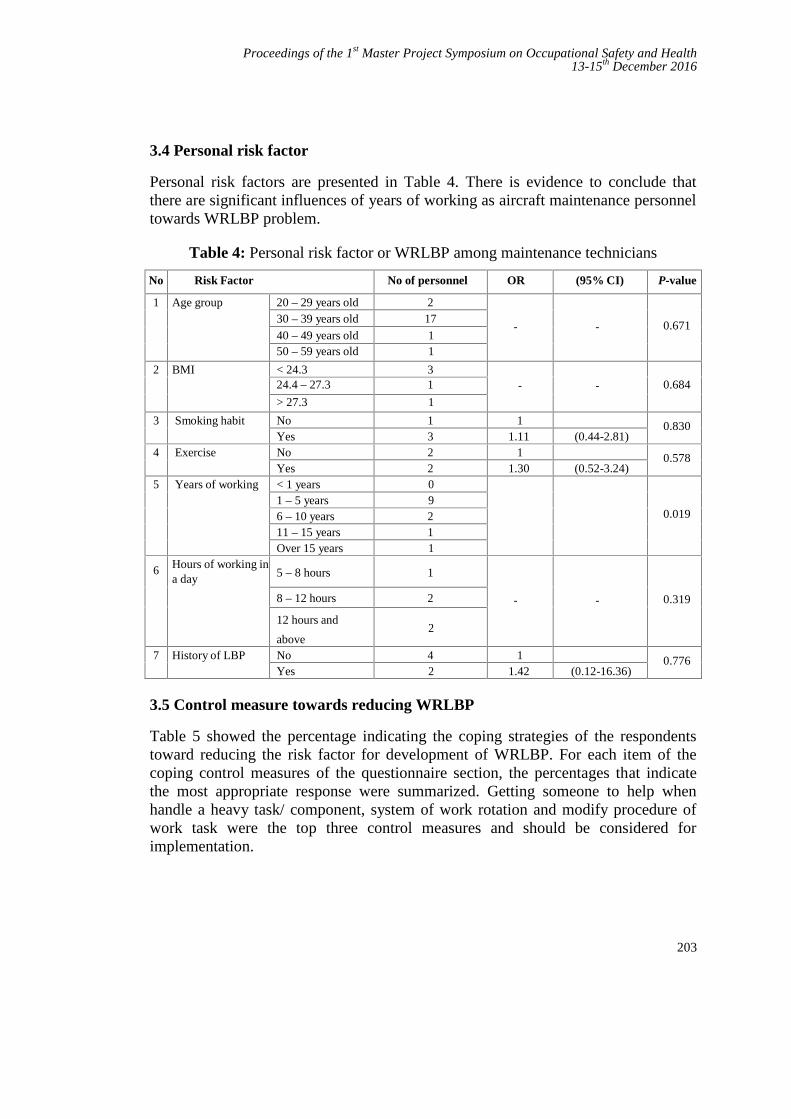
Proceedings of the 1st Master Project Symposium on Occupational Safety and Health13-15th December 2016
203
3.4 Personal risk factor
Personal risk factors are presented in Table 4. There is evidence to conclude thatthere are significant influences of years of working as aircraft maintenance personneltowards WRLBP problem.
Table 4: Personal risk factor or WRLBP among maintenance technicians
No Risk Factor No of personnel OR (95% CI) P-value
1 Age group 20 – 29 years old 28
- - 0.67130 – 39 years old 17
40 – 49 years old 150 – 59 years old 1
2 BMI < 24.3 31 - - 0.68424.4 – 27.3 15> 27.3 1
3 Smoking habit No 16
1 0.830Yes 3
11.11 (0.44-2.81)
4 Exercise No 27
1 0.578Yes 2
01.30 (0.52-3.24)
5 Years of working < 1 years 0
0.0191 – 5 years 96 – 10 years 2
111 – 15 years 16Over 15 years 1
6 Hours of working ina day 5 – 8 hours 1
- - 0.3198 – 12 hours 28
12 hours and
above2
7 History of LBP No 45
1 0.776Yes 2 1.42 (0.12-16.36)
3.5 Control measure towards reducing WRLBP
Table 5 showed the percentage indicating the coping strategies of the respondentstoward reducing the risk factor for development of WRLBP. For each item of thecoping control measures of the questionnaire section, the percentages that indicatethe most appropriate response were summarized. Getting someone to help whenhandle a heavy task/ component, system of work rotation and modify procedure ofwork task were the top three control measures and should be considered forimplementation.
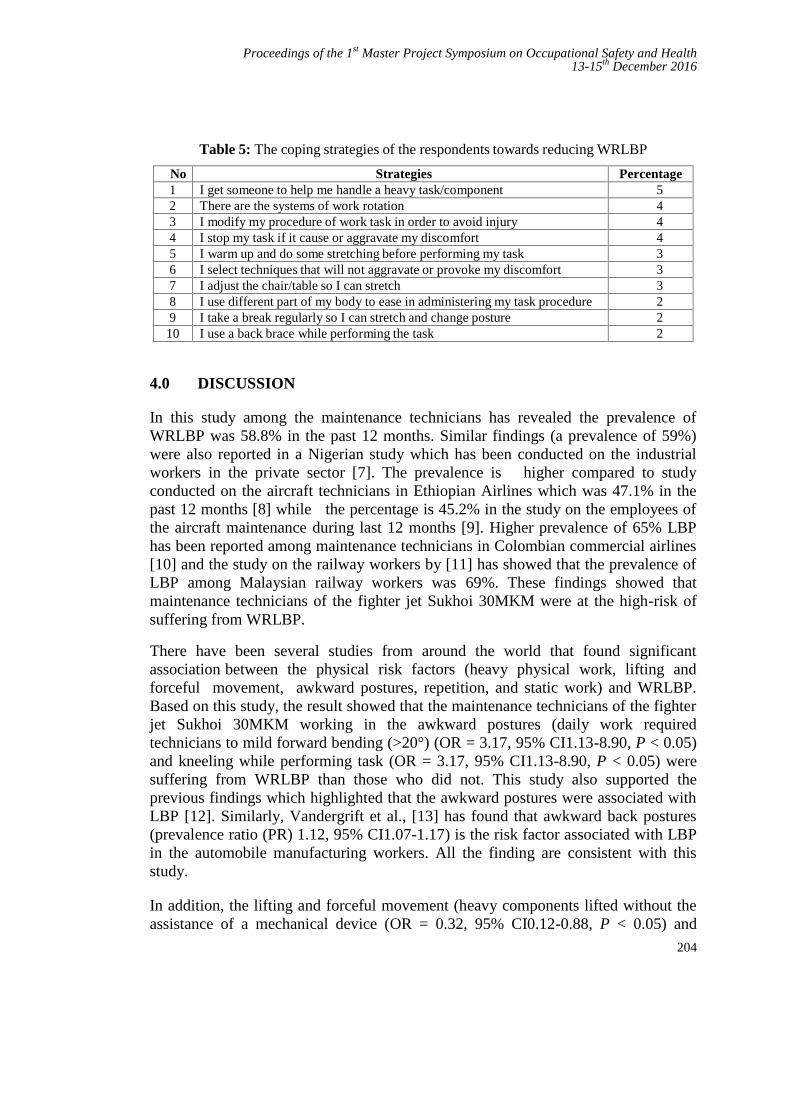
Proceedings of the 1st Master Project Symposium on Occupational Safety and Health13-15th December 2016
204
Table 5: The coping strategies of the respondents towards reducing WRLBP
No Strategies Percentage1 I get someone to help me handle a heavy task/component 5
3.8
2 There are the systems of work rotation 47.5
3 I modify my procedure of work task in order to avoid injury 45.0
4 I stop my task if it cause or aggravate my discomfort 40.0
5 I warm up and do some stretching before performing my task 33.8
6 I select techniques that will not aggravate or provoke my discomfort 32.5
7 I adjust the chair/table so I can stretch 30.0
8 I use different part of my body to ease in administering my task procedure 28.8
9 I take a break regularly so I can stretch and change posture 25.0
10 I use a back brace while performing the task 22.54.0 DISCUSSION
In this study among the maintenance technicians has revealed the prevalence ofWRLBP was 58.8% in the past 12 months. Similar findings (a prevalence of 59%)were also reported in a Nigerian study which has been conducted on the industrialworkers in the private sector [7]. The prevalence is higher compared to studyconducted on the aircraft technicians in Ethiopian Airlines which was 47.1% in thepast 12 months [8] while the percentage is 45.2% in the study on the employees ofthe aircraft maintenance during last 12 months [9]. Higher prevalence of 65% LBPhas been reported among maintenance technicians in Colombian commercial airlines[10] and the study on the railway workers by [11] has showed that the prevalence ofLBP among Malaysian railway workers was 69%. These findings showed thatmaintenance technicians of the fighter jet Sukhoi 30MKM were at the high-risk ofsuffering from WRLBP.
There have been several studies from around the world that found significantassociation between the physical risk factors (heavy physical work, lifting andforceful movement, awkward postures, repetition, and static work) and WRLBP.Based on this study, the result showed that the maintenance technicians of the fighterjet Sukhoi 30MKM working in the awkward postures (daily work requiredtechnicians to mild forward bending (>20°) (OR = 3.17, 95% CI1.13-8.90, P < 0.05)and kneeling while performing task (OR = 3.17, 95% CI1.13-8.90, P < 0.05) weresuffering from WRLBP than those who did not. This study also supported theprevious findings which highlighted that the awkward postures were associated withLBP [12]. Similarly, Vandergrift et al., [13] has found that awkward back postures(prevalence ratio (PR) 1.12, 95% CI1.07-1.17) is the risk factor associated with LBPin the automobile manufacturing workers. All the finding are consistent with thisstudy.
In addition, the lifting and forceful movement (heavy components lifted without theassistance of a mechanical device (OR = 0.32, 95% CI0.12-0.88, P < 0.05) and
Proceedings of the 1st Master Project Symposium on Occupational Safety and Health13-15th December 2016
205
pulling rather than pushing routinely used to move an object (OR = 0.23, 95%CI0.09-0.59, P < 0.05) are often associated with LBP. As reported in previous studyby (Kemp P.A,2010), the most common sources of injury among the civilian andmilitary U.S. Air Force (USAF) were lifting the aircraft components, boxes andfurniture. In similar cases, the study on the railway workers by [11] showed thatlifting and lowering heavy loads was the most important workplace risk factor tocaused LBP in Malaysian railway workers, while [8] in their study on the aircrafttechnicians in Ethiopian airlines also reported that there were statisticallysignificant associations between LBP and job activities that involved lifting a heavyobject (OR=1.90; 95% CI 1.01-3.60), pulling and pushing heavy loads (OR=3.17;95% CI 1.49-6.74) and carrying heavy loads (OR=2.02; 95% CI 1.15-3.57).Furthermore, the forced movements that include lifting and pushing can also lead toWRLBP among aircraft technicians in the aviation industry according to this study.
This study has also found an association between the heavy physical work (the toolssize is not comfortable to hold/use (OR = 0.28, 95% CI0.11-0.75, P < 0.05) andWRLBP problem. While in similar case, Baiduri Widanarko et al., [14] from theNew Zealand Electoral Roll has also concluded that respondent with heavy physicalworkloads are at higher prevalence of the body regions pain compare than those withlight physical workloads. This shown that the heavy physical works can beassociated with WRLBP. In addition, there were also significant influences of yearsof working as the aircraft maintenance personnel towards WRLBP problem in thisstudy.
The study has listed the suggestions on how to reduce the risk factors of the awkwardpostures, lifting and forceful movements and heavy physical works using thehierarchy of control. Based on the questionnaires that have been distributed to therespondents, the top three most acceptable coping strategies towards reducing therisk factor of WRLBP are by getting the assistance or support from other techniciansto handle a heavy task or component, using the systems of work rotations, and themodification of work task procedures as these factors are known to avoidstressing any injuries. However, the most important thing in order to reduce the riskfactors is the understanding of the ergonomics aspects of the work. By understandingthis aspect, the maintenance technicians can perform the task with minimum injury[15]
In future studies, it is recommended a large sample size of maintenance technicianbeing study for ensuring the generalization of the study. Secondly, this study onlyinvestigate man sample, which may not represent the association of gander withWRLBP. In addition, it is recommended to study the psychosocial and environmentalrisk factor that will establish the combination of casual association of WRLBPproblem.
Proceedings of the 1st Master Project Symposium on Occupational Safety and Health13-15th December 2016
206
5.0 CONCLUSION
It can be concluded that WRLBP appears to be a serious problem amongmaintenance technicians and become a major health concern for them. Furthermore,the study has shown that there were associations of physical risk factors forheavy physical work, lifting and forceful movements and awkward postures withWRLBP problem. However there were no correlations of physical risk factors forrepetition and static postures with WRLBP problem. In addition, the study has shownthat there was an association of personal risk factor for the years of working withWRLBP prevalence while there are no correlation of personal risk factors for age,BMI, smoking habits, exercise routine, and working hours in a day with WRLBPproblem. Lastly, this study has showed the coping control measures based on thequestionnaire answered by the respondents. Getting someone to help when handle aheavy task/ component, system of works rotation and modify procedure of worktasks were the top three control measures suggested by them. In addition, theimportant thing in order to reduce the risk factor is the understanding on theergonomics. By understanding it, maintenance technicians can perform the task withminimum injury.
REFERENCES
[1] Dictionary, M.W., Fighter —Definition and More from the Free Merriam WebsterDictionary, in Merriam Webster Dictionary. 2011: Encyclopædia Britannica.
[2] Pinder, A., et al., Work related musculoskeletal disorder: back to work report.European agency for safety and health at work. Belgium, 2012.
[3] Profile, E.A., Ethiopian Airlines Profile. 2012:http://www.ethiopianairlines.com/en/profile.
[4] Kemp, P.A., et al., Injuries to air force personnel associated with lifting, handlingand carrying object. American journal of preventive medicine, 2010. 38(1): p. 148-155.
[5] Alrowayeh, H.N., T.A. Alshatti, and S.H. Aljadi, Prevalence, characteristics, andimpacts of work- related musculoskeletal disorders: a survey among physicaltherapists in the State of Kuwait. BMC Musculoskeletal Disorders, 2010. 11(116).
[6] Tinubu, B.M., et al., Work-related musculoskeletal disorders among nurses inIbadan, South-west Nigeria: a cross-sectional survey. BMC MusculoskeletalDisorders, 2010. 11: p. 12-20.
[7] Sanya, A. and O. Ogwumike, Low back pain prevalence amongst industrial workersin the private sector in Oyo State, Nigeria. Afr J Med Med Sci., 2005. 3: p. 245-249.
[8] Zungu, L.I.a.N., E.S, A comparative study of the prevalence and risk factors of lowerback pain among aircraft technicians in Ethiopian Airlines. Occupational HealthSouthern Africa, 2015. 21(2).
[9] Nogueira, H.C., et al., Musculoskeletal disorder and psychosocial risk factor amongworkers of aircrraft maintenance industry. Research gate, 2013. Work 41: p. 4801-4807.
Proceedings of the 1st Master Project Symposium on Occupational Safety and Health13-15th December 2016
207
[10] Fajardo, R., et al., Characterization of Low Back Pain in Pilots and MaintenanceTechnicians on a Commercial Airline. Aerospace Medicine and Human Performance,2016. 87(9): p. 795-799(5).
[11] Ganasegeran, K., et al., Psycho-behavioural risks of low back pain in railwayworkers.Occupational Medicine, 2014. 64: p. 372-375.
[12] McGaha, J., et al., Exploring physical exposures and identifying high-risk work taskswithin the floor layer trade. Appl Ergon. 2014 Jul, 2014. 45(4): p. 857-864.
[13] Vandergrift, J., et al., Physical and psychosocial ergonomic risk factors for low backpain in automobile manufacturing workers. Occupy EnvironMed, 2011. 63: p. 45-52.
[14] Baiduri Widanarko, et al., Prevalence of musculoskeletal symptoms in relation togender, age, and occupational/industrial group. International Journal of IndustrialErgonomics, 2011. 41(5): p.561-572.
[15] Baird, M.Z., MANAGING ERGONOMICS RISK FACTORS ON CONSTRUCTIONSITES in Faculty of Civil Engineering. 2007, Universiti Teknologi Malaysia.
Proceedings of the 1st Master Project Symposium on Occupational Safety and Health13-15th December 2016
208
The Influences of Safety Behaviour andSafety Practice at Klang Valley Construction
SiteRaudhah Bt Haji Bahrina and Hayati Habibah Abdul Talibb
UTM Razak School of Engineering and Advanced Technology,Universiti Teknologi Malaysia, 54100 Jalan Sultan Yahya Petra, Kuala Lumpur,
[email protected], [email protected]
Abstract - Construction industry is known as one of the most hazardous activities.The accident rate is very high when compared to other industries. The accidentsoccur are due to management and workers who lack safety awareness, cut corners towork and perform unsafe behaviour at work. In addition, most of constructionworkers are lack on a proper or formal education thus, they have not receivedproper safety training and trade skill training in the construction field. This study isconducted to investigate the influence of safety behaviour and safety practice atconstruction site. The data collection is gain from questionnaires which is wasdistributed to construction site workers. The above study was carried out bychoosing randomly workers in construction site around Klang Valley area. In thepresent study, questionnaire survey was carried out in these any project site areasusing a standard checklist and a detailed developed questionnaire. The questionnairecomprised the general information with 31 safety behaviour statements on a 1-4Likert scale which was distributed to 100 construction workers. The findings of thepresent study revealed invaluable indications to the construction workers especiallyin improving the attitude towards safety, health and environment and hence goodsafety behaviour in the construction site.
Keywords: Construction, Safety, Site, Behaviour, Attitude
1.0 INTRODUCTION
Malaysian construction industry recorded a GDP growth of 1.6% in the fourthquarter of 2008 and continued to improve as it achieved a positive growth of 0.6% inthe first quarter of 2009 (CIDB, 2010). Although this industry has contributedsignificantly to Malaysian’s economy, this does not mean Malaysia can settle downcomfortably. Often known as “dirty”, “dangerous” and “difficult”, this industry hasbeen plagued by a high number of fatality rates on construction sites. Construction
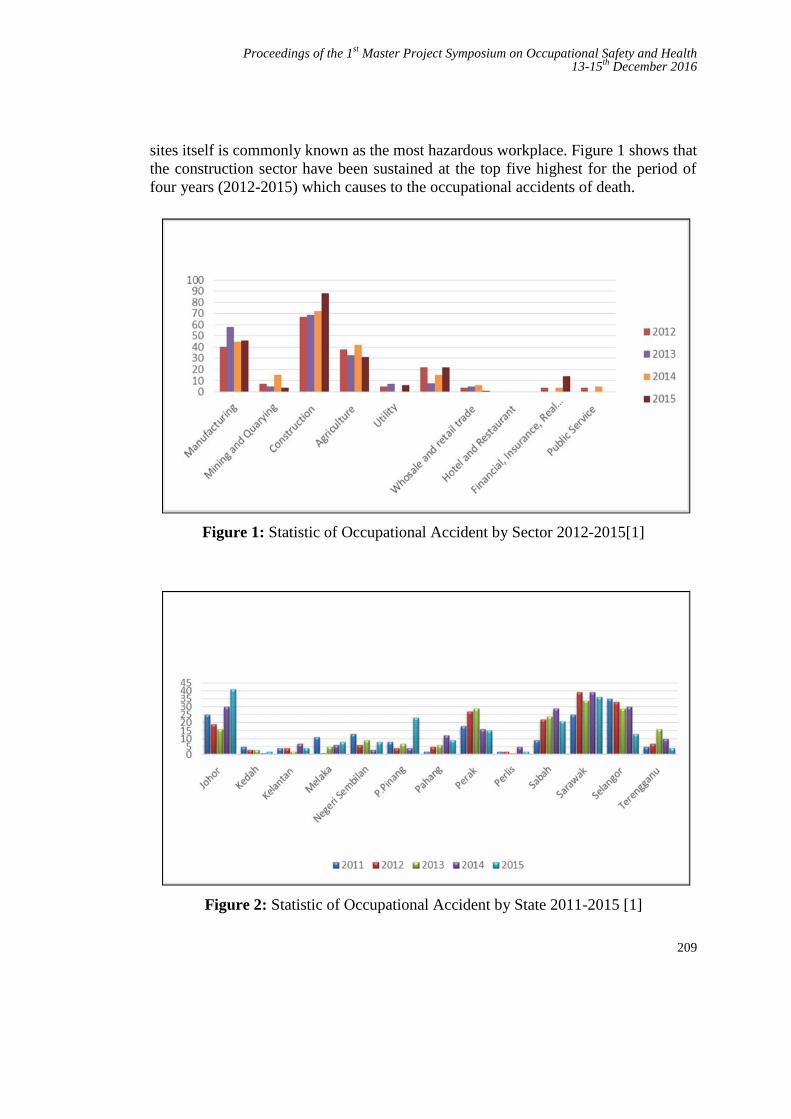
Proceedings of the 1st Master Project Symposium on Occupational Safety and Health13-15th December 2016
209
sites itself is commonly known as the most hazardous workplace. Figure 1 shows thatthe construction sector have been sustained at the top five highest for the period offour years (2012-2015) which causes to the occupational accidents of death.
Figure 1: Statistic of Occupational Accident by Sector 2012-2015[1]
Figure 2: Statistic of Occupational Accident by State 2011-2015 [1]
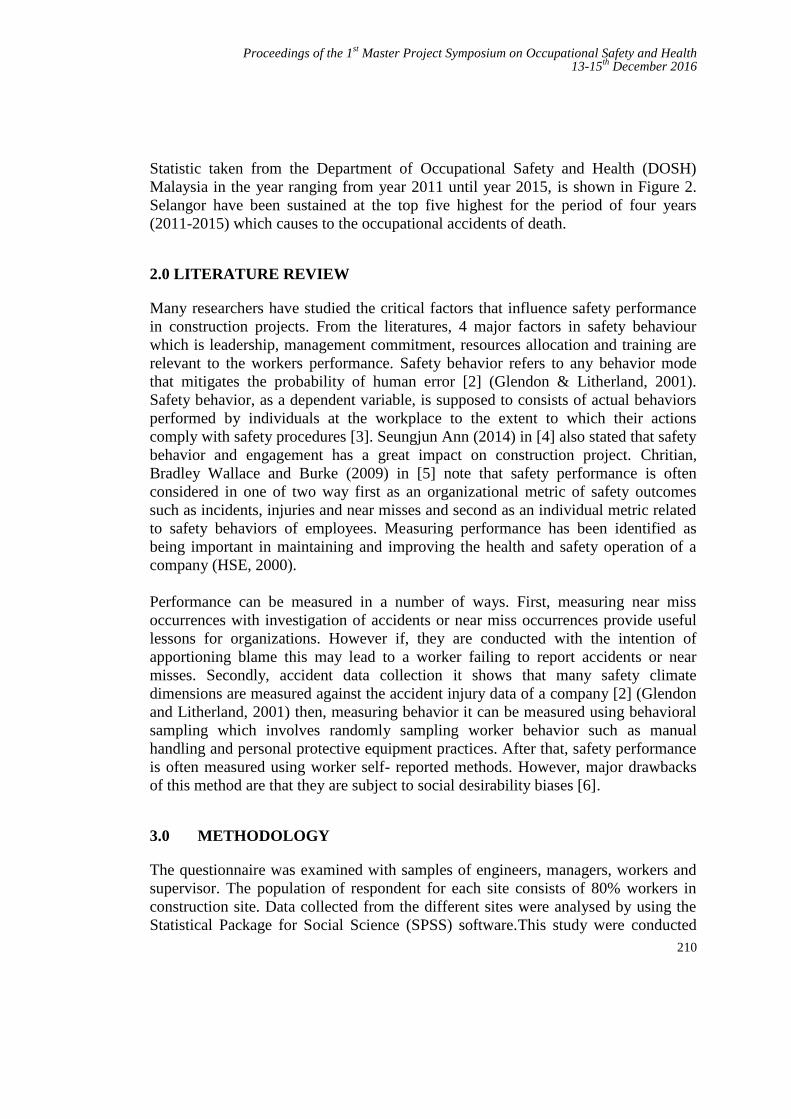
Proceedings of the 1st Master Project Symposium on Occupational Safety and Health13-15th December 2016
210
Statistic taken from the Department of Occupational Safety and Health (DOSH)Malaysia in the year ranging from year 2011 until year 2015, is shown in Figure 2.Selangor have been sustained at the top five highest for the period of four years(2011-2015) which causes to the occupational accidents of death.
2.0 LITERATURE REVIEW
Many researchers have studied the critical factors that influence safety performancein construction projects. From the literatures, 4 major factors in safety behaviourwhich is leadership, management commitment, resources allocation and training arerelevant to the workers performance. Safety behavior refers to any behavior modethat mitigates the probability of human error [2] (Glendon & Litherland, 2001).Safety behavior, as a dependent variable, is supposed to consists of actual behaviorsperformed by individuals at the workplace to the extent to which their actionscomply with safety procedures [3]. Seungjun Ann (2014) in [4] also stated that safetybehavior and engagement has a great impact on construction project. Chritian,Bradley Wallace and Burke (2009) in [5] note that safety performance is oftenconsidered in one of two way first as an organizational metric of safety outcomessuch as incidents, injuries and near misses and second as an individual metric relatedto safety behaviors of employees. Measuring performance has been identified asbeing important in maintaining and improving the health and safety operation of acompany (HSE, 2000).
Performance can be measured in a number of ways. First, measuring near missoccurrences with investigation of accidents or near miss occurrences provide usefullessons for organizations. However if, they are conducted with the intention ofapportioning blame this may lead to a worker failing to report accidents or nearmisses. Secondly, accident data collection it shows that many safety climatedimensions are measured against the accident injury data of a company [2] (Glendonand Litherland, 2001) then, measuring behavior it can be measured using behavioralsampling which involves randomly sampling worker behavior such as manualhandling and personal protective equipment practices. After that, safety performanceis often measured using worker self- reported methods. However, major drawbacksof this method are that they are subject to social desirability biases [6].
3.0 METHODOLOGY
The questionnaire was examined with samples of engineers, managers, workers andsupervisor. The population of respondent for each site consists of 80% workers inconstruction site. Data collected from the different sites were analysed by using theStatistical Package for Social Science (SPSS) software.This study were conducted
Proceedings of the 1st Master Project Symposium on Occupational Safety and Health13-15th December 2016
211
quantitatively where data will be collected through questionnaires that will bedistributed directly to the workers at construction site.
In this research, safety behavior was reflected on four factors: ManagementCommitment, Leadership, Resources Allocation and Training and performance onworker measured in the aspects of Productivity, Safety and Quality. As some of theinstrument is self-developed, it would first be pilot test.
This research study were using descriptive and inferential statistic to analyze thedata. Descriptive statistic will be using to analyze the demographic data and allindependent and dependent variables. Frequency measures such as percentage, meanand standard deviation will be used at this point. The mean is a measure of centraltendency that gives a general description in a data set. Hence, for this research study,the mean score that is acceptable will be between 3.00 (Moderately Agree) to 4.00(Strongly Agree) Descriptive analysis on the range (minimum and maximum score)is also being used in the analysis
4.0 RESULTS AND DISCUSSION
Hundred questionnaires were sent out by hand, but only 80 questionnaires wereaccepted. All of the questions were answered by the workers in construction site.Table 1 presents the demographic characteristic of the respondent.
Perception level of the respondents were divide into two groups only, high and lowlevel. The majority of respondents in this study were in the age range of 26-30 years.As for the gender, majority respondents in this study were male (83.8%) compared tofemale (16.3%). In the table also show majority respondents were married (57.5%)then single (41.3%). Since most of the respondents were taken from the constructionsite, (31.3%) of respondents get Diploma certificate and the remaining of therespondent possess a Master (15.0%), Degree (30.0%) and SPM (23.8%). As forposition held, majority of respondents were from Supervisor (43.8%) followed byEngineer (21.3%), Manager (16.3%) and Workers (18.8%). As for work experience,majority of the respondents has been working at construction site for range five years(51.2%)
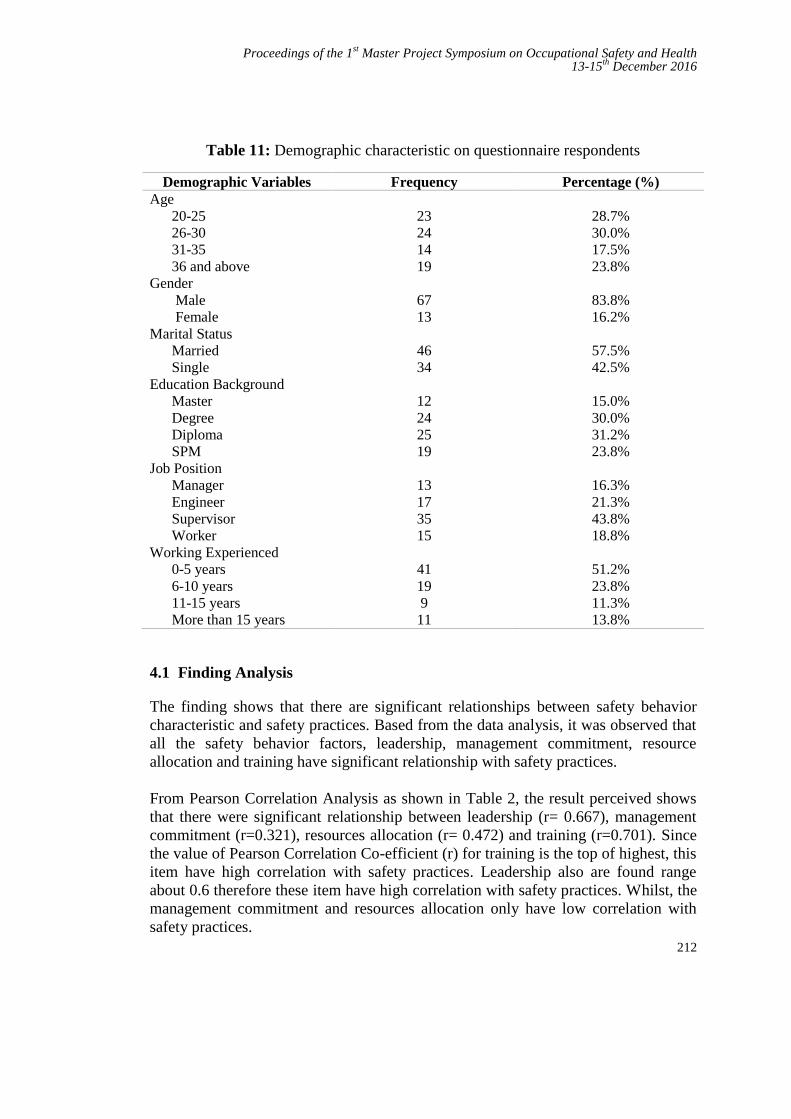
Proceedings of the 1st Master Project Symposium on Occupational Safety and Health13-15th December 2016
212
Table 11: Demographic characteristic on questionnaire respondents
Demographic Variables Frequency Percentage (%)Age
20-2526-3031-3536 and above
GenderMaleFemale
Marital StatusMarriedSingle
Education BackgroundMasterDegreeDiplomaSPM
Job PositionManagerEngineerSupervisorWorker
Working Experienced0-5 years6-10 years11-15 yearsMore than 15 years
23241419
6713
4634
12242519
13173515
4119911
28.7%30.0%17.5%23.8%
83.8%16.2%
57.5%42.5%
15.0%30.0%31.2%23.8%
16.3%21.3%43.8%18.8%
51.2%23.8%11.3%13.8%
4.1 Finding Analysis
The finding shows that there are significant relationships between safety behaviorcharacteristic and safety practices. Based from the data analysis, it was observed thatall the safety behavior factors, leadership, management commitment, resourceallocation and training have significant relationship with safety practices.
From Pearson Correlation Analysis as shown in Table 2, the result perceived showsthat there were significant relationship between leadership (r= 0.667), managementcommitment (r=0.321), resources allocation (r= 0.472) and training (r=0.701). Sincethe value of Pearson Correlation Co-efficient (r) for training is the top of highest, thisitem have high correlation with safety practices. Leadership also are found rangeabout 0.6 therefore these item have high correlation with safety practices. Whilst, themanagement commitment and resources allocation only have low correlation withsafety practices.
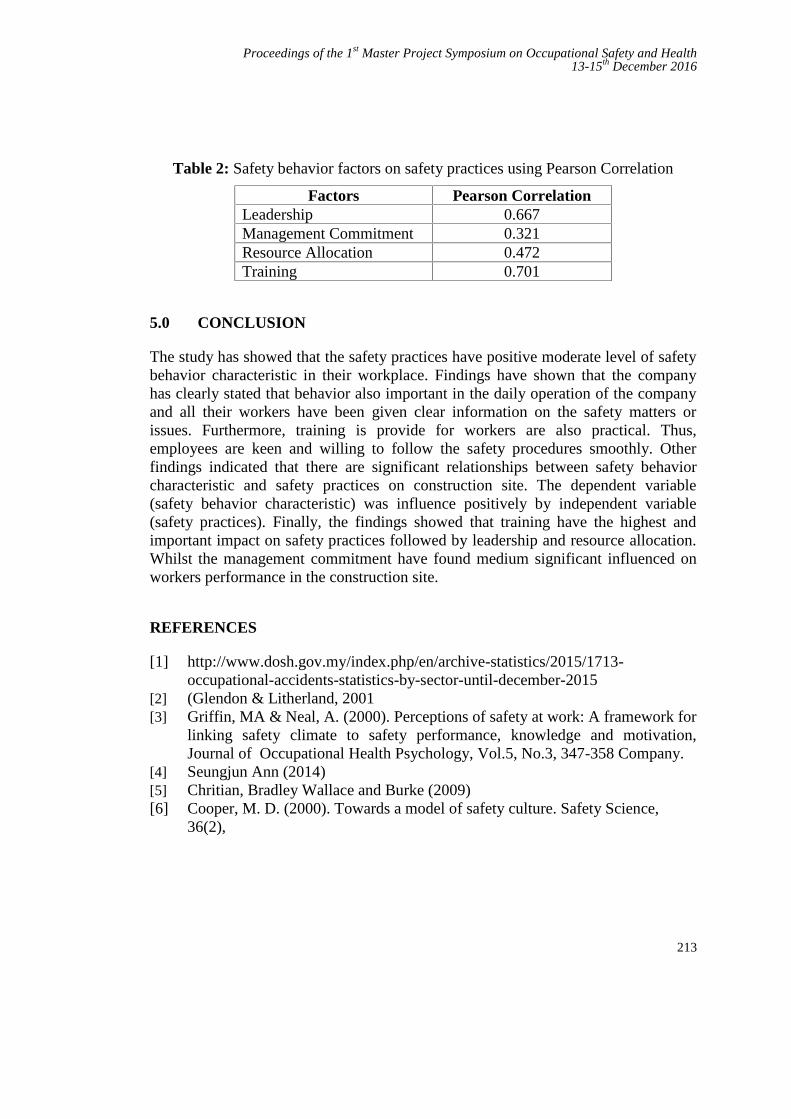
Proceedings of the 1st Master Project Symposium on Occupational Safety and Health13-15th December 2016
213
Table 2: Safety behavior factors on safety practices using Pearson Correlation
Factors Pearson CorrelationLeadership 0.667Management Commitment 0.321Resource Allocation 0.472Training 0.701
5.0 CONCLUSION
The study has showed that the safety practices have positive moderate level of safetybehavior characteristic in their workplace. Findings have shown that the companyhas clearly stated that behavior also important in the daily operation of the companyand all their workers have been given clear information on the safety matters orissues. Furthermore, training is provide for workers are also practical. Thus,employees are keen and willing to follow the safety procedures smoothly. Otherfindings indicated that there are significant relationships between safety behaviorcharacteristic and safety practices on construction site. The dependent variable(safety behavior characteristic) was influence positively by independent variable(safety practices). Finally, the findings showed that training have the highest andimportant impact on safety practices followed by leadership and resource allocation.Whilst the management commitment have found medium significant influenced onworkers performance in the construction site.
REFERENCES
[1] http://www.dosh.gov.my/index.php/en/archive-statistics/2015/1713-occupational-accidents-statistics-by-sector-until-december-2015
[2] (Glendon & Litherland, 2001[3] Griffin, MA & Neal, A. (2000). Perceptions of safety at work: A framework for
linking safety climate to safety performance, knowledge and motivation,Journal of Occupational Health Psychology, Vol.5, No.3, 347-358 Company.
[4] Seungjun Ann (2014)[5] Chritian, Bradley Wallace and Burke (2009)[6] Cooper, M. D. (2000). Towards a model of safety culture. Safety Science,
36(2),
Master Project Symposium Organizing CommitteeUTM Razak School of Engineering and Advanced Technology
Universiti Teknologi MalaysiaJalan Sultan Yahya Petra
54100 Kuala LumpurMALAYSIA
Phone: +603-2180 5138; Fax: +603-2180 5380