proceedings annual research review workshop...
TRANSCRIPT

Proceedings
Annual Research Review Workshop 2018
Date: 09-10 October 2018
Bangladesh Livestock Research Institute Savar, Dhaka 1341, Bangladesh

Annual Research Review Workshop 2018
Date: 09-10 October 2018
BLRI Conference Hall
3rd
floor, Building 3
PROGRAMME
Bangladesh Livestock Research Institute Savar, Dhaka 1341, Bangladesh
TECHNICAL SESSIONS
Day 1: Tuesday, 09 October 2018
Technical Session I
:
ANIMAL AND POULTRY BREEDING AND GENETICS
Chairperson
:
Dr. AK Fazlul Haque Bhuiyan
Professor, Department of Animal Breeding and Genetics
Bangladesh Agricultural University, Mymensingh 2202
Co-Chairperson : Md. Lutfor Rahman Khan Deputy Director
Central Cattle Breeding Station & Dairy Farm
Savar, Dhaka
Rapporteurs : Dr. Gautam Kumar Deb, SSO, BLRI
Md. Yousuf Ali Khan, SO, BLRI
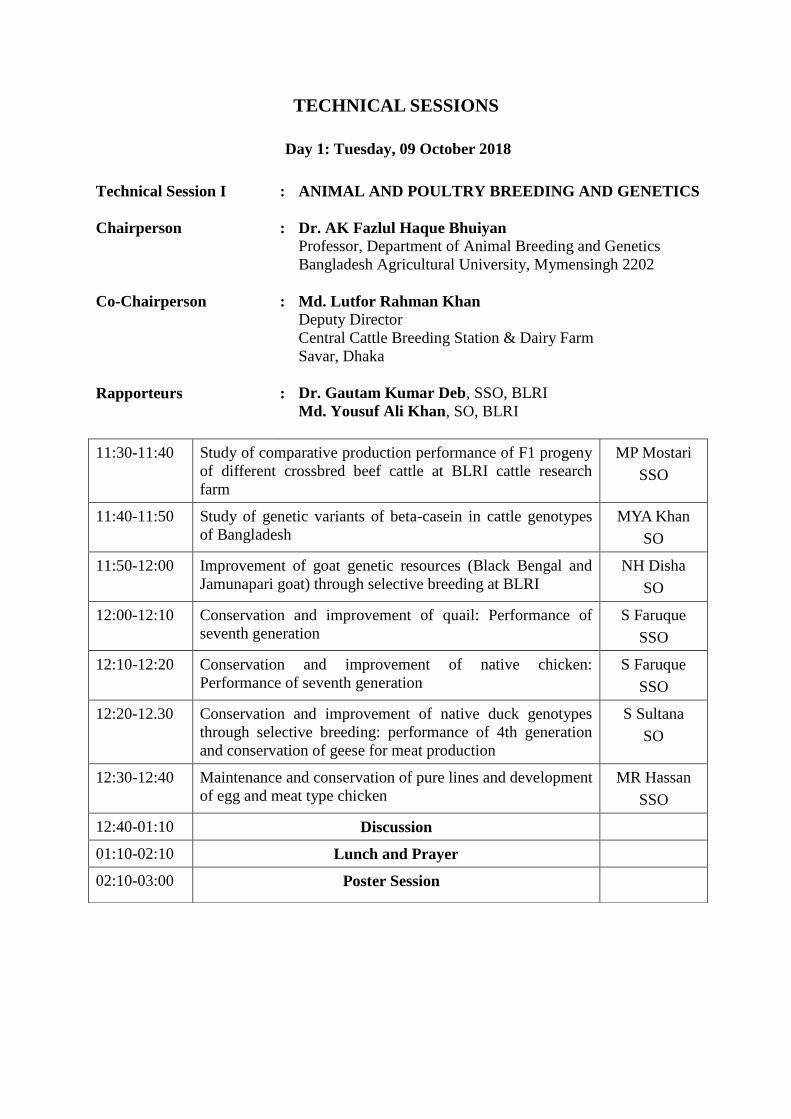
11:30-11:40 Study of comparative production performance of F1 progeny
of different crossbred beef cattle at BLRI cattle research
farm
MP Mostari
SSO
11:40-11:50 Study of genetic variants of beta-casein in cattle genotypes
of Bangladesh
MYA Khan
SO
11:50-12:00 Improvement of goat genetic resources (Black Bengal and
Jamunapari goat) through selective breeding at BLRI
NH Disha
SO
12:00-12:10 Conservation and improvement of quail: Performance of
seventh generation
S Faruque
SSO
12:10-12:20 Conservation and improvement of native chicken:
Performance of seventh generation
S Faruque
SSO
12:20-12.30 Conservation and improvement of native duck genotypes
through selective breeding: performance of 4th generation
and conservation of geese for meat production
S Sultana
SO
12:30-12:40 Maintenance and conservation of pure lines and development
of egg and meat type chicken
MR Hassan
SSO
12:40-01:10 Discussion
01:10-02:10 Lunch and Prayer
02:10-03:00 Poster Session

Day 1: Tuesday, 09 October 2018
Technical Session II : ANIMAL AND POULTRY DISEASES AND HEALTH
Chairperson : Dr. NC Debnath
Ex-Vice Chancellor
Chittagong Veterinary & Animal Sciences University
Chittagong
Co-Chairperson : Dr. MJFA Taimur
Ex-Chief Scientific Officer
Bangladesh Livestock Research Institute
Rapporteurs : Dr. Md. Abdus Samad, SSO, BLRI
Dr. Md. Rezaul Karim, SO, BLRI
03:00-03:10 Phenotypic and genotypic profiling of antimicrobial
resistance (AMR) Enterococcus spp. in finisher livestock
and poultry in Bangladesh
MS Sagor
RA
03:10-03:20 Development and validation of a low-cost mastitis detection
kit
SM Rahman
SSO
03:20-03:30 Development of Peste des Petits Ruminants (PPR) free zone
in selected areas of Bangladesh to meet global control
strategy
M Giasuddin
PSO
03:30-03:40 Development of FMD free zone in Bangladesh as per OIE
guidelines
M Giasuddin
PSO
03:40-03:50 Prevalence of different dairy cattle diseases in selected
dairy areas and farms of Pabna and Sirajganj districts of
Bangladesh
SM Rahman
SSO
03:50-04.00 Tick borne blood protozoan diseases of farm based &
slaughter house animal
MZ Hassan
SO
04:00-04:10 Seroprevalence of caprine brucellosis in Bangladesh MH Rahman
SO
04:10-04:40 Discussion
04:40-05:00 Tea and Snacks

Day 2: Wednesday, 10 October 2018
Technical Session III : BIOTECHNOLOGY, ENVIRONMENT AND
CLIMATE RESILIENCE
Chairperson
:
Professor Dr. MAM Yahia Khondoker
Department of Animal Breeding and Genetics
Bangladesh Agricultural University
Mymensingh 2202
Co-Chairperson
:
Dr. Md. Imtiaz Uddain
Chief Scientific Officer and Head
Biotechnology Division
Bangladesh Institute of Nuclear Agriculture
BAU Campus, Mymensingh 2202
Rapporteurs
: Dr. Parvin Mostari, SSO, BLRI
Md. Faizul Hossain Miraz, SO, BLRI
09:00-09:10 Adaptation of ovum pick up and somatic cell nuclear
transfer technologies for cattle in Bangladesh
GK Deb
SSO
09:10-09:20 Isolation and identification of LAB and
Streptococcus bacteria for developing starter culture
for Yogurt
MA Kabir
SO
09:20-09:30 Growth and Physiological Response of Selected
Mutant’s Line of Napier Cultivar to Salt Stress in
Hydroponic Technique
MK Alam
PhD Fellow
09:30-09:40 Study on adaptability of HYV fodder cultivars in
drought prone Barind areas of Bangladesh
MT Hasan
SO
09:40-09:50 Use of water hyacinth and press mud as co-substrate
with cow dung and layer droppings for improving
biogas production
SM Amanullah,
SSO
09:50-10.00 Study of value added livestock manure based
product production
JS Khanam
SO
10:00-10:10 Study on farm nutrient recycling in BLRI foreign
sheep farm
M Yesmin
SO
10:10-10:20 Assessment of methane emission in dairy production
systems based on existing feed resources through
GLEAM model under different climatic zones of
Bangladesh and their mitigation options
MK Bashar
SO
10:20-10:45 Discussion
10:45-11:00 Tea and Snacks

Technical Session IV
:
FEEDS, FODDER AND NUTRITION
Chairperson : Dr. Khan Shahidul Huque
Ex-Director General
Bangladesh Livestock Research Institute
Savar, Dhaka 1341
Co-Chairperson : Md. Mahbubur Rahman
Director (Production)
Department of Livestock Services
Farmgate, Dhaka
Rapporteurs : Dr. Sazedul Karim Sarker, SSO, BLRI
Dr. Sadek Ahmed, SSO, BLRI
11:00-11:10 Study of production and supply chain development of
Moringa feed (Mf) in different regions of Bangladesh
MK Bashar
SO
11:10-11:20 Feeding oil versus calcium salt of n-3 and n-6 fatty acid
on feed intake, digestibility, enteric methane emission
and blood metabolic profile in cattle
MM
Rahman,
SO
11:20-11:30 Development of probiotic feed supplement for calves
and their evaluation
SM
Amanullah
SSO
11:30-11:40 Buffalo fattening in the Southern Delta of Bangladesh BK Roy
SSO
11:40-11:50 Development of cost effective complete pellet feed and
its utilization for commercial goat and sheep production
S Ahmed
SSO
11.50-12.00 Development of cost effective crop residues based Total
Mixed Ration (TMR) for Ruminant: On farm validation
of TMR technology for dairy cow
D Yeasmin
SO
12:00-12:10 Study of diversification and upgradation of market waste
vegetable based feed manufacturing system
N Sultana
PSO
12:10-12:20 Strategic development of feeding and management
techniques to improve the performance of egg and meat
type chicken and their qualities
MR Hasan
SSO
12:20-12:30 Study on the comparative performance of turkey, guinea
fowl and broiler in some selected areas of Bangladesh
MY Ali
SO
12:30-01:00 Discussion
01:00-02:00 Lunch and Prayer
02:00-03:00 Poster Session

Day 2: Wednesday, 10 October, 2018
Technical Session V : SOCIOECONOMICS AND FARMING SYSTEM
RESEARCH
Chairperson : Professor Dr. Jahangir Alam Khan
Vice-Chancellor
University of Global Village
Barisal
Co-Chairperson
:
Professor Dr. Fakir Azmal Huda Department of Agricultural Economics
Agricultural Economics & Rural Sociology
Bangladesh Agricultural University
Mymensingh-2202
Rapporteurs
:
Dr. Rezia Khatun, SSO, BLRI
Md. Ashadul Alam, SSO, BLRI
03:00-03:10 Study on an economic impact of native chicken in some
selected areas of Bangladesh
M Khatun
SO
03:10-03:20 Study on cattle fattening and beef marketing in some selected
areas of Bangladesh
S Yasmin
SO
03:20-03:30 A baseline survey for field testing of BLRI FeedMaster
mobile application in selective locations of Bangladesh
MA Kabir
SO
03:30-03:40 A study on economic losses due to Foot and Mouth Disease
outbreak in cattle and buffalo in some affected areas of
Bangladesh
E Islam
SO
03:40-04:00 Discussion
04:00-05:00 Closing Session
05:00-05:15 Tea and Snacks
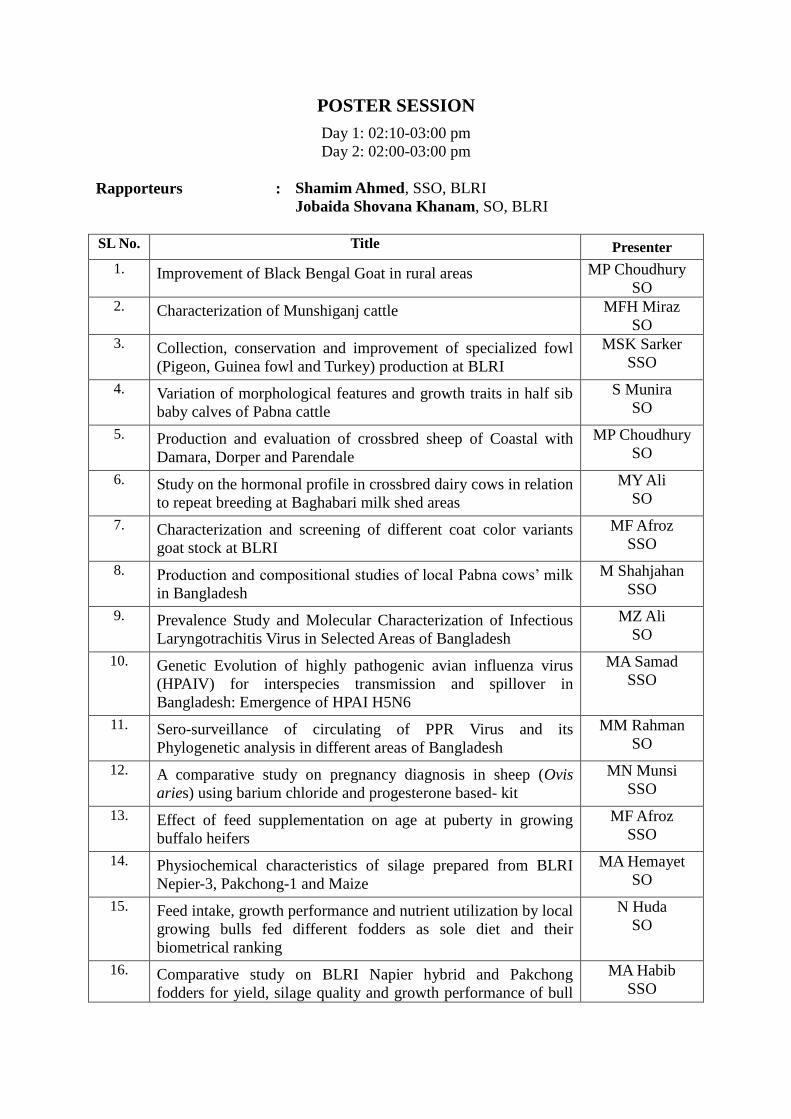
POSTER SESSION
Day 1: 02:10-03:00 pm
Day 2: 02:00-03:00 pm
Rapporteurs : Shamim Ahmed, SSO, BLRI
Jobaida Shovana Khanam, SO, BLRI
SL No. Title Presenter
1. Improvement of Black Bengal Goat in rural areas MP Choudhury
SO 2. Characterization of Munshiganj cattle MFH Miraz
SO 3. Collection, conservation and improvement of specialized fowl
(Pigeon, Guinea fowl and Turkey) production at BLRI
MSK Sarker
SSO
4. Variation of morphological features and growth traits in half sib
baby calves of Pabna cattle
S Munira
SO
5. Production and evaluation of crossbred sheep of Coastal with
Damara, Dorper and Parendale
MP Choudhury
SO
6. Study on the hormonal profile in crossbred dairy cows in relation
to repeat breeding at Baghabari milk shed areas
MY Ali
SO
7. Characterization and screening of different coat color variants
goat stock at BLRI
MF Afroz
SSO
8. Production and compositional studies of local Pabna cows’ milk
in Bangladesh
M Shahjahan
SSO
9. Prevalence Study and Molecular Characterization of Infectious
Laryngotrachitis Virus in Selected Areas of Bangladesh
MZ Ali
SO
10. Genetic Evolution of highly pathogenic avian influenza virus
(HPAIV) for interspecies transmission and spillover in
Bangladesh: Emergence of HPAI H5N6
MA Samad
SSO
11. Sero-surveillance of circulating of PPR Virus and its
Phylogenetic analysis in different areas of Bangladesh
MM Rahman
SO
12. A comparative study on pregnancy diagnosis in sheep (Ovis
aries) using barium chloride and progesterone based- kit
MN Munsi
SSO
13. Effect of feed supplementation on age at puberty in growing
buffalo heifers
MF Afroz
SSO
14. Physiochemical characteristics of silage prepared from BLRI
Nepier-3, Pakchong-1 and Maize
MA Hemayet
SO
15. Feed intake, growth performance and nutrient utilization by local
growing bulls fed different fodders as sole diet and their
biometrical ranking
N Huda
SO
16. Comparative study on BLRI Napier hybrid and Pakchong
fodders for yield, silage quality and growth performance of bull
MA Habib
SSO

SL No. Title Presenter
calves
17. Health risk assessment of heavy metals in animal origin food
chain through feed and fodders pathway
MA Islam
MS Student
18. Study on availability of feed resources and comparison of
nutrients composition of feed ingredients used by farmers and on
station
MM Billah
SO
19. Identification of poultry processing problems and development
of a model processing plant for safe poultry meat production
MSK Sarker
SSO
20. A baseline study about farmers training on BLRI developed
technologies
MZ Rahman
SSO
21. Development of blended yarns and fabrics from jute, cotton and
native sheep wool
MH Majumder
SO
22. Conservation and Improvement of Farm Animal Genetic
Resources (FAnGR) at Hilly Region at Naikhongchari
MA Alam
SSO
23 Study on the development of canned meat production techniques JS Khanam
SO 24 Community based sheep production in Hilly Area at
Naikhongchari
MA Hemayet
SO
25 Biomolecular characterization and diversity of the circulating
Bacillus anthracis in Bangladesh
MR Karim
SO
26 Development of energy and protein supplementation based
feeding system of pregnant Bengal sheep under stall feeding
condition
M Asaduzzaman
PSO
27 Molecular characterization of BLRI improved indigenus chicken
variety using microsatellite markers
MA Rashid
SSO

INAUGURAL SESSION (09 October 2018)
Chief Guest
: Mr. Narayon Chandra Chanda, MP
Hon’ble Minister
Ministry of Fisheries and Livestock
Special Guest : Dr. Md. Enamur Rahaman, MP
Dhaka-19
Special Guest
:
Mr. Md. Raisul Alam Mondal
Secretary
Ministry of Fisheries & Livestock
Special Guest :
Dr. Md. Kabir Ikramul Haque
Executive Chairman
Bangladesh Agricultural Research Council
Guest of Honor : DR. Hiresh Ranjan Bhowmik
Director General, Department of Livestock Services
Chairperson : Dr. Nathu Ram Sarker
Director General
Bangladesh Livestock Research Institute
08:30 am Registration
09.20 am Guests take their seat
09:25 am Recitation from the Holy Qur’an & Holy Gita
09.30 am Welcome address by
Mr. Md. Azharul Amin
Additional Director & Convener, Annual Research Review Workshop-2018
09:35 am Address by the Guest of Honor
DR. Hiresh Ranjan Bhowmik
Director General, Department of Livestock Services
09:40am Address by the Special Guest
Dr. Md. Kabir Ikramul Haque
Executive Chairman, Bangladesh Agricultural Research Council
09:45 am Address by the Special Guest
Mr. Md. Raisul Alam Mondal
Secretary, Ministry of Fisheries & Livestock
09:55 am Address by the Special Guest
Dr. Md. Enamur Rahaman, MP
Dhaka-19
10:05 am Address by the Chairperson
Dr. Nathu Ram Sarker
Director General, Bangladesh Livestock Research Institute
10:10 am Address by the Chief Guest
Mr. Narayon Chandra Chanda, MP Hon’ble State Minister, Ministry of Fisheries & Livestock
10:25 am Vote of thanks by
Dr. Md. Azharul Islam Talukder
CSO, Goat and Sheep Production Research Division, BLRI
10:30 am Refreshment

CLOSING SESSION
(10 October 2018)
Chief Guest
: Mr. Md. Raisul Alam Mondal
Secretary
Ministry of Fisheries & Livestock
Special Guest : DR. Hiresh Ranjan Bhowmik
Director General
Department of Livestock Services
Chairperson : Dr. Nathu Ram Sarker Director General
Bangladesh Livestock Research Institute
04:00 pm Recitation from the Holy Qur’an & Holy Gita
04:05 pm Presentation of workshop recommendation
Dr. Md. Giasuddin, PSO & Head, Animal Health Research Division
04:20 pm Open Discussion
04:40 pm Address by the Special Guest
Dr. Hiresh Ranjan Bhowmik
Director General, Department of Livestock Services
04:50 pm Address by the Chief Guest
Mr. Md. Raisul Alam Mondal
Secretary, Ministry of Fisheries & Livestock
05:00 pm Concluding by the Chairperson
Dr. Nathu Ram Sarker Director General, Bangladesh Livestock Research Institute
05: 10 pm Refreshment

i
CONTENTS
Sl.
No.
Programme area and Research title Page
No.
Session I: Animal and Poultry Breeding and Genetics
1 Study of comparative production performance of F1 progeny of different
crossbred beef cattle at BLRI cattle research farm 1
2 Study of genetic variants of beta-casein in cattle genotypes of Bangladesh 3
3 Improvement of goat genetic resources (Black Bengal and Jamunapari goat)
through selective breeding at BLRI 5
4 Conservation and improvement of quail: Performance of seventh generation 7
5 Conservation and improvement of native chicken: Performance of seventh
generation 9
6
Conservation and improvement of native duck genotypes through selective
breeding: performance of 4th generation and conservation of geese for meat
production
11
7 Maintenance and conservation of pure lines and development of egg and meat
type chicken 13
Session II: Animal and Poultry Diseases and Health
8 Phenotypic and genotypic profiling of antimicrobial resistance (AMR)
Enterococcus spp. in finisher livestock and poultry in Bangladesh 15
9 Development and validation of a low-cost mastitis detection kit 16
10 Development of Peste des Petits Ruminants (PPR) free zone in selected areas of
Bangladesh to meet global control strategy 18
11 Development of FMD free zone in Bangladesh as per OIE guidelines 20
12 Prevalence of different dairy cattle diseases in selected dairy areas and farms of
Pabnaand Sirajganj districts of Bangladesh 22
13 Tick borne blood protozoan diseases of farm based & slaughter house animal 24
14 Sero-prevalence of caprine brucellosis in Bangladesh 26
Session III: Biotechnology, Environment and Climate Resilience
15 Adaptation of ovum pick up and somatic cell nuclear transfer technologies for
cattle in Bangladesh 27
16 Isolation and identification of LAB and Streptococcus bacteria for developing
starter culture for Yogurt 29
17 Growth and physiological response of selected mutant’s line of Napier cultivar
to salt stress in hydroponic technique 31
18 Adaptability of HYV fodder cultivars in drought prone Barind areas of
Bangladesh 33

ii
Sl.
No.
Programme area and Research title Page
No.
19 Use of water hyacinth and press mud as co-substrate with cow dung and layer
droppings for improving biogas production 35
20 Study of value added livestock manure based product production 37
21 Study on farm nutrient recycling in BLRI foreign sheep farm 39
22
Assessment of methane emission in dairy production systems based on existing
feed resources through GLEAM model under different climatic zones of
Bangladesh and their mitigation options
41
Session IV: Feeds, Fodder and Nutrition
23 Study of production and supply chain development of Moringa feed (Mf) in
different regions of Bangladesh 43
24 Feeding oil versus calcium salt of n-3 and n-6 fatty acid on feed intake,
digestibility, enteric methane emission and blood metabolic profile in cattle 45
25 Development of probiotic feed supplement for calves and their evaluation 47
26 Buffalo fattening in the Southern Delta of Bangladesh 49
27 Development of cost effective complete pellet feed and its utilization for
commercial goat and sheep production 51
28 Development of cost effective crop residues based Total Mixed Ration (TMR)
for Ruminant: On farm validation of TMR technology for dairy cow 53
29 Study of diversification and up gradation of market waste vegetable based feed
manufacturing system 55
30 Strategic development of feeding and management techniques to improve the
performance of egg and meat type chicken and their qualities 57
31 Study on the comparative performance of turkey, guinea fowl and broiler in
some selected areas of Bangladesh 59
Session V: Socioeconomics and Farming System Research
32 Study on an economic impact of native chicken in some selected areas of
Bangladesh 61
33 Study on cattle fattening and beef marketing in some selected areas of
Bangladesh 63
34 A baseline survey for field testing of BLRI FeedMaster mobile application in
selective locations of Bangladesh 65
35 A study on economic losses due to Foot and Mouth Disease outbreak in cattle
and buffalo in some affected areas of Bangladesh 67
Poster Session
36 Improvement of Black Bengal goat in rural areas 69
37 Characterization of Munshiganj cattle 71

iii
Sl.
No.
Programme area and Research title Page
No.
38 Collection, conservation and improvement of specialized fowl (Pigeon, Guinea
fowl and Turkey) production at BLRI 73
39 Variation of morphological features and growth traits in half sib baby calves of
Pabna cattle 75
40 Production and evaluation of crossbred sheep of coastal with Damara, Dorper
and Parendale 77
41 Study on the hormonal profile in crossbred dairy cows in relation to repeat
breeding at Baghabari milk shed areas 79
42 Characterization and screening of different coat color variants goat stock at
BLRI 81
43 Production and compositional studies of local Pabna cows’ milk in Bangladesh 83
44 Prevalence study and molecular characterization of infectious Laryngotrachitis
virus in selected areas of Bangladesh 85
45 Genetic evolution of highly pathogenic avian influenza virus (HPAIV) for
interspecies transmission and spillover in Bangladesh: Emergence of HPAI
H5N6
86
46 Sero-surveillance of circulating of PPR virus and its phylogenetic analysis in
different areas of Bangladesh 87
47 A comparative study on pregnancy diagnosis in sheep (Ovis aries) using barium
chloride and progesterone based- kit 89
48 Effect of feed supplementation on age at puberty in growing buffalo heifers 91
49 Physiochemical characteristics of silage prepared from BLRI Nepier-3,
Pakchong-1 and maize 93
50 Feed intake, growth performance and nutrient utilization by local growing bulls
fed different fodders as sole diet and their biometrical ranking 95
51 Comparative study on BLRI Napier hybrid and Pakchong fodders for yield,
silage quality and growth performance of bull calves 97
52 Health risk assessment of heavy metals in animal origin food chain through feed
and fodders pathway 99
53 Study on availability of feed resources and comparison of nutrients composition
of feed ingredients used by farmers and on station 101
54 Identification of poultry processing problems and development of a model
processing plant for safe poultry meat production 103
55 A baseline study about farmers training on BLRI developed technologies 105
56 Development of blended yarns and fabrics from jute, cotton and native sheep
wool 107
57 Conservation and improvement of farm animal genetic resources (FAnGR) at
Hilly region at Naikhongchari 109

iv
Sl.
No.
Programme area and Research title Page
No.
58 Study on the development of canned meat production techniques 111
59 Community based sheep production in Hilly area at Naikhongchari 113
60 Biomolecular characterization and diversity of the circulating Bacillus anthracis
in Bangladesh 115
61 Development of energy and protein supplementation based feeding system of
pregnant Bengal sheep under stall feeding condition 117
62 Molecular characterization of BLRI improved indigenous chicken varieties
using microsatellite markers 119
63 Committee and different sub-committees of the Annual Research Review
Workshop 2018 121

Session I
ANIMAL & POULTRY BREEDING
AND GENETICS

Proceedings of the Annual Research Review Workshop 2018, BLRI, Savar, Dhaka 1341, October 09-10, 2018
1 Technical Session I
Study of comparative production performance of F1 progeny of different crossbred beef cattle
at BLRI cattle research farm
MP Mostari, MYA Khan, BK Roy, SMJ Hossain and N Sultana
Executive summary
Beef is one of the most nutrient-dense foods in the human diet. It is a protein rich food and has a great
demand to Bangladeshi consumers. Though Bangladesh has a high dense of cattle population but low
carcass yield of native cattle and to meet up the growing demand of beef in the upcoming years,
crossbreeding of native cattle with suitable exotic beef sire (s) is requisite. Conventional beef
production system coupled with intensive beef farming may help increasing beef production in the
country. Brahman crosses are being produced to increase productivity of indigenous cattle, but
strategic approach for breed development that needs screening of multiple genotypes is ignored. Thus,
the present work was undertaken with an objective to develop market beef cattle of average 150.0 kg
carcass weight with an average FCR of ≈ 6.50 at 2 years of age under on farm feeding and
management conditions. Aiming at developing breeding bulls the cows of BLRI Cattle Breed 1 (BCB-
1) were inseminated with the imported frozen semen of Brahman, Simmental, Charolais or Limousine.
The crossbred bulls of different assorted F1 genotypes are being selected and their production and
breeding performance (birth, weaning, 6th month, yearling & market age weight, average daily gains
at different ages, total DM intake and FCR) are being recorded, evaluated and compared with BCB-1
(control). All calves were raised in an identical care and management. Under this program, a feeding
trial was conducted using F1 crossbreds and BCB-1 at 18 to 24 months of age to compare their
production potentials. All animals received 55:45 mixed ration (DM basis) of german grass and a
concentrate mixture of crushed wheat (18%), wheat bran (40%), khesari bran (20%), soybean meal
(18%), common salt (1%), DCP (2%), limestone (1%) and premix (0.1%). The supplied concentrate
mixture contained 18% CP. The effects of genotypes of F1 progeny on growth performance were
determined. The recorded economic traits were compared statistically in an ANOVA of a Completely
Randomized Design using General Linear Model of “agricolae” package of R software (version
3.5.1).
A total number of 53 F1crossbred progeny were produced and out of that 15 were Limousine, 14 were
Simmental, 12 were Charolais and 12 were Brahman crosses.
Table 1. Effects of genotypes of F1 male progeny on live weight at different ages Live weight
(kg)
Genotype
Mean±SD(n)
Sig.
Lev.
Limousine×
BCB-1
Simmental×
BCB-1
Charolais×
BCB-1
Brahman×
BCB-1
Purebred
BCB-1
At birth 21.24 bc±3.36
(8)
23.00 abc±2.34
(5)
26.40 a±6.84
(7)
24.90 ab±2.48
(7)
18.84 c±3.41
(5)
*
At weaning
(3 months)
62.74 ab±11.79
(8)
63.20 ab±18.23
(5)
66.30 ab±13.94
(7)
75.00 a±13.94
(7)
52.30 b±5.63
(5)
NS
At yearling
(12 months)
253.17 b ±13.18
(6)
299.00 a±32.53
(2)
302.25 a±32.87
(4)
250.14 b±19.75
(7)
202.20 c±9.76
(5)
***
At market age
(24 months )
486.40 ab±27.52
(5)
555.50 a±109.60
(2)
507.67 a±20.40
(3)
432.00 b±36.52
(4)
354.20 c±20.52
(5)
***
Table1 revealed that all crossbred F1 male progeny performed better than BCB-1 in terms of live
weight at different ages and they differ significantly among the groups except the weaning period.
Similar to the male, crossbred female attained higher live weight than purebred BCB-1female at birth,
weaning, 6 months, yearling and 24 months of age (Table 2). Females of Simmental cross also had the
highest live weight (464.60±34.37 kg) at market age followed by Limousine×BCB-1 (446.50±19.09
kg), Charolais×BCB-1 (425.50±16.26 kg), Brahman×BCB-1 (333.3 ±11.02 kg) and BCB-1 (295.60
±20.74 kg). In average daily weight gain, genotype had highly significant effect (p<0.001) in 0-12 and
0-24 months of age of male progeny (Table 3). During birth to market age, all crossbred males gained
more than BCB-1 and Simmental cross gained the highest daily live weight (0.74±0.16) followed by
Charolais (0.67±0.03), Limousine (0.65±0.04), Brahman (0.57±0.05) crosses and BCB-1
(0.46±0.03). Similarly, the male, Simmental female crosses grew faster than other crosses. Table 4
Proceedings of the Annual Research Review Workshop 2018, BLRI, Savar, Dhaka 1341, October 09-10, 2018
2 Technical Session I
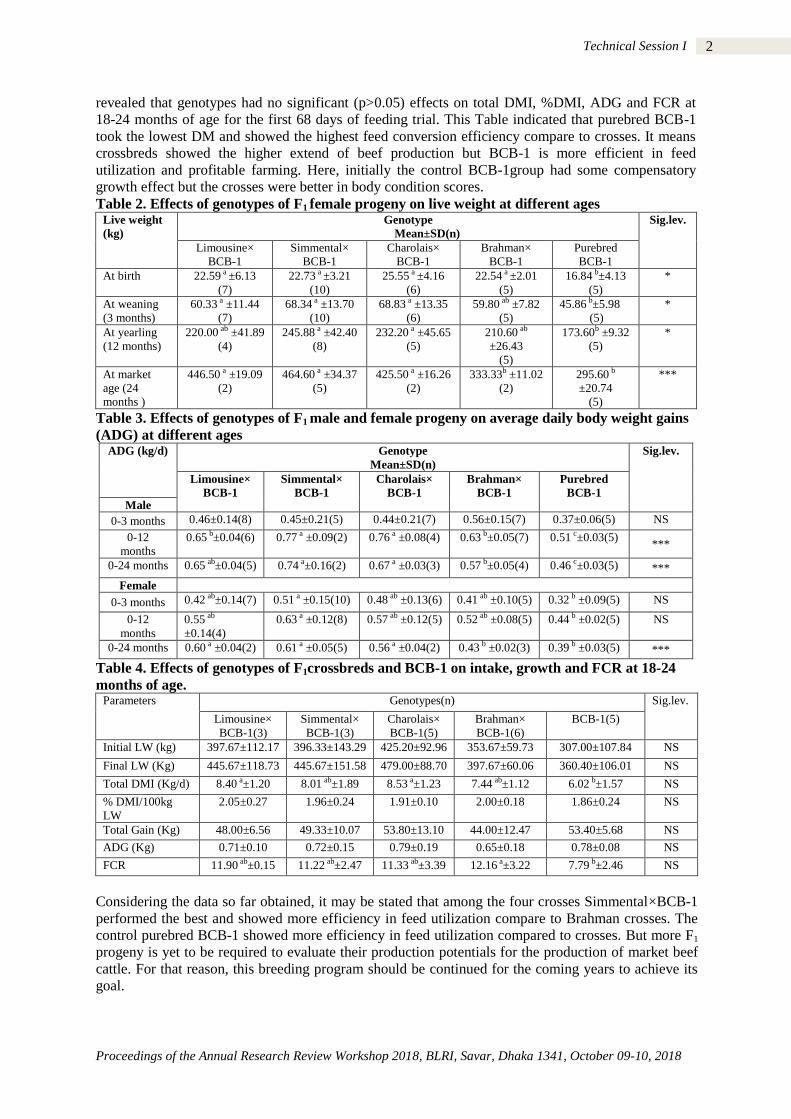
revealed that genotypes had no significant (p>0.05) effects on total DMI, %DMI, ADG and FCR at
18-24 months of age for the first 68 days of feeding trial. This Table indicated that purebred BCB-1
took the lowest DM and showed the highest feed conversion efficiency compare to crosses. It means
crossbreds showed the higher extend of beef production but BCB-1 is more efficient in feed
utilization and profitable farming. Here, initially the control BCB-1group had some compensatory
growth effect but the crosses were better in body condition scores.
Table 2. Effects of genotypes of F1 female progeny on live weight at different ages Live weight
(kg)
Genotype
Mean±SD(n)
Sig.lev.
Limousine×
BCB-1
Simmental×
BCB-1
Charolais×
BCB-1
Brahman×
BCB-1
Purebred
BCB-1
At birth 22.59 a ±6.13
(7)
22.73 a ±3.21
(10)
25.55 a ±4.16
(6)
22.54 a ±2.01
(5)
16.84 b±4.13
(5)
*
At weaning
(3 months)
60.33 a ±11.44
(7)
68.34 a ±13.70
(10)
68.83 a ±13.35
(6)
59.80 ab ±7.82
(5)
45.86 b±5.98
(5)
*
At yearling
(12 months)
220.00 ab ±41.89
(4)
245.88 a ±42.40
(8)
232.20 a ±45.65
(5)
210.60 ab
±26.43
(5)
173.60b ±9.32
(5)
*
At market
age (24
months )
446.50 a ±19.09
(2)
464.60 a ±34.37
(5)
425.50 a ±16.26
(2)
333.33b ±11.02
(2)
295.60 b
±20.74
(5)
***
Table 3. Effects of genotypes of F1 male and female progeny on average daily body weight gains
(ADG) at different ages ADG (kg/d) Genotype
Mean±SD(n)
Sig.lev.
Limousine×
BCB-1
Simmental×
BCB-1
Charolais×
BCB-1
Brahman×
BCB-1
Purebred
BCB-1 Male
0-3 months 0.46±0.14(8) 0.45±0.21(5) 0.44±0.21(7) 0.56±0.15(7) 0.37±0.06(5) NS
0-12
months
0.65 b±0.04(6) 0.77 a ±0.09(2) 0.76 a ±0.08(4) 0.63 b±0.05(7) 0.51 c±0.03(5) ***
0-24 months 0.65 ab±0.04(5) 0.74 a±0.16(2) 0.67 a ±0.03(3) 0.57 b±0.05(4) 0.46 c±0.03(5) ***
Female
0-3 months 0.42 ab±0.14(7) 0.51 a ±0.15(10) 0.48 ab ±0.13(6) 0.41 ab ±0.10(5) 0.32 b ±0.09(5) NS
0-12
months
0.55 ab
±0.14(4)
0.63 a ±0.12(8) 0.57 ab ±0.12(5) 0.52 ab ±0.08(5) 0.44 b ±0.02(5) NS
0-24 months 0.60 a ±0.04(2) 0.61 a ±0.05(5) 0.56 a ±0.04(2) 0.43 b ±0.02(3) 0.39 b ±0.03(5) ***
Table 4. Effects of genotypes of F1crossbreds and BCB-1 on intake, growth and FCR at 18-24
months of age. Parameters Genotypes(n) Sig.lev.
Limousine×
BCB-1(3)
Simmental×
BCB-1(3)
Charolais×
BCB-1(5)
Brahman×
BCB-1(6)
BCB-1(5)
Initial LW (kg) 397.67±112.17 396.33±143.29 425.20±92.96 353.67±59.73 307.00±107.84 NS
Final LW (Kg) 445.67±118.73 445.67±151.58 479.00±88.70 397.67±60.06 360.40±106.01 NS
Total DMI (Kg/d) 8.40 a±1.20 8.01 ab±1.89 8.53 a±1.23 7.44 ab±1.12 6.02 b±1.57 NS
% DMI/100kg
LW
2.05±0.27 1.96±0.24 1.91±0.10 2.00±0.18 1.86±0.24 NS
Total Gain (Kg) 48.00±6.56 49.33±10.07 53.80±13.10 44.00±12.47 53.40±5.68 NS
ADG (Kg) 0.71±0.10 0.72±0.15 0.79±0.19 0.65±0.18 0.78±0.08 NS
FCR 11.90 ab±0.15 11.22 ab±2.47 11.33 ab±3.39 12.16 a±3.22 7.79 b±2.46 NS
Considering the data so far obtained, it may be stated that among the four crosses Simmental×BCB-1
performed the best and showed more efficiency in feed utilization compare to Brahman crosses. The
control purebred BCB-1 showed more efficiency in feed utilization compared to crosses. But more F1
progeny is yet to be required to evaluate their production potentials for the production of market beef
cattle. For that reason, this breeding program should be continued for the coming years to achieve its
goal.

Proceedings of the Annual Research Review Workshop 2018, BLRI, Savar, Dhaka 1341, October 09-10, 2018
3 Technical Session I
Study of genetic variants of beta-casein in cattle genotypes of Bangladesh
MP Mostari and MYA Khan
Animal Production Research Division
Executive Summary
The bovine milk is worldwide most important food for human since it is the most common source of
animal proteins and micronutrients. Caseins and whey proteins are the two major protein groups
present in the milk. Caseins account for 80% of bovine milk protein and whey proteins constitute
about 14%. The four caseins proteins are present in bovine milk: casein alpha s1 (39–46%), casein
alpha s2 (8–11%), beta-casein (25–35%), and casein kappa (8–15%). The most frequently observed
forms of beta-casein (CSN2 gene) in dairy cattle breeds are A1 and A2. The difference between the
A1 and A2 beta-casein variants is a single amino acid substitution (CCT_CAT) at the 67th residue of
the 209 amino acid chain. This difference in structure results in A1 beta-casein preferentially releasing
an opioid peptide called beta-casomorphin-7 (BCM-7) upon digestion. The BCM-7 may lead to
adverse physiological effects like gastrointestinal inflammation, worsening of post-dairy digestive
discomfort (PD3) symptoms, triggers lactose intolerance, ischemic heart diseases, insulin-dependent
diabetes, atherosclerosis, sudden infant death syndrome, autism and schizophrenia. Besides health
promoting properties, the A2 variant has also been reported to have positive relationship with milk
performance traits especially protein and milk yield, whereas A1 variant showed the opposite
influence. Bangladesh possesses 25.67 millions head cattle of which 47% are crossbred. However,
screening of available cattle genotypes in Bangladesh has not yet been undertaken for CSN2
polymorphism. Considering the healthfulness of A2 milk as well as positive relationship of A2 allelic
variant with milk performance traits in different cattle breeds, the present study was undertaken with
the objectives to (i) identify genetic variability (A1/A2) of beta-casein in existing cattle genotypes of
Bangladesh and (ii) to make breeding decision at policy and farmers level to enhance A2 milk
production. To achieve the objectives, cattle genotypes i.e. Red Chittagong (RCC), BLRI Cattle
Breed-1 (BCB-1), Munshiganj (MC), North Bengal Grey (NBG), non-descriptive native cattle and
their crosses with Holstein-Friesian, Sahiwal, Jersey, Brahman and others available cattle genotypes
were selected for the genetic variability study of A1 and A2 beta-casein. In the financial year of 2017-
18, a total of 129 blood samples were collected from three native cattle breeds of which 47, 56 and 26
samples were from RCC, BCB-1 and MC respectively. Blood samples were taken from jugular vein
using venoject tubes coated with EDTA (Di sodium ethylene di amine tetra acetate). The date and
place of collection, sample number, sex of animals were recorded. The collected blood samples were
carried in cooling box and preserved at -20ºC until DNA extraction. The DNA was extracted from
blood samples using a commercial kit (Promega- Wizard® Genomic DNA Purifcation Kit) following
manufacturer instruction. The extracted DNA samples were quantified by agarose gel electrophoresis.
The primers used in this study from the bovine CSN2 gene (Gene Bank Accession No. M55158.1)
were the reference work of Ganguly et al., 2013 (Indian Journal of Biotechnology. Vol 12: P 195-
198). AS-PCR was carried out using a forward primer carrying either A (IGBhF:
5‟CTTCCCTGGGCCCATCCA 3‟) or C (IGBpF: 5‟CTTCCCTGGGCCCATCCC 3‟) and at the 3‟
end a common reverse primer (IGBR: 5‟AGACTGGAGCAGAGGCAGAG 3‟) to amplify a 244 bp
fragment. Primer pairs IGBhF-IGBR and IGBpF-IGBR were intended to pick histidine (A1) and
proline (A2) specific amplicon respectively. The PCR amplifications were performed in a total
volume of 25 μl using commercial master mix (Promega- GoTaq® G2 Green Master Mix) following
manufacturer instruction, which contain 100–180 ng of genomic DNA, 15 pmol of each primer, 200
μM of each dNTP, 1× buffers with 1.5 mM MgCl2 and 1 U Taq DNA polymerase in final
concentration. The PCR amplifications were performed using thermal cycler (GTQ Cycler 96, of
HAIN Life-science) in a condition of initial denaturation at 95 °C for 5 min followed by 30 cycles of
95 °C for 60 s, annealing temperature (58 °C) for 45 s and 72 °C for 60 s followed by final extension
at 72 °C for 10 min. The amplified products were analyzed by electrophoresis on 1% agarose gel at 80

Proceedings of the Annual Research Review Workshop 2018, BLRI, Savar, Dhaka 1341, October 09-10, 2018
4 Technical Session I
V for 40 min with ethidium bromide staining and alleles were identified using UV-trans-illuminator
(Figure 1). The Genotype and gene (allele) frequency of individual breeds were calculated using
Microsoft Excel program.
Figure 1: Identification of A1 and A2 alleles in BCB-1 through PCR and agarose gel electrophoresis
Genotype frequencies of A2A2, A1A2 and A1A1 in RCC were 89.4, 10.6 and 0.0. However, the
corresponding frequencies in BCB-1 were 85.7, 12.5 and 1.8 and, in MC were 80.8, 15.4 and 3.8,
respectively. The frequency of A2 allele was 94.7, 92.0 and 88.5 in RCC, BCB-1 and MC and, A1
allele was 5.3, 8.0 and 11.5 in corresponding breeds (Table 1). The genetic variability of beta-casein
(A1/A2) in NBG, non descriptive native cattle and their crosses with Holstein-Friesian, Sahiwal,
Jersey, Brahman and others available cattle genotypes will be analyzed in the following year.
Table 1: Genotype and gene (allele) frequencies of beta-casein in RCC, BCB-1 and MC genotypes.
Breeds No. of
Sample
Genotype frequency Allele frequency
A2A2 A1A2 A1A1 A2 A1
RCC 47 89.4 (n=42) 10.6 (n=5) 0 (n=0) 94.7 5.3
BCB-1 56 85.7 (n=48) 12.5 (n=7) 1.8 (n=1) 92.0 8.0
MC 26 80.8 (n=21) 15.4 (n=4) 3.8 (n=1) 88.5 11.5
In conclusion, so far data obtained, it may be stated that, most of the native cattle have A2A2
genotype with a few A1A2. The present investigation offers a plenty of scope for changing gene
frequency through using A2A2 genotyped bulls in artificial insemination program running by
Government and Private sector.

Proceedings of the Annual Research Review Workshop 2018, BLRI, Savar, Dhaka 1341, October 09-10, 2018
5 Technical Session I
Improvement of goat genetic resources (Black Bengal and Jamunapari goat) through selective
breeding at BLRI
MA Jalil, NH Desha1, MP Choudhury
Goat and Sheep Production Research Division, BLRI, Savar, Dhaka 1341
Executive Summary
Goat is the important potential livestock species which contributing meat and skins, and to some
extent, milk, fleece and manure which help economic development of country like Bangladesh. But,
the available goat breeds are being diluted by unwanted crossing all over the country. Considering the
fact, the project has designed with the objectives- i) improvement of goat genetic resources (Black
Bengal and Jamunapari goat) through selective breeding and ii) evaluation of performances of goat
genetic resources (Black Bengal and Jamunapari goat) at BLRI. The study was conducted in Goat and
Sheep Research Farm of Bangladesh Livestock Research Institute, Savar, Dhaka. The breeding
program was conducted through Open Nucleus Breeding System (ONBS) avoiding inbreeding in
order to improve the genetic and phenotypic traits of existing breeding goat stock. The selection
objectives of the study were improvement of prolificacy, milk production and growth rate of
respective goat breeds. The targeted prolificacy, milk production and 6 months body weight of Black
Bengal and Jamunapari goat were, minimum 2 kids per kidding; 0.5 litter/day and 1.00 litter/day; 12
kg and 16 kg, respectively. The selection index was calculated by the following equation, IB = b1x1 +
b2x2 + ……………….. + bnxn. Where, b1, b2,…, bn were phenotypic values for the traits and x1, x2,…,
xn were relative economic values given to each of the traits.
The average prolificacy of Black Bengal goat were 1.78±0.06, 1.83±0.04, 1.58±0.08, 1.66±0.05,
1.49±0.08, 1.85±0.08 and 1.56±0.15 for 1st, 2
nd, 3
rd, 4
th, 5
th, 6
th and 7
th generation, respectively. The
average six month body weight of Black Bengal goat were 8.95±0.39, 9.27±0.42, 7.65±0.47,
8.40±0.44, 7.9±0.52, 7.64±0.78 and 7.8±1.00 kg respectively, for 1st, 2
nd, 3
rd, 4
th, 5
th, 6
th and 7
th
generation. In case of Jamunapari goat, the average prolificacy were 2.26±0.09, 1.61±0.06, 1.68±0.09,
1.97±0.22, 1.53±0.12 and 1.5±0.5 respectively, for 1st, 2
nd, 3
rd, 4
th, 5
th and 6
th generation. The average
six month body weights of Jamunapari goat were 10.9±0.71, 12.65±0.58, 12.57±1.25, 13.15±0.90 and
14.3 kg for 1st, 2
nd, 3
rd, 4
th, 5
th and 6
th generation respectively.
Table 1: Productive and reproductive performance of Black Bengal Goat (Mean ± SE):
Generation Average
prolificacy Birth weight (kg)
3 months weight
(kg)
6 months weight
(kg)
1 1.78±0.06 (30) 1.35±0.05 (30) 6.28±0.30 (22) 8.95±0.39 (18)
2 1.83±0.04 (65) 1.23±0.03 (65) 5.58±0.19 (44) 9.27±0.42 (28)
3 1.58±0.08 (28) 1.13±0.05 (28) 5.46±0.19 (24) 7.65±0.47 (15)
4 1.66±0.05 (34) 1.29±0.06 (34) 5.85±0.29 (26) 8.40±0.44 (21)
5 1.49±0.08 (12) 1.16±0.10 (12) 5.51±0.35 (9) 7.9±0.52 (7)
6 1.85±0.08 (21) 1.17±0.05 (14) 5.22±0.23 (17) 7.64±0.78 (7)
7 1.56±0.15 (8) 1.19±0.07 (8) 5.09±0.31 (5) 7.8±1.00 (3)
Figure in the parenthesis indicate the number of observations.

Proceedings of the Annual Research Review Workshop 2018, BLRI, Savar, Dhaka 1341, October 09-10, 2018
6 Technical Session I
Table 2: Productive and reproductive performance of Jamunapari Goat (Mean ± SE):
Generation Average
prolificacy Birth weight (kg)
3 months weight
(kg)
6 months weight
(kg)
1 2.26±0.09 (8) 2.06±0.09 (8) 8.34±0.23 (5) 10.9±0.71 (5)
2 1.61±0.06 (32) 2.6±0.09 (32) 9.9±0.42 (25) 12.65±0.58 (20)
3 1.68±0.09 (18) 2.21±0.12 (18) 9.69±0.61 (12) 12.57±1.25 (7)
4 1.97±0.22 (10) 2.01±0.09 (10) 8.45±0.32( 6) 10.43±0.61 (6)
5 1.53±0.12 (10) 2.19±0.19 (10) 10.59±0.73 (7) 13.15±0.90 (4)
6 1.5±0.5 (2) 2.6±0.3 (2) 10.55±0.85 (2) 14.3(1)
Figure in the parenthesis indicate the number of observations.
Data on milk production is being collected for all the generations. After collecting all the data,
selection index of each individual will be calculated and the animal with higher total index score will
be selected for the breeding purpose.
In conclusion, superior bucks and does from all the generations will be selected by the individual
performance score. Therefore, the selection program should be continued for the coming years to
achieve the targeted goal.

Proceedings of the Annual Research Review Workshop 2018, BLRI, Savar, Dhaka 1341, October 09-10, 2018
7 Technical Session I
Conservation and improvement of Quail: Performance of seventh generation
S Faruque1, AKFH Bhuiyan
2, MOA Rahman
1, MSK Sarker
1 and NR Sarker
1
1Poultry Production Research Division, Bangladesh Livestock Research Institute, Savar, Dhaka,
Bangladesh ; 2Department of Animal Breeding and Genetics, Bangladesh Agricultural University,
Mymensingh 2202.
Executive summary
Individual selection is essential particularly in selection experiments for body weight in quail. Four
genotypes of quail like Dhakai (D), White (W), Brown (Br) and Black (Bl) quail are being maintained
at BLRI with the objective to develop a suitable meat type quail genotype for our existing farming.
The parent males and females were being maintained in cages for single pair mating through selective
breeding system for producing each generation. Pedigree records are being kept by using
commercially available leg bands to identify quail of all ages. For producing seventh generation (G7),
parent quails of each genotype were selected from the sixth generation (G6) on the basis of breeding
value according to their 5th week body weight. Hatching eggs were collected from every single pen of
the selected parent quails. A total of 1135-day-old chicks comprising of 4 types of quail namely D, W,
Br, and Bl were hatched in a batch. The diet containing 24% crude protein and 3000kcal ME/kg were
provided to the birds at laying period. Data on egg weight, hatchability, body weight of chick at first
day, 2nd
week, 4th week, 5
th week and 6
th week of age, feed intake, mortality, egg production were
recorded to study their productive and reproductive performance. Collected data were analyzed in a
CRD by General Linear Model Univariate Procedure using „agricolae‟ package in R Software version
3.5.1. The expected genetic progress due to selection for 5thweek body weight was estimated for G7
using the following equation (Falconer, 1981).
R = h2 ×Swhere, R = Expected response, h
2 = heritability for 5
thweek body weight and S = Selection
differential for the selected males and females.
The genotype had significant (p<0.001) effect on the body weight of quails at 2nd
week, 4th week and
6th week of age (Table 1). The 6
th week body weight was 158.16± 0.72, 139.72 ± 0.96, 129.76 ±0.36
and 127.90± 0.85g, respectively for D, W, Br and Bl genotypes. Significantly higher body weight was
found in D followed by W, Br and Bl quail genotypes at different periods of age. The Dhakai
genotype (2.35%) had non-significantly (χ2 = 0.82; p>0.05) higher chick mortality compared to other
genotypes at 0-5 weeks (Table 2).The hatchability rate were significantly (p<0.001) higher in D
(76.59%) compared to other three genotypes of quail (Table 3). The eggs production performance up
to 24th week of age was83.17± 1.1, 78.52±1.7, 79.19±1.7 and 94.26±1.2, respectively for D, W, Br
and Bland significantly (p<0.001) differed among all genotypes. Table 4 showed that 5th week body
weight of males of D, W, Br and Bl quails were expected to increase by 3.19, 5.01, 1.62 and 2.16 g,
respectively. While in females of D, W, Br and Bl quails, the expected responses were 5.39, 3.23,
2.63 and 2.73 g, respectively. Based on the performance Dhakai quail was superior for body weight
and Black quail for egg production. These findings suggested for continuing the quail breeding
research for producing a suitable meat type quail genotype in our country.
Table 1 Least squares means (LSM) and standard error (SE) of different age groups as affected by
genotype
Genotype 2nd
wk body wt (g) 4th
wk body wt (g) 6th
wk body wt (g)
Dhakai 37.16a±0.55 122.60
a±0.76 158.16
a±0.72
White 25.06b ± 0.38 113.98
b ± 0.51 139.72
b±0.96
Brown 26.58c ± 0.36 94.48
c ± 0.53 129.76
d±0.36
Black 25.66bc
± 0.39 95.70c ± 0.86 127.90
c±0.85
Level of significance (p<0.001) (p<0.001) (p<0.001)

Proceedings of the Annual Research Review Workshop 2018, BLRI, Savar, Dhaka 1341, October 09-10, 2018
8 Technical Session I
Table 2 Effect of genotype on chick mortality (%) during 0-5 weeks of age
Parameter Genotype 2 (df=3) P- value
Dhakai White Brown Black
Mortality
(%)
2.35 1.63 2.17 1.33 0.82 p>0.05
Table 3 Productive and reproductive performance of four quail genotypes
Parameter genotype (Mean ±SE) Level of
Significance Dhakai White Brown Black
Hatchability on
setting eggs (%) 76.59
a±1.6 75.37
a±1.5 67.19
b±1.8 73.06
a±1.7 P<0.001
Feed Intake(g/b/d) 18.12±1.17 17.42±1.19 16.39±1.13 17.06±1.15 NS
Egg production
(%) (6-24 wks) 83.17
b±1.1 78.52
c±1.7 79.19
c±1.7 94.26
a±1.2 P<0.001
Table 4 Selection differential, selection intensity for 6 weeks body weight (g) in seventh generation
Gen
oty
pe
Sex
Before selection After selection Selection
Differential
(S) (g)
Heritability
(h2)
Expected
response to
selection
(R) No. Aver. No. Aver.
Dh
ak ai M 90 150.9 40 158.3 7.4 0.432 3.19
F 96 161.4 40 175.2 13.8 0.391 5.39
Wh
ite
M 195 133.7 120 144.1 10.4 0.482 5.01
F 233 149.8 120 156.6 6.80 0.476 3.23
Bro
wn
M 165 127.3 120 130.9 3.60 0.451 1.62
F 176 134.5 120 140.3 5.8 0.454 2.63
Bla ck
M 92 129.1 40 134.5 5.4 0.401 2.16
F 88 137.3 40 143.3 6.0 0.455 2.73
Proceedings of the Annual Research Review Workshop 2018, BLRI, Savar, Dhaka 1341, October 09-10, 2018
9 Technical Session I
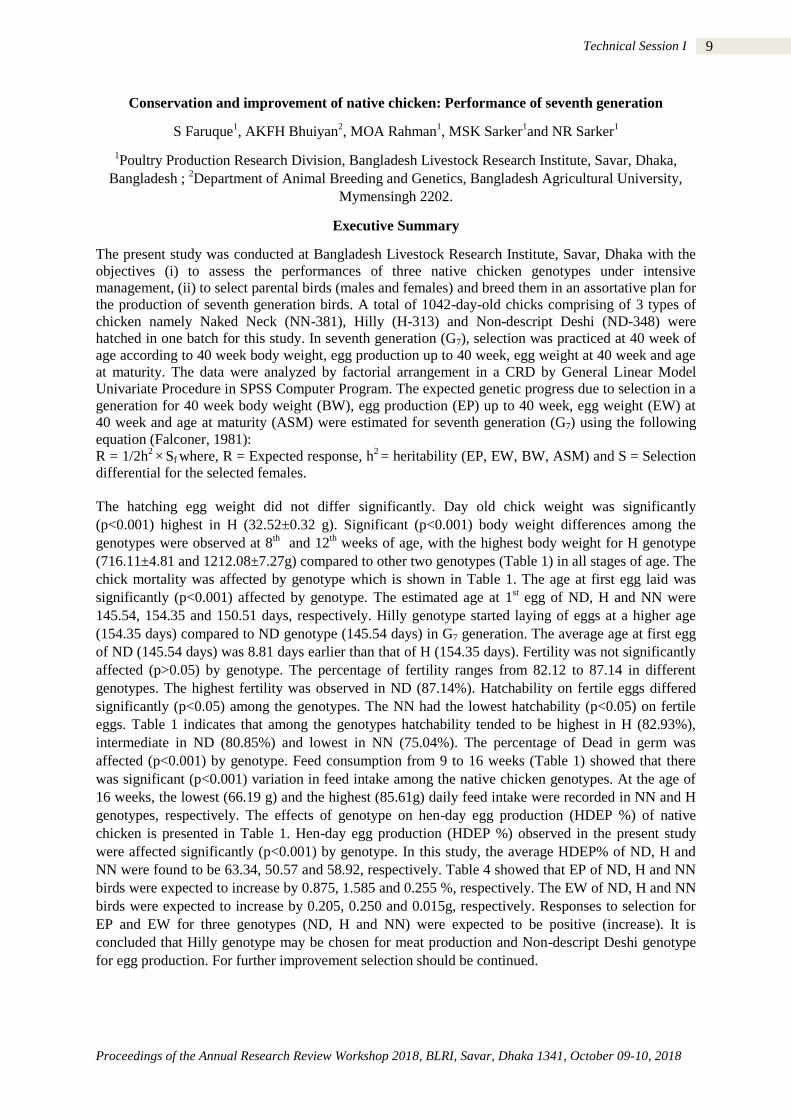
Conservation and improvement of native chicken: Performance of seventh generation
S Faruque1, AKFH Bhuiyan
2, MOA Rahman
1, MSK Sarker
1and NR Sarker
1
1Poultry Production Research Division, Bangladesh Livestock Research Institute, Savar, Dhaka,
Bangladesh ; 2Department of Animal Breeding and Genetics, Bangladesh Agricultural University,
Mymensingh 2202.
Executive Summary
The present study was conducted at Bangladesh Livestock Research Institute, Savar, Dhaka with the
objectives (i) to assess the performances of three native chicken genotypes under intensive
management, (ii) to select parental birds (males and females) and breed them in an assortative plan for
the production of seventh generation birds. A total of 1042-day-old chicks comprising of 3 types of
chicken namely Naked Neck (NN-381), Hilly (H-313) and Non-descript Deshi (ND-348) were
hatched in one batch for this study. In seventh generation (G7), selection was practiced at 40 week of
age according to 40 week body weight, egg production up to 40 week, egg weight at 40 week and age
at maturity. The data were analyzed by factorial arrangement in a CRD by General Linear Model
Univariate Procedure in SPSS Computer Program. The expected genetic progress due to selection in a
generation for 40 week body weight (BW), egg production (EP) up to 40 week, egg weight (EW) at
40 week and age at maturity (ASM) were estimated for seventh generation (G7) using the following
equation (Falconer, 1981):
R = 1/2h2 ×
Sf
where, R = Expected response, h
2 = heritability (EP, EW, BW, ASM) and S = Selection
differential for the selected females.
The hatching egg weight did not differ significantly. Day old chick weight was significantly
(p<0.001) highest in H (32.52±0.32 g). Significant (p<0.001) body weight differences among the
genotypes were observed at 8th and 12
th weeks of age, with the highest body weight for H genotype
(716.11±4.81 and 1212.08±7.27g) compared to other two genotypes (Table 1) in all stages of age. The
chick mortality was affected by genotype which is shown in Table 1. The age at first egg laid was
significantly (p<0.001) affected by genotype. The estimated age at 1st egg of ND, H and NN were
145.54, 154.35 and 150.51 days, respectively. Hilly genotype started laying of eggs at a higher age
(154.35 days) compared to ND genotype (145.54 days) in G7 generation. The average age at first egg
of ND (145.54 days) was 8.81 days earlier than that of H (154.35 days). Fertility was not significantly
affected (p>0.05) by genotype. The percentage of fertility ranges from 82.12 to 87.14 in different
genotypes. The highest fertility was observed in ND (87.14%). Hatchability on fertile eggs differed
significantly (p<0.05) among the genotypes. The NN had the lowest hatchability (p<0.05) on fertile
eggs. Table 1 indicates that among the genotypes hatchability tended to be highest in H (82.93%),
intermediate in ND (80.85%) and lowest in NN (75.04%). The percentage of Dead in germ was
affected (p<0.001) by genotype. Feed consumption from 9 to 16 weeks (Table 1) showed that there
was significant (p<0.001) variation in feed intake among the native chicken genotypes. At the age of
16 weeks, the lowest (66.19 g) and the highest (85.61g) daily feed intake were recorded in NN and H
genotypes, respectively. The effects of genotype on hen-day egg production (HDEP %) of native
chicken is presented in Table 1. Hen-day egg production (HDEP %) observed in the present study
were affected significantly (p<0.001) by genotype. In this study, the average HDEP% of ND, H and
NN were found to be 63.34, 50.57 and 58.92, respectively. Table 4 showed that EP of ND, H and NN
birds were expected to increase by 0.875, 1.585 and 0.255 %, respectively. The EW of ND, H and NN
birds were expected to increase by 0.205, 0.250 and 0.015g, respectively. Responses to selection for
EP and EW for three genotypes (ND, H and NN) were expected to be positive (increase). It is
concluded that Hilly genotype may be chosen for meat production and Non-descript Deshi genotype
for egg production. For further improvement selection should be continued.

Proceedings of the Annual Research Review Workshop 2018, BLRI, Savar, Dhaka 1341, October 09-10, 2018
10 Technical Session I
Table 1 Productive and reproductive performance of native chicken genotypes
Parameter Genotype (Mean ±SE) Level of
Sig. ND (Mean±SE) H (Mean±SE) NN (Mean±SE)
Hatching egg wt (g) 49.22±0.39 (400) 48.68±0.42 (370) 48.57±0.39 (450) p>0.05
DOC weight (g) 30.65b±0.29 (348) 32.52
a±0.32 (313) 32.31
a±0.31 (381) p<0.001
8th week weight (g) 618.20
b±5.24 (344) 716.11
a±4.81 (308) 603.54
b±4.94 (375) p<0.001
12th week weight (g) 991.94
b±7.91 (339) 1212.08
a±7.27(306) 981.05
b±7.47 (372) p<0.001
Age at first egg (d) 145.54c ±1.08 (146) 154.35
a±1.01 (147) 150.51
a±1.08 (148) p<0.001
Hen wt at maturity (d) 1370.1±13.2 (146) 1650.89±12.4 (147) 1233.3±13.1 (148) p<0.001
Fertility (%) 87.14±2.67 85.29±3.16 82.12±2.32 p>0.05
Hatchability on fertile eggs
(%)
80.85a±2.76 82.93
a±2.44 75.04
b±2.29 p<0.05
Dead in germ (%) 2.35b±0.23 3.532
a±0.41 3.90
a±0.70 p<0.001
Feed Intake(g/b/d)
(9-16 weeks)
68.18b±2.21 85.61
a±1.06 66.19
b±2.31 p<0.001
HDEP (%)
(22-28 weeks)
63.34a±1.69 50.57
c±1.75 58.92
b±1.99 p<0.001
Mortality (%) (0-8 week) 1.14 1.59 1.57 p>0.05
DOC= Day Old Chick; ND=Non-descript Deshi; H=Hilly; NN=Naked Neck; HDEP=Hen day egg
production; figures in the parentheses indicate the number of observations; least squares means
without a common superscript along the row within a factor differed significantly (p<0.05).
Table 2 Expected response to selection for EP (up to 40 weeks) and EW (at 40 weeks) in G7 of native
chicken
Gen
oty
pe
par
amet
er Before selection After selection Selection
Differential
(S)
Heritability
(h2)
Expected
Response to
Selection
®
No. Average No. Average
ND
EP 190 71.49 100 75.0 3.51 0.50±0.03 0.875
EW 190 45.09 100 45.94 0.85 0.49±0.03 0.205
H EP 149 54.00 100 60.48 6.48 0.49±0.03 1.585
EW 149 45.09 100 46.18 1.09 0.46±0.05 0.250
NN
EP 114 67.02 100 68.49 1.47 0.35±0.10 0.255
EW 114 44.88 100 44.94 0.06 0.49±0.03 0.015

Proceedings of the Annual Research Review Workshop 2018, BLRI, Savar, Dhaka 1341, October 09-10, 2018
11 Technical Session I
Conservation and improvement of native duck genotypes through selective breeding:
performance of 4th
generation and conservation of geese for meat production
MSK Sarker1*
, S Sultana1, MRA Sumon
1, S Faruque
1 and NR Sarker
1
1Poultry Production Research Division, Bangladesh Livestock Research Institute,
Savar, Dhaka 1341
*Correspondence: [email protected]
Executive Summary
Study 1.Conservation and improvement of native duck genotypes through selective breeding:
Performance of 4th
generation
An individual selection program has been taken at BLRI to improve the egg laying performances of
Desi White (Rupali) and White Breasted Black (Nageswari) of native duck genotypes. Productive and
reproductive potentialities of native ducks have already been evaluated from foundation to third
generations. Egg production performances of fourth generation (G4) were studied in this FY 2017-18.
In each generation selection were practiced on the basis of age at first lay, body weight at first lay, egg
production % (168-336 days) and egg weight. Adult ducks were housed in an open sided shed with
concrete floor and diet contained 17.5% Crude Protein and 2750 Kcal ME/kg DM during laying
period. Egg production data of individual duck of 4th generation were recorded. Selected male and
female were mated at the maximum ratio of 1: 5 by natural mating. Duck meat has a high consumer
demand due to its high meat quality traits with unique texture and flavor (Kim et al., 2012). Aiming to
develop a fast growing meat type mule duck by using different genotypes through 3-way crossing,
Pekin×Rupali (F1) were hatched and reared at duck shed for the production of mule ducks. Ducks
were individually weighed weekly to determine the mean population weight. Body weight, feed
consumption and feed conversion ratio (FCR) were measured weekly up to 12 wks of age. All
recorded data were analyzed by SAS and difference were determined by Duncan Multiple Range Test.
Table 1: Selection differential, intensity and selection responses of Rupali and Nageswari ducks
Genotype Traits Before
selection
After
selection
Selection
differential
selection
intensity
selection
responses
Rupali ASM (d) 155.9 153 -2.90 -0.44 -1.16
EW(g) 58.26 59.56 1.30 0.38 0.65
BW(g) 1672.71 1680.91 8.20 0.12 4.10
EP(%) 45.42 51.72 6.30 0.65 0.95
Nageswari ASM (d) 152 149.50 -2.5 -0.31 -1
EW(g) 56.97 57.68 0.71 0.22 0.35
BW(g) 1618.88 1607.68 -11.2 -0.17 -5.6
EP(%) 42.15 45.13 2.98 0.35 0.44 ASM-Age at sexual maturity, BW-Body weight, EW-Egg weight, EP-Egg production
According to selection criteria of fourth generation (G4), ASM was reduced more than 2 days in both
Rupali and Nageswari ducks but BW was increased in Rupali whereas decreased in Nageswari after
selection. Body weight was positively correlated with egg weight (Cheng et al., 1995) may be due to
the reason that EW was higher in Rupali than Nageswari. Egg production EP) percent was also
increased 2-6% in Nageswari and Rupali ducks. Selection intensity and selection responses in Rupali
for EP% were 0.65 and 0.95, and in Nageswari ducks were 0.35 and 0.44, respectively. Annual egg
production was recorded 221 for Rupali and 214 for Nageswari with the FCR for the laying ducks
were 3.52 and 3.71, respectively. According to Ukil and Islam, (1991) deshi ducks are poor producer
and lay only 60-80 eggs per bird per year against 250-300 eggs of exotic ones. In Chara and
Chemballi ducks of Kerala, the egg number up to 72 weeks of age as being 116 and 125 eggs
respectively. Egg numbers were higher in Rupali and Nageswari ducks than their results may be due
to selection responses of both duck genotypes.
Proceedings of the Annual Research Review Workshop 2018, BLRI, Savar, Dhaka 1341, October 09-10, 2018
12 Technical Session I
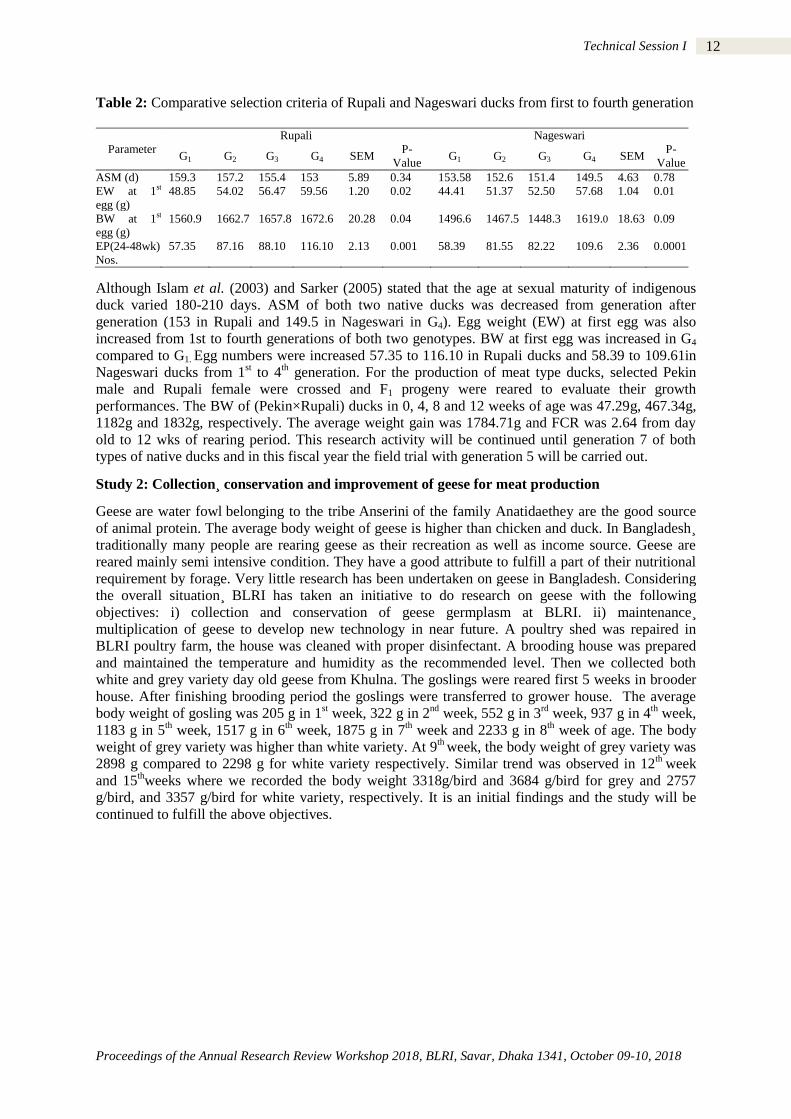
Table 2: Comparative selection criteria of Rupali and Nageswari ducks from first to fourth generation
Parameter
Rupali Nageswari
G1 G2 G3 G4 SEM P-
Value G1 G2 G3 G4 SEM
P-
Value
ASM (d) 159.3 157.2 155.4 153 5.89 0.34 153.58 152.6 151.4 149.5 4.63 0.78
EW at 1st
egg (g)
48.85 54.02 56.47 59.56 1.20 0.02 44.41 51.37 52.50 57.68 1.04 0.01
BW at 1st
egg (g)
1560.9 1662.7 1657.8 1672.6
20.28 0.04 1496.6 1467.5 1448.3 1619.0 18.63 0.09
EP(24-48wk)
Nos.
57.35 87.16 88.10 116.10 2.13 0.001 58.39 81.55 82.22 109.6 2.36 0.0001
Although Islam et al. (2003) and Sarker (2005) stated that the age at sexual maturity of indigenous
duck varied 180-210 days. ASM of both two native ducks was decreased from generation after
generation (153 in Rupali and 149.5 in Nageswari in G4). Egg weight (EW) at first egg was also
increased from 1st to fourth generations of both two genotypes. BW at first egg was increased in G4
compared to G1. Egg numbers were increased 57.35 to 116.10 in Rupali ducks and 58.39 to 109.61in
Nageswari ducks from 1st to 4
th generation. For the production of meat type ducks, selected Pekin
male and Rupali female were crossed and F1 progeny were reared to evaluate their growth
performances. The BW of (Pekin×Rupali) ducks in 0, 4, 8 and 12 weeks of age was 47.29g, 467.34g,
1182g and 1832g, respectively. The average weight gain was 1784.71g and FCR was 2.64 from day
old to 12 wks of rearing period. This research activity will be continued until generation 7 of both
types of native ducks and in this fiscal year the field trial with generation 5 will be carried out.
Study 2: Collection¸ conservation and improvement of geese for meat production
Geese are water fowl belonging to the tribe Anserini of the family Anatidaethey are the good source
of animal protein. The average body weight of geese is higher than chicken and duck. In Bangladesh¸
traditionally many people are rearing geese as their recreation as well as income source. Geese are
reared mainly semi intensive condition. They have a good attribute to fulfill a part of their nutritional
requirement by forage. Very little research has been undertaken on geese in Bangladesh. Considering
the overall situation ̧ BLRI has taken an initiative to do research on geese with the following
objectives: i) collection and conservation of geese germplasm at BLRI. ii) maintenance¸
multiplication of geese to develop new technology in near future. A poultry shed was repaired in
BLRI poultry farm, the house was cleaned with proper disinfectant. A brooding house was prepared
and maintained the temperature and humidity as the recommended level. Then we collected both
white and grey variety day old geese from Khulna. The goslings were reared first 5 weeks in brooder
house. After finishing brooding period the goslings were transferred to grower house. The average
body weight of gosling was 205 g in 1st week, 322 g in 2
nd week, 552 g in 3
rd week, 937 g in 4
th week,
1183 g in 5th week, 1517 g in 6
th week, 1875 g in 7
th week and 2233 g in 8
th week of age. The body
weight of grey variety was higher than white variety. At 9th
week, the body weight of grey variety was
2898 g compared to 2298 g for white variety respectively. Similar trend was observed in 12th
week
and 15thweeks where we recorded the body weight 3318g/bird and 3684 g/bird for grey and 2757
g/bird, and 3357 g/bird for white variety, respectively. It is an initial findings and the study will be
continued to fulfill the above objectives.

Proceedings of the Annual Research Review Workshop 2018, BLRI, Savar, Dhaka 1341, October 09-10, 2018
13 Technical Session I
Maintenance and conservation of pure lines and development of egg and meat type chicken
MR Hassan*, MAG Rabbani, S Sultana, S Faruque, MZ Ali, S Islam and NR Sarker
Poultry Production Research Division, Bangladesh Livestock Research Institute, Savar, Dhaka
*Corresponding author: [email protected]
Executive summary
Bangladesh is one of the densely populated countries in the world. During the last three decades
poultry farming in Bangladesh has transformed itself from backyard venture to dynamic agro
industry. Therefore, to meet its internal demand, Bangladesh imports parent and grandparents leading
to use huge foreign currency and thus increase production cost. Therefore, Bangladesh Livestock
Research Institute (BLRI) was undertaken a research program aiming to develop meat type chicken
considering the existing climatic condition of Bangladesh. Recently, BLRI has developed a meat type
chicken called Multi Colour Table Chicken (MCTC) using indigenous genetic resources through
selection and breeding. Day old chicks of MCTC are mixed feather color and have a similar
phenotypic appearance to that of native chickens. Therefore, to know the performance, meat quality,
antibody titre level, adaptability and economic returns of MCTC were conducted under on station and
on farm condition.
Study 1: Growth performance, carcass traits and economics of BLRI developed meat type
chicken
In experiment 1, a total of 1020 day old chicks were allotted in 30 pens (34 chicks per pen, stocking
density 15 birds/) to know the performance and carcass characteristics. The birds were feed with the
starter (1-21 d), grower (22-35 d) and finisher (36-56 d) diet. Body weight (BW), weight gain (WG),
feed intakes (FI) and feed conversion ratio (FCR) were measured weekly. In results, the average day-
old weight was found 39.46 grams. During 0-56 days, average BW, WG, FI and FCR were found
980.50 g, 940.50 g, 2269.48 g and 2.296 respectively. Average mortality was found 1.50 %. At 8
weeks of age, average dressing percentage, relative breast, thigh and drumstick weight percentage
were found 72.37 %, 13.55, 8.57 and 15.47 % respectively. In meat qualities, cooking and drip loss
percentages were found 12.89 and 5.68 respectively. In meat color, average lightness (L*), redness
(a*) and yellowness (b*) were found 46.25, 2.69 and 7.78 respectively. The average pH of breast
muscle was found 5.95.
Study 2: Comparison of growth performance, carcass characteristics and meat quality of
different meat type chicken
To compare the performance with existing meat type chicken, experiment 2 was undertaken using 3
gentic group (Hilly, MCTC and Sonali) of chicken, a total of 540 day old chicks (180 chicks in each
genetic group) were allotted to 18 pens. Each genetic group was replicated 6 times having 30 birds in
each pen. All other management was followed according to experiment 1. Blood was collected and
Hemagglutination Inhibition (HI) antibody titers of the sera samples were measured before and after
vaccination based on the Sabrin et al. (2012). At 8 weeks of age, 8 birds per treatments were
slaughtered and breast meat was collected and cooked under similar temperature and period using 1%
salt. Cooked meat was cut in cubes (2x2 cm) and three cubes per treatment were placed into
individual cup. The sensory panel consisted of 10 experienced and trained participants. In fried
chicken sample, before the roasting the chickens meat were cut in similar size and seasoned with a
mixture of salt, onion, pepper, garlic, ginger and coated with flour. The roasting was done with an
electric roaster rented from a professional manufacturer of roast meat. The thermometer and timer of
the roaster were used to set the similar cooking temperature and time for each treatment. Each
parameter set up on a Hedonic scale (1 extremely dislike) to 9 (like extremely). From 0-8 weeks, both
body weight and weight gain were significantly higher in MCTC than that of Sonali. But feed intake
and FCR were not influenced among the treatments. In a sensory evaluation test, there is no
significant variation of tenderness, chewiness, juiciness, fineness and mouth coating of meat. But
significantly higher score on flavor, color and taste were found in hilly chicken meat than that of
sonali chicken. But, no differences were found between Hilly and MCTC chicken meat. Before
vaccination, HI antibody titre level was significantly lower in Sonali than that of MCTC and hilly

Proceedings of the Annual Research Review Workshop 2018, BLRI, Savar, Dhaka 1341, October 09-10, 2018
14 Technical Session I
chicken genotypes (P<0.05). After vaccination of 7 and 14 days later, titre level did not significantly
different among the treatments.
Table 1: Comparative performances of different meat type chicken
Parameters Hilly MCTC Sonali SEM P value
Body weight (g)
At 21 d 191.15ab
254.50a 176.12
b 10.47 0.001
At 35 d 426.20b 502.50
a 380.76
b 18.90 0.0001
At 56 d 778.35b 980.50
a 707.80
c 32.17 0.001
Weight gain (g)
0-21 d 157.97b 215.07
a 142.82
b 9.76 0.018
22-35 d 235.05ab
248.00a 204.64
b 9.34 0.021
36-56 d 352.15b 478.00
a 327.04
b 16.99 0.013
0-56 d 745.18b 941.07
a 674.50
c 31.45 0.035
Feed intake (g)
0-21 d 351.03 386.5 287.51 14.11 0.079
22-35 d 622.54 564.71 422.68 37.39 0.098
36-56 d 1076.71 1283.06 1182.37 38.58 0.125
0-56 d 2050.28ab
2234.27a 1892.56
b 56.90 0.043
FCR
0-21 d 2.222 1.797 2.009 0.06 0.087
22-35 d 2.648a 2.277
c 2.065
b 0.11 0.038
36-56 d 3.057 2.684 3.615 0.10 0.279
0-56 d 2.751a 2.374
b 2.805
a 0.07 0.035
In experiment 3, a total of 2580 day
old MCTC chicks were distributed at
three different regions (Barisal 900
chicks, Khulna 1180 chicks and Pabna
500 chicks) of the country. Birds were
reared under farmers existing condition.
All data were recorded according to the
supplied schedule. To examine the
economic viability of MCTC farming,
cost and returns were measured
according to Singh and Saran (2007).
The Straight Line Method was used to
compute the depreciation. All data were
analyzed by SAS and differences were
determined by Duncan Multiple Range
Test. At 8 weeks of age, average body
weight was found higher in Barisal
(1030.12 g) and lower in Pabna (966.09
g) district. Therefore, Feed Intake (FI) and FCR were not influenced among the location but better
FCR was found in Barisal than that of other district. In economic evaluation, the total cost and gross
return were found 164124.50 and 200566.20 taka respectively. So, the net returns were found
36441.73 taka within 8 weeks for one unit of 1000 MCTC meat type chicken rearing. Therefore, the
input output ratio was found 1:1.222. The highest returns were found in Barisal than that of other
region due to the variation of chicken market price. Based on the on station and on farm trial, results
indicated that production performance of MCTC is consistent, adaptable and profitable under farmer‟s
condition. Therefore, MCTC chicken may be suitable followed by Hilly and Sonali for meat
production. Further follow up experiment is needed to know the performance under different
extensive farming condition of Bangladesh.
Figure 1 Effect of vaccination on the antibody titre
level of meat type chicken
0
1
2
3
4
5
6
7
Before
vaccination
Vaccination
after 7 days
Vaccination
after 14 days
Hilly MCTC Sonali
HI
an
tigen
(lo
g2 b
ase
)
a
b
a

Session II
LIVESTOCK AND POULTRY DISEASES
AND HEALTH

Proceedings of the Annual Research Review Workshop 2018, BLRI, Savar, Dhaka 1341, October 09-10, 2018
15 Technical Session II
Phenotypic and genotypic profiling of antimicrobial resistance (AMR) Enterococcus
spp. in finisher livestock and poultry in Bangladesh
MA Samad1, MS Sagor
1, MR Karim
1, MS Hossain
1, MM Asheak
1, MZ Ali
1, AM Swapnil
2 and M
Giasuddin1
1Animal Health Research Division, Bangladesh Livestock Research Institute, Savar, Dhaka 1341;
2Sir
Salimullah Medical College, Dhaka
Executive summary
Enterococcus spp. has been emerged as leading causes of hospital infection, surgical sepsis, and
urinary tract infection (UTI) due to their harsh environment tolerance and intrinsic antimicrobial
resistance. This study focused on determination of antimicrobial sensitivity and virulence
characteristics of Enterococcus faecalis and Enterococcus faecium isolated from different finisher
poultry, livestock and meat in Bangladesh. A total of 352 swab or meat samples were collected from
different poultry and livestock origins including 230 cloacal swabs from poultry (n=136), cattle
(n=35), goat (n=29), camel (n=30) and 122 meat samples comprises of chicken meat (n=60), beef
(n=32) and mutton (n=30). Samples were primarily screened for enterococci using 6.5% NaCl
Mueller hinton broth and Kanamycin aesculin azide agar. Initial selective culture positive samples
were selected as presumptive enterococci which were then confirmed using E. faecalis and E. faecium
specific primer with conventional PCR. Overall 40.1% (n=141; 95%CI 35-45.1%) sample were
Enterococcus spp. positive which included 47.8% poultry (n=65; 95%CI 39.4-56.1%), 25.7% cattle
(n=9; 95%CI 11.8-39.6%), 24.1% goat (n=7; 95%CI 9.5-38.7%), 46.7% camel (n=14; 95%CI 31.7-
61.6%), 30% chicken meat (n=18; 95%CI 18.9-41%), 59.4% beef (n=19; 95%CI 43.2-75.4%) and
30% mutton (n=9; 95%CI 14.4-45.5%). A total of 141 Enterococcus spp. were isolated from 141
positive samples where prevalence of E. faecalis (74.5%; n=105) was predominant than E. faecium
(18.4%; n=26) and overall co-prevalence of both enterococci species was 2.8% (n=10; 95%CI 1.1-
4.5%) among all the tested samples. Significantly higher prevalence (p<0.05) of enterococci was
observed in poultry (47.8%; n=65; 95%CI 39.4-56.1%) than livestock (31.9%; n=30; 95%CI 23-
40.7%). The prevalence of E. faecalis was also significantly higher (p<0.01) in poultry (40.4%; n=55;
95%CI 32.1-48.6%) than chicken meat (23.4%; n=22; 95%CI 15.3-31.4%). But when the comparison
was made within meat samples, the prevalence of enterococci in livestock meat was found higher
(41.9%; n=26; 95%CI 30.2-53.5%) than poultry meat (20%; n=12; 95%CI 10.3-29.6%) although the
variation was statistically non-significant (p=0.09).
As 12 individual antibiotics from 11 different antibiotic classes were tested against 117 isolates; a
total of 107 (91.5%) isolates showed multidrug resistance (MDR) characteristics (non-susceptible to
three or more antibiotics classes). The isolates that showed resistance against vancomycin (n=18) in
phenotypic assay were subjected to test genotypic criteria. Plasmid mediated mobile gene vanA and
vanB commonly associated with vancomycin resistance (VR) were observed in 44.4% (n=8/18,
95%CI 21.4-67.3%) and 16.7% (n=3/18, 95%CI 0-33.9%) vancomycin resistance enterococci (VRE)
isolates respectively whereas a single isolate (n=1/18) had both the genes. Some other resistance
genes associated with VRE like vanC1 (n=5/18, 95%CI 7.1-48.4%) and vanC2/3 (n=9/18,95%CI 27-
73%) were also observed. High prevalence of VRE associated gene was found in E. faecalis isolates
16.3% (n=14/86, 95% CI 8.4-24.1%), among them 50% (n=7/14, 95% CI 23.8-76.1%) VR E. faecalis
found to have vanA gene. The virulence factor gelatinase (gelE) was observed in 42 MDR isolates
(39.3%, 95%CI 24.6-54%); the aggregation factor (asa1) in 20 MDR isolates (18.7%, 95%CI 6.6-
38.9%) and the sex pheromones (cpd) in 35 MDR isolates (32.7.0%, 95%CI 20.6-44.8). The factors
including cytolysin, surface protein, hyaluronidase, collagen-binding protein, transmembrane protein,
endocarditis specific antigen, and aggregation protein were not observed among the MDR isolates.
The resistance of E. faecalis and E. faecium to multiple antibiotics especially to vancomycin and the
presence of virulence factors will allow the bacteria to survive and proliferate in patients receiving
multiple antimicrobials and cause super-infection. So the presence of this vulnerable opportunistic
pathogen with virulence criteria in finisher poultry and livestock origin is an alarming concern for
public health in Bangladesh.

Proceedings of the Annual Research Review Workshop 2018, BLRI, Savar, Dhaka 1341, October 09-10, 2018
16 Technical Session II
Development and validation of a low-cost mastitis detection kit
MH Kabir1, M Ershaduzzaman
2, M Giasuddin
3, MNI Nazir
4, MA Yousuf
3, R Khatun
2, MY Ali
1
1Bangladesh Livestock Research Institute, Regional Station, Baghabari, Sirajganj,
2System Research
Division, 3Animal Health Division, Bangladesh Livestock Research Institute, Savar, Dhaka 1341;
4Bangladesh Agricultural University, Mymensingh 2202
Mastitis is the most costly and devastating disease condition in terms of economic losses from
reduced milk production, treatment costs, increased labour, milk withheld following treatment, death
and premature culling occurring throughout the world. Depending upon the climatic condition, animal
species and disease management practices, etiological agents may vary place to place and case to case.
That is the region that behind the isolation of largest number of pathogens in a single disease i.e. more
than 135 is from the cases of mastitis. Subclinical mastitis is a serious problem in dairy industries
because there is no gross changes occur in udder or glandular tissues and acts as a continuous source
of infection to herd mates. Thus the control and prevention of mastitis is a challenge and despite of the
early diagnosis it is a cause behind the severe economic losses to dairy industry. Therefore, the
present research work was undertaken with the following objectives- study of validity and
reproducibility of BLRI developed low cost, rapid screening of mastitis test kit (BMT kit) and to
recheck the efficacy of the kit comparison with CMT kit on the basis of somatic cell count. The
research activities were concern to reproduce the mastitis detection kit and recheck its validity,
screening the milk samples to detect sub clinical mastitis through the kit extensively and establish the
kit as a technology and use in field as a part of mastitis control package. The present study was
conducted at Shahjadpur, Sirajganj, Bangladesh during July 2017 to June 2018 under BLRI Regional
Station Baghabari, Sirajganj. We reproduced the BMT kit extensively and regular testing in detecting
subclinical mastitis in dairy cows in the study area. BMT kit is cheap, easy and farmers friendly and
its reagents are locally available. It has five categories of result like CMT (Negative, Trace, Weak,
Distict and Strong). It provides the producer with simple and rapid method for the detection of
elevated somatic cell counts (SCC) in mammary glands suspected of having mastitis. This
inexpensive cow-side test requires no sophisticated equipment and is intended in part for use with
good mastitis management practices. In operational procedure of the test in brief is 2 ml of milk is
taken in a test paddle and add equal amount of the working solution and rotated the paddle. Result
will come out within 10-20 secondy. The kit could be used regularly (eg. every two weeks) in
individual quarters within your entire herd for subclinical mastitis. It can also be used to quantify SCC
in composite and bulk tank samples. The BMT reagent reacts with leucocytes (Somatic cells) that are
elevated during mastitis. The degree of gel formation was proportional to the increasing numbers of
leucocytes present during mammary gland inflammation, characteristics of mastitis. Greater gel
formation corresponds to a higher BMT score. BMT results recorded for -(Negative) while mixture
remains liquid with no thickening; T(trace), slight thickening which disappears with paddle
movement; 1 (Weak), distinct thickening but no gel formation; 2 (Districts), mixture thickens
immediately moving to centre of cup; 3(Strong) distinct gel formation which tends to form a mass.
The mixing working solution of the kit remains unchanged within 2 years with in normal
environmental temperature and humidity. The cost per test of milk (including reagents and materials)
of the kit is 1.00 (One) Tk. The working solution contains three elements and their amount in per litter
is Sodium carbonate 10 gm, Sodium laryl ethyl sulphate 7gm and Bromocresol purple 0.1gm. A total
400 quarter milk samples from 100 crossbred dairy cows were subjected to BLRI mastitis test (BMT)
to justify its efficacy to validate as a individual test comparison with California mastitis test (CMT) in
detecting sub clinical mastitis on the basis of somatic cell count (SCC) through direct microscopic
count (DMC). CMT score 1+ was least scale of positivity for CMT and BMT and ≥2 lac cell/ml was
scale of positivity in detecting mastitis. Milk samples positive by CMT and BMT were 179 and 175.
All samples were subjected to somatic cell count and 222 samples were positive by DMC. The
percentage accuracy of CMT and BMT were 76.75 % & 75.75 %; sensitivity 69.36% & 67.56 %;
specificity 85.95 % & 85.85 %; positive predictive value 86.03 % & 85.7 %; negative predictive value
69.23 % & 68 % respectively. P value 0.001 is both for CMT and BMT and in case of comparison
between them P value is 0.776. CMT and BMT has no difference in sensitivity. Both tests are
sensitive at SCC count more than 2 lac/ml. There is no difference in sensitivity among the tests at

Proceedings of the Annual Research Review Workshop 2018, BLRI, Savar, Dhaka 1341, October 09-10, 2018
17 Technical Session II
SCC level and it were more or less than 2 lacs/ ml. On the another study of 150 milk samples SCCs
determined by DMC and DCC (De Laval cell counter®) categorized by CMT and BMT scores
including average result. Average SCCs (cells/ml) determined by DCC (85.50 X 10³, 345.20 X 10
3,
675.50 X 10³, 1357.50 X 10
3, 2449.60 X 10
3) and DMC (55.50 X 10
3, 250.50 X 10
3, 550.50 X 10
3,
1250.0 X 103, 3944.50 X 10
3) respectively were mostly corresponded to the SCC range in each CMT
and BMT score. BMT is reliable and accurate mastitis diagnostic test. It could be an independent,
cheap, farmers friendly, country made and alternative method besides CMT and showed almost same
accuracy, sensitivity, specificity with showed categorizing scores like CMT

Proceedings of the Annual Research Review Workshop 2018, BLRI, Savar, Dhaka 1341, October 09-10, 2018
18 Technical Session II
Development of Peste des Petits Ruminants (PPR) free zone in selected areas of
Bangladesh to meet global control strategy
M Giasuddin1, MS Mahmud
1, E Islam
1, MA Yousuf
2, MA Samad
2, MR Karim
2, MZ Ali
2, MZ
Hassan2, MA Islam
1
1Research on FMD and PPR in Bangladesh Project,
2Animal Health Research Division, Bangladesh
Livestock Research Institute, Savar, Dhaka 1341
Executive summary
Peste des petits ruminants (PPR), also known as ‘goat plague’, is a viral disease of goats and sheep
characterized by fever, sores in the mouth, diarrhea, pneumonia, and sometimes death. The project
has the following objectives: to conduct surveillance and epidemiological studies to determine
present status of PPR and PPR like diseases, risk factors for the spread and persistence of the
disease, to undertake sero-monitoring activities (post vaccination), to determine the level of
conferred immunity; to enhance the knowledge of small ruminant farmers, public and private
technical personnel on PPR recognition, prevention and control through awareness campaigns; to
get an in depth understanding of problems and prospects of implementing such control program.
Sixteen different villages in Magura union under Jicorgacha upazilza of Jessore district were
selected as treatment villages and one village for control. This development project was conducted
at Magura union of Jhikargacha upazila under Jessore district. PPR prevention and control is based
on four different stages at Magura union of Jikorghacha upazila. As OIE guideline, there are four
stages that is correspond to a combination of decreasing levels of epidemiological risk and
increasing levels of PPR prevention and control. The Stages range from Stage 1 – where the
epidemiological situation is being assessed, to Stage 4 – when the country can provide evidence
that there is no virus circulation either at zonal or national level, and is ready to apply for the OIE
official country status of PPR freedom (Fig. 1).
Figure 1. The Progressive Step-wise approach for the prevention and control of PPR.
For PPR Control and Eradication, Magura union has been achieved stage two in June 2018.
Epidemiological studies were done for PPR and PPR like diseases. Mass vaccination program was
carried out in all goats (3+ months of age) of 16 treatment villages where around app.15,000 goats
were vaccinated against PPR. Sera from blood samples were collected to determine antibody against
PPR after 2 months of post vaccination and tested with cELISA kit to assess the titer levels. Sero-
positive goats in the treatment villages was 100% and in control Villages 28%. Enhanced capacities
have been developed of LRI, BLRI and DLS on vaccine quality and field level PPR disease control
intervention. Now we are situated stage three in our selected area following OIE guideline. Improved
knowledge and awareness of farmers and technical staff (public and private) has been taken on PPR
recognition, prevention and control. Developed model PPR Free Zone technology are being
contributing towards a national PPR Strategic Control and Eradication Plan.

Proceedings of the Annual Research Review Workshop 2018, BLRI, Savar, Dhaka 1341, October 09-10, 2018
19 Technical Session II
With the effective vaccines, diagnostics and knowledge of PPR now available to us, as well as the
successful experience of eliminating rinderpest, Bangladesh can achieve the goal of controlling PPR.
This, in turn, will open the door for the eradication of PPR from Bangladesh, as well as from other
South Asian countries. The successful eradication of rinderpest in Bangladesh, thanks to the efforts of
all the stakeholders, as well as the international community, should be celebrated. The successful
global eradication of rinderpest shows that a similar programme could now be followed to globally
eradicate PPR.

Proceedings of the Annual Research Review Workshop 2018, BLRI, Savar, Dhaka 1341, October 09-10, 2018
20 Technical Session II
Development of FMD free zone in Bangladesh as per OIE guidelines
M Giasuddin1, MS Mahmud
1, E Islam
1, MA Samad
2, MR Karim
2, MZ Ali
2, MH Kabir
3, MZ Hassan
2,
S Islam4, MA Islam
1
1Research on FMD and PPR in Bangladesh project,
2Animal Health Research Division,
3 Regional Station, Baghabari, Sirajgong,
4Socioeconomic Research Division, Bangladesh
Livestock Research Institute, Savar, Dhaka 1341
Executive summary
FMD, a highly contagious transboundary animal disease, can cripple a country's economy due to
reductions in animal productivity and high costs associated with control and vaccination efforts. It
mainly affects countries in Africa, Latin America and southern Asia. The Food and Agriculture
Organization (FAO) of the United Nations in collaboration with the European Commission for the
control of Foot-and-Mouth Disease (EuFMD) and the World Organisation for Animal Health (OIE),
have made it their mission to implement the Progressive Control Pathway (PCP) over the past six
years with the aim of eradicating FMD at a global level. The aim of the research work was to establish
a FMD free zone in a selected area of ‘Pabna-Sirajgonj’ of Bangladesh as per OIE guideline.
Selection of an area/zone in ‘Pabna-Sirajgonj’ which is clearly separated from adjacent
district/upazila with a physical or geographical barrier. In selected areas of Pabna-Sirajgonj,
Progressive Control Pathway (PCP) have been implemented that can enable countries to progressively
increase the level of FMD control to the point where an application for OIE-endorsement of a national
control programme vaccination or official freedom from FMD with or without vaccination. The PCP
is a step-by-step approach to control FMD in selected areas where the disease is endemic. The PCP
stages are summarized in Fig. 1 and described below.
Figure 1. The step of Progressive Control Pathway (PCP) for FMD free zone.
The ‘Stage Focus’ represents the usual overall objective or aim of the stage and the numbered points
outline the ‘key outcomes’ necessary to achieve that aim. This helps to endorse individual countries'
requests for further national and international investment to control FMD. Countries where the disease
is endemic with no reliable information on the disease status are classified as stage 0. A
comprehensive study of the epidemiology of FMD is required to move from stage 0 to 1 (PCP-FMD
Principles and Applications, 2011). Stage 1 assists in identifying appropriate control options.
Countries in stage 1 are in the process of developing their control strategies in at least one animal
production sector based on a comprehensive assessment of the epidemiology and control options.
Progression from stage 1 to 2 requires a risk based FMD control plan. Stage 2 involves the
implementation of the chosen policy. Countries in stage 2 implement risk-based FMD control strategy
that aims to reduce disease in at least one animal production sector. In order to move from stage 2 to
3, an aggressive strategy to eliminate FMD needs to be developed. Countries in stage 3 should adopt a
Proceedings of the Annual Research Review Workshop 2018, BLRI, Savar, Dhaka 1341, October 09-10, 2018
21 Technical Session II
control plan to progressively reduce/eliminate virus circulation in at least one region/production
system (PCP-FMD Principles and Applications, 2011). Accoding to PCP-FMD road map for SAARC
countries, the selected areas of Pabna-Sirajgonj is supposed to achieve stage 3 in 2018, provided that
epidemiological studies, risk identification, and fixed risk-based control plan were completed. FMD
control measures had been applied namely, improved biosecurity, active monitoring for FMDV
circulation, movement control, deworming, vaccination, sero-survillence, quarantine, volunteer
development, training etc. To develop immunity, animal was vaccinated regularly with trivalent FMD
vaccine at 4-6 months of age and maintained booster dose at 6 months interval. Blood samples were
collected for sera to identify antibody by ELISA during pre and post vaccination. The protection level
of the antibody against FMD was 100 % in selected area of Pabna district and Sirajgonj district.
According to OIE guideline, we are now staying in stage two at the selected upazilas (Bera, Sathia
and Sujanagar) of Pabna district and Alokdiar village of Sirajgonj district. Implement risk-based
control strategy such that the impact of FMD was reduced in the zones and control strategy had been
taken to eliminate circulation of FMDV to ensure no endemic FMD in domestic livestock.

Proceedings of the Annual Research Review Workshop 2018, BLRI, Savar, Dhaka 1341, October 09-10, 2018
22 Technical Session II
Prevalence of different dairy cattle diseases in selected dairy areas and farms of Pabna
and Sirajganj districts of Bangladesh
MAI Talukder1, SM Rahman
2*, MAH Miah
2, M Shahjahan
2, MY Ali
2, MM Billah
2, S Munira
2, M
Salahuddin2 and MR Habib
1
1Goat and Sheep Production Research Division, Bangladesh Livestock Research Institute, Savar,
Dhaka 1341; 2Baghabari Regional Station, Bangladesh Livestock Research Institute, Sirajganj 6770
Executive summary
Animal health is one of the many factors that conspire against productivity of cattle (Miranda,
2014).The present study was designed to have a comprehensive epidemiological data of the
circulating diseases in Pabna cattle at the nucleus breeding herd (NBH) and the community of dairy
development research project (DDRP). A total of 965 clinical cases of cattle of different breed and sex
were diagnosed during the period from July, 2017 to June, 2018. Prevalence of different dairy cattle
diseases in community and on station (the NBH) are presented in Table.1. The result of a paired t-test
suggests that there is no significant difference in the pattern of disease occurrence in the two separate
populations may be because in both the cattle population genotype is same (mostly local Pabna
variety).
Table 1. Comparative prevelance of different dairy cattle diseases between community and the NBH Disease
category
Name of the
disease
No. of identified cases Prevalence% by cases t- test Prevalence % by population t-test
Community On station Community On station Community On station
Aspiration
pneumonia
2 0 0.21 0 0.702 0.40 0 0.528
General
disorder
Non-specific
fever
32 12 3.41 7.27 6.32 17.14
General
debility(def)
45 7 4.80 4.24 8.89 10.00
Parasitic Blood protozoa 11 2 1.17 1.21 0.56 2.17 2.86 0.41
Endo-parasite 147 36 15.67 21.82 29.05 51.43
Hump sore 2 14 0.21 8.48 0.40 20.00
Ectoparasite 27 4 2.88 2.42 5.34 5.71
Maggot 25 5 2.67 3.03 4.94 7.14
Viral FMD 258 0 27.51 0.00 0.29 50.99 0.00 0.293
Bovine
Ephemeral fever
31 1 3.30 0.61 6.13 1.43
Wart 7 1 0.75 0.61 1.38 1.43
Rabies 2 0 0.21 0.00 0.40 0.00
Bacterial Anthrax 3 0 0.32 0.00 0.22 0.59 0.00 0.183
HS 5 0 0.53 0.00 0.99 0.00
Dermatophilosis 9 9 0.96 5.45 1.78 12.86
Conjuntivitis 14 8 1.49 4.85 2.77 11.43
Pneumonia 8 0 0.85 0.00 1.58 0.00
Mastitis 17 2 1.81 1.21 3.36 2.86
Black Quarder 4 0 0.43 0.00 0.79 0.00
Tetanus 1 0 0.11 0.00 0.20 0.00
Foot rot 5 25 0.53 15.15 0.99 35.71
Arthritis 6 1 0.64 0.61 1.19 1.43
Digestive Anorexia 23 3 2.45 1.82 0.37 4.55 4.29 0.515
Ruminal acidosis 2 0 0.21 0.00 0.40 0.00
Constipation 1 3 0.11 1.82 0.20 4.29
Simple
indigestion
1 0 0.11 0.00 0.20 0.00
Non-specific
Diarrhoea
69 5 7.36 3.03 13.64 7.14
Blot 35 0 3.73 0.00 6.92 0.00
Metabolic Milk fever 10 0 1.07 0.00 0.99 1.98 0.00 0.839
Grass tetany 3 0 0.32 0.00 0.59 0.00
Weak calf
syndrome
15 5 1.60 3.03 2.96 7.14
Reproductive Retained
Placenta
1 9 0.11 5.45 0.80 0.20 12.86 0.998
UTIs 3 1 0.32 0.61 0.59 1.43
Repeat breeding 23 1 2.45 0.61 4.55 1.43
Post-partum
anoestrus
73 2 7.78 1.21 14.43 2.86
Prolapse 1 1 0.11 0.61 0.20 1.43
Surgical Abscess 2 1 0.21 0.61 0.17 0.40 1.43 0.148
Navel-ill 5 2 0.53 1.21 0.99 2.86
UPF 0 4 0.00 2.42 0.00 5.71
Hernia 2 0 0.21 0.00 0.40 0.00
Others Allergic reaction 7 1 0.75 0.61 __ 1.38 1.43 __
Congenital def. 1 0 0.11 0 0.20 0
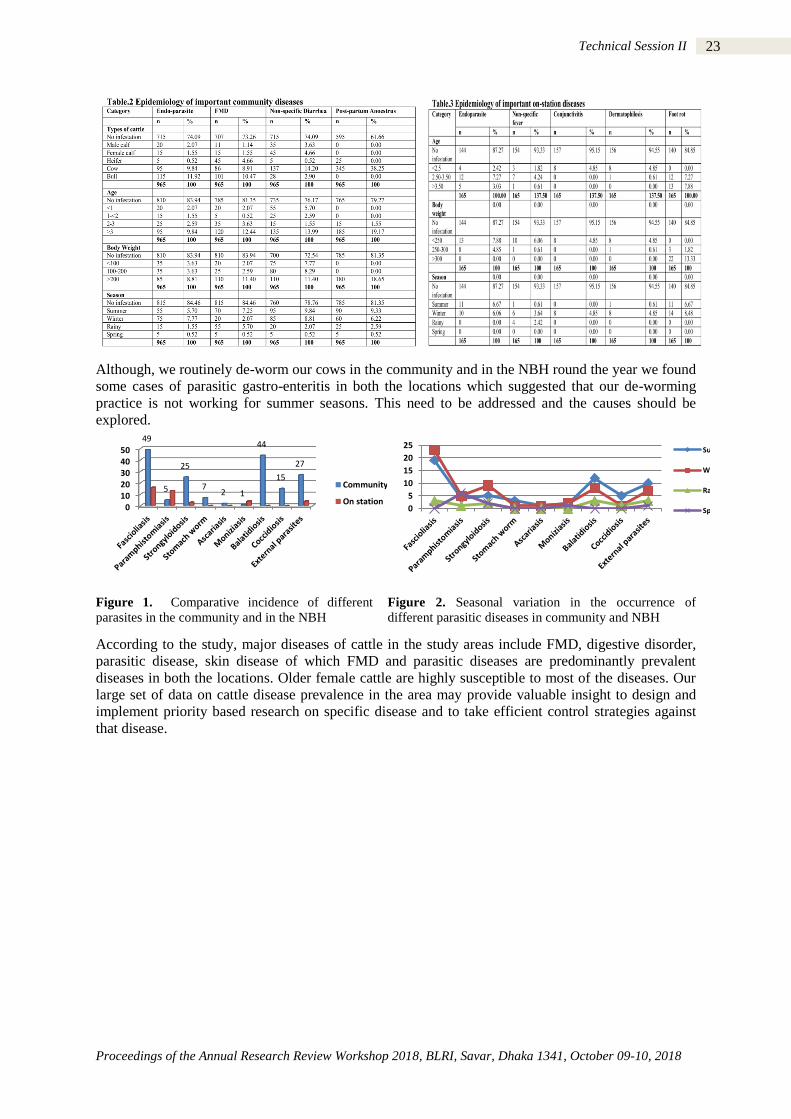
Proceedings of the Annual Research Review Workshop 2018, BLRI, Savar, Dhaka 1341, October 09-10, 2018
23 Technical Session II
Although, we routinely de-worm our cows in the community and in the NBH round the year we found
some cases of parasitic gastro-enteritis in both the locations which suggested that our de-worming
practice is not working for summer seasons. This need to be addressed and the causes should be
explored.
Figure 1. Comparative incidence of different
parasites in the community and in the NBH
Figure 2. Seasonal variation in the occurrence of
different parasitic diseases in community and NBH
According to the study, major diseases of cattle in the study areas include FMD, digestive disorder,
parasitic disease, skin disease of which FMD and parasitic diseases are predominantly prevalent
diseases in both the locations. Older female cattle are highly susceptible to most of the diseases. Our
large set of data on cattle disease prevalence in the area may provide valuable insight to design and
implement priority based research on specific disease and to take efficient control strategies against
that disease.
01020304050
49
5
25
7 2 1
44
15
27
Community
On station0
5
10
15
20
25Summer
Winter
Rainny
Spring
Proceedings of the Annual Research Review Workshop 2018, BLRI, Savar, Dhaka 1341, October 09-10, 2018
24 Technical Session II
Tick borne blood protozoan diseases of farm based and slaughter house animal
MZ Hassan1, M Giasuddin
1, M Hasan
1, MM Rahman
2, M Ershaduzzaman
2, MH Kabir
3, A Hossen
3,
and MAH Noor Ali Khan4
1Animal Health Research Division,
2Conservation and Improvement of Native Sheep through
Community & Commercial Farming Project, 3System Research Division, Bangladesh Livestock
Research Institute, 4Department of Pathology, Bangladesh Agricultural University.
Executive summary
Babesiosis, Anaplasmosis and Theileriasis are the most important economic tick borne blood
protozoan diseases (TBDs) in Bangladesh. A prevalence study on blood protozoan diseases was
conducted on high yielding crossbred (50% to above), indigenous cattle and exotic sheep, particularly
in selected areas of Sirajganj & Naikhongchari and organized cattle & sheep farm of Savar upazila. A
total 750 blood samples were collected randomly with the information on topography, season, age
and sex with a pretested questionnaire in which 300 from dairy farm (Savar), 300 from milk vita
Bathan area (Baghabari), 50 from native cattle (Sirajganj), 50 from hilly areas (Naikhongchari) and
50 from exotic sheep (Soffolk, Perandale, Dorper and Dhamara) farm (BLRI). The collected blood
samples were examined by Giemsa's stained blood smear (GMS) method (OIE, FAO) and
confirmatory diagnosis through Polymerase Chain Reaction (PCR). In case of Babesia spp. short and
long loop formation was found at the periphery of RBC (Piroplasmosis). Whereas, in case of
Anaplasma marginale and Anaplasma central pointed round dot at periphery of RBC and inside of
RBC were found respectfully. In case of Theileria spp, RBC was slight triangle in shape and ring
formation was found (annular), sometimes oval, round, dot or rod shape was found. Clinical sign had
shown that high fever (105-1070F), complete off feeding, respiratory distress, continual panting, rapid
breathing, sometime diarrhea, sometime bloody diarrhea, coffee color urine at last stage of in
Babesiosis. Post mortem lesion shown that epicardial and endocardial petechial haemorrhage,
haemorrhagic spleenomegaly, highly congested and foamy lung, opaque and frazile liver, sometimes
hepatomegaly and ruminal PH>4.
In clinical investigation prevalence of TBDs was 80% (n=240) in dairy farm, 40% (n=120) in Bathan
area, 20% (n=10) in native cattle, 35% (n=18) in hilly cattle and 100% (n=50) in exotic sheep. The
overall prevalence of TBDs was 58.40% (n=438) in cattle in which Anaplasma spp was 43% (n=188),
Babesia spp 19% (n=82), Anaplasma spp and Babesia spp 33% (n=145), Theileria spp 4% (n=18) and
mixed infection 1% (n=5). Tick, flices (Vector) act as carrier of TBDs. Calf under 4 month and lamb
under 2 month of age shown immunity due to maternal immunity of TBDs. From this positive sample
(blood) multiplex Polymerase Chain Reaction (PCR) was done in which Anaplasma marginale shown
positive band as 265 bp, Babesia bovis in 166 bp, and Theileria annulata in 312 bp, Babesia ovis in
422bp and Babesia motasi in 518bp. A autogenous blood protozoan killed vaccine was developed and
a trial study was done on 45 exotic sheep @ 3 ml/animal at 6 month interval twice in a year. The
vaccinated sheep were healthy and did not show any sign or symptoms of TBDs. On epidemiological
study in Bangladesh it was observed that May to September environmental temperature is arise
(above 300C, sometimes 40
0 C) and humidity is above 68% (sometimes above 90%) that triggers the
multiplication of tick biologically and also multiplication of TBDs protozoa both in tick and animal
blood that progresses havoc of TBDs in high yielding animal and local animal act as carrier. But when
environmental temperature is 300C or below and humidity is below 70% ie; October to March animal
act as carrier but not showing clinical sign. High environmental temperature (<300 C), high moisture
(<68 %), new introduction of animal, mixed with locally habituated animal, humid- semi humid
tropical climatic zone, physical stress are main risk factor of TBDs outbreaks. In case of high yielding
animal (above 60% cross breed) and 100% pure exotic breed show high clinical sign and even death
in high percentage and response of treatment is low. In case of local and under 50% cross breed
animal usually act as carrier and in some cases show clinical sign, usually shown positive response to
line of treatment.
Tick borne blood protozoan disease (Babesiosis, Anaplasmosis, and Theileriosis) are now a days, a
crucial factor for livestock production in Bangladesh. Local animal act as carrier but it indicating
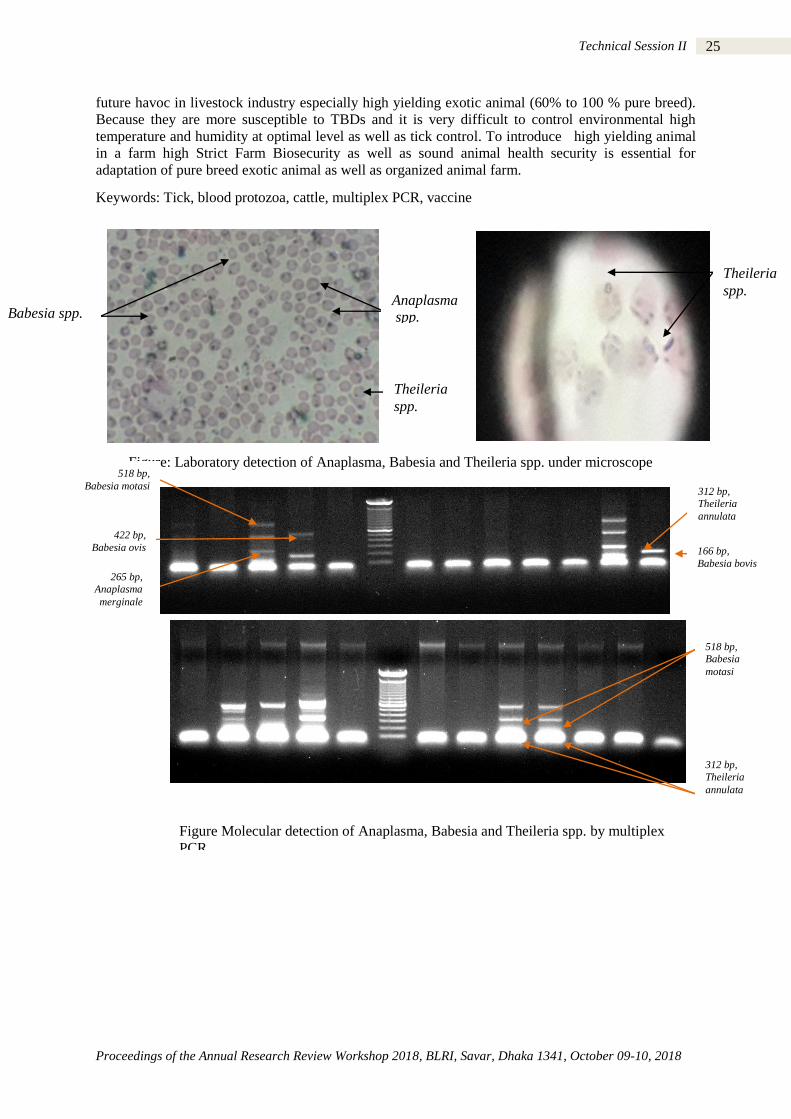
Proceedings of the Annual Research Review Workshop 2018, BLRI, Savar, Dhaka 1341, October 09-10, 2018
25 Technical Session II
future havoc in livestock industry especially high yielding exotic animal (60% to 100 % pure breed).
Because they are more susceptible to TBDs and it is very difficult to control environmental high
temperature and humidity at optimal level as well as tick control. To introduce high yielding animal
in a farm high Strict Farm Biosecurity as well as sound animal health security is essential for
adaptation of pure breed exotic animal as well as organized animal farm.
Keywords: Tick, blood protozoa, cattle, multiplex PCR, vaccine
Babesia spp. Anaplasma
spp.
Theileria
spp.
Theileria
spp.
Figure: Laboratory detection of Anaplasma, Babesia and Theileria spp. under microscope
Figure Molecular detection of Anaplasma, Babesia and Theileria spp. by multiplex
PCR
166 bp,
Babesia bovis
312 bp, Theileria
annulata
518 bp,
Babesia motasi
422 bp,
Babesia ovis
265 bp,
Anaplasma
merginale
518 bp, Babesia
motasi
312 bp,
Theileria
annulata

Proceedings of the Annual Research Review Workshop 2018, BLRI, Savar, Dhaka 1341, October 09-10, 2018
26 Technical Session II
Seroprevalence of caprine brucellosis in Bangladesh
MN Munsi1, MH Rahman
1, S Akther
1, MZ Hassan
2 and MZ Ali
2
1Goat and Sheep Production Research Division,
2Animal Health Research Division, Bangladesh
Livestock Research Institute, Savar, Dhaka 1341
Executive summary
Brucellosis is a highly contagious and important zoonotic disease caused by different species of the
genus Brucella, a small, facultative, gram negative, non-motile, non-spore forming, rod shaped
(coccobacilli) bacteria. In goats and sheep, brucellosis is mainly caused by Brucella melitensis. In
animals, brucellosis mainly affects reproduction and fertility, reduces the survival of newborns, and
diminshes milk yield and thus may cause significant economic losses. There are a lot of undiagnosed
cases of abortion, stillbirth and retained placenta which are thought to be down to brucellosis and
these have a significant impact on the development of livestock. So, the objective of the study was to
determine the status of seroprevalence of brucellosis in goats of Bangladesh. The study was
conducted in different agro-ecological zones in Bangladesh from July 2017 to June 2018 to estimate
the brucellosis of goats through serosurveillance. About 208 (Buck-19, Doe-189) serum sample
were collected from randomly selected goats in different areas in Bangladesh that includes Jashore
(n=50, Buck-3, Doe-47), Jhenidah (n=22, Buck-1, Doe-21), Tangail (n=40, Buck-2, Doe-38), Savar
(n=46, Buck-10, Doe-36), Thakurgoan (n=18, Buck-1, Doe-17), Bandarban (n=32, Buck-2, Doe-30)
to determine the seroprevelance of brucellosis. Two different serological tests, Rose Bengal Plate Test
(RBT) and Enzyme Linked Immuno Sorbent Assay (ELISA) were performed in Small Ruminants
Health laboratory and Zoonosis laboratory of Bangladesh Livestock Research Institute (BLRI), Savar,
Dhaka. The RBT was performed as per standard procedure. Some 30 μL of serum was taken on a
glass plate by micropipette. The rose bengal colored antigen bottle was shaken well to ensure
homogenous suspension and then 30 μL of the Rose Bengal colored antigen was added to the serum.
The antigen and serum was mixed thoroughly and waited for 5 min. Definite clumping/ agglutination
was considered as positive reaction, whereas no clumping/agglutination was regarded as negative and
slight agglutination is also considered as a positive result. The c-ELISA was performed using
commercial kits according the manufacturer’s protocol from Svanovir® Brucella-Ab C-ELISA
(Svanova Biotech AB, art. No. 10-2701-02 and 10-2701-10 Sweden). In our study, we found the
prevalence of brucellosis on the basis of Rose Bengal Plate Test (RBT) was 6% (Buck-0%, Doe-6%)
in Jashore, 4.5% (Buck-0%, Doe-4.5%) in Jhenidah, 2.5% (Buck-0%, Doe-2.5%) in Tangail, 4.35%
(Buck-0%, Doe-4.35%) in Savar, 6.25% (Buck-0%, Doe-6.25%) in Bandarban and 5.56% (Buck-
0%, Doe-5.56%) in Thakurgaon. On the other hand, we found the prevalence of brucellosis on basis
of ELISA was 4% (Buck-0%, Doe-4%) in Jashore, 4.5% (Buck-0%, Doe-4.5%) in Jhenidah, 0% in
Tangail, 0% in Savar, 3.13% (Buck-0%, Doe-3.13%) in Bandarban and 5.56% (Buck-0%, Doe-
5.56%) in Thakurgaon.
In conclusion, the overall seroprevalence of brucellosis were 4.33% and 2.40% from RBT and ELISA
respectively. Therefore, further study of the true seropositive goats is required for confirming the
presence of brucella organisms in order to cull the individuals for keeping apart them from this
detrimental zoonotic disease.

Session III
BIOTECHNOLOGY, ENVIRONMENT
AND CLIMATE RESILIENCE

Proceedings of the Annual Research Review Workshop 2018, BLRI, Savar, Dhaka 1341, October 09-10, 2018
27 Technical Session III
0
2
4
6
8
10
12
14
16
18
small follicle
(mm)
medium follicle
(mm)
large follicle
(mm)
13.30%
63.30%
23.30%
small follicle medium follicle large follicle
Adaptation of ovum pick up and somatic cell nuclear transfer technologies for cattle
in Bangladesh
GK Deb1*, MFH Miraz
1, MA Kabir
1, AK Paul
2 and SMJ Hossain
1
1Biotechnology Division, Bangladesh Livestock Research Institute, Savar, Dhaka 1341;
2Faculty of
Animal Science and Veterinary Medicine, Patuakhali Science and Technology University,
Dumki, Patuakhali; *Corresponding author: [email protected]
Executive summary
Numbers of reproductive biotechnology approaches are adopted with traditional cattle breeding
programme for increasing rate of genetic progress. The in vitro embryo production (IVEP) is one of
them. This technology is used individually or jointly with other technology to increase reproductive
efficiency and to reduce generation interval of farm animals. The OPU (full meaning) in combination
with conventional IVEP (full meaning) has enabled repeated production of large number of embryos
from donors of high genetic merits. Considering these facts, the present research programme was
designed to produce calves from transfer of OPU derived embryos. Oocytes were collected
throughout the experimental period from six regular breeder Red Chittagong cows, without subjecting
the cows to hormonal stimulation. Follicles were visualized using an ultrasound scanner equipped
with a sectorial probe fitted in a custom made intra-vaginal OPU probe-holder. Follicles number was
recorded according to their diameter using ultrasonography. An 18 gauge disposable hypodermic
needle connected to a 50 mL conical tube by Teflon tubing was used for follicular puncture. The COC
(full name) collection tube and aspiration medium was kept at 38°C in a water bath. Oocytes were
collected in Tyrodes lactate (TL)-HEPES medium enriched with 2% (v/v) fetal calf serum, 100 iu/mL
penicillin, 0.1 mg/mL streptomycin and 5 iu/mL heparin in a 50-mL Falcon tube. To minimize
abdominal straining during OPU, epidural anesthesia was performed with 5 mL of lidocaine. A
twice/week OPU schedule was used for collection of oocytes from elite donor cows. During this
experimental period, twenty OPU sessions were conducted. Oocyt were recovered from 5 sessions
and subjected to in vitro maturation. The maturation rates were evaluated by expansion of cumulus
cell. The matured oocytes were fertilized with fresh semen in vitro.
Figure 1. Follicular diameter (A) and proportion of different follicle (B) in RCC cows observed
during ovum pick up (OPU) from live donor
A B

Proceedings of the Annual Research Review Workshop 2018, BLRI, Savar, Dhaka 1341, October 09-10, 2018
28 Technical Session III
Table 1. In vitro maturation status of OPU derived oocytes from RCC cows
Parameter Value
No. of follicle punctured 26
No. of cumulus-oocyte-complexes recovered 12
Oocyte recovery rate 46.15%
No. of oocytes for IVM 12
No. of cumulus expansion 7
Maturation rate 58.33%
No. of zygote developed 0
The results showed that fig.1.the average diameter of ovary, large follicle and medium follicles were
17.04 mm, 9.28 mm, 5.66 mm respectively. Aspirated follicles were belonged to small (13.3%),
medium (63.3%) and large (23.3%) follicles, (Figure 1) respectively. Total 26 follicles were
punctured and 12 cumulus-oocyte-complexes were recovered. The in vitro maturation rate was
58.33%. (Table 1). However, no oocytes were developed into zygotes. In conclusion, oocyte recovery
rate in the OPU was moderated.

Proceedings of the Annual Research Review Workshop 2018, BLRI, Savar, Dhaka 1341, October 09-10, 2018
29 Technical Session III
Isolation and identification of LAB and Streptococcus bacteria for developing starter
culture for Yogurt
SMJ Hossain1, MA Kabir
1, SM Amanullah
1, MM Rahman
1 and MA Samad
2
1Biotechnology Division;
2Animal Health Research Division, Bangladesh Livestock Research
Institute, Savar, Dhaka 1341
Executive summary
Yoghurt is a fermented dairy product, obtain from control fermentation of milk by a selective culture
of lactic acid bacteria (LAB) produced a flavor and typical aroma. To produce a good quality yogurt,
starter culture containing desirable live viable food grade LAB is pre requisite. However, unlike
developed countries, packed starter culture in sachet is not available in local market in Bangladesh.
Consumers are dependent mostly on marketed yogurt, bacterial type and contents of which are non-
descriptive and often not viable for further use as starter culture and not cost-effective. Considering
these facts, the present research was undertaken to develop a suitable starter culture for yogurt
preparation at commercial level as well as consumer’s home.
In last year, 15 isolates of LAB from six locally available yogurt samples were isolated using
Lactobacillus MRS Agar and identified through biochemical tests. This year, study was performed to
isolate and identify bacteria of Streptococcus genus through biochemical characterization as well as
molecular confirmation of isolates primarily identified as Lactobacillus acidophilus and
Streptococcus thermophilus bacteria using PCR. For this purpose eight yogurt samples were collected
from local market and Streptococcus bacteria were isolated through culturing it on selective M17
Agar media. Bacteria were initially identified by performing catalase test and Gram’s staining.
Catalase negative and Gram’s stained and cocci shaped isolates were picked-up and purified by
sequential culturing in M17 Broth and M17 Agar. Biochemical properties of isolates were evaluated
through gas production from glucose, growth at different temperature (10ºC, 45ºC) and growth at 2%,
4%, and 6.5% NaCl concentration. Then DNA was extracted from isolated bacterial colony using hot
cold method, concentration was quantified by Nanodrop 2000c confirmed by PCR followed by gel
electrophoresis.
Out of eight samples, live viable bacteria were found all samples and the concentrations ranged from
6.00 to 8.54 Log 10cfu/ml. Based on catalase negative and gram’s stain positive a total nine colonies
(Ps1,Ps2, A, B, Ms1, Ms2, Mvs, Wf and Mvsw) were selected as lactic acid bacteria. Among nine
colonies four colonies were cocci shape (A, Ms1, Mvs and Mvsw) and were selected for further
biochemical and molecular identification. According to biochemical activity Mvs and Ms1colonies
were identified as streptococcus genus however, A and Mvsw colonies were belong to Leuconostoc
genus (Table1).
Table 1. Biochemical test results of isolated colonies
DNA was extracted from isolated colonies and the concentration of DNA varied from 22.2 to 422.6
nano gram/µl. The DNA from previously (last year) identified 15 colonies (Mv1,Mv2, Mv3, MW1,
Ps1,Ps2, Ps3, P1,P2,P3,P4,B1,B2,Bo1,Bo2)of LAB were amplified by Lactobacillus genus (247 bp)
and Lactobacillus acidophilus (227bp) species specific primer and after gel documentation 7 isolated
Biochemical Tests A Ms1 Mvs Mvsw
Gas from glucose
test
+ - - +
Growth at
10°C + - - +
45°C - + + -
Growth of different NaCl
2% - - - -
4% - - - -
6.5% - - - -
Genus Leuconostoc Streptococcus Streptococcus Leuconostoc

Proceedings of the Annual Research Review Workshop 2018, BLRI, Savar, Dhaka 1341, October 09-10, 2018
30 Technical Session III
200
colonies (Mv1, Mv2, Ps1,P1,P2,B1,Bo1) (Fig1) were identified as Lactobacillus genus. However,
among them 2 isolated colonies ( Bo1 and Ps1 ) were detected Lactobacillus acidophilus ( Fig. 2). On
the other hand four colonies (A, Ms1, Mvs and Mvsw) isolated on M17 agar were amplified by
Streptococcus genus and streptococcus thermophiles species specific primer. After gel documentation
among four colonies Mvs and Ms1 showed positive PCR amplification of streptococcus genus
(560bp) specific primer, however only Mvs showed positive amplification on streptococcus
thermophiles species primer (157bp) (Fig. 3). Yogurt preparation and its quality assessment by using
streptococcus thermophiles and Lactobacillus acidophilus are ongoing.
Figure 3. DNA amplification by Streptococcus thermophelous species Specific
primer
1= 1 Kb DNA Ladder, 2= Negative
control, 3= B01, 4= Ps 1
1= 100 bp DNA Ladder, 2= Negative control, 3= A, 4= Ms1, 5=Mvsw, 6= MSV
1= 100 lb ladder, 2= Bo 2, 3= Bo1, 4=B2,
5= B 1, 6= P 4, 7= P 3, 8= P 2, 9=P 1, 10=
Ps 3, 11= Ps 2, 12=Ps 1, 13= Mw, 14= Mv
3, 15= Mv 2, 16=Mv 1, 17= Negative
control.
Figure 2. DNA amplification by
Lactobacillus acidophilus Specific
primer
Figure 1. DNA amplification by Lactobacillus
genus Specific primer
227
bp
1 2 43
250/253
1 2 3 4 5 6
157 bp

Proceedings of the Annual Research Review Workshop 2018, BLRI, Savar, Dhaka 1341, October 09-10, 2018
31 Technical Session III
Growth and physiological response of selected mutant’s line of Napier cultivar to salt
stress in hydroponic technique
MK Alam1*
, NR Sarker2, KM Nasiruddin
3 and AM Shohael
4
1Ph.D Research Fellow, Fodder Research and Development Project;
2Project Director, Fodder
Research and Development Project, Bangladesh Livestock Research Institute, Savar, Dhaka; 3Vice
Chancellor, Gopalgonj Science and Technology University, Gopalgonj and 4 Department of
Biotechnology & Genetic Engineering, Jahangirnagar University, Savar, Dhaka.
Executive summary
Mutation (gamma -ray irradiation) has become increasingly popular in recent times as an effective
plant breeding tool for improvement of existing fodder germplasm. BLRI Napier-3 and BLRI Napier-
4 were exposed to 10 to 100 gamma rays (Gys), with an interval of 10 Gys doses to determine the
morphological and nutritional quality in terms of cutting survivability rate, biomass yield, tiller
numbers, and crude protein (CP%) content. Five mutants’ lines of BLRI Napier-3 were selected
followed after 10, 20, 30 and 50 Gys on the basis of morphological and nutritional quality and genetic
variations (analyzed by using RAPD markers). In the present study, five mutants along with a control
lines were assessed for salt tolerance under hydroponic system to determine the effect of saline stress
on morphological and nutritional quality and Na+& K
+ content under hydroponic condition. As per
guidelines of Bangladesh Agricultural Research Institute (BARI) with some modifications, all the
selected mutants and control lines were grown hydroponically by using BARI standard solution
developed for horticulture. Salinity levels were accounted for 6 dS m-1
, 8 dS m-1
, 10dS m-1
and 12dS
m-1
using different NaCl concentrations corresponding to the nutrient solution. Cork sheets were
placed in water on 3 ft x 7ft steel plates. 10 holes were made in each cork sheet. Proper aeration of the
culture solution was provided for 5 minutes daily by stirring a bamboo stick. At two nodes cutting of
uniform size were planted in holes of cork sheets floating over nutrient solution. An analysis of
variance was done to determine the varietals differences. Collected data were analyzed statistically by
using Compare Means (CM) procedure of One-Way Analysis of variance (ANOVA): Post Hoc
Multiple Comparisons of IBM SPSS 20 for Windows (SPSS Inc. 2010) following the method of
Randomized Completely Block Design (RCBD).
Table 1. Effect of different salinity levels on biomass yield (kg)
The biomass yield was decreased with the increasing levels of salinity. Significant variations of
biomass yields among different lines were found in all levels of salinity. The highest biomass yield
was obtained from selected all mutant’s line at different salinity levels and lowest was found from
control line (Table1). Significant variations of CP contents among lines were observed in 6 dSm-1
and
8 dSm-1
level of salinity. On the other hand, no significant variations of CP contents among different
lines were exhibited in10 dSm-1
and 12 dSm-1
salinity levels. Highest CP was obtained with the 6 dSm-
1. CP % gradually decreased with increasing salinity levels, except selected mutant’s line-5 at 8 dSm
-1
(Table 2).

Proceedings of the Annual Research Review Workshop 2018, BLRI, Savar, Dhaka 1341, October 09-10, 2018
32 Technical Session III
Table 2. Effect of different salinity levels on crude protein % (CP %)
In the physiological parameters, more sodium ions were accumulated in plant with increasing the
level of salinity, whereas, the maximum Na+ concentrations were observed in control lines for
different levels of salinity (0.194 to 0.579 mg g-1
). The concentrations of Na+ among different lines
did not varied significantly in 10 dSm-1
. Highest Na+ content (0.324 to 0.579 mg g-1
) was found in 12
dSm-1
treatment and lowest (0.115 to 0.194 mg g-1
) was observed in control which followed by 6 dSm-
1 (Table 3).
Table 3. Effect of different salinity levels on Na content
K+
contents in plant dry matter of different mutant lines were significantly influenced for 8 dSm-1
and
10 dSm-1
levels of salinity. The highest K+ content was obtained on plant dry matter while salinity
level was applied at 6 dSm-1
. Lowest was calculated from 12 dSm-1
. K+ concentration decreased as
salinity levels increased. In this experiment K+ content was found highest in control line at all levels
of salinity (Table 4).
Table 4. Effect of different salinity levels on K content
This study forwarded to observe salinity stress on biomass yield and crude protein (CP %) decreased
with increasing salinity level. Physiological character of Na+& K
+ content on control and selected
mutant’s line also affected due to salinity.

Proceedings of the Annual Research Review Workshop 2018, BLRI, Savar, Dhaka 1341, October 09-10, 2018
33 Technical Session III
Study on adaptability of HYV fodder cultivars in drought prone Barind areas of
Bangladesh
NR Sarker, MA Habib, MT Hasan and MR Amin
Fodder Research and Development Project, Bangladesh Livestock Research Institute, Savar, Dhaka
1341
Executive summary
Drought is being considered as the main cause which hampers the estimated agricultural production,
here in Bangladesh over the last few decades. Apart from the agricultural losses, droughts have
important effect on livestock population, land degradation, health and employment. In the drought
prone areas, the scarcity of green fodder is one of the important problems in Bangladesh for rearing
dairy cows. The Barind region is known as the major drought prone area, where the majority of
households involved in rearing livestock. Lack of grazing facilities constrains mass rearing of cattle
and goats. Therefore, the aim of this study was to increase the availability of green grasses in the
Barind regions of Bangladesh. To achieve the goal, an adaptability trial with BLRI Napier cultivars
(BN-1, BN-2, BN-3, BN-4, BN-5 and Pakchong) was conducted as pilot basis in three different
locations (Chapai Nawabganj sadar, Nachol and Gomostapur) of Chapai Nawabganj district and BLRI
regional station at Godagari, Rajshahi. Number of farmers in each location of Chapai Nawabganj was
five as disperse replications. In Godagari five blocks comprising 5 plots (for 5 cultivars) in each block
measuring an area of (9.64×8)m per plot were prepared for the experiment. Thus, the design of the
experiment was randomized completely block design (RCBD). Stem cutting was planted in each plot.
Before plantation, all plots were properly prepared by normal agronomical practice as farmers do
conventionally (3-4 tillage, weeding and irrigation as per necessary), whereas in Godagari, standard
agronomical practices as per BLRI was followed (3-4 tillage, fertilizing through cow dung@ 15-
20MT/ha-1
, urea@50kg/ha-1
, TSP@70kg/ha-1
and MP@30kg/ha-1
at the time of land preparation and
weeding and irrigation when required). Stem cuttings were planted in rows apart from 70cm and
35cm spacing between plants. Biomass yield and plant morphology along with nutritional evaluation
were studied in the experiment. Data were collected up to 10 cuts from Chapai Nawabganj and 6 cuts
from Godagari and analyzed statistically by ‘R’(Agricolae and Pastecs packages). Tukey’s HSD test
was conducted for mean comparison of the variables.
Table 1. Performance of different Napier cultivars at Godagari rajshahi (Peri-Barind region)
Table 1 illustrates the performances of different Napier cultivars in Godagari, Rajshahi. The results
show that unlike dry-biomass yield and CP composition, significant differences were found for all the
parameters studied. Total fresh biomass, dry-biomass and CP yields in different cultivars varied
significantly for sequence of harvest and season of harvest. Highest biomass production was obtained
at 3rd
harvest (26.31 MTha-1
) after plantation and in dry summer (22.14MTha-1
). On the other hand,
highest dry-biomass production was obtained at 2nd
harvest (5.04 MTha-1
) in dry summer (4.45MTha-
1) and highest CP yields at 6
th harvest (0.391 MTha
-1) in dry summer (0.360MTha
-1). However,
sequence and season of harvest have no significant effect on leaf and stem ratio (LSR). DM and CP
contents differed significantly for botanical fraction of the plants. Highest % of DM and CP contained
in leaf (25.86 and 7.25%), followed by sheath (18.57 and 4.1%) and stem (14.45 and 3.62%). Table 2
shows the performances of different Napier cultivars in Chapai Nawabganj. In Barind region total
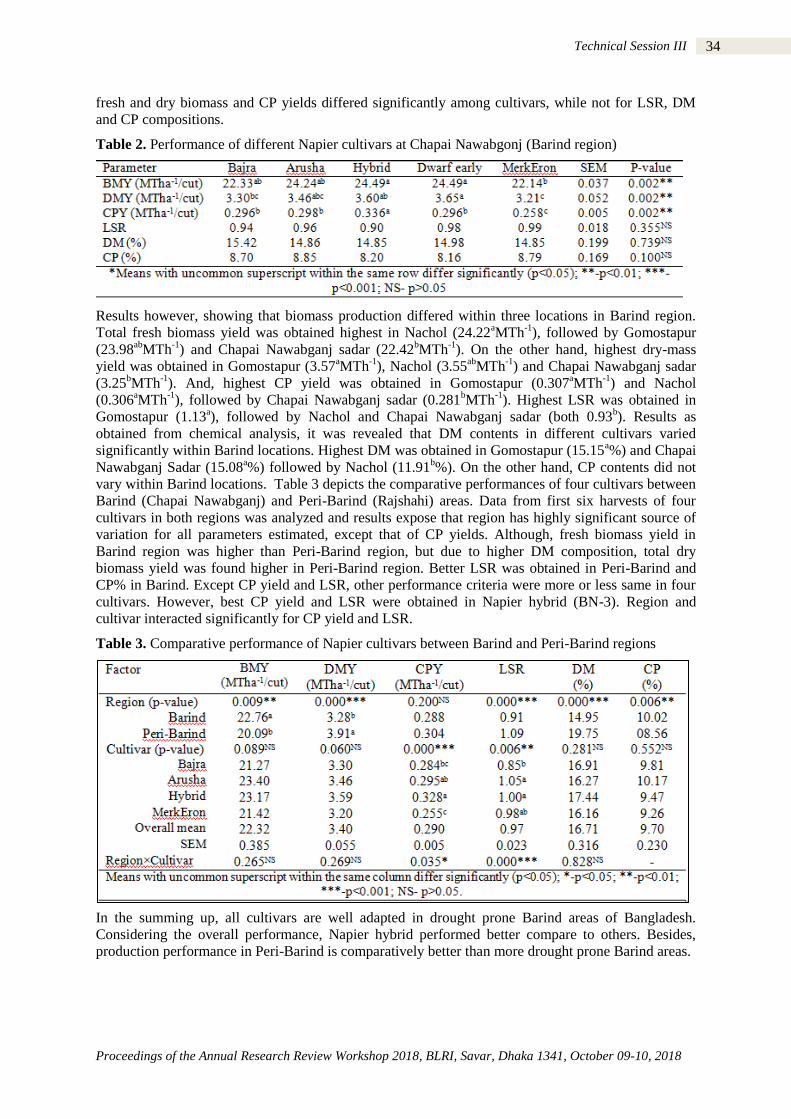
Proceedings of the Annual Research Review Workshop 2018, BLRI, Savar, Dhaka 1341, October 09-10, 2018
34 Technical Session III
fresh and dry biomass and CP yields differed significantly among cultivars, while not for LSR, DM
and CP compositions.
Table 2. Performance of different Napier cultivars at Chapai Nawabgonj (Barind region)
Results however, showing that biomass production differed within three locations in Barind region.
Total fresh biomass yield was obtained highest in Nachol (24.22aMTh
-1), followed by Gomostapur
(23.98ab
MTh-1
) and Chapai Nawabganj sadar (22.42bMTh
-1). On the other hand, highest dry-mass
yield was obtained in Gomostapur (3.57aMTh
-1), Nachol (3.55
abMTh
-1) and Chapai Nawabganj sadar
(3.25bMTh
-1). And, highest CP yield was obtained in Gomostapur (0.307
aMTh
-1) and Nachol
(0.306aMTh
-1), followed by Chapai Nawabganj sadar (0.281
bMTh
-1). Highest LSR was obtained in
Gomostapur (1.13a), followed by Nachol and Chapai Nawabganj sadar (both 0.93
b). Results as
obtained from chemical analysis, it was revealed that DM contents in different cultivars varied
significantly within Barind locations. Highest DM was obtained in Gomostapur (15.15a%) and Chapai
Nawabganj Sadar (15.08a%) followed by Nachol (11.91
b%). On the other hand, CP contents did not
vary within Barind locations. Table 3 depicts the comparative performances of four cultivars between
Barind (Chapai Nawabganj) and Peri-Barind (Rajshahi) areas. Data from first six harvests of four
cultivars in both regions was analyzed and results expose that region has highly significant source of
variation for all parameters estimated, except that of CP yields. Although, fresh biomass yield in
Barind region was higher than Peri-Barind region, but due to higher DM composition, total dry
biomass yield was found higher in Peri-Barind region. Better LSR was obtained in Peri-Barind and
CP% in Barind. Except CP yield and LSR, other performance criteria were more or less same in four
cultivars. However, best CP yield and LSR were obtained in Napier hybrid (BN-3). Region and
cultivar interacted significantly for CP yield and LSR.
Table 3. Comparative performance of Napier cultivars between Barind and Peri-Barind regions
In the summing up, all cultivars are well adapted in drought prone Barind areas of Bangladesh.
Considering the overall performance, Napier hybrid performed better compare to others. Besides,
production performance in Peri-Barind is comparatively better than more drought prone Barind areas.
Proceedings of the Annual Research Review Workshop 2018, BLRI, Savar, Dhaka 1341, October 09-10, 2018
35 Technical Session III
Use of water hyacinth and press mud as co-substrate with cow dung and layer
droppings for improving biogas production
SM Amanullah1, MM Rahman
1, M Roy
2, MA Kabir
1, MM Haque
3and SMJ Hossain
1
1Biotechnology Division, Bangladesh Livestock Research Institute, Savar, Dhaka 1341;
2Department
of Biochemistry and Molecular Biology, Jahangirnagar University, Dhaka 1342; 3Soil Science
Division, BRRI, Joydevpur, Gazipur, Dhaka
Executive summary
Water hyacinth (WH) and press mud (PM; sugar mill by-product) were studied as co-substrate with
cow dung (CD) and layer droppings (LD) for increasing biogas production, methane concentration in
biogas and fertilizer characteristics of slurry. For this purpose, four different experiments were
conducted separately. The WH was mixed either with CD (Exp. 1) or LD (Exp. 2) in four different
ratios of 0:100(T1), 15:85(T2), 30:70(T3) and 45:55(T4) on total solid (TS) basis and incubated in
triplicates in 3.5 litter laboratory simulated biogas digester. Similarly, in next two experiments, PM
was mixed either with CD (Exp. 3) or LD (Exp. 4) following same ratios and procedure as previous
experiments. The digesters were then sealed to provide anaerobic condition and kept in mesophilic
temperature (350C) at about 38 days and 62 days of retention time (RT) for LD mixed with PM & WH
and CD mixed with PM & WH, respectively. Gas production was measured several times in a day by
a syringe connected with digester and pressure was released periodically. Gas sample was analyzed
weekly with the help of sensor based digital biogas analyzer (Biogas5000, Geotech, UK). The
incubation was stopped when gas production was in declining trend. At opening of digester, pH of
bio-slurry was recorded and samples were collected for microbial enumeration (E. coli and
Salmonella) and mineral analysis. Gas composition data were analyzed using repeated measures in
General Linear Model (GLM), while all other data were subjected to analyzed for Analysis of
Variance (ANOVA) in complete randomized design (CRD) in SPSS 20.
Table 1. Effect of mixing water hyacinth (WH) in different ratios with cow dung (CD) on biogas
production, composition and fertilizer characteristics of bio-slurry
Variables studied Treatment* SEM P-value
Control, T1
(0:100)
T2
(15:85)
T3
(30:70)
T4
(45:55)
Biogas production and composition
Total gas, L 8.96c 16.15
b 21.37
a 7.94
c 0.514 <0.01
Daily gas, ml/day 144.52c 260.46
b 344.6
a 128.06
c 8.276 <0.01
CH4, % 29.39b 37.06
a 37.29
a 31.18
b 0.793 <0.01
CO2, % 22.91b 25.09
a 25.04
a 25.52
a 0.578 <0.05
NH3, ppm 26.55c 42.00
b 49.45 57.93
a 3.565 <0.01
H2S, ppm 247.67b 359.70
a 330.33 379.63
a 17.625 <0.01
Bio-slurry characteristics
Slurry pH 7.09a 6.97b 7.00
ab 6.99
ab 0.021 0.023
N, % 1.48 1.47 1.52 1.81 0.060 0.124
P, % 0.92 0.97 0.98 1.08 0.031 0.351
K, % 0.72c 1.98
bc 3.17
ab 4.43
a 0.438 <0.01
*Ratios indicated WH: CD in mixed substrate;
a,b,cMeans having similar superscripts in the same row have
significant difference
Important results of experiment 1 and 2 are presented in Table 1 and 2, respectively. In experiment 1
(Table 1), biogas production along with CH4 concentration observed higher (P<0.01) in both T3 (WH:
CD=30:70) and T2 (WH: CD=15:85) compared to T1 (WH: CD=0:100) and T4 (WD: CD=45:55).
Potassium (K), magnesium (Mg) and Calcium (Ca) contents in bio-slurry were increased linearly
(P<0.01) with the increasing level of WH in the digester. In experiment 2 (Table 2), gas production
along with CH4 concentration was found higher (P<0.01) in T3 (WH: LD=30:70) and T4 (WH:
LD=45:55) compared to others. No effects (P>0.05) on mineral composition of slurry were observed

Proceedings of the Annual Research Review Workshop 2018, BLRI, Savar, Dhaka 1341, October 09-10, 2018
36 Technical Session III
by mixing WH with LD. In contrast to first two experiments, addition of PM to both CD and LD
(Exp.3 and 4) failed to improve biogas production and composition, rather deteriorated. In both
experiment 3 and 4, T1 (control; 100% CD/LD) produced higher gas compared to all other treatments.
Though the fresh CD contained E. coli, and fresh LD contained both E. coli and Salmonella but none
of the slurries contained any of these public health concerned microorganism.
Table 2. Effect of mixing water hyacinth (WH) in different rations with layer droppings (LD) on
biogas production, composition and fertilizer characteristics bio-slurry
Variables studied Treatment* SEM P-value
Control, T1
(0:100)
T2
(15:85)
T3
(30:70)
T4
(45:55)
Biogas production and composition
Total gas, L 4.56b
10.12b
18.28a
13.59ab
1.760 <0.01
Daily gas, ml/day 139.9b
187.33b
338.55a
251.65ab
32.58 <0.01
CH4, % 9.76c
20.64b
40.28a
40.49a
7.794 <0.01
CO2, % 48.03a
44.25a
34.16b
34.85b
6.619 <0.01
NH3, ppm 631.88ab
787.33a
450.55b
403.33b
233.04 <0.01
H2S, ppm 107.85b
142.07b
252.45a
184.65ab
24.415
Bio-slurry characteristics
Slurry pH 6.6b
6.8b
7.4a
7.3a
0.109
N, % 1.53 .61 1.61 1.44 0.164 0.082
P, % 3.53 3.44 3.24 3.08 0.101 0.465
K, % 3.66 4.22 4.43 4.67 0.172 0.192
*Ratios indicated WH: LD in mixed substrate;
a,b,cMeans having similar superscripts in the same row have
significant difference
From the results, it can be concluded that, water hyacinth can be added with cow dung at 15 to 30%,
while with layer droppings at 30 to 45% for increasing biogas production and its methane
concentration. On the other hand, press mud found not suitable for using as co-substrate both with
cow dung and layer droppings.

Proceedings of the Annual Research Review Workshop 2018, BLRI, Savar, Dhaka 1341, October 09-10, 2018
37 Technical Session III
Study of value added livestock manure based product production
N Sultana1, JS khanam
1 and MA Islam
2
1Animal Production Research Division, Bangladesh Livestock Research Institute, Savar, Dhaka 1341;
2 Bangladesh Agricultural University, Mymensingh 2202
Executive summary
Bio-slurry, the an-aerobically digested by-product come from biogas digester after producing biogas.
It carries higher fertilizer value which can recuperate the lost organic components and productive
capacity of soil. Recently bio-slurry water is globally used as organic pesticide to some extent but no
specific evidence of it’s role on controlling pests yet not investigated. In past coupler years, cost-
effective bio-slurry based organic fertilizer production technique with maximum nutrient was
developed and it’s efficacy on rice production was studied. Organic fertilization plays an indicatory
role in horticultural cultivation. Recently fodder cultivation is also getting more attention by farmers
than before. So, the present study was designed in Randomized Complete Block Design (RCBD)with
three replications to know the impact of BLRI developed bio-slurry based organic fertilizer on
horticulture crop and fodder production. Total six nutrient management packages viz. 100% inorganic
fertilizer (IF,T1), 75:25 (IF:OF, T2), 50:50 (IF:OF, T3), 25:75 (IF:OF, T4), 100% organic fertilizer (OF,
T5) and native fertility of soil (Control,T6) were cumulatively form each block and tested on spinach,
tomato, carrot and maize. Experiment was conducted at BLRI and horticulture field of Bangladesh
Agricultural University (BAU). Land was well prepared by local tillage, removing weeds and stubbles
and finally dividing into 64 plots. Each plot was 16m2 (4m×4m) in size. Fertilizer dose was calculated
analyzing the N, P, K content of both soil and developed organic fertilizer and following the treatment
it was applied during the final land preparation. So many organic fertilizers are available in market
now which are extensively used by farmers without knowing its’ veritable feature of quality.
Representative amount of market available organic fertilizers were collected and analyzed at animal
nutrition laboratory of BLRI, Soil science laboratory of BAU and soil science laboratory of BRRI
under this study to compare the quality between market available organic fertilizer and developed bio-
slurry based fertilizer. To harness the pesticidal potentiality of bio-slurry a pot experiment was carried
out on Indian spinach leaf infection with four treatments viz. T1 control (without any pesticide), T2
bio-slurry, T3 Commercial pesticide and T4 Bio-slurry with neem leaves with three replications of
each.After collecting all the data they were inserted in Microsoft Excel spreadsheet and analyzed by
excel and analysis of variance (General Linear Model procedure) and Tukey’s pair wise comparison
test (p < 0.05) usingMinitab Version 16 (Minitab Inc., State College, PA, USA) as per requirement.
Table 1. Yield characteristics of crops and fodder under organic and inorganic fertilization
Crops Final yield (ton/ha) (Mean±SE)
T1 T2 T3 T4 T5 T6
BLRI
Spinach 6.94±0.53c 8.50±0.24
bc 9.14±0.39
ab 10.65±0.15
a 6.96±0.68
c 4.35±0.16
d
Tomato 10.46±0.64b
11.03±1.03b
12.85±1.30ab
16.41±1.06 a
10.14±0.90 b
3.79±0.26c
Carrot 16.75±0.34a
16.75±0.60a
17.00±0.34a
18.10±0.26a
13.17±0.50b
7.19±0.10c
Maize 35.37±2.65bc
40.13±6.41ab
45.90±3.52a
51.60±3.22 a
27.33±1.67bc
22.00±1.15c
BAU
Spinach 5.87±0.11bc
7.85±0.13b 8.54±0.19
a 9.79±0.31
a 4.79±0.10
bc 2.66±0.16
d
Tomato 13.28±3.58ab
14.25±4.09 ab
15.68±6.37ab
18.32±2.95a
10.70±0.43ab
5.36±0.97b
Carrot 13.67±0.48a 14.19±7.05
a 15.19±7.05
a 16.88±2.84
a 9.56±0.15
b 5.45±0.15
c
Maize 32.33±2.00b 35.52±3.44
ab 39.69±2.12
a 45.60±3.00
a 22.00±1.00
c 19.20±1.17
c
Table 1 represents the final yield characteristics of different crops and fodder studied under this
research. Data reveals that maximum yield of spinach (10.65±0.15, 9.79±0.31 t/ha), tomato
(10.14±0.90, 18.32±2.95 t/ha), carrot (18.10±0.26, 16.88±2.84t/ha) and maize (51.60±3.22,
45.60±3.00 t/ha) was obtained from the integration of 75% organic fertilizer with 25% inorganic
fertilizer (T4) in both BLRI and BAU field. Yield of T4wassignificantly higher than other nutrient
packages used in this study. No significant difference was observed in yield amount of 100%
inorganic fertilizer (T1) and 100% organic fertilizer (T5) application. Yield trend of T2 and T3 was

Proceedings of the Annual Research Review Workshop 2018, BLRI, Savar, Dhaka 1341, October 09-10, 2018
38 Technical Session III
%N % K % S % P % Na %Mn % Zn % Fe % Cu % Mg % CaCd
(ppm)
Pb
(ppm)
Bio-slurry 2.16 0.25 0.49 0.44 0.29 0.026 0.023 0.3 0.06 0.17 0.25 0 0
M.F 1.14 0.18 0.25 0.17 0.22 0.05 0.02 0.33 0.02 0.11 0.08 0.00 0.00
0
0.5
1
1.5
2
2.5
Figure 1. Comparison of bio-slurry based organic fertilizer with market available
organic fertilizer (M.F)
Bio-slurry M.F
almost similar and no significant difference was observed there.N,P and K is considered as major
plant nutrient and the maximum uptaken amount of N, P, K was also found in T4 treatment
irrespective of crops (Table 2). Not only N, P, K but other macro and micro minerals were also
analyzed and found in impressive amount in T4 treatment and no heavy metals were found there (data
not shown)..The comparative nutritional value of bio-slurry based organic fertilizer and market
available organic fertilizer is presented in figure 1.
Table 2. Nutritive values of yielded crop under organic and inorganic fertilization
Crops Spinach Tomato carrot Maize
Nutrients (%, Mean±SE)
Treat
ments
N P K N P K N P K N P K
T1 2.6±0.
03
0.3±0
.01
0.7±0
.11
2.2±0.
07
0.2±0.
05
0.3±0.
02
2.1±
0.04
0.5±0
.02
0.4±
0.03
2.2±0
.08
0.2±0
.02
0.3±0
.0
T2 2.6±0.
0
0.3±0
.09
0.8±0
.10
2.5±0.
07
0.3±0.
03
0.4±0.
03
2.1±
0.03
0.4±0
.01
0.4±
0.04
2.3±0
.04
0.2±0
.03
0.4±0
.03
T3 3.1±0.
0
0.3±0
.11
0.8±0
.08
2.7±0.
09
0.3±0.
03
0.5±0.
02
2.1±
0.12
0.4±0
.02
0.5±
0.02
2.3±0
.04
0.3±0
.02
0.4±0
.01
T4 3.6±0.
0
0.4±0
.02
0.9±0
.04
2.9±0.
02
0.4±0.
04
0.7±0.
02
2.3±
0.20
0.5±0
.04
0.6±
0.02
2.5±0
.02
0.1±0
.01
0.5±0
.03
T5 2.3±0.
0
0.3±0
.07
0.6±0
.06
2.3±0.
04
0.3±0.
03
0.4±0.
01
2.0±
0.03
0.5±0
.01
0.4±
0.03
2.1±0
.03
0.2±0
.01
0.4±0
.02
T6 2.2±0.
0
0.2±0
.05
0.6±0
.01
2.1±0.
03
0.2±0.
04
0.3±0.
01
1.9±
0.02
0.4±0
.01
0.4±
0.01
1.9±0
.02
0.2±0
.01
0.3±0
.02
Data shows that the extent of macro nutrients (N,P,K and S) of bio-slurry based organic fertilizer was
comparatively higher than organic fertilizers available at market, but the % share of micro nutrients
(Zn Na, Mn, Fe, Cu, Mg and Ca) of bio-slurry based organic fertilizer and market available organic
fertilizer was almost same. Bio-slurry water has potential pesticide properties and data originated
from this study indicates that minimum number of infected plants (2.33 nos),leaves (4.33 nos) and
infected leaf spot per pot (15.00 nos) was found when bio-slurry water mixed with neem leaf juice
was sprayed as pesticide. Results of same parameters did not vary significantly when bio-slurry water
solely sprayed as pesticide and the extent of infected plant, leaves and leaf spot was 2.33, 5.67 and
17.67 respectively. But significantly higher number of infected plants (3.00), leaves (9.67) and
infected leaf spot per pot (34.00) was found in commercial pesticide group and it was almost similar
to control i.e. no pesticide group. Although it is a preliminary work but a series of studies need to be
conducted to find out specific compound and its associating factors playing role on pests control. It
can be concluded that bio-slurry based organic fertilizer could be much more competent for
horticultural crop and fodder production.
The integration of 75% organic with 25% inorganic fertilizer could achieve better output in both
quality and quantity than traditional inorganic fertilization system for crop production of Bangladesh.
At the same time using bio-slurry as organic pesticide will unpack new opportunities to the farmers to
harvest maximum economic benefit with qualitative product production which ultimately make the
livestock farming system more endurable.

Proceedings of the Annual Research Review Workshop 2018, BLRI, Savar, Dhaka 1341, October 09-10, 2018
39 Technical Session III
Study on farm nutrient recycling in BLRI foreign sheep farm
N Sultana1, JS Khanam
1, M Yesmin
2, FT Jahura
2 and M Ershaduzzaman
2
1Animal Production Research Division,
2Conservation and Improvement of Native Sheep through
Commercial and Community Farming, Bangladesh Livestock Research Institute, Savar, Dhaka 1341
Executive summary
Nutrient recycling involves the movement and exchange of organic and inorganic matter back into the
production of matter which assert more concern now at farming system to attain more profit than
conventional key performance indicators of it. Feeding management involves the major cost of
livestock farming system but almost half of this cost is being wasted through dung and urine due to
their non-judicial management. In results, it creates social and public health hazards, tainted climatic
condition and huge economic loss of farm and farmers. Recently, improved livestock manure
management program is getting popularity to some extent but it is confined only in large ruminants
and poultry and the small ruminant farmers are still submerged in darkness. Regarding this fact the
present study was undertaken with the objective to develop an easy, profitable, environment friendly
small ruminant farm waste management technique to recycle the feed nutrients into agriculture
including the quantification of its daily input and outgo. A total of 16 animals of three different
introduced sheep breed (Perendale, Dorper and Suffock) were classified into 4 different groups as-
adult male, adult female, growing male and growing female. Roughage and concentrate mixture was
supplied to the animals of each group on ad-libitum basis as regular farm practice. Daily feed intake
and dung void of animals in each group was recorded and their nutrient composition was analyzed in
animal nutrition laboratory, BLRI and soil science laboratory, BAU and BRRI. To alternate the
common practice of dung management and to find out appropriate cost effective processing
techniques of waste, the produced dung was goes under aerobic system of processing. In the present
study, the processing system of waste involved both normal aerobic composting and vermin-
composting. Total 3 pit of 2×2m size was prepared for normal composting purpose and each of three
was filled with 150 kg dung. Regular temperature from four corner and center of the pile was
recorded upto 42 days and recovery rate of final product was recorded. Vermin compost preparation
from sheep feces was carried out with four different treatments with three replication of each at
cement made chari of 2×2 ft size. Each chari was filled with 20 kg feces and then earth worm
(Eisenia fetida) was added at four different levels (250, 350, 500 and 750 nos.). Temperature and
humidity of vermin compost unit was recorded upto 35 days. Regular turning at 7 days interval was
practiced. After 35 days, recovery rate of final product and cost of per kg compost production of both
type was calculated and finally sample of both compost was taken and analyzed for quantifying pH,
nutritional composition and heavy metal content at the same laboratory mentioned earlier. The
response testing experiment of both type compost on vegetable and fodder crop is going on . Data
were inserted in Microsoft excel spread sheet and analyzed using excel and IBM SPSS 20 statistical
packages as per requirement.
Initial pH of sheep feces was 8.5 and it was reduced to 7.8 in normal compost and 5.26 to 6 in vermin
compost. Maximum pH (6.00) of vermin compost was found in T3 (20 kg manure with 500 nos worm)
treatment. The input and output quantification table (Table 1) shows that, the daily average roughage
Table 1. Input-Output quantification of sheep (fresh basis, kg/day/animal)
Animal category Intake
Outgo Roughage Concentrate
Adult male 11.19±2.71 0.21 ±0.0 2.56±0
Adult female 7.04±1.38 0.15 ±0.29 2.10±1.59
Growing male 8.29±1.05 0.2±0.0 1.9±1.48
Growing female 5.16±0.95 0.2±0.0 1.8±1.26

Proceedings of the Annual Research Review Workshop 2018, BLRI, Savar, Dhaka 1341, October 09-10, 2018
40 Technical Session III
and concentrate intake on fresh basis of adult male and female was 11.19 vs 7.04 kg and 0.21 vs 0.15
kg, respectively and their outgo i.e., fresh feces void was 2.56 and 2.1 Kg, respectively.
Table 2. Nutritive value of feed and feces (Fresh basis)
Feed Macro nutrients (%) (Mean±SD) Micro nutrients (%) (Mean±SD)
N P K S Zn Cu
Roughage 2.97±1.91 0.30±.12 0.88±0.067 0.39±0.02 0.01±.01 0.004±0.00
Concentrate 2.28±1.1 0.35±0.21 0.72±0.05 0.31±0.01 0.005±0.001 0.006±.000
Feces
Adult Male 1.77±0.54 0.22 ±0.27 0.44±0.06 0.27±0.04 0.01±.002 0.001±0.00
Adult Female 1.65±0.05 0.20 ±0.02 0.42±0.01 0.28±0.04 0.01±0.001 0.001±0.00
Growing
male 1.94±0.58 0.24±0.067 0.44±0.025 0.25±0.014 0.01±0.000 0.002±000
Growing
female 1.60±0.23 0.21 ±0.02 0.47 ±0.03 0.27±0.03 0.01±0.002 0.001±.000
The respective roughage intake of growing male and female was 8.29 kg and 5.16 kg and amount of
consumed concentrate mixture was equal (0.2kg/day) and they produced 1.90 and 1.80 kg feces per
day. The nutritional value (macro and micro nutrients) of both feed and feces is presented in Table 2.
Data shows that more than 50% of received nutrient was being passed through feces and nutrient
passing out tendency was comparatively higher in growing animal group. Although the result was
found in this experiment but it needs to be further tested through a well-designed feed digestibility
trial. No heavy metal entity was found in both feed and feces (data not shown). But the nutritional
value of normal and vermin compost (Table-3) is higher than the same value of fresh feces which
indicates that fermentation process may have role on enhancing the form and quantity of nutrients.
The recorded temperature of aerobic and vermin composting was 65-70ºC and 22-25ºC respectively.
In case of vermin compost maximum recovery rate of final product was obtained from T3 and it was
15.02 kg fertilizer from 20 kg feces and required worm for per kg fertilizer production was 33 nos.
Vermin compost was comparatively superior in quality than normal aerobic compost in terms of
nutritional value and return rate of final product.
Table 3. Nutritive value of aerobic compost
Feed Macro nutrients (%) (Mean±SD) Micro nutrients (%) (Mean±SD)
N P K S Zn Cu
Normal 2.05±0.07 0.26±0.012 0.16±0.051 0.34± 0.05 0.03±0.000 0.006±0.00
Vermin 2.66±0.04 0.36±0.017 0.24±0.00 0.46 ±0.008 0.01±0.00 0.004±.000
The respective return rate of normal and vermin compost is 55 and 75%. The production cost of per
kg normal compost was Tk. 3.50 and vermin compost was Tk. 5.00. In terms money on an average
each animal of adult and growing category received nutrients of Tk. 36.80 and Tk. 47.30 per day,
respectively and voided nutrients of Tk. 15.00 and 12.64 per day which is become wasted now
through the conventional management system. But when it undergoes a simple processing system
then it recovered nutrients of Tk. 25.00 in normal compost and Tk. 49.5 in vermin compost which is
higher than the wasted amount of money in per animal feces.
In conclusion, it could be said that to develop cost-effective and sustainable approach of small
ruminant farming system there is no alternative to recycle the nutrients supplied to the animals and
among the recycling systems vermin composting of feces could be a good choice to practice at farm
level.

Proceedings of the Annual Research Review Workshop 2018, BLRI, Savar, Dhaka 1341, October 09-10, 2018
41 Technical Session III
Table 1. Nutrient intake of crossbred dairy cows under different climatic zones
Parameters Different Climatic Zones Significance
River basin area
Drought prone area
Poor Feed Based area
Saline Prone area
Overall SE
Level
CPR (gm/day) 832.01 733.03 703.81 1025 50.34 P=0.09
MER (MJ/kg) 76.6 69.73 65.63 88.69 3.56 P=0.10
TDMI(kg/day) 16.5a 15.4
ab 12.8
b 13.1
b 0.55 P=0.04
TCPI(g/day) 1751.0 1463.7 1370.9 1388.8 81.7 P=0.33
Assessment of methane emission in dairy production systems based on existing
feed resources through GLEAM model under different climatic zones of
Bangladesh and their mitigation options
NR Sarker and MK Bashar
Bangladesh Livestock Research Institute, Savar, Dhaka-1341
Executive summary
The Global Livestock Environmental Assessment Model (GLEAM) is a modeling framework that
simulates the environmental impacts of the livestock sector. Enteric methane (CH4) has been
generated in the gastrointestinal tract of livestock is the single largest source of anthropogenic CH4
which is responsible for Green House Gas (GHG). GHG resulting global warming is the burning
issues that impact on human health, crop and livestock production and environment pollution. In
Bangladesh, 82% of CH4 production comes from rice field and livestock production with 43 % being
due to enteric fermentation and manure
breakdown from livestock production.
Keeping the above factors in view, the
present research work was undertaken to
(i) assess the enteric methane emissions
from dairy cattle through GLEAM
model and (ii) demonstrate the
mitigation options by adaptation of
feeding interventions. For calculating
the enteric methane emission from dairy
animal through GLEAM model, a semi-
structural
questionnaire
was formulated
and a total of
fifty (50)
farmers were
included from
five districts
namely coastal
area (Bhola),
saline prone area (Sathkhira), river basin area (Pabna), drought prone area (Chapainobabganj) and
poor feed base area (Nilphamari) under this study. In addition, two lactating cows in each farmer
were also selected for collecting the necessary information e.g. existing feeding practice, feed
resources, feed intake; both roughages and concentrate , water intake, productive and reproductive
parameters for seven days in each site considering two seasons dry (November – February) and wet (
June- October). Temperature and humidity were recorded in the respected season. The data were
analyzed through Completely Randomize Design (CRD) to evaluate the enteric methane emission.
The farm practice of roughage feeding and their actual amount were shown in Fig.1. The study
revealed that the consumption of rice straw in drought Prone area was the lowest where as the highest
amount of rice straw was consumed in poor Feed based area which was 45% or 75% of the total
roughage. But, the farmer in drought prone area supplied the highest amount of Napier grass that was
40%. It was double compared to the other climatic zones. Feeds and nutrient intake by dairy cows in
different climatic zones of Bangladesh are shown in Table 2. Crude Protein (CP) and Metabolizable
Energy (ME) requirements among the different areas did not differ significantly (P>0.05). But the
dairy cows reared in river basin area were consumed significant (P=0.04) amount of dry matter (DM)

Proceedings of the Annual Research Review Workshop 2018, BLRI, Savar, Dhaka 1341, October 09-10, 2018
42 Technical Session III
Table 02: Production performance and their methane production of crossbred dairy cows
Parameters Different Climatic Zones Significance
River
basin area
Drought
prone
area
Poor Feed
Based area
Saline
Prone area
Overall
SE
Level
Ave. live weight (kg) 283.8 276.3 248.8 282.3 8.09 P=0.39
AM prods. (kg/day) 9.06ab
7.74b 7.40
b 11.8
a 0.67 P=0.09
4% FCM yield(kg/day) 8.08 7.41 7.54 10.95 0.64 P=0.16
Fat yield(kg/day) 0.29 0.28 0.30 0.41 0.15 P=0.22
Methane production
CH4 prod. (g/day) 565.01a 527.75
ab 440.78
b 448.54
b 18.82 P=0.04
CH4 prod. (g/kg DMI) 34.21b 34.24
ab 34.28
a 34.26
ab 0.01 P=0.05
g CH4/kg milk prod. 77.0b 88.0
ab 99.0
a 91.0
a 0.02 P=0.00
compared to others two zones. The highest amount of DM intake was shown in river basin area
where, dairy cows in poor feed based area consumed the lowest amount of DM (16.5 kg/day vs 12.8
kg/day, respectively). There was no significant difference (P>0.05) on total CP intake from roughage
and concentrate among different zones. The average live weight (kg), 4% Fat Corrected Milk (FCM)
production (kg/day) and fat yield (kg/day) had no significant variation under different climatic zones
of Bangladesh. The average daily milk production (11.8 kg/day) of dairy cows under saline prone
area was significantly higher (p=0.09) than that of drought prone area and poor feed based area (7.74
kg/day and 7.40 kg/day, respectively) and their differences were significant. But the dairy cows
reared under poor feed based area was produced significant (p=0.05) amount of methane from DMI
and per kg milk production that was 34.28 g and 99.0 g respectively, compared to river basin area
that produced 34.21g and 77.0g respectively, which was significantly different. Figure 2 Shows that,
with the increase in milk production, methane production decreased linearly (R2=1). So, balance feed
may be the options in different climatic zones to reduce the enteric methane emission that converted
to energy and finally positive impact on livestock production in Bangladesh.
Acknowledgement: This project was funded by PIU-BARC, NATP-2

Session IV
FEEDS, FODDER AND NUTRITION

Proceedings of the Annual Research Review Workshop 2018, BLRI, Savar, Dhaka 1341, October 09-10, 2018
43 Technical Session IV
Study of production and supply chain development of Moringa feed (Mf) in different
regions of Bangladesh
N Sultana, MK Bashar, NR Sarker, SMJ Hossain and KS Huque
Animal Production Research Division, Bangladesh Livestock Research Institute, Savar, Dhaka 1341
Executive summary
Moringa (Moringa oleifera), a plant fodder being researched and found responsive to increasing
production and productivity of small (Sultana et al. 2012) and large ruminants (Huque et al 2016;
Foidl et al. 1999; Sanchez et al., 2006 ;), and also poultry (Sarker et al., 2017) was identified as one
of the best options of the
growing demand of
quality feed in
Bangladesh. Keeping the
above factors the present
research work was
undertaken to (i)
determine the Moringa
feed (Mf) production in
on farm condition (ii)
determine feeding
impacts of Moringa
pellet feed on RCC
growing bulls and (iii)
develop value added
Moringa food products.
For determining the Moringa feed production at farmers fields the best agronomical practices in on-
station was implemented to the on-farm condition. A uniformly plain land area of 1296.0 m2 was
divided into four replications, each of 18X18 sq m2 separated by 1.0 meter wide walking alleys. Each
plot was planted 1080 sampling at a space of 0.3mx0.3m per sampling. After 125 days of planting,
first Moringa harvest was occurred then it
was continued after 60 days interval with
40 cm above the ground level and
analyzed the data in a t- test to determine
the production response of on station and
on-farm condition. The production
performance and their chemical
composition of Moringa fodder at on-
station and on-farm condition is shown in Table 1. The average no. of prunes of Moringa at on-farm
condition was significantly (p<0.05) higher (3.5 vs 5.07) than that of on-station. It becomes bushier
than on-station. The survivability was not significantly (P> 0.05) affect by two climatic zones and it
varied from 95.5 to 95.7 percent. The annual dry matter (DM) yield of tops at on-farm condition was
the highest (26.6 ton/ha) compared to on-station (22.7 ton DM/ha/year) and their differences were
significant (p< 0.05). The leaf to stem ratio was similar and their difference was not significant. The
DM, ash and CP content of tops of Moringa foliage did not differ significantly between the
treatments. But the ADF content of Moringa tops was significantly (p<0.05) higher in on-station
condition followed by on-farm. For determining the Moringa pellet feeding impact on meat
production, twenty RCC growing bulls aged 18-24 months with average live weight (186.05±0.02)
were selected and divided into four dietary groups having five animals in each group. During 125
days feeding period including 10 days for adjustment and 7 days for digestibility trial; all
experimental bulls were fed a control diet consisting of 60:40 ration (DM basis) of maize silage and a
concentrate mixture (Table 2) of wheat bran-45%, Khesari bran-20%, crushed wheat-25%, soybean
meal-12%, DCP-1% , mineral mixture-1% and salt-1%. The concentrate of the control diet was
replaced by Moringa pellet feed (60:40) in diet T1; Moringa mash feed (60:40) in diet T2 and control
Table 1. Production performance and quality of Moringa foliage
Parameters
Production Performance Significance
On- Station On-Farm t-value Level
Survival rate (%) 95.5 95.7 -0.10 NS
No of Prunes/plant 3.5 5.07 -4.5 *
DM yield; ton/ha/y 22.7 26.6 -7.7 *
Leaf to stem 0.45 0.45 -0.72 NS
Chemical Composition of tops (g kg-1
)
DM 197.0 200.1 -0.17 NS
Ash 50.9 49.1 -4.5 NS
CP 216.8 206.6 1.6 NS
ADF 331.7 315.3 -3.5 *
Table 2. Chemical composition of different feeds
Experimental diet %, Chemical composition (DM basis)
DM CP ADF NDF
Maize Silage 19.38 7.93 50.97 62.57
Con. mixture 89.91 17.08 35.36 51.04
Moringa feed 89.01 16.75 32.89 40.73

Proceedings of the Annual Research Review Workshop 2018, BLRI, Savar, Dhaka 1341, October 09-10, 2018
44 Technical Session IV
diet with additives (Catafox) in diet T3. All the four concentrate diets were iso-nitrogenous. Feeding
response of different diets on different parameters was analyzed in an ANOVA of a Completely
Randomized Design (CRD).
Table 3. Effect of supplementation of Moringa pellet feed on nutrient intake of RCC growing bulls
Parameters Experimental rations Significance
T0 T1 T2 T3 Overall SE P- value
TDMI(kg/day) 4.11±0.2 4.0±0.21 3.76a±0.2 3.92±0.15 0.09 0.65
TMEI(MJ/day) 41.2±1.9 40.2±2.1 37.7±2.3 40.4±1.6 0.97 0.62
TCPI(g/day) 503.8±28.1 455.0b±26.5 427.5±25.2 503.6±23.5 14.09 0.13
Here, T0= Control (only concentrate); T1= Moringa pellet feed; T2= only Moringa Mash Feed and T3= Control
with additives, Figures with different superscript in the same row differ Non significant
The replacement of
concentrate mixture by
Moringa pellet feed had
no effect on daily DM,
CP or ME intake (Table
3). But the average daily
live weight gain of RCC
bulls was increased
significantly (p=0.01)
when Moringa pellet
was added to the control diet and it also decreased the FCR from 5.3 in control diet to 4.8 in the
Moringa pellet feed diet in T1 without showing any significant changes. Fig1 shows that feeding of
Moringa pellet feed decreased the cost of
production from Tk.111 to Tk. 75 with
controls with additive group and also shown
the lowest FCR that was 4.8. BLRI made
some Moringa food products like Moringa
tea and Moringa capsule with Moringa
Private Ltd as a nutritional supplementation
for human health. The result so far
generated that Moringa is cultivated as a
commercial fodder crop at farmer level and
the feed produced from it was increased
daily live weight gain of growing bulls and
reduction in cost of production. However,
the effect of Moringa feed on keeping
quality and meat quality needs to be
determined through further research. The
seasonal impacts on Moringa production on
station and on farm needs to be determined
through continuation of its cultivation in
subsequent years.
Table 4. Feeding effect on growth performance of RCC growing bulls
Parameters Experimental rations Significance
T0 T1 T2 T3 Overall SE Level
Initial Live weight (kg) 186.4 186.6 184.6 186.6 7.29 P=1.0
Final Live weight (kg) 236.5 238.7 223.1 233.7 7.63 P=0.90
ADG (gm/day) 807.1a 839.4
a 620.0
b 759.8
a 4.42 P=0.01
FCR 5.3 4.8 6.1 5.2 0.22 P=0.23

Proceedings of the Annual Research Review Workshop 2018, BLRI, Savar, Dhaka 1341, October 09-10, 2018
45 Technical Session IV
Feeding oil versus calcium salt of n-3 and n-6 fatty acid on feed intake, digestibility,
enteric methane emission and blood metabolic profile in cattle
SM Amanullah, MM Rahamn, MA Kabir and SMJ Hossain
Biotechnology Division, Bangladesh Livestock Research Institute, Savar, Dhaka 1341
Executive summery
The recent trends of feeding n-6 and n-3 fatty acids (FAs) sources are due to their enormous health
benefits for human through animal product. Feeding rumen protected fat by producing calcium salt
(Ca-salt) of FAs, can effectively overcome the biodegradation loses though increase the calcium
supply in the diet. The objectives of this study were to know effects of dietary oils and Ca-salt sources
of n-3 and n-6 FA on feed intake, digestibility, blood metabolic profile, rumen fermentation, enteric
methane emission and fatty acid profile in bull. For this purpose, sunflower oil (SFO) and linseed oil
(LSO) was collected as the source of n-6 and n-3FA, respectively. These oils were used to prepare Ca-
salt on n-3 and n-6 FA, respectively in the laboratory. Four rumen cannulated bulls were used in 4 x 4
Latin square design (LSD) for this purpose. Animals were housed individually in digestion crates and
supplied with Napier silage and concentrate mixture. Four dietary treatments were SFO (oil source of
n-6 FA), LSO (oil source of n-3 FA), Ca-salt of SFO (Ca-SFO, protected source of n-6 FA) and Ca-
salt of LSO (Ca-LSO, protected source of n-3 FA). Oils or salts were mixed with the concentrate part
(Broken wheat, 37%; Khesari bran, 25%; Wheat bran, 20%; till oil cake, 12%; DCP, 2.50% and salt,
0.50%) of the ration at 3% of fresh weight. The formulated four diets contained 64.23% n-6 FA,
47.66% n-3FA, 60.16% n-6FA and 37.98% n-3FA according to the treatment SFO, LSO, Ca-SFO and
Ca-LSO. In 4 x 4 LSD, diets were rotated among the animals in four different periods, consisting of
15 days for each period. The first 10 days of each period was for adaptation with the diets and the last
5 days was for sample collection. Feed refusal (orts) of every day was weighted and intake was
calculated by subtracting refusal from the supplied amount. Representative samples of silage, feed and
feces were collected, composited and subjected to chemical analysis separately. Rumen fluid and
blood samples were collected at 3 hours after morning feeding on the 4th and 5
th day of collection
period from each treatment animal, respectively. The pH of rumen fluid was measured and blood was
centrifuged to obtain plasma immediately after collection. Variation of data were subjected to
analyzed for Analysis of Variance (ANOVA) in 2x2 factorial design using repeated measures in
General Linear Model (GLM) in SPSS 20, where, Factor 1 was FA (n-6 vs n-3) and factor 2 was
sources of FA (oil vs Ca-salt).
It was observed that intake and digestibility of DM, OM, CP, EE, ADF and NDF were significantly
(p<0.05) reduced by feeding Ca-salt compared to oil sources of n-6 and n-3 FA (Table 1). Table 1
also showed that there were a significant interaction effect in CP (P<0.01) and NDF (P<0.05) intake
as well as NDF (P<0.05) digestibility. The CP and NDF intake was found reduced in Ca-salt of n-6
and n-3FA than oil diet as well as n-3 FA than n-6FA irrespective of sources, while NDF digestibility
was increased only in Ca-salt of n-3 FA. The EE intake and DM, OM and EE digestibility were
significantly (P<0.01) increased in n-3 FA compared to n-6 FA diet irrespective of sources. The
dietary effect of oil and Ca-salt of n-6 and n-3FA sources on plasma metabolic profiles are described
in Table 2. The plasma glucose, urea nitrogen (BUN), cortisol and IgF-1 were neither affected
(P>0.05) by FA (n-6 or n-3), nor by FA sources (oil or Ca-salt).However, total cholesterol, LDL and
IgG were reduced (P<0.01) by both the Ca-Salt of n-6 and n-3 FA. On contrary, HDL and insulin
content was increased (P<0.01) by the Ca-salts irrespective of n-6 or n-3 FA. The HDL and
triglyceride concentration was found higher (P<0.05) in n-3 FA irrespective of sources, while LDL
was reduced (P<0.01) by the same. However, there was no FA x Source interactions for any of these
parameters studied. The dietary effect of oil and Ca-salt of n-6 and n-3FA sources on ruminal pH
concentrations and methane production (%) at different feeding hours are also described (Table not
shown). Ruminal pH content at 0, 3 and 6 hours of feeding were neither significantly altered by n-6
and n-3 FA, nor by FA sources but in all treatment cases reduced with the increment of feeding hours.

Proceedings of the Annual Research Review Workshop 2018, BLRI, Savar, Dhaka 1341, October 09-10, 2018
46 Technical Session IV
Table 1. The dietary effect of oil and Ca-salt of n-6 and n-3FA sources nutrient intake and digestibility
Parameters studied Treatments SEM P-value
n-6 n-3
Oil Salt Oil Salt FA Source FA x Source
Nutrient Intake, Kg/d
DMI 6.35 6.13 6.52 6.16 0.119 0.416 P<0.05 0.553
OM 5.71 5.50 5.95 5.40 0.121 0.573 P<0.01 0.184
CP 0.54 0.51 0.57 0.47 0.008 0.446 P<0.01 P<0.01
EE 0.21 0.19 0.25 0.21 0.005 P<0.01 P<0.01 0.096
ADF 2.50 2.47 2.68 2.46 0.044 0.070 P<0.05 0.057
NDF 4.72 4.71 5.01 4.46 0.098 0.841 P<0.05 P<0.05
Digestibility (%)
DM 56.09 55.10 63.33 56.25 1.535 P<0.05 P<0.05 0.071
OM 60.13 60.09 65.98 61.35 1.116 P<0.01 P<0.05 0.062
CP 62.84 59.83 63.47 56.51 1.131 0.257 P<0.01 0.106
EE 46.02 42.89 56.70 49.42 1.662 P<0.01 P<0.01 0.235
ADF 37.98 34.21 40.56 34.47 1.181 0.251 P<0.01 0.345
NDF 54.99 54.72 59.39 60.35 1.260 0.568 P<0.01 P<0.05
In all feeding hours (at 0, 2 and 4 hours after feeding) methane production (%) were significantly
(P<0.05) reduced by oils sources compared to Ca-salt of n-6 and n-3 FA, while except 2 hours after
feeding (reduced, P= 0.194) methane production were significantly (P<0.01) reduced with n-3 FA
compared to n-6 FA diet irrespective of sources. However, there was no FA x Source interactions for
methane production at any feeding hours studied.
Table 2. The dietary effect of oil and Ca-salt of n-6 and n-3FA sources on plasma metabolic profiles
Parameters studied Treatments SEM P-value
n-6 n-3
Oil Salt Oil Salt FA Source FAxSource
Glucose(m mol/L) 3.90 3.80 3.60 3.58 0.157 0.121 0.698 0.816
Urea nitrogen, mg/dl 25.38 29.03 26.63 28.50 1.317 0.788 0.058 0.513
Cholesterol, mg/dl 126.95 122.67 124.89 121.04 0.938 0.072 P<0.01 0.822
HDL, mg/dl 69.06 70.36 73.57 78.40 1.007 P<0.01 P<0.01 0.105
LDL, mg/dl 55.03 51.51 48.71 42.29 1.276 P<0.01 P<0.01 0.279
Triglyceride, mg/dl 9.54 9.49 10.05 10.76 0.299 P<0.05 0.284 0.227
Cortisol, μg/dl 1.08 1.08 1.05 1.09 0.095 0.938 0.816 0.857
IgG, ng/dl 13.93 11.54 14.92 10.95 0.367 0.600 P<0.01 0.053
IgF-1, g/L 1.03 1.15 1.01 1.08 1.276 0.739 0.479 0.856
Insulin, μIU/ml 1.43 2.64 1.58 2.49 0.938 0.072 P<0.01 0.822
Results suggested that Ca-salt of n-6 and n-3 FA was reduced DM intake and nutrient digestibility,
while reduced total cholesterol and LDL, but increased HDL concentration in plasma of cattle.
Results also suggested, oils compared to salt of n-3 and n-6 FA reduced more methane gas production,
while n-3 FA source reduced more compared to n-6FA. More research in future is needed to derive a
precise conclusion.

Proceedings of the Annual Research Review Workshop 2018, BLRI, Savar, Dhaka 1341, October 09-10, 2018
47 Technical Session IV
Development of probiotic feed supplement for calves and their evaluation
SM Amanullah1, RJ Tamanna
2, MA Samad
3 and SMJ Hossain
1
1Biotechnology Division,
2Competitive Research Grant (CRG) Sub-project no. 790 (PIU-BARC-
NATP-2), 3Animal Health Research Division, Bangladesh Livestock Research Institute, Savar, Dhaka
1341
Executive summary
The objectives of this research were to develop probiotic feed supplement for calves preferably of
Lactobacillus acidophilus (LAB), Bacillus subtilis (BS) and Sacharomyces cerevisae (SC); their
evaluation in terms of chemical, microbial and shelf-life characteristics and finally testing the best
selected feed on fecal microbial load, growth performance and blood metabolites of milk-fed calves.
Commercial sources were used to isolate target microbes using selective agar media and five feeds
were developed based on wheat bran (WB), rice polish (RP), lentil powder (LP), WB fortified with
LP at 4:1 ratio (WB+LP) and RP fortified with LP at 4:1 ratio. Each base substrate was mixed with a
solution containing water, molasses and mixed bacterial culture followed by incubation at 37 C for 3
days. After 3 days, feeds were found dried and clumpy in physical form and microbial count was very
low, but high in pH. Therefore, a second formulation was made by changing composition of
„molasses-bacteria solution‟ and incubation time was increased to 6 days. Feed based on sole LP was
removed as color and odor of this feed was unpleasant. After 6 days of incubation, feeds were found
in very good physical condition. The pH was down from 6.0 in fresh feed to 4.3 in probiotic feed on
an average, and remained constant throughout the period of shelf-life study (status of pH, NH3-N,
microbial count, DM & CP) for 35 days. The concentrations of LAB, BS and SC were very high and
sufficient to work as probiotic feed and remained constant as like pH remained. The dry matter (DM),
crude protein (CP) and NH3-N concentrations were good enough to keep probiotic feed quality in
good. After evaluation it was found that these four feeds were all potential to be used as probiotic feed,
however, sole RP and WB based feeds were found better than others. Then these two feeds were
further subjected to a different approach of shelf-life study for the determination of probable expire
date after manufacturing.
The WB based probiotic feed was selected for evaluation on growth performance, blood metabolites
and calf health. Twelve 2 weeks old RCC calves were selected and distributed equally in two groups
maintaining gender (3 ♂ + 3 ♀) and live weight (20.68 vs 21.20 kg) balance between the groups.
Calves were reared in individual pan and provided with ad libitum suckling, calf starter according to
manufacturer‟s (ACI-Godrez) recommendation and ad libitum green grass (German grass). Mineral
block was provided for licking and fresh clean drinking water was supplied for all the time. The
probiotic fed group was supplied with developed probiotic feed, while the control/placebo group was
supplied with same feed substrate without probiotic microbes. The trial was continued for 90 days and
data were collected on growth performance, blood metabolic profile, immune status, fecal microbial
load, morbidity etc.
It was observed that milk intake, dry matter intake (DMI), daily gain and feed conversion ratio (FCR)
were not differ (P>0.05) between the control and probiotic fed group (Data are not shown). Physical
properties of feces, comprising color, odor and consistency, it was found that claves under probiotic
fed group voided feces of better physical properties compared to the control (Data are not shown). On
an average, 13% cases of yellowish/yellow/yellow-green feces with bad odor in control compared to
6.6% in probiotic group were observed. Similarly, consistency score of 2.12 vs 2.04 (higher number
indicate more loose motion) was observed in the control vs probiotic group, respectively, while the
cases of diarrhea were observed 14 vs 7.0, respectively. The E. coli count (log10 CFU/g) in feces at
onset of trial (Day 1) was found 7.87 vs 8.16 in the control vs probiotic group, respectively that was
not differ significantly (P>0.05). However, from the Day-15 onward, up-to the end of the experiment,
weekly E. coli count (log10 CFU/g) in feces was found significantly ((P<0.01) lower in probiotic group
compared to the control. Again, Salmonella was not detected in any of the groups usually at weekly
fecal count, but found 3 cases of Salmonella in concentration of more than 6.0 log10 CFU/g of feces
during 3 cases of diarrhea. At the end (90 d) of the trial, LAB, BS and SC counts in feces of probiotic

Proceedings of the Annual Research Review Workshop 2018, BLRI, Savar, Dhaka 1341, October 09-10, 2018
48 Technical Session IV
group were observed 9.11, 4.11 and 3.63 log10 CFU/g, respectively, while in the control only LAB
was found at a concentration of 6.96 log10 CFU/g, which was significantly (P<0.01) lower than that in
probiotic. Table 2 showed the results of blood metabolic profile as affected by probiotic feed. The IgG
(ng/ml) concentration was found significantly higher (P<0.05) in probiotic group than in the control,
and the total cholesterol level was tended to be high in the same (P=0.071). All other metabolites were
not differed significantly (P>0.05) between treatments.
Table 1. Effect of feeding probiotic feed supplement on fecal microbial load.
Control Probiotic SEM Sig.
Eschericia coli
0 d 7.87 8.16 0.259 0.315
15 d 8.22 8.24 0.159 0.874
30 d 8.34 7.44 0.086 <0.001
45 d 8.45 7.36 0.052 <0.001
60 d 8.33 7.46 0.066 <0.001
75 d 8.27 6.71 0.306 0.004
90 d 7.28 6.14 0.128 <0.001
Salmonella spp nd nd - -
Lactobacillus acidophilus (90 d) 6.96 9.11 0.428 0.004
Bacillus subtilis (90 d) nd 4.11 - -
Sacharomyces cerevisae (90 d) nd 3.63 - -
Table 2. Effect of feeding probiotic feed supplement on blood metabolic profile of milk-fed calves
Control Probiotic SEM Sig.
Blood glucose (mmol/l) 3.7 3.9 0.118 0.152
BUN (mg/dl) 31.78 31.68 1.566 0.952
Total Cholesterol (mg/dl) 157.2 171.52 23.857 0.575
HDL (mg/dl) 25.8 37.55 5.136 0.071
LDL (mg/dl) 76.45 82.26 7.562 0.477
Triglyceride (mg/dl) 8.02 10.82 3.733 0.489
Cortisol (µg/dl) 0.52 0.66 0.147 0.401
IgG (ng/ml) 8.38 12.62 1.353 0.026
IgF-1 (g/l) 0.62 0.76 0.419 0.738
Insulin (mIU/ml) 0.76 0.52 0.212 0.319
BUN, Blood urea nitrogen; HDL, High density lipoprotein; LDL, Low density lipoprotein; IgG, Immunoglobulin
G; IgF-1, Insulin-like growth factor-1/Somatotropin-c
It is concluded that, four probiotic feed supplements were formulated potentially to be used for calves,
among which rice polish and wheat bran based feeds were found better considering their quality and
shelf-life. Wheat bran based probiotic feed upon feeding to milk-fed calves from 15 to 105 days of
age resulted improved fecal characteristics, lesser E. coli and Salmonella load, but higher probiotic
microbes shedding in feces, lowered diarrheal incidence and improved immunoglobulin status in
calves.
Acknowledgement: This project was funded by PIU-BARC, NATP-2 (CRG Sub-project No. 790)

Proceedings of the Annual Research Review Workshop 2018, BLRI, Savar, Dhaka 1341, October 09-10, 2018
49 Technical Session IV
Table 1. Chemical composition of experimental diets
Diets DM, % of fresh
biomass
Chemical composition (%DM) GE (MJ/kg,
DM) OM CP ADF NDF Ash
Maize silage 31.63 91.80 7.51 43.67 70.87 8.20 15.82
Conc.mix. 91.71 90.48 17.84 18.62 39.56 9.52 15.32
Table 2. Yield (ton/h/cultivation) and production cost of maize
silage in Charfashion, Bhola
Items Maize
Fresh biomass yield 33.13
Dry matter yield 10.48
Crude protein yield 0.78
Production cost (ton silage DM) BDT 6610 (US$. 79.88)
Price of conc. mixture (Tk./kg DM) BDT 34.98
Buffalo fattening in the Southern Delta of Bangladesh
BK Roy1, N Huda
1, H Biswas
4, N Sultana
1, KS Huque
1 and NR Sarker
3
1Animal Production Research Division,
1Ex-Director General,
3Director General, Bangladesh
Livestock Research Institute, Savar, Dhaka 1341; Upazilla Livestock Officer, Department of
Livestock Services
Executive summary
Buffalo, a unique livestock, nowadays draws a rapt attention for boosting strategic meat or buffen
production of Bangladesh when the country forwards to be a middle-income country in 2021 with 160
million of dense population and a great concern of ensuring their food security. The largest deltaic
floodplain of the world, Bangladesh has a fabulous opportunity to boosting the meat production of the
country using buffalo in delta region. Thus, the present study was undertaken with the objectives: i) to
validate the BLRI developed buffalo fattening technology and quantifies its response to animals raised
by farmers in coastal region and ii) To develop a sustainable and cost effective buffalo fattening
model as income generating and livelihood improvement tool for the farmers. To achieve the above
objectives, coastal region (Charfashion, Bhola) was selected as the experimental site of the study. On
account of that a baseline survey has conducted to perceive the existing production system as well as
socio-economic status of farmers in coastal region. During the time of focus group discussion a
“Buffalo Fattening Farmers Forum” was formed included 20 farmers on the basis of having growing
buffalo bulls and trained them accordingly. For fattening of buffalo, a total of 7.5 acres of land was
hired from the local farmers. Maize (BRAC Grass Bhutta) was cultivated, harvested at their optimum
maturity and ensiled for feeding to experimental animals. A total of 22 local buffalo bulls of age
ranges from 2-3 years were randomly divided into two groups. Farmers reared Buffaloes following
the BLRI developed buffalo fattening technology was considered as experimental treatments denoted
as T1 (intensive feeding system) and buffalo reared under the existing feeding & management
practices (extensive feeding management system) in the study area was treated as control and denoted
as T0. Though, the feed intake of animals under T0 was not quantified, but their growth performances
were recorded accordingly. However, the total number of buffalo bulls under T0 and T1 groups was 07
and 15, respectively. All
the animals under T1
group were reared on a
single plane of nutrition
of a 60:40 mixed diet
(DM basis) of maize
silage and a concentrate mixture of crushed wheat (20%), wheat bran (40%), khesari bran (20%),
soybean meal (15%), common salt (1%), dicalcium phosphate (3%) & limestone (1%). Ad libitum
feeding of Maize (Zea mays) silage during the trial period was ensured by supplying at least 10%
more roughage, and the desired roughage to concentrate ratio (60:40) was adjusted by changing the
daily per head allowances of a conventionally mixed concentrate mixture of 17.84 % CP. Animals
were housed in individual tie stalls and
offered daily rations in two equal meals at
9:00 and 16:00 h. At the onset of feeding
trial the experimental animals were
dewormed with anthelmentics. The
feeding trial was continued for a period of
60 days. The animals were weighed at an
interval of 15 days, and their feed
intake,feed convertion ratio (FCR) and
cost-net profit calculation were done using
Excel computer programme. The growth performance data were analyzed statistically in an ANOVA
of a completely randomized design (CRD) using the compare means with SPSS, 17 computer
software packages.
Proceedings of the Annual Research Review Workshop 2018, BLRI, Savar, Dhaka 1341, October 09-10, 2018
50 Technical Session IV
Table 4. Growth & feed conversion efficiency of buffalo bulls
(Mean±SE)
Parameters T0 (Extensive) T1 (Intensive) F-value Sig.
Initial LW(Kg) 277.9 ±20.3 274.7±10.7 0.02 NS
Final LW (Kg) 297.0±57.9 364.65±13.5 8.72 **
Total LWG (Kg) 19.2±7.9 89.93±3.8 86.0 ***
ADG (Kg) 0.32±0.13 1.50±0.06 86.0 ***
FCR - 6.48 - -
Table 3. Intake of bulls under intensive
feeding & manage condition (Mean±SD)
Parameters Intensive (T1)
DM intake (Kg/d) 9.52±0.48
DM intake (Kg; % LW) 3.12±0.32
DM intake (g/Kg
W0.75
.d)
130.0±0.88
OM intake (Kg/d) 8.70±0.43
CP intake (Kg/d) 1.06±0.08
ADF intake 3.33±0.11
NDF intake 5.63±0.21
Roughage to conc. ratio 65:35±0.03
Table 1 presents the chemical composition of the different
feeds used in the experiments. The DM, OM, CP, ADF and
NDF of maize silage and concentrate mixture was 31.63,
91.80, 7.51, 43.67, and 70.87 and 91.71, 90.48, 17.81,
18.62 and 39.56 percent, respectively. The yield of fresh
biomass, Dry matter, and crude protein yield of Maize
(BRAC Grass Bhutta) fodder cultivated in Charfahion,
Bhola were 33.13, 10.48 and 0.78 metric tons per hectare
of land. Data from production and processing cost of
maize, it was calculated that the cost involvement for Kg
fresh biomass, Kg fresh silage or Kg DM yield of maize
silage were Tk. 1.47, Tk. 2.19 and Tk. 6.61, respectively.
Similarly, the prices of per kg fresh or kg DM concentrate
mixture were Tk. 31.65 and Tk. 34.98, respectively (Table 2). The feed intake of buffalo bulls under
intensive system (T1) has been presented in Table 3. Its shows that the total per head daily DM, OM,
CP, ADF and NDF intake of
buffalo bulls were 9.52, 8.70, 1.06,
3.33 and 5.63 Kg, respectively.
However, the DM intake of bulls
based on percent live weight and
metabolic body weight were
3.12% and 130 g/d, respectively.
Growth performances and feed
conversion efficiency of buffalo
bulls fed under existing (T0) and intensive feeding management condition are presented in Table 4.
The initial live weight of bulls between the group did not differ significantly (p>0.05). However, the
final live weight of bulls between the groups varied significantly (p<0.01). Bulls fed under the
intensive condition (T1) achieved significantly (p<0.01) higher body weight than bulls those fed with
existing feeding & management condition (T0). Similarly, the average daily gain (ADG) of buffalo
bulls was significantly higher in intensive feeding and management condition than extensive and the
respective ADG was 1.50 Kg and 0.32 Kg. The feed conversion efficiency of bulls fed under the
intensive system was 6.48. The FCR of bulls fed under the existing (extensive) feeding system was
not determined due to lack of feed intak data.
Table 5. Cost (Tk.) involvement of Kg, LWG of buffalo bulls fed under intensive feeding system in Charfashion, Bhola
Roughage cost/Kg
gain
Concentrate cost
/Kg gain
Refusal cost/Kg
gain
Total feed
cost/Kg gain
Management
cost/Kg gain
Total cost/Kg
gain
28.62 75.52 3.82 107.96 26.99 134.96
The cost and net benefit analysis of buffalo fattening under intensive feeding condition in
Charfashion, Bhola revealed that the feed cost, management cost and total cost of Kg live weight gain
were Tk. 107.96, Tk. 26.99 and Tk. 134.96, respectively (Table 5). The cost & benefit analysis of
buffalo fattening under intensive condition in southern delta areas revealed that, the total cost (feed
and management) involved for 60 days fattening was Tk. 11,922.00 per animal. Considering the
market price and dressing percent obtained from on-station research, it was estimated that the selling
price of meat (carcass) along with both edible and non-edible portion was to be Tk. 25,583.00. The
total inputs (total cost) and output involved for 60 days rearing of a buffalo indicated that farmer in
coastal areas may get net profit of Tk. 13,661 from fattening a buffalo following the BLRI developed
buffalo fattening techniques.
Table 6. Cost & benefit (Tk.) analysis of buffalo fattening (60 days) under intensive feeding in Charfashion, Bhola
LWG
(kg)
Feed
cost
Management
cost
Total
cost
Carcass wt
(kg)
Price
carcass
Price of edible/non
edible portion
Total
price
Net
profit
89.93 9538 2384 11922 46.86 19679 5904 25583 13661
From the above discussion, it may be concluded that the on-station based buffalo fattening techniques
developed by BLRI was successfully validated and showed an economically viable system for buffalo
fattening in the coastal areas under the intensive condition.

Proceedings of the Annual Research Review Workshop 2018, BLRI, Savar, Dhaka 1341, October 09-10, 2018
51 Technical Session IV
Development of cost effective complete pellet feed and its utilization for commercial goat and
sheep production
S Ahmed, MRH Rakib, MA Hemayet and MA Jalil
Goat and sheep production Research Division, Bangladesh Livestock Research Institute, Savar,
Dhaka 1341
Executive summary
In Bangladesh, with changing socio-economic conditions, presently there is a little scope for free
grazing of goats and sheep and stall feeding gaining popularity day by day. Feeding system based on
complete pellet feeds may help to develop stall-feeding method for the commercial sheep and goat
production as well as feed manufacturing entrepreneurs. Therefore, the objective of the study was to
develop cost effective complete pellet feed and testing it on animal performances. For this purpose, a
cost effective formulation (40% rice straw and 60% concentrate mixture) of complete pellet feed was
developed based on some previous studies of our group. The concentrate mixture composed of Rice
polish 50%, Maize crush 16%, Soybean meal 20%, Molasses 10%, Salt 2%, DCP 1%, Vitamin-
mineral premix 0.5% and Pellet binder 0.5%. The ground rice straw was mixed very well with
concentrate mixture and finally mixed with required amount of water to passing it to the pelleting
machine. The prepared pellet was then sun dried and stored for animal feeding. Two on-station and
one on-farm experiments were completed with this developed complete pellet feed. Data were
analyzed according to CRD with one way ANOVA by SPSS-19.
Experiment 1. Effect of developed pellet feed on goat production under stall feeding condition (on
station)
Three treatment groups (T1, T2, T3) having 05 Black Bengal castrated male of 4-5 months of age in
each group were used for this trial where T1 and T2 considered as conventional stall feeding system.
The diet of T1 group was ad-libitum oats grass + concentrate mixture @ 1.5% of body weight, T2 fed
ad-libitum UMS +
concentrate mixture @
1.5% of and T3 group was
fed ad-libitum complete
pellet feed. Table 1 shows
the chemical composition of
the experimental diets.
Table 2 shows the effect of
complete pellet feed on the
performances of goat compared to conventional stall feeding. Although, DMI, weight gain and FCR
not differ significantly but considerable low FCR and significantly (p<0.05) low feed cost per kg
weight gain was observed in pellet feeding group (T3).
Table 2. Performances of goat fed pellet feed compare to conventional stall feeding
ab, different superscript in the same raw differ significantly, * p<0.05
No disease or clinical symptoms observed during experimental period. Results suggest that complete
pellet feed would be economic for commercial good production under stall fed condition. The DM,
CP and NDF digestibility (%) were significantly high in T1 (78.74, 85.24 and 77.23, respectively)
Table1. Chemical composition of the experimental diets
Ingredients/feed DM OM Ash CP ADF NDF
Complete pellet feed 91.70 85.71 14.29 13.40 32.24 51.56
Oats grass 13.74 94.22 5.78 16.54 51.6 78.8
UMS 61.73 87.7 12.3 9.45 61.31 73.8
Concentrated mixture 88.55 94.07 5.93 18.65 9.98 35.81
Parameters Treatments SEM Level of sig.
T1 T2 T3
Initial weight, kg 7.01 6.98 7.01 0.266 NS
Final weight, kg 10.14 10.02 11.54 0.411 NS
DMI, kg/day 0.264 0.245 0.272 0.009 NS
DMI, % body weight 3.25 3.03 3.06 0.066 NS
FCR 8.32 8.03 5.7 0.607 NS
Feed cost/kg gain 203.85a 214.74
a 124.22
b 17.297 *

Proceedings of the Annual Research Review Workshop 2018, BLRI, Savar, Dhaka 1341, October 09-10, 2018
52 Technical Session IV
followed by T3 (71.52, 75.41 and 65.67, respectively) and T1 (70.62, 68.35 and 67.26, respectively).
Results indicated that pelleting enhance the digestibility of rice straw (UMS).
Experiment 2. Effect of developed pellet feed on sheep production under stall feeding condition (on
station)
This experiment was conducted with the similar methodology followed by experiment 1. The DMI
and daily weight gain was significantly (p<0.01) increased in Pellet feeding group (T3). Feed cost per
kg weight gain and FCR not differ among the groups. No disease or clinical symptoms observed
during experimental period. The CP digestibility (%) found significantly (p<0.05) high in T1 group
(69.77) followed by T3 (54.75) and T2 (45.72), but the DM, OM, ADF and NDF did not differ
significantly among the treatment groups.
Table 3. Effect of complete pellet feed on the performances of growing sheep compare to
conventional stall feeding.
Parameters Treatments SEM Level of sig.
T1 T2 T3
Initial weight, kg 10.69 11.01 10.80 0.325 NS
Final weight, kg 16.38a 16.84
a 19.86
b 0.639 *
Weight gain, kg 5.694a 5.83
a 9.06
b 0.485 **
Weight gain/day 63.27a 64.78
a 100.67
b 5.388 **
DMI, kg 0.415a 0.427
a 0.768
b 0.045 **
DMI, % body weight 3.07a 3.21
a 5.13
b 0.261 **
FCR 7.11 6.87 7.39 0.201 NS
Feed cost/kg gain 166.35 176.33 169.06 4.992 NS
ab, different superscript in the same raw differ significantly, * p<0.05; ** p<0.01
Experiment 3. On-farm performances of Sheep fed complete pellet feed
The experiment was conducted at Subornachar Upazila under Noakhali district of Bangladesh. Total
14 farmers were selected having at least one male lamb with 4-5 months of age. They were equally
distributed in to two treatment groups having 7 lambs in each group. In T0, lambs were reared under
traditional semi intensive system, while in T1, lambs were reared under stall feeding condition and fed
complete pellet feed. The duration of the experiment was 3 months. Data from above two treatments
were compared to on-station pellet feeding group, which was designated as T2. The results (Table 4)
indicated that daily weight gain increased about 4-5 times due to complete pellet feeding (T1 and T2)
compared to the conventional farmers rearing (T0).
Table 4. Performances of Sheep fed complete pellet feed (on-farm)
Parameters Treatments SEM Level of sig.
T0 T1 T2
Initial weight 9.25 9.85 10.78 0.741 NS
Fina weight 10.82a 15.80
b 19.86
b 1.2497 **
Body weight change 1.57a 5.95
b 9.08
c 0.783 **
Total DMI - 51.14 69.09 3.315 **
FCR - 8.93 7.68 0.450 NS
Feed cost /kg gain - 197.70 168.58 10.053 NS
Daily weight gain, g 22.42a 84.98
b 100.67
b 9.066 **
ab, different superscript in the same raw differ significantly, ** p<0.01
Finally, the results of the on-station and on-farm experiments suggest that body weight gain increased,
FCR and feed cost reduced considerably by pellet feeding. No clinical symptoms and other health
hazards observed due to complete pellet feeding. Therefore, complete pellet feed could be an
alternative ready feed for commercial goat and sheep production under stall fed condition.
Acknowledgement: This project was funded by PIU-BARC, NATP-2

Proceedings of the Annual Research Review Workshop 2018, BLRI, Savar, Dhaka 1341, October 09-10, 2018
53 Technical Session IV
Development of cost effective crop residues based Total Mixed Ration (TMR) for
Ruminant: On farm validation of TMR technology for dairy cow
N.R. Sarker, D. Yeasmin, F. Tabassum and M.A. Habib
R eeddoFdcdtdsPotneopdldv D dneohd adse ,oetntvtedcPoclldce skoFdcdtdsPosncelened,ortltd,o pPtkto
1431
Executive summary
Feed cost is a major deterrent to economic milk production of milking animals. It can be moderated
by replacing concentrate in some extent with good quality forage and feeding it in the form of a
complete ration to minimize wastages. This study depicts the effect of feeding maize stover based
complete ration on feed intake and efficiency, milk production and composition and economic
outcome in lactating cows. This field trial was carried out for a period of 60 days on 10 lactating
animals belonging to the farmers of Alokdiar village at Baghabarighat, Shahzadpur upazilla in
Sirajgonj district. The selected cows were in 1st
to 3rd
lactation at early stage (1-2 months) of
production and were divided into two homogenous groups. In control group (T0), animals were
provided conventional feeds comprising of 20.0 kg Napier grass, 5.0 kg paddy straw, 2 kg pellet feed
(ProvitaR) and 10.0 kg concentrate mixture (composed of 5kg wheat bran, 2 kg kheshari bran, 2 kg red
gram bran and 1.0 kg til oil cake), while animals in other group (T1) were fed with a complete ration
comprising of chopped maize stover and concentrate with 50:50 proportions according to their
nutrient requirements. The dietary composition for the experimental animals is given in Table 1. The
dry matter (DM), crude protein (CP), organic matter (OM), ash, neutral detergent fibre (NDF), acid
detergent fibre (ADF) contents were 90.33, 15.6, 89.8, 10.2, 39.1 and 21.3 percent, respectively in the
concentrate mixture (T0), and 38.01, 16.7, 89.58, 10.42, 45.2 and 35.7 percent, respectively in
complete ration (T1). The animals in both groups were housed in well ventilated, conventional stalls
maintained under hygienic conditions with individual feeding and watering arrangements. Daily milk
yield was estimated adding two complete milk extraction in a day at 5.30 AM and 4.30 PM, and 4.5%
fat corrected milk yield was computed. Representative milk samples taken once in a week were
collected and stored in sterile bottles and milk constituents (viz. fat, protein, lactose, solids not fat) of
those samples were estimated thereafter by Lactostar by Funk Garber. The data were analyzed by
"IBM SPSS 20.0" statistical program in a completely randomized design (CRD).
The feed intakes of animals supplied with two dietary groups are shown in Table 2. Although, fresh
feed intake in T0 group was significantly higher than T1 group, but DM intake did not differ between
Proceedings of the Annual Research Review Workshop 2018, BLRI, Savar, Dhaka 1341, October 09-10, 2018
54 Technical Session IV
groups. CP intake was significantly higher in T1 group than T0 group. Differences were not significant
in case of dry matter intake on %live weight (DMI%LWT) of animals between groups.
Milk production and composition of two treatment groups were shown in Table 3 and 4. There were
significant differences observed in milk yield between two groups. Highest milk yield was observed
in T1 group.
Significant difference was observed in fat% of milk in two groups. However, there were no significant
differences of protein, lactose and SNF contents in milk between groups. Highest fat% was obtained
in T1 group.
At the end of the whole experiment, economic analysis was conducted based on feed cost and income
from milk of two treatment group as shown in Table 5. In this experiment maximum profit was
obtained in T1 group.
Based on the results, it may be concluded that feeding of maize stover based complete ration (TMR)
improved substantial amount of milk yield and milk composition, with concurrent reduction in the
cost of milk production.

Proceedings of the Annual Research Review Workshop 2018, BLRI, Savar, Dhaka 1341, October 09-10, 2018
55 Technical Session IV
Study of diversification and upgradation of market waste vegetable based feed manufacturing
system
NG Das, N Sultana, BK Roy, SM Amanullah and MA Jalil
Bangladesh Livestock Research Institute, Savar, Dhaka 1341
Executive summary
Recycling of market vegetable wastes as feed using sustainable technology may increase feed
availability of the country and save environment from pollution. The objectives of this study were to
investigate nutrient value of ensiled vegetables waste and its suitability as alternative to conventional
feed for ruminants. Cabbage and cauliflower leaf (CL; 3:1, as fresh), after dewatering (DCL), was
ensiled alone (DCL0) or with 5% molasses (DCLm) or 5% molasses including either of 10% wheat
bran (DCLmWB), rice polish (DCLmRP) or rice straw (DCLmRS) as absorbents in 5 replicates of 35 kg
plastic drums. After 45 days of ensiling, they were evaluated regarding physical and fermentation
properties for determining their silage quality. After evaluation, based on results, 2 silages were
selected for testing on animal performances. Fifteen indigenous lambs of 9.92 (±1.25) kg initial live
weight (LW) were divided equally into 3 groups having 5 lambs in each and assigned to fed maize
silage (120 d maturity; ensiled 25 d), mixed silage (maize and DCLmRS, 1:1, fresh) and DCLmRS (108 d
ensiled) as basal diet for 90 d to appetite, while supplementing similar concentrate at 1.5% of LW to
all lambs in order to evaluate its suitability as a replacement of conventional roughage. The
concentrate mixture was consisted of fresh wheat bran (30%), maize broken (30%), soybean meal
(20%), kheshari
bran (16%),
DCP (1%),
common salt
(1.5%) and
protein
concentrate
(1.5%).
Chemical
analysis was
done according
to AOAC
(2004). Data
were analyzed
with the analysis
of variance
(ANOVA) of a completely
randomized design (CRD) by
SPSS 11.5.
The color, smell and structure
of silages indicated that
DCLmWM, DCLmRP, and
DCLmRS silages were of
excellent quality. In
fermentation properties (Table
1), level of pH, DM (% fresh),
Flieg point, lactic acid bacteria
and total volatile fatty acid
differed significantly (P<0.01),
and found that DCLmWM,
DCLmRP, and DCLmRS silages
were successfully ensiled.
In feeding trial, live weight
Table 1. Fermentation properties of silage
Parameters Different types of DCL silage
SEM P
values DCL0 DCLm DCLmWB DCLmRP DCLmRS
pH 5.88c 5.21
b 4.34
a 4.33
a 4.23
a 0.19 <0.01
DM, % fresh 12.28c 16.86
b 25.08
a 24.82
a 24.18
a 0.67 <0.01
Flieg point <0.00c 30.16
b 81.54
a 81.36
a 84.06
a 7.78 <0.01
LAB, Log10 cfu/g 0.00d 5.81
c 6.51
b 7.48
a 6.04
b 0.49 <0.01
TVFA, mM/L 21.00c 29.20
b 32.40
bc 36.00
a 32.0
bc 2.93 <0.01
DCL, dewatered cabbage and cauliflower leaf (3:1 as fresh); DCL0, 100% DCL
silage, DCLm, DCL with 5% molasses silage; DCLmWB DCLmRP or DCLmRS, DCL
silage with 5% molasses and 10% of either wheat bran (WB) or rice polish (RP)
or rice straw (RS); DM, dry matter; LAB, lactic acid bacteria; cfu, colony forming
unit); TVFA, total volatile fatty acids; SEM, standard error of mean; P<0.05,
significant; abcd
, means with different letters within same raw are significantly
different (P<0.05).
Table 2. Nutrient intake and live weight gain of lambs
Parameters Different types of silage
SEM P
values Maize Mixed DCLmRS
Initial LW, kg 9.79 10.06 9.90 1.34 0.951
Final LW, kg 19.72 21.57 22.59 1.78 0.070
Average LW, kg 14.76 15.82 16.25 1.46 0.288
Gain, g/d 110b 128
ab 141
a 13.26 0.011
Silage DM intake, g/d 195c 221
b 298
a 12.51 <0.01
Conc. DM intake, g/d 139b 144
a 144
a 0.08 <0.01
Total DM intake, g/d 334c 364
b 442
a 12.49 <0.01
OM intake, g/d 291c 320
b 407
a 111.0 <0.01
CP intake, g/d 42.71c 54.53
b 69.21
a 0.93 <0.01
Mixed silage, mixture of fresh maize silage and DCLmRS silage at
50% each; DCLmRS, DCL silage with 5% molasses and 10% of rice
straw (RS); LW, live weight; DM, dry matter; OM, organic matter;
CP, crude protein; SEM, standard error of mean; P<0.05,
significant; abc
, means with different letters within same raw are
significantly different (P<0.05).

Proceedings of the Annual Research Review Workshop 2018, BLRI, Savar, Dhaka 1341, October 09-10, 2018
56 Technical Session IV
(LW) gain of lambs increased significantly (P<0.01) when maize silage was replace with DCLmRS at
50% or 100%, which might be attributed to significantly higher (P<0.01) dietary dry matter (DM),
organic matter (OM) and crude
protein (CP) intake (Table 2). Dietary
DM intake in DCLmRS silage diet
corroborates with the maintenance
requirements of lambs according to
BSTI (2008) (440 g/d), but low in
other diets. However, CP intake,
irrespective of diets, was above the
maintenance requirements of lambs
(33 g/d; BSTI, 2008).
Digestibility coefficient of DM and
OM was not affected due to replacing
maize silage with DCLmRS (P>0.05)
(Table 3). However, significantly
higher N balance in lambs of DCLmRS
silage diet was resulted from higher N
intake in DCLmRS silage diet compared
to maize silage diet (P<0.01).
Similarly, intake of GE, DE and ME
was increased significantly (P<0.01)
when maize silage was replaced with DCLmRS silage. According to Oliveira et al. (2017), N balance of
lambs of all dietary groups (6.81-10.85 g/d) was above the maintenance requirement (3.5-3.9 g/d).
Similarly, ME intake of lambs (2837-3358 kJ) was above their requirements (1760-1930 kJ; Oliveira
et al., 2017).
During metabolic trial, a strong and significantly linear relationship existed between daily gain and N
balance {y (N, g) = 0.013 × gain (g) + 7.159, r =
0.555, n = 13; P<0.05}, irrespective of diets (Figure
1). Relationship between daily gain and ME intake
was also significant {y (ME, MJ) = 5.978 × gain
(g) + 2555; n = 14; r = 0.716; P>0.0005}. It seems
that daily maintenance requirement of N was
(7.159 g) within range reported by Oliveira et al.
(2017) for tropical hair sheep. Unlikely, ME for
maintenance (2555 kJ) was higher than the reported
values. Estimation of ME for maintenance
according to different methods might not represent
local sheep; a calorimetric study could attribute the
energy efficiency of them more accurately.
It was concluded that DCL might be ensiled
successfully by adding molasses and absorbents at
5% and 10%, respectively; DCL silage with
molasses and rice and straw may be fed lambs,
replacing conventional roughage.
Table 3. Digestibility and metabolism of nutrients
Parameters Different types of silage
SEM P values Maize Mixed DCLmWB
Digestibility coefficient
DM 0.62 0.60 0.58 0.05 0.554
OM 0.54 0.57 0.58 0.04 0.441
N intake, g/d 7.31a 9.39
b 11.53
c 0.22 <0.01
N in feces, g/d 0.22 0.22 0.23 0.03 0.564
N in urine, g/d 0.28 0.34 0.44 0.09 0.062
N balance, g/d 6.81a 8.83
b 10.85
c 0.19 <0.01
GE intake, kJ/d 7004a 7547
b 8560
c 339 <0.01
DE, kJ/d 3460a 3958
a 4868
b 388 <0.01
ME, kJ/d 2837a 3245
a 3358
b 318 <0.01
Mixed silage, mixture of fresh maize silage and DCLmRS
silage at 50% each; DCLmRS, DCL silage with 5% molasses
and 10% of rice straw (RS); DM, dry matter; OM, organic
matter; N, nitrogen; GE, gross energy; DE, digestible
energy; ME, metabolizable energy; SEM, standard error of
mean; P<0.05, significant. abc
, means with different letters
within same raw are significantly different (P<0.05).
Figure 1. Relationship between daily live weight
gain (g/d) and N balance (g/d) or ME intake (kJ/d)
of lambs. Solid line and closed circles represent
ME, while dotted line and open circles represent N.
y = 5.978x + 2555
R² = 0.512
y = 0.0136x + 7.1599
R² = 0.3088
6
8
10
12
2500
3500
4500
0 70 140 210 280
N b
ala
nce
, g
/d
ME
in
tak
e, k
J/d
Gain, g/d

Proceedings of the Annual Research Review Workshop 2018, BLRI, Savar, Dhaka 1341, October 09-10, 2018
57 Technical Session IV
Strategic development of feeding and management techniques to improve the
performance of egg and meat type chicken and their qualities
MSK Sarker1*
, MR Hassan1, MAG Rabbani
1, S Sultana
1, MRA Sumon
1, F Sharmin
2, S Faruque
1, SM
Amanullah3 and NR Sarker
1
1Poultry Production Research Division,
2Post-Doctoral Research Fellow,
3Biotechnology Division,
Bangladesh Livestock Research Institute, Savar, Dhaka 1341; Corresponding author:
Executive summary
Study 1. Dietary cottonseed meal on the growth performance, dressing yield, organ development and
meat composition in broiler chicken
A feeding trial with broiler chicken was conducted to know the effect of cottonseed meal on the
growth performance, dressing yield, organ development and meat composition. A total of 288 day old
chicks were considered to be used cottonseed meal as feed additives in broiler diet. The treatments
were control (basal diet) and other 5 different levels of CSM powder (1%, 1.5%, 2.0%, 2.5% and
3.0%) with basal diet. The broiler chicks were distributed in 6 different dietary treatments having 48
chicks in each with 4 replications and each replication contained 12 chicks. The experimental design
was completely randomized design and the management practices were standard with dietary
requirement. All the data were analyzed using SAS statistical analysis software. Highest weight gain
(2295g/bird) was obtained in the 2% CSM fed group compared to other dietary groups with the lowest
FCR (1.61) among the CSM added groups. The highest European Feed Efficiency Factor (EPEF) was
calculated in 2% CSM added group among the cottonseed meal fed groups. The higher the EPEF
value, the better the technical performance. The breast and thigh meat content in CSM fed (2%) group
was observed 565 g/b compared to control 547 g/b and other CSM fed birds. Addition of CSM
enhanced about 1% dressing percentage (74.22%) compared to control (73.20%) except the highest
level (3%) of CSM. The values of internal organs were not varied significantly among the dietary
treatments except abdominal fat pad. This response indirectly revealed that no negative impact was
found after using CSM in the diet. Cottonseed meal has influence on reducing abdominal fat than non-
fed CSM group. The crude fat contents in broiler chicken meat were found 2.84% in breast meat and
3.88% in thigh meat in control diet. Addition of CSM reduced the crude fat content in breast meat by
22 percent and in thigh meat by 32 percent compared to control that indicated to lean meat production
from broiler chicken. Considering all the parameters it can be concluded that addition of cottonseed
meal as it is can be added up to 2% in the broiler diet for maintaining production performance and
lean meat production.
Study 2. Development of light wavelength based poultry production system in Bangladesh
The present experiment was undertaken to know the effect of different light wavelength on the
performance, meat qualities and blood properties of broiler chicken. A total of 600 day old broiler
chicks were weighted and equally allotted to the following 5 light treatments with 6 replications: red
(R 660-670 nm), yellow (Y 590-610 nm) green (G 540-560 nm) and blue (B 460-470 nm) light colors.
Fluorescent white light was the control. Light (24 L: 0 D) and intensity 15 lux was maintained at the
bird‟s head level. Body weight, weight gain, feed intakes and feed conversion ratio were measured
weekly. During the pre-starter period (0-7 days), G light treatment showed increased body weight
compared to that in the other groups. A significant (P<0.05) increase in weight gain was found in the
G treatment compared to that in the R and W treatments during the starter period (2-3 weeks).
However, no significant difference was observed in weight gain among the Y, G, or B treatments.
Therefore, weight gain was significantly higher (P<0.05) in the B treatment during the growing
period (4-5 weeks) than that R and W treatments. Both feed intake and FCR were not affected by the
light treatments.Serum erythrocyte sedimentation rate (ESR) was significantly decreased with light
wavelengths. No significant effects of light treatments were found for hemoglobin level in the blood.
On the other hand, serum lipid parameter (GLU, TP, Cholesterol and LDL) were not influenced by the
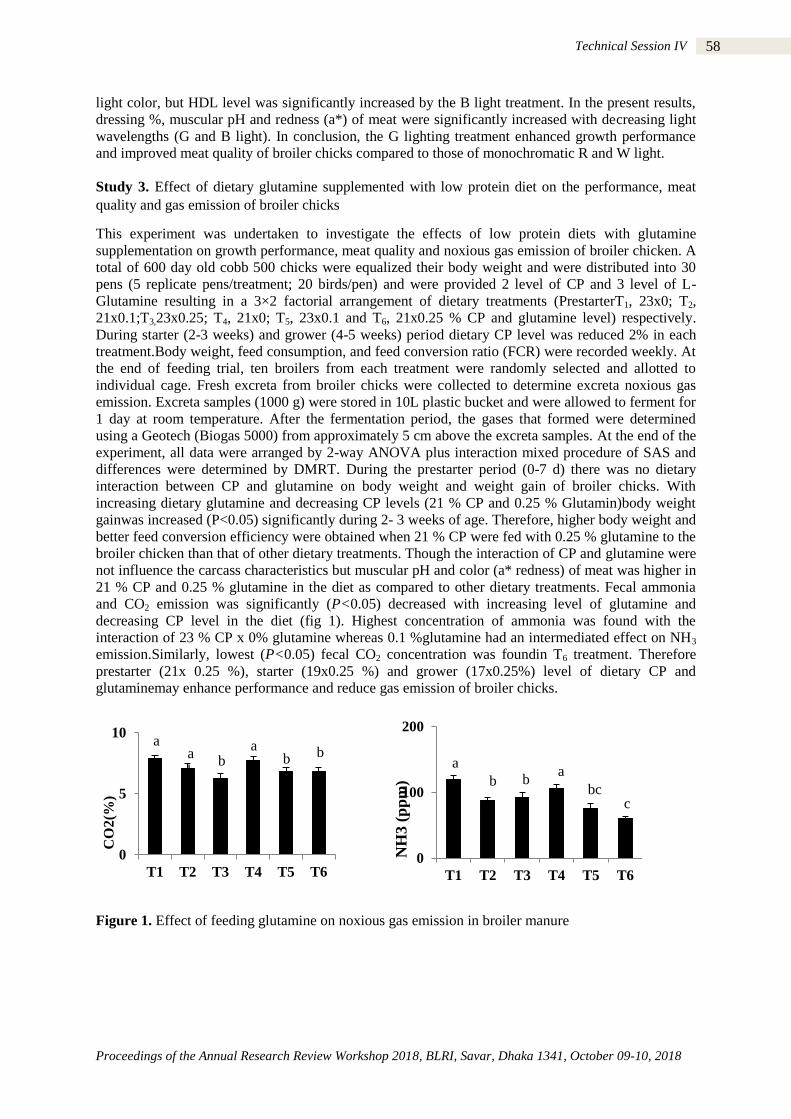
Proceedings of the Annual Research Review Workshop 2018, BLRI, Savar, Dhaka 1341, October 09-10, 2018
58 Technical Session IV
light color, but HDL level was significantly increased by the B light treatment. In the present results,
dressing %, muscular pH and redness (a*) of meat were significantly increased with decreasing light
wavelengths (G and B light). In conclusion, the G lighting treatment enhanced growth performance
and improved meat quality of broiler chicks compared to those of monochromatic R and W light.
Study 3. Effect of dietary glutamine supplemented with low protein diet on the performance, meat
quality and gas emission of broiler chicks
This experiment was undertaken to investigate the effects of low protein diets with glutamine
supplementation on growth performance, meat quality and noxious gas emission of broiler chicken. A
total of 600 day old cobb 500 chicks were equalized their body weight and were distributed into 30
pens (5 replicate pens/treatment; 20 birds/pen) and were provided 2 level of CP and 3 level of L-
Glutamine resulting in a 3×2 factorial arrangement of dietary treatments (PrestarterT1, 23x0; T2,
21x0.1;T3,23x0.25; T4, 21x0; T5, 23x0.1 and T6, 21x0.25 % CP and glutamine level) respectively.
During starter (2-3 weeks) and grower (4-5 weeks) period dietary CP level was reduced 2% in each
treatment.Body weight, feed consumption, and feed conversion ratio (FCR) were recorded weekly. At
the end of feeding trial, ten broilers from each treatment were randomly selected and allotted to
individual cage. Fresh excreta from broiler chicks were collected to determine excreta noxious gas
emission. Excreta samples (1000 g) were stored in 10L plastic bucket and were allowed to ferment for
1 day at room temperature. After the fermentation period, the gases that formed were determined
using a Geotech (Biogas 5000) from approximately 5 cm above the excreta samples. At the end of the
experiment, all data were arranged by 2-way ANOVA plus interaction mixed procedure of SAS and
differences were determined by DMRT. During the prestarter period (0-7 d) there was no dietary
interaction between CP and glutamine on body weight and weight gain of broiler chicks. With
increasing dietary glutamine and decreasing CP levels (21 % CP and 0.25 % Glutamin)body weight
gainwas increased (P<0.05) significantly during 2- 3 weeks of age. Therefore, higher body weight and
better feed conversion efficiency were obtained when 21 % CP were fed with 0.25 % glutamine to the
broiler chicken than that of other dietary treatments. Though the interaction of CP and glutamine were
not influence the carcass characteristics but muscular pH and color (a* redness) of meat was higher in
21 % CP and 0.25 % glutamine in the diet as compared to other dietary treatments. Fecal ammonia
and CO2 emission was significantly (P<0.05) decreased with increasing level of glutamine and
decreasing CP level in the diet (fig 1). Highest concentration of ammonia was found with the
interaction of 23 % CP x 0% glutamine whereas 0.1 %glutamine had an intermediated effect on NH3
emission.Similarly, lowest (P<0.05) fecal CO2 concentration was foundin T6 treatment. Therefore
prestarter (21x 0.25 %), starter (19x0.25 %) and grower (17x0.25%) level of dietary CP and
glutaminemay enhance performance and reduce gas emission of broiler chicks.
Figure 1. Effect of feeding glutamine on noxious gas emission in broiler manure
0
5
10
T1 T2 T3 T4 T5 T6
CO
2(%
)
a b b b a
b
a
0
100
200
T1 T2 T3 T4 T5 T6
NH
3 (
pp
m)
a a
b b bc
c

Proceedings of the Annual Research Review Workshop 2018, BLRI, Savar, Dhaka 1341, October 09-10, 2018
59 Technical Session IV
Study on the comparative performance of turkey, guinea fowl and broiler in some
selected areas of Bangladesh
MY Ali*, M Ershaduzzaman, R Khatun, M Shahjahan, SM Rahman, MH Kabir and
NR Sarker
Bangladesh Livestock Research Institute, Savar, Dhaka 1341
Executive summary
Nowadays turkey rearing has drawn the attention of small to medium poultry farmers in some selected
areas of Bangladesh. They are expecting for getting production technology or package detailed
information about turkey production whether turkey farming is commercially profitable or not. The
study was conducted (i) to know present status of feeding, rearing, problems and prospects of turkey
farming and (ii) to analyze the production performances of turkey(bronze) compare to guinea
fowl(perl) and broiler(Cobb 500) following the survey and farm trial(on turkey) techniques. The
initial data was collected about the above species (turkey, guinea fowl and broiler) farming by the pre-
structured questionnaire (4 hundred) in the selected areas of Dhaka (80), Chittagong (80), Sylhet (80),
Mymensingh (80) and Rajshahi division (80) of Bangladesh. On the basis of collected data the
maximum profit (2.02) was observed in turkey farming by investing each taka (table 1). To validate
the collected data, a trial was conducted at farmer‟s level to find out the actual scenario of turkey
production in Bangladesh. The duration of the trial was 24 weeks and recorded the data as per plan of the project to fulfill the objectives. There were four treatments (T0 to T3 including control group (T0).
The total number birds were 60 and the design of the experiment was CRD. Each treatment had three
replications and each replication was allocated 5 birds randomly. T1 contained 28%, 22% and16% CP
and 2800,3150,3250 kcal energy/kg, T2 contained 27% ,21% and 15% CP and 2900,3100,3300 kcal
energy/kg and T3 contained 26%, 20%,14% CP and 2700,3000 and 3200 kcal energy/kg in the diet for
0-8 ,9-16 and 17-24 weeks of age respectively. The control group contained 22% CP and 2900 kcal
energy/kg in the diet which was provided by the farmer‟s in the whole duration of the experiment.
The management practices were same for each group. The birds were supplied feed twice a daily and
fresh drinking water was supplied ad-libitum. The feeders and drinkers were cleaned every day. The
growth rate was measured weekly and others related data like feed intake, temperature, humidity,
mortality, disease-out break were also recorded accurately. Average body weight gained of four
treatments was significantly differed (p≤0.01) among the treatments. At the age of 8, 16 and 24
weeks of age observed the highest final weight gain for treatment T3 (3.65±0.93) than others three
treatment (table 2). The interaction effect of sex on BW was significant (p≤0.05). The body weight of
turkey males at 24 weeks of age (3.91±0.068) kg which was significantly (p≤0.05) higher compared to
female (2.96±0.064) at end of the experiment.
Table 1. Poultry birds with few production parameters of the survey
Parameter Genotypes
Turkey Guinea fowl Broiler
Number of bird (bird/farm) 86.63(200) 91.83(100) 1001.18(100)
Average price of day old chick(Tk/chick) 440.87 338.04 41.06
Feed intake for each kg body wt gain(excluding
grass)
2.53 3.17 1.88
Mortality (%) 0-2 0-2 0-5
Profit margin(for each taka investment) 2.02 1.96 1.08

Proceedings of the Annual Research Review Workshop 2018, BLRI, Savar, Dhaka 1341, October 09-10, 2018
60 Technical Session IV
Table 2. Average body weight gained (kg) up to 24 weeks of age
Age
(Week)
Treatment (Mean±SE) P Value
T0 T1 T2 T3
0-8 0.51±0.029 0.64±029 0.57±029 0.50±029 0.006
9-16 1.54±0.070 2.06±0.070 1.84±0.070 1.73±0.070 0.000
17-24 3.18±0.93 3.53±0.93 3.38±0.93 3.65±0.93 0.005
The average feed intake (kg) of four treatments were significantly differed (p≤0.001) among the
treatments at 8,16 and 24 weeks of age with the lowest value 8.99±0.002 and 20.13±0.002 observed
respectively in T3 at 16 and 24 weeks of age than others three treatments (table 3).
Table 3. Average feed intake (kg) up to 24 weeks of age
Age
(Week)
Treatment (Mean±SE) P Value
T0 T1 T2 T3
0-8 1.74±0.002 1.71±0.008 1.99±0.003 1.84±0.001 0.000
9-16 9.99±0.004 9.15±0.016 9.86±0.023 8.99±0.002 0.000
17-24 21.34±0.004 20.28±0.019 20.98±0.018 20.13±0.002 0.000
The FCR was estimated for four different treatments of their age including 0-8, 9-16 and 17-24
weeks. Differences among the treatments for FCR at different periods of age were also significant
(p≤0.05). Average FCR at the age of 16 and 24 weeks significantly lowest for T3 group which were
5.32±0.21 and 5.42±0.25 respectively compared to others treatments group (table 4).
Table 4. Average FCR (kg) up to 24 weeks of age
Age
(Week)
Treatment (Mean±SE) P Value
T0 T1 T2 T3
0-8 3.83±0.18 2.76±0.18 3.68±0.18 3.77±0.18 0.000
9-16 6.58±0.21 4.51±0.21 5.54±0.21 5.32±0.21 0.000
17-24 6.41±0.25 5.56±0.25 5.97±0.25 5.42±0.25 0.034
Mortality% of four different treatments was not varied statistically (p≤0.05) although maximum
mortality percentage (0.133±0.091) was observed in control (T0) group compared to others treatments
at all stages of trial (table 5).
Table 5. Effect of treatment on mortality (%) up to 24 weeks of age
Parameter Treatment (Mean±SE) P Value
T0 T1 T2 T3
0-24 Weeks 0.133±0.091 0.066±0.066 0.066±0.066 0 0.561
The Benefit Cost Ratio (BCR) among the treatments varied significantly (p≤0.001) with maximum
profit (1.582±0.088) was observed in T3 (table 6). It can be conclude that from turkey farming with
this genotype, farmers can get maximum 1.58 taka (treatment 3) by investing each.
Table 6. Effect of treatment on BCR up to 24 weeks of age
Parameter Treatment (Mean±SE) P Value
T0 T1 T2 T3
Up to 24 Weeks 1.068±0.035 1.452±0.067 1.384±0.062 1.582±0.088 0.000

Session V
SOCIOECONOMIC AND FARMING
SYSTEM RESEARCH

Proceedings of the Annual Research Review Workshop 2018, BLRI, Savar, Dhaka 1341, October 09-10, 2018
69 Poster Session
Improvement of Black Bengal Goat in Rural Areas
MA Jalil, MP Choudhury, MAI Talukder and MN Munshi
Goat and Sheep Production Research Division, Bangladesh Livestock Research Institute, Savar,
Dhaka 1341
Executive summary
Bangladesh has only one goat breed of its own, popularly known as the Black Bengal goat. It is also
observed that there are wide variations in color, body size and weight of goats found in different
locations. The Black Bengal is a dwarf breed of goats and known to be famous for its high
adaptability, fertility, prolificacy, delicious meat and superior skin . Selection is one of the vital tools
for improving the native genetic resources. Since 1988, the Bangladesh Livestock Research Institute
has been attempted to improve Black Bengal goat through selective breeding. In this situation, “Co-
operative Village Breeding Program” may play a vital role in the improvement of indigenous goat.
Such type of breeding program was tested in Africa as “Community Breeding Program” and found to
be very successful.The primary objectives of community breeding program is to improve indigenous
goat and provide smallholder goat farmers with improved breeding animals particularly males. The
objectives of this project were to improve the Black Bengal goat at farmer‟s level, to improve
livelihood of community farmer through rearing Black Bengal goat and to operate
community based Buck Park at farmer‟s level. The research was conducted at three villages
namely Pachpai, Borochala and Gangatia under Bhaluka Upazilla, Mymensingh district. A well
organized questionnaire was developed for baseline survey through Participatory Rural Appraisal
(PRA) which was helped to know population number of Black Bengal goat, local management,
feeding and breeding system of Black Bengal goat, available local breed of goat, social status of
farmers etc. Fifty (50) farmers were selected randomly in the project area to conduct baseline survey.
Fourteen (14) farmers were selected randomly on the basis of elaborate questionnaire who had at least
4-5 years Black Bengal goats rearing experiences to form goat rearing community in the project area.
Twenty (20) maiden does from Goat Research farm, BLRI were given to 10 selected farmers and 6
superior bucks were also given to another 4 buck rearing farmers. Goats of each farmer in the
community were identified through the giving identification number. A well-organized record
keeping card was given for recording of each of the goat in each farmer‟s house in the community.
After certain period the buck will be exchange to prevent inbreeding at farmer‟s level. Routine
vaccination and de-worming were practiced. Obtained information was putted and stored on to the
Excel spread sheet. Then data were analyzed using Statistical Package for the Social Sciences (SPSS)
version 17.0. Table 1. Growth and reproductive performances of BLRI Black Bengal goat at farmer‟s level
Parameters Progeny of BLRI
doe
Progeny of BLRI buck Level of significant
Mean±SE Mean±SE
Birth weight (kg) 1.11±0.05 (39) 1.37±0.04 (50) ***
3 month weight (kg) 6.58±0.36 (24) 8.66±0.28 (46) ***
6 month weight (kg) 8.71±0.68 (14) 13.26±0.44 (30) ***
12 month weight (kg) 12.40±0.48 (5) 19.14±0.94 (14) ***
Litter size (no) 1.54±0.09 (28) 2.21±0.11 (23) ***
Gestation length (days) 146.22±0.68 (18) 145.81±0.77 (21) NS
Kidding interval (days) 257.25±37.32 (4) - -
Means with uncommon superscripts differ significantly. Figures in the parenthesis indicate the number of
observation, ***= Significant at 0.1% level of probability (p<0.001). NS= Not significant (p>0.05).
Table 1 shows the progeny performances of BLRI Black Bengal goat at farmer‟s level. Birth weight,
3 month weight, 6 month weight, 12 month weight and litter size were significantly p<0.001) higher
in progeny of BLRI buck than progeny of BLRI doe. There was no significant different of gestation
length between progeny of BLRI buck and progeny of BLRI doe.

Proceedings of the Annual Research Review Workshop 2018, BLRI, Savar, Dhaka 1341, October 09-10, 2018
70 Poster Session
Table 2. Effect of sex, parity and litter size on performances of BLRI Black Bengal goat at farmer‟s
level
Factors Parameters
BW (kg)±SE 3M (kg)±SE 6M (kg)±SE GL (days) ±SE
Sex
Male 1.22±0.05 (20) 7.40±0.51 (10) 10.02±0.64 (5) 147.00±0.82 (12)
Female 1.00±0.08 (19) 5.31±0.37 (10) 7.44±0.72 (8) 144.67±1.02 (3)
LS * * ** NS
Parity
1 1.21±0.06 (11) 6.58±041 (5) 9.45±0.62 (5) 146.17±0.70 (6)
2 1.21±0.12 (9) 6.63±0.89 (6) 7.93±1.02 (3) 144.71±0.92 (7)
3+
1.09±0.17 (7) 6.68±1.23 (4) 7.80±3.30 (2) 148.40±1.60 (5)
LS NS NS NS NS
Litter size
1 1.29±0.10 (13) 7.05±0.82 (8) 9.40±0.49 (4) 148.14±1.52 (7)
2 1.07±0.07 (14) 6.14±0.32 (7) 8.18±0.69 (6) 145.00±0.64 (11)
LS NS NS NS *
BW= Birth weight, 3M= 3 month weight, 6M=6 month weight, GL= Gestation length, LS= Level significant.
Figures in the parenthesis indicate the number of observation.*= Significant at 5% level of probability (p<0.05),
**= Significant at 1% level of probability (p<0.01), NS= Not significant (p>0.05).
Table 2 shows Effect of sex, parity and litter size on performances of BLRI Black Bengal goat at
farmer‟s level. Sex had significant effect on birth weight (p<0.05), 3 month weight (p<0.05) and 6
month weight (p<0.01), while no significant effect on gestation length. There was no significant
effect of parity and litter size on birth weight, 3 month weight, 6 month weight and gestation length
except gestation length which was varied with litter size of Black Bengal goat at farmer‟s level. Four
maiden doe (s) from community farmers were given to another selected goat rearing farmer
on the basis of contact. Different data were recorded in flock record keeping book regularly and the
study will be continued until significant to build model community based goat production.

Proceedings of the Annual Research Review Workshop 2018, BLRI, Savar, Dhaka 1341, October 09-10, 2018
71 Poster Session
Characterization of Munshiganj cattle
SMJ Hossain1, MFH Miraz
1, MF Afroz
1, GK Deb
1, AKFH Bhuiyan
2
1Biotechnology Division,
Bangladesh Livestock Research Institute, Savar, Dhaka 1341;
2Bangladesh
Agricultural University, Mymensingh 2202
Executive summary
The cattle of Bangladesh are indigenous (Bosindicus) type which constitutes about 90% of the total
cattle population. The indigenous cattle are of various sizes and possess varied coat color such as red,
grey, white, black or mixture of these in different proportion. Munshiganj cattle (MC) are one of the
promising varieties of indigenous cattle genetic resources in Bangladesh, generally found in the
Munshiganj district and its surrounding areas. Farmers are replacing MC with high yielding crossbred
cattle and population of MC is rapidly declining in their breeding tract. Considering the above facts,
steps have been taken by BLRI for conservation, characterization and subsequent improvement of this
valuable cattle genetic resource at their own habitat (in-situ) and at BLRI (ex-situ). For in-situ
conservation, a Munshiganj cattle rearing community was established in Munshiganj district with 104
households having at least a single MC cow. For ex-situ conservation, a mini nucleus herd was
established at BLRI which has been enlarged with a total population of 30 animals including 10 cows,
4 breeding bulls, 8 heifer calves and 8 bull calves. Different productive and reproductive performance
was recorded throughout this period.Semen was collected from 3 sexually matured Munshiganj bull,
analyzed and diluted with Tris- egg -yolk citrate diluter. After 4hrs equilibration, semen was frozen
with liquid nitrogen vapor with a programmable bio freezer (Minitube, Germany) at -140ºCand
finally stored at -196ºCin liquid nitrogen. After that post thawing semen qualitieswere observed and
evaluated after 24 hrs of storage.
The fresh semen was thick creamy in colour with an average volume and concentration of 4.273±0.54
ml and 1796 ±122.29 milion/ml, respectively. Total progressive, static and slow motility of the fresh
and post thawed semen samples were 84.69±4.28 and 52.97±3.13, 72.53 ± 2.91 and 43.71±1.57,
15.31±4.28and 47.03 ±3.13 and 1.23± 0.60 and 0.58± 0.18%, respectively (Table 1).
Table 1. Fresh and frozen semen quality of Munshiganj bull
Parameter Fresh semen (Mean±SD) Frozen semen(Mean±SD)
Volume (ml) 4.273±0.54 -
Concentration (million/ml) 1796 ±122.29 -
Total motility (%) 84.69 ±4.28 52.97± 3.13
Progressive motility (%) 72.53 ± 2.91 43.71±1.57
Static motility (%) 15.31± 4.2 47.03 ±3.13
Slow motility (%) 1.23± 0.60 0.58± 0.18
The average birth weights of male calves (19.47±0.79 kg) were significantly (p<0.05) higher than
those of female calves (16.14±0.52 kg). Average lactation length (LL), lactation milk yield (LMY),
daily milk yield (DMY), postpartum heat period (PPH) and number of services for each conception
(NSPC) was found 187.5±9.54 days, 728.46±88.80 kg, 3.84±0.31 kg, 65.5±5.25 days and 1.58±
0.79respectively (Table 2 & 3). The gestation length is a species characteristic. The duration of
gestation is genetically determined. Variation may be due to maternal or other influence.
Table 2. Productive performances of Munshiganj cattle
Characteristics (Mean±SD)
Body weight of male calf (kg) 19.47a±0.79
Body weight of female calf (kg) 16.14b±0.52
Lactation length (Days) 176.25±26.47
Lactation yield (L) 731.53±140.61
Daily milk yield (L) 4.13±0.39

Proceedings of the Annual Research Review Workshop 2018, BLRI, Savar, Dhaka 1341, October 09-10, 2018
72 Poster Session
Table 3. Reproductive performances of Munshiganj cows
Characteristics (Mean±SD)
Gestation period (days) 279.17± 3.76
Postpartum heat period (days) 63.42± 22.08
No of service per conception 1.58± 0.79
Milk fat and protein content of evening milk were significantly higher than morning milk, where no
significant differences were found in lactose and SNF content (Table 4). Artificial insemination (AI)
is ongoing in Munshiganj rearing community with pure Munshiganj semen. Till date 82 AI has been
conducted with an average conception rate of 54.88%.Eight calves have been born so far following
AI.
Table 4. Milk composition of Munshiganj cows
Milk properties Morning Evening Overall mean Sig level
%Fat 4.89b±0.28 6.34
a±0.35 5.61±0.29 **
%Protein 4.23b±0.04 4.38
a±0.05 4.31±0.04 *
%Lactose 6.11±0.06 6.28±0.07 6.19±0.05 NS
%SNF 11.25±0.11 11.60±0.13 11.43±0.09 NS
*-significant at 5% level (p<0.05); **-significant at 1% level (p<0.01); NS-not significant (p>0.05)
In conclusion, Munshiganj cattle are highly potential for most of the productive and
reproductive point of view. This valuable endangered germplasm needs to be conserved for
future multiplication. The ongoing program of artificial insemination (AI) with pure semen of
Munshiganj bull may be a potential initiative to increase the population size of Munshiganj
cattle in their habitat.

Proceedings of the Annual Research Review Workshop 2018, BLRI, Savar, Dhaka 1341, October 09-10, 2018
73 Poster Session
Collection, conservation and improvement of specialized fowl (Pigeon, Guinea fowl and
Turkey) production at BLRI
MSK Sarker1, S Faruque
1, MOA Rahman
1, MRA Sumon
1, S Sultana
1, NR Sarker
1
1Poultry Production Research Division, Bangladesh Livestock Research Institute, Savar, Dhaka, 1341
Correspondence: [email protected]
Executive summary
Study 1. Collection, conservation and improvement of pigeons at BLRI research farm
Pigeon production in rural and urban areas of Bangladesh has got great importance for
supplying family protein nutrition by squab meat and supplementary income generation.
Some of these are comparatively lowest keeping cost, short generation interval, rapid growth,
early sexual maturity i.e. 5-6 months of age, less feed and housing cost required. Moreover,
they are friendly to environment, associated with ecological balance, natural beautification
and fancy pigeons are keeping as a good source of recreation. People of all religions like
squab meat. Squab meat is very lean, easily digestible and rich in proteins, minerals and
vitamins. It is also used as tasty, delicate and fancy meat (Aliza, 2005; Morgan, 2006). The
objectives of this study were to collect, conserve and improve few potential pigeon
germplsms through selective breeding. The research facility for pigeon rearing at BLRI was
developed in FY 2017-18. Local and exotic pigeon germplasms were collected for assessing
their economic return, squab production and meat quality in this current plan. Before
collection of pigeon at BLRI research shed a survey was conducted to six regions of the
country taking 15 questionnaires each side (total 90) because of generating basic information
bank of the pigeon raisers. From that survey report we found that family members of the pigeon
raisers are 4 to 5 persons in each family. The land area showed a wide variation from 41.07 decimal in
Feni sadar to 162.27 decimal in Dinajpur areas. Farmers of Dumuria showed higher education among
other 5 regions. HSC educated farmers concentration are found highest in Nokla areas than other
regions followed by Dinajpur and others. No farmers were found illiterate in the study area. Among
the 6 sites, pigeon farmers of Feni sadar were 100% in SSC or below followed by 93% Gopalgonj and
73% in Joypurhat. Highest number of pigeon as well as poultry was found in Dinajpur areas per farm
followed by Joypurhat, Feni, Khulna, Gopalgonj and Nokla. The supplementary income is also
followed the same trend, meaning highest income per pigeon farm was recorded 14571 taka / farm
with 22 pairs of pigeon in Dinajpur that other regions. Their experience on pigeon rearing is also
more (5.77 yrs) than others. New castle, fowl pox, cholera are common diseases found in the study
areas with diarrhoea sometimes. As a remedy most of the farmers provide ND vaccine with few Fowl
pox vaccines. Some problems of predator were also found in different areas of the study. Only 6
pigeons taking golla 4 (1 pair white and 1 pair black) and giribaz 2 were collected from Savar Bazzar.
Later a pair of King pigeon (752g/male and 740 g/female) was introduced. Adult body weight of
white 376g for male and 320 g for female were recorded white black matured 370 g and 330 g for
male and female respectively. The number of pigeon increased to 52 number including nine pairs of
baby pigeon (squab). Our intention is to identify suitable pigeon genotypes for producing more squabs
to increase supplemental income and generate profitable pigeon production technology for the raisers.
Study 2. Collection, conservation and improvement of Guinea fowl production at BLRI
Guinea fowl are seasonal breeders and lay eggs during the warm season (Moreki, 2009). Bell and
Smith (2010) in Australia also reported that guinea fowl hens start laying in spring (with increasing
daylight) and continue laying for about nine months. In Ghana, Konlan et al. (2011) argued that
guinea fowl hens (pearl) are capable of laying fertile eggs throughout the year when given adequate
supplementary feeds with the provision of water ad libitum. The study was conducted with the
objectives i) collection and conservation of Guinea fowl at BLRI germplasm ii) maintenance and
multiplication of Guinea fowl for further investigation. One hundred fifty guinea fowls were collected
and are conserving for multiplication. The management practices were standard.The feed conversion

Proceedings of the Annual Research Review Workshop 2018, BLRI, Savar, Dhaka 1341, October 09-10, 2018
74 Poster Session
ratios (FCR) were calculated 2.26, 4.46 and 5.58 in 5-8; 9-12 and 13-16 weeks of age for foundation
stock. At 16 weeks of age in generation 1, the live weight was found 1214.22 g/bird, weight gain
1186g/bird, feed intake (5320 g/bird), FCR 4.38 with mortality 3.50%.Age at sexual maturity of
guinea fowl was 168d and body weight was 1304.64g at that time. It was found the hen guinea fowl
lay about 100 to 110 eggs per bird per year with a mortality of up to 8%. Average egg weight of
guinea fowl was recorded 42g and albumen index (%) was 7.31, Yolk index (%) was 40.94 and
Haugh unit was 85.077. The dressing percentage of guinea fowl was found 65.79. It can be concluded
that guinea fowl might be a potentiality poultry species for meat and egg production. Further study
should be conducted to increase its egg production performances. The study is ongoing to investigate the
different guinea fowl variety, production performance of eggs, measurement of egg quality characteristics under
intensive rearing system and improvement of BLRI selected guinea fowl in Bangladesh. At least 5th generation
will need for improvement of guinea fowl through selection and breeding program.
Study 3. Collection, conservation and improvement of Turkey germplasm at BLRI
Turkey (Meleagris gallopavo) belongs to the family of birds called Meleagrididae. Turkey rearing is
very popular in many parts of the world especially Europe and America and their meat is popular in
the developed country due to low fat as well as cholesterol content in meat (Sarker and Sarker, 2018).
They can be raised successfully almost anywhere in the world if they are well fed and protected
against diseases, predators, and adverse weather conditions. The young birds are called poults, the
male birds are referred to as turkey cocks or toms while the female are called turkey hens. Turkey was
probably domesticated firstly in Mexico, it was also used as a domestic fowl by Indian communities
the place is now the South-Western USA (Smith, 1990). The standard weights for adult toms and
adult hens are 16-26 and 9.18kg for the Bronze, 15 and 8.18kg for white Holland, 10.45kg and 5.91kg
for Beltsville small white. Normal mature males of all varieties of turkey have a conspicuous black
beard attached to the skin of the upper breast region and occasionally have small beard but beards are
reared in females of colored varieties. Turkeys are gaining in popularity in Bangladesh and for good
reasons that it can produce huge and high-quality meat. Turkey can substitute for broiler because
some consumers do not like broiler meat. In particular, Bangladesh Livestock Research Institute is the
only research institute related to livestock in Bangladesh but there was no Turkey stock in their
poultry germplasm. Thus the present research proposal was undertaken with the objectives to collect,
multiply and improve a flock of Turkey at BLRI poultry germplasm.
Figure 1. Body weight of turkey at different weeks of age Figure 2. Turkey flock at growing age
Recently, BLRI has introduced with turkey with a flock of 100 birds consisting bronze, black and
white. Their performances data are recording (BW showed in Figure1) routinely. In FY 2018-19,
performance of this turkey variety will be carried out followed by egg production and meat quality
parameters. Bangladesh government has allocated bank loans for the turkey farmers to encourage the
innovative and dedicated farmers of the country. We are also committed to provide the technological
support for making turkey production a profitable business in near future and to supply lean and safe
meat for the consumers.
0
1000
2000
3000
4 8 12 16
Black White Bronze
Body w
eight
(g/b
)
Weeks of age
Proceedings of the Annual Research Review Workshop 2018, BLRI, Savar, Dhaka 1341, October 09-10, 2018
75 Poster Session
Variation of morphological features and growth traits in half sib baby calves of Pabna
cattle
MAI Talukder1,2
, M Shahjahan2*
, S Munira2, SM Rahman
2, MY Ali
2, M Salahuddin
2, MAH Miah
2,
MM Billah2, MR Habib
1 and AKFH Bhuiyan
3
2Dairy Development Research Project,
1Bangladesh Livestock Research Institute Regional Station,
Baghabari, Sirajganj 6770; 3Department of Animal Breeding and Genetics, Bangladesh Agricultural
University, Mymensingh 2202
Executive summary
Pabna cattle are one of the most promising local varieties for milk production and growth among the
available cattle varieties in Bangladesh. This study was aimed to reveal the phenotypic features of
local Pabnacalves including their growth traits attribute at BLRI regional station, Baghabari. Data on
different phenotypic measurements and growth traits were collected from 12 half sib Pabnababy
calves having same sire using measuring tape and weighing balance within three months of calving,
respectively.Each calf was allowed to drink10% of milk for individual‟s body weight from respective
dam. Data analyses were conducted following independent sample t-test and one-way ANOVA using
SPSS software (SPSS Inc. Chicago, USA). The morphological features of Pabna calves at birth had
significant differences in body weight (p<0.001), body length (p<0.05), heart girth (p<0.05) and
mouth circumference (p<0.05) based on two types of birth weight groups in calves (<20 kg and ≥20
kg) where the values found higher in 20 kg weight group for 20.97±0.52 kg, 53.33±1.20 cm,
61.33±0.67 cm and 21.33±0.33 cm, respectively (Table 1). In case of dam‟s body weights (<250 kg
and ≥250 kg), there were no variation observed in the baby calves except head length (p< 0.05) in two
groups, respectively. However, this phenotypic feature (head length) also showed significant
(p<0.001) increasing pattern at three month of age in half sib calves (Table 2). These data are
indicating few phenotypic characters which could be considered as effective differentiating features of
calves during selection. In addition, these data suggested that higher body weight of dam might not
responsible of changing overall phenotype of calves.The body weight of local Pabna calves at birth,
first, second and third months were found as 18.73±0.47, 31.11±0.66, 43.09±1.12 and 53.67±1.47 kg,
respectively (Table 3). There were no variations (p>0.05) observed in the growth rates of those
measuring periods in baby calves (Figure 1). These data showed that half sib calves originated from
the same sire had similar growth in the early stage.
Table 1. Effects of own and dam‟s body weight on phenotypic features of half sib baby calves at birth in
local Pabna cattle
Phenotypic features Calves‟ body weight (Mean±SE) Dams‟ body weight (Mean±SE)
<20 kg
(n=9)
≥ 20 kg
(n=3)
t-test <250 kg
(n=6)
≥ 250 kg
(n=6)
t-test
Body characteristics
Body weight (kg) 17.99±0.33 20.97±0.52 0.001 19.22±0.76 18.25±0.55 0.326
Body length (cm) 50.56±0.53 53.33±1.20 0.034 51.50±0.85 51.00±0.89 0.693
Heart girth (cm) 58.78±0.52 61.33±0.67 0.028 60.00±0.86 58.83±0.60 0.291
Wither height (cm) 64.22±0.70 65.67±1.45 0.347 64.17±0.98 65.00±0.86 0.536
Carpal circumference (cm) 9.22±0.28 9.67±0.33 0.418 9.50±0.22 9.17±0.40 0.485
Tarsal circumference (cm) 10.56±0.29 10.83±0.17 0.614 11.00±0.26 10.25±0.31 0.092
Tail length (cm) 33.22±0.52 33.67±2.19 0.768 34.17±0.98 32.50±0.62 0.181
Tail dock circumference
(cm)
8.67±0.33 9.33±0.67 0.356 9.17±0.31 8.50±0.50 0.282
Pelvic length (cm) 11.44±0.29 12.00±1.00 0.468 11.50±0.43 11.67±0.49 0.804
Rump length (cm) 11.56±0.24 12.33±0.67 0.190 11.83±0.40 11.67±0.33 0.756
Head characteristics
Mouth circumference (cm) 20.22±0.22 21.33±0.33 0.028 20.83±0.31 20.17±0.31 0.156
Ear length (cm) 13.56±0.47 12.67±0.33 0.329 13.83±0.48 12.83±0.54 0.197
Ear diameter (cm) 8.33±0.17 8.00±0.58 0.448 8.50±0.22 8.00±0.26 0.174
Head length (cm) 21.00±0.37 21.00±0.58 1.00 20.33±0.21 21.67±0.42 0.018
Head width (cm) 10.00±0.24 10.33±0.67 0.554 10.17±0.31 10.00±0.37 0.734

Proceedings of the Annual Research Review Workshop 2018, BLRI, Savar, Dhaka 1341, October 09-10, 2018
76 Poster Session
Table 2. Phenotypic features of half sib baby calves at three months based on dams‟ body weight
in local Pabna cattle
Phenotypic features <250 kg body weight (n=3) ≥ 250 kg body weight
(n=5)
t-test
Mean SE Mean SE
Body characteristics
Body weight (kg) 56.54 0.46 54.09 1.71 0.328
Body length (cm) 70.67 1.76 74.90 1.21 0.86
Heart girth (cm) 84.67 1.48 85.50 1.52 0.729
Wither height (cm) 78.33 1.20 79.20 0.70 0.524
Carpal circumference (cm) 10.67 0.17 10.80 0.12 0.537
Tarsal circumference (cm) 11.83 0.33 11.90 0.10 0.818
Tail length (cm) 43.83 0.73 44.90 0.33 0.173
Tail dock circumference (cm) 12.50 0.29 12.50 0.32 1.00
Pelvic length (cm) 19.83 0.93 20.40 0.40 0.535
Rump length (cm) 23.50 0.87 24.80 0.62 0.260
Head characteristics
Mouth circumference (cm) 23.50 0.50 24.20 0.34 0.274
Ear length (cm) 18.00 0.58 19.50 0.50 0.106
Ear diameter (cm) 10.67 0.17 10.60 0.24 0.855
Head length (cm) 26.00 0.00 27.20 0.12 0.000
Head width (cm) 12.67 0.88 12.70 0.25 0.965
Table 3. Body weight (kg) of half sib baby local Pabna calves
Body weight n Minimum Maximum Mean SE
At birth 12 16.60 22.00 18.73 0.47
First month 10 27.55 34.65 31.11 0.66
Second month 9 37.90 48.45 43.09 1.12
Third month 8 46.66 57.41 53.67 1.47
Figure 1. Variation of growth traits at early stage in local Pabna calves
It is concluded that phenotypic variation and growth traits were almost similar for half sib Pabna baby
calves; in addition, dams‟ body weight had limited effects on those features rather than individual calf
weight.
0
0.2
0.4
0.6
0.8
1
First Second Third
Gro
wth
rat
e (k
g)
Measuring period (month)

Proceedings of the Annual Research Review Workshop 2018, BLRI, Savar, Dhaka 1341, October 09-10, 2018
77 Poster Session
Production and evaluation of cross bred sheep of Coastal with Damara, Dorper and
Parendale
MA Jalil1, MP Choudhury
1, M Ershaduzzaman
2 and FT Jahura
2
1Goat and Sheep Production Research Division,
2Conservation and Improvement of Native Sheep
through community and commercial farming project
BLRI, Savar, Dhaka 1341
Executive summary
Cattle, goat and chicken are the major and popular sources of meat in Bangladesh. Numbers of
programmes were implemented and some of them are under execution for increasing production
efficiency of cattle, goat and chicken species. However, after implementation of these programmes,
the rate of increment of meat production is not sufficient to meet the national demand of meat.
Therefore, different species including sheep might be emphasized as a meat animal. Meat produced
by different conventional sources like poultry, cattle, sheep and goat is quite insufficient to meet-up
the growing demand of animal protein in spite of high density of livestock. Protein deficiency has
been taken as the major contributory factor in malnutrition. It is therefore, important to develop cross
bred to minimize the deficiency of animal protein. The objectives of this project are to evaluation of
the productive and reproductive performances and also the adaptation of different crossbred
genotypes in hot and humid climatic conditions. The breeding program was conducted at Goat and
Sheep Research farm of Bangladesh Livestock Research Institute, Savar, Dhaka. At starting period
25 Coastal ewes were crossed with ram of Damara sheep. More 25 Coastal ewes are being crossed
with ram of Dorper sheep. Beside this, 25 Coastal ewes are being crossed with ram of Parendale
sheep. All the ewes and ram were housed in slated floor permanent house raise above the ground level
with sufficient space to keep them comfortable. Ramsare being kept separately from ewes to avoid
unplanned mating. Green grass was supplied adlibitum basis and concentrate (17% CP, 11MJ ME/kg
DM) was offered twice daily (morning and evening) at the rate of 300g per head per day. The birth
weight of newborn kids was taken by digital weighing balance within one hour after birth. The
subsequent weight of kids was recorded in the morning and before feeding up to fortnight throughout
the year. Subsequently, data on productive and reproductive performances were recorded regularly.
The collected data was analyzed by SPSS 17.0 statistical computer programme.
Table 1 shows Production performances of different cross bred sheep genotype. The birth weight of
Damara-Coastal, Dorper-Coastal and Parendale-Coastal cross bred genotype were1.98±0.06 kg,
1.97±0.19 kg and1.77±0.86kg respectively. Average body weight of Damara-Coastal and Dorper-
Coastal cross bred sheep genotype were9.80±0.35 kg; 12.12±0.52 kg and 11.56±0.76 kg and
13.98±0.74 kg at 3 and 6 months of age respectively. Average growth rate of Damara-Coastal and
Dorper-Coastal cross bred sheep genotype were 87.2±0.04 g/d; 71.00±0.02 g/d, and 104.6±0.01 g/d
Figure 1. Damara-Coastal
cross bred lamb
Figure 2. Dorper-Coastal
cross bred lamb
Figure 3. Parendale-
Coastal cross bred lamb

Proceedings of the Annual Research Review Workshop 2018, BLRI, Savar, Dhaka 1341, October 09-10, 2018
78 Poster Session
and 65.2±0.01 g/d at 3 and 6 months of age respectively. This is ongoing research program. Data on
productive and reproductive performances of three cross bred sheep genotypes during this study might
help in decision making on evaluation of performance of above said three cross bred sheep
genotype.This study need to be continued for developing a cross bred sheep genotype in Bangladesh.
Table 1. Production performances of different cross bred sheep genotype
Parameters Genotypes
Damara-Coastal
cross bred
Dorper-Coastal
cross bred
Parendale-Coastal
cross bred
Birth weight (kg) 1.98±0.06 (45) 1.97±0.19 (9) 1.77±0.86 (7)
Body weight in kg (3 months) 9.80±0.35 (40) 11.56±0.76 (5) -
Body weight in kg (6 months) 12.12±0.52 (35) 13.98±0.74(4) -
Growth rate-g/d(3 months) 87.2±0.04 (40) 104.6±0.01 (5) -
Growth rate-g/d(6 months) 71.00±0.02 (40) 65.2±0.01(5) -

Proceedings of the Annual Research Review Workshop 2018, BLRI, Savar, Dhaka 1341, October 09-10, 2018
79 Poster Session
Study on the hormonal profile in crossbred dairy cows in relation to repeat breeding at
Baghabari milk shed areas
MS Islam1, MY Ali
*1, M Ershaduzzaman
2, R Khatun
2, M Shahjahan
1, SM Rahman
1, MH Kabir
1 and
NR Sarker2
1Bangladesh Livestock Research Institute Regional Station, Baghabari, Sirajganj-6770;
2Bangladesh
Livestock Research Institute, Savar, Dhaka 134, *Corresponding author: [email protected],
Executive Summary
Repeat Breeding (RB) is a major reproductive disorder caused a great economic loss in dairy herds. It
increased production cost of insemination, treatment, feed, labor and management, calving interval,
culling rates and decreased calf and milk production. RB is a multi-factorial problem involving a
number of extrinsic factor as well as intrinsic factors coupled to the individual animal. Lack of
balanced feed, poor quality semen, hormonal deficiency, incidence of reproductive diseases, unskilled
Artificial Insemination Workers (AIW), maltreatment of RB cows, crossbred genotype, high yielding
cow, improper heat detection at the time of artificial insemination, seasons and lack of deworming
were found the major causes of repeat breeding problems at Baghabari milk pocket areas. It was also
found that incidence of repeat breeding problems was about 29 percent in dairy cattle which is very
much alarming for dairy cattle production in the Baghabari milk shed areas. Presently, dairy farmers
have been suffering a lot due to RB problem. No systematic works are done to minimize major causes
of RB problems in the aforesaid areas. Hence, this study was undertaken to determine the hormonal
profiles of repeat breeder cows before and after synchronization.The present study was conducted at
the different sheds of dairy farmers at the Bathan area of Shahjadpur Upazila under Sirajgonj district.
A total of 30 repeat breeder cows were selected randomly to determine their hormonal profiles in the
study areas.. Selected repeat breeder cows were marked by ear tag and collected breeding history of
each individual cow. Experimental cows were reared under the bathan feeding and management
system. In addition, 50g mineral supplementation was given daily to all experimental cows. All
experimental cows were synchronized using following hormonal treatment-
0 days 7 days 9 days
GnRH PGF2α GnRH
A total of fifty three (53) blood samples were collected into vacutainer tube from the jugular vein of
each experimental repeat breeder cow. Blood samples were collected before synchronization from all
experimental cows. Blood samples were collected after synchronization during standing heat period of
estrous cycle of each cow measured by Estrous Detector Device for AI in appropriate time. The serum
samples were prepared in the Animal Health Laboratory of Bangladesh Livestock Research Institute,
Regional Station, Baghabari, Shahjadpur, Shirajgonj-6770. The plasma serum was separated by
centrifugation (1500 rpm for 20 min). The separated serum was collected in a sterile vial and
preserved at −20°C until analysis. All serum samples were analyzed in the Laboratory in the
Department of Biochemistry and Molecular Biology, Faculty of Biological Sciences, Jahangirnagar
University (JU), Savar, Dhaka by using endocrine detection kits (Mono LelacR USA). Values of
different reproductive hormones between before and after synchronized repeat breeder (RB) cows are
shown in Table 1. From the results of the present study clearly found that different reproductive
hormones of LH, FSH and progesterone were significantly differed between before and after
synchronization of repeat breeder cows except estradiol value. This result may be attributed due to
synchronized of repeat breeder cows.

Proceedings of the Annual Research Review Workshop 2018, BLRI, Savar, Dhaka 1341, October 09-10, 2018
80 Poster Session
Table 1. Values of different reproductive hormones between before and after synchronized repeat
breeder (RB) cows
Name of hormones Hormonal values before
Synchronization of RB
cows
Hormonal values after
Synchronization of RB
cows
Level of
significance
Mean ± SE Mean ± SE
LH(mIU/ml) 0.8251 ± 0.08153
2.481 ± 0.4806
***
FSH(mIU/ml) 4.647 ± 0.7999 17.04 ± 2.743
***
Progesterone
(ng/ml)
1.807 ± 0.2148
5.927 ± 0.4219
***
Estradiol
(E2)(pg/ml)
82.23 ± 2.402
107.3 ± 6.974
NS
SE=Standard error, ***= highly significant, NS=Non-significant,LH=Luteinizing hormone,FSH=Follicle
stimulating hormone.
It can be concluded that the level of luteinizing hormone (LH), follicle stimulating hormone
(FSH),progesterone were significantly differed between repeat breeder cows and synchronized repeat
breeder cows. It may also be inferred from the present findings that synchronized effect might be
influence the results of hormonal values. However, more detailed studies s may be needed for drawing
a specific inference.

Proceedings of the Annual Research Review Workshop 2018, BLRI, Savar, Dhaka 1341, October 09-10, 2018
81 Poster Session
Characterization and screening of different coat color variants goat stock at BLRI
SMJ Hossain, MF Afroz, GK Deb, MFH Miraz and MA Habib1
Biotechnology Division, Bangladesh Livestock Research Institute (BLRI), Savar, Dhaka 1Fodder Research and Development Project, BLRI, Savar, Dhaka
Executive summary
Goats are prolific small ruminants mostly reared by ultra-poor and poor peoples in Bangladesh. That‟s
why it is said in our country that goat is the poor people‟s cow. Goats provide meat and skin which
contribute national economy of Bangladesh by earning foreign exchange. There are about
25.77millions goats in our country.But, inheritance of coat color in goatreceived less attention than
that of quantitative economic important traits and lack of a similar importance for color in most goats.
However, attempts to develop and conserve different color variety of goat have not yet been done for
the satisfaction of consumer‟s preference. Coat color is also an identity of a specific breed‟s character.
However, people have a fascination on color phenotype of animals. Goats have great variation in
color and the genetic control can be tricky. Considering the point of view, the present study had been
taken with the objectives to develop pure-line goat genotypes based on coat color variant and
phenotypic characterization of different coat color goat genotype. The research conducted pachutia
goat shed at BLRI. To develop different color variants‟ goat stock, primarily goats having three
distinguished colors viz. solid white (SW), Dutch belted (DB) and Toggenburg (TB) comprising
flocks with 24; 39 and30 had been established. Within color pure breeding are being followed for
designing mating plan. Progeny are being screened based on their color inheritance. Admixture of
genes responsible for more than single color pattern are being discarded from the flock to maintain
pure line generation. Semi-intensive management are being followed for animals of each flock.
Genetic and phenotypic characterization of different coat color variants‟ goat are being recorded. The
collected data were analyzed using computer software statistically with R (agricolae, pastecs
pacakages).
Table 1. Body weight of goat at different ages
Factor Mean±SE
BWT (Kg) 3MWT (kg) 6MWT (kg) GR0-3 (g/d) GR3-6 (g/d)
Sex *** NS NS NS NS
Male 1.26±0.03
(41)
7.53±0.35
(41)
11.44±0.47
(36)
69.16±3.63
(41)
37.76±4.05
(36)
Female 1.16±0.05
(38)
7.21±0.42
(38)
11.31±0.51
(34)
66.48±4.32
(38)
40.43±4.39
(34)
Genotype NS NS NS NS NS
SW 1.3±0.05
(17)
7.67±0.44
(15)
11.94±0.57
(15)
69.91±4.52
(20)
45.39±4.93
(15)
DB 1.235±0.04
(18)
8.24±0.42
(17)
13.79±0.61
(17)
76.60±4.37
(23)
49.31±5.15
(17)
TB 1.15±0.04
(18)
7.05±0.41
(15)
10.83±0.53
(15)
65.14±4.25
(21)
37.06±4.93
(15)
Parity NS NS NS NS NS
1st 1.22±0.04
(22)
7.15±0.41
(19)
10.86±0.46
(17)
66.00±4.14
(19)
39.10±4.34
(17)
2nd 1.33±0.09
(32)
8.65±0.44
(20)
12.17±0.46
(20)
79.87±4.39
(20)
39.05±4.36
(20)
3rd 1.08±0.05
(6)
- - - -
Overall 1.21±0.03
(79)
7.9±0.27
(79)
12.08±0.35
(70)
88.82±2.82
(79)
71.09±2.99
(70)
*Figures in the parenthesis indicate number of observation; NS-Non-significant (p>0.05).
Table 1 shows the body weight and growth performances of kids at different ages. Irrespective of
different genetic factors, the overall mean birth weight (BWT), three month body weight (3MWT), six
month body weight (6MWT), growth rate at 0 to 3 month (GR0-3) and growth rate at 3to 6 month
(GR0-6) were 1.21±0.03kg, 7.9±0.27kg, 12.08±0.35kg, 88.82±2.82g/d and 71.09±2.99g/d,

Proceedings of the Annual Research Review Workshop 2018, BLRI, Savar, Dhaka 1341, October 09-10, 2018
82 Poster Session
respectively. BWT of male kids were significantly (p<0.001) higher than those of female kids.
However, sex, genotype and parity had no significant effect on3MWT, 6MWT, GR0-3and GR3-6.
Table 2 shows the reproductive performances for different coat color genotypes of goat. The overall
age at puberty(days), number of service per conception, gestation length (d), age at first kidding (d),
litter size (no), post-partum heat period (d) and kidding interval (d) obtained in this study were
236.0±6.71, 1.37±0.06, 166.5±3.01, 413±15.29, 2.17±0.13, 72.3±15.59 and 235.7±15.53,
respectively. However, coat color genotype of goat, and parity had no significant effect on age at
puberty, number of service per conception, gestation length, age at first kidding, and kidding interval.
On the other hand, litter size and post-partum heat period significantly varied for the effect of coat
color genotype and parity.
Table 2. Reproductive performance for different coat color genotype of goat
Factor Reproductive parameters (Mean±SE)
Age at
puberty
(Days)
N. of service
per
Conception
(no.)
Gestation
length
(Days)
Age at first
kidding
(Days)
Litter size
(no.)
Post-partum
heat
period(Days)
Kidding
Interval
Genotype NS NS NS NS * ** NS
SW 225.6±0.38
(7)
1.33±0.02
(24)
161. 7±1.22
(20)
397.7±12.28
(6)
2.59±0.04
(22)
57.7±8.17
(6)
199.78±4.44
(9)
DB 237.5±3.46
(12)
1.39±0.02
(23)
171.5±0.97
(19)
411.8±8.14
(11)
1.88±0.04
(24)
27.0±2.73
(6)
240.88±7.48
(8)
TB 245.3±5.13
(6)
1.42±0.04
(12)
170.8±2.02
(10)
430.5±6.55
(6)
1.92±0.04
(12)
144.0±25.04
(4)
256.8±19.82
(5)
Parity NS NS *** * NS
1st - 1.48±0.02
(25)
173.5±0.98
(23)
- 1.69±0.02
(26)
88.5±20.15
(2)
243.5±8.81
(8)
2nd - 1.35±0.02
(23)
158.1±1.11
(17)
- 2.23±0.03
(22)
72.0±8.42
(9)
213.64±6.08
(11)
3rd - 1.18±0.03
(11)
168.8±2.6(8) - 3.33±0.14
(9)
62.75±4.83
(4)
237.0±17.83
(3)
Overall 236.0±6.71
(25)
1.37±0.06
(59)
166.5±3.01
(49)
413±15.29
(23)
2.17±0.13
(58)
72.3±15.59
(16)
235.7±15.53
(22)
*Figures in the parenthesis indicate number of observation; *-p<0.05; **-p<0.01); NS-Non-significant (p>0.05)
The results as obtained in this study show that body weight and growth rate of three coat color
genotypes performed almost similar. However, reproductive performance varied among color types.
Best litter size and post-partum heat period obtained from SW and DB types, respectively.
Proceedings of the Annual Research Review Workshop 2018, BLRI, Savar, Dhaka 1341, October 09-10, 2018
83 Poster Session
Production and compositional studies of local Pabna cows’ milk in Bangladesh
MAI Talukder1, M Shahjahan
2*, MR Habib
1, M Salahuddin
2, SM Rahman
2, MY Ali
2, S Munira
2,
MAH Miah2, MM Billah
2, S Rahman
2 and AKFH Bhuiyan
3
1Bangladesh Livestock Research Institute, Savar, Dhaka 1341;
2Dairy Development Research Project,
Bangladesh Livestock Research Institute Regional Station, Baghabari, Sirajganj-6770; 3Department of
Animal Breeding & Genetics, Bangladesh Agricultural University, Mymensingh 2202
Executive summary
Milk is an ideal food which contains all the essential nutrients for physiological functions of human
being. The aim of the present study was to know the effect of lactation length, parity and management
on production performance and nutritional composition of local Pabna cows‟ milk. The daily milk
yield data were recorded at 15 days interval from calving to till experimental period for animals raised
at BLRI Research station. The trial was continued from January-September,2018. The cows raised at
BLRI research station had the same parity (2nd
)and similar feeding regime (DM basis; 2.5% of body
weight using concentrate, straw and/or green grass).However, the overall management system varied
between on-station and community. To determine the nutritional composition of milk, a total of 12
and 16 milk samples, respectively were collected from the cows raised at BLRI research station and
DDRP community at Bera, Pabna district during June, 2018. All the collected milk samples were
shifted by ice box until analyzed at laboratory using Lactoscan MMC50 (Nova Zagora, Bulgaria).
Data on milk production were statistically analyzed in an ANOVA of Completely Randomized
Design and nutritional composition were statistically analyzed using independent sample t-test by
SPSS version 16 (SPSS Inc. Chicago, USA).
The average daily milk yield was significantly (p<0.05) higher during the first month (4.72 L) of
lactation and the lowest daily milk yield was at 5th month (3.44 L). However, daily milk yield of
Pabna cows raised at BLRI research station did not vary significantly (p>0.05) during 1st to 4
th months
of lactation period (Table 1). Among the test days milking(Figure 1) better yield was observed at 15
days (4.79L) of lactation (p<0.05).The effect of lactation stages (up to three or above months) had no
significant variations (p>0.05) on nutrient composition of local Pabna cows‟ milk (Table 2). Based on
the effects of parity number and lactation stages of cows, similar trends (p>0.05) were also found in
the milk collected from community cows (Table 3). However, the overall characteristics of milk
between on-station and community had significant differences on the composition of total solids
(p<0.001), SNF (p<0.001), fat (p<0.01), and protein (p<0.05where the highest values were 14.81,
8.65, 6.17and 3.53% at on-station cows‟ milk, respectively (Table 4).
Table 1. Effect of lactation period on milk production of local Pabna cows at on-station
Lactation period
(month)
n Mean
(L)
SE Minimum Maximum
First 12 4.72a 0.35 3.58 7.96
Second 10 4.17ab
0.16 3.48 5.28
Third 9 3.90ab
0.13 3.34 4.38
Fourth 8 3.68ab
0.17 3.03 4.53
Fifth 4 3.44b 0.25 2.82 4.02
Sig. level * - - -
Overall 43 4.10 0.13 2.82 7.96

Proceedings of the Annual Research Review Workshop 2018, BLRI, Savar, Dhaka 1341, October 09-10, 2018
84 Poster Session
Figure 1. Milk yield of local Pabna cows in different test days of lactation
Table 2. Effect of parity and lactation stages on milk characteristics of local Pabna cows at on-
station
Parameters Parity number (Mean±SE) t test Lactation stage (Mean±SE) t-test
≤2 parity
(n=12)
>2 parity
(n=0)
≤3 months
(n=9)
>3 months
(n=3)
Total solid (%) 14.81±0.19 - - 14.85±0.24 14.70±0.37 0.756
SNF (%) 8.65±0.08 - - 8.68±0.09 8.55±0.16 0.512
Fat (%) 6.17±0.16 - - 6.17±0.20 6.15±0.26 0.958
Protein (%) 3.53±0.11 - - 3.51±0.10 3.59±0.38 0.768
Lactose (%) 4.45±0.09 - - 4.49±0.10 4.30±0.18 0.365
Ash (%) 0.68±0.01 - - 0.68±0.02 0.67±0.04 0.829
Specific gravity 1.027±0.001 - - 1.027±0.001 1.026±0.001 0.382
pH 6.72±0.01 - - 6.71±0.02 6.73±0.01 0.720
Conductivity 4.04±0.04 - - 4.09±0.03 4.13±0.03 0.504
Table 3. Effect of parity and lactation stages on milk compositional characteristicsfrom local
Pabna cattle at community
Parameters Parity number (Mean±SE) t-test Lactation stage (Mean±SE) t-test
≤2 parity
(n=10)
>2 parity
(n=6)
≤3 months (n=5) >3 months
(n=11)
Total solid (%) 13.91±0.51 12.97±0.35 0.211 13.55±0.66 13.55±0.44 1.00
SNF (%) 7.88±0.18 8.05±0.10 0.493 7.80±0.27 7.99±0.13 0.487
Fat (%) 6.04±0.51 4.92±0.39 0.150 5.75±0.68 5.56±0.46 0.822
Protein (%) 3.10±0.07 3.15±0.04 0.515 3.07±0.09 3.13±0.05 0.507
Lactose (%) 4.15±0.10 4.25±0.06 0.472 4.11±0.15 4.22±0.07 0.481
Ash (%) 0.63±0.02 0.64±0.01 0.546 0.62±0.02 0.64±0.01 0.433
Specific gravity 1.025±0.001 1.027±0.001 0.228 1.025±0.001 1.025±0.001 0.607
pH 6.81±0.06 6.77±0.09 0.669 6.80±0.07 6.80±0.07 0.987
Conductivity 4.13±0.03 4.14±0.12 0.863 4.17±0.07 4.11±0.02 0.272
Table 4.The overall milk compositional characteristics of local Pabna cows (≤2 parity) raised under
on-station and community
Parameters Management systems (Mean±SE) t-test
On-station (n=12) Community (n=10)
Total solid (%) 14.81±0.19 12.97±0.19 0.000
SNF (%) 8.65±0.08 8.05±0.10 0.000
Fat (%) 6.17±0.16 4.92±0.39 0.003
Protein (%) 3.53±0.11 3.15±0.04 0.034
Lactose (%) 4.45±0.09 4.25±0.06 0.162
Ash (%) 0.68±0.01 0.64±0.01 0.099
Specific gravity 1.027±0.001 1.027±0.001 0.702
pH 6.72±0.01 6.77±0.10 0.438
Conductivity 4.10±0.02 4.14±0.05 0.411
It is concluded that first month of lactation was the best milk producing period among the five months
of lactation and the management system had positive association with milk composition of local
Pabna cows.
0.00
2.00
4.00
6.00
1 15 30 45 60 75 90 105 120 135 150
Mil
k y
ield
(L
)
Test day milking (day)

Proceedings of the Annual Research Review Workshop 2018, BLRI, Savar, Dhaka 1341, October 09-10, 2018
85 Poster Session
Prevalence study and molecular characterization of infectious laryngotrachitis virus in
selected areas of Bangladesh
M Giasuddin1, MZ Ali
1, MR Karim
1, MA Samad
1, E Islam
2 and NR Sarker
3
1Animal Health Research Division,
2Research on FMD and PPR in Bangladesh,
3Poultry Production
Research Division, Bangladesh Livestock Research Institute (BLRI), Savar, Dhaka 1341
Executive summery
Infectious Laryngotrachitis (ILT) is an important respiratory disease of chicken caused by gallid
herpes virus-І of the family Herpesviridae, subfamily Alphaherpesvirinae, genus Iltovirus. It is an
enveloped, non-segmented and linear double-stranded DNA virus. Clinical signs associated with the
severe form of the disease include gasping, depression, nasal discharge, conjunctivitis, and
expectoration of bloody mucus. Upon gross examination of the trachea, characteristic severe
hemorrhages and mucus plugs are observed. The clinical signs associated with less severe forms of
the disease include conjunctivitis, swelling of the infraorbital sinuses, closed eyes, persistent nasal
discharge and mild tracheitis. Total 350 tracheal swab samples were collected from suspected cases of
ILT from commercial layer of selected areas (Gazipur, Bogura, Chattogram and Dhaka) of
Bangladesh. After collection the samples were kept in viral transport medium (VTM) containing
antibiotics. After collection, the samples were transported to the Virology Laboratory of the Animal
Health Research Division, BLRI, Savar, Dhaka and stored at -800C until tested. The samples swab
samples were grinded and homogenized, and 10% suspension was be prepared by using phosphate
buffer solution (PBS). The suspension was centrifuged at 4500 rpm for 10 min for the collection of
supernatant and extracts the genomic DNA by QIAamp DNA Mini Kit according to manufacturer
guideline. Then qPCR were performed for the confirmation of ILTV positive samples by reference
primer and probe. About 5.14% (n=18) samples were found positive for ILTV with distribution of
prevalence as 8, 7, 2 and 1 in Gazipur, Bogura, Dhaka and Chattogram district respectively. Highest
prevalence was revealed in young chicks (72.22%) than adult (27.78%). The study carried out to
detect ILTV circulating in Bangladesh and young chicks are more susceptible to infection.

Proceedings of the Annual Research Review Workshop 2018, BLRI, Savar, Dhaka 1341, October 09-10, 2018
86 Poster Session
Genetic evolution of highly pathogenic avian influenza virus (HPAIV) for interspecies
transmission and spillover in Bangladesh: Emergence of HPAI H5N6
MA Samad1, MR Karim
1, MZ Ali
1, M. Hasan
1, P Pramanik
1, MA Sufian
2 and M Giasuddin
1
1National Reference Laboratory for Avian Influenza, Animal Health Research Division, Bangladesh
Livestock Research Institute, Savar, Dhaka 1341; 2Department of Livestock Services, Dhaka,
Bangladesh
Executive summary
Highly pathogenic avian influenza virus (HPAIV) A/H5N1 subtype – is a major issue for the poultry
industry in Bangladesh during first incursion of HPAIV in 2007. Bangladesh has one of the highest
reported numbers of outbreaks of highly pathogenic avian influenza (HPAI) H5N1 in poultry. As of
July 20, 2015, a total of 548 outbreaks of HPAI H5N1 have been reported; these outbreaks have
resulted in serious economic repercussions in poultry sector in this country. Furthermore, 7 cases of
human infection with HPAI H5N1 were confirmed emphasizing the public health aspect of the on-
going HPAIV H5N1 outbreaks. Following the initial spread of clade 2.2 H5N1 HPAI virus in
Bangladesh in 2007, there have been new introductions of clade 2.3.2.1 and clade 2.3.4 virus in 2011.
Genetic information about those circulating AIVs have shown natural reassortment HPAI H5N1 virus
containing a H9N2-PB1 gene in poultry in Bangladesh. The HPAI A/H5 virus is a significant menace
not only to the poultry industry but also to human health due to its pandemic budding. The aim of the
study was the detection of molecular evolution and identification of novel HPAIVs circulating in
Bangladesh. Cloacal and oropharyngeal swab samples were collected from the live bird of LBMs
(birds; n=754, ducks; n=414) and morbid materials such as trachea were collected from dead birds
(n=108), and environmental samples of LBMs (n=242) from sub district Savar, Dhamri, Gazipur
Sadar during July 2017 to June 2018. All samples were tested by qRT-PCR for influenza A (M gene),
H5, H7, H9, N1, N2, N6, N8, N9 genes of avian influenza virus. Of the total, 3 of the chicken were
found positive for A/H5N6. The identified H5N6 viruses were cultured and further characterized by
qRT-PCR which also revealed A/H5N6. Partial HA gene sequencing was performed by Sanger
sequencing and subjected to phylogenetic analysis. Phylogenetic analysis based on partial sequences
of the HA gene of A/H5N6 subtype belongs to 2.3.4.4 clade. Whole genome sequencing of A/H5N6
samples were performed in Animal and Plant health Agency, UK and subjected to phylogenetic
analysis. Phylogenetic analysis based on whole genome sequences also revealed that circulating
A/H5N6 subtype belongs to 2.3.4.4 clade.

Proceedings of the Annual Research Review Workshop 2018, BLRI, Savar, Dhaka 1341, October 09-10, 2018
87 Poster Session
Sero-surveillance of circulating of PPR Virus and its Phylogenetic analysis in different
areas of Bangladesh
M Ershaduzzaman1, MA Yousuf
2, MN Monsi
3, MZ Hassan
2, MR Islam
4 and MM Rahman
5
1 System Research Division,
2Animal Health Research Division,
3 Goat and Sheep Research Division,
Bangladesh Livestock Research Institute, Savar, Dhaka 1341; 4 Bangladesh Agricultural Research
Council. Farmgate, Dhaka; 5 Sheep project, BLRI, Savar, Dhaka 1341
Executive summary
Peste des Petits Ruminants (PPR) is a highly fatal viral disease of goat and sheep. This research work
was done in 2017-18 by executing, surveillance and epidemiological studies to determine
present status of circulating PPR virus and its molecular characterization in different areas of
Bangladesh. cELISA was used PPR antibody detection and RT-PCR also used for N gene
identification. Sera samples and nasal swabs were collected from eight (8) selected villages under
Meherpur sadar upazila of Meherpur district on questionnaire basis. Considering two villages as
control and six villages as treatment villages. The total 3656 sera was collected at pre vaccination (0
days), 21 days, 2 months, 6 months of post vaccination at the selected areas that was tested by
cELISA and 12035 goats and sheep received local PPR Vaccine. Baseline study showed that a total
of 950 household rear goats in selected 8 villages where number of goats per household ranges from
4.0-5.0. Deworming was done before vaccination in the treatment villages. Pre-vaccination sera
analysis showed that in six treatment village seropositive goats were 55.95%, 50.76%, 37.68%,
41.12%, 44.62%, and 43.26% in Chakshamnagar, kola, Amjupi, Amdaoah, Gopalpur and Chadbill
respectively, whereas in the control villages seropositive goats were 40.00% and 42.57% in Doforpur
and Mayamari, respectively that presented in figure number 01.
Figure 1. Sero-Prevalance of PPR antibody in goats at treatment (6 villages) and control (2 villages)
Overall 44.90% goats were seropositive against PPR Virus in treated villages before vaccination. Sera
was analysed from 21 days, 2 months and 6 months of post-vaccinated goat from the treatment 6
villages showed the herd immunity level of goats rose to 89.10%, 93.25% and 93.37% respectively
shown in Graph-1.

Proceedings of the Annual Research Review Workshop 2018, BLRI, Savar, Dhaka 1341, October 09-10, 2018
88 Poster Session
Graph 1. The herd immunity against PPR virus at treatment (6 Villages) of Meherpur district.
Whereas in the control villages seropositive against PPR virus in goats was 38.14%, 43.98% and
35.64%, respectively shown in Graph 2.
Graph 2. The immunity status against PPR virus at control (2 Villages) of Meherpur district
Awareness building campaigns with villagers have been conducted involving both men and women
through meeting, regular visit of household, distribution of poster and leaflet. Morbidity and case
fatality rate recorded were 15% and 70.55%, respectively due to PPR outbreaks. In clinical case, total
172 nasal swabs were tested by RT-PCR and 119 samples were N gene positive. The PCR Products
were storage for phylogenetic analysis. There was no PPR outbreak in the vaccinated villages though
two farmers introduced PPR infected goats in their herds bought from market. No spread of PPR in
other goats due to vaccination program. New entry of goats in the household or village is most
important risk factor for PPR virus circulation which was found in several outbreaks in the non-
vaccinated and surrounding villages. It is reflected that locally produced PPR vaccine confers
sufficient herd immunity that can protect PPR disease in goat and helps to meet global PPR control
programme.
0.00%
20.00%
40.00%
60.00%
80.00%
100.00%
120.00%
Pre vaccination
PV 21 Days
PV 3 Month
PV 6 Month
0.00%
5.00%
10.00%
15.00%
20.00%
25.00%
30.00%
35.00%
40.00%
45.00%
50.00%
Pre vaccination Post 21 days Post 3 Month Post 6 Month
Doforpur (CV)
Myamari (CV)

Proceedings of the Annual Research Review Workshop 2018, BLRI, Savar, Dhaka 1341, October 09-10, 2018
89 Poster Session
A comparative study on pregnancy diagnosis in sheep (Ovis aries) using barium chloride
and progesterone based- kit
MN Munsi, S Akther and MH Rahman
Goat and Sheep Production Research Division, Bangladesh Livestock Research Institute, Savar,
Dhaka 1341
Executive summary
This study aiming at developing a low cost technique for early diagnosis of pregnancy in sheep was
conducted in Goat and Sheep Research Farm and Small Ruminants Health Laboratory under Goat and
Sheep Production Research Division of Bangladesh Livestock Research Institute (BLRI), Savar,
Dhaka from July 2017 to June 2018. About 100 sheep of different age groups were randomly selected
for the trial and sheep were categorized under four groups according to their gestation length and
blood and urine sample were used for this experiment. Then 1%, 1.5% and 2% barium chloride
solution were prepared and test was done by using 1 ml barium chloride of each concentration after
mixing with 1 ml of urine sample and allowed for 5 and 10 minutes for interpretation. Presence of
precipitation was interpreted as negative for pregnancy and absence of precipitation was interpreted as
positive for pregnancy. For each blood sample, after adding 3 to 5 drops of serum in each insertion
hole of the Bovipreg kit and observe for 5 minutes to notice the presence of one or two red line in.
One red line was interpreted as negative pregnancy and two red lines were interpreted as positive
pregnancy. In our study,1.5% barium chloride showed the highest accuracy of 67.75% for sheep with
0.5 to 1 month of gestation (Table 1), 68% for sheep with >1 to 1.5monthof gestation (Table 2),
69.25% for sheep with >1.5 to 2months of gestation (Table 3), and 67.75% for sheep with >2 to 2.5
months of gestation(Table 4).Conversely, the accuracy levels for progesterone-based early pregnancy
diagnostic kit were 80%, 82%, 83%, and 85% for sheep with 0.5 to 1 month, >1 to 1.5month, >1.5 to
2months, and >2 to 2.5months of gestation respectively (Table 1, 2, 3, and 4).
Table 1. Comparative results of barium chloride and progesterone- based kit pregnancy diagnosis in
sheep with 0.5 to 1 month of gestation
Number
of Goats
Barium Chloride (Concentration and diagnostic accuracy) Progesterone
- Based Kit
(Diagnostic
accuracy) n=25 1% (Conc.) 1.5% (Conc.) 2% (Conc.)
5 min. 10 min. 5min 10min 5 min. 10 min. 5 min.
66.5% 67.5% 68% 67.5% 67.5% 66.5% 80%
Mean 67% 67.75% 67% -
Table 2. Comparative results of barium chloride and progesterone- based kit pregnancy diagnosis in
sheep with >1 to 1.5 month of gestation
Number
of Goats
Barium Chloride (Concentration and diagnostic accuracy) Progesterone
- Based Kit
(Diagnostic
accuracy) n=25 1% (Conc.) 1.5% (Conc.) 2% (Conc.)
5 min. 10 min. 5min 10 min 5 min. 10 min. 5 min.
68% 67.5% 68.5% 67.5% 68.5% 67% 82%
Mean 67.75% 68% 67.75% -

Proceedings of the Annual Research Review Workshop 2018, BLRI, Savar, Dhaka 1341, October 09-10, 2018
90 Poster Session
Table 3. Comparative results of barium chloride and progesterone- based kit pregnancy diagnosis in
sheep with >1.5 to 2 months of gestation
Number
of Goats
Barium Chloride (Concentration and diagnostic accuracy) Progesterone-
Based Kit
(Diagnostic
accuracy) n=25 1% (Conc.) 1.5% (Conc.) 2% (Conc.)
5 min. 10 min. 5 min 10 min 5 min. 10 min. 5 min.
70% 67.5% 70.5% 68% 67.5% 66.5% 83%
Mean 68.75% 69.25% 67% -
Table 4. Comparative results of barium chloride and progesterone- based kit pregnancy diagnosis in
sheep with >2 to 2.5 months of gestation
Number
of Goats
Barium Chloride (Concentration and diagnostic accuracy) Progesterone
- Based Kit
(Diagnostic
accuracy) n=25 1% (Conc.) 1.5% (Conc.) 2% (Conc.)
5 min. 10 min. 5min 10min 5 min. 10 min. 5 min.
69% 68% 70% 71% 66.5% 67.5% 85%
Mean 68.5% 70.5% 67% -
To conclude, it is obvious that incase of sheep, the progesterone-based early pregnancy diagnostic kit
cannot be replaced by barium chloride test but 1.5% barium chloride can be used for primary
screening.

Proceedings of the Annual Research Review Workshop 2018, BLRI, Savar, Dhaka 1341, October 09-10, 2018
91 Poster Session
Effect of feed supplementation on age at puberty in growing buffalo heifers
MF Afroz*, SMJ Hossain, GK Deb, SM Amanullah and MA Habib1
Biotechnology Division, 1Fodder Research and Development Project, Bangladesh Livestock Research
Institute, Savar, Dhaka 1341; *Corresponding author: [email protected]
Executive summary
Buffalo is a potential animal genetic resource. At present, buffalo population in the world is
approximately 150 million. Based on karyotypes, buffaloes are two types such as river and swamp
type. The swamp buffaloes are raised in countries extending from Assam to China and used for
drought power and river buffaloes are found in the Indian sub-continent, and used primarily as a
source of milk. The fertility of buffalo was significantly higher (83.5%) when kept on higher plain of
nutrition as compared to 66.6% for those maintained on low plain of nutrition. Age at first calving
may be reduced through providing balanced feeding, improved management and minimum disease
prevalence. To get faster growth rates for early puberty on cost effective, it is recommended that forge
should be the basal diet and concentrates as supplementation. Our local buffalo attained puberty at
30.3months age at on-station and 39.4 to 54.5 months at on-farm condition. But, in the majority
of dairy buffaloes in Bangladesh, calving occurs at 4-6 years of age. This is due to an inadequate
supply of feed and nutrients during the growing phase. Most buffalo cease ovarian cyclicity during
hot summers, probably due to the combined effects of nutrition, environment and management.
Nutritional manipulations may influence the period of sexual maturation. In Bangladesh, buffalo is an
important large ruminant; estimated the population of about 1.47 millions and they are mostly local
type. Pakistani Nili-Ravi and Indian Murrah buffaloes were widely used to increase dairy
characteristics of local buffalo population in Indo-Chinese Region and South America through
crossbreeding. These crossbreeding programmes resulted increase in lactation milk yield from 700 to
2,000 kg per year in China. So, considering the above facts genetic potentiality of local buffalo breeds
has to improve for increasing their milk and meat production through crossing local buffalo with high
yielding exotic Murrah and Nili-Ravi buffalo breed. It needs also to evaluate the adaptability of those
crossbred buffaloes to our farmer‟s condition. Low reproductive efficiency (late maturity, long
calving interval and silent heat etc.) is a serious constraint to buffalo production. To overcome these
problems, a feeding trial was conducted with different levels of concentrate supplement along with
urea-molasses-straw (UMS) was supplied adlib as basal diet. Thus, the aim of present study was to
investigate the effect of different levels of concentrate supplement on age of sexual maturity of
buffalo heifers and is too increase genetic makeup of local buffalo through crossbreeding with Murrah
& Nili-Ravi buffalo. To conduct this study, sixteen buffalo heifers aged from 6 months to 12 months were selected and
divided randomly into four homogenous (considering age and body weight) treatment groups (Group
A, B, C and D). Buffaloes of all groups received urea molasses straws as basal diet. The experimental
buffaloes were also received concentrates@ 0.5% on body weight for group A, 0.75% for group B,
1.00% for group C and 1.25% for group D, respectively. Required amount of concentrates were
provided twice in a day (50% in the morning and 50% in the evening). Adlib fresh water was supplied
to separate manger for each group. The age of puberty were recorded when the animals had showed
first sign of heat or responded to teaser bull. The susceptibility of buffalo with common diseases was
evaluated. Any reproductive diseases were monitored. Daily feed intake; body weight; feed
evaluation; nutrient requirement calculations, date of birth; feed conversion ratios were recorded.
Regular de-worming and vaccination against common diseases were ensured during experimental
periods for all groups. The trial was conducted for a period of 482days. The relevant data were
compared statistically in an ANOVA of a Completely Randomized Design using IBM SPSS 20.0
Table 1 represents feed intake, growth and FCR values of buffalo heifer fed graded levels of
concentrate mixture. The total DM intakes during the entire experimental periods differed
significantly (p<0.001) among treatment groups. As the level of concentrate increase in diet the DM
intake increased linearly and significantly (p<0.001). Significantly lowest amount of DM was
consumed in the animals of group A. The feed conversion efficiency had significantly better in group
A than that of group B, C, and D respectively. FCR however, did not differ significantly (p>0.05)

Proceedings of the Annual Research Review Workshop 2018, BLRI, Savar, Dhaka 1341, October 09-10, 2018
92 Poster Session
among the group B, C and D, although overall difference among groups were not significant. The
average daily gain as well as the total live weight gain did not differ significantly among the treatment
groups (p>0.05).
Table 2 shows the age at puberty and body weight at puberty of buffalo heifers among four treatment
groups. As shown in Table 2 that quantity of concentrate feeds allocated by different proportions
among four treatment groups had no significant (p>0.05) effect for either attaining age at puberty or
body weight at puberty.
Table 1. Feed intake (up to 482 days) and efficiency of buffalo heifers for different treatment groups
Intake Treatment group (Mean±SE) Level of
significance A B C D
Initial body
weight (Kg)
195.5±19.62 220.38±41.23 194.75±28.51 203.5±37.19 P=0.939NS
Final body
weight (kg)
302.5±19.50 319.25±40.77 297.25±22.46 292.25±31.69 P=0.924NS
Total weight
gain (kg)
221.75±16.61 191.25±25.82
192.75±11.42
205.50±22.04
P=0.680NS
Daily weight
gain (g/d)
460.06±0.03 396.78±0.05 399.89±0.02 426.35±0.04 P=0.680NS
Total DM
intake (Kg)
2501.75a±160.4 2926.50b±28.05 3189.50b±93.09 3593.50c±70.28 P=0.0***
FCR 11.31a±0.23 16.21ab±2.27 16.68b±0.82 18.21b±2.25 P=0.060NS
A=UMS (adlib)+0.5% concentrate; B=UMS (adlib)+0.75% concentrate; C=UMS (adlib)+1.0% concentrate; D=
UMS (adlib)+1.25% concentrate; NS-not significant (p>0.05); ***-significant at 0.1% level (p<0.001); mean
with uncommon superscripts within the same row differed significantly (p<0.05).
Table 2. Age and body weight at puberty of buffalo heifer for different treatment groups
Pubertal age and
weight
*Treatment group (Mean±SE) Level of
significance A B C D
Age at puberty
(month)
22.94±1.07
(03)
23.40±0.80
(02)
23.90±0.40
(03)
24.30±0.60
(02)
P=0.678NS
Body weight at
puberty (kg)
346.67±16.91
(03)
372.30±2.50
(02)
355.0±1.73
(03)
372.50±10.61
(02)
P=0.351NS
*Treatment combinations have given in footnote of Table 1; NS-significant at 5% level (p<0.05)
Based on the results so far obtained from this study, it may be concluded that buffalo heifers could be
allowed concentrates @0.5% on body weight along with UMS adlib for obtaining optimum puberty,
as more concentrates than this had not shown significantly better results. However, more researches
including more animals need to be done to draw a concrete decision.

Proceedings of the Annual Research Review Workshop 2018, BLRI, Savar, Dhaka 1341, October 09-10, 2018
93 Poster Session
Physiochemical characteristics of silage prepared from BLRI Nepier-3, Pakchong-1 and
Maize
S Ahmed, MA Hemayet, MRH Rakib and MA Jalil
Goat and Sheep Production Research Division, Bangladesh Livestock Research Institute, Savar,
Dhaka 1341
Executive summary
Goat and sheep are widespread in the country and are important for the subsistence, economic and
social livelihoods of a large human population of Bangladesh. Being much smaller than cattle, they
require less money to purchase and need little investment facilities. Feed and fodder scarcity is a
major limiting factor of livestock production in Bangladesh and in particular resulting in low
productivity, poor growth and reproduction of animals. As arable land is decreasing day by day stall
feeding system of goat and sheep farming is increasing. Thus, farmers are practicing perennial fodder
production for their goat and sheep. BLRI Napier-3, Pakchong-1 and maize fodders are commonly
cultivated by farmers regarding this purpose. As Pakchong-1 is a newly introduced fodder germplasm
in the country, no systematic information available about the production and the forage quality of
Pakchong-1 in Bangladesh condition. Therefore, the study was aimed to know the silage quality of
Pakchong-1 compare to BLRI Nepier-3 using Maize silage as a control group.All the mention fodders
were cultivated at Bangladesh Livestock Research Institute fodder field. BLRI Nepier-3 and
Pakchong-1 were harvested at 50 days of maturity while the fodder maize was harvested at about 50%
flowering stage after sowing(75days) and chopped at 01–04-cm length for silage preparation. Silages
were packed tightly in plastic drum and sealed to remain air tight. All experimental silages were
replicated three times and stored in room temperature for 60 days for ensiling. The fodder samples
before and after fermentation were collected forphysical and chemical analysis.
Table 1. The chemical composition of fodders used for silage preparation
Parameters Grasses
BLRI Nepier-3 Pakchong-1 Maize
DM, % 21.58 21.42 18.61
OM, % 78.42 78.58 81.39
Ash, % 9.93 7.61 10.20
CP, % 7.33 7.08 8.47
ADF, % 50.48 48.00 51.68
NDF, % 81.84 83.20 82.30
Physical characteristics of BLRI Nepier-3, Pakchong-1 and Maize silage are presented in table2. The
colour of all types of silages wasacceptable but aroma indicated that the ensiling quality of Pakchong-
1 and Maize fodderwasbetter compared to BLRI Napier-3. The aroma of Pakchong-1 and Maize
silage indicated that thedesirable lactic acid fermentation occurred where aroma of BLRI Nepier-3
indicated the production of acetic acid along with lactic acid. However, both the colour and aroma are
in acceptable range for silage quality.
Table 2. The physical characteristics of different fodder silages
Parameters Silage
BLRI Nepier-3 Pakchong-1 Maize
Colour Pale yellowish green Light green to yellowish
green
Light green to yellowish
green
Aroma Mild and Slightly
vinegary
Mild, pleasantly acidic,
sour milk or natural yoghurt
smell
Mild, pleasantly acidic, sour
milk or natural yoghurt
smell
Texture firm firm firm

Proceedings of the Annual Research Review Workshop 2018, BLRI, Savar, Dhaka 1341, October 09-10, 2018
94 Poster Session
Table 3. Fermentation characteristics and chemical composition of different fodder silages
Parameters Silages
BLRI Nepier-3 Pakchong-1 Maize silage
pH 4.78 3.54 3.58
NH3N (mg/100g) 97.12 29.95 11.62
DM, % 15.84 20.24 22.56
OM, % 84.16 79.76 77.44
Ash, % 6.91 6.84 4.54
CP, % 8.08 7.05 7.09
ADF, % 39.50 47.54 46.96
NDF, % 74.32 73.93 77.17
The fermentation characteristics and chemical composition of BLRI Nepier-3, Pakchong-1 and Maize
silage are shown in Table3. The lower pH produced by Pakchong-1 and Maize silage indicated that
the ensiling properties of Pakchong-1 was better than BLRI Napier-3. Higher concentration of NH3-
Nin BLRI Nepier-3 compared to Pakchong-1 and maize silage also suggested that more proteolysis
occurred in BLRI Nepier-3 silage. Therefore, the results suggest that ensiling characteristics of
Pakchong-1 is better than BLRI Nepier-3 cultivar based on current study.

Proceedings of the Annual Research Review Workshop 2018, BLRI, Savar, Dhaka 1341, October 09-10, 2018
95 Poster Session
Table 1. Chemical composition of experimental diets
Diets DM, % of
fresh BM
Chemical composition (%DM) GE (Mj/
kg, DM) OM CP ADF NDF Ash
Maize 18.89b 93.8 7.8b 42.5a 68.47a 6.16 16.11b
Oat 20.18b 94.1 10.1a 42.9a 65.72b 5.87 15.96c
Triticale 22.20a 93.3 10.7a 38.8b 64.45c 6.73 16.39a
SED 0.83 0.43 0.16 1.68 0.33 0.43 0.003
Sig. ** NS *** ** *** NS ***
Table 2. Nutritional and growth responses of different roughages
Parameters Diets SED Sig.
Maize Oats Triticale
DMI (Kg/d) 3.67 3.60 3.54 0.04 NS
CPI (Kg/d) 0.28b 0.37a 0.39a 0.004 ***
OMI (Kg/d) 3.44 3.38 3.31 0.03 NS
DMI (kg, % LW) 1.97 1.92 1.92 0.03 NS
DM dig. 59.8b 64.7a 62.6ab 4.32 *
CP dig. 58.2b 64.5a 60.0b 4.47 **
OM dig. 61.2b 66.1a 64.4ab 4.05 *
DDMI (Kg/d) 2.20 2.32 2.23 0.02 NS
DCPI (Kg/d) 0.17b 0.24a 0.23a 0.004 ***
Initial LW (Kg) 181.3 179.5 178.5 596 NS
Final LW (Kg) 197.0 199.5 195.9 585 NS
ADG (g) 248 305 290 2.35 NS
FCR 15.23 12.55 12.60 3.46 NS
Feed intake, growth performance and nutrient utilization by local growing bulls fed
different fodders as sole diet and their biometrical ranking
BK Roy, N Huda, KS Huque1 and N Sultana
Animal Production Research Division, 1Ex-Director General, Bangladesh Livestock Research
Institute, Savar, Dhaka 1341
Executive summary
The efficiency of a fodder to animal production performances is important as about 55 to 75 % of the
total costs of farming are associated with feed costs (NRC, 2000; Basarab and Okine, 2002). Feed
evaluation systems are used to match the dietary nutrient supply with animal requirements for a
specific level of production. These systems are important in order to optimize the efficiency of feed
utilization, to improve animal performance and to reduce nutrient losses to the environment. The
germplasm of different varieties of fodder crops are available in the country, some of them are
popular as cultivars to farmers and a number of private organizations have been introducing new
seeds of fodder crops of exotic origins to a backdrop of demand and supply gaps of green grass in the
country (Huque and Sarker,
2014). Without considering
nutritional benefits to animals or
comparative production
performances with existing crops
new fodder crops are being
introduced. The efficiency of on-
farm biomass production, it‟s
response to growth & milk production to bovine animals and the reduction of enteric methane
emission in the rumen and the cost-effectiveness are major factors affect benefits of a fodder crop in
farming systems (Huque et al., 2014).Biometrical ranking based on Maize Index (Mi) of Maize,
Napier, Jumbo (sugar graze), Australian sweet Jumbo, UMS of Rice straw (Boro and Aman), Moringa
plant fodder, Green Jumbo, German and Para have been done and a Maize index (Mi) has been
developed through a series of feeding trial from 2014-2017.Maize Index (Mi) is a co-efficient of
production efficiency of biomass and animals, reduction efficiency of enteric CH4 emission in the
rumen, and of benefit-cost ratio compared to Maize silage. Thus, the Maize Index equation of
afodder was developed (Huque et al, 2017) and putted below.
In continuation of research works, Oat
(Avena sativa) and Triticale (Triticosecale),
two important fodders being cultivated by
the farmers in the winter are considered to
be ranked accordingly. Thus, the present
research work was undertaken with the
objectives of evaluating intake, digestibility
and growth performances of local growing
bulls fed Oat or Triticale silage alone
keeping Maize (Zea mays) silage as control
and to scaling up the available roughages.
Maize, Oat and Triticale were cultivated
and harvested at their optimum maturity and
ensiled for feeding to experimental animals.
The three different types of fodder were
randomly fed to 18 local growing bulls (Bos indicus; BCB-1) of average 179.733.4 Kg initial live

Proceedings of the Annual Research Review Workshop 2018, BLRI, Savar, Dhaka 1341, October 09-10, 2018
96 Poster Session
Table 3. Maize index (Mi) of different fodder crops
Fodder Xddm Xap XCH4 Xbc Mi
Maize 1 1 1 1 1
Oat 0.64 0.74 1.27 0.87 0.88
Triticale 0.56 0.64 1.19 0.80 0.80
weight dividing them into three equal groups. The animals were housed individually and fed the
roughage diets ad libitum for a period of 60 days including a 7 days digestibility trial after 40 days of
feeding. Fresh and clean water was available in the animal sheds for the whole experimental period.
At the onset of feeding trial, animals were dewormed properly with Endex ® (Levamesol BP 600 mg
per bolus).The animals were weighed at an interval of 10 days, and their feed intake, digestibility of
nutrients and growth performances were used for comparing the nutritional qualities of different
roughages. The enteric CH4 emission in the rumen was calculated using the equation of IPCC
(2006).The nutritional responses were compared statistically in an ANOVA of a Completely
Randomized Design (CRD) using General Linier Model Procedures of SPSS, 17 computer software
packages.
Among the three different roughages, Maize had higher biomass yield in terms of both fresh (46.9
MT/h) and dry matter basis (10.6 MT/h) than that of Oat (31.3 & 6.32 MT/h, respectively) and
Triticale (25.4 & 5.64 MT/h, respectively)
considering a single cultivation. The
production cost per ton DM silage of Maize
was lower (US$ 85.0) than that of Oats
(US$152.0) and Triticale (US$165).Both the
Triticale (10.7%) and Oat silage (10.1%) had
significantly (p<0.001) greater CP
concentrations than the Maize (7.8%). The
ADF (p<0.01) and NDF (p<0.001) content on the other hand were greatest with Maize, intermediate
with Oat and lowest with Triticale silage(Table 1).Maize, Oat and Triticale silage had per head daily
DM intake of 3.67 Kg, 3.60 Kg and 3.54 Kg, respectively, and their intake percent live weight was
1.97, 1.92 and 1.92%, respectively. Daily DM intake, DM intake on percent live weight and OM
intake of bulls did not vary significantly (p>0.05) among the three different roughages. However, per
day CP intake of bulls fed Triticale silage (0.39 Kg/d) was significantly higher (p<0.001) followed by
bulls those fed Oat silage (0.37 Kg/d) and Maize silage (0.28 Kg/d). The DM (p<0.05), CP (p<0.01)
and OM (p<0.05) digestibility appear to be greatest for Oat (64.7, 64.5 & 64.4%, respectively),
intermediate for Triticale (62.6, 60.0 & 64.4%, respectively) and lowest for Maize (59.8, 58.2 &
61.2%, respectively). Similarly, Oat silage had the highest (p<0.001) intake of digestible DM
followed by DDM intake of Triticale and Maize. However, the intake of DDM and DOM did not vary
significantly (p>0.05) among the roughages. Feeding Oat silage had higher (p>0.05) average daily
gain of 305 g compared to 290 g of Triticale or 248 g of Maize with an average feed conversion
efficiency of 12.55, 12.60 and 15.23, respectively (p>0.05; Table 2).The cost involvement for kg DM
yield of Maize, Oat and Triticale silage were Tk. 7.03, 12.59 and 13.63, respectively. However, the
total roughage cost including refusal losses of Kg live weight gain were significantly (p<0.01) lower
for bulls fed Maize silage (Tk. 119.0) than bulls those fed with Oat (Tk. 176.0) and Triticale silage
(Tk. 193.0). Considering feed cost, Maize silage fed bulls required less feed cost for Kg live weight
gain than other two roughages. Therefore, considering the feed cost data the roughages may be ranked
as Maize silage>Oat silage>Triticale silage. The calculated Maize index (Mi) based on biomass
production efficiency (Xddm), animal production efficiency (Xap),enteric methane emission reduction
efficiency(XCH4) and benefit to cost efficiency(Xbc) of fodder crops has been presented in Table 3.
Considering all these factors, the Mi of Maize was the highest (1.00) followed by Oat (0.88) and
Triticale (0.80), respectively.
Finally, it may be concluded that considering the Maize index (Mi) of fodder crops, the biometrical
rank of roughages may be as Maize>Oat>Triticale.

Proceedings of the Annual Research Review Workshop 2018, BLRI, Savar, Dhaka 1341, October 09-10, 2018
97 Poster Session
Comparative study on BLRI Napier hybrid and Pakchong fodders for yield, silage
quality and growth performance of bull calves
NR Sarker, D Yeasmin, F Tabassum, MR Amin, MT Hasan and MA Habib
Fodder Research Development Project, Bangladesh Livestock Research Institute, Savar, Dhaka 1341
Executive Summary
Scarcity of feed is one of the major problems for rearing livestock in Bangladesh. Sustainable
livestock production is highly dependent on the availability of quality feed and forage resources.
Napier or elephant grass has been the most promising and high yielding fodders giving considerable
nutritional characteristics and adaptability that suppresses most tropical grasses. But with the
increasing demand of feeds and forages for livestock, Napier alone does not meet the requirements.
So, it is an urgent need to search for alternative grasses those may perform better than Napier.
Recently, a high yielding grass has been imported from Thailand named Pakchong which has been
derived from Napier and mostly adapted to our climate. This study was undertaken to compare the
biomass production and nutritional evaluation of Pakchong with Napier hybrid (BN-3)at different
stages of maturity (SM) and feeding impacts of both fodders on growing bull calves after making
silage. For this study, 10 experimental plots each of 25m2were prepared at Pachutia Research Farm,
BLRI, Savar, Dhaka. After land preparation, stem cuttings of both cultivars were transplanted into 5
plots for each cultivar. Fodder crops were harvested in three different periods at 70, 80 and 90 days.
Data were recorded up to three cuttings for the same periods of harvest. After harvest, silage was
prepared from both grasses. Nutritive value and feeding effects of silage for both grasses were
examined. Both silages were fed to 10 RCC growing bull calves for comparing the effects of feed
intake and growth of calves. No concentrate feeds were supplied to animals of each group. All data
related to yields, nutritive value of silage, silage intake, body weight changes and nutrient digestibility
of silage in two cultivars were recorded and analyzed for statistical outputs by IBM SPSS 20.0 in a
2×3 factorial CRD design.
Biomass yield and botanical fractions of two cultivars are shown in Table 1, which shows that both
cultivars differed significantly on biomass yield and botanical fractions. Although, biomass yield of
Pakchong was significantly higher than BN-3, but in terms of leaf production and leaf-stem ratio
(LSR), BN-3 performed better than Pakchong. Different stages of maturity (SM) caused variations for
stem weight and LSR significantly with increasing stem weight and decreasing LSR in latter stages.
Cultivar and SM interacted (Cultivar×SM) significantly for plant height, stem weight and LSR.
Table 2 represents the nutrient compositions after making silage of both cultivars. As shown in Table
2 that the quality of Pakchong silage is comparatively better than the quality of Napier-3 silage in
terms of nutritional facts.

Proceedings of the Annual Research Review Workshop 2018, BLRI, Savar, Dhaka 1341, October 09-10, 2018
98 Poster Session
Table 3 shows the comparative evaluation of intake of silage made from both cultivars and growth
performance of growing bull calves after feeding silage. Result shows that both group of calves
consumed similar amount of silage, but DM and CP intakes of calves consumed Pakchong silage were
significantly higher than DM and CP intakes of calves consumed Napier-3 silage. There were no
significant variations of total and daily average live weight gains of calves between groups.
Table 4 illustrates the nutrient digestibility of silage made in both cultivars after feeding to growing
bull calves. Nutrient digestibility of Pakchong silage was significantly better than the nutrient
digestibility of Napier-3 silage.
This study reveals that Pakchong is comparatively better than Napier-3 in respect to total fresh
biomass yield, nutrient composition of fresh and silage and nutrient utilization for growing bull
calves. However, Napier hybrid is good for early harvest with more leaf yields compare to Pakchong.
Proceedings of the Annual Research Review Workshop 2018, BLRI, Savar, Dhaka 1341, October 09-10, 2018
99 Poster Session
Health risk assessment of heavy metals in animal origin food chain through feed and
fodders pathway
Islam MA1, Alam MK
2*, NR Sarker
3 and AM Shohael
4
1M.Sc. Student, Dept. of Biotechnology and Genetic Engineering, Jahangirnagar University,
2Ph.D
Research Fellow, Fodder Research and Development Project; 3Project Director, Fodder Research and
Development Project, Bangladesh Livestock Research Institute, Savar, Dhaka; and 4 Department of
Biotechnology & Genetic Engineering, Jahangirnagar University, Savar, Dhaka 1442
Executive summary
Heavy metals are those metals with relatively high densities or atomic weights. Some heavy metals
are essential as nutrients which are harmless for the survival but some of them are highly poisonous.
Physical and chemical properties of heavy metals should be handled very carefully. Poisonous heavy
metals have a great negative influence on almost every living organisms. The persistence nature and
bioaccumulation of those metals in the food chain remains the major threat for those organisms.
Bioaccumulation of heavy metals is the main threat or concern for the migration of heavy metals in
the food chain. We, humans are the consumers or being depended on the food from animal source or
plant source. Those two major sources can be poisonous through heavy metals, mainly by Arsenic. It
will directly affect the human health. Already many peoples from the selected regions of Bangladesh
are suffering from different diseases formed by the heavy metals. This study will focus on the
migration of heavy metals through the food chain in those selected regions. The risk assessment
program can also be initiated through this study. This study will also follow up the risks of heavy
metals in animal origin food chain through feed and fodders pathway. Identification of the presence of
heavy metals in feeds & fodders of selected locations to investigate the potential heavy metal
tolerance fodders in the country and to identify the heavy metals in milk, meat and cattle blood of
selected locations are the key objectives in this study. Standardization of guidelines of arsenic and
other poisonous heavy metals free safe food of animal origin in the context of animal and public
health concern is also another objective of this research. For the extraction and identification of heavy
metals, samples are needed to be digested. There are several ways to extract the heavy metals from the
desired samples. But most of the cases, acid digestion is mostly used for its wide acceptance. In this
study, we used the acid digestion process to extract the heavy metal. Different types of acid digestion
process are available for the heavy metal extraction. Aqua regia (mixture of nitric acid and
hydrochloric acid), Perchloric acid (HClO4), Nitric acid (HNO3), Hydrochloric acid (HCI) etc. or their
combinations are being used mainly. It depends on the samples from where heavy metals are needed
to be extracted.For this study samples were collected from six regions of heavy metal affected area of
Bangladesh. Those sites are Faridpur, Kuakata, Bangladesh Livestock Research Institute (BLRI),
Narayanganj, Jossore and Chadpur. We have collected soil, water, fodder, rice straw, cow milk, cow
dung and blood samples from these six regions. Cow dung, milk and blood samples were collected
from a wide ranges of cattle species. Different protocols of digestion are being followed for those
sample types to standardize the final protocols to get an accurate and excellent result of the
concentrations of the heavy metals.
Arsenic (Ar), Lead (Pb), Cadmium (Cd), Chromium (Cr) and Mercury (Hg) are the heavy metals, we
are working on. We are going to determine their existence in concentrations from the collected
samples. Those five heavy metals are so much poisonous for human health. It is very much important
to determine their existing levels and evaluate their adverse effect on human health. AAS or atomic
absorption spectrometry is a procedure for the quantitative determination of chemical elements by
measuring the absorption of free atoms in the gaseous state. It is a widely acceptable method for the
determination of the concentration of heavy metals. In this study, AAS is going to be used for the
heavy metal determination. Till now we got the concentration of Lead (Pb) and Cadmium (Cd) from
the samples from Bangladesh Livestock Research Institute (BLRI), Faridpur and Chadpur. The
determination of other heavy metals and samples from those and others sites are going on very fast.
The following first two figures shows the cadmium (Cd) and Lead (Pb) determination in two different

Proceedings of the Annual Research Review Workshop 2018, BLRI, Savar, Dhaka 1341, October 09-10, 2018
100 Poster Session
sites in Faridpur district respectively. The last two figures shows the comparison between the
concentration of Cd and Pb in same samples of BLRI and Chadpur, respectively. Work is going on
with other resulted data from other sites and locations.
Till now the resulted outcome provides the information that, food chains through the fodder pathway
are being highly contaminated with heavy metals. Longer persistence of those metals in nature
extremely affect different organisms and exacerbates different health problems in human being. Risk
assessment program can also be initiated through the above study. Proper treatment and further
precautions can also be developed to overcome heavy metals problem in Bangladesh.

Proceedings of the Annual Research Review Workshop 2018, BLRI, Savar, Dhaka 1341, October 09-10, 2018
101 Poster Session
Study on availability of feed resources and comparison of nutrients composition of feed
ingredients used by farmers and on station
MAI Talukder1, MM Billah
2*, M Shahjahan
2, SM Rahman
2, MY Ali
2, S Munira
2, M Salahuddin
2,
MAH Miah2, MR Habib
1and ZH Khandaker
3
1Goat and Sheep Production Research Division,
2Baghabari Regional Station, Bangladesh Livestock
Research Institute, Sirajganj 6770; 3Department of Animal Nutrition, BAU, Mymensingh 2202;
*Corresponding author: [email protected]
Executive summary
Based on the dairy cattle population, Bangladesh has secured 15th position among the top dairy cattle
populated countries in the world (FAO, 2012). The current milk production in Bangladesh is about 7.2
million whereas the demand is 14.7 million MT considering 250 ml per head/day (DLS, 2016). In
Banladesh the district of Pabna and Sirajganj are the most promising and recognized area where
farmers keep dairy cows mainly for milk production (Sikder et al., 2009). Hence, feed availability
varies over the year in this area that may affect the cattle nutrition, production and reproduction.
Therefore, it is necessary to assess the availability of feed resources and their nutrient composition.
Thus, a baseline survey were conducted for identify the available feed resource of dairy cattle in rural
villages of Pabna district. Data on available feed resource of dairy cattle were collected from total 50
households from three selected villages (Umarpur, Khorbagan and Hatail Aralia) under BeraUpazila
of Pabna district with a pretested survey questionnaire. The collected feed sample were chemically
analysed for knowing the nutritive value at Animal Nutrition laboratory of BLRI Regional Station
Baghabari. The collected data were complied, tabulated and analyzed (descriptive statistics) by SPSS
version 16 (SPSS Inc. Chicago, USA).
Available feedstuffs used in surveyed area are shown in Figure 1. It was observed that highest number
of farmers (82%) used rice straw for cattle feeding as roughage source while 76% farmers used
jamboo and 44% farmers used Napier grass. Beside these it was observed that 54% farmers used
maize crush, 46% used wheat bran, 24% used til oil cake and 44% farmers used mixed feed for cattle
feeding. Proximate composition of available feedstuff from surveyed area is presented in Table
1.where for concentrate it shows that highest DM% is observed in wheat bran (89.69±0.57%), highest
Ash% is observed in til oil cake (17.23±0.27%), highest CF% is observed in til oil cake
(29.33±0.29%), highest CP% is observed in khesari (19.56±0.25%) and more EE% and EEE% is
observed in til oil cake (12.64±0.03%) and maize (65.06±0.02%), respectively. For roughage they
used rice straw which served more DM% (98.57±0.13%) but less CP% (straw, 6.60±0.11%) than
napier (13.81±0.01% CP) and jamboo (12.50±0.17% CP).Proximate composition of available
feedstuff that used in BLRI Regional Station is presented in Table 2. It shows that highest DM% is
observed in til oil cake (92.15±0.60%), highest CF% is observed in khesari (24.78±1.01%) and
highest CP% is observed in soybean meal (43.84±0.19%). Comparative nutrient value of feedstuff
between on-station and community is depicted in Table 3.
Table 1. Proximate composition of available feedstuff from surveyed area (%DM basis)
Feed Stuff Nutrient Parameters/Variables (Mean±SE)
DM% Ash% CF% CP% EE% NFE%
Khesari 86.28±0.42 5.05±0.08 26.17±0.48 19.56±0.25 1.30±0.01 34.19±0.41
Maize 89.10±0.52 2.86±0.02 3.98±0.13 13.72±0.16 3.48±0.01 65.06±0.20
Straw 98.57±0.13 10.78±0.02 33.57±0.21 6.60±0.11 1.68±0.01 45.92±0.21
Wheat bran 89.69±0.57 6.00±0.23 11.18±0.10 15.86±0.19 2.43±0.02 52.22±0.41
Tiloil cake 86.62±0.50 17.23±0.27 29.33±0.27 11.45±0.03 12.64±0.03 15.97±0.04
Mixed 85.95±0.19 8.90±0.11 13.53±0.04 14.22±0.06 1.30±0.02 48.00±0.08
Napier 36.20±0.11 6.00±0.05 12.00±0.11 13.81±0.01 1.90±0.01 2.49±0.06
Jamboo 35.00±0.28 5.60±0.06 10.80±0.05 12.50±0.17 1.86±0.01 4.24±0.12
Results showed that Proximate component of maize (except DM) as CP% (8.44±0.32 vs13.72±0.16),
CF% (2.72±0.03 vs3.98±0.13), Ash% (1.78±0.02 vs 2.86±0.02) from on-station and community have
a highly significant (p<0.001) relation. Proximate component of til oil cake (except DM) as CP%

Proceedings of the Annual Research Review Workshop 2018, BLRI, Savar, Dhaka 1341, October 09-10, 2018
102 Poster Session
46%
54%
82%
46%
24%
44%
44%
76%
0% 20% 40% 60% 80% 100%
KHESARI HULL
MAIZE CRUSH
STRAW
WHEAT BRAN
TIL 0IL CAKE
MIXED FEED
NAPIER
JUMBOO
No. of Farmer
(17.54±0.09 vs 11.45±0.03), CF% (13.92±0.16 vs29.33±0.27), Ash% (21.58±0.24 vs 17.23±0.27)
from on-station and community have also highly significant (p<0.001) relation. There is no significant
difference (p>0.05) of DM%, Ash%, CF% between on-station and community khesari feed but have a
highly significant (p<0.001) difference between CP% (15.13±0.50 vs 19.56±0.25) of khesari. There is
no significant difference (p>0.05) of DM%, CP% between on-station and community wheat bran but
have a significant (p<0.002) difference between CF% (6.30±0.69vs 11.18±0.10) on-station and
community wheat bran.
Figure1.Available feedstuffs used in dairy project community
Table 2. Proximate composition of available feedstuff that used in BLRI Regional Station (%DM
basis)
Feed Stuff
Nutrient Parameters/Variables (Mean±SE)
DM% Ash% CF% CP% EE% NFE%
Maize 87.01±0.57 1.78±0.02 2.72±0.03 8.44±0.32 2.82±0.05 71.25±0.19
Khesari 86.75±0.70 5.05±0.60 24.78±1.01 15.13±0.50 2.58±0.24 39.17±1.63
Wheat Bran 87.44±0.66 3.08±0.27 6.30±0.69 15.36±0.49 1.36±0.09 61.34±0.88
TilOil Cake 92.15±0.60 21.58±0.24 13.92±0.16 17.54±0.09 6.97±0.02 32.14±0.09
Soybean meal 89.85±0.09 6.18±0.10 6.41±0.05 43.84±0.19 3.12±0.04 30.30±0.30
Table 3.Comparative nutrient value of feedstuff between on-station and community (%DM basis)
Feed and
Location
Nutrient Parameters/Variables (Mean±SE)
DM% Ash% CF% CP% EE% NFE%
Maize
On station 87.01±0.57 1.78±0.02 2.72±0.03 8.44±0.32 2.82±0.05 71.25±0.19
Community 89.10±0.52 2.86±0.02 3.98±0.13 13.72±0.16 3.48±0.01 65.06±0.20
P value 0.054 0.00 0.001 0.00 0.00 0.00
TilOil Cake
On station 92.15±0.60 21.58±0.24 13.92±0.16 17.54±0.09 6.97±0.02 32.14±0.09
Community 86.62±0.50 17.23±0.27 29.33±0.27 11.45±0.03 12.64±0.03 15.97±0.04
P value 0.002 0.00 0.00 0.00 0.00 0.00
Khesari
On station 86.75±0.70 5.05±0.60 24.78±1.01 15.13±0.50 2.58±0.24 39.17±1.63
Community 86.28±0.42 5.05±0.08 26.17±0.48 19.56±0.25 1.30±0.01 34.19±0.41
P value 0.619 0.988 0.282 0.001 0.006 0.042
Wheat Bran
On station 87.44±0.66 3.08±0.27 6.30±0.69 15.36±0.49 1.36±0.09 61.34±0.88
Community 89.69±0.57 6.00±0.23 11.18±0.10 15.86±0.19 2.43±0.02 52.22±0.41
P value 0.791 0.001 0.002 0.402 0.00 0.001
From the study it may say that the farmers of surveyed area are used both cultivated and ready feed
for cattle feeding.

Proceedings of the Annual Research Review Workshop 2018, BLRI, Savar, Dhaka 1341, October 09-10, 2018
103 Poster Session
Identification of poultry processing problems and development of a model processing
plant for safe poultry meat production
MSK Sarker*1
, S Sultana1, NR Sarker
1
Poultry Production Research Division, Bangladesh Livestock Research Institute, Savar, Dhaka 1341
Executive summary
Poultry is a fast growing industry that supporting the livelihood of about 1.50 crore people directly
and indirectly with about 40% female engagement. The poultry meat consumption is currently 5
kg/person/year which is targeted to increase more than 8kg/person/year by next two years. Poultry
meat is preferable than other types of meat due to its various attributes namely high in protein, prevent
bone loss, polyunsaturated fatty acids content, good for heart, rich in phosphorus, improve eyesight
and vitamin B3 and B6 content. There is an estimated 150,000 poultry farms in Bangladesh
(Wikipedia, 2017), The poultry sector will require up to Tk 30,000 crore in fresh investments to meet
the increased demand for chicken meat and eggs by 2021 (The Daily Star, March 3, 2017). A growing
number of small producers are raising poultry outdoors on pasture, processing the birds on-farm, and
selling the meat directly to customers at the farm or at a farmers‟ market. Poultry and poultry products
become as a cheap source of animal protein in terms of meat and eggs. Poultry meat alone contributes
37% of the total meat production in the country and 22 to 27% of total animal protein (Hamid et al,
2017). Khatun et al (2016) stated that the demand for food in Bangladesh and around the world is
changing rapidly. This changing pattern is driven by economic growth, rising incomes, urbanization
and demand is shifting away from traditional staples toward high-value food commodities.
Considering the situation this research was started with two objectives i) identifying the existing
poultry processing problems and prospects ii) analyzing the nutrient contents and meat oxidation of
fresh and preserved poultry meat for safe consumption. A survey was conducted among the mini
poultry processors earlier in nearby areas of Savar and Nabinagar. According to their statement all
birds are slaughtered in Halal method. About half of the processing wastes were used in the pond as
fish feed. The most notifiable problem of the processors has no technical training. About 60 %
processors managed their fund of their own and remaining had got loans. Their monthly income
ranges from 20000 to 40000 taka from this mini poultry processing operation, their education level
were primary to SSC level. It was pointed out that science based knowledge and technological support
can enhance their business enterprises and also providing the safe poultry meat to the consumers.
Experimentally about 8500 poultry birds (chicken, ducks, quail, guinea fowl and turkey) were
dressed, packaged, stored and supplied from our mini poultry processing plant to the consumers in last
fiscal year 2017-18. Currently at our mini poultry processing plant some equipment‟s were locally
made (below figure) as killing cone stand, evisceration table, working table, trey, digital weighing
balance, stainless steel trolley, aluminum saucepan, burner, plastic container, packing machine,
dissecting box etc. We have installed an ice cube making machine to produce ice cubes to keep the
processed poultry birds in good condition. We processed the broiler chicken at our mini poultry
processing plant. Then with this meat TBA value of broiler breast and thigh meat of fresh and frozen
sample were analyzed for determining MDA (melon di aldehyde). The value was calculated 8.81
(micro mole / 100 g meat) for control which was reduced to 7.63 after addition of additive.

Proceedings of the Annual Research Review Workshop 2018, BLRI, Savar, Dhaka 1341, October 09-10, 2018
104 Poster Session
Figure 1. Equipment‟s with related pictures of our developed poultry processing plants
Slaughtering process: At the end of the broiler trial 10 chickens per treatment were randomly selected
and were weighed properly. The chickens were bled by section of the jugular vein and then scalded in
hot water (70-80 ° C) and plucked manually. Then, birds were eviscerated and heart, kidney, crop and
intestines were taken off. The samples of breast and thigh-drumstick were collected to determine the
chemical composition of meat. The nutritional quality of breast and thigh meat of guinea fowl was
analyzed: The frozen samples of the breast and the thigh were dissected into small pieces and
homogenized in a blender at - 10°C. Moisture, protein, fat, and ash contents of breast and thigh meat
samples were determined following the standard procedures (AOAC, 2000).
For hygienic and safe poultry meat production proper processing procedure are following with the
principles of HACCP. Hence, after completion of all the planned activities a model processing plant
will be developed which finally distributed to different communities for safe poultry meat production
to the consumers. This research and development activity should have to be continued to produce
need based technology generation for the mini poultry processors and to enhance their knowledge by
training on the generated technologies.
21.00
22.00
23.00
24.00
25.00
Thigh Breast
22.33
24.57
CP% of Guinea fowl meat
Proceedings of the Annual Research Review Workshop 2018, BLRI, Savar, Dhaka 1341, October 09-10, 2018
105 Poster Session
A baseline study about farmers training on BLRI developed technologies
MZ Rahman1*
, MA Hasan1, ASM Ashabuddin
1, MS Islam
2 and N Sultana
1
1 Training, Planning and Technology Testing Division,
2 Socioeconomic Research Division,
Bangladesh Livestock Research Institute, Savar, Dhaka 1341
Executive summary
Bangladesh is basically an agricultural country and nearly three-fourth population depends on
agriculture, livestock and allied sectors for livelihood. The share of agriculture sector in national GDP
is 18.70 and the share of livestock sub-sector is 2.45 (BER, 2013). As a national research institute for
livestock development BLRI is committed to develop native breeds of cattle, chicken and duck,
techniques for their feeding and nutrition, disease prevention and health management and models for
milk, meat and egg production system through strategic research. Since inception BLRI has developed
83 packages/technologies on livestock and poultry production. These technologies have presumably
made a significant response to increase milk, meat and egg production and generation of income and
creation of employment at farm level. BLRI developed technologies are important for livestock
rearing in our country. During the last 3 years BLRI has conducted training on cattle, goat and
poultry rearing and management. But after training we have no information about how good or useful
it is in the field condition. Considering the situation a study was under taken to know the socio-
economic status of trainee on adoption of technologies in the field. A total of 300 farmers who took
part in training on livestock rearing & management were selected for this study. Survey method was
followed to collect data. Mostly descriptive analysis was used to achieve the objectives.
The education level of the farmers were 45% primary level, 25% SSC, 18% HSC and 12%
graduates/masters level. The family members of male were below 18 years 1.8 and over 18 years 2.6
number per family. The females below 18 years accounted for 1.72 and over 18 years 2.11 number
per family. The land availability such as housing area were 0.86 acre, cultivated area 2.780 acre,
uncultivated area 0.46 acre and fodder land area 0.21acre per family. The Agriculture was the highest
(55%) occupation followed by business (35%), services (3%) and others (7%).The possessions of
cattle was 5.43 no./family. In case of small ruminants, average no. of goat and sheep were 5.88 and
1.10 no./family, respectively. Most of dairy cows were indigenous/ local. Some farmers reared
crossbred cattle. The average milk production (l/d), birth wt. (kg), calf mortality (%) and lactation
period (d) of cattle were, 4.53, 23, 22.31 and 173, respectively. The average litter size (no. per year),
kid birth wt (kg) and kid mortality (%) were 1.86, 0.81 and 33%, respectively. Fodder land (acre) use
and fodder production (ton/year) were 0.034 and 1.66, respectively (Table 1).
Table 1. Information on livestock productivity, mortality and fodder production
Parameters Mean±SE
No. of dairy cows 3.25±0.23
No. of bulls 2.18±0.33
Milk production (l/d) (Dairy cow) 4.53±0.77
Birth wt.(Kg) (cattle) 23.00±2.41
Calf mortality (%) 22.31±1.99
Lactation period (d) (Dairy) 173±21.21
Litter size (no/year) (Goat) 1.86±0.98
Kid birth wt. (kg) 0.81±0.04
Kid mortality (%) 33%±5.22
Fodder land (acre) 0.034 ±0.19
Fodder prodn(ton/year) 1.66±0.21
Table 2 shows incomes (Tk per year per farm) from milk, cattle sale, cowdung, compost and goat sale
(live) were 71523.40, 90812.33, 10220.40, 20150.66 and 60000.00, respectively. The total annual
income was Tk. 252706.79.

Proceedings of the Annual Research Review Workshop 2018, BLRI, Savar, Dhaka 1341, October 09-10, 2018
106 Poster Session
Table 2. Annual income from livestock products or by-products of farm families (Tk./year/farm)
Source of income Mean±SE
Milk 71523.40±35.44
Cattle sale 90812.33±22.46
Cowdung 10220.40±21.88
Compost 20150.66 (3) ±10.11
Goat sale (live) 60000.00±4144
Total 252706.79±42.52
Table 3. Total livestock (cattle & goat) rearing cost (Tk./year)
Particulars Mean±SE
Rearing cost (Feed, medicine, labor) 199840.00±51.42
Table 4. Annual household expenditure (Tk./year)
Particulars Mean±SE
Food 100000.00±22.57
Clothing 12310.58±24.99
Health care 6750.24±17.77
Education 18000.00±19.22
Cosmatics 5000.00±14.21
Total 142060.82±28.56
On average, the total annual household expenditure was Tk. 142060.82
Table 5. Consumption of different food items (g/d/capita)
Food item Mean±SE
Rice 400.10±8.21
Ata 90.21±9.23
Pulse 35.11±4.11
Fish 5.77±8.76
Meat 33.11±2.99
Milk 180.11±23.42
Egg 5.21±0.99
Vegetables 280.00±18.96
Total 1029.52±27.78
Farmers overall consumption of all food items was 1029.52g per day per capita. The finding of the
study represents small scale livestock production. Calf mortality rate was higher and less fodder
production than needed. On the other hand marginal profit was observed from livestock rearing in the
surveyed areas.

Proceedings of the Annual Research Review Workshop 2018, BLRI, Savar, Dhaka 1341, October 09-10, 2018
107 Poster Session
Development of blended yarns and fabrics from jute, cotton and native sheep wool
MKH Majumder1, M Ershaduzzaman
1, AK Azad
2, M Asaduzzaman
2, MMU Jubayer
2, MT Hossain
2, S
Alam2 and M Yesmin
1
1Conservation and Improvement of Native Sheep through community and commercial farming
project, Bangladesh Livestock Research Institute, Savar, Dhaka 1341; 2Bangladesh Jute Research
Institute, Manik mia Avenue, Dhaka-1207
Executive summary
Native sheep are considered as an important and promising animal resource in Bangladesh.
Bangladesh possesses 3.313 million sheep and the present annual rate of growth is ever increasing
(Bangladesh Economic Review, 2016). Average 700 to 800gms of raw wool can be collected from
each sheep per year. Then 3.0 thousands metric tons of raw wool will be obtained. Cotton, jute, wool
and silk are some of the major fibers which are widely used throughout the world for producing yarn
and fabrics. Wool fiber is the natural hair grown on sheep and is composed of protein substance called
as keratin. Wool is composed of carbon, hydrogen, nitrogen and this is the only animal fiber, which
contains sulfur in addition. The characteristics of wool fiber are composed of amino acids, excellent
absorbency, high moisture regain, tend to be warmer than others, poor resistance to alkalis but good
resistance to acids and good elasticity and resiliency. Enormous quantity of local sheep wool is
wasted due to lack of processing. This fiber can play a significant role if proper processing technology
and products of today‟s necessity can be developed out of this fiber. Due to natural source, wool, jute
and cotton blended yarn has tremendous potentiality for making good quality warm cloth, floor mate,
blazer cloth etc. So, the development of local sheep wool blended yarn decorative fabrics and value
added products may enable to unlock the enormous potential of this fiber and provide very good
scope for sheep farmer to generate income. A research was conducted for commercial use of wool in
Bangladesh through yarn and fabrics production with the joint collaboration of Bangladesh Livestock
Research Institute and Bangladesh Jute Research Institute. The aims of the research work are to
produce blended yarn and fabrics from jute, cotton and native sheep wool and to determine the
physical properties of jute, cotton and native sheep wool. Sheep wool was collected from sheep
research farms of BLRI and also from the different sub-station of sheep project and Bengal meat
processing industries ltd, Pabna and sent to the Bangladesh Jute Research Institute. Jute was collected
from local market. Cotton was collected from the cotton board. The required chemical was collected
from local market. Raw sheep wool was washed with detergent and carbonized with 8% H2S04 at
normal temperature (30°C). It is known that jute is long fiber but cotton is short staple length fiber so
jute was cut at different length (1, 1.5 and 2 inch) blended the staple length at cotton. According to a
standard procedure blending of wool, jute and cotton fiber was mixed at different proportion. By
using cotton processing system blended yarn was produced. After producing blended yarn (jute,
cotton and sheep wool), this yarn was used in weaving machine (loom) to produce blended fabrics.
For processing of wool, jute and cotton fiber, we should know about some physical properties of these
fibers.
Table 1. Physical properties of jute, cotton fiber and sheep wool
Property Jute fiber Cotton fiber Sheep wool
Fiber fineness 5.05µg /inch 3.35µg /inch 8.03µg /inch
Moisture regain 13-14% 7-8% 9-10%
Tenacity g/tex 35 25 32
Note: Tenacity is the customary measure of strength of a yarn
Fibers are generally classified as very fine if they have a µg /inch value up to 3.1; Fine if they have
value between 3.1 to 3.9; Medium if they have value between 4.0 to 4.9; Slightly coarse between
values of 5 to 5.9 and Coarse if they have a µg /inch value above 6. So, Sheep wool is coarse fibers,
jute is slightly coarse fibers and cotton is fine fibers. For the production of smooth blended yarn,
sheep wool is mixed with jute and cotton fibers. In the present study, it was observed that 30% wool,
30% jute and 40% cotton fiber blended 12s (yarn count system) count yarn has been successfully
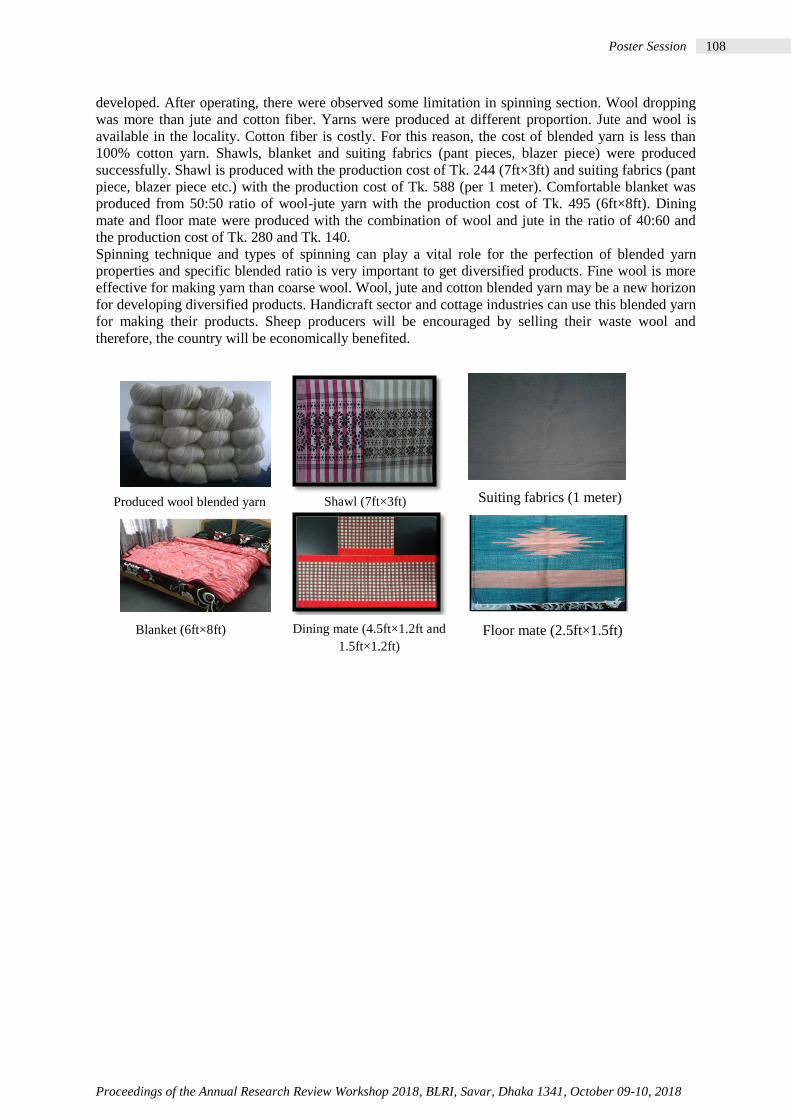
Proceedings of the Annual Research Review Workshop 2018, BLRI, Savar, Dhaka 1341, October 09-10, 2018
108 Poster Session
developed. After operating, there were observed some limitation in spinning section. Wool dropping
was more than jute and cotton fiber. Yarns were produced at different proportion. Jute and wool is
available in the locality. Cotton fiber is costly. For this reason, the cost of blended yarn is less than
100% cotton yarn. Shawls, blanket and suiting fabrics (pant pieces, blazer piece) were produced
successfully. Shawl is produced with the production cost of Tk. 244 (7ft×3ft) and suiting fabrics (pant
piece, blazer piece etc.) with the production cost of Tk. 588 (per 1 meter). Comfortable blanket was
produced from 50:50 ratio of wool-jute yarn with the production cost of Tk. 495 (6ft×8ft). Dining
mate and floor mate were produced with the combination of wool and jute in the ratio of 40:60 and
the production cost of Tk. 280 and Tk. 140.
Spinning technique and types of spinning can play a vital role for the perfection of blended yarn
properties and specific blended ratio is very important to get diversified products. Fine wool is more
effective for making yarn than coarse wool. Wool, jute and cotton blended yarn may be a new horizon
for developing diversified products. Handicraft sector and cottage industries can use this blended yarn
for making their products. Sheep producers will be encouraged by selling their waste wool and
therefore, the country will be economically benefited.
Produced wool blended yarn Shawl (7ft×3ft)
Blanket (6ft×8ft)
Suiting fabrics (1 meter)
Dining mate (4.5ft×1.2ft and
1.5ft×1.2ft) Floor mate (2.5ft×1.5ft)

Proceedings of the Annual Research Review Workshop 2018, BLRI, Savar, Dhaka 1341, October 09-10, 2018
109 Poster Session
Conservation and improvement of farm animal genetic resources at Hilly region at
Naikhongchari
MA Alam, M Ershaduzzman, A Hossen, R Khatun, MAI Talukder and NR Sarker
Bangladesh Livestock Research Institute, Savar, Dhaka 1341
Executive summary
The majorities of the tribal people live in the Hilly forests with primitive ways of life. These regions
possess slightly different type of genetic resources of livestock and poultry rather than the common
indigenous. In this part, attempt has been taken to improve the production potentialities of the native
genetic resources of livestock at Hilly regions. The Hilly Brown Bengal goats (HBBG), Hilly (HC)
and Naked Neck Hilly chickens (NNHC) are available at Hill tracts region of Bangladesh. However,
the production characteristics of both type of HC are not well documented. Systematic information
on genetic and phenotypic parameters of Hilly goats, HC and NNHC is very limited. Therefore, the
main objectives of the project are to evaluate the productive and reproductive performances of goats
and chickens and their improvement and conservation at Naikhongchari.
For Hilly goats, the breeding program was conducted initially through Open Nucleus Breeding
System (ONBS) at Naikhongchari BLRI Regional Station Research farm and was designed in such a
way, which resists inbreeding. Animals were maintained in a semi-intensive rearing system. All
goats were allowed to graze for 6-7 hours per day and concentrate was offered twice daily during
morning and evening at the rate of 1% of body weight and supplied clean drinking water. Goats
were de-wormed on regular intervals and only PPR vaccine was given at the age of 2 month. Data
on productive, reproductive and disease incidence were recorded regularly. Reproductive parameters
studied were: litter size (LS), kid birth weight (KBW) Gestation length (GL), Age at first conception
(AFC), Age at first kidding (AFK) and Kidding interval (KI). On the other hands, a total of 121
adult HC and 21 NNHC were reared in open sided poultry house under intensive management
system for collecting hatching eggs. Both broody mother hen and incubator were used for hatching
chicks. The chicks were reared on floor, littered with rice husk. Standard starter, grower and layer
feed was fed during rearing period. The birds were allowed to take adlibitum feed and clean
drinking water. Birds were de-wormed on regular intervals. A standard vaccination schedule was
followed during rearing period.
The statistical analysis of the Hilly goat‟s data was performed using compare mean with one way
ANOVA and univariate analysis of variance procedure of SPSS package. Subsequently, the
productive and reproductive performance of birds were recorded and analyzed by R statistical
computer programme. The Results showed from (Table-1) that kid birth weight were significantly
(P<0.01) differ among generation whereas birth weight of generation_3(1.21±0.013kg) highest than
generation_5 (1.20±0.031kg), 4 (1.18±0.012 kg), 2 (1.16±0.016 kg) and generation_1 (1.11±0.01
kg). Result also showed that 3 month, 6 month and 9 month age of body weight were non-significant
among generation.
Table 1. Effect of Generation on body weight of Hilly Brown Bengal goat
Generation Parameters (kg)
Birth wt.
(Mean±SE)
3-m wt.
(Mean±SE)
6-m wt.
(Mean±SE)
9-m wt.
(Mean±SE)
G-1 1.11b± 0.01 (75) 4.69±0.15 7.12±0.28 8.65±0.38
G-2 1.16ab±0.016 (61) 4.47±0.16 7.07±0.29 8.52±0.23
G-3 1.21a±0.013 (51) 4.71±0.15 7.43±0.22 9.68±0.32
G-4 1.18a±0.012 (67) 4.90±0.21 7.21±0.32 8.96±0.30
G-5 1.20a±0.031 (13) 5.03±0.24 7.86±0.50 9.15±0.85
Sig. level ** NS NS NS
Sig=Significance; m=month; Fig in the parenthesis indicates the number of observation. Means with different
superscripts within the same column differ significantly. *=Significant at 5% (p<0.05) level of probability,
**=Significant at 1% (p<0.01) level of probability, NS=Non significant (p>0.05).

Proceedings of the Annual Research Review Workshop 2018, BLRI, Savar, Dhaka 1341, October 09-10, 2018
110 Poster Session
The age at first conception (AFC) were significantly (p<0.05) differ among generation (Table-2).
The weight at first conception (WFC) were also significantly (p<0.01) differ among generation
(table-2).The kidding interval and Gestation length was not significant (P>.05) effect on generation.
Results showed that according to parity there was not significant (P>.05) effect on kid birth weight
but significantly (p<0.01) differ of Kid litter weight and litter size (Table-3).
Table 2. Reproductive performance of Hilly Brown Bengal goat according to generation
Parameters
Generation
AFC (d)
(Mean±SE)
WFC (kg)
(Mean±SE)
AFK (d)
(Mean±SE)
GL (d)
(Mean±SE)
KI (d)
(Mean±SE)
G-1 359.80a±18.87 (32) 13.23±0.47 506.60±19.02 146.80±0.78 225.90±10.27
G-2 336.27ab±11.36 (23) 12.09±0.48 481.45±11.44 145.18±0.69 217.72±7.76
G-3 328.65ab±9.07 (17) 11.89±0.47 475.33±9.22 146.66±0.68 216.11±8.30
G-4 301.57b±9.06 (13) 10.65±0.52 448.85±9.45 147.28±0.74 211.42±10.39
Sig. level * ** NS NS NS
AFC=Age at first conception, WFC=weight at first conception, AFK=age at first kidding, GL=Gestation length,
KI=kidding interval, Sig=Significance; Means with different superscripts within the same column differ
significantly. *=Significant at 5% (p<0.05) level of probability, ** =Significant at 1% (p<0.01) level of
probability, NS=Non significant (p>0.05).
Table 3. Reproductive performance of Hilly Brown Bengal goat according to parity
Parity
Parameters
KBW (kg)
(Mean±SE)
KLW (kg)
(Mean±SE)
LS (No.)
(Mean±SE)
P-1 1.17±0.031 (24) 1.40e±0.52 1.20±0.022
P-2 1.16±0.02 (31) 1.80d±0.63 1.60±0.11
P-3 1.13±0.02 (38) 2.16b±0.31 1.70±0.13
P-4 1.18±0.04 (29) 1.94c±0.34 1.90±0.04
P-5 1.09±0.06 (32) 2.26a±0.41 2.06±0.03
Sig. level NS ** **
KBW=kid birth weight, KLW=kid litter weight, LS=litter size, Sig=Significance; Means with different
superscripts within the same column differ significantly. **=Significant at 1% (p<0.01) level of probability,
NS=Non significant (p>0.05).
It was also showed that according to birth type single kid (1.21±0.08 kg) was highest birth weight
than double kid (1.15±0.13 kg) followed by triplet (1.10±0.17 kg) and quadruplet (1.08±0.13kg)
kids and it was found that kids mortality were 12.23±0.53% during one year period.
Result showed that there were no significant differences of body weight between HC and NNHC in
growing period up to 12 weeks of age. The body weights of HC were higher than previous year. The
feed intake and mortality of HC was lower than that of NNHC. It was found that there were no
significant difference of hatchability between HC (68.28±11.13%) and NNHC (60.97±13.2%)
hatched by both broody hens and the incubator. However, hatchability percentage of HC is slightly
higher than that of NNHC. The adult body weight of Hilly hen (2111.32±146g) and cock
(2869.20±141g) up to 30 weeks of age were higher than that of NNHC (1990.94±118g and
2531.20±107g) and were no significant difference. However, the egg production (H.D) of HC
(34.30±8%) was reduced than previous year where as egg productions of NNHC were 28.3±6. Egg
weight of HC and NNHC was 41.99±4g and 40.17±4g respectively. Age at first egg, feed
consumption and mortality of both HC and NNHC were 152 days, 159 days, 89.68 g, 95.2 g, 12.97
% and 18.42 %, respectively and there were no significant difference among the breeds.
It was also found that the HC and NNHC reared at Naikhongchari regional station was improved in
body weight but reduced egg production from previous year. The performance of both type of HC is
better than other indigenous chicken. It may be suggested that both Hilly (feathered) and Naked
Neck Hilly chicken and Hilly goat‟s need to be conserved and improved further through selective
breeding and better management system. This project will assist to conserves the potential Hilly
animals of Bangladesh
Proceedings of the Annual Research Review Workshop 2018, BLRI, Savar, Dhaka 1341, October 09-10, 2018
111 Poster Session
Table 1. Physical and chemical properties of fresh meat in different
species used for can meat preparation
Items Meat in different species SED p-
value
Sig.
Beef Chevon Chicken
Meat pH 5.45
b 5.96
a 6.00
a 0.004 56.77 ***
Drip loss (%) 10.37b 14.06
a 14.34
a 0.50 24.22 ***
Cook loss (%) 19.14b 21.75
a 19.69
b 0.20 19.04 **
Chemical composition (%)
Moisture 74.76 77.48 76.12 2.04 2.50 NS
DM 25.24 22.52 23.88 2.04 2.50 NS
Protein 19.80a 17.36
b 19.70
a 0.33 13.14 **
Fat 2.07 1.92 1.71 0.18 0.40 NS
Study on the development of canned meat production techniques
BK Roy, JS Khanam, N Huda, NR Sarker1 and N Sultana
Animal Production Research Division, 1Director General, Bangladesh Livestock Research Institute,
Savar, Dhaka 1341
Executive summary
Meat is a popular food item of Bangladeshi people irrespective of clusters. Diversification of this
product with high value addition may contribute to more agricultural growth and employment
opportunities along with the diversification in consumption, required for healthier and more balanced
diets. Propelled by increased income, urbanization and increasing amount of people cumulatively
enforces the demand of diversified feature and quality attribute of this product as it is one source of
quality animal protein. It will also ensure the world recognized reliable food safety issue of developed
countries. Considering this circumstance an experimental work was undertaken to develop and
diversify of value addition technology through canning for processing of red and white meat. Canning
is a globally accepted popular
food preservation technique which
involves processing and sealing of
food products in air-tight container
which improves the shelf life
duration and preservation quality
of that product along with saving
cooking time of consumers. Now,
irrespective of gender people are
working at same level outside of
home and they have no time to
give for cooking like our
traditional system. Many people
are dependent on processed food. From this aspect canned meat could be a popular value added
product in Bangladeshi market both for industrial people and consumers. The research work was
corroborated in meat processing laboratory of BLRI. Fresh meat of beef, chevon and chicken were
purchased from local market and pH of both beef and chevon was recorded at about 6 h postmortem
(fresh meat). However, the chicken meat pH was recorded immediate after slaughtering. The pH of
both fresh & canned meat were recorded with a digital pH meter following the method of University
of Nebraska-Lincoln (2005). For this, 90 ml. distilled water was added with 10 g of blended meat
sample to measure the pH of meat. Drip and cook loss was calculated by following the procedure of
Joo et al. (1995) and Yang et al. (2006) respectively. Samples of both fresh and canned meat were
collected for proximate component analysis, microbial count and final recovery rate calculation.
However, the proximate composition of both fresh and canned meat were determined by the method
described by Association of Official Analytical Chemist (AOAC; 2005).Before starting the canning
procedure meat of all the can and glass jar was sterilized properly at 120-121ºc for 60 minutes. About
500g of fresh meat of each species (beef, chevon and chicken) was weighed and poured into different
glass jar without keeping any free space within the meat cut. Three treatments were applied for meat
of all species viz. control (no preservatives), meat treated with Na-nitrite and meat treated with
Sodium chloride. All the treatments were replicated for three times for each species meat. The level of
using Na-nitrite and salt was 150 mg and 5g respectively for per kg meat. After filling all the glass
jars the self-sealing jar lid were tightly sealed. However, in case of can, the lid were tightly sealed
with semi-auto sealer machine. The canner machine was prepared by applying moisturizer on both
side and filled with water up to 3 inch from bottom. Then it was placed on cooking burner until
boiling of water. When boiling was started then the vapor was removed, jars/cans were placed in
canner machine and proper pressure weight was settled. Canning was performed at 2400 F under10lb
pressures for 90 minutes. Thereafter, the can were cooled with water for 1 hr. Finally, the lids of all
the can or jar was again sealed with shrink paper using electric hot gun. Data on quality of fresh meat
were compared statistically in an ANOVA of a CRD and canned meat were compared statistically in a
3*3 factorial design using General Linier Model Procedures of SPSS, 17 computer software packages.

Proceedings of the Annual Research Review Workshop 2018, BLRI, Savar, Dhaka 1341, October 09-10, 2018
112 Poster Session
Table 2. Loss or recovery rate of beef during canning process
using preservatives or without preservatives
Beef meat % Losses
during canning
% water in
can/jar
% meat in
can/jar
Total fresh
meat (g)
Control 25.41 20.67 53.91 500
Sodium
nitrite
4.69 31.88 63.42 500
Sodium
chloride
13.33 25.78 60.88 500
Table 3. Effect of meat type and preservatives on Physical and chemical
composition of canned meat
Meat type, preservatives
& their interactions
pH %DM %CP %EE %
Ash
Meat
Beef 6.00 31.3b
25.2b
3.9a
3.1
Chevon 6.30 35.4a
28.7a
2.6c 3.1
Chicken 6.91 34.8a
28.4a
3.5b
2.7
Preservatives
Control 6.28 34.9 28.5 3.4 3.1
Sodium nitrite 6.47 34.0 26.4 3.3 2.9
Sodium
chloride
6.45 32.5 27.5 3.3 2.9
SED 0.0003 3.21 1.72 0.02 0.23
Sig.lev.
Meat *** * * *** NS
Preservatives *** NS NS NS NS
m×p *** NS NS NS NS
The physical and chemical properties of fresh meat used for canning purpose under this research, is
presented in Table-1. Results obtained from this study revealed that, both chicken meat and chevon
had significantly (p<0.001) higher meat pH than that of beef. The pH value of chicken meat, chevon
and beef were 6.00, 5.96 and 5.45,
respectively. Both chicken
(14.34%) and chevon (14.06%)
had significantly (p<0.001) higher
drip loss of meat juice than that of
beef (10.37%). In case of cook
loss, chevon losses higher juice
during cooking than meat of two
others species. The chemical
composition of fresh meat did not vary significantly (p>0.05) among the species except the protein
content of meat and the protein content was significantly (p<0.01) lower in chevon (17.4%) than that
of beef (19.8%) and chicken meat (19.7%). Table 2 represents the effect of preservatives on losses
and recovery of beef during canning process. During canning, the maximum loss (25.41%) was
observed in control i.e., no
preservative group and highest
final product recovery rate
(63.42% meat) was in beef
treated with Na-nitrite.
Amount of loss of this group
was only 4.69%. The recovery
rate in beef treated with NaCl
was comparatively lower
(60.88%) than Na-nitrite
treated group but much higher
than control (53.91%) group.
The pH and proximate
composition of canned meat
was also analyzed after 30
days of processing. The pH value of both red and white meat was increased after canning as compare
to pH of fresh meat. Irrespective of preservatives, chicken meat had significantly (p<0.001) higher pH
value than that of beef and chevon. Irrespective of meat type, meat treated with Sodium nitrite had
higher (p<0.001) pH value than that of control or meat treated with common salt. Type of meat had an
influential impact on the nutritional composition in canned meat. It was also observed that in canned
meat, the crude protein increased by 5.44, 11.02 and 8.67% when used in beef, chevon and chicken as
compared to their fresh product. In microbiological aspects, there was no botulism spore was found in
canned meat. It was estimated that the production cost of 0.5 Kg canned meat was Tk. 330, Tk.
430and Tk. 95, respectively for beef, chevon and chicken. Though, it is a preliminary work, further
more study is needed to dig out the reasons hinder it. In conclusion, it can be said that canning has an
impressive influence on meat processing system. So it could be a good option to be introduced for
meat value addition at industrial level of Bangladesh.

Proceedings of the Annual Research Review Workshop 2018, BLRI, Savar, Dhaka 1341, October 09-10, 2018
113 Poster Session
Community based sheep production in Hilly Area at Naikhongchari
MA.Hemayet, M Ershaduzzaman, MA Alam, MS Islam and SS Islam
Bangladesh Livestock Research Institute, Savar, Dhaka 1341
Executive summary
The study was planned to reduce poverty by making income generation activity of the community
people at Naikhongchari upazilla in Bandarban district of Bangladesh through establishment of BLRI
improved native sheep. After three years, impact study results indicated positive response to
technological and heath management interventions in regards to reduce mortality and increased
productivity. This year, a training program was conducted to improve community farmer‟s technical
knowledge on 2nd
week of march‟18 regarding all managemental issues on BLRI improved sheep
rearing along with demonstration of some BLRI developed technologies, such as UMS, UTS, UMB,
silage and hay etc. The sheep marketing channel, where the product reached from producer to
consumer have identified and the problems regarding sheep marketing and rearing have also identified
through a questionnaire. The percentages of women participation index have calculated to determine
the participation rate of women in each farming activity. Personal, social and economic constrains to
sheep rearing activities of women have also analyzed.
Farmer sell sheep for various reasons and on different occasions, like „Biju, Boishabi‟ for the tribal
people mostly in April, „Eid-Ul-Azha‟ for muslims in July-August, „Durgapuza‟ in September-
October, „Barodin‟ in December, and others reasons (to pay annual credit bill, household purchase,
farm input purchase, sending children to school and their educational cost etc.) in the year-round.
Figure 1 showed that, seasonality of demand for and supply of sheep expressed as proportions (%)
sold each month and the demand was almost always high than supply which proves that the sheep
meat has become very popular to the tribal peoples. Factors affecting sheep supply in order of
importance are holidays, household expenditures, agricultural inputs and religious occasions. In
holidays farmers expect high price for their sheep. Men and women do not receive the same price for
their animals. We came to understand that women negotiate harder than men when they sell or buy
animals. As a result, traders prefer to buy sheep from men over women. So, it is women who get the
higher price. Sheep marketing was conducted based on „eyeball‟ estimation. There were no
experiences of using scientific weight measuring scales to sell or buy sheep.
Figure 1. Seasonability of demand for and supply of sheep as proportions (%) sold each month
From the initial data we found that the marketable live sheep of community farmer reach to consumer
following different ways like, from the data of questionnaire it was estimated that 16% of sheep were
sold to big traders, 13% to small traders, 15% to hotels/butchers, 11% to individual consumers and
43% to other types of farmers (Fig.2).Among the sheep sold to different buyers, 43% was fattened
sheep that mostly sold to hotels/butchers, the rest are sold to the other farmers and individual
consumers. Yearlings (20% (9% male, 11% female) were more demanded from traders and farmers.
Farmers have preferred breeding ram and ewes (19%) for breeding purpose (replacement and
15
9
2
19
1.25 2
13
16.25
6.5
9
1.5
5.5
1
5.3
15.2 17.15
1.5 2.9
16.2
13.25
7.85
15.2
1.5 2.95
0
5
10
15
20
Jan Feb Mar Apr May Jun Jul Aug Sep Oct Nov Dec
demand(%)
supply(%)

Proceedings of the Annual Research Review Workshop 2018, BLRI, Savar, Dhaka 1341, October 09-10, 2018
114 Poster Session
foundation stock) and also to sell their old ewes. Few farmers and traders have showed interest to buy
castrated male (18%) for fattening purpose (Figure 3).
Figure 2. % of buyers purchased sheep Figure 3. Categories of sheep sold (%)
The major factor affecting prices in the sheep market was dependent on the time of the sale. When
there was a high supply, the trader can set a lower price and when there was high demand (low
supply) the farmer can demand a higher price. From the survey, we have identified some factors that
affect the sheep marketing were as follows, their market concept was not well developed, constant and
uniform animal supply for the market cannot be ensured, marketing infrastructure was poor or non-
existent in most places, lack of standards and grading procedures, they were economically poor and
thus lack the resources to invest on their businesses. To improve sheep marketing system/channel of
the community farmer, we have some plan like, by producing market extension material and
conducting increasing farmers awareness, by linking farmers to the sheep marketing chain, by
identifying the best buying and selling season, by organizing farmers‟ marketing cooperatives, by
improving animal welfare at the time of transportation, by providing fresh and reliable market
information. In summary, we found that simple sheep rearing practices do empower rural women and
improve their social status. Hence, homestead sheep rearing and other similar business projects should
be encouraged by government and non-government development agencies as it increases independent
decision making authority and the involvement of women in their family affairs, which enhances the
socio-economic development of the rural sector. Despite of some constraints, it can be concluded that
this project plays a significant role in changing the socio-economic status of the rural people of hilly
area. Progress so far has met almost all the objectives of this project including livelihood, economic,
food security, health status and empowering women. Finally, it can be concluded that if the
limitations and constraints can be minimized, this project will more feasible.
Y'g(m)
9% Y'g(f)
11%
Fattened
43%
Breeding
Ram &
Ewes
19%
Castrated
male
18%
Big
traders
13%
S.trader
s
16% Hotel/b'
chers
15%
I. con
11%
Farmers
45%

Proceedings of the Annual Research Review Workshop 2018, BLRI, Savar, Dhaka 1341, October 09-10, 2018
115 Poster Session
Biomolecular characterization and diversity of the circulating Bacillus anthracis in Bangladesh
MR Karim1, MA Samad
1, MZ Ali
1, MS Mahmud
1 AM Swapnil
2 and M Giasuddin1*
1Zoonoses Laboratory, Animal Health Research Division, Bangladesh Livestock Research Institute,
Savar, Dhaka-1341; 2Sir Salimullah Medical College, Dhaka
*Corresponding author: M. Giasuddin; e-mail: [email protected]
Executive Summary
Anthrax is an acute to peracute, non contagious infectious disease of domestic and wild mammals.
Human is also susceptible to this disease. The causal bacterial agent is Bacillus anthracis, whose
main feature is to form spores that can survive outdoors for several decades, which increase its
viability and pathogenicity. B. anthracis is considered one of the pathogens of greatest interest as a
bacteriological weapon in a bioterrorist attack. Anthrax was reported in Bangladesh from 1980 to
1984 affecting both cattle and man, but it reemerged in 2009-2010 with wider involvement. Soil
conditions, together with ambient temperature and rainfall in Bangladesh represent an ideal situation
for the spread of B. anthracis. The persistence of B. anthracis in soils is related to a lack of
knowledge about butchering sick animals, and disposing of carcasses and wastes where animal
graze. To effectively combat the threats posed by this disease, there is a need for clear understanding
of the epidemiology of the respective diseases. Rapid and sensitive detection is necessary for the
diagnosis of anthrax organism to formulate a nationwide strategic control. The objective of the present
work was to establish effective and rapid diagnostic methods for the detection of Bacillus anthracis, a
highly virulent zoonotic pathogen. About 50 swab samples had been collected from anthrax suspected
dead animals with history of vaccination and epidemiological information on anthrax outbreak of
those areas. Blood smear slides were prepared from dead animals of suspected cases of anthrax and
were analyzed. at the zoonoses laboratory, BLRI, Savar, Dhaka, DNA was extracted from Swab
samples of suspected cases of anthrax by Qiagen mini extraction kit following the specific protocol
for tissue. DNAs was subjected to real time PCR using anthrax-specific primers (pXOl and pXO2
plasmids, and chromosome) according to Fasanella et al. (2001) with positive and negative control.
PCR test was performed with system Only 5 samples showed positive ct value (25.61, 24.55, 27.83,
23.45, 30.53) out of 50 samples. The Real time PCR presented in the current work has been shown to
be highly specific for the simultaneous detection and characterization of B. anthracis chromosomal
DNA and the pXO1 and pXO2 virulence plasmids. The PCR has a rapid turnaround time (≈1 hour,
35 min), requires no culture, gel electrophoresis and is easy to read and interpret, making this
molecular diagnostic assay well-suited for the high-throughput comprehensive identification and
characterization of Bacillus anthracis.

Proceedings of the Annual Research Review Workshop 2018, BLRI, Savar, Dhaka 1341, October 09-10, 2018
116 Poster Session
Development of energy and protein supplementation based feeding system of pregnant
Bengal sheep under stall feeding condition
M Asaduzzaman, MA Hemayet and MA Jalil
Goat and Sheep Production Research Division, BLRI, Savar, Dhaka 1341
Executive summary
There are about 3.45 million sheep in Bangladesh (BES, 2018). Their concentration is relatively
higher in Barind, Jamuna basin and coastal area. They are phenotypic differences and highly prolific
compared to the other breeds. They live mainly on naturally grown grasses with no supplementation.
There is no energy and protein supplementation based feeding system of pregnant sheep in
Bangladesh. Over the years no study has been made to develop energy and protein supplementation
requirement based feeding system of pregnant ewes. It is necessary to develop energy and protein
supplementation requirement based feeding system of pregnant ewes. Present study was conducted to
determine the intake, requirement and nutritional status and development of energy and protein
supplementation based feeding system for pregnant ewes. The experiment was conducted in the Goat
and Sheep Production Research Farm of BLRI with 15 pregnant Bengal ewes of Jamuna river basin
origin for a period of five months. Pregnant ewes between 2-3 parities were used in this trial. The
animals were randomly grouped into three, i.e., Group T0, T1 and T2.
Concentrate diet (10.85 MJ ME/kg DM and 148 g/kg DM CP) was offered at 100% requirement, 5%
more of 100% requirement and 5% less of 100% requirement, for T0 , T1 and T2 group, respectively
with freshly cut German grass (Echinocloa crous-galli). Animals were weighed individually at
fortnightly interval and recorded. Nutrient requirements were estimated according to ARC (1995)
standard. All experimental animals were de-wormed (Endex®; Triclabendazole & Levamisole HCL)
and given intramuscularly injection of 2ml of Vit. AD3E (Dutch Farm, Veterinary Pharmaceuticals,
Holland) to the start of the experiment and also dipped in 0.5% melathion solution. The data were
analyzed statistically.
Table 1. Nutrient requirement (ARC, 1995), intake and balance of pregnant ewes of T0 group
Parameter Nutrientren quirement
(ARC, 1995) ± SED
Nutrient intake
± SED
Balance surplus
Average live wt. (kg) 25.23± 1.43
Average metabolic live wt.(kgW0.75
) 11.23±0.47
Total DM (kg/d) 1.42±0.06 0.65±0.05 0.77 (Surplus)
Total ME (MJ/d) 13.65±0.55 6.30±0.43 7.35 (Surplus)
Total CP (g/d) 171±5.91 89 ± 6.20 82 (Surplus)
Total DM(kg/100kg live weight) 5.68 ± 0.95 2.70±0.08 2.98 (Surplus)
Total DM (g/kgW0.75
/d) 127± 0.48 60±2.30 67 (Surplus)
Total ME (MJ/ kgW0.75
/d) 1.21±0.005 0.58±0.02 0.63 (Surplus)
Total CP (g// kgW0.75
/d) 15 ± 0.14 8±0.28 7 (Surplus) SED = Standard error of difference.
Nutrient requirement (ARC, 1995), intake and balance of pregnant ewes of T0 group is shown in
Table1. The pregnant ewes of Jamuna river origin were not consumed nutrient according to ARC
(1995) standard. Feed and nutrient intake of pregnant ewes of Jamuna river basin origin is presented
in Table 2. Feed and nutrient intake of all groups was nonsignificant (P> 0.05). Overall average live
weight was significantly (P< 0.05) higher in T2 group (28.19kg) than the T1 (27.09 kg) and T0 group
(25.23 kg). The higher live of T2 group may be due to better utilization of feed. There was
significantly (P< 0.05) difference in the average daily live weight gain of animals of T2 group to that
of the T1 and T0 group. The lower growth rate was observed in T0 (81g/d) group than the T1 (99g/d)
and T2 (116g/d) group. Digestibility of DM, OM, CP and ADF was significantly (P< 0.05) higher in
T2 group than the T1 and T0 group. The higher feed digestibility of T2 group may be due to the better
digestive efficiency.

Proceedings of the Annual Research Review Workshop 2018, BLRI, Savar, Dhaka 1341, October 09-10, 2018
117 Poster Session
Table 2. Feed and nutrient intake of pregnant ewes of Jamuna basin origin
Parameter Dietary treatment groups SED Level of
Significance T0 T1 T2
Overall average live weight (kg) 25.23c 27.09
b 28.19
a 0.89 *
Average metabolic live weight (kgW0.75
) 11.23c 11.42
b 11.98
a 0.27 *
Daily live weight gain (g/d) 81c 99
b 116
a 5.37 *
Grass DM intake (kg/d) 0.28 0.29 0.28 0.019 NS
Grass ME intake (MJ/d) 2.26 2.30 2.28 0.09 NS
Grass CP intake (g/d) 33.49 34.98 33.75 1.41 NS
Concentrate DM intake (kg/d) 0.37 0.42 0.32 0.011 NS
Concentrate ME intake (MJ/d) 4.04 4.50 3.48 0.12 NS
Concentrate CP intake (g/d) 55 58 53 1.79 NS
Total DM intake (kg/d) 0.65 0.71 0.60 0.02 NS
Total ME intake (MJ/d) 6.30 6.80 5.76 0.21 NS
Total CP intake (g/d) 89 97 86 2.99 NS
Total DM intake (kg/100 kg live weight) 2.70 3.43 2.60 0.09 NS
Total DM intake ( g/kgW0.75
/d) 59 62 57 0.96 NS
Total ME intake (MJ/kgW0.75
/d) 0.57 0.60 0.55 0.08 NS
Total CP intake (g/kgW0.75
/d) 8 9 7 0.12 NS
Table 3. Lamb birth weight of Jamuna river basin origin ewes
Parameter
Dietary treatment group Level of
Sig. T0 T1 T2
No. Mean ±SE No. Mean ±SE No. Mean ±SE
Lamb birth wt. (kg) of single-born - - 2 1.85±0.30 - - -
Lamb birth wt.(kg) of twin-born 8 1.79b±0.30 6 1.73
b±0.18 6 2.05
a±0.19 *
Lamb birth wt. (kg) of triple-born 3 1.63±0.17 - - 6 1.65±0.18 -
Male birth wt (kg) 6 1.92b±.09 3 1.93
b±0.47 5 2.10
a±0.13 *
Female birth wt. (kg) 5 1.62±0.04 5 1.66±0.08 7 1.67±0.33 NS
Mean of lamb birth wt. (kg) 11 1.75b±0.28 8 1.76
b±0.18 12 1.85
a±0.13 *
Total lamb birth wt. (kg) 19.20b 14.10
c 22.20
a *
Average litter size (no.) 5 2.2±0.20 5 1.5±0.24 5 2.4±0.54 *
Average litter wt. (kg.) 5 3.38c±0.38 5 3.60
b±0.29 5 4.98
a±0.02 *
Table 3 shows the lamb birth weight of Jamuna river basin origin ewes. Significantly (P< 0.05) higher
average lamb birth weight was observed in T2 (1.85 kg) group than the T1 (1.76 kg) and T0 (1.75kg)
group.
The results of the present study indicated that the fresh chopped German grass plus 5% less
concentrate diet of supplemented concentrate diet of T0 group had beneficial effect on feed digestion,
lamb birth weight and ewes live weight. Therefore, the fresh German grass plus 5% less concentrate
diet was a better feeding system of pregnant sheep of Jamuna basin area. This observation need to
be confirmed through data from other Bengal sheep genotype.

Proceedings of the Annual Research Review Workshop 2018, BLRI, Savar, Dhaka 1341, October 09-10, 2018
118 Poster Session
Molecular characterization of BLRI improved indigenous chicken varieties using microsatellite
markers
MA Rashid1, MSA Bhuiyan
2, AKFH Bhuiyan
2, S Faruque
1 and J Alam
3
1Poultry Production Research Division, Bangladesh Livestock Research Institute, Savar, Dhaka-1341
2Dept. of Animal Breeding and Genetics, Bangladesh Agricultural University, Mymensingh-2202
3National Institute of Biotechnology, Ashulia, Dhaka-1349
Executive Summary
Domestic chickens, native and locally adapted breeds or varieties those represent a diverse gene pool
in the world. Among them, important components are available in developing countries including
Bangladesh.Moreover, red jungle fowl; the wild progenitor of domestic chickens is still available in
some regions of the country. This fact warrants and would be worthwhile to assess the genetic
relationships and differentiation in indigenous chickens of Bangladesh. Therefore, the study was
conducted to investigate genetic diversity, relationships and/or distances among the three indigenous
chicken populations (Non-descript deshi, Naked Neck and Hilly) of Bangladesh. Besides, a panel of
samples from red jungle fowl (JF); and a fighting breed Aseel were also included in this study. A total
of 161 DNA samples were included in this study. All 5 chicken populations were discriminated using
16 highly polymorphic microsatellite markers those were screened and optimized at Animal
Molecular Genetics Lab, Chungnam National University, Republic of Korea. PCR reactions were
carried out using the C1000 Thermal Cycler in the aforementioned lab. The fragment size analysis
was performed using the Genetic Analyzer 3130 (Applied Biosystems, USA) and allele score was
determined using Genemapper ver. 4.1 ((Applied Biosystems, USA).
Our result showed that the mean number of alleles ranged between 5.81 (in red jungle fowl) and 7.13
(in Non-descript deshi). The average observed and expected heterozygosity in the studied populations
was 0.67 ± 0.01 and 0.70 ± 0.01, respectively, whereas the overall heterozygote deficiency (Fit) was
found 0.15 ± 0.02. AMOVA (analysis of molecular variance) analysis revealed 88.07 % of the total
genetic diversity was accounted for within population variation and the rest 11.93 % was incurred
with population differentiation (Fst). This result indicates little genetic differentiation among the
investigated populations.Structure analysis depicted that the studied samples can be categorized into 4
distinct types (ΔK=3.74) or varieties (Non-descript deshi, Naked Neck, Hilly, Aseel/JF)where Aseel
and JF grouped together. This finding suggests massive introgression of JF to Aseel breed and is also
supported by our previous mitochondrial DNA study. In conclusion, these results provided important
insight in relation to genetic diversity and population structure aspects which could be utilized
forBangladeshi chicken genetic resource conservation as well as future breeding strategy
development.

Proceedings of the Annual Research Review Workshop 2018, BLRI, Savar, Dhaka 1341, October 09-10, 2018
119 Poster Session
Figure 1: Structure analysis among 5 different chicken populations of Bangladesh using 16
polymorphic microsatellite markers.

POSTER SESSION

Proceedings of the Annual Research Review Workshop 2018, BLRI, Savar, Dhaka 1341, October 09-10, 2018
61 Technical Session V
Study on an economic impact of native chicken in some selected areas of Bangladesh
S Islam1, M Khatun
1, S Yasmin
1, M Ershaduzzaman
2 and AHMS Islam
3
1Socioeconomic Research Division,
2Goat and Sheep Production Research Division, Bangladesh
Livestock Research Institute, Savar, Dhaka 1341; 3Bangladesh Agricultural University, Mymensingh
2202
Executive summary
Native chickens are important for the rural poor women and marginalized section for subsidiary
income and safe nutrition. Considering these views, the study was conducted taking objectives,
namely, to assess the profitability of improved native chicken and to delineate the impact on
household dietary diversity.Study areas were selected from six districts, namely,Joypurhat sadar under
Joypurhat, Dinajpur sadar under Dinajpur, Dumoria under Khulna, Kotalipara under Gopalgonj,
Nokla under Sherpur and Sonagazi under Feni district basis of improved native chicken project
implementation areas. Primary data were collected through structure questionnaire during the months
of January to March 2018 from two types of native chicken farmers. Project beneficiary group was
treated as treatment group and served with training on scientific rearing and management practices
and improved native chicken breed, on the other hand, control group those who reared native chicken
in a traditional manner that means scavenging system. Both tabular and statistical techniques were
adopted to analyze data. From the light of research findings, it was evident that treatment group
produced 60 number native chickens annually and on the other hand, control group produced half of
the treatment group that means 30 numbers of native chickens. On average, the treatment group
hatched egg 2.57 times annually and each time they produced 23 numbers of chicks. On contrast,
control group hatched 2.36 times annually and each time they produced 13 numbers of chicks. The
study identified cost items such as feed, beginning stock , medicine & vaccine, electricity,
transportation, labour and housing etc. Feed and labour were built the highest cost among the cost
items for both the groups. For control group, labour cost occupied the 42 percent and the feed cost
captured 28 percent. On the other hand, for treatment group, feed cost occurred 39 percent and the
labour cost was 34 percent. The study also identified some cash inflow items such as closing stock,
number of chicken sold, number of egg sold, number of chicken consumed, number of egg consumed,
gift out chicken and gift out egg etc. we found that the improved native chicken had laid 141 number
of eggs per year per bird, on the other hand, native chicken under scavenging system and traditional
management practices laid only 50 number of eggs per year per bird indicating that the improved
native chicken was better than the control in terms of egg production. The purpose of native chicken
rearing was diversified namely additional family income, home consumption, ceremonies and creating
employment opportunities partially. Fifty percent farmers opined that they reared native chicken for
additional family income followed by 37 percent home consumption, 9 percent ceremonies and 4
percent creating employment opportunity. Farmers utilized the income from native chicken in a good
way. The treatment group, 24 percent money spent for child education, 53 percent family expenses
(food, clothing), 4 percent health treatment (medicine) and 19 percent savings whereas control group
only 17 percent for child education, 66 percent family expenses (food, clothing), 9 percent health
treatment (medicine) and 8 percent savings. The income utilization pattern was observed significantly
different between these two groups and the treatment group obviously in convenient and well off
position compare to control group. In case of profitability, the treatment group earned BDT 3,450 per
10 birds per annum followed by control group earned BDT 2,476. The BCR was found 2.04 and 1.45,
respectively for treatment and control group (Table 1). Among the cash inflows, value of chicken sold
was found highest. For treatment group, value of chicken sold was calculated 39 percent followed by
value of egg sold 20 percent, value of chicken consumed 14 percent, value of egg consumed13
percent and the value of closing stock 11 percent. On contrast, for control group, value of chicken
sold was calculated 44 percent followed by value of egg sold 7 percent, value of chicken consumed 27
percent, value of egg consumed 16 percent and the value of closing stock 4 percent.

Proceedings of the Annual Research Review Workshop 2018, BLRI, Savar, Dhaka 1341, October 09-10, 2018
62 Technical Session V
Table 1. Revenue comparison between treatment and control group
10 birds/year
Area
Treatment Control
Total
revenue
Gross
margin
Net
return
BCR Total
revenue
Gross
margin
Net
return
BCR
Sherpur 3051 1801 1437 1.89 1618 750 289 1.22
Gopalgonj 3993 3168 2379 2.47 2375 1701 764 1.47
Feni 3316 2648 2147 2.84 3699 2835 1427 1.63
Dinajpur 2591 1521 1018 1.65 1711 810 255 1.18
Joypurhut 3027 1726 1206 1.66 2173 981 360 1.20
Khulna 4724 3607 2367 2.00 3280 2677 1549 1.89
Average 3450 2412 1759 2.04 2476 1626 774 1.45
Source: Field survey, 2018
We found that women were the sole reared of native chicken and logically the controlling power of
money received from native chicken should be on the hands of women but study result showed that
money usage depends on mainly the decision of the family head in most of cases. Rearing of native
chicken entirely depends on women‟s decision but the usage of money controlled by women and men
i. e. for treatment group 73 percent and for control group 52 percent, meaning that the treatment group
was more empowered than the control group. We had constructed a household dietary diversity score
on the basis of food items consumed by the family members. The food items were namely food grain,
pulses, edible oil, leafless vegetables, leafy vegetables, meat, egg, milk fruits, fish, spices and
beverage etc. We found that the household dietary diversity score for treatment group was calculated
8.33 for household members and 7.93 for household main women, on the contrary, for control group,
7.95 for household members and 7.64 for household main women. It was indicating that the treatment
group had better supply of family dietary items. A Cobb-Douglas production function was drawn
adopting multiple regression model comprising the independent variables were housing cost,
treatment cost, labour cost, initial investment, feed cost, age, education, occupation and farm size. It
was predicted that treatment cost, labour cost initial investment, feed cost, education and farm size
might have positive influence to household native chicken production. It was apparent from the value
of coefficient that most of the prediction was justified and statistically significant at different levels of
confidence intervals (Table 2).
Table 2. Coefficient of explanatory variables of cost items and socioeconomic parameters
Explanatory variable Coefficients Std. Error Sig. Level
Housing cost -14.335 10.960 0.193
Treatment cost 12.669*** 3.090 0.000
Labour cost 0.795 0.479 0.099
Initial investment 6.309*** 1.857 0.001
Feed cost 1.775*** 0.488 0.000
Age 11.003 11.277 0.330
Education 5.304 151.651 0.972
Occupation 158.078 104.488 0.132
Farm size -1.504 4.294 0.727
Constant -452.616 1375.885 0.743
R2 0.280 - -
F value 7.903*** - 0.000
Source: author‟s calculation. (*** represent 1% significant level).
In conclusion, we would like to state that the BLRI developed improved native chicken species has
high potential over the traditional native chicken in terms of production performances.

Proceedings of the Annual Research Review Workshop 2018, BLRI, Savar, Dhaka 1341, October 09-10, 2018
63 Technical Session V
Study on Cattle Fattening and Beef Marketing in some selected Areas of Bangladesh
S Islam1, M Khatun
1, S Yasmin
1, M Ershaduzzaman
1 and MI Hossain
2
1Socioeconomic Research Division, BLRI, Savar, Dhaka
2Bangladesh Agricultural University, Mymensingh
Executive Summary
By adopting BLRI developed much popular and commonly practiced Cattle Fattening Technology
(CFT) on compensatory growth concept, farmers produce huge fattened cattle over the year, specially
taking Eid-ul-Azha as a target point for selling and making profit. With a view to analyse the issue,
this study was conducted comprising objectives, namely, to assess the profitability of cattle fattening;
to determine the marketing of fattened cattle; and to examine the socioeconomic impact of cattle
fattening farmers. Study areas were selected from three districts, namely, Dhamrai under Dhaka;
Kustia sadar under Kustia and Pachbibi under Joypurhat district on the basis of more cattle fattening
areas. Primary data were collected through structured questionnaire during the months of March to
May 2018 from two types of sample interviewees-cattle fattening farmers and butcher/meat seller.
Total sample size was 105 constituting 90 from cattle fattening farmers and 15 from butcher in the
respective areas. Both tabular and statistical techniques were adopted to analyze data by R software.
From the study, it was found that 61% farmers had taken crossbred followed by 27% native and 12%
both types of cattle for fattening. Farmers opined that crossbred was a fast growing and more
profitable than the native one. In addition, fat composition is low in crossbred meat stated by the
butcher. As source, 79% farmers had collected cattle from the recognized cattle market in the Upazila
followed by 14% from own farms and the rest from farm and market for fattening of cattle. Farmers
fattened 100%. The initial average age of fattened cattle was found 2.26 years. We found that 53%
farmers did cattle fattening whole year, on contrast, 47 farmers only before Eid-ul-Azha, the biggest
religious festival for the Muslim Community in Bangladesh. In the case of feed processing for cattle
fattening, 41% farmers had given positive statement that they had knowledge on silage, hay and Urea
Molasses Straw (UMS) preparation and conservation but the remaining 59% farmers had no proper
knowledge on feed processing. Study also found that among the cattle fatten farmers only 22% had
taken training on scientific management practices on cattle fattening from the department of livestock
services (DLS) and the average duration was 4.25 days. Moreover, 94% farmers opined that for the
purpose of treatment of their livestock, they had taken treatment and other advisory services from the
Upazila Veterinary Hospital. On average, per farm fattened cattle population was found 2.74 and
duration of fattening was 3.4 months. For fattening, among cost items, initial price of cattle that
means purchase price of cattle was the highest (65.51%) followed by feed cost 21.22%, labour cost
10.47% and the rest of other cost. On average, total cost was calculated BDT 68,813/cattle/batch
(Table 1).
Table 1. Cattle fattening cost (BDT/cattle/batch)
Cost items Damrai Kustia Pachbibi Average Percentage (%)
Initial price of cattle 45256 53667 36315 45079 65.51
Treatment 466 423 277 389 0.57
Feed cost 16267 16438 11102 14602 21.22
Equipment 117 169 130 139 0.20
Electricity 169 177 102 149 0.22
Interest on operating capital 1254 1427 882 1188 1.73
A. Total variable cost 63529 72301 48808 61546 89.44
Labor cost 6816 8954 5853 7208 10.47
Housing cost 59 71 47 59 0.09
B. Total fixed cost 6875 9025 5900 7267 10.56
C. Total cost (A+B) 70404 81326 54708 68813 100.00
Source: Field survey, 2018.
The study identified some cash inflow such as value of cattle sold, value of cow dung and sold value
of feed sacks etc. We found the highest return in Kustia sadar followed by Dhamrai and Pachbibi.

Proceedings of the Annual Research Review Workshop 2018, BLRI, Savar, Dhaka 1341, October 09-10, 2018
64 Technical Session V
Average return was estimated BDT 86,171 per cattle and value of cattle sold contributed 99.16% of
the total return. The estimated BCR was found in Pachbibi, Dhamrai and Kustia Sadar, respectively,
1.36, 1.26 and 1.18. Average BCR was 1.25 indicating that cattle fattening was a profitable enterprise
(Table 2).
Table 2. Return from fattening cattle (BDT/cattle/batch)
Return items Damrai Kustia Pachbibi Average Percentage (%)
Cattle sold 87972 94850 73524 85449 99.16
Cow dung 580 607 605 598 0.69
Feed sacks 123 142 108 124 0.14
D. Total return 88675 95599 74237 86171 100.00
E. Gross margin (D-A) 25146 23298 25429 24625
F. Net return (D-C) 18271 14273 19529 17358
G. BCR (D/C) 1.26 1.18 1.36 1.25
Source: Field survey, 2018.
A Cobb-Douglas production function was drawn adopting multiple regression model comprising the
independent variables was age, education, family size, farm size, occupation, initial value of cattle,
treatment cost, feed cost and labour cost. It was predicted that treatment cost, labour cost, initial
investment, feed cost, education and farm size might have positive influence to cattle fattening and
income. It was apparent from the value of coefficient that most of the prediction was justified and
statistically significant at different levels of confidence intervals (Table 3).
Table 3. Coefficient of explanatory variables of cost items and socioeconomic parameters Explanatory variable Coefficients Std. Error Sig. Level
Constant 56515.377*** 14678.744 0.000
Age -160.639 199.866 0.424
Education 1880.481 1968.108 0.342
Family size -43.075 1351.791 0.975
Farm size -14.452 18.254 0.431
Occupation -5059.534** 2206.129 0.024
Initial value of cattle 0.068 0.139 0.625
Treatment cost 23.134** 10.257 0.027
Feed cost 1.332*** .454 0.004
Labour cost 1.876** .946 0.051
R2 0.284 - -
F value 3.531*** .001
Source: author‟s calculation. (*** and ** represent 1% and 5% significant level).
In the case of beef marketing, on average, 45 numbers of cattle were slaughtered in each Upazila
every day. In Bangladesh, total number of Upazila/thana was 550 (BBS, 2013) and in accordance,
about 7,548,750 numbers of cattle were slaughtered every year except Eid-ul-Azha. Meat
seller/butcher slaughtered 63% native breed and 37% crossbred cattle in the local Hut or market.
About 93% butcher stated that they did not examine the health condition of cattle before slaughtering.
Among the cattle slaughtered by the butcher, 86% was ox/bull and the remaining 14% was cow. In
addition, 60% butcher opined that the place where cattle were slaughtered was not hygienic or
wholesome. A butcher earned BDT 65,778 as total return where purchased price of cattle was BDT
60,384 and the marketing profit was calculated BDT 4,164 per cattle. For cattle fattening farmers,
sector wise average annual household income was found BDT 384,061 where livestock sub-sector
alone contributed BDT 192,772 which was 50.19% of the total income. On contrast, household annual
expenditure on food was found highest 48.20% and second highest on education (17.83%). Farmers
did not apply any types of steroids or growth hormone for cattle fattening. In conclusion, it may be
stated that the BLRI developed cattle fattening technology was widely used by the farmers and it
made their farm profitable and sustainable.

Proceedings of the Annual Research Review Workshop 2018, BLRI, Savar, Dhaka 1341, October 09-10, 2018
65 Technical Session V
A baseline survey for field testing of BLRI FeedMaster mobile application in selective
locations of Bangladesh
N Sultana1, MA Kabir
2, MFH Miraz
2, MA Hasan
1, ASMA Uddin
1
1 Training, Planning and Technology Testing Division,
2 Biotechnology Division Bangladesh
Livestock Research Institute, Savar, Dhaka 1341
Executive summary
“Feed Master” is a farmers and extension personnel friendly android application that can calculate
animal ration according to their stage of production as well as help the farmers for year round fodder
production planning, vaccination and scientific management of animals developed at Bangladesh
Livestock Research Institute (BLRI), Savar, Dhaka. However, the efficacy of this technology has not
yet been justified in field level. Considering this fact, the current research programme was designed to
judge the efficacy, socio economic impact and to identify the constraints to adopt and sustain this
technology at farmer‟s level. For this purpose, a baseline survey was conducted through a pretested
questionnaire regarding the existing farming system of the farmers in Dhaka, Rajshahi and Sirajgonj
regions as a preliminary step of this work. The data collected from the said regions were statistically
analyzed with IBM SPSS 20.0 software. Results as obtained from this study reveal that contribution
of male (84.6%) dominates over female (15.4%) in livestock farming in all of the surveyed area and
average age of the farmers was 39.79 years. 44.2% respondents have an average family size of 4-5
people and 59.3% family have single earning member in their family. Primary education is the basic
education level for 31.5% respondents and agriculture (85.5%) is the main occupation whereas, 4.6%
involved in cattle farming. Majority of the respondents use smart mobile (66.3%) and 65.9%
respondent have knowledge about mobile apps. Most of the farmers reared cattle in semi intensive
system (61.3%) followed by intensive (29%) and extensive (9%) system. Although, crossbred cattle
rearing farmers (67.9%) dominate over the indigenous cattle rearing farmers (44.9%) in the surveyed
areas, but average number of indigenous and crossbred cattle per cattle keeper household are 5.55 and
5.33, respectively. Highest percentage (94.0%) of indigenous cattle keeper households were found in
Rajshahi, followed by Sirajganj (21.8%) and Dhaka (20.2%), whereas 97% farmers in Sirajganj rear
crossbreed cattle followed by Dhaka (90.4%) and Rajshahi (15%). Farmers in Sirajganj area have
higher numbers of crossbred cows (6.37 per household) than Rajshahi (3.13) and Dhaka (4.6),
whereas higher number of indigenous cattle per household was obtained in Rajshahi (6.90) than
Dhaka (2.71) and Sirajganj (2.45). This study reveals that Sirajganj region is rich for crossbred cattle
and Rajshahi for indigenous cattle. Almost equal percentage of farmers supply sole green grass or rice
straw (46.1 and 45.1%, respectively), whereas only 8% farmers supply a combination of both green
grass and rice straw. However 66.9% farmers supply concentrate mixture to their cattle, whereas
31.1% and 63% farmers supply sole roughage and both roughage and concentrate to their animals
respectively. When farmers prepare concentrate mixture at farm, the cost of feed (24.0 Tk./kg) is
lower than that of purchased ready feed (35.8 Tk./kg). Despite the higher price of purchased ready
feed 24.8% of the farmers supply ready feed which proportion is higher in Dhaka (54.8%), followed
by Rajshahi (11.6%) and Sirajganj (8.5%). This indicates that farmers do not have adequate
knowledge about balanced ration formulation as they have to rely on commercial feed. 95.5% farmers
supply concentrate feeds to their animals on the basis of eye estimation of requirements. However,
33.7% farmers have idea about balanced ration. Wheat bran, rice polish, oil cake, khesari bran, broken
rice, mosur bran and crashed maize are the most common types of concentrate feeds used in the
surveyed area. Among the concentrate feed ingredients, wheat bran is especially used by about 26.1%
farmers. About 64.4% farmers cultivate fodder for feeding their cattle where Napier is cultivated by
most of the farmers (41.6%). Body weight of cattle is estimated by 98.3% farmers based on eye
estimation, which is mainly due to administration of drugs (87%). Vaccination and deworming is
practiced by 94.4% and 96.7% farmers, respectively in the selected regions. But regular vaccination
and deworming are followed by 79.1% and 76.6% farmers respectively. Among the farmers, 36.3%
have proper knowledge about vaccination and rest of them vaccinate without having any knowledge
on it. FMD (45.8%) and Anthrax (37.9%) are the most common types of vaccines used by the farmers
for their animals. There is a huge gap between the supply and demand of Government vaccines, as

Proceedings of the Annual Research Review Workshop 2018, BLRI, Savar, Dhaka 1341, October 09-10, 2018
66 Technical Session V
42.5% farmers purchase vaccines from private sources. Most of the cases 62.5% vaccination is done
by Quack or Livestock service provider. About 46.6% of the farmers deworm their animals twice in a
year. Most of the cases 31.2% deworming is done by farmers themselves. Different types of diseases
(most commonly FMD, Diarrhoea, Bloat, Fever, Anthrax and HS) are found in different rates of
prevalence in the surveyed areas. FMD is the highest (37.4%) prevalent disease in the surveyed areas
and about 91.0% of the farmers take their animals under treatment when disease occurred. 84.4% of
the disease affected animals recover from the diseases after proper treatment and rest of the animals
die. In most cases, treatment is facilitated by Quack (Livestock service provider), whereas, 26.6%
registered veterinarian facilitate for treatment. Only 36.7% farmers have idea about disease condition
and 46.5% of the farmers face problems to avail registered veterinarian. Average milk production of
the surveyed areas was found to be 13.42 kg/day. Average milk production was highest in Sirajganj
(27.01 kg/day) followed by Dhaka (10.23 kg/day) and Rajshahi (4.85 kg/day). Milk selling price
average 43.6 Tk./kg) with highest in Dhaka (52.6 Tk./kg), followed by Rajshahi (41.7 Tk./kg) and
Sirajganj (35.5 Tk./kg). Although, Sirajganj is rich in milk production among the surveyed areas,
lower price of milk results in economic loss of the dairy farmers. Only 15.3% farmers are acquainted
with different technologies related to livestock and 25% farmers have training on livestock rearing
and management, based on economic analysis for dairy and fattening farming in the selected areas. It
was found that dairy and fattening are more profitable in Rajshahi (BDT. 59,150.0 and BDT 49,122.0
Per annum) than Dhaka (BDT 45,732.0 and BDT. 20,000.0 Per annum) and Sirajganj (BDT. 99,818.0
and BDT. 18,200.0, respectively Per annum). This might be due to lack of proper synchronization of
production and cost of production along with low milk price. This feed based mobile application will
help in economic production for both dairy and fattening farming in those areas. After baseline
survey, 30 farmers were selected from each of the three locations for two days long orientation and
practical demonstration program on „Feed Master‟ mobile apps. Among the trainees, 5 (five) farmers
were selected for documentation of the technology in each of the locations. The socioeconomic
impact and status of technology analysis will be performed in next year.

Proceedings of the Annual Research Review Workshop 2018, BLRI, Savar, Dhaka 1341, October 09-10, 2018
67 Technical Session V
A study on economic losses due to foot and mouth disease outbreak in cattle and buffalo
in some affected areas of Bangladesh
M Giasuddin1, E Islam
1, S Islam
2, MS Mahmud
1, MA Samad
3, MR Karim
3, MZ Ali
3, MZ Hassan
3,
MA Islam1
1Research on FMD and PPR in Bangladesh Project,
2Socioeconomic Research Division,
3Animal
Health Research Division, Bangladesh Livestock Research Institute, Savar, Dhaka 1341
Executive summary
Foot and mouth disease (FMD) is a severe, highly contagious disease that causes immense economic
loss due to mortality, reduced milk production, treatment cost for affected cattle and weight loss of
fattening cattle, which occurs in Bangladesh almost every year. Outbreak of this disease causes
immense economic loss to the farmer as well to the national economy. In this study, an attempt was
made to analyze the morbidity, mortality and fatality of cattle affected by Foot and Mouth Disease
(FMD) and financial loss incurred therein. For this study data were collected from 652 affected
households of Dhaka, Rajshahi, Rangpur, Khulna, Chittagong divisions. Data were collected from
July 2017 to June 2018 using a predesigned questionnaire responding to the objectives of the study.
In total, there were 3792 crossbred and 1959 native cattle in the affected households. According to
area the overall morbidity, fatality and mortality were 50.29%, 13.11% and 6.59%, respectively in
crossbred cattle (Table 1). Morbidity in crossbred cattle was found the highest in Khulna (83.87%)
followed by Rajshahi (70.00%), Rangpur (66.67%), Dhaka (64.53%) and Chittagong (28.53%).
Fatality was highest in Chittagong (24.85), followed by Khulna (11.54%), Dhaka (9.27%), Rajshahi
(8.83%) and Rangpur (6.25%). Mortality was highest in Khulna (9.68%), followed by Chittagong
(7.09%), Rajshahi (6.18%), Dhaka (5.98%) and Rangpur (4.17%). It was found that morbidity,
mortality and fatality in crossbred cattle differed significantly (2=621.98, p<0.01;
2=665.99, p<0.01;
2=145.16, p<0.01). The overall morbidity, fatality and mortality were 77.59%, 9.67% and 7.50%,
respectively in native cattle. Morbidity in native cattle was found the highest in Khulna (85.47%)
followed by Rangpur (77.14%), Dhaka (74.77%) and Rajshahi (60.31%) but mortality was highest in
Rangpur (10.06%), followed by Dhaka (6.85%), Khulna (7.68%) and Rajshahi (1.17). Fatality was
highest in Rangpur (13.06%), followed by Dhaka (9.17%), Khulna (8.99%) and Rajshahi (1.94%).
Morbidity and fatality in native cattle differed significantly (2=71.28, P<0.01;
2=9.86, P<0.01 and
2=14.36, P<0.01) by area. No buffalo was found in the affected farms.
Table 1. Morbidity, Fatality and mortality of crossbred and native cattle by area.
Area No. of farms
Crossbred cattle Native cattle
Total no.
of cattle Morbidity Fatality Mortality
Total no. of
cattle Morbidity Fatality Mortality
Dhaka 150 468
(12.34) 302
(64.53) 28
(9.27) 28
(5.98) 321 (16.39)
240 (74.77)
22 (9.17)
22 (6.85)
Rajshahi 160 1520
(40.08)
1064
(70.00)
94
(8.83)
94
(6.18) 257 (13.12)
155
(60.31)
3
(1.94)
3
(1.17)
Rangpur 202 24
(0.63) 16
(66.67) 1
(6.25) 1
(4.17) 665
(33.95) 513
(77.14) 67
(13.06) 67
(10.08)
Khulna 110 31
(0.82)
26
(83.87)
3
(11.54)
3
(9.68)
716
(36.55)
612
(85.47)
55
(8.99)
55
(7.68)
Chittagong 30 1749
(46.13) 499
(28.53) 124
(24.85) 124
(7.09) 0
(0.00) 0
(0.00) 0
(0.00) 0
(0.00)
All area 652 3792
(100)
1907
(50.29)
250
(13.11)
250
(6.59)
1959
(100)
1520
(77.59)
147
(9.67)
147
(7.50)
2 values*
Significance
621.98
P<0.01
665.99
P<0.01
145.16
P<0.01
71.28
P<0.01
9.86
P<0.01
14.36
P<0.01
Figures in parentheses are percentages the respective area total; 2
was estimated from absolute numbers and
not from percentages
Prevalence of FMD was found to be the highest in the months of January-February (31.44%) followed
by March-April (21.78%), September-October (16.26%), July-August (15.64%) and November-
December (14.88%).
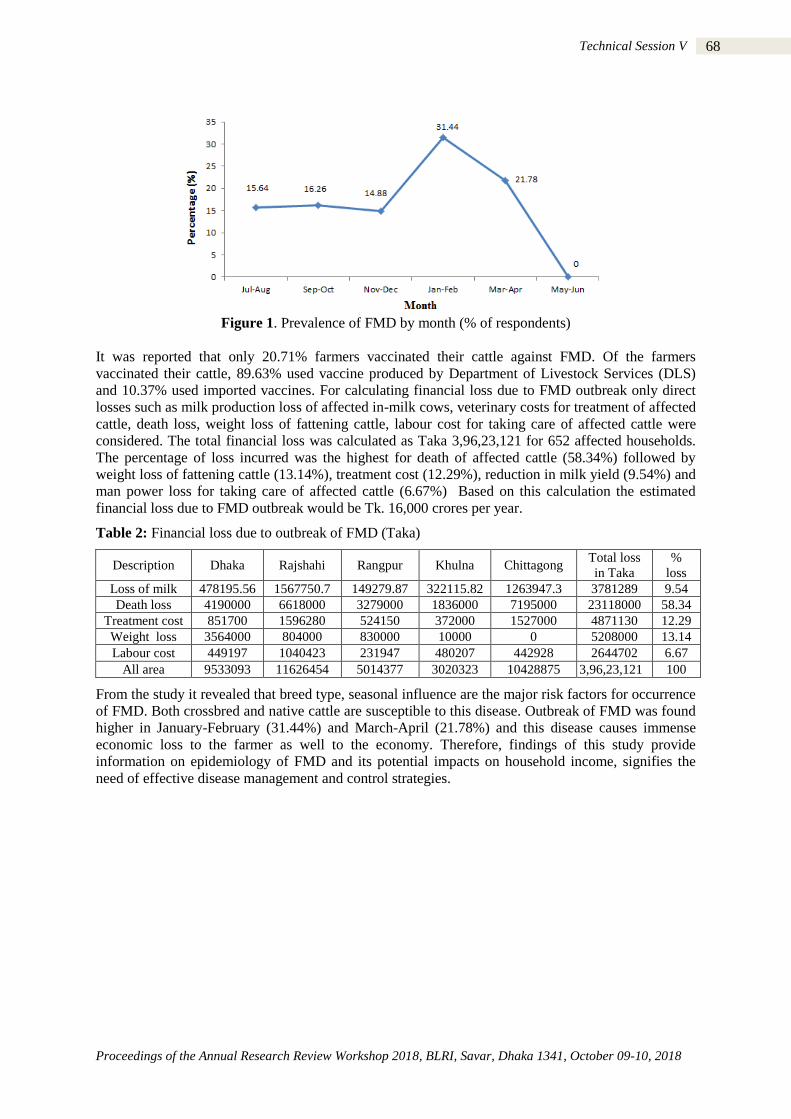
Proceedings of the Annual Research Review Workshop 2018, BLRI, Savar, Dhaka 1341, October 09-10, 2018
68 Technical Session V
Figure 1. Prevalence of FMD by month (% of respondents)
It was reported that only 20.71% farmers vaccinated their cattle against FMD. Of the farmers
vaccinated their cattle, 89.63% used vaccine produced by Department of Livestock Services (DLS)
and 10.37% used imported vaccines. For calculating financial loss due to FMD outbreak only direct
losses such as milk production loss of affected in-milk cows, veterinary costs for treatment of affected
cattle, death loss, weight loss of fattening cattle, labour cost for taking care of affected cattle were
considered. The total financial loss was calculated as Taka 3,96,23,121 for 652 affected households.
The percentage of loss incurred was the highest for death of affected cattle (58.34%) followed by
weight loss of fattening cattle (13.14%), treatment cost (12.29%), reduction in milk yield (9.54%) and
man power loss for taking care of affected cattle (6.67%) Based on this calculation the estimated
financial loss due to FMD outbreak would be Tk. 16,000 crores per year.
Table 2: Financial loss due to outbreak of FMD (Taka)
Description Dhaka Rajshahi Rangpur Khulna Chittagong Total loss
in Taka
%
loss
Loss of milk 478195.56 1567750.7 149279.87 322115.82 1263947.3 3781289 9.54
Death loss 4190000 6618000 3279000 1836000 7195000 23118000 58.34
Treatment cost 851700 1596280 524150 372000 1527000 4871130 12.29
Weight loss 3564000 804000 830000 10000 0 5208000 13.14
Labour cost 449197 1040423 231947 480207 442928 2644702 6.67
All area 9533093 11626454 5014377 3020323 10428875 3,96,23,121 100
From the study it revealed that breed type, seasonal influence are the major risk factors for occurrence
of FMD. Both crossbred and native cattle are susceptible to this disease. Outbreak of FMD was found
higher in January-February (31.44%) and March-April (21.78%) and this disease causes immense
economic loss to the farmer as well to the economy. Therefore, findings of this study provide
information on epidemiology of FMD and its potential impacts on household income, signifies the
need of effective disease management and control strategies.

Proceedings of the Annual Research Review Workshop 2018, BLRI, Savar, Dhaka 1341, October 09-10, 2018
120 Workshop committee and sub-committee
Annual Research Review Workshop 2018
Workshop Committee and Sub-Committee
Workshop Committee
1. Additional Director Convener
2. Head, Poultry Production Research Division Member
3. Head, Animal Health Research Division Member
4. Head, System Research Division Member
5. Head, Goat and Sheep Production Research Division Member
6. Head, Biotechnology Division Member
7. Head, Animal Production Research Division Member
8. Head, Training, Planning and Technology Testing Division Member
Invitation, Press-Publication and Stage Sub-committee
1. Dr. Md. Azharul Islam Talukder, CSO and Project Director, Dairy
Development Project
Convener
2. Mohammad Lutful Haque, System Analyst Member
3. Md. Al-Mamun, Librarian. Member
4. Amal Kumar Saha, Laboratory Technician, AHRD, BLRI Member
5. Md. Shah Alam, Information Officer Member Secretary
Program Planning and Paper Preparation Sub-committee
1. Dr. Md. Giasuddin , PSO and Head, Animal Health Research Division Convener
2. Dr. Md. Sazedul Karim Sarker, SSO, Poultry Production Research
Division
Member
3. Dr. Biplob Kumar Roy, SSO, Animal Production Research Division Member
4. Dr. Gautam Kumar Deb, SSO, Biotechnology Division
5. Dr. Razia Khatun, SSO, System Research Division Member
6. Dr. Sadek Ahmed, SSO, Goat & Sheep Production Research Division Member
7. Dr. Mohammed Abdus Samad, SSO, Animal Health Research Division Member
8. Md. Saiful Islam, SO, Socio-Economic Research Division Member
9. DR. Md. Zakir Hassan, SO, Animal Health Research Division Member
10. Mohammad Lutful Haque, System Analyst, Support Service Division Co-opt Member
11. Dr. Sardar Muhammad Amanullah, SSO, Biotechnology Division Member Secretary

Proceedings of the Annual Research Review Workshop 2018, BLRI, Savar, Dhaka 1341, October 09-10, 2018
121 Workshop committee and sub-committee
Refreshment, Resident and Transport Sub-Committee
1. Dr. Md. Abdul Jalil, PSO, Goat and Sheep Research Division Convener
2. Dr. Biplob Kumar Roy, SSO, Animal Production Research Division Member
3. Md. Khairul Bashar, SO, Animal Production Research Division Member
4. Md. Ponir Chowdhury, SO, Goat and Sheep Research Division Member
5. Md. Ahsan Habib, Security Officer Member
6. Md. Abdus Samad, Sub Asst. Engineer, Support Service Division Member
7. Dr. SM Jahangir Hossian, PSO, Biotechnology Division Member Secretary
Registration Sub-committee
1. Dr. Nasrin Sultana, PSO, Training, Planning and Technology Testing
Division
Convener
2. Dr. Md. Zillur Rahman, SSO, Training, Planning and Technology Testing
Division
Member
3. Ms. Kamrun Nahar Monira, SSO, Training, Planning and Technology
Testing Division
Member
4. Dr. Md. Rakibul Hassan, SSO, Poultry Production Research Division Member
5. Most. Farhana Afroz, SSO, Biotechnology Division Member
6. Dr. Md. Abu Yousuf, SO, Animal Health Research Division Member
7. Most. Mahfuja Khatun, SO, Socio-Economic Research Division Member
8. Dr. Shakila Faruque, SSO, Poultry Production Research Division Member Secretary
Environment Sub-Committee
1. Md. Ashraful Islam, Executive Engineer Convener
2. Dr. Md. Giasuddin , PSO and Head, Animal Health Research Division Member
3. Dr. SM Jahangir Hossain, PSO, Biotechnology Division Member
4. Md. Ahsan Habib, Security Officer Member
5. Md. Abdul Karim, LDA-cum-Typist, Biotechnology Division Member
6. Md. Abdul Malek, Messenger, Support Service Division Member
7. Md. Abdus Samad, Sub Assistant Engineer Member Secretary