biochemical, physiochemical, and microbial changes of
TRANSCRIPT
RESEARCH CIRCULAR 256 JUNE 1980
Biochemical, Physiochemical, and
Microbial Changes of Chemically Tr~ated
Cabbage Slaw During Storage
L. M. CHEN.
A. C. PENG
OHIO AGRICULTURAL RESEARCH AND DEVELOPMENT CENTER U. S. 250 and OHIO 83 SOUTH
WOOSTER, OHIO
CONTENTS
* * * Summary ___________________________________________________ 3
Introduction ________________________________________________ 3
Material and Methods _______________________________________ 4
Preparation of Packaged Cabbage Slaw ____________________ 4
pH and Total Acidity ________ · _____________________________ 4
Co lo r Determination _______________ -· _ _ _ _ _ _ _ _ _ _ _ _ _ _ _ _ _ _ _ _ _ 4
Preparation of Acetone Powder and Enzyme Extract ____________ 5
Assay Procedures _______________________________________ 5
Determination of Phenol Content_ __________________________ 5
Determination of Oxygen in the Heads pace of Container ________ 5
Sensory Evaluation ______________________________________ 5
Determination of Microbial Count_ __________________________ 5
Statistical Analysis ______________________________________ 6
Results and Discussion ________________________________________ 7
Changes in pH and Total Acidity upon Treatment and Storage ____ 7
Effects of Treatment and Storage on Phenolic Content_ _________ 9
Changes in PPO Specific Activity of Treated ~abbage Slaw During Storage __________________ l 0
Color Changes in Packaged Cabbage Slaw After Treatment and Storage _____________________________ 12
Effect of Treatment and Storage on Microbial Count in Cabbage Slaw ______________________ 15
Changes in Oxygen Uptake by Treated Cabbage Slaw During Storage __________________ 16
Sensory Evaluation ______________________________________ l 9
References ____ .. __ .. ______ .. -· ___ .. _________ .. _ .. __ ·- ________ .- _____ ·- __ 19
All publications of the Ohio Agricultural Research and Development Center are available to all on a nondiscriminatory basis without ~egard to race, color, national origin, sex or religious affiliation. · ·
AGDEX 252/64-65-75-76 6-80-2.5M
Biochemical, Physiochemical, and Microb'ial Changes of Chemically Treated
Cabbage Slaw During Storage L. M. CHEN and A. C. PENG
SUMMARY Cabbage slaws were treated with acid, sorbate, and metabisulfite.
Their pH, total acidity, phenol ·content, enzyme activity, microbial changes, and oxygen depletion were studied. Keeping quality was also evaluated. A correlation between the color change and polyphenol oxidase specific activity was observed. Citric acid, potassium sorbate, and sodium metabisulfite retarded discoloration of cabbage slaw. The concentration of sodium metabisulfite was critical. A 350 ppm in 0.2 % citric acid and 300 ppm in 0.2% citric acid/0.1 % potassium sorbate extended the shelf life to 3 weeks in terms of color, flavor, texture, and microbial quality. Generally, total acidity, phenol content, and microbial counts increased with storage time, while pH, enzyme activity, color, and oxygen decreased. The treated samples maintained acceptable flavor and texture throughout.
INTRODUCTION It has been shown that notable chemical and physical changes are
associated with deterioration of fresh vegetables. These indude changes in pH, color, texture, and aroma. Discoloration is particularly significant on the cut surfaces of cabbage and coleslaw as well as other vegetables and fruits. The chemical system responsible for this darkening may be related to an enzyme, namely polyphenol oxidase, and its reaction with a phenolic substrate in the presence of molecular oxygen. This reaction is referred to as enzymatic browning ( 1 7).
Enzymatic browning of vegetables and fruits has been of great interest in the food industry. The characteristics ·of polyphenol oxidasc (PPO) and control of browning have been reviewed (17, 26). Browning can be reduced by blanching, chilling, addition of sugar, salt, and chemical inhibitors of PPO, or by selecting cultivars of raw material less susceptible to browning and/ or raw material at the stage of maturity at which discoloration is at a minimum ( 14).
Several methods have been suggested to control discoloration in coleslaw. These include: vacuum cooling ( 10), removal of oxygen from the atmosphere surrounding the cabbage shreds ( 8, 19), or treatment with acids, ·reducing reagents, antibiotics, and other chemical inhibitors. Most observations upon tr~atments were made objectively on
3
the changes of color (8) and microbial populations (32), or subjective evaluations of appearance by trained panelists ( 19). Little is known concerning the effect of treatments and storage on changes of pH, total acidity, phenol content, PPO activity, and other physical or chemical properties accompanying discoloration. Knowledge of these changes should be helpful in developing methods for preventing discoloration.
The objective of this research was to study biochemical, physiochemical, and microbial changes occurring in packaged cabbage slaw treated with citric acid, potassium sorbate and potassium metabisulfite during 3. weeks of refrigerated storage. Investigations included pH, total acidity, phenol content, PPO specific activity, microbial studies, oxygen uptake by cabbage slaw, as well as sensory evaluation.
MATERIAL AND METHODS Preparation of Packaged Cabbage Slaw
Cabbage heads obtained from the wholesale market were inspected, decorded, and shredded. Shredded cabbage was then dipped in the test solutions as a proportion of 1144 g of shreds to 4 L of solution for 2 min. After draining and drying with layers of cheesecloth, cabbage shreds were packed in rigid High-Density polyethylene containers ( 1.8 L) and stored in the refrigerator at 4° C for 3
1 weeks. 1 Slaw dressing, which
may affect chemical analysis, was not added. Test solutions in this experiment were: 0.2% citric acid; 0.2%
citric acid with 200 ppm, 350 ppm, 500 ppm, 650 ·ppm, and 800 ppm of sodium metabisulfite, respectively; 0.1 % potassium sorbate; 0.1 % potassium sorbate with 200 ppm, 350 ppm, 500 ppm, 650 ppm, and 800 ppm of sodium metabisulfite, respectively; 0.2 % citric acid with 0.1 % potassium sorbate and their combinations with 200 ppm, 300 ppm, 400 ppm, and 500 ppm of sodium metabisulfite. Tater white ( L. K. Baker, Columbus, Ohio) and STA white (Archibald & Kendall, Inc., New York, N.Y.) were prepared as specified by th~ manufacturers. Water dipped samples were used as a control. Four replicates from each differently treated samples were randomly taken at the 1st, 7th, 14th, and 21st day of storage for the following objective measurements. pH and Total Acidity
The glass electrode method ( 1) was applied to measure the pH and titratable acidity in a sample solution prepared by blending 5 g· cabbage shreds with 95 ml of distilled water. Total acidity was expressed as percent titratable citric acid in 50 ml of sample aliquot. Color Determination
Color determination on acetone-extracted residue of cabbage slaw was performed by Hunter Color Difference Meter D25D3 against a yel-
4
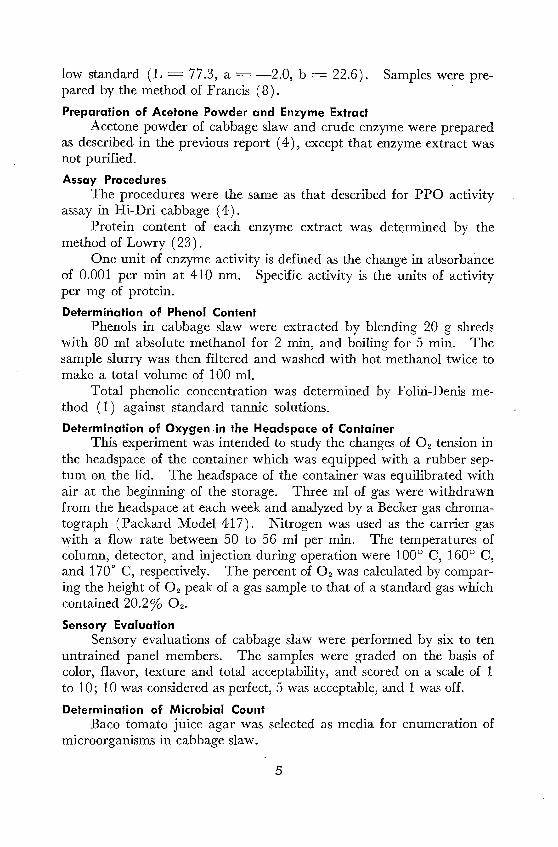
low standard (L = 77.3, a= -2.0, b = 22.6). Samples were prepared by the method of Francis ( 8) .
Preparation of Acetone Powder and Enzyme Extract Acetone powder of cabbage slaw and crude enzyme were prepared
as described in the previous report ( 4), except that enzyme extract was not purified.
Assay Procedures The procedures were the same as that described for PPO activity
assay in Hi-Dri cabbage ( 4). Protein content of each enzyme extract was determined by the
method of Lowry ( 23). One unit of enzyme activity is defined as the change in absorbance
of 0.001 per min at 410 nm. Specific activity is the units of activity per mg of protein.
Determination of Phenol Content Phenols in cabbage slaw were extracted by blending 20 g shreds
with 80 ml absolute methanol for 2 min, and boiling for 5 min. The sample slurry was then filtered and washed with hot methanol twice to make a total volume of 100 ml.
Total phenolic concentration \-\'.'as determined by Folin-Denis method ( 1) against standard tannic solutions.
Determination of Oxygen in the Headspace of Container This experiment was intended to study the changes of 0 2 tension in
the headspace of the container which was equipped with a rubber septum on the lid. The headspace of the container was equilibrated with air at the beginning of the storage. Three ml of gas were withdrawn from the headspace at each week and analyzed by a Becker gas chromatograph (Packard Model 41 7). Nitrogen was used as the carrier gas with a flow rate between 50 to 56 ml per min. The temperatures of column, detector, and injection during operation were 100° C, 160° C, and 170° C, respectively. The percent of 0 2 was calculated by comparing the height of 0 2 peak of a gas sample to that of a standard gas which contained 20.2% 02.
Sensory Evaluation Sensory evaluations of cabbage slaw were performed by six to ten
untrained panel members. The samples were graded on the basis of color, flavor, texture and total acceptability, and scored on a scale of 1 to 10; 10 was considered as perfect, 5 was acceptable, and 1 was off.
Determination of Microbial Count Baco tomato juice agar was selected as media for enumeration of
microorganisms in cabbage slaw.
5
A 10 g sample was weighed into a sterile blender cup with addition of 90 ml citrate-phosphate buffer (pH 6.8). The sample was blended for 2 min. Consecutive serial dilutions from 10-2 to 10-7 were prepared.
Duplicate plates with 10-2 through 10-1 dilutions were poured with 12-14 ml of tomato juice agar, allowed to solidify, and incubated at room temperature for 4 days. Preparation and counting were performed in accordance with Standard Methods for the Examination of Dairy Products ( 2).
Statistical Analysis All results were statistically analyzed. The significant differences
among treated and control sample means were performed by Duncan's multiple range test (28) on the basis of each sampling. The least sig-
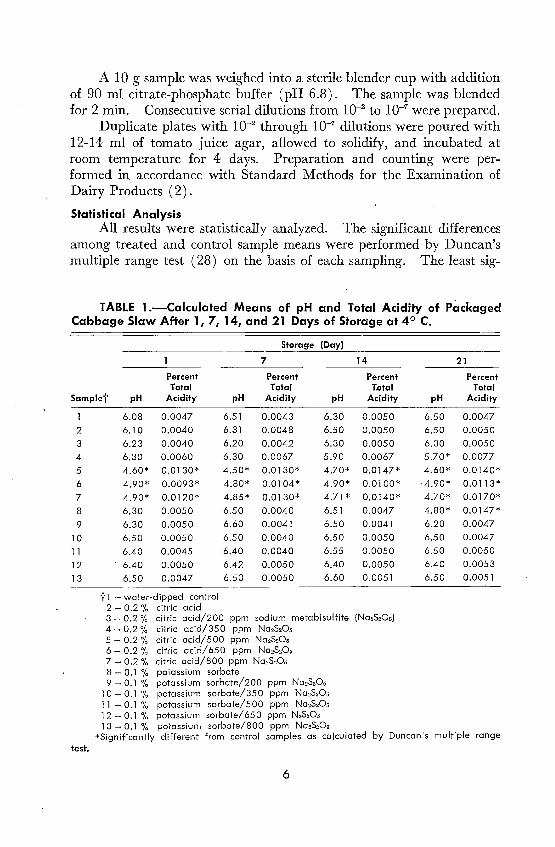
TABLE 1.-Calculated Means of pH and Total Acidity of P.ackaged Cabbage Slaw After 1, 7, 14, and 21 Days of Storage at 4° C.
Storage (Day)
7 14
Percent Percent Percent Total Total total
Samp!et pH Acidity pH Acidity pH Acidity
2
3
4
5
6
7
8
9
10
11
12
13
6.08 0.0047
6.10 0.0040
6.23 0.0040
6.30 0.0060
4.60* 0.0130*
4.90* 0.0093*
4.90* 0.0120*
6.30 0.0050
6.30 0.0050
6.50 0.0050
6.40 0.0045
6.40 0.0050
6.50 0.0047
i"l - water-dipped control 2 - 0.2 % citric acid
6.51
6.31
6.20
6.30
4.50*
4.80*
4.85*
6.50
6.60
6.50
6.40
6.42
6.50
0.0043 6.30 0.0050 0.0048 6.50 0.0050
0.0042 6.30 0.0050 0.0067 5.90 0.0067
0.0130* 4.70* 0.0147*
0.0104* 4.90* 0.0100*
0.0130* 4.71 * 0.0140*
0.0040 6.51 0.0047
0.0041 6.50 0.0041
0.0040 6.50 0.0050
0.0040 6.55 0.0050
0.0050 6.40 0.0050
0.0050 6.60 0.0051
3 - 0.2 % citric acid/200 ppm sodium metabisulfite (Na2S20u) 4 - 0.2 % citric acid/350 ppm Na2S205 5 - 0.2 % citric acid/500 ppm Na2S20s 6 - 0.2 % cifric acid/ 650 ppm Na2S205 7 - 0.2 % citric acid/800 ppm Na2S205 8 - 0.1 % potassium sorbate
21
Percent Total
pH Acidity
6.50 0.0047
6.50 0.0050
6.30 0.0050
5.70* 0.0077
4.60* 0.0140*
4.90* 0.0113*
4.70* 0.0170*
4.80* 0.0147*
6.20 0.0047
6.50 0.0047
6.50 0.0050
6.40 0.0053
6.50 0.0051
9 - 0.1 % potassium sorbate/200 ppm Na2S20u 10 - 0.1 % potassium sorbate/350 ppm Na2S20u 11 - 0.1 % potassium sorbate/500 ppm Na2S20u 12 - 0.1 % potassium sorbate/ 650 ppm N2S20J 13 - 0.1 % potassium sorbate/800 ppm Na2S20:;
*Significantly different from control samples as calculated by Duncan's multiple range test.
6
nificant difference (LSD) was calculated to evaluate differences among treatments ( 21) .
RESULTS AND DISCUSSION Changes in pH and Total Acidity upon Treatment and Storage
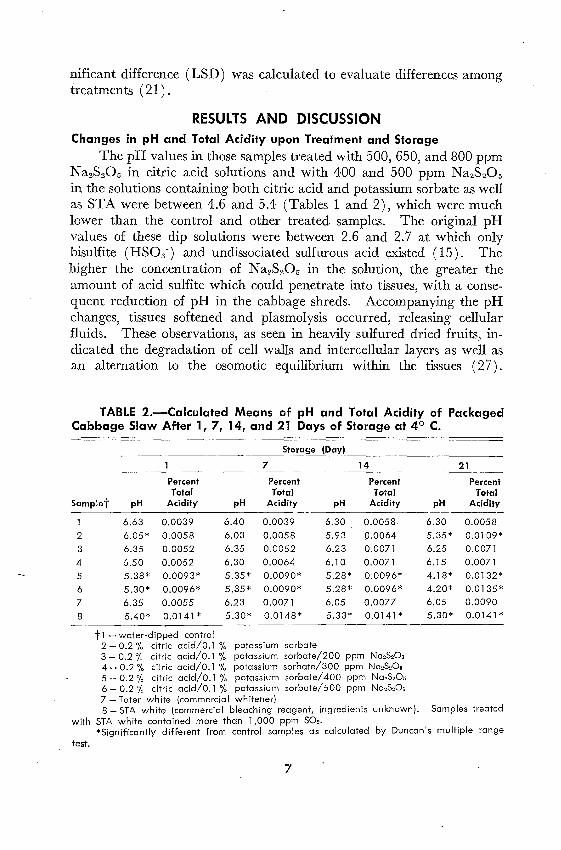
The pH values in those samples treated with 500, 650, and 800 ppm Na2S205 in citric acid solutions and with 400 and 500 ppm Na2S205 in the solutions containing both citric acid and potassium sorbate as well as STA were between 4.6 and 5.4 (Tables 1 and 2), which were much lower than the control and other treated samples. The original pH values of these dip solutions were between 2.6 and 2.7 at which only bisulfite ( HS03 -) and undissociated sulfurous acid ~xisted ( 15) . The higher the concentration of N azS205 in the solution, the greater the amount of acid sulfite which could penetrate into tissues, with a consequent reduction of pH in the cabbage shreds. Accompanying the pH changes, tissues softened and plasmolysis occurred, releasing cellular fluids. These observations, as seen in heavily sulfured dried fruits, indicated the degradation of cell walls and intercellular layers as well as an alternation to the osomotic equilibrium within the tissues ( 27).
TABLE 2.-Calculated Means of pH and Total Acidity of Packaged Cabbage Slaw After 1, 7, 14, and 21 Days of Storage at 4° C.
Storage (Day)
7 14
Percent Percent Percent Total Total Total
Sample·j· pH Acidity pH Acidity pH Acidity
2
3
4
5 6
7
8
6.63 0.0039 6.40 0.0039 6.30 0.0058.
6.05* 0.0058 6.03 0.0058 5.93 0.0064
6.35 0.0052 6.35 0.0052 6.23 0.0071
6.50 0.0052 6.30 0.0064 6.10 0.0071
5.38* 0.0093* 5.35* 0.0090* 5.28* 0.0096*
5.30* 0.0096* 5.35* 0.0090* 5.28* 0.0096*
6.35 0.0055 6.23 0.0071 6.05 0.0077
5.40* 0.0141 * 5.30* 0.0148* 5.33* 0.0141 *
ti - water-dipped control 2 - 0.2 % citric acid/0.1 % potassium sorbate 3 - 0.2 % citric acid/0.1 % potassium sorbate/200 ppm Na2S20a 4 - 0.2 % citric acid/0.1 % potassium sorbate/300 ppm Na2S20;; 5 - 0.2 % citric acid/0.1 % potassium sorbate/ 400 ppm Na2S20a 6 - 0.2 % citric acid/0.1 % potassium sorbate/500 ppm Na2S20;; 7 - Tater white (commercial whitener)
21
Percent Total
pH Acidity
6.30 0.0058
5.35* 0.0109* 6.25 0.0071
6.15 0.0071 4.18* 0.0132*
4.20* 0.0135* 6.05 0.0090 5.30* 0.0141 *
8 - STA white (commercial bleaching reagent, ingredients unknown). Samples treated with STA white contained more than 1,000 ppm S02.
*Significantly different from control samples as calculated by Duncan's multiple range test.
7
Changes in total acidity·. upon treatment mostly related to the changes in pH values; where there was a decrease in pH, there was an increase in total acidity. .
At pH level of 4.8 to 7.3 in the d1p solutions containing potassium sorbate and different concentrations of N a2S205, sulfite existed as sulfite (So/-) and bisulfite (HSQ3-) ions but not undissociated sulfurous acid (H2S03 ). which is the most active form of sulfur dioxide. As a ·result, potassium sorbate with Na2S205 did not influence pH and total acidity in packaged cabbage slaw (Table 1).
The effect of storage was only seen in samples treated with potassium sorbate (sample 8 in Table 1) and samples treated with citric acid, potassium sorbate, and their combinations with 400, 500 ppm N a2S20o (samples 2, 5, 6 in Table 2). The onset of fermentation is suspected to
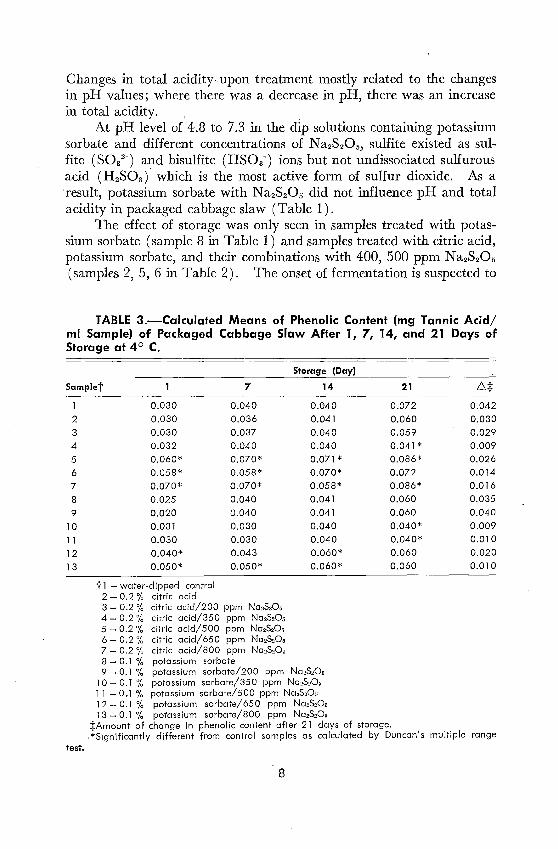
TABLE 3.-Calculated Means of Phenolic Content (mg Tannie Acid/ ml Sample) of Packaged Cabbage Slaw After 1, 7, 14, and 21 Days of Storage at 4° C.
Storage (Day)
Sam pl et 7 14 21 .6.:f:
2
3
4 5 6 7 8 9
10 11 12
13
test.
0.030 0.030 0.030 0.032 0.060* 0.058* 0.070* 0.025
0.020 0.031 0.030 0.040* 0.050*
tl - water-dipped control 2 - 0.2 % citric acid
0.040 0.040 0.036 0.041 0.037 0.040 0.040 0.040 0.070* 0.071 * 0.058* 0.070* 0.070* 0.058* 0.040 0.041 0.040 0.041
0.030 0.040
0.030 0.040 0.043 0.060*
0.050* 0.060*
3 - 0.2 % citric acid/200 ppm Na2S205 4 - 0.2 % citric acid/350 ppm Na2S20s 5 - 0.2 % citric acid/500 ppm Na2S20n 6 - 0.2 % citric acid/ 650 ppm Na2S205 7 - 0.2 % citric acid/800 ppm Na2S20;; 8 - 0.1 % potassium sorbate 9 - 0.1 % potassium sorbate/200 ppm Na2S20o
l O - 0.1 % potassium sorbate/350 ppm Na2S20t. 11 - 0.1 % potassium sorbate/500 ppm Na2S20o 12 - 0.1 % potassium sorbate/ 650 ppm Na2S20cr l 3 - 0.1 % potassium sorbate/800 ppm Na2S20n
0.072 0.042
0.060 0.030 0.059 0.029 0.041 * 0.009 0.086* 0.026 0.072 0.014 0.086* 0.016 0.060 0.035 0.060 0.040 0.040* 0.009 0.040* 0.010
0.060 0.020
0.060 0.010
:j:Amount of change in phenolic content after 21 days of storage . . *Significantly different from control samples as calculated by Duncan's multiple range
8
account for the sharp decrease in pH values and increase in total acidity. The change influenced in other than these treatments was likely to be smaller than the sampling or analytical errors.
Effects of Treatment and Storage on Phenolic Content
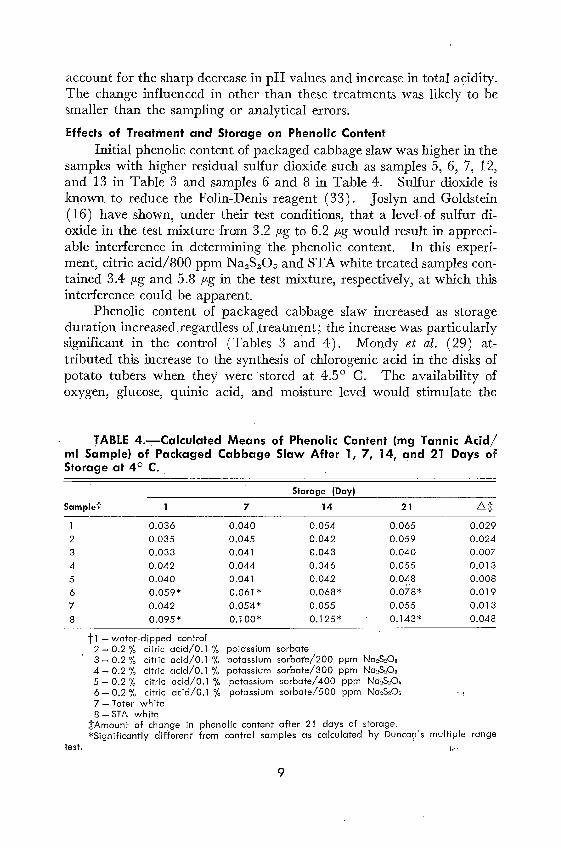
Initial phenolic content of packaged cabbage slaw was higher in the samples with higher residual sulfur dioxide such as samples 5, 6, 7, 12, and 13 in Table 3 and samples 6 and 8 in Table 4. Sulfur dioxide is known to reduce the Folin-Denis reagent (33). Joslyn and Goldstein ( 16) have shown, under their test conditions, that a level. of sulfur dioxide in the test mixture from 3.2 µg to 6.2 µg would result in appreciable interference in determining the phenolic content. In this experiment, citric acid/800 ppm Na2S205 and STA white treated samples contained 3.4 µg and 5.8 µg in the test mixture, respectively, at which this interference could be apparent.
Phenolic content of packaged cabbage slaw increased as storage durati.on increased. regardless of ,treatment; the increase was particularly significant in the control (Tables 3 and 4). Mondy et al. ( 29) attributed this increase to the synthesis of chlorogenic acid in the disks of potato tubers when they were ·stored at 4.5° C. The availability of oxygen, glucose, quinic acid, and moisture level would stimulate the
J' ABLE 4.-:--Calculated Means of Phenolic Content (mg Tannie Acid/ ml Sample) of Packaged Cabbage Slaw After 1, 7, 14, and 21 Days of Storage at 4° C.
Storage (Day)
Sam pl et 7 14 21 .6.:j:
2 3 4 5 6 7 8
test.
0.036 0.040 0.054 0.065 0.035 0.045 0.042 0.059 0.033 0.041 0.043 0.040 0.042 0.044 0.046 0.055 0.040 0.041 0.042 0.048
0.059* 0.061 * 0.068* 0.078*
0.042 0.05~* 0.055 0.055
0.095* 0.100* 0.125* 0.143*
ti - water-dipped control 2 - 0.2 % citric acid/0.1 % potassium sorbate 3 - 0.2 % citric acid/0.1 % potassium sorbal'e/200 ppm Na2S20r. 4 - 0.2 % citric acid/0.1 % potassium sorbate/300 ppm Na2S20cr 5 - 0.2 % citric acid/0.1 % potassium sorbate/ 400 ppm Na2S20;, 6 - 0.2 % citric acid/0.1 % potassium sorbate/500 ppm Na2S20n ' 1
7 - Tater white 8 -STA white
0.029 0.024 0.007 0.013 0.008 0.019 0.013 0.048
:j:Amount of change in phenolic content after 21 days of storage. *Significantly different from control samples as calculated by Dunca~'s multiple range
9
synthesis of phenolic compounds ( 6, 39). Cell damage of cabbage tissues might bring about the accumulation of phenols as was observed in virus-infected peaches ( 11), pear ( 31), and in mechanically injured potatoes ( 13), as well as result in increasing the extractability of phenols by solvent.
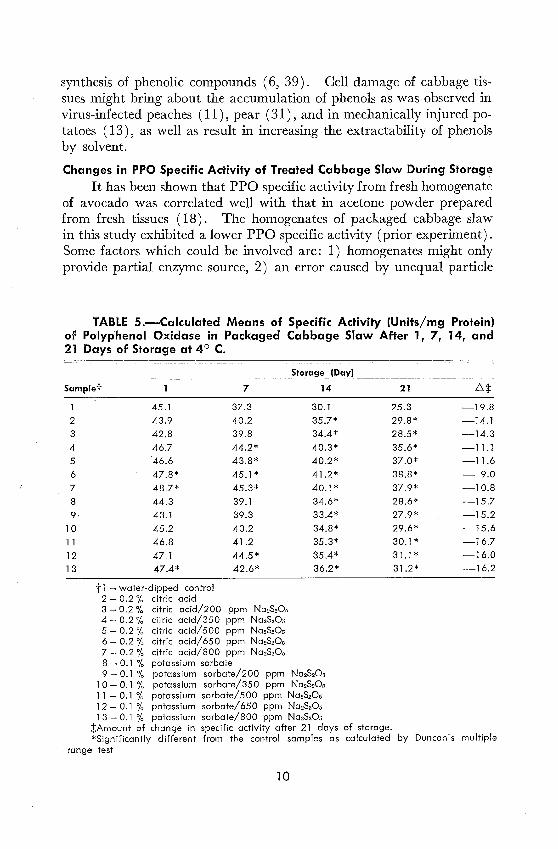
Changes in PPO Specific Activity of Treated Cabbage Slaw During Storag~ It has been shown that PPO specific activity from fresh homogenate
of avocado was correlated well with that in acetone powder prepared from fresh tissues ( 18). The homogenates of packaged cabbage slaw in this study exhibited a lower PPO specific activity (prior experiment) . Some factors which could be involved are: 1) homogenates might only provide partial enzyme source, 2) an error caused by unequal particle
TABLE 5.-Calculated Means of Specific Activity (Units/mg Protein) of Polyp'henol Oxidase in Packaged Cabbage Slaw After 1, 7, 14, and 21 Days of Storage at 4° C.
Storage (Day)
Sam pl et 7 14 21
2 3
4 5 6
7
8 9.
10 11
12 13
45.l 43.9 42.8
46.7 0
46.6
47.8*
48.7* 44.3 43.l
45.2 46.8
47.l 47.4*
t1 - water-dipped control 2 - 0.2 % citric acid
37.3 40.2 39.8
44.2* 43.8*
45.l *
45.3* 39.l 39.3
40.2
41.2 44.5* 42.6*
3 - 0.2 % citric acid/200 ppm Na2S20:; 4 - 0.2 % citric acid/350 ppm Na2S20;; 5 - 0.2 % citric acid/500 ppm Na2S20s 6 - 0.2 % citric acid/ 650 ppm Na2S205 7 - 0.2 % citric acid/800 ppm Na2S20a 8 - 0.1 % potassium sorbate
30.l 35.7* 34.4*
40.3* 40.2* 41.2*
40.l * 34.6* 33.4* 34.8* 35.3*
35.4* 36.2*
9 - 0.1 % potassium sorbate/200 ppm Na2S20o l 0 - 0.1 % potassium sorbate/350 ppm Na2S20u 11 - 0.1 % potassium sorbate/500 ppm Na2S205 12 - 0.1 % potassium sorbate/ 650 ppm Na2S205 l 3 - 0.1 % potassium sorbate/800 ppm Na2S20;
25.3 29.8* 28.5*
35.6* 37.0* 38.8* 37.9* 28.6*
27.9* 29.6* 30.l * 31.l * 31.2*
:j:Amount of change in specific activity after 21 days of storage.
.6.:1: -19.8 -14.l -14.3
-11.l -11.6
- 9.0 -10.8 -15.7 -15.2 -15.6 -16.7 -16.0 -16.2
*Significantly different from the control samples as calculated by Duncan's multiple range test.
10
distribution in the reaction mixture which often occurred during the measurements, and 3) the presence of inhibitory substances for PPO interfered with the measurements. A recent report also indicated a 20-fold increase in PPO activity in extracts of acetone powder over ·that from fresh extracts of peaches ( 7). Therefore, extracts of acetone powder as the enzyme source were suggested in this study.
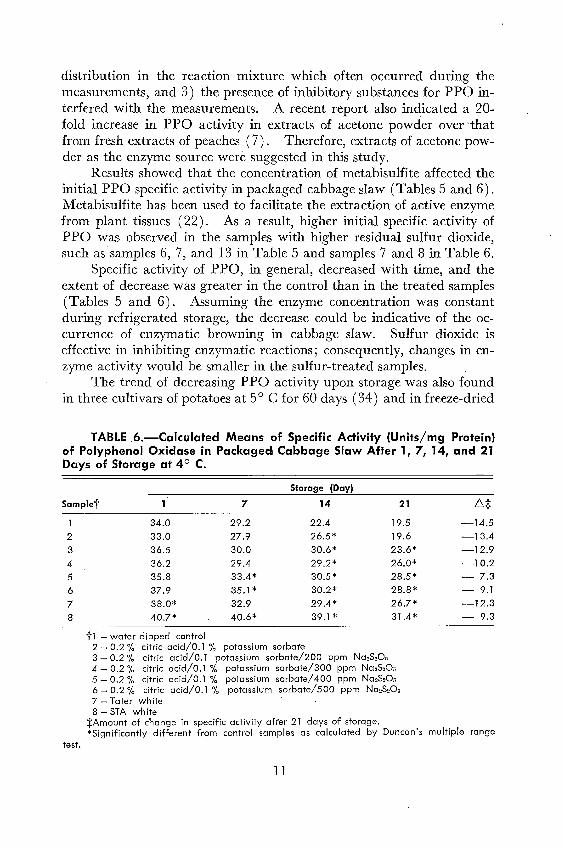
Results showed that the concentration of metabisulfite affected the initial PPO specific activity in packaged cabbage slaw (Tables 5 and 6). Metabisulfite has been used to facilitate the extraction of active enzyme from plant tissues ( 22). As a result, higher initial specific activity of PPO was observed in the samples with higher residual sulfur dioxide, such as samples 6, 7, and 13 in Table 5 and samples 7 and 8 in Table 6.
Specific activity of PPO, in general, decreased with time, and the extent of decrease was greater in the control than in the treated samples (Tables 5 and 6). Assuming the enzyme concentration was constant during refrigerated storage, the decrease could be indicative of the occurrence of enzymatic browning in cabbage slaw. Sulfur dioxide is effective in inhibiting enzymatic reactions; consequently, changes in enzyme activity would be smaller in the sulfur-treated samples.
The trend of decreasing PPO activity upon storage was also found jn three cultivars of potatoes at 5 ° C for 60 days ( 34) and in freeze-dried
TABLE 6.-Calculated Means of Specific Activity (Units/mg Protein} of Polyphenol Oxidase in Packaged! Cabbage Slaw After 1, 7, 14, and 21 Days of Storage at 4° C.
Storage (Day)
Samplet 7 14 21
2
3
4 5
6
7 8
34.0 29.2 22.4 19.5
33.0 27.9 26.5* 19.6
36.5 30.0 30.6* 23.6*
36.2 29.4 29.2* 26.0*
35.8 33.4* 30.5* 28.5*
37.9 35.1 * 30.2* 28.8*
38.0* 32.9 29.4* 26.7*
40.7* 40.6* 39.1 * 31.4*
ti - water-dipped control 2 - 0.2 % citric acid/0.1 % potassium sorbal'e 3 - 0.2 % citric acid/0.1 potasi;ium sorbate/200 ppm Na2S20a 4 - 0.2 % citric acid/0.1 % potassium sorbate/300 ppm Na2S20; 5 - 0.2 % citric acid/0.1 % potassium sorbate/ 400 ppm Na2S20r, 6 - 0.2 % citric acid/0.1 % potassium sorbate/500 ppm Na2S20;; 7 - Tater white 8-STA white
.6.:I: -14.5
-13.4 -12.9
-10.2
- 7.3 - 9.1 -12.3
- 9.3
:j:Amount of change in specific activity after 21 days of storage. *Significantly different from control samples as calculated by Duncan's multiple range
test.
11
peaches and bananas at 28° C for 60 days ( 6). However, PPO activity increased when dates were stored at 49° C for a month ( 25). The increased activity was suggested as a result of tissue disintegration which released the soluble PPO originating in the particulate fraction, or releasing the particulate fraction to determine whether this discrepancy was due to experimental errors, methodology, individual commodity or chemical treatment of commodity. Further research is certainly required.
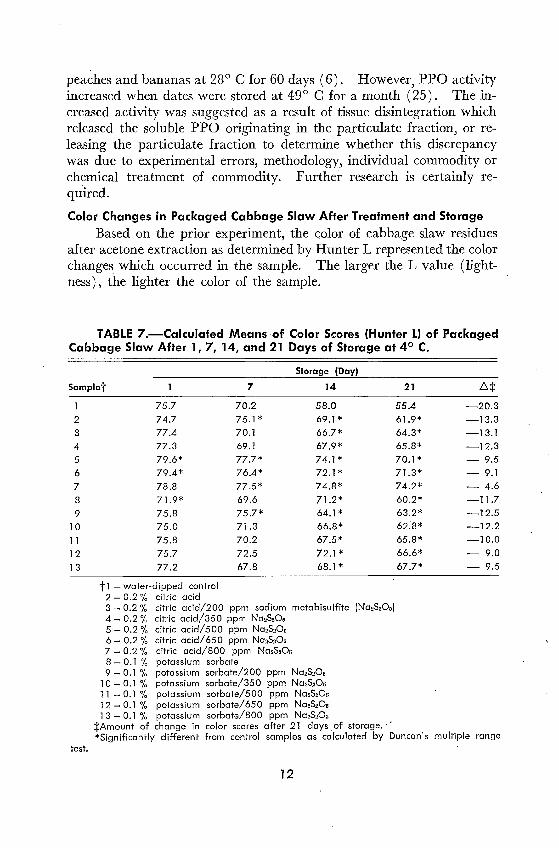
Color Changes in Packaged Cabbage Slaw After Treatment and Storage Based on the prior experiment, the color of cabbage slaw residues
after acetone extraction as determined by Hunter L represented the color changes which occurred in the sample. The larger the L value (lightness), the lighter the color of the sample.
TABLE 7.-Calculated Means ·of Color Scores (Hunter L) of Packaged Cabbage Slaw After 1, 7, 14, and 21 Days of Storage at 4° C.
Storage (Day)
Sam pl et 7 14
2 3 4 5 6 7 8 9
10 11 12 13
75.7 74.7 77.4 77.3 79.6* 79.4* 78.8 71.9* 75.8 75.0 75.8 75.7 77.2
t1 - water-dipped control 2 - 0.2 % citric acid
70.2 58.0 75.l * 69.l * 70.l 66.7* 69.l 67.9* 77.7* 74.l ~ 76.4* 72.l * 77.5* 74.8* 69.6 71.2* 75.7* 64.l * 71.3 66.8* 70.2 67.5* 72.5 72.l * 67.8 68.l *
3 - 0.2 % citric acid/200 ppm sodium metabisulfite (Na2S205) 4 - 0.2 % citric acid/350 ppm Na2S20s 5 - 0.2 % citric acid/500 ppm Na2S205 6 - 0.2 % citric acid/ 650 ppm Na2S20s 7 - 0.2 % citric acid/800 ppm Na2S20s 8 - 0.1 % potassium sorbate 9 - 0.1 % potassium sorbate/200 ppm Na2S20s
l 0 - 0.1 % potassium sorbate/350 ppm Na2S205 11 - 0.1 % potassium sorbate/500 ppm Na2S20s 12 - 0.1 % potassium sorbate/ 650 ppm Na2S205 l 3 - 0.1 % potassium sorbate/800 ppm Na2S20::;
21 -6.:j:
55.4 -20.3 61.9* -13.3 64.3* -13.l 65.8* -12.3 70.l * - 9.5 71.3* - 9.1 74.2* - 4.6 60.2* -11.7 63.2* -12.5 62.8* -12.2 65.8* -10.0 66.6* - 9.0 67.7* - 9.5
:j:Amount of change in color scores after 21 days. of storage. · · *Significantly different from control samples as calculated by Duncan's multiple range
test.
12
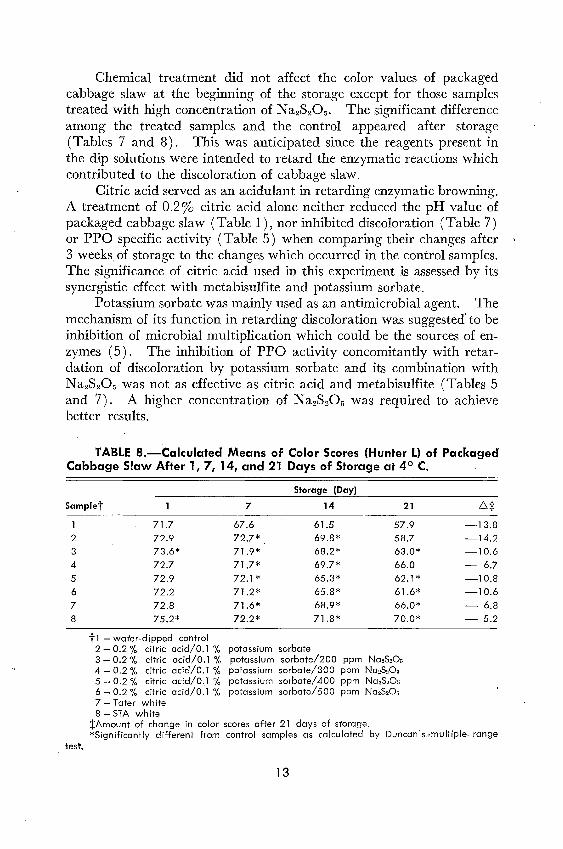
Chemical treatment did not affect the color values of packaged cabbage slaw at the beginning of the storage except for those samples treated with high concentration of N a2S20 5 • The significant difference among the treated samples and the control appeared after storage (Tables 7 and 8). This was anticipated since the reagents present in the dip solutions were intended to retard the enzymatic reactions which contributed to the discoloration of cabbage slaw.
Citric acid served as an acidulant in retarding enzymatic browning. A treatment of 0.2% citric acid alone neither reduced the pH value of packaged cabbage slaw (Table 1), nor inhibited discoloration (Table 7) or PPO specific activity (Table 5) when comparing their changes after 3 weeks. of storage to the changes which occurred in the control samples. The significance of citric acid used in this experiment is assessed by its synergistic effect with metabisulfite and potassium sorbate.
Potassium sorbate was mainly used as an antimicrobial agent. The mechanism of its function in retarding discoloration was suggested' to be inhibition of microbial multiplication which could be the sources of enzymes ( 5). The inhibition of PPO activity concomitantly with retardation of discoloration by potassium sorbate and its combination with N a2S20r, was not as effective as citric acid and metabisulfite (Tables 5 and 7). A higher concentration of N a2S205 was required to achieve better results.
TABLE 8.-Calculated Means of Color Scores (Hunter L) of Packaged Cabbage Slaw After 1, 7, 14, and 21 Days of Storage at 4° C.
Storage (Day)
Sam pl et 7 14 21 .6.:j:
2 3 4 5 6 7 8
test.
71.7 67.6 61.5 57.9 72.9 72.7* 69.8* 58.7 73.6* 71.9* 68.2* 63.0* 72.7 71.7* 69.7* 66.0 72.9 72.1 * 65.3* 62.1 * 72.2 71.2* 65.8* 61.6* 72.8 71.6* 68.9* 66.0* 75.2* 72.2* 71.8* 70.0*
t1 - water-dipped control 2 - 0.2 % citric acid/0.1 % potassium sorbate 3 - 0.2 % citric acid/O. l % potassium sorbate/200 ppm Na2S20n 4 - 0.2 % citric acid/0.1 % potassium sorbate/300 ppm Na2S20; 5 - 0.2 % citric acid/O .. l % potassium sorbate/400 ppm Na2S205 6 - 0.2 % citric acid/0.1 % potassium sorbate/500 ppm Na2S20r. 7 - Tater white 8 - STA white
:j:Amount of change in color scores after 21 days of storage.
-13.8 -14.2 -10.6
- 6.7 -10.8 -10.6
- 6.8 - 5.2
*Significantly different from control samples as calculated by Duncan's .• multiple. range
13
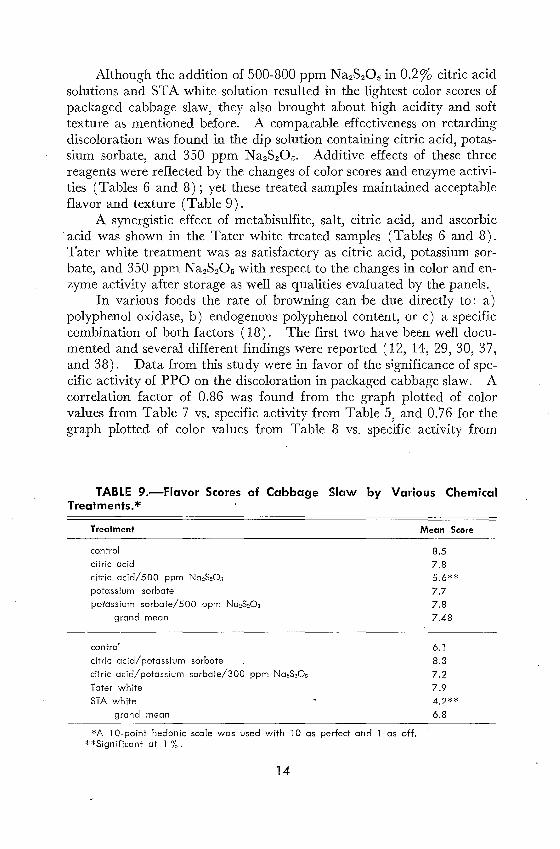
Although the addition of 500-800 ppm Na2S205 in 0.2% citric acid solutions and STA white solution resulted in the lightest color scores of packaged cabbage slaw, they also brought about high acidity and soft texture as mentioned before. A comparable effectiveness on retarding discoloration was found in the dip solution containing citric acid, potassium sorbate, and 350 ppm Na2S205. Additive effects of these three reagents were reflected by the changes of color scores and enzyme activities (Tables 6 and 8); yet these treated samples maintained acceptable flavor and texture (Table 9).
A synergistic effect of metabisulfite, salt, citric acid, and ascorbic ·acid was shown in the Tater white treated samples (Tables 6 and 8). Tater white treatment was as satisfactory as citric acid, potassium sorbate, and 350 ppm N azS205 with respect to the changes in color and enzyme activity after storage as well as qualities evaluated by the panels.
In various foods the rate of browning can be due directly to: a) polyphenol oxidase, b) endogenous polyphenol content, or c) a specific combination of both factors ( 18) . The first two have been well documented and several different findings were reported ( 12, 14, 29, 30, 37, and 38). Data from this study were in favor of the significance of specific activity of PPO on the discoloration in packaged cabbage slaw. A correlation factor of 0.86 was found from the graph plotted of color values from Table 7 vs. specific activity from Table 5, and 0.76 for the graph plotted of color values from Table 8 vs. specific activity from
TABLE 9.-Flavor Scores of Cabbage Slaw by Various Chemical Treatments.*
'treatment
control
citric acid
citric acid/500 ppm Na2S20:i potassium sorbate
potassium sorbate/500 ppm Na2S20u
grand mean
control
citric acid/potassium sorbate
citric acid/potassium sorbate/300 ppm Na2S20r.
Tater white
STA white
grand mean
*A l 0-point hedonic scale was used with l 0 as perfect and l as off. **Significant at l % .
14
Mean Score
8.5 7.8 5.6**
7.7 7.8 7.48
6.1 8.3
7.2 7.9
4.2** 6.8
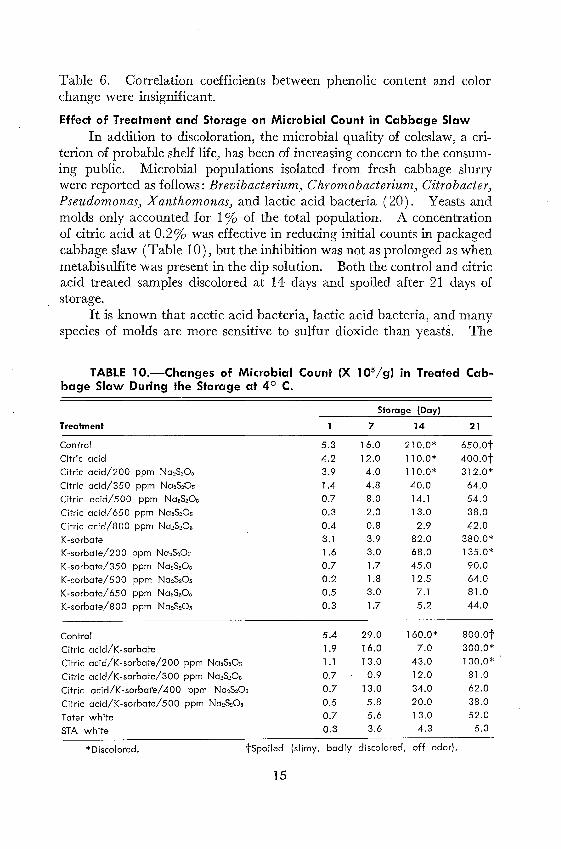
Table 6. Correlation coefficients between phenolic content and color change were insignificant.
Effect of Treatment and Storage on Microbial Count in Cabbage Slaw
In addition to discoloration, the microbial quality of coleslaw, a criterion of probable shelf life, has been of increasing concern to the consuming public. Microbial populations isolated from fresh cabbage slurry were reported as follows: Brevibact.eriumJ ChromobacteriumJ CitrobacterJ PseudomonasJ X anthomonasJ and lactic acid bacteria ( 20). Yeasts and molds only accounted for 1 % of the total population. A concentration of citric acid at 0.2% was effective in reducing initial counts in packaged cabbage slaw (Table 10), but the inhibition was not as prolonged as when metabisulfite was present in the dip solution. Both the control and citric acid treated samples discolored at 14 days and spoiled after 21 days of storage.
It is known that acetic acid bacteria, lactic acid bacteria, and many species of molds are more sensitive to sulfur dioxide than yeasts. The
TABLE 10.-Changes of Microbial Count {X 105 / g) in Treated Cabbage Slaw During the Storage at 4° C.
Storage {Day)
Treatment 7 14 21
Con1'rol 5.3 16.0 210.0* 650.0t Citric acid 4.2 12.0 110.0* 400.ot Citric acid/200 ppm Na2S20:; 3.9 4.0 110.0* 312.0* Citric acid/350 ppm Na2S20a 1.4 4.8 40.0 64.0
Citric acid/500 ppm Na2S20:; 0.7 8.0 14.1 54.0 Citric acid/ 650 ppm Na2S20:; 0.3 2.0 13.0 38.0
Citric acid/800 ppm Na2S20:; 0.4 0.8 2.9 42.0
K-sorbate 3.1 3.9 82.0 380.0*
K-sorbate/200 ppm Na2S20a 1.6 3.0 68.0 135.0*
K-sorbate/350 ppm Na2S20:; 0.7 1.7 45.0 90.0
K-sorbate/500 ppm Na2S20u 0.2 1.8 12.5 64.0
K -sorbate/ 65 0 ppm Na2S20:; 0.5 3.0 7.1 81.0
K-sorbate/800 ppm Na2S20s 0.3 1.7 5.2 44.0
Control 5.4 29.0 160.0* 800.ot
Citric acid/K-sorbate 1.9 16.0 7.0 300.0*
Citric acid/K-sorbate/200 ppm Na2S20s 1.1 13.0 43.0 130.0*
Citric acid/K-sorbate/300 ppm Na2S20:; 0.7 0.9 12.0 81.0
Citric acid/K-sorba1'e/ 400 ppm Na2S20n 0.7 13.0 34.0 62.0
Citric acid/K-sorbate/500 ppm Na2S20s 0.5 5.8 20.0 38.0
Tater white 0.7 5.6 13.0 52.0
STA white 0.3 3.6 4.3 5.3
*Discolored. tspoiled (slimy, badly discolored, off odor).
15
antiseptic action of sulfur dioxide towards microorganisms, particularly yeasts, varied with pH, temperature, initial counts, stage of growth, and other factors. With the more acidic solutions, a lower concentration of sulfur concentration was required to inhibit microbial growth ( 35). As seen from the results (Table 10), with 500 ppm or more N a2S205 in a citric acid solution, a much lower initial count was obtained. The preservative value of metabisulfite was a temporary effect. It lost its value upon oxidation to sulfate, on volatilization, or combination with other chemical constituents ( 15). In this experiment, increasing microbial counts were shown during storage time, indicating a decrease in effectiveness.
Potassium sorbate, in contrast to metabisulfite, is more potent against yeasts and molds, but less active against bacteria. The optimal effectiveness of pH can be up to 6.5 with higher activity at lower pH. Reviewing the results obtained, the bonus effect from metabisulfite on inhibition of microorganisms was obvious regardless of the pH values of the cabbage slaw. It is partially because their effect increased about 10-fold when their concentrations raised by a factor of 10 (9).
When citric acid, potassium sorbate, and Na2S205 were present in the dip solutions, their effectiveness in reducing initial counts was accentuated (Table 10). Three respective initial counts for citric acid treated, potassium sorbate treated, citric acid and potassium sorbate treated packaged cabbage slaw were 4.2 x 10⁵ I g, 3.1 x 10⁵ I g and 1.9 x 10⁵ / g respectively. For citric acid/200 ppm Na2S205, potassium sorbate/200 ppm Na2S205 and citric acid/potassium sorbate/200 ppm Na2S205, the counts were 3.9 x 10⁵ / g, 1.6 x 10⁵ / g and 1.1 x 10⁵ / g respectively.
Tater white, a commercial whi.tener, not only reduced the initial counts (Table 10) in packaged cabbage slaw but also preserved appear .. ance. The effect of acid, salt, ascorbate, and metabisulfite appeared to be synergistic. Differences in counts from this treatment persisted throughout the entire storage period.
Changes in Oxygen Uptake by Treated Cabbage Slaw During Storage
The determination of residual oxygen in the headspace of the container was originally intended to study the significance of oxygen on the extent of discoloration. Results (Table 11) showed a marked oxygen reduction in the containers of control, citric acid, and citric acid/200 ppm N a2S205 treated samples. Packaged cabbage slaw is living tissues and should continue to respire in storage under the conditions used in this experiment. Therefore, the suppression of oxygen uptake 'by chemical treatment might involve changes in the respiratory mechanism resulting from such chemicals.
Citric acid was found to be a respiratory stimulant in castor beans
16
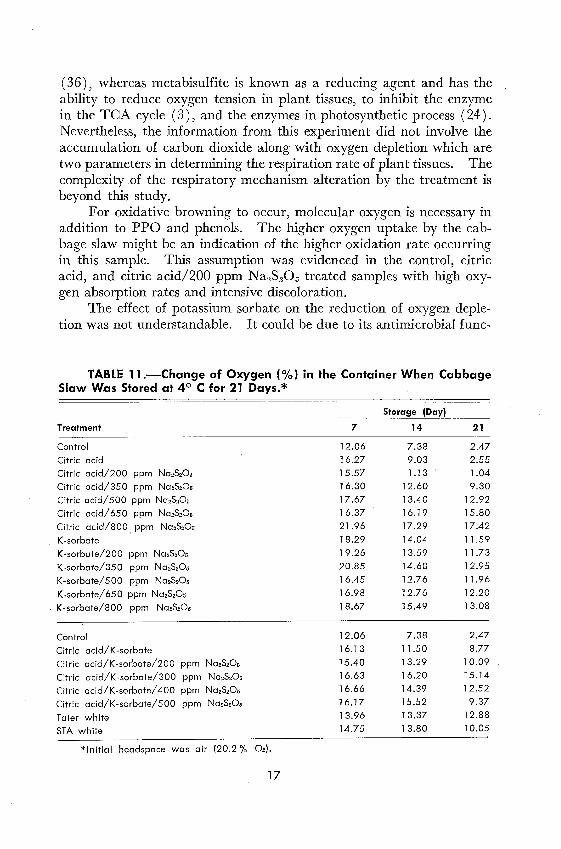
(36), whereas metabisulfite is known as a reducing agent and has the ability to reduce oxygen tension in plant tissues, to inhibit the enzyme in the TCA cycle ( 3), and the enzymes in photosynthetic process ( 24) . Nevertheless, the information from this experiment did not involve the accumulation of carbon dioxide along with oxygen depletion which are two parameters in determining the respiration rate of plant tissues. The complexity of the respiratory mechanism alteration by the treatment is beyond this study.
For oxidative browning to occur, molecular oxygen is necessary in addition to PPO and phenols. The higher oxygen uptake by the cabbage slaw might be an indication of the higher oxidation rate occurring in this sample. This assumption was evidenced in the control, citric acid, and citric acid/200 ppm N a2S205 treated samples with high oxygen absorption rates and intensive discoloration.
The effect of potassium sorbate on the reduction of oxygen depletion was not understandable. It could be due to its antimicrobial func-
TABLE 11 .-Change of Oxygen { % } in the Container When Cabbage Slaw Was Stored at 4° C for 21 Days.*
Storage (Day)
Treatment 7 14 21
Control 12.06 7.38 2.47
Citric acid 16.27 9.03 2.55 Citric acid/200 ppm Na2S20;; 15.57 1.13 1.04
Citric acid/350 ppm Na2S20u 16.30 12.60 9.30
Citric acid/500 ppm Na2S20u 17.67 13.40 12.92
Citric acid/ 650 ppm Na2S20u 16.37 16.19 15.80
Citric acid/800 ppm Na2S20u 21.96 17.29 17.42
K-sorbate 18.29 14.04 11.59
K-sorbate/200 ppm Na2S20s 19.26 13.59 11.73
K-sorbal'e/350 ppm Na2S20o 20.85 14.60 12.95
K-sorbate/500 ppm Na2S20o 16.45 12.76 11.96
K-sorbate/ 650 ppm Na2S20o 16.98 12.76 12.20
K-sorbate/800 ppm Na2S20.; 18.67 15.49 13.08
Control 12.06 7.38 2.47
Citric acid/K-sorbate 16.13 11.50 8.77
Citric acid/K-sorbate/200 ppm Na2S20u 15.40 13.29 l 0.09
Citric acid/K-sorbate/300 ppm Na2S20u 16.63 16.20 15.14
Otric acid/K-sorbate/ 400 ppm Na2S205 16.66 14.39 12.52
Citric acid/K-sorbate/500 ppm Na2S20s 16.17 15.52 9.37
Tater white 13.96 13.37 12.88
STA white 14.75 13.80 l 0.05
*Initial headspace was air (20.2 % 02).
17
tion if part of the oxygen depletion observed was the result of microbial respiration ( 25) . However, oxygen depletion in dates accounted for enzymatic browning, seed respiration, and tissue respiration but not mi-
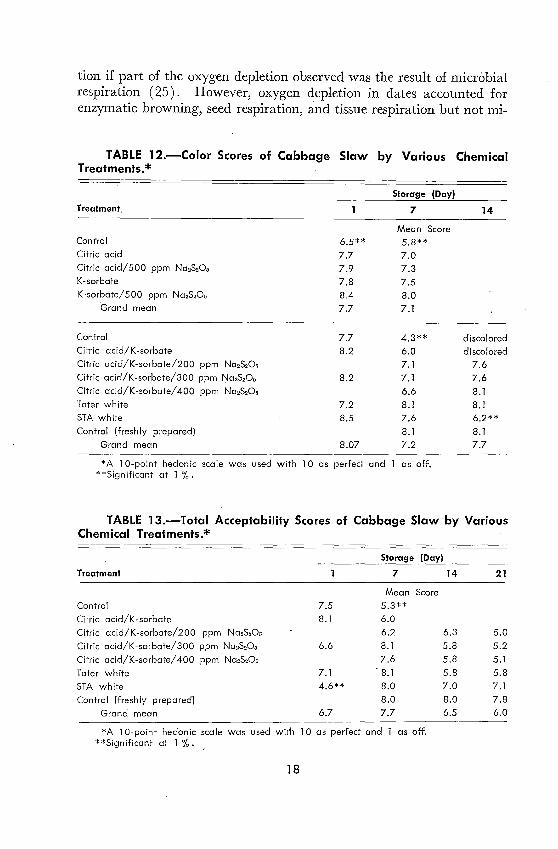
TABLE 12.-Color Scores of Cabbage Slaw by Various Chemical Treatments.*
Treatment.
Conl'rol Citric acid
Citric acid/500 ppm Na2S20s K-sorbate
K-sorbate/500 ppm Na2S205 'Grand mean
Control
Citric acid/K-sorbate Citric acid/K-sorbate/200 ppm Na2S20s Citric acid/K-sorbate/300 ppm Na2S20i;
Citric acid/K-sorbate/ 400 ppm Na2S205 Tater white STA white Control (freshly prepared)
Grand mean
6.5** 7.7 7.9 7.8 8.4
7.7
7.7 8.2
8.2
7.2 8.5
8.07
Storage (Day)
7
Mean Score 5.8** 7.0 7.3 7.5 8.0 7.1
4.3** 6.0 7.1 7.1 6.6 8.1 7.6
8.1 7.2
*A l 0-point hedonic scale was used with l 0 as perfect and as off. **Significant at l % .
14
discolored discolored
7.6 7.6 8.1
8.1 6.2** 8.1 7.7
TABLE 13.-Total Acceptability Scores of Cabbage Slaw by Various Chemical Treatments.*
Storag.e (Day)
Treatment 7
Mean Score
Control 7.5 5.3** Citric acid/K-sorbate 8.1 6.0 Citric acid/K-sorbate/200 ppm Na2S20i; 6.2
Citric acid/K-sorbate/300 ppm Na2S20i; 6.6 8.1
Citric acid/K-sorbate/ 400 ppm Na2S20i; 7.6
Tater white 7.1 8.1
STA white 4.6** 8.0
Control (freshly prepared) 8.0
Grand mean 6.7 7.7
*A l 0-point hedonic scale was used wil'h 10 as perfect and 1 as off. **Significant at l % .
18
14
6.3 5.8 5.8 5.8 7.0 8.0 6.5
21
5.0 5.2
5.1 5.8 7.1 7.8 6.0
crobial respiration ( 25), because the preservative (ethylene oxide) did not reduce the rate of oxygen depletion.
Sensory Evaluation
Color, flavor, texture, and total acceptability were evaluated by panelists. Results showed a color difference between the control and other treated samples (Table 12). Treatments were effective in maintaining lighter color during storage, with the evidence in accordance with the results obtained from objective measurements (Hunter L).
Judges indicated a flavor inferiority in the sample treated with 500 ppm Na2S20 5 in citric acid solution and the sample treated with STA white solution (Table 9). They described it as tart and sour in the former and bitter with undesirable flavor .in the latter. This is the drawback of using high concentrations of Na2S20 5, even though the color in these samples was very desirable. Neither the treatment nor the storage could change the texture of the product when judged by the panels.
Determination of total acceptability was based on the color, flavor, and texture of the product. ·Results (Table 13) revealed a decrease in acceptability in all the samples. However, the treated samples were still acceptable after 3 weeks of refrigerated storage. A deviation of the evaluation was observed in STA white treated samples at the first test and the second test. This could be attributed to the fact that the former was based on color and flavor, while the latter was based on color and odor.
REFERENCES 1. AOAC. 1975. Official Methods of Analysis. 12th ed. Assoc.
Off. Anal. Chem., Washington, D. C 2. APHA. 1972. Standard Methods for the Examination of Dairy
Products. 12th ed. Amer. Public Health Assoc., Inc., Washington, D. C.
3. Beevers, H. 1960. Respiratory Metabolism in Plants. 1st ed. Row, Peterson and Co., Evanston, Ill.
4. Chen, L. M. and A. C. Peng. 1978. Kinetic Studies of Poly-· phenol Oxidase from Hi-Dri Cabbages. In Food· Processing and Technology 1978: A Summary of Research, pp. 48-52. Res.Gire. 240, Ohio Agri. Res. and Dev. Ctr., Wooster.
5. Chichester, p. F. 1975. Antimicrobial Food Additives. In Handbook of Food Additives, Furia, R. E. ed., p. 225. CRC Press, Cleveland, Ohio.
19
6. Draudt, H. N. and Y. H. Huang. 1966. Effect of Moisture Content of Freeze-dried Peaches and Bananas on Changes During Storage Related to Oxidative and Carbonyl Amine Browning. J. Agri. Food Chem., 21 :194.
7. Flurkey, W. H. and J. J. Jen. 1978. Peroxidase and Polyphenol Oxidase Activities in Developing Peaches. J. Food Sci., 33: 1827.
8. Francis, F. J. 1960. Discoloration and Quality Maintenance in Coleslaw. J. Amer. Soc. Hort. Sci., 75 :449.
9. Freese, E .. C., C. W. Sheu, and E. Galliers. 1973. Function of Lipophilic ,Acids as Antimicrobial Food Additives. Nature, 241 (2) :321.
10. Friedman, B. A. 1951. Vacuum Cooling of Prepackaged Spinach, Coleslaw and Mixed Salads. Proc., Amer. Soc. Hort. Sci., 58:279.
11. Geissman, T. A. 1956. The Flavonoid Constituents of Normal and Virus Infected Peach and Cherry Leaves. Arch. Bio chem. Biophys., 56:97.
12. Guadagni, D. G., D. G. Sorber, and J. S. Wilbur. 1949. Enzymatic Oxidation of Phenolic Compounds in Frozen Peaches. Food Technol., 3 :359.
13. Haard, N. F. 1976. Characteristics of Edible Plant Tissues. In Principle of Food Science, Fennema, D.R., ed., Part I, Food Chemistry, p. 677. Marcel Dekker, Inc., New York, N. Y.
14. Harel, E., A. M. Mayer, and Y. Shain. 1966. Catechol Oxidase, Endogenous Substrates and Browning in Developing Apples. J. Sci. Food Agr., 17 :389.
15. Joslyn, M. A. and J. R. S. Braverman. 1954. The Chemistry and Technology of the Pretreatment and Preservation of Fruit and Vegetable Products with Sulfur Dioxide and Sulfites. Adv. Food Res., 5:97.
16. Joslyn, M. A. and J. L. Goldstein. 1964. Changes in Phenolic Content in Persimmons During Ripening and Processing. J. Agri. Food Chem., 12 :511.
17. Joslyn, M.A. and J. D. Ponting. 1951. Enzyme-catalyzed Oxidative Browning of Fruit Products. Adv. Food Res., 3: 1.
18. Kahn, V. 1975. Polyphenol Oxidase Activity and Browning of Three Avocado Vari'eties. J. Sci. Food Agr., 26:1319.
19. Kaufman, J. and J. Lutz. 1954. Lengthening the Shelf-life of Packaged Coleslaw. Pre-Pack-Age, 8(1) :23.
20
20. King, A. D., H. D. Michener, H. G. Bayne, and M. Keiko. 1976. Microbial Studies on Shelf-life of Cabbage and Coleslaw. Appl. Environ. Microbial., 31 (3) :404.
21. Larmond, E. 1977. Laboratory Methods for Sensory Evaluation of Food. Res. Br., Canada Dept. of Agr., Bull 1637:15, 17.
22. Loomis, W. D. 1974. Overcoming Problems of Phenolics and Quinones in the Isolation of Plant Enzymes and Organells. In Methods in Enzymology, S. Fleischer and L. Packer, eds., Vol. XXXI, p. 528. Academic Press, New York, ~· Y.
23. Lowry, 0. H. 1951. Protein Measurement with the Falin-Phenol Reagent. J. Biol. Chem., 193 :265.
24. Luttge, U., C. B. Osmond, and E. Ball. 1972. Bisulfite Compounds as Metabolic Inhibitors: Nonspecific Effects on Membranes. Plant Cell Physiol.; 13 :505.
25. Maier, V. P. and F. H. Schiller. 1961. Dates. II. Some Chemical Changes Associated with Deterioration. J. Food Sci., 26 :322.
26. Mathew, A. G. and H. A. B. Parpia. 1971. Food Browning as a Polyphenol Reaction. Adv. Food Res., 19:75.
27. McBean, D. M., M.A. Mayer, and F. S. Nury. 1971. Dehydrated Fruits. In Biochemistry of Fruits and Their Products, Hulme, A. C., ed., Vol. IL, p. 637. Academic Press, New York, N. Y.
28. Miller, R. G. 1966. Normal Univariate Technique Simultaneous Statistical Inference, p. 81. McGraw-Hill Book Company, New York, N. Y.
29. Mondy, N. I., S. B. Gedde-Dahl, and E. 0. Mobley. 1966. Effect of Storage Temperature on the Cytochrome Oxidase and Polyphenol Oxidase Activities and Phenolic Content of Potatoes. J. Food Sci., 31 :32.
30. Mondy, N. I., B. P. Kelin, and L. I. Smith, 1960. The Effect of Maturity and Storage on Phenolic Content, Enzymatic Activity and Discoloration of Potatoes. Food Res., 25 :693.
31. Ranadive, A. S. and N. F. Haard. 1971. Changes in Polyphenolics on Ripening of Selected Pear Varieties. J. Sci. Food Agr., 22:86.
32. Shapiro, J. E. and J. A. Holden. 1960. Effect of Antibiotic and Chemical Dip on the Microflora of Packaged Salad Mix. Appl. Micro biol., 8 : 341.
33. Snell, F. D. and C. T. Snell. 1948. Colorimetric Methods of Analysis. 3rd ed., Vol. III, Part I, p. 104. Van Nostrand, New York, N. Y. Cited from Joslyn, M.A. and J. L. Goldstein, 1964.
21
Changes in Phenolic Content in Persimmons During Ripening and Processing. J. Agri. Food Chem., 12:511.
34. Vamos-Vigyazo, L., L. Vas, and N. Kiss-Kutz. 1974. Part II. Some Characteristics of the Enzyme, its Amount in Different Varieties and its Changes on Storage. Acta Alimentaria, 3 ( 1) :49. ·
35. Vas, K. and M. Ingram. 1949. Preservation of Fruit Juice with Less Sulfur Dioxide. Food Mfg., 24:414.
36. Walker, D. A. and H. Beevers. 1956. Some Requirement for Pyruvate Oxidation by Plant Mitochondria Preparation. Biochem. J., 62:120.
37. Walker, J. R. C. 1962. Phenolic Acids in "Cloud" and Normal Tomato Fruit Wall Tissues. J. Sci. Food Agr., 13 :363.
38. Weurman, C. and T. Swain. 1955. Changes in the Enzymatic Browning of Bramley's Seedling Apples During Their Development. J. Sci. Food Agr., 6:186.
39. Zucker, M. and C. C. Levy. 1959. Some Factors Which Affect the Synthesis of Chlorogenic Acid in Disks of Potato Tuber. Plant Physiol., 34:108.
22
BETTER LIVING IS THE PRODUCT of. research at the Ohio Agricultural Research and Development Center. All Ohioans benefit from this product.~
Ohio's farm families benefit from the results of agricultural research translated into increased earnings and improved living conditions. So do the families of the thousands of workers employed in the firms making up the state's agribusiness complex.
But the greatest benefits of agricultural research flow to the millions of Ohio consumers. They enjoy the end products of agricultural science-the world's most wholesome and nutritious food, attractive lawns, beautiful ornamental plants, and hundreds of consumer products containing ingredients originating on the farm, in the greenhouse and nursery, or in the forest.
The Ohio Agricultural Experiment Station, as the Center was called for 83 years, was established at The Ohio State University, Columbus, in 1882. Ten years later, the Station was moved to its present location in Wayne County. In 1965, the Ohio General Assembly passed legislation changing the name to Ohio Agricultural Research and Development Center-a name which more accurately reflects the nature and scope of the Center's research program today.
Research at OARDC deals with the improvement of all agricultural production and marketing practices. It is concerned with the development of an agricultural product from germination of a seed or development of an embryo through to the consumer's dinner table: It is directed at improved human nutrition, family and child development, home management, and all other aspects of family life. It is geared to enhancing and preserving the quality of our environment.
Individuals and groups are welcome to visit the OARDC, to enjoy the attractive buildings, grounds, and arboretum, and to observe first hand research aimed at the goal of Better Living for All Ohioans!
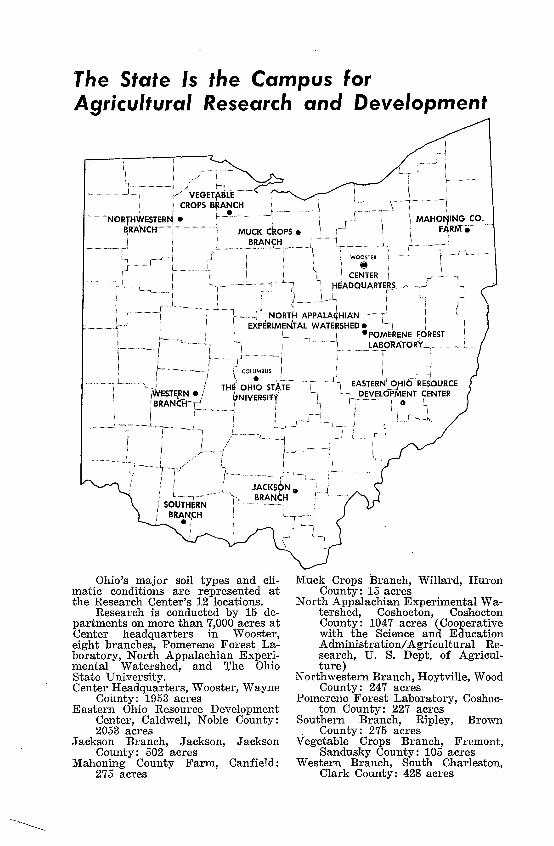
The State Is the Campus for Agricultural Research and Development
// ~ ./ ! ...... , . / VEGETA8U: .......... ..
=·i"'
' CROPS BRANCH ' ............. N.ORJHWESTER~ • ~ ..... !.-.---.. . ;.
~R~NCH_ ......... J ............................ J MUCK C~OPS e
................... ·-· .... "l".J .......... . BR~~.£t.:I, ... ~ ............ J
...... { L
, CENTER , t:tEAD.QUARTE~.$... .. . .. ~ ... ..l
... J.. ···'·--= Y''' • .;.
['" ............ -~ .......... """T'"" ........... , ........... { NORT~ APPALActHIAN
............. ~-~-k ·' Ex·fi·ERIMENTAL WATERSHED• : , ' ,.... ' •poMERENE FOREST Li .... ) LA~Q°kATORY.. " ..... .-~ .... i~.
i.~-.,....,tt,,.•••••rn:•J .....
"": r1 COLUMBUS i ', • (., ..........
\ ..... i,ESTERN e j THE OHIO STATE ! • · 1:1.'· NIVERS!Tf
' ""C"T.r-~·-~•o•-•"'t"'J.''"''
i L..~ ..... ..i .• 1 EASTERNl...c::>,\Ht6"; R~SOURCE
DEVELOPMENT CENTER .................... , ... ] ct ,,,,
' j BRANC·H .. r.'..... .......... .. .... )
,.,, .......... .i "!.... ... \ ! ; · .......... .i·:,
! ....... r . t""' ........ ~
................... rt
Ohio's major soil types and climatic conditions are represented at the Research Center's 12 locations.
Research is conducted by 15 departments on more than 7,000 acres at Center headquarters in Wooster, eight branches, Pomerene Forest Laboratory, North Appalachian Experimental Watershed, and The Ohio State University. Center Headquarters, Wooster, Wayne
County: 1953 acres Eastern Ohio Resource Development
Center, Caldwell, Noble County: 2053 acres
Jackson Branch, Jackson, Jackson County: 502 acres
Mahoning County Farm, Canfield: 275 acres
Muck Crops Branch, Willard, Huron County: 15 acres
North Appalachian Experimental Watershed, Coshocton, Coshocton County: 1047 acres (Cooperative with the Science and Education Administration/ Agricultural Research, U. S. Dept. of Agriculture)
Northwestern Branch, Hoytville, Wood County: 247 acres
Pomerene Forest Laboratory, Coshocton County: 227 acres
Southern Branch, Ripley, Brown . County: 275 acres
Vegetable Crops Branch, Fremont, Sandusky County: 105 acres
Western Branch, South Charleston, Clark County: 428 acres