proceedings af the 1979 mechanical and magnetic energy
TRANSCRIPT
U.$= CIPAUTtWMT OF ENEROYDK*iibn df Energy Storage Systems
CoorcHnqted by ttie PacMIc NorthwestLaboratory for the AnMaht Secretary forConservation and Solar Energy
Proceedings af the 1979Mechanical and MagneticEnergy Storage Contractors'Review Meeting
August 1979Washington, D.C.
Published December 1979
fliSTRlBUTlOK OF THIS OQCUMtKT IS UNLUHTGl

Dist. Category UC-94b
U.S. DEPARTMENT OF ENERGYDivision of Energy Storage SystemsWashington, D.C. 2O545
Coordinated by the Pacific NorthwestLaboratory for the Assistant Secretary forConservation and Solar Energy
Proceedings of the 1979Mechanical and MagneticEnergy Storage Contractors'Review Meeting
August 1979Washington, D.C.
Published December 1979 Ni!i«i« iho United Slates G
comp'olents';. c usefulne
jf ine United Stales Govern™
v of Iheir employe". '™ k ( ; s
liabil.product
y snee;ti
recommendalion. cr favoring by the Unitedi ocinions of authors expreswd herein do no!
DISTRIBUTION Of THIS DOCUMENT IS U H U W T J l

TABLE OF CONTENTS
Papers are grouped by session in the order they were presented at the conference.
SUPERCONDUCTING MAGNETIC ENERGY STORAGE
F.R. Fickett and A.F. Clark, National Bureau of Standards, "Standards forSuperconductor" 3
R.I. Schermer, Los Alamos Scientific Laboratory, "The Stabilization Unitfor Bonneville Power Administration" 9
John R. Purcell, General Atomic Company, "Designing the Magnet for theBonneville Power Administration" 21
J.D. Rogers, Los Alamos Scientific Laboratory, "1-GWh Diurnal Load-LevelingSuperconducting Magnetic Energy Storage System Reference Design" 27
S.W. Van Sciver and R.W. Boom, University of Wisconsin, "Component Developmentof Large Magnetic Storage Units" 47
J.J. Skiles and J.B. Prince, Jr., Energy Research Center and University ofWisconsin, "Electrical Engineering Considerations for Diurnal SuperconductingStorage Devices" 59
Bette Winer, Arthur D. Little, Inc., "An Evaluation of SuperconductingMagnetic Energy Storage" 68
O.K. Mawardi, H. Nara, and M. Grabnic, Case Western Reserve University,"A Force Balanced Magnetic Energy Storage System" 81
Carl H. Rosner, Intermagnetics General Corporation, "Energy Storage inSuperconductive Magnets: A Demonstration" 91
COMPRESSED AIR ENERGY STORAGE
W.'1' Luscotoff, Pacific Northwest Laboratory, "Compressed Air Energy StorageProgram Overview" 99
Paul F. Gnirk, Terje Brandshaug, Gary D. Callahan, Joe L. Ratigan,RE/SPEC Inc., "Numerical Studies of Compensated CAES Caverns in Hard Rock" ... 105
A.F. Fossura, RE/SPEC Inc., "Laboratory Testing of Hard Rock Specimens forCompensated CAES Caverns" 119
J.A. Stottlemyre, R.L. Erikson, and R.P. Smith, Pacific NorthwestLaboratory, "Permeability and Friability Alterations in Quartoze Sand-stones Exposed to Elevated Temperature Humidified Air" 129
L.E. Wiles, Pacific Northwest Laboratory, "Two-dimensional Fluid andThermal Analysi s of Dry Porous Rock Reservoi rs for CAES" 139
J.D. Blacic, P.H. Halleck, P. D'Onfro, Los Alamos Scientific Laboratory,"Thermo-nechanical Properties of Galesvilie Sandstone" 149
J.R. Friley, Pacific Northwest Laboratory, "Structural Response of aGeneric Porous Site" 157

Compressed Air Energy Storage (cont.)
R.L. Thorns, Louisiana State University, "Laboratory Studies of Salt Responseto CAES Conditions" 167
T.J. Doherty, Pacific Northwest Laboratory, "Complementary and PotentialCAES Field Studies" 175
R.T. Allemann and M.K. Drost, Pacific Northwest Laboratory, "AdvancedConcept Studies" 183
S.C. Schulte, Pacific Northwest Laboratory, "The Economics of ThermalEnergy Storage for Compressed Air Energy Storage Systems" 191
Albert J. Giramonti, United Technologies Research Center, "PreliminaryEvaluation of Coal-fired Fluid Bed Combustion-augmented Compressed AirEnergy Storage Power Plants" 199
UNDERGROUND PUMPED HYDRO STORAGE
John Degnan, Allis-Chalmers Corporation, "Comparison of Single, Double andMultistage Pump/Turbine Equipment for Underground Pumped Storage Service 217
S.W. Tarn, A.A. Frigo and C.A. Blomquist, Argonne National Laboratory,"Turbomachinery Considerations for Underground Pumped HydroelectricStorage Plants (UPHS)" 229
Alexander Gokham, Nail Ozboya, EDS Nuclear Inc., "Assessment of theApplication Potential of the Pumps With Controlled Flow Rate forEnergy Storage" 247
SOLAR MECHANICAL ENERGY STORAGE
H.M. Dodd, B.C. Caskey, and H.E. Schildnecht, Sandia Laboratories,"Mechanical Energy Storage for Photovoltaic/Wind Project" 265
Francis C. Younger, William M. Brobeck and Associates, "FlywheelEnergy Storage System Concept for a Residential Photovoltaic Supply" 273
Theodore W. Place, AiResearch Manufacturing Company of California,"Residential Flywheel with Wind Turbine Supply" 287
Arthur J. Mansure, The BDM Corporation, "Feasibility Study of a SmallPumped Aquifer Storage System for Solar and Wind Energy" 295
L.B. McEwen and J.W. Swain, Jalar Associates, "Industrial CompressedAir Applications for Solar Energy Conversion/Storage Devices" 303
Harold E. Schildknecht, Sandia Laboratories, "An Overview of Contractswith Colleges and Universities for Advanced Flywheel Concepts" 309
Alan R. Millner, MIT Lincoln Laboratory, "A Flywheel Energy Storageand Conversion System for Photovoltaic Applications" 319
n

FLYWHEELS
Thomas M. Barlow, Lawrence Livermore Laboratory, "Mechanical Energy StorageTechnology Project : Project Summary" 329
R.O. Woods, Sandia Laborator ies, "Sandia A c t i v i t i e s Overview" 331
Charles W. Ber t , Univers i ty of Oklahoma, "Rotor Dynamics: Dynamics ofRim-type Flywheels Supported by Flexib le Bands" 339
A. Keith M i l l e r , Sandia Laborator ies, "Recent Spin Tests of Two CompositeWagon Wheel Flywheels" 347
A.R. Nord, Sandia Laborator ies, "Modal Determination—Composite Flywheels" 357
J.A. Rinde and Ed Wu, Lawrence Livermore Laboratory, "LLL Materials Programfor Fiber-composite Flywheels" 363
David L. Satchwell , AiResearch Manufacturing Company of Ca l i f o rn i a , "High-energy-density Flywheel" 375
Satish U. Kulkarn i , Lawrence Livermore Laboratory, "Composite-laminateFlywheel-rotor Development Program" 387
R.P. Nimmer, General E lec t r i c Company, "Laminated Flywheel Disc wi thFilament Wound Outer Ring" 399
David W. Rabenhorst, Applied Physics Laboratory, The Johns HopkinsUnivers i ty , "Demonstration o f a Low Cost Flywheel i n an Energy StorageSystem" 407
R.S. Steele, Union Carbide Corporation, "Oak Ridge Flywheel EvaluationLaboratory" 415
C.J. Heise, L . I . Amstutz, U.S. Army MERADCOM, "Army Flywheel Program" 423
Douglas L. Kerr, General E lec t r i c Company, "Appl icat ion of Ine r t i aWelding Technology to Steel Disc-type Flywheels" 431
Norman H. Beachley and Andrew A. Frank, Univers i ty of Wisconsin-Madison,"Mechanical Continuously-variable Transmission Designs f o r FlywheelEnergy-storage Automobiles" 439
Wil l iam T. Crothers, Lawrence Livermore Laboratory, "Vehicular Appl icat ionsof Mechanical Energy Storage—FY79" 44g
L.O. Huppie, Eaton Corporation, "Regenerative Braking through ElastomericEnergy Storage" 457
Arthur E. Raynard, AiResearch Manufacturing Company of Ca l i f o rn ia ,"Electr ic/Flywheel Powered Postal Vehicle Development Program" 465
E.L. Lustenader, I .H. E d e l f e l t , D.W. Jones, A.B. Plunket t , E. Richter, andF.G. Turnbu l l , General E lec t r i c Company, "Regenerative Flywheel EnergyStorage System" 479
i i i

Flywheels (cont.)
Leo V. Norrup, AiResearch Manufacturing Company of California, "LLL/AiResearchAdvanced Energy Storage Unit Development Program" 487
Andrew A. Frank and Norman H. Beachley, University of Wisconsin-Madison,"Comparison of Alternative Heat Engines for Flywheel Mechanical TransmissionAutomobiles" 501
APPENDICES
List :f Speakers and Session Chairmen 513
List of Attendees 517
iv

SESSION 1: SUPERCONDUCTING MAGNETIC ENERGY STORAGE

PROJECT SUMMARY
Project Title:
Principal Investigators:
Organization:
Project Goals:
Project Status:
Contract Number:
Contract Period:
Funding Level:
Funding Source:
"Development of Standards for SuperconductingMaterials and Superconductors"
A. F. Clark and F. R. Fickett
National Bureau of StandardsBoulder, CO 80303(303) 499-1000, X3253
The superconductor standards program is acooperative effort funded by: NBS and fourdivision of DOE (Energy Storage, Fusion Energy,High Energy Physics, and Hagnetohydrodynamicsthrough the Francis Bitter National MagnetLaboratory). The goal of the program is toarrive at a set of voluntary standards formodern practical superconductors that will beacceptable to both manufacturers and users.The need for such a set of standards increasesas more and more large superconducting magnetsystems are designed and constructed. Theprimary areas in which standards are now beingdeveloped are: critical current, criticaltemperature, critical field, and physical andmechanical properties of conductors.
Four papers presenting interim definitions forsuperconducting parameters have been completed.Three have been published.
An ASTM subcommittee on superconductors hasbeen formed and task groups appointed.
A national survey of measurement techniques hasbeen made.
Extensive studies have been made of the effecton results of various practices in commonmethods of measuring critical current.
A comparison of three techniques for measuringcritical temperature (calorimetric, suscep-tibility and resistive) has been made.
02-79-ET-26603.000
FY'79
$185K
U.S. Department of Energy

STANDARDS FOR SUPERCONDUCTORS
F. R. Fickett and A. F. ClarkThermophysical Properties Division
National Bureau of StandardsBoulder, Colorado 80303
ABSTRACT
This report describes the present state of the superconductor standards program and in-cludes a brief historical introduction. The need for standards in this area is described withparticular attention paid to the need for consensus among all interested parties and our tech-niques for achieving it. Early results from the experimental research projects are presentedand the scope of the entire program is outlined.
INTRODUCTION
The superconductor standards program is a cooperative effort funded by: NBS, four divi-sions of DOE (Energy Storage, Fusion Energy, High Energy Physics, and Magnetohydrodynamicsthrough the Francis Bitter National Magnet Laboratory), and the Air Force Aeropropulsion Lab-oratory. The goal of the program is to arrive at a set of voluntary standards for modern prac-tical superconductors that will be acceptable to both manufacturers and users. The need forsuch a set of standards increases as more and more large superconducting magnet systems aredesigned and constructed.
The basis for the program was set several years ago at meetings called by NBS at The ASMConference on the Manufacture of Superconducting Materials and the Applied SuperconductivityConference, 1976. The manufacturers, users, and researchers present all made extensive sugges-tions as to how the work should proceed. In the years that followed a small program was ini-tiated, with NBS funding, to make a more formal survey of the needs and desires of the researchcommunity. From this study and several related meetings, the following conclusions were drawn:
For all concerned, standards were both necessary and desirable.
The small size and financial position of the wire manufacturing industry i(and Its competitive nature) precluded industrial developments of standards in areasonable period of time.
The NBS Cryogenics Division (now Thermophysical Properties Division) was an "unbiasedthird party" with the charter, the desire, and the expertise to carry out a supercon-ductor standards program of a sufficient size that significant progress could be madeIn a time span of several years.
The problem, as always, was funding.
Fortunately, there appeared to be agreement with our conclusions among a variety of agen-cies, and cooperative funding of the program as described above was arranged. The full projectstarted In m1d-FY 79.
The development and promulgation of standards can be a very sensitive issue, for soundfinancial reasons. Because of this, our program relies heavily on continuing interactions

between all interested parties to assure that, as far as possible, a consensus will be devel-oped on any proposed standard. To this end a portion of the funding is subcontracted to eachof the U.S. wire manufacturers to promote*Wevelopment of their research capability, to provideus with needed data, and to provide a source of funding for their participation in work associ-ated with test development. Furthermore, a new ASTM subcommittee on superconductors (ASTMBl.08) was formed earlier this year with excellent participation from manufacturers, fundingagencies, and the national laboratories. The first formal report of the various task groupswill be presented at the International Cryogenic Materials Conference in late August. Minutesof the organizational meeting are available from the authors.
The term Standards as used here may indicate any or all of four quite different aspectsof standardization:
1. Unambiguous definition of terminology,2. Detailed description of measurement technique,3. Development of common experimental apparatus,4. Preparation and characterization of reference materials.
The role of each of these aspe.ts in our program is described in the following sections, wheremore specific examples are discussed.
DEFINITION Or TERMS
It was decided early that the first step in any standards program should be the develop-ment of a uniform terminology. To this end an extensive review of existing terminology wasmade and several review iterations were performed involving more than 50 reviewers both inthis country and abroad. The result was four papers containing proposed definitions, three ofwhich have now been published in the open literature. They deal respectively with:
^ w a M *% . * • ^ ^ a i l l
1.3.4. Josephson phenomena^•
The ASTM committee described above is now reviewing some of the terms and each of the publishedpapers solicits responses from the readers. Ultimately all definitions will be collected in aNBS document that will serve as the guide for their application.
e nun ueen ^uui!:>Meu in uie u fcri i i icrsLui c. INC./ i
Fundamental states and flux phenomena'')Critical parameters!?) ,,,Fabrication, stabilization and transient losses^
A specific example of problems created by ambiguous definitions is illustrated in Fig. !which shows the effect,of stress on the critical current of a commercial high field supercon-ductor measured at NBS1 '• The separate curves indicate the critical current behavior oneobserves using the indicated criterion or definition for critical current. Note that not onlythe magnitude, but also the shape of the curve is affected. All of the definitions shown havebeen used. Our studies have led us to conclude that the use of either the electric fieldcriterion or the resistivity criterion will provide a maximum of information with minimumeffort.
MEASUREMENT TECHNIQUES
The measurement of critical parameters of superconductors (current, field, and tempera-ture) as well as other phenomena of importance in applications (ac losses, effects of stressand fatigue, etc.) require complex apparatus that usually must be constructed by the experi-menter. In such measurements it is not uncommon for the results from different laboratoriesto be quite different even though everyone agrees on the definitions of the appropriate termsand similar apparatus is used. One solution to this problem is the use of a very detailed andreproducible experimental technique that has been developed from extensive experimentation.This type of development is one of the strong thrusts of our program.
To again use our experimental critical current investigation as an example, considerFig. 2, which shows the effect of the use of grease as a means of holding the test specimen ina "conventional" hairpin test rig machined from linen phenolicw- Clearly, this apparentlyrather innocuous (and common) laboratory technique greatly influences the result.
In support of the program segment on standard measurement techniques, we are now surveyingall of the laboratories that make these measurements routinely to determine the details oftheir technique and apparatus. We intend to publish the results as a NBS report if the infor-mation developed appears to be of sufficiently wide interest. A similar survey of techniques

used in Japan, a leader in new materials technology, has been prepared by a guest worker onthe program (Dr. Genshiro Fujii of the Institute for Solid State Physics, University of Tokyo)and will be published later this year.
APPARATUS .DEVELOPMENT
It is often desirable to have a standard apparatus design available for a given test.Frequently the technique and apparatus descriptions are a single document (e.g. ASTM Standards).Care is needed in the design phase to insure that the device is suited to all potential usersand that a given measurement can be completed in a reasonable time. Our first design in thiscategory is for a critical current apparatus and work has just started. The final des'gn willbe subjected to a detailed evaluation by interested parties. If possible, apparatus will thenbe sent to various laboratories for field trials of the design.
Another aspect of apparatus development occurs in the situation where widely differenttechniques are used to measure what is ostensibly the same quantity. Determining the causesof disagreement among the techniques can be a very difficult task. A specific example isprovided by the ac loss phenomena in superconductors. The losses may be determined by acalorimeter, a wattmeter, or a flux integration technique. All of these measurements aredifficult and agreement between any two is rare; flmong three it is essentially nonexistent.One if our experimental projects has started to research the problera and preliminary experi-mental data are shown in Fig. 3 from one of our latest publications''', these results arevery encouraging, but much work remains to be done before we understand all of the parameters.
A similar project is also underway at NBS (Gaithersburg) to compare several techniquescommercially used for the measurement of critical temperature.
REFERENCE MATERIALS
Evaluation of apparatus and test techniques employed at different locations is greatlysimplified by the use of standard reference materials. In the case of testing of practicalsuperconductors, such materials are nearly essential. The acquisition and characterization ofsuperconductors representing a range of properties is an important part of the program plan,but one that will be pursued later in the program. An informal inventory of available mater-ials at various manufacturers has been made as a first step.
CONCLUSIONS
All aspects of the superconductor standards program are progressing well in spite of arather late start this year. The experimental projects at NBS are already producing usefuldata and our subcontractors are well along at setting up their respective experiments. Theresponse of the users and suppliers to our efforts at involving them in all aspects of thepronra-n has been gratifying. In FY 80 we anticipate much greater visibility for the programao i...... ...perimental results become available and our activities in definitions and apparatusstandardization receive further distribution.

100
a.E
/»-iO"Mn
Nb3Sn9 T
1
NX
\ \C m \ \^ \
1
1,1
1 1
> . S.C. — NPMmW Ov
\ E=3/iV/cm
1
Fig. 1 The critical current of aNb3Sn multifilamentary con-ductor as a function ofapplied stress for variouscritical current criteria.
STRESS (108Pa)
Fig. 2 Critical current degradationof Nb3Sn and V3Ga fixed withgrease to a phenolic sampleholder with fiber directionperpendicular to the sample.
140
120
100
80
60
40
20
WithGrease
\ r
Grease
I I I
140
120
100
80
60
40
20
2 4 6 8 10

300
200
100
50
20
I
NbTi MULT 1 FILAMENTARY WIRE0.5 mm DIA.
1 = 4-° Arms V = 5T
O LOCK-IN AMPLIFIER• DIGITAL SCOPEA CALORIMETER
200 500FREQUENCY, Hz
I I
Fig. 3 The ac loss as a function offrequency for a multifilamen-tary NbTi superconductor. Acalorimetric value at 215 Hzis not shown since it agreesalmost exactly with the digitalvalue.
1000
REFERENCES
1. R. L. Powell and A. F. Clark, Cryogenics J_7, 697 (1977).
2. R. L. Powell and A. F. Clark, Cryogenics 18, 137 (1978).
3. D. T. Read, J. W. Ekin, R. L. Powell, and A. F. Clark, Cryogenics J£, 327 (1979).
4. R. L. Powell, S. B. Kaplan, R. Radebaugh, and F. R. Fickett, Cryogenics {To be published).
5. A. F. Clark and J. W. Ekin, IEEE Trans. Mag. MAG-13, 38 (1977).
6. G. Fujii, J. W. Ekin, R. Radebaugh, and A. F. Clark, Paper No. FA-19, Cryogenic Engin-eering Conference/International Cryogenic Materials Conference, University of Wisconsin,August 21-24, 1979.
7. R. Radebaugh, G. Fujii, D. T. Read, and A. F. Clark, Paper presented at the XVth Inter-national Congress on Refrigeration, Venice, Italy, September 23-29, 1979.

Project Title:
Principal Investigator:
Organization:
Project Goals:
Project Status:
Contract Number:
Contract Period:
Funding Level:
Funding Source:
PROJECT SUMMARY
Superconducting Magnetic Energy Storage (SMES)
John D. Rogers
University of CaliforniaLos Alamos Scientific LaboratoryLos Alamos, NM 87545(505) 667-5427; FTS 843-5427
The goals of the SMES program are two-fold. These are to design,fabricate, and place into operation a 30-MJ, 10-MW SMES unit forelectric utility transmission line stabilization on the BonnevillePower Administration (BPA) system by 1982-83. The second goal is todesign and have constructed a 10-to-5O-MWh SMES unit. This unit willbe for a completely detailed engineering prototype demonstration ofan electric utility diurnal load-leveling system.
The engineering design of the BPA SMES transmission line stabiliza-tion system is in an advanced state. Many large hardware items aredetermined and on order. The refrigerator has passed the acceptancetest. It is being Installed in a trailer obtained for this purpose.The superconducting wire for the 30-MJ coil has been obtained. Acontract was placed with General Atomic Co. for design of the 30-MJcoil. The design 1s about 80S complete. Lengths of 5-kA cable havebeen received and tested. Additional cable development is necessary.The converter has been ordered and all components for the protectiveenergy dump circuit have been received. Surplus high-pressuregas-recovery compressors have been obtained and are to be trailermounted. Similarly, an evaporative cooler has been obtained andwHI be trailer mounted for a heat-rejection unit. Detailedcontrols design and operating logic are being addressed for remotemicrowave-link operation of the SMES unit in the BPA system. AnRFQ has been issued for the power transformer.
The reference design for a 1-GWh diurnal load-leveling SMES unitwas completed. The costs extrapolated to a 10-GWh unit weredetermined to be $77 to $lll/kWh. Recommendations, based on thestudy, are made for extending the large SMES unit work.
W-7405-ENG-36
Continuing
$1,385,000 FY79
Department of Energy, Division of Energy Storage Systems andDivision of Electrical Energy Systems.

THE STABILIZATION UNIT FOR BONNEVILLE POWER ADMINISTRATION
R. I. SchermerLos Alamos Scientific Laboratory of the
University of CaliforniaLos Alamos, New Mexico 87545
ABSTRACT
The Bonneville Power Administration operates the transmission system that joins thePacific Northwest and southern California. A 30-MJ (8.4 kWh) Superconducting Magnet EnergyStorage (SMES) unit with a 10-MW converter can provide system damping for low frequencyoscillations. The unit is scheduled to operate in 1982. Progress during FY 79 is de-scribed, including the details of mechanical and electrical testing of prototype conductorsand the design, specification, and procurement activities for the energy storage coil, non-conducting dewar, electrical system and cryogenic system.
INTRODUCTION AND SUMMARY
The Pacific Northwest and southern California are part of the Western US Power Systemand are connected by two 500-kV, ac-power transmission lines, collectively referred to asthe Pacific AC Intertie, and one + 4OO-kV dc-transmission line, the Pacific HVDC Intertie.The two ac lines have a thermal rating of 3500 MW, and the dc line has a rating of 1440 MW.
The stability of the Western Power System is affected by relative weakness of the tieprovided by the 905-mile-long Pacific AC Intertie. In fact, studies made before energiza-tion of the Pacific AC Intertie showed that negatively damped oscillations with a frequencyof about 20 cpm were likely to occur. In 1974 negatively damped oscillations with a fre-quency of 21 cpm (0.35 Hz) were observed. The peak-to-peak oscillation on the Pacific ACIntertie was about 300 MW. Subsequent to these instabilities, the Bonneville Power Adminis-tration (BPA) installed equipment to modulate the power flow on the HVDC Intertie as a meansof damping the oscillations. The maximum possible power modulation on the HVDC Intertie is40 MW, about 3 percent of the HVDC power rating. The modulation of the HVDC Intertie hasincreased the stability limit of the Pacific AC Intertie from about 2100 MW to 2500 MW when-ever the HVDC Intertie is operating. However, the HVDC Intertie does not operate contin-uously. The line availability is 89.5X, and the southern terminal was down for six monthsas a result of earthquake damage. A back up stabilizing system could be used. Late in1975, representatives of BPA and the Los Alamos Scientific Laboratory (LASL) developed theconcept of installing a small SMES unit for the purpose of providing system damping similarto that now available through modulation of the Pacific HVDC Intertie. The design param-eters of the unit to be installed at the Fite Substation near Tacoma are summarized in Table1.
10
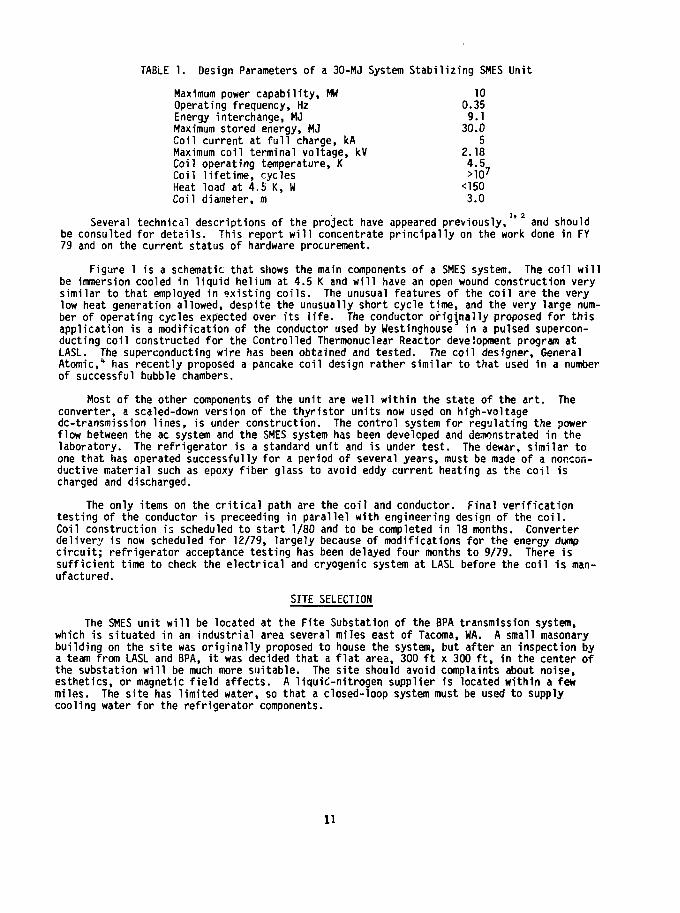
TABLE 1. Design Parameters of a 30-MJ System Stabilizing SMES Unit
Maximum power capability, MW 10Operating frequency, Hz 0.35Energy interchange, MJ 9.1Maximum stored energy, MJ 30.0Coil current at full charge, kA 5Maximum coil terminal voltage, kV 2.18Coil operating temperature, K 4.5Coil lifetime, cycles >107
Heat load at 4.5 K, W <150Coil diameter, in 3.0
Several technical descriptions of the project have appeared previously, ' and shouldbe consulted for details. This report will concentrate principally on the work done in FY79 and on the current status of hardware procurement.
Figure 1 is a schematic that shows the main components of a SMES system. The coil willbe immersion cooled in liquid helium at 4.5 K and will have an open wound construction verysimilar to that employed in existing coils. The unusual features of the coil are the verylow heat generation allowed, despite the unusually short cycle time, and the very large num-ber of operating cycles expected over its life. The conductor origjnally proposed for thisapplication is a modification of the conductor used by Westinghouse in a pulsed supercon-ducting coil constructed for the Controlled Thermonuclear Reactor development program atLASL. The superconducting wire has been obtained and tested. The coil designer, GeneralAtomic,* has recently proposed a pancake coil design rather similar to that used in a numberof successful bubble chambers.
Most of the other components of the unit are well within the state of the art. Theconverter, a scaled-down version of the thyristor units now used on high-voltagedc-transmission lines, is under construction. The control system for regulating the powerflow between the ac system and the SMES system has been developed and demonstrated in thelaboratory. The refrigerator is a standard unit and is under test. The dewar, similar toone that has operated successfully for a period of several years, must be made of a noncon-ductive material such as epoxy fiber glass to avoid eddy current heating as the coil ischarged and discharged.
The only items on the critical path are the coil and conductor. Final verificationtesting of the conductor is preceeding in parallel with engineering design of the coil.Coil construction is scheduled to start 1/80 and to be completed in 18 months. Converterdelivery is now scheduled for 12/79, largely because of modifications for the energy dumpcircuit; refrigerator acceptance testing has been delayed four months to 9/79. There issufficient time to check the electrical and cryogenic system at LASL before the coil is man-ufactured.
SITE SELECTION
The SMES unit will be located at the Fite Substation of the BPA transmission system,which is situated in an industrial area several miles east of Tacoma, WA. A small masonarybuilding on the site was originally proposed to house the system, but after an inspection bya team from LASL and BPA, it was decided that a flat area, 300 ft x 300 ft, in the center ofthe substation will be much more suitable. The site should avoid complaints about noise,esthetics, or magnetic field affects. A liquid-nitrogen supplier is located within a fewmiles. The site has limited water, so that a closed-loop system must be used to supplycooling water for the refrigerator components.
11

Thn* .ptlCIM
but
HHCtMpowtr _
SxMr conducting;| coil
SCRfiringcircuit L Coil
pronctwn
Mrigmtor
IContrtd ii««< to/from•Mdricol pOMr system
Fig. 1. Components of a Superconducting Magnetic Energy Storage System
The only problem with the substation is that it is manned only 4 hours per day. Thishas led to an unanticipated requirement for automated control of the entire system, whichwill increase the hardware cost of the system by roughly $250,000. There are no sitesavailable, however, at stations which are manned arounJ the clock. BPA has argued, in addi-tion, that any SMES system which operates commercially will certainly need a high degree ofautomation, and that there is no reason not to solve the problem at this time.
A draft memorandum of understanding (MOU) has been circulated among the BPA and LASLstaffs. The MOU gives the responsibilities of both parties in the installation and oper-ation of the equipment.
CONDUCTOR DEVELOPMENT
The cable design for the 30-MJ coil, as shown in Fig. 2, has been modified somewhatfrom that described in previous presentations1'2 as a result of the on-going program of acloss tests, stability tests, mechanical tests, and detailed engineering discussions heldwith the coil designer, General Atomic. Geometric specifications for the various elementsare given in Table 2. The first subcable consists of a superconducting component core,around which are cabled six strands of oxygen-free copper that acts as a stabilizer. If alength of superconducting core should become normal, that is, become non-superconducting,the current will transfer into the copper, allowing the core to regain the superconductingstate.^ In the original proposal, the first subcables were solder-filled and wrapped withKapton tape. Neither of these steps presently appears necessary. Furthermore, eliminatingthese steps results in a gain in performance and a savings of $100,000 in fabrication costs.Insulation must be added to the second subcable, as shown, to limit ac losses. For the pan-cake design proposed by GA, the stainless steel strap no longer forms a.n integral element ofthe cable. The cable core consists of a thin strip of Kapton or Mylar that serves to preventfretting of the interior cable surfaces. It is expected that the modified conductor will befar easier to wind than the original conductor.
*DuPont trademark
12

4.856.5
1464
0.511
2,94:5.0
x 10"2
1
TABLE 2. Conductor Specifications for 30-HJ Coil
A. Superconductor Composite Core
2
Area of NbTi, irni
Filament diameter, ym
Number of filaments
Strand diameter, mm
Cu to NbTi ratio
Twist pitch, mm
B. First Subcable (Six copper wires cabled about one core)
Uncompacted diameter, mm 1.39
Overall Cu to NbTi ratio 26.7:1
C. Second Subcable (Insulated)
Six.first subcables around a copper core
Diameter, mm 4.59
D. Finished Conductor
Ten second subcables around a Kapton strip
Strip dimension, mm 18 x 0.25Conductor dimension, mm 23 x 9.2
Most of the development work which has gone into the original conductor concept isdirectly applicable to the modified conductor. Samples of original conductor are undergoingthe entire series of qualification tests so that the original concept will be available foruse if necessary.
ELECTRICAL TESTING PROGRAM
Stability tests on a mock-up conductor array using second subcable with Kapton insu-lated first subcable show that the original conductor concept is stable at the BPA operatingpoint. Tests will be done on samples of modified cable as they become available, althoughit is expected that the modified cable will be stable at an even higher current than theoriginal conductor.
A simple test of electrical resistivity at 20 K (boiling point of liquid hydrogen) hasbeen developed for use as a quality control procedure during cable fabrication. It has beenfound that the first subcable must be annealed at 600°F for 2 hours to recover the origi-nal low electrical resistivity of the stabilizing copper. This procedure does not affectthe superconductor. Forming the second subcable and final conductor results in only afurther 10% increase in the resistivity.
13

1ST SUB-CABLE
2 NOSUB-CA6LE
Fig. 2. Low-Loss Cryostable Cable for 3O-MJ Pancake Coils
Ac losses have been measured as a function of frequency and cable geometry to definethe separate contributions due to superconductor hysteresis, coupling currents, and coppereddy currents. With soldered first subcable the losses are approximately equal to thosecalculated in the original 30-HJ system proposal. With nonsoldered cable, the contactresistance between the copper wires is sufficient to reduce the coupling and eddy currentlosses by a factor of ten, with no detectable effect on conductor stability. Further, thecontact resistance between first subcables is large enough that they need not be insulatedbefore the second subcables are formed. Leaving the first subcables bare reduces cost,increases stability, and solves a number of problems related to current sharing betweeninsulated strands in a cable. The present design calls for each of the 10 second subcablesto have a separate power lead from the liquid helium bath to a common, room-temperature,bussbar. The lead resistance forces each second subcable to carry the same current, whilethe uninsulated first subcables within each second subcable automatically share the cur-rent. It is possible to use short lengths of superconductor cold-welded together, and evena complete break in the superconductor can be tolerated.
Acceptance tests have been performed on 64 samples of superconducting composite corewire, drawn from 90X of the wire order. All samples met the specified current carrying per-formance of 110 A at 4.2 K, 3 T and 1 x 10-'Z n-cm. Thehigher.
average performance was 20%
14
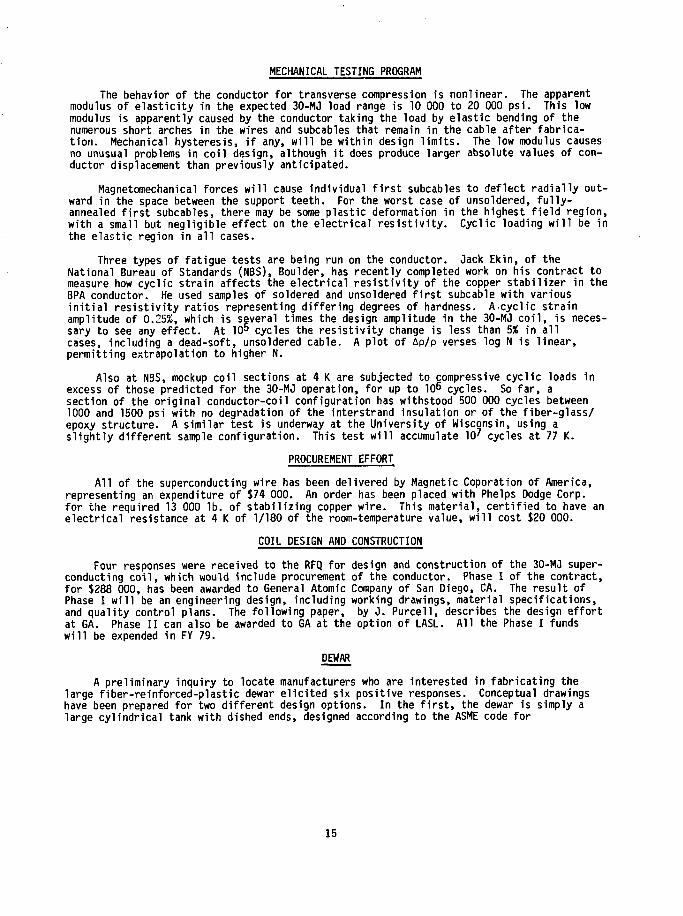
MECHANICAL TESTING PROGRAM
The behavior of the conductor for transverse compression is nonlinear. The apparentmodulus of elasticity in the expected 30-MJ load range is 10 000 to 20 000 psi. This lowmodulus is apparently caused by the conductor taking the load by elastic bending of thenumerous short arches in the wires and subcables that remain in the cable after fabrica-tion. Mechanical hysteresis, if any, will be within design limits. The low modulus causesno unusual problems in coil design, although it does produce larger absolute values of con-ductor displacement than previously anticipated.
Magnetomechanical forces will cause individual first subcables to deflect radially out-ward in the space between the support teeth. For the worst case of unsoldered, fully-annealed first subcables, there may be some plastic deformation in the highest field region,with a small but negligible effect on the electrical resistivity. Cyclic loading will be inthe elastic region in all cases.
Three types of fatigue tests are being run on the conductor. Jack Ekin, of theNational Bureau of Standards (NBS), Boulder, has recently completed work on his contract tomeasure how cyclic strain affects the electrical resistivity of the copper stabilizer in theBPA conductor. He used samples of soldered and unsoldered first subcable with variousinitial resistivity ratios representing differing degrees of hardness. A cyclic strainamplitude of 0.25%, which is several times the design amplitude in the 30-MJ coil, is neces-sary to see any effect. At 10$ cycles the resistivity change is less than 5% in allcases, including a dead-soft, unsoldered cable. A plot of Ap/p verses log N is linear,permitting extrapolation to higher N.
Also at NBS, mockup coil sections at 4 K are subjected to compressive cyclic loads inexcess of those predicted for the 30-MJ operation, for up to 106 cycles. So far, asection of the original conductor-coil configuration has withstood 500 000 cycles between1000 and 1500 psi with no degradation of the interstrand insulation or of the fiber-glass/epoxy structure. A similar test is underway at the University of Wisconsin, using aslightly different sample configuration. This test will accumulate 10' cycles at 77 K.
PROCUREMENT EFFORT
All of the superconducting wire has been delivered by Magnetic Coporation of America,representing an expenditure of $74 000. An order has been placed with Phelps Dodge Corp.for the required 13 000 lb. of stabilizing copper wire. This material, certified to have anelectrical resistance at 4 K of 1/180 of the room-temperature value, will cost $20 000.
COIL DESIGN AND CONSTRUCTION
Four responses were received to the RFQ for design and construction of the 30-MJ super-conducting coil, which would include procurement of the conductor. Phase I of the contract,for $288 000, has been awarded to General Atomic Company of San Diego, CA. The result ofPhase I will be an engineering design, including working drawings, material specifications,and quality control plans. The following paper, by J. Purcell, describes the design effortat GA. Phase II can also be awarded to GA at the option of LASL. All the Phase I fundswill be expended in FY 79.
DEWAR
A preliminary inquiry to locate manufacturers who are interested in fabricating thelarge fiber-reinforced-plastic dewar elicited six positive responses. Conceptual drawingshave been prepared for two different design options. In the first, the dewar is simply alarge cylindrical tank with dished ends, designed according to the ASME code for
15

pressure-vacuum vessels. To save helium, a second, evacuated, chamber would be placedinside the bore of the coil. In the second option, the dewar is toroidal, with a roughlyrectangular cross section and a flat lid. In both cases, there must be liquid nitrogencooled shields in the vacuum spaces and in the helium gas space above the coil and super-insulation in the vacuum spaces. The superinsulation must be arranged not to form a con-ducting ring encircling the coil. At least one vendor has successfully fabricated thesecond type of dewar, 10 feet in diameter and 3 feet deep. Currently, the two sets of draw-ings are being circulated among the vendors for comments, following which modifications andmore specific design will be made and a formal RFQ will be issued.
ELECTRICAL SYSTEM
A schematic of the electrical system is shown in Fig. 3. A contract for the 10-MW con-verter was let to Robicon Corp., Pittsburgh, PA, and was subsequently extended for modifica-tions to include integrating the energy dump circuit for a combined total cost of $180 000.The final design review for the converter has been held, detailed drawings approved and fab-rication begun. Scheduled delivery date is November 30, 1979.
The 108 SCR's for the converter were purchased for $38 000 at the end of FY 78 fromWestinghouse Electric Corp. An additional order has been placed for 48 SCR's at a cost of$17 000, with delivery scheduled before the end of FY 79. The additional SCR's are for theenergy dump circuit and for spares.
Considerable effort on the part of the LASL staff went into the design of the energydump circuit, which is based upon a circuit developed for switching applications in the mag-netic fusion program.5 By placing the interrupter in series with the converter, rather than
• in parallel, it is possible to discharge the coil at a higher voltage and therefore in ashorter time. The entire electrical system is arranged so the 30-MJ coil can be protectedunder any conceivable failure mode. The 5-KA dc vacuum interrupter is formed by a parallelcombination of the three-phase contacts of a commercially available ac vacuum breaker. This$12 000 item has already been shipped by GE to Robicon for integration into the convertermodules. The remaining components of the energy-dump circuit are presently being fabricatedby various vendors.
Bids have been received and are being evaluated for the 12-MVA converter transformer,which is a $100 000 to $200 000 item. It is expected that the contract will be let veryshortly, with delivery scheduled for the end of FY 80.
The four firing cirucits shown in Fig. 3 are built into the converter. The controlcircuitry, which forms the logic interface with the BPA network, will be designed and builtby LASL, Experiments with a prototype circuit have been described previously.6
Present plans nail for all the electrical system components to be delivered to LosAlamos except for the transformer, which will be delivered to Tacoma, WA. Power at LosAlamos will be supplied by an existing 3.25-MVA rectiformer. The control circuit will beintegrated into the system and the computer controlled operation will be tested.
CRYOGENIC SYSTEM
Figure 4 shows a block diagram of the cryogenic system, with the components arrangedfor the Tacuma site. All the components are mounted on trailers, so that the entire systemis portable. In particular, the system will be assembled at Los Alamos in mid FY 80, whichwill permit an extensive testing of the automatic operation and which should limit theamount of plumbing that needs to be done at Tacoma.
16

Fig. 3 Electrical System for SHES BPA System Stabilizer
The refrigerator is a CTI - Cryogenics model 2800 with Sulzer gas bearing turbines,three variable flow compressors, and liquid nitrogen precooling. The refrigerator willproduce 75 £/hr of liquid helium or 320 W of refrigeration at 4.2 K, or any linear combina-tion of the two. The expected load, 15 l/hr of liquid and less than 150 W should be withinthe system capability with only two compressors running. Initial tests are scheduled momen-tarily. The refrigerator and compressors installed in the trailer and equipped for auto-matic remote control cost $450 000. This includes two spare gas-bearing turbines. Two-thirds of this amount has been expended.
The refrigerator trailer, fabricated by Aluminum Body Corp., Los Angeles, CA, cost $24000 and has been shipped to CTI. Still outstanding is an RFQ for refrigerator modificationsto allow long-term unattended operation and automatic remote control.
The liquid nitrogen trailer was obtained as excess equipment and will be reconditionedat Los Alamos.
A minimum inventory of 108 000 SCFM of helium is required to operate the system at acost of $10 000. It is assumed that there will be intervals during which the refrigerationplant will not be running when the gas will be recovered and stored. The gas recovery sub-system consists of any one of the refrigerator compressors, three Corblin 2500 psi com-pressors, a 100 W heater in the coil dewar, and a high pressure tube trailer. One Corblinwill handle the gas flow resulting from the normal heat load on the dewar, which evaporatesthe liquid helium in 86 hours. The heater and additional Corblin compressors permit thedewar to be emptied in one day, if desired.
17

Fig. 4. Layout of SMES System at Fite Substation, Tacoma, WA
The Corblin compressors were obtained from excess property and are currently beingserviced. A suitable trailer to contain them exists at Los Alamos. A bid of $100 000 wasreceived for the tube trailer but acceptance has been deferred to allow for a search ofexcess property lists for this item. Tube trailer delivery is only 60 days. If all thecompressors run simultaneously, they require 60 gpm of cooling water, which is too much foronce-through cooling. An evaporative cooling tower has been located at Los Alamos whichappears suitable for this application. A flat-bed trailer to hold the cooling tower hasalso been located as excess property.
18

CONCLUSION
The 30-MJ SMES transmission line stabilization project is proceeding with the criticalitems on schedule. Verification testing has been performed on one version of the originalconductor. Much of this testing also applies to a modified conductor that promises to per-form even better and which will be easier to fabricate. The refrigerator and converter sys-tems will be completed early in FY 80 and tested at LASL.
REFERENCES
1. H. 0. Boenig, J. C. Bronson, D. B. Colyer, W. V. Hassenzahl, J. D. Rogers, R. I.Schermer, June 1978, "A Proposed 30-MJ Superconducting Magnetic Energy Storage Unit forStabilizing an Electric Transmission System," Los Alamos Scientific Laboratory reportLA-7312P.
2. J. D. Rogers, H. J. Boenig, J. C. Bronson, D. B. Colyer, W. V. Hassenzahl, R. D. Turnerand R. I. Schermer, Jan. 1979, "30-MJ SMES Unit for Stabilizing An Electric Transmis-sion System," IEEE Trans, on Magnetics, Vol. MAG-15, Jan. 1979, pp. 820-823.
3. J. D. Rogers, D. J. Blevins, J. D. G. Lindsay, G. A. Miranda, C. E. Swannack, D. M.Weldon, and J. J. Wollan, C. J. Mole, E. Mullan, P. W. Eckels, H. E. Haller III, M. A.Janocko, S. A. Karpathy, D. C. Litz, P. Reichner, Z. N. Sanjana, and M. S. Walker,"0.54-MJ Superconducting Magnetic Energy Transfer and Storage," Adv. Cryo. Eng. 23, 57(1978). —
4. J. Purcell, following paper, this conference.
5. R. Warren, M. Parsons, E. Honig, and J. Lindsay, "Tests of Vacuum Interrupters for theTokamak Fusion Test Reactor," April 1979, Los Alamos Scientific Laboratory reportLA-7759-MS.
6. H. J. Boenig and W. S. Ranken, 1977, "Design and Tests of a Control System forThyristorized Power Supplies for Superconducting Coils," Proc. 7th Symp. Eng. Problemsof Fusion Research, Knoxville, TN, Oct. 25-28, 1977, IEEE, Inc., Piscataway, NJ, IEEENo. 77CH1267-4-NPS, p. 484.
19

Project Title:
Principal Investigator:
Organization:
Project Goals:
Project Status:
Contract Number:
Contract Period:
Funding Level:
Funding Source:
PROJECT SUMMARY
Superconducting Magnetic Energy Storage (SMES)
John D. Rogers
University of CaliforniaLos Alamos Scientific LaboratoryLos Alamos, NM 87545(505) 667-5427; FTS 843-5427
The goals of the SMES program are two-fold. These are to design,fabricate, and place into operation a 30-MJ, 10-MW SMES unit forelectric utility transmission line stabilization on the BonnevillePower Administration (BPA) system by 1982-83. The second goal is todesign and have constructed a 10-to-50-MWh SMES unit. This unit willbe for a completely detailed engineering prototype demonstration ofan electric utility diurnal load-leveling system.
The engineering design of the BPA SMES transmission line stabiliza-tion system is in an advanced state. Many large hardware items aredetermined and on order. The refrigerator has passed the acceptancetest. It is being installed in a trailer obtained for this purpose.The superconducting wire for the 30-MJ coil has been obtained. Acontract was placed with General Atomic Co. for design of the 30-MJcoil. The design is about 80% complete. Lengths of 5-kA cable havebeen received and tested. Additional cable development is necessary.The converter has been ordered and all components for the protectiveenergy dump circuit have been received. Surplus high-pressuregas-recovery compressors have been obtained and are to be trailermounted. Similarly, an evaporative cooler has been obtained andwill be trailer mounted for a heat-rejection unit. Detailedcontrols design and operating logic are being addressed for remotemicrowave-link operation of the SMES unit in the BPA system. AnRFQ has been issued for the power transformer.
The reference design for a 1-GWh diurnal load-leveling SMES unitwas completed. The costs extrapolated to a 10-GWh unit weredetermined to be S77 to Slll/kWh. Recommendations, based on thestudy, are made for extending the large SMES unit work.
W-74O5-ENG-36
Continuing
31,385,000 FY79
Department of Energy, Division of Energy Storage Systems andDivision of Electrical Energy Systems.
21

DESIGNING THE MAGNET FOR THE BONNEVILLE POWER ADMINISTRATION*
John R. PurcellGeneral Atomic Company
P.O. Box 81608, San Diego, California 92138
ABSTRACT
This paper describes the design of the Bonneville 30 MJ superconducting stabilizing coil.The various components in the coil are described along with the rationale for materials choice.
INTRODUCTION
The 30 MJ coil is a solenoid with a winding bore of 107 inches. It will be 48 inches talland have an outside diameter of 134 inches. Peak field on the conductor will be about 2.7 T atfull current of 4900 amperes and the stored energy will be 32 MJ. Total weight of the finishedcoil will be 36,000 pounds.
CONSTRUCTION
The coils will be constructed by winding a superconducting cable and a stainless steelstrip in parallel. The stainless steel strip will support the hoop stress generated by themagnetic field. An overall view of the coil is shown in Fig. 1. The windings will be flatdiscs, or pancakes, shown in Fig. 2, that consist of outward spiraling turns of superconductorand stainless steel. Forty of these pancakes (23 turns each) are stacked, one above the otherto form the complete coil. The coil stack is clamped together with tie bolts and clamp rings.Connections are made between the pancakes to place all the windings in series. Current flowsinto one end of the coil, spirals in and out through the pancakes, and out the other end of thecoil to produce the magnetic field.
CONDUCTOR
Since the coil will be operated in a pulsed mode at a frequency of 0.35 Hz, it is importantto minimize the heating produced by the pulsed fields and current. The heating aspect has thelargest impact on the conductor itself. To reduce the ac losses, the superconductor must befinely divided, twisted, and parallel paths must be electrically insulated and be furthertwisted. The copper stabilizing material must also be divided into small wires and twisted.
In addition to having low ac losses, the conductor must be stabilized against thermal andelectrical perturbations. Stabilization is the purpose of the additional copper wires that aretwisted into the cable along with the superconductor. In the event a short length of super-conductor goes "normal" for a short period of time, the current in that short section is bypassedinto the neighboring copper until the superconducting state is resumed. The copper provides alow resistance path, to minimize heating during the current bypass, and allows the conductor toreturn to the superconducting state. Considerations of stability and ac loss have led to a con-ductor design as shown in Fig. 3.
MECHANICAL
The pancakes are separated by perforated spacers as can be seen in Fig. 2. The spacersmust be perforated to allow free circulation of the liquid helium and be strong enough to supportthe large compressive load between coils. Epoxy glass laminate is a good material for thisservice.
Work support by Department of Energy, LASL Agreement X49-6722H-1.
22

TOPFLANGE
CONDUCTORSPLICEPLATE
Fig. 1. Isometric view of 30 MJ magnet with a 90° sector removed
One of the forces generated by a solenoid winding when it is energized is a bursting force,called the hoop force, that tries to make the coils grow in diameter. The hoop force is sup-ported by tension in the stainless steel strips wound into the pancake coils. In addition tothe hoop force, the magnetic field produces another force that pushes two coils together tendingto make the coil stack shorter. This force is transmitted from pancake to pancake through thewidth of the stainless steel strip. The fragile conductor is thus protected from large forces,both along its length and across its width, by the stainless steel strip.
The coil assembly will be tied together with aluminum bolts between epoxy glass laminateplates at the top and bottom of the coil. Aluminum is a desirable material for these tie boltsbecause its thermal coefficient matches the composite thermal coefficient of the coil stack andthe tension will be the same at low temperature as it is at room temperature. In addition, thelow elastic modulus of aluminum results in considerable stretch of the bolts during tightening.This stretch in the aluminum tie bolts will allow them to maintain a clamping force even whenthe magnet is energized and the coil stack is shortened somewhat due to magnetic forces.
Joints between the pancakes will be made by soldering with about a 12-inch overlap. Thejoints will not be superconducting; however, the resistance will be very low and the total heatgenerated by the joints at full current will be only 2-3 watts.

BOBBIN
BOTTOM COIL
F1g. 2. Isometric end view of double pancake assembly
LIFETIME
The energy storage coil is designed to operate for 30 years and to tolerate 10** cycles from80% to 100% current. The coil will normally be in an ideal environment for long life. It willbe kept in an inert atmosphere (helium) at 4°K, well below the temperature that any chemicalreactions or corrosion can take place. The occasional warmup to room temperature and subsequentcooldown to 4°K present very little thermal fatigue effect. Only the effect of mechanicalfatigue is seen as a design problem and this is being considered very carefully. The designeliminates all sliding and inelastic motion during coil energization and all materials that aresubjected to stress will operate at conservative stress levels to insure reliability.
24

DOUBLE PANCAKE ASSEMBLY
STAINLESSSTEEL STRAP
INSULATOR
CONDUCTOR
PERFORATED INTERLAYERSPACER
Ffg. 3. Isometric view of conductor assembly showing stainless steelsupport strap, insulator strips and 10-cable conductor
25

rProject Title:
Principal Investigator:
Organization:
Project Goals:
Project Status:
Contract Number:
Contract Period:
Funding Level:
Funding Source:
PROJECT SUMMARY
Superconducting Magnetic Energy Storage (SMES)
John D. Rogers
University of CaliforniaLos Alamos Scientific LaboratoryLos Alamos, NM 87545(505) 667-5427; FTS 843-5427
The goals of the SMES program are two-fold. These are to design,fabricate, and place into operation a 30-MJ, 10-MW SMES unit forelectric utility transmission line stabilization on the BonnevillePower Administration (BPA) system by 1982-83. The second goal is todesign and have constructed a 10-to-50-MWh SMES unit. This unit willbe for a completely detailed engineering prototype demonstration ofan electric utility diurnal load-level ing system.
The engineering design of the BPA SMES transmission line stabiliza-tion system is in an advanced state. Many large hardware items aredetermined and on order. The refrigerator has passed the acceptancetest. It is being installed in a trailer obtained for this purpose.The superconducting wire for the 30-MJ coil has been obtained. Acontract was placed with General Atomic Co. for design of the 30-MJcoil. The design is about 80% complete. Lengths of 5-kA cable havebeen received and tested. Additional cable development is necessary.The converter has been ordered and all components for the protectiveenergy dump circuit have been received. Surplus high-pressuregas-recovery compressors have been obtained and are to be trailermounted. Similarly, an evaporative cooler has beei obtained andwill be trailer mounted for a heat-rejection unit. Detailedcontrols design and operating logic are being addressed for remotemicrowave-link operation of the SMES unit in the BPA system. AnRFQ has been issued for the power transformer.
The reference design for a 1-GWh diurnal load-leveling SMES unitwas completed. The costs extrapolated to a 10-GWh unit weredetermined to be S77 to Slll/kWh. Recommendations, based on thestudy, are made for extending the large SMES unit work.
W-7405-ENG-36
Continuing
$1,385,000 FY79
Department of Energy, Division of Energy Storage Systems andDivision of Electrical Energy Systems.
27

1-GWh DIURNAL LOAD-LEVELING SUPERCONDUCTING MAGNETICENERGY STORAGE SYSTEM REFERENCE DESIGN
J. D. RogersLos Alamos Scientific Laboratoryof the University of California
Los Alamos, NM 87545
ABSTRACT
A point reference design has been completed for a 1-GWh Superconducting Magnetic EnergyStorage system. The system Is for electric utility diurnal load-leveling; however, such adevice will function to meet much faster power demands including dynamic stabilization. Thestudy has explored several concepts of design not previously considered in the same detail astreated here. Because the study is for a point design, optimization in all respects is notcomplete. The study examines aspects of the coll design; superconductor supported off of thedewar shell; the dewar shell. Its configuration and stresses; the underground excavation andrelated construction for holding the superconducting coll and its dewar; the heliumrefrigeration system; the electrical converter system; the vacuum system; the guard coil; andthe costs. This report Is a condensation of the more comprehensive study which is In theprocess of being printed.
INTRODUCTION
A study has been undertaken to evaluate the magnitude in size, technical difficulty anddetail, and cost of a 1-GWh Superconducting Magnetic Energy Storage (SMES) system for diurnalI oad-1 eve 11ng for electric utility application. A 1-GWh size was chosen as being sufficientlylarge to make extrapolation to a larger size reliable and, unto Itself, to be a size for whichthere could be considerable demand, cost permitting. Extrapolation of cost per unit of energystored is, to the first order. Inversely proportional to the maximum energy stored to theone-third power. The approach, used In the design, has been to explore some variations toalready conceived details of a SMES unit. These details are particularly those related to thedewar structure and the support and design of the conductor. Before any commitment is made tothese or other concepts, a careful comparison is needed. To aid the stu.'y and establishcredibility in areas in which unusual expertise Is required, Industrial consultants were usedto assess the nature of converters, underground excavation for locating the superconductingstorage coll, and high-purity aluminum to establish both methodology and costs.
Several aspects of a large SMES unit determined by earlier work are retained as featuresof this reference design. These Include the concept of operating with the superconductor in a1.8-K l-atm superfluld helium bath to reduce the cost of the superconductor; contoured, modularcold- and warm-wall helium dewar to accommodate thermal expansion and reduce materialthickness; location of the storage coil underground to reduce coil support construction costs;and the use of a simple solenoid with a helght-to-diameter ratio of about one-third.
Table 1 gives some of the characteristics of the storage system. The technology base ofthis reference design Is considered to be within the state of the art. No discoveries orunusual Inventions are needed to design and construct such a SMES system. At the same time,technology development Is required to establish methods of construction which will bereliable. Also, Improvements In the technology base could considerably alter the economics ofsuch a major capital project.
28
Thr*fl
sRndiM
pfnpfttottonSCR
Sugarconduci*ig
1 Control tit
Coilpflrttclion
LHi
Vrigntor
4 sionol ID/fromclKlrical pcotr system
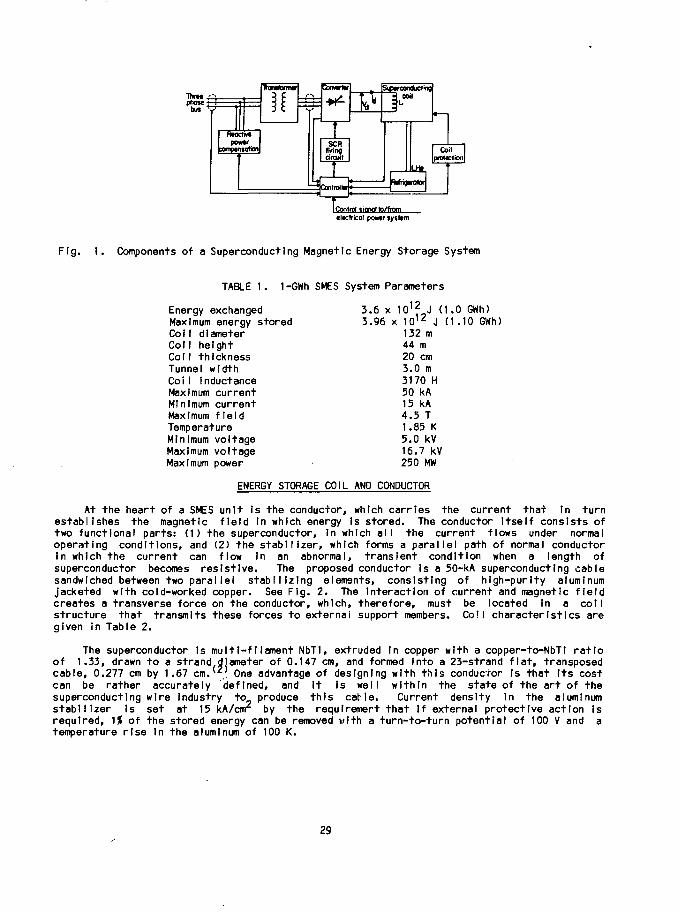
Fig. 1. Components of a Superconducting Magnetic Energy Storage System
TABLE 1. 1-GWh SMES System Parameters
Energy exchangedMaximum energy storedCoil diameterColl heightCol I thicknessTunnel widthCoiI InductanceMaximum currentMinimum currentMaximum fieldTemperatureMinimum voltageMaximum voltageMaximum power
D12 .3.96 x 10 1 2 J (1.10 GWh)
132 m44 m20 cm3.0 m3170 H50 kA15 kA4.5 T1.85 K5.0 kV16.7 kV250 MW
ENERGY STORAGE COIL AND CONDUCTOR
At the heart of a SMES unit Is the conductor, which carries the current that In turnestablishes the magnetic field In which energy Is stored. The conductor Itself consists oftwo functional parts: (1) the superconductor, In which all the current flows under normaloperating conditions, and (2) the stabilizer, which forms a parallel path of normal conductorin which the current can flow in an abnormal, transient condition when a length ofsuperconductor becomes resistive. The proposed conductor is a 50-kA superconducting cablesandwiched between two parallei stabilizing elements, consisting of high-purity aluminumjacketed with cold-worked copper. See Fig. 2. The Interaction of current and magnetic fieldcreates a transverse force on the conductor, which, therefore, must be located In a collstructure that transmits these forces to external support members. Coil characteristics aregiven in Table 2.
The superconductor Is multi-filament NbTI, extruded in copper with a copper-to-NbTI ratioof 1.33, drawn to a strand diameter of 0.147 cm, and formed Into a 23-strand flat, transposedcable, 0.277 cm by 1.67 cm. . One advantage of designing with this conductor is that its costcan be rather accurately defined, and It is well within the state of the art of thesuperconducting wire Industry to produce this cable. Current density in the aluminumstabilizer is set at 15 kA/cm by the requirement that if external protective action isrequired, lit of the stored energy can be removed with a turn-to-turn potential of 100 V and atemperature rise In the aluminum of 100 K.
29

TABLE 2. 1-GWh Coll Characteristics
Average radiusHeightRadial thicknessInductanceOperating current at fulI chargeCryogenic coolantNumber of turnsNumber of radial turnsWinding patternRadial turn spacingAxial turn spacing, ml dp laneAxial turn spacing, end
66 m44 m0.20 m3170 H50 kA
He Iiurn at 1.8 K, 1 atm42805pancake0.60 cm2.69 cm11.7 cm
The conductor Is designed to be fully stable, such that the heat generation with all thecurrent in the stabilizer is equal to the heat which can be carried away by the helium incontact with the exposed surface. A study has been performed by ALCOA on the cost ofhigh-purity aluminum as a function of purity, based on the use of a proprietary process thatthey developed/ 5' The cost of copper is taken as $1.50/kg.
In a superconductor, when the magnetic field is varied, the electric fields produce eddycurrent losses that must be removed by the liquid helium. The time averaged losses total131 W with the coil holding full charge and 12 W with the coil holding minimum charge, bothentirely due to joints, and 303 W with the coil either being charged or discharged.
The radial and axial forces on the Individual conductors are transmitted through theconductor stack to the helium vessel and thence to the support struts. While the accumulatedradial J,oad is small, the accumulated axial load may become very large. With a strain limitof 10'ri In the aluminum stabilizer, the maximum load is 84 MPA (12.2 ksi). The load withineachhellum vessel section accumulates to a large value. ( 4' It is, therefore, proposed that theconductor stack within each section be divided vertically into two sections. The half nearestthe coll mi dp lane bears on the vessel end, while the half away from the mi dp lane bears onledges fitted to the Inner and outer helium vessel walls.
- IB.56mm
"
0 65mm —(COPPER WALLS!
^^^
-H2.77mm»
Fig. 2. Cross Section of a Conductor Array Showing Dimensions
30

Material costs for the conductor support within the dewar are taken as $2.50/kg foreither aluminum alloy or stainless steel; and the fabricated, insulated cost is taken as twicethis. Placement costs are included in the coll winding estimate. Aggregate costs of thevarious elements discussed in this section are given in Table 3.
TABLE 3. Costs for Conductor and Coil
CostItem $10°
50 kA, graded and fabricated superconducting cable 43.2Copper jacketed, aluminum stabilizer; materials 7.3
fabrication 7.3Supports and spacers; material 6.2
fabrication 6.2Coi I winding labor 2.7
Total 72.9
DEWAR AND STRUCTURAL SUPPORT
The general dimensions for the 1-GWh excavation cross section are shown in Fig. 3. Theexcavation is made to house a large underground vacuum vessel. Inside this vacuum vessel arethe inner vessels that serve as structural support for and contain the superconducting coil.The upper and lower ends of the outer vacuum vessel are sealed by means of an aluminum 5083bellows that joins to an end seal structure. The upper end seal structure will have thenecessary penetrations for construction purposes and piping, and personnel access to thetunnel will be through the radial access drift tunnel.
The inner, helium vessel is shown segmented into 13 sections with numbers I through 6,above the central segment and 7 through 12 below. The central segment is numbered 13. Thehelium vessel is a rippled structure in the plan view. See Fig. 4. Support struts, locatedevery 2 m on centers circumferentially, transmit the radial and axial magnetic forces to theouter wall of the excavation. The general concept is based upon struts proposed by theUniversity of Wisconsin. ' The struts have been divided axially into an 18.2-m centralsection, in which the axial loads are very small, plus two 12.9-m end sections in which theaxial loads are greater than the radial loads.
The vacuum vessel is to be constructed of aluminum 5083 in the H-38 condition. Thevessel will be a continuous shell except for required penetrations with bellows closures forpiping, conductors, and access. This shell will f •> .instructed from seam-welded aluminumplate 2.5 mm thick. The sheli will be supported by 0.3-m-long rock anchor-type supports on a1- by 1-m spacing pattern. The material for the vacuum vessel and bellows is expected to cost$245 000 and $123 000, respectively. °' The strut components and materials are shown InFig. 5.
The Installed costs of this system and the per unit materials costs are given in Table 4.A factor of three times the computed material cost has been used to determine the installedcost. This factor may be somewhat high and its effect is discussed below.
Potential savings in material cost can be investigated through design changes in someareas. Three such major changes are evident. Stainless steel is considered for the dewarstructural material because of the known available technology for handling with someconfidence in the vacuum reliability of welds, etc. If similar technology for aluminumsections can be made available, there are potentially large material cost savings.
31

r
Fig. 3. Basic Dimensions and Cross Section of the 13-Segment Vessel Concept
niPPLEDHEUUM VESSELS-/
VACUUM VESSEL
. ' • • . SHOT CRETE
Z5?&G> 'cr
OUTER VACUUMBARRIER
BOLTED THRUFRICTION CONNECTION
Fig. 4. Section AA Plan View of Fig. 3Showing Proposed Vessel Concept
Fig. 5. Low-Thermal Conductivity SupportComponents
32

0.1.
es 0.53.33.90.
$4880/m3
$8/kg$17300/m3
7454687956
($0.
($1
SO/lb)
.00/lb)
TABLE 4. In-Place Cost for 1-GWh SMES Structural Components
Component Cost, SiO6
Vacuum walIsVacuum-walI anchor systemBel lows seals, upper and lower enclosure structuresLow-conductlvlty support strutsHe 11 urn vessels
Total
Material Cost
AluminumG-10 CRA-304 Stainless
The second promising concept is the wire rope conductor design.'6' Such a self-supportingconductor design would be a highly efficient structure, eliminates the dewar as aload-carrying member, and is the easiest proposed conductor to fabricate.
The third possibility is to use considerably less expensive oriented fiber reinforcedpolyester or other reinforced support structure material rather than the G10CR fiber-glassreinforced epoxy.
UNDERGROUND EXCAVATION
Superconducting magnetic energy storage devices are planned for Installation inunderground tunnels. See Fig. 6. Structural supports from the cold Inner helium dewar to the300-K rock make use of the rock as an economical load-bearing material. The rock is undercompression from Its own weight and the earth's overburden. Elastic analyses of granite underthe co!I load distribution generate compressive stresses having maximum values of ~103 barsand shear stress as of ~17 bars in the surrounding granite. These values are —10)C or less oflimiting strength criteria; hence, the tunnels should be stable.
Consideration of effects of cyclic loading during the 30-yr history, hydrologicconditions, or locating the dewar in weaker rocks suggests induced stresses may approachfailure; and rock bolting for wall stabilization !s a necessity. Rock properties forisotroplc granite were chosen to allow comparisons with calculations of Fuh et al. for adifferent tunnel design.
The first dewar segment Is physically connected to the wall so the loads are taken morethan 3.1 m away from the end access room. Segments two through six are attached for adistance of 12.9 m vertically along the tunnel wail. The axial pressure Is transmitted to thewall as constant axial components equal to 108 bars (1580 psl). The radial load is a minimumat the top and bottom of the coll tunnel and is a maximum at the mldplane of the tunnel. Theeffect is to increase Incrementally the radial pressure from 12.5 bars (182 psl) to a peakvalue of 100.5 bars (1470 psl) along the entire outer tunnel surface. The total force fromthe field is resolved Into radial and axial components. Figure 7 is an Illustration of theresolved components.
The maximum principal compressive stress given as a negative value on Fig. 8 is 103 bars(~1495 psi) occurring -15 m beiow the top of the room. Similar contours were calculated forother stresses. The minimum principal stress is compressive and is 75 bars (~1090 psi). Thehoop stress is compressive with a maximum value of 26 bars (~380 psi). The shear stress of~17 bars Increases approaching the mi dp lane.
33

EARTH'S SURFACE
XMIDPLANE
Fig. 6. Schematic of Quarter Section of Tunnel to Contain SMES Device
THIS nttMC snmeimau. MOOT mmzom/u. tnoHjwe
• tan OF nsrmwiTED
MMNCTKnELD.
mrnsais
Fig. 7. Loading System with Coil Supportedby Outer Wall
1 I I
TUNNEL • ROOM
CONTOUR INTERVAL IN bort
I bor < 14.5 (Kl
Fig. 8. Maximum Principal Compressive Stresswith Coil Supported by Outer Mall
34

A consulting contract was placed wfth Fenfx and Scfsson, Inc., a mfnlng engineering firm,to make a SMES tunnel excavation and construction study and to obtain costs for same. Thetunnel conforms to the configuration of Fig. 6. The study considered locating the coll depthsof 200, 300, and 400 m. Only the cost estimates for the 200-m depth are presented here.
The excavation study originally called for six, 1.82-m-diam drill holes with steellinings for vacuum pump-out lines; a production shaft, 3.96-m by 3.35-m with concrete linedstabilized walls and a skip hoist for subsequent use In assembly ing the storage coil; ahorizontal shaft, 3.7-m by 3.7-m, extending 250-m horizontally from the center line of thetunnel axis to an equipment room at the 227-m level; and an equipment room, 20 m by 20 m by10 m high, with Its own 3.9-m by 3.9-m vertical service shaft. The rock walls throughout theexcavation are to be stabflized with rock bolts.
The main storage coil tunnel is lined with impermeable load-bearing concrete walls with aminimum compressive strength of 422 to 563 kg/cm . Steel load bearing plates are mechanicallyanchored to both walls with 50-mm-diam by 1-m long zinc-plated rock bolts. The zinc platingIs required for a 30-year life. Tweiity-f Ive-ml 11 i meter copper pipes on 1-m centers areImbedded in the concrete lining of the tunnel walls. These supply heat to prevent freezing ofthe concrete and rock due to the heat leaks Into the dewar. Provision was made to removeground water seepage from behind the concrete. An underground equipment room was found toprovide a saving In the refrigerator system. Its remote location from the coil was necessaryto have the equipment in a low fringe field of 5200 G for maintenance.
Fenlx and Sclsson estimated the total cost of the above work at S48.5 million.Subsequent analysis and redesign resulted In a significant cost saving. The major designchanges follow. These are:
1. Locating the vacuum pumps In the underground equipment room make the six drilledshafts unnecessary, provided the equipment room and the horizontal drift leading to it aresomewhat enlarged. The net saving Is $9 million.
2. The vertical shaft to the equipment room can be eliminated and the main productionshaft used for all mining and maintenance functions, provided the main shaft is relocated andthe horizontal production drifts are extended. The net saving is 0.7 million.
3. The excavation study was performed at a stage in the design when the axial magneticforces were to be transmitted to both Inner and outer tunnel walls. Under the final concept,in which load-bearing struts do not contact the inner wall, this wall need not have a thickconcrete lining, can be of lower quality, and does not require heating pipes. The associatedcost reduction Is $2.0 million.
4. The study Included a steel bearing plate at the base of each support strut, at a costfor material and placement of $3 million. These plates have since been redesigned and theircost has already been included In Table 4, although the cost of the rock bolts which fastenthese plates to the tunnel wall are still counted In this section. These bolts, at$8 million, are a major cost Item.
The adjusted cost for excavating and preparing the tunnel, after considering the savingsof Items 1 through 4, becomes $33.8 million.
CRYOGENIC SYSTEM
Cooling of the superconducting coll is accomplished by means of a two-fluid system. Thecoll Is Immersed in a superflutd bath at 1.8 K that is maintained with an overpressure of1 atm. The 1.8-K temperature Is achieved by two means. The first Is a thermal barrierlocated In a small cross-sectional area portion of the dewar. This barrier sustains atemperature gradient with a small heat leak to an overlying layer of 4.5-K liquid helium. The
35
4.5-K liquid ts then pressurized at about 1 atm with cold helium gas. The second device ismerely a heat exchanger, a set of vertical pipes, located within the 1.8-K 1-atm liquid heliumbath. This heat exchanger operates at 1.8 K and 12.5 torr on the refrigerant side. Thelargest heat load to be removed is that due to thermal conduction along the support struts.The refrigerator provides the liquid helium and cold gas to the system, which distributesliquid helium to cool the coil to 1.8 K and cold gas to cool the support struts and dewarradiation shield. The refrigerator consists of the helium compressors, cold box, low pressurepumps, transfer lines, and helium storage facility. Some of the liquid at 4.5 K cools thepower leads. The liquid is vaporized by the leads and returned to the helium compressor atapproximately 300 K.
The support struts and dewar radiation shield are cooled with high-pressure helium gasfrom the cold box at temperatures of 63 K and 12 K. This 18.0-atm gas undergoes a 10.0-Ktemperature rise across the parts to be cooled and is then recirculated through the cold box.Low-pressure helium pumps provide the continuous pumping power to move 12.5-torr helium gasthrough the transfer lines and cold box for heat exchange and to raise the pressure to about1.0 atm at 300 K to feed the main helium compressors. The pumps are located underground inthe equipment room with the cold box.
Equipment that will need routine servicing and maintenance must, for occupationalreasons, be in a magnetic field of 200 G or less. Hence the below-ground equipment room forthe cold box and pumps must be at a distance of 250 m from the center of the magnet. Adjacentto the compressors at the surface will be a helium storage facility and a water coolingsystem.
Liquid in will be stored at 4.5 K on the surface in eight dewars during periods whenthe coil and k. dewar must be nonoperational for maintenance. A liquid-helium pump, locatedbeneath the coil dewar, provides a 225-m head to transfer the liquid, in reverse direction,through the 4.5-K coll-dewar heat exchanger supply line and a vertical transfer line.
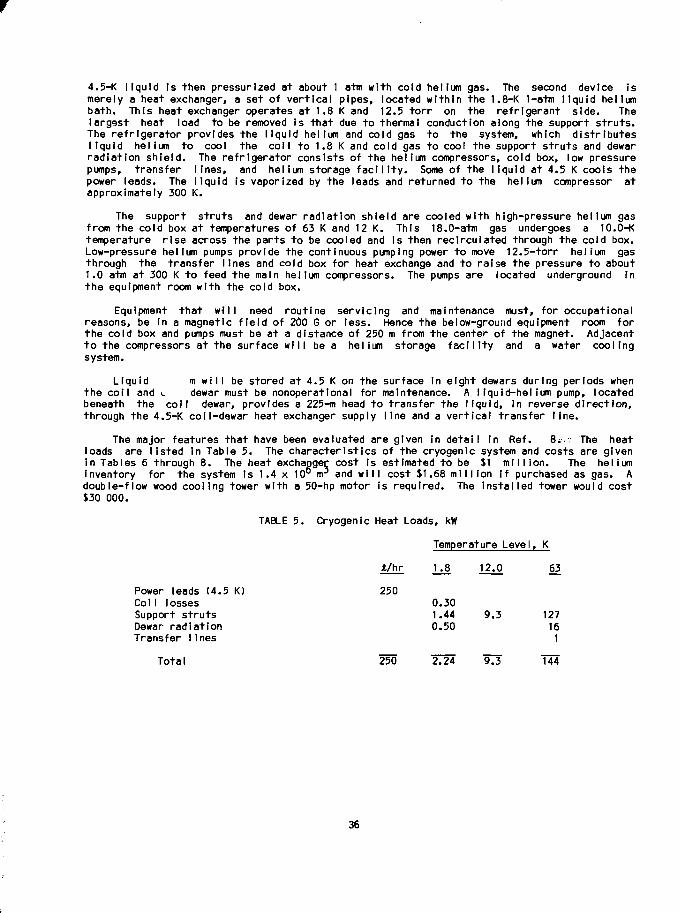
The major features that have been evaluated are given in detail In Ref. 8v. The heatloads are listed in Table 5. The characteristics of the cryogenic system and costs are givenIn Tables 6 through 8. The heat exchanger cost is estimated to be $1 million. The heliuminventory for the system is 1.4 x 10° nr and will cost $1.68 million If purchased as gas. Adouble-flow wood cooling tower with a 50-hp motor is required. The Installed tower would cost$30 000.
TABLE 5. Cryogenic Heat Loads, kW
Temperature Level, K
A/hr _K8 12.0 63
Power leads (4.5 K) 250Coll losses 0.30Support struts 1.44 9.3 127Dewar radiation 0.50 16Transfer lines 1
Total 250 2724 9 3 T44
36
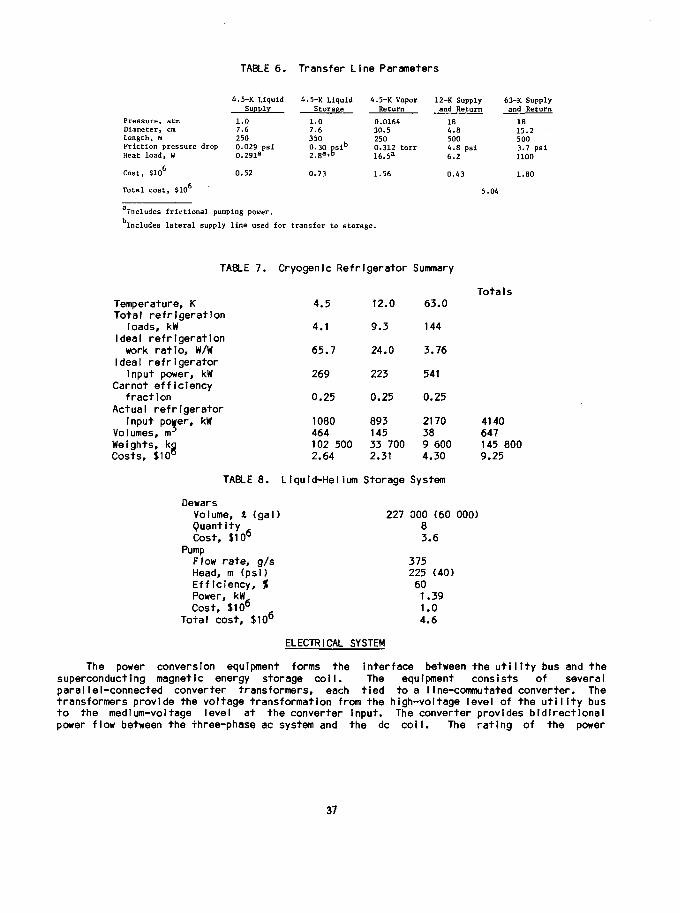
TABLE 6. Transfer Line Parameters
Pressure, atmDiameter, cmLength, mFriction pressure dropHeat load, U
Cost, S106
Total cost, $106
4.5-K LiquidSupply
1.07.62500.029 psi0.291a
0.52
4.5-K LiquidStorage
1.07.63500.30 ps i b
2.8a>6
0.73
4.5-K VaporReturn
0.016430.52500.312 torr16.5a
1.56
12-K Supplyand Return
184 .85004.8 psi6.2
0.43
5.04
63-K Supplyand Return
IB15.25003.7 psi1100
1.80
Includes frictional pumping power.
Includes lateral supply line used for transfer to storage.
TABLE 7. Cryogenic Refrigerator Summary
TotalsTemperature, KTotal refrigeration
loads, kWIdeal refrigerationwork ratio, W/W
Ideal refrigeratorInput power, kW
Carnot efficiencyfraction
Actual refrigeratorinput power, kW
Volumes, m3
Weights, kgCosts, $10°
4.5
4.1
65.7
269
0.25
1080464102 5002.64
12.0
9.3
24.0
223
0.25
89314533 7002.31
63.0
144
3.76
541
0.25
2170389 6004.30
4140647145 8009.25
TABLE 8. Liquid-Helium Storage System
DewarsVolume, i. (gal)QuantityCost, $10°
PumpFlow rate, g/sHead, m (psi)Efficiency, %Power, kWCost, $10°
Total cost, $106
ELECTRICAL SYSTEM
The power conversion equipment forms the interface between the utility bus and thesuperconducting magnetic energy storage coll. The equipment consists of severalparallel-connected converter transformers, each tied to a Iine-commutated converter. Thetransformers provide the voltage transformation from the high-voltage level of the utility busto the medium-voltage level at the converter Input. The converter provides bidirectionalpower flow between the three-phase ac system and the dc coil. The rating of the power
227 00083,
375225
601.1.4.
(60 000)
.6
(40)
,39,06
37

conversion equipment requires that It be divided into two identical modules; each of which inturn consists of four identical submodules. The heart of each submodule is a convertertransformer and two parallel-connected Graetz bridges forming one 12-pulse bridge. Theassumption Is made that a 230-kV system with a short-circuit capacity of over 4000 MVA isadequate to be used for the installation of a 1-GWh 250-MW SMES unit.
Different circuit configurations suitable for SMES converters are presented elsewhere.From consideration of these circuits the series-parallel switching scheme as shown in Fig. 9results in the lowest installed converter power and cost for a constant power system. Thiscircuit configuration results in a 40% reduction in the converter size compared to a converterunit which is designed for maximum voltage and maximum current. A constant-voltage converterwould not require switching and would need less reactive-power compensation.
The design cesl Is for an energy exchange of 3.6 x 10 J in four hours at a constant-powerrate with a maximum charging or discharging power of 250 MW. Maximum and minimum current andvoltages are respectively 50 kA and 15 kA and 16.7 kV and 5.0 kV. Figure 10 shows thevoltage, current, and power relationship for the SMES system in per unit and absoluteparameter values. A Iine-commutated converter with silicon controlled rectifiers, SCRs, asswitching elements is uniquely qualified as the power conditioning equipment for a SMES unit.Two converter modules with a current rating of 25 kA and a voltage rating of 10 kV at 12.5 kAare required to guarantee 250 MW output power under all load currents. The area bordered bydashed lines In Fig. 10 represents the operating range of the two converter modules. Avoltage drop of 1.0 kV at 25 kA results in a module rating of 11 kV and 25 kA. The totalinstalled converter power Is 2 x 11 kV x 25 kA = 550 MW. If two 8.33-kV 25-kA convertermodules are used and a \0% voltage increase of the no-load voltage over the rated voltage isallowed, then the installed converter power is reduced to 2 x 9.16 kV x 25 kA = 458 MW.However, the converter would not be capable of providing 250 MW in the current range of 25 kAto 28.8 kA. The darkened area in Fig. 10 indicates the insufficient converter power for thiscase. At 25 kA the maximum power would be 218.6 MW instead of 250 MW. The smaller converterrating is Justified in spite of the 12.6? reduction in output power within a small currentrange because of the substantial saving of 92 MW of converter power. At 40 $/kW this resultsIn a saving of $3.68 million. The total Installed converter power has been reduced by 52 MW;but, in addition, the mixed mode of operation allows the use of the module by-pass switchingscheme at a lower per unit cost of $35/kW. Table 9 summarizes the converter characteristics.
LIne-commutated converters, working in both the rectifier and the inverter mode ofoperation, require reactive power to compensate for the reactive-power demand of a SMES unitand to improve the power factor. A recent study by General Electric (GE) shows that thestatic VAR generator with a controlled inductance should be used when the SMES unit is for
Convertermodule I
f
vj
T l Switch 1
_ • - ' _Switch 2
_ r— i —
tConvertermodule 2
Byjxrestnyristor
Fig. 9. Series-Parallel Converter Module Switching Circuit
38

kV pu20.0 1.2
16.6 1.0
8.33 0.5 -
-8.33 -0.5 -
-16.6 -1.0
3.0 -1.2
v,v
\
i i
> i
ii
i i
i i
! 1
1
J
k0-5 , , ,25kA
1.0
50 kA 1,1
Fig. 10. Current-Voltage Diagram of SMES Unit and Converter
storage purposes and system stabilization and If only fo- storage,capacftors are adequate for VAR compensation.
less expensive switching
The reactive-power requirement is 58.1 MVAR. Commutation reactive power must be added tothe displacement reactive power and Is estimated to be about 50 MVAR. The total reactivepower Is, therefore, about 100 MVAR. For a converter operated in mixed mode, the reactivepower Is reduced by 20?. An additional cost of $25/kVA occurs for the VAR generator.
Table 10 summarizes the cost for the total converter system. The costs are in 1977dollars; however, if the converter cost development over the last 10 years Is an Indicationfor the future, then the converter cost will stay constant for the next 5 to 10 years.
39

TABLE 9. Converter Parametersa
Converter module
Maximum currentLoad voltage at 25 kANo-load voltagePower ratingNumber of converter modulesNumber of submodules In a converter module
Submodule
Maximum currentLoad voltage at 25 kANo-load voltagePower ratingNumber of Graetz bridges in a submodule
Graetz Bridge
Maximum currentNo-load voltagePower ratingNumber of 2000-V 1400-A, watercooled SCRs,
3 in series, 4 in parallel for each legof the bridge 72
Submodule Transformer
High voltage 230 kVLow voltage 1.68 kVSecondary phase current 10.21 kAPower rating 60 MVA
258.339.1622924
252.082.29
57.252
12.52.29
28.63
kAkVkVMW
kAkVkVMW
kAkVMW
aTwo converter modules In series-parallel switching arrangementfor 250-MW output power.
TABLE 10. Cost for Power Conditioning Equipment for the 1-GWh 250-MW SMES Unit
Converter including transformersSCR bridges, filters, by-passswitches, and building
VAR generator
Constant458 MW
Unft Cost$ /kVA
40
25
Power Mode, 50 MVAR
Total Cost$10°
18.3
1.319^6
Mixed406 MW,
Unit Cost$ /kVA
35
25
Mode40 MVAR
Total Cost$106
14.2
1.215.4
40

VACUUM SYSTEM
The dewar Is located 200 m below the surface of the earth. Three pairs of diffusionpumps are located at this lower level and are coupled as closely as possible to the dewarwall. They are located, equally spaced, around the lower circumference of the dewar and areconnected by appropriately sized lines to a single line that runs to the equipment room andthe mechanical blowers and pumps. See Fig. 11. Only the diffusion pumps, right anglevalves, and the refrigerated baffles are located immediately adjacent to the dewar. Pumpingcapacity of the system is set by the surfaces to be outgassed, the volume of the vacuum space,and the nature of the materials. Table 11 gives the dewar volume and surface area.
TABLE 11. Dewar Volume and Surface Area
Vacuum Vessel He 11 urn Vessel
Volume, n\i 5.4 x 10* 3.8 xNet volume, m 3 5.0 x 10⁴ 2.0 xSurface area, m z 4.0 x 10⁴ 3.7 x 10⁴
In the vacuum vessel there will be 960 tonnes of flbei—glass reinforced epoxy orpolyester struts with a surface area of 1.3 x 10 m and 32 tonnes of aluminlzed Mylarsuperlnsulation. From these two Items, together with the stainless steel and aluminumsurfaces, an out-gassing load can be expected after one hour of pumping of 1.6 x 10 5
torr-lIter/s.
Cost of the vacuum system hardware,Installation Is an equal cost.
Including Instrumentation, Is set at $830 thousand.
GUARD COIL
The effect of constraints on the magnetic field beyond the fence enclosing the 1-GWh SMEScoll on the land requirements and a possible guard coil were examined . If the property linecan be at a field of 10~ 3 T or greater an economical guard coil will have little effect on thelocation of the boundary. A guard coil can reduce the land requirement by at least a factorof 4 If the property line Is at a field of 3 x 10 T. A guard coll located at the same depth
Fig. 11. Schematic of Dewar and Vacuum System
41

as the main storage coll is more effective than a guard coil at ground level; but neither hasmuch effect on the field at ground level directly over the main coll. This field can only becontrolled by locating the main coll deeper. The parameters of the reference guard coll arepresented In Table 12. Use of the same 50-kA conductor as in the main storage coil has beenassumed.
TABLE 12. Guard Coil Parameters
Vertical locationMean radius, mHeight, mRadial thickness, mNumber of turnsConductor length, mMaximum current, kAMaximum field, TSelf Inductance, HMutual inductance to main coll, HEnergy change, MWhOperating temperature, KVacuum vessel minor diameter, m
ground level3300.5740.191110
R2.30 x 103
504.9397.68.31.851.0
The resulting pressure from the magnetic forces Is approximately 10 MPa (1400 psi) andis well below the stress limit of the conductor. The fields at the guard coll at maximumcharge are B R = 6.9 x 10~
3 T and B z = -1.56 x 10"z T. The guard coll Itself contributes
-1.47 x 10"z T to B z. The resulting force components are 3.78 x 10⁴ N/m upward and 8.58 x 10 4
N/m outward. The upward force should be compared to a conductor weight of 1.73 x 10 N/M.
The vector sum of Fy and F^ can be supported in hoop tension by 0.11 m of all.oy aluminumat a stress of 280 MPa (40 ksl) and a material cost of $1.76/kg. The upward force must betransmitted to the outer vessel wall by means of fiber-glass straps set into long, re-entranttubes in the outer wall. The upward forcecan be balanced by several meters of earth. Forcost purposes the weight of the concrete foundation is taken to be equal to this levitatingforce. A total of 3330 m of concrete is required, at an Installed cost of $500/m . Withcold support, the heat leak into the guard coil is very small compared to the main storagecoil. Thus the refrigeration requirement and the helium Inventory have been neglected.
Component costs of the guard coil are given In Table 13, where the same cost factors havebeen used as in Ref. 2 and 3. The superconductor is not graded, and the dewar is constructedof 0.5-cm-thick aluminum alloy. A vacuum vessel 1.0-m in cross-sectional diameter leaves morethan enough space for insulation and for construction tolerances.
TABLE 13. Component Costs for Guard Coll
Item50-kA superconducting cableStabilizer, fabricatedCol 1 winding laborStructural supportDewarConcrete foundations
Total
Cost $106
7.81.91.53.31.51.7
17.7
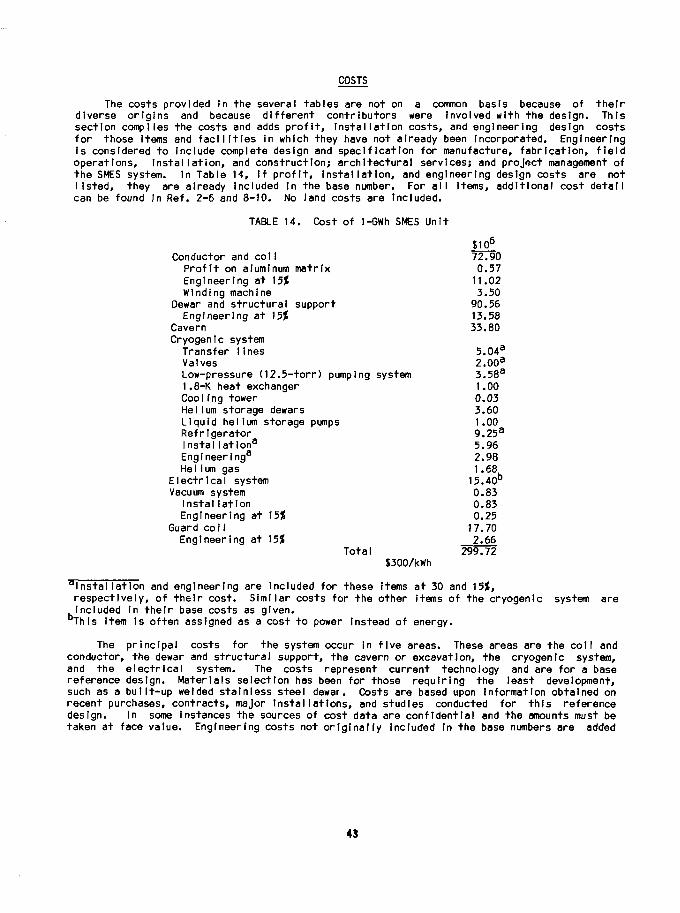
COSTS
The costs provided in the several tables are not on a common basis because of theirdiverse origins and because different contributors were Involved with the design. Thissection compiles the costs and adds profit, installation costs, and engineering design costsfor those items and facilities In which they have not already been Incorporated. Engineeringis considered to Include complete design and specification for manufacture, fabrication, fieldoperations, installation, and construction; architectural services; and project management ofthe SMES system. In Table 14, If profit, Installation, and engineering design costs are notlisted, they are already Included in the base number. For all items, additional cost detailcan be found In Ref. 2-6 and 8-10. No land costs are Included.
TABLE 14. Cost of 1-GWh SMES Unit
S106
Conductor and col IProfit on aluminum matrixEngineering at \5%Winding machine
Dewar and structural supportEngineering at \5%
CavernCryogenic system
Transfer 1inesValvesLow-pressure (12.5-torr) pumping system1.8-K heat exchangerCool Ing towerHelium storage dewarsLiquid helium storage pumpsRefrigeratorInstallatlona
Engineering3
Helium gasElectrical systemVacuum system
Instal1 at I onEngineering at 15$
Guard cor 1Engineering at 15?
72.900.5711.023.50
90.5613.5833.80
5.04a
2.00a
3.58a
1.000.033.601.009.25a
5.962.981.68U
15.40b
0.830.830.25
17.702.66
Total 299.72$300/kWh
installation and engineering are included for these items at 30 and 15JC,respectively, of their cost. Similar costs for the other Items of the cryogenic system areIncluded In their base costs as given.This Item is often assigned as a cost to power Instead of energy.
The principal costs for the system occur in five areas. These areas are the coll andconductor, the dewar and structural support, the cavern or excavation, the cryogenic system,and the electrical system. The costs represent current technology and are for a basereference design. Materials selectton has been for those requiring the least development,such as a built-up welded stainless steel dewar. Costs are based upon information obtained onrecent purchases, contracts, major Installations, and studies conducted for this referencedesign. In some instances the sources of cost data are confidential and the amounts must betaken at face value. Engineering costs not originally Included in the base numbers are added
43
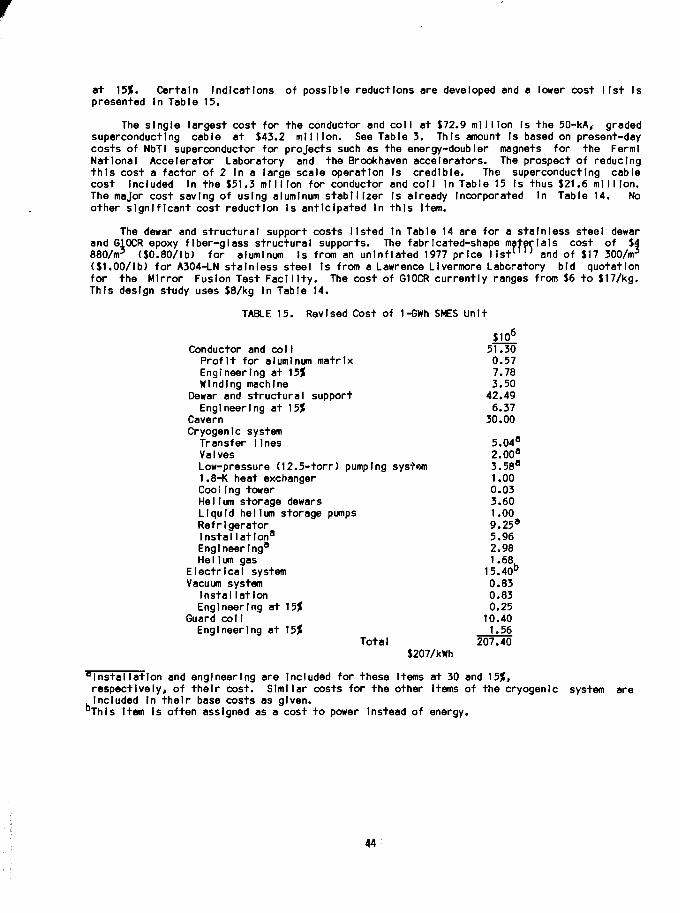
at 15$. Certain Indications of possible reductions are developed and a lower cost list Ispresented In Table 15.
The single largest cost for the conductor and coll at $72.9 million is the 50-kA, gradedsuperconducting cable at $43.2 million. See Table 3. This amount Is based on present-daycosts of NbTI superconductor for projects such as the energy-doubIer magnets for the FermiNational Accelerator Laboratory and the Brookhaven accelerators. The prospect of reducingthis cost a factor of 2 In a large scale operation Is credible. The superconducting cablecost Included In the $51.3 million for conductor and coil In Table 15 is thus $21.6 million.The major cost saving of using aluminum stabilizer Is already Incorporated In Table 14. Noother significant cost reduction Is anticipated In this Item.
The dewar and structural support costs listed In Table 14 are for a stainless steel dewarand G10CR epoxy fiber-glass structural supports. The fabricated-shape materials cost of $4880/m3 ($0.80/lb) for aluminum Is from an unlnflated 1977 price list111' and of $17 300/m3
(SI.00/1b) for A304-LN stainless steel Is from a Lawrence Llvermore Laboratory bid quotationfor the Mirror Fusion Test Facility. The cost of G10CR currently ranges from $6 to $17/kg.This design study uses $8/kg In Table 14.
TABLE 15. Revised Cost of 1-GWh SMES Unit
Conductor and col 1Profit for aluminum matrixEngineering at \5%Winding machine
Dewar and structural supportEngineering at 15J
CavernCryogenic system
Transfer 1lnesValvesLow-pressure (12.5-torr) pumping systom1.8-K heat exchangerCoo 11ng towerHelium storage dewarsLiquid helium storage pumpsRefrigeratorInstallation8Engineering8
He 11 urn gasElectrical systemVacuum system
InstallationEngineering at 15%
Guard col 1Engineering at 15)t
$106
51.300.577.783.50
42.496.37
30.00
5.04a
2.00a
3.58a
1.000.033.601.009.25a
5.962.981.68,_
15.40b
0.830.830.25
10.401.56
Total 207.40$207/kWh
"Installation and engineering are Included for these Items at 30 and \5%,respectively, of their cost. Similar costs for the other Items of the cryogenic system areIncluded in their base costs as given.
"This Item Is often assigned as a cost to power Instead of energy.
The revised costs of Table 15 Incorporate other changes. These are a change from astainless steel dswar to aluminum, a support structure material cost of $4/kg based onquantity production, and the use of a multiplier of 2 for the Installed cost ofpolyester-fiber glass composite and other materials. The change from stainless steel to analuminum dewar requires a change from a 13-segment to a 25-segment dewar. This occurs becausethe thermal stress is exceeded for an aluminum dewar with fewer segments.
The cavern costs are fixed mostly by the materials and mining equipment. If the rate ofexcavation is doubled without additional labor and equipment, then a saving of about$3.8 million can be made.
The cryogenic system cost indicates an area for which engineering optimization would bemost productive. Transfer line costs are based on estimates made available by Cryenco. Therefrigerator cost, the Installation cost, and the engineering cost are based upon a reasonableextrapolation of large liquid helium plants presently being Installed in the United States.Optimization would possibly reduce the cryogenic system cost by 15 to 30%; however,there wouldbe a compensating Increase In the structural support cost for a lower overall net saving.Refrigerator costs corresponding to a reduced structural support thermal conductivity by afactor of 2 would change the last line of Table 7 to $2.00, 1.42, 2.86, and 6.28 million.The total saving In refrigerator cost is $2.96 million . Such an optimization Is not Includedin Table 15.
The guard coll cost has been reduced by changes in both the superconductor and dewarcosts corresponding to those made above for the main energy storage coil.
Thus, based upon the point reference design and on the material and fabrication cosfspresented in this report, the capital cost of storing energy In a 1-GWh SMES system rangesfrom $207 to $300/kWh. These values extrapolate Inversely as the maximum energy to theone-third power. For a 10-GWh SMES unit the corresponding costs become $96 and $139/kWh.Clearly, the economy of size Is important.
The possibility of this type of saving being made without an associated increase for someother part of the system is unlikely. A more realistic percentage reduction by optimizationhas been judged to be nearer to 20?, although even this appears high for optimization of theentire system. On this basis the unit installed costs for a 10-GWh system would then rangefrom $77 to $111/kWh. These costs must be recognized as being higher by factors of 2 to 3than previously developed numbers.
CONCLUSIONS
A SMES system has the potential of providing a very advanced and efficient energy storagesystem for electric utility diurnal load-1 eve I ing. The cost of constructing such a system maybe high. Nevertheless a more thorough engineering design is warranted. SMES efficiency hasbeen reevaluated In a utility operational scenario in a recent study by Arthur D. Little,Inc. 1 2' Comparison with battery storage underground pumped hydrostorage, compressed airenergy storage, and conventional generation capacity shows that SMES is economicallycompetitive and is the most attractive of th<» large systems when the rated energy deliveredper year per unit power capacity Is above about 1750 kWh/yr per kW. See Figs. 3.8 and 3.9 ofRef. 12. This result Is predicated upon system costs lower than those developed here.
REFERENCES
1. F. R. Kahlhammer, "Energy Storage: Applications, Benefits and Candidate Technologies,"Proc, of the Symp. on Energy Storage of the Electrochemical Society, March 1976,pp. 1-20.
45

2. R. I. Schermer, "1-GWh Diurnal Load-Leveling Superconducting Magnetic Energy StorageSystem Reference Design; Appendix A: Energy Storage Coil and Superconductor," Los AlamosScientific Laboratory report LA-7885-MS Vol. II (1979).
3. C. N. Cochran, R. K. Dawless, and J. B. Whltchurch, "1-GWh Diurnal Load-LevelingSuperconducting Magnetic Energy Storage System Reference Design; Appendix B: Cost Study,High-Purity Aluminum Production," Los Alamos Scientific Laboratory report LA-7885-MSVol. Ill (1979).
4. J. G. Bennett and F. D. Ju, "1-GWh Diurnal Load-Leveling Superconducting Magnetic EnergyStorage System Reference Design; Appendix C: Dewar and Structural Support," Los AlamosScientific Laboratory report LA-7885-MS Vol. IV (1979).
5. R. W. Boom, ed., "Wisconsin Superconductive Energy Storage Project," Vol. I and II,Engineering Experiment Station, College of Engineering, University of Wisconsin,Madison, Wl (1974 and 1976).
6. J. G. Bennett and F. D. Ju, "1-GWh Diurnal Load-Leveling Superconducting Magnetic EnergyStorage System Reference Design; Appendix C: Dewar and Structural Support," Los AlamosScientific Laboratory report LA-7885-MS Vol. IV (1979).
7. G. F. Fun, T. Doe, and B. C. Haimson, "Design of Underground Tunnels for SuperconductiveEnergy Storage," Supplemental Volume, Eighteenth US Symposium on Rock Mechanics, USNational Comm. Rock Mech., National Acad. Sci., F. Wang, and G. Clark, Eds., (ColoradoSchool of Mines Press, Boulder, CO, 5A5-6 1977).
8. D. B. Colyer and R. I. Schermer, "1-GWh Diurnal Load-Leveling SuperconductingMagnetic Energy Storage System Reference Design; Appendix E: Cryogenic System," LosAlamos Scientific Laboratory report LA-7885-MS Vol. VI (1979).
9. H. J. Boenig, "1-GWh Diurnal Load-Level Ing Superconducting Magnetic Energy StorageSystem Reference Design; Appendix F: 1-GWh Electrical System Design," Los AlamosScientific Laboratory report LA-7885-MS Vol. VII (1979).
10. C. B. Llndh, R. V. Pohl, and H. T. Trojan, "1-GWh Diurnal Load-LevelingSuperconducting Magnetic Energy Storage System Reference Design; Appendix G: DesignStudy: Thyrlstor Converter Stations for Use with Superconducting Magnetic Energy StorageSystems," Los Alamos Scientific Laboratory report LA-7885-MS Vol. VIII (1979).
11. Materials Jour., Materials Selector 84, No. 6, 26 (1977).12. "An Evaluation of Superconducting Magnetic Energy Storage," Arthur D. Little, Inc.
report to be published.
4.6
PROJECT SUMMARY
Project Title:
Principal Investigator:
Organization:
Project Goals:
Project Status:
Contract Number:
Contract Period:
Funding Level:
Funding Source:
"Superconductive Energy Storage"
R.W. Boom
531 Engineering Research BuildingUniversity of WisconsinMadison, Wisconsin 53706(608)263-5027
To develop hardware components, produce engineering systemdesigns, procure manufacturing and assembly equipmentdesigns, revise cost estimates, and assess operationalefficiencies for large underground superconductivestorage systems.
Component development in three areas: cryogenics, conductorand structures is under way to be completed in FY-81.Rock mechanics design and experimentation is under wayto be completed in FY-81. Parallel efforts supported bythe Wisconsin Utilities are under way on the same schedulein five other areas: magnetics, environmental studies,system design, electrical, and safety.
EY-76-C-02-2844-000
FY-78
$600 K
U.S. Department of EnergyDivision of Energy Storage
47

COMPONENT DEVELOPMENT FOR LARGE MAGNETIC STORAGE UNITS
S. W. Van Sciver and R. U. BoomUniversity of Wisconsin
Madison, Wisconsin 53706
ABSTRACT
A survey of University of Wisconsin research and development on components for large scalesuperconductive energy storage units is presented. The major activities involve development ofthe aluminum stabilized-NbTi composite conductor and the fiberglass reinforced polyester strut.Scale models of these components have been produced and tested. Design activities have beendirected toward consideration of a 15 tunnel design to reduce axial structure. Rock mechanicsstudies of the 15 tunnel design are also reported.
INTRODUCTION
The Superconductive Energy Storage Project at the University of Wisconsin was describedin papers by R. W. Boom and S. W. Van Sciver in the Proceedings of the 1978 Mechanical andMagnetic Energy Storage Contractors' Review Meeting, DOE Report CONF-781046.^ • ' Those twopapers include a review of technical progress from 1970 to 1978 in the evolution of systemdesign and the development of components. The conclusions given at that time are:
1. A one layer, thin wall, high current superconductive solenoid is probably the bestdesign.
2. Bedrock structure is needed.
3. Pool cooling with superfluid helium is preferred.
4. The conductor is a composite of NbTi and high purity aluminum which has full cryo-genic stability.
5. The conductor, dewar and associated structure are to be rippled at approximately a onemeter radius of curvature.
6. The design is a multi-tunnel sectored solenoid to save on axial structure.
In FY-79 the design has been refined, more detailed tunneling cost studies have beenundertaken and work on system assembly has been initiated. The conductor and strut developmenthas continued through scaled sample tests. Electrical system studies, unit size preference andbridge cost estimates have also continued and are presented in a companion paper by J. J.Skiles.t3'
Our present preference is for units of 5000 MWh size. This size is a compromise betweenless expensive larger units and the need for several redundant smaller units for reliability.Relative costs are given in Table 1. The Wisconsin Electric Utility companies have a combinedpeak capacity of 8880 MW installed in 1979. It has been assumed for several years that10,000 MWh from storage would be an appropriate amount for Wisconsin. In the past year it has
48

1051
,000,000,000100
been tentatively decided that the use of two 5000 MWh units would be preferable. Each unitwould be rated at 500 MW for 10 hour discharge at constant power level and would be dischargedto 10% of its stored energy daily. To account for a residual 10% energy always in storage andto account for losses the actual storage capacity of a unit is 1005% larger than the amountused. Thus the actual size recommended for construction is approximately 5500 MWh.
TABLE 1. Relative Capital Costs* ofSuperconductive Magnetic Storage Units
Size (MWh) Relative Capital Cost/Unit Energy
1.001.262.164.63
*Based on scaling relations presented in Ref. 4.
We tentatively recommend a 100 MWh model unit as the first storage device to be builtafter the component development and fabrication phase is completed in FY-83. Successfulcompletion of the 100 MWh model would probably be followed by the construction of a 1000 MWhdemonstration plant.
DESIGN
The design of the Wisconsin superconductive energy storage unit has emphasized the demon-stration unit size of 1000 MWh discharge capabilities/ ' Recent work has been directed towarda net,- design which reduces the need for axial structure in the unit. A sketch of this designis ihown in Fig. 1. There are 15 tunnels arranged in a circular pattern. The resultantforces are primarily radial directed outward along the 40 m radii. The orientation of theforces normal to the rock structure greatly reduces the shear loading and the need for axialstructure. The use of many tunnels reduces the accumulation of axial forces by transferringthese forces to the bedrock more frequently.
The central tunnels would have their turns wound perperdicular to the minor radius. Thetwo tunnels at ±69° would have the turns inclined at about 10° from horizontal. The endtunnels at ±90° are 20% larger in diameter with 20% more turns which are inclined at about 40°from perpendicular. The above distribution of turns reduces end fields in each tunnel andgenerally makes the overall flux lines parallel to the winding layer in each tunnel. Theparameters are listed in Table 2.
In comparison to earlier designs approximately the same amount of radial strut materialis required to carry the magnetic force to the rock face. The axial strut material is only 4%of the previous designs. The savings of axial strut materials is due to the multi-tunnels andthe circular configuration. The axial cold structure is only 1/8 as much as the cold structurefor previous three tunnel designs.

Fig. 1. Cross Section of New 15 Tunnel Energy Storage Magnet Design
TABLE 2. Fifteen Tunnel Solenoid
Energy StoredMajor RadiusMinor RadiusTotal TurnsTurns per Central TunnelTurns per End TunnelCurrent per TurnCentral Average FieldMaximum FieldTotal Radial ForceTotal Axial ForceRadial Strut Material*Axial Cold Structure*Axial Strut Material*
1186 MWh120 m40 m
5543643
300,000 A2.5 T4.0 T4.4 x 10 1 0 N1.7 x 103
0.79 x09 N7O 6Kg
1.2 x 10° Kg0.03 x 106 Kg
•Material is polyester fiberglass used at 1.9 x 10⁸ N/m2
(27,000 psi).
50
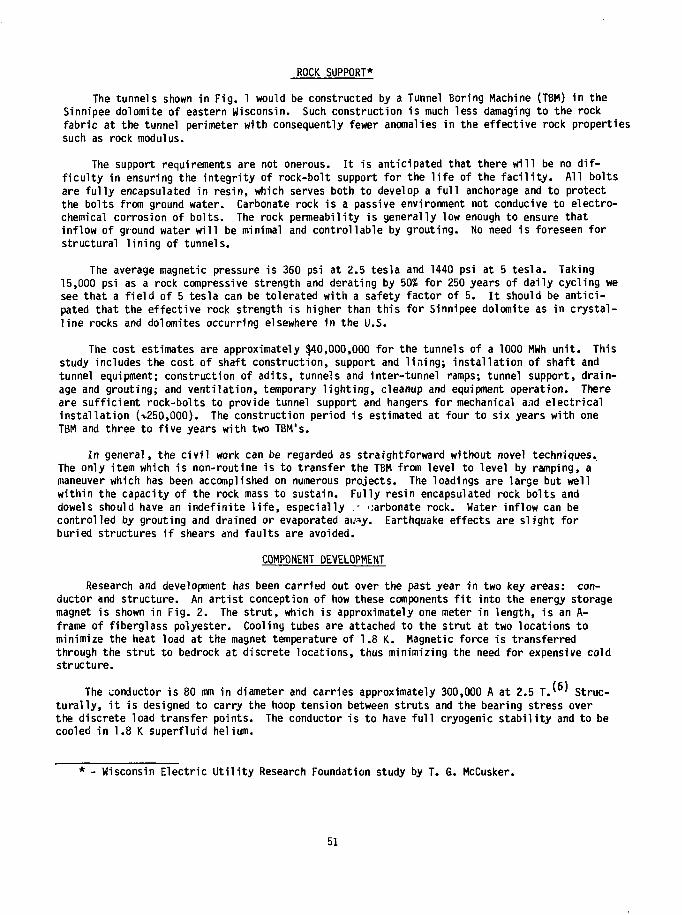
ROCK SUPPORT*
The tunnels shown in Fig. 1 would be constructed by a Tunnel Boring Machine (TBM) in theSinnipee dolomite of eastern Wisconsin. Such construction is much less damaging to the rockfabric at the tunnel perimeter with consequently fewer anomalies in the effective rock propertiessuch as rock modulus.
The support requirements are not onerous. It is anticipated that there will be no dif-ficulty in ensuring the integrity of rock-bolt support for the life of the facility. All boltsare fully encapsulated in resin, which serves both to develop a full anchorage and to protectthe bolts from ground water. Carbonate rock is a passive environment not conducive to electro-chemical corrosion of bolts. The rock permeability is generally low enough to ensure thatinflow of ground water will be minimal and controllable by grouting. No need is foreseen forstructural lining of tunnels.
The average magnetic pressure is 360 psi at 2.5 tesla and 1440 psi at 5 tesla. Taking15,000 psi as a rock compressive strength and derating by 50% for 250 years of daily cycling wesee that a field of 5 tesla can be tolerated with a safety factor of 5. It should be antici-pated that the effective rock strength is higher than this for Sinnipee dolomite as in crystal-line rocks and dolomites occurring elsewhere in the U.S.
The cost estimates are approximately $40,000,000 for the tunnels of a 1000 MWh unit. Thisstudy includes the cost of shaft construction, support and lining; installation of shaft andtunnel equipment; construction of adits, tunnels and inter-tunnel ramps; tunnel support, drain-age and grouting; and ventilation, temporary lighting, cleanup and equipment operation. Thereare sufficient rock-bolts to provide tunnel support and hangers for mechanical and electricalinstallation (1.250,000). The construction period is estimated at four to six years with oneTBM and three to five years with two TBM's.
In general, the civil work can be regarded as straightforward without novel techniques.The only item which is non-routine is to transfer the TBM from level to level by ramping, amaneuver which has been accomplished on numerous projects. The loadings are large but wellwithin the capacity of the rock mass to sustain. Fully resin encapsulated rock bolts anddowels should have an indefinite life, especially .- carbonate rock. Water inflow can becontrolled by grouting and drained or evaporated at. y. Earthquake effects are slight forburied structures if shears and faults are avoided.
COMPONENT DEVELOPMENT
Research and development has been carried out over the past year in two key areas: con-ductor and structure. An artist conception of how these components fit into the energy storagemagnet is shown in Fig. 2. The strut, which is approximately one meter in length, is an A-frame of fiberglass polyester. Cooling tubes are attached to the strut at two locations tominimize the heat load at the magnet temperature of 1.8 K. Magnetic force is transferredthrough the strut to bedrock at discrete locations, thus minimizing the need for expensive coldstructure.
The conductor is 80 mm in diameter and carries approximately 300,000 A at 2.5 T V ' Struc-turally, it is designed to carry the hoop tension between struts and the bearing stress overthe discrete load transfer points. The conductor is to have full cryogenic stability and to becooled in 1.8 K superfluid helium.
* - Wisconsin Electric Utility Research Foundation study by T. 6. McCusker.
51

Fig. 2. Artist Sketch of Magnet and Support Structure
Structural research has been in the selection of candidate materials and compressivetesting of model struts. Conductor work has involved studies of stabilizer, superconductor andhelium heat transfer as well as fabrication and testing of assembled model conductors. Thissection surveys the recent work in these two developmental areas.
CONDUCTOR
The Wisconsin conductor design for energy storage contains four components. Current iscarried by a composite of NbTi in an aluminum stabilizer. The conducting elements are heldtogether by an internal structural member or cruciform which is made from high strengthaluminum alloy. To restrict the high purity aluminum from excessive plastic flow the super-conductor, stabilizer and cruciform are surrounded by an aluminum alloy skin."'
In an effort to understand enhanced current densities in NbTi, transmission electronmicroscopy of four commercial multifilamentary composites of varying composition in the rangeNb 46.5 to 53 w/o Ti has been carried out.'8) Detailed investigation of the structures foundin these composites has shown that a-precipitates play at least as important a role as dis-location cell size in the critical current density. Although this type of study is complex, itrepresents the only reliable method to study changes in current density that result from smallvariations in fabrication and heat treatment.
To insure stability the sectored composite conductor must have adequate thermal conduc-tivity in the radial direction. The thermal resistance of the bond between the stabilizer andthe skin, the thermal conductivity of the skin and the heat transfer to the helium will governthe radial flow of heat. The method of joining the conductor components and the selection of askin alloy are thus important considerations.
The bonding between conductor components is under investigation to develop the best manu-facturing and assembly procedure.'9' Radial heat transfer and electrical resistivity studiesof two component specimens have shown that drawing is far superior to swaging for conductorassembly. Swaged samples typically have thermal or electrical boundary resistances betweencomponents which are one to two orders of magnitude greater than occurs in drawn specimens. Asa result of these studies, swaging has been eliminated as a manufacturing- technique for theconductor.
52

Heat transfer studies in superfluid helium have continued to develop further understandingof conductor stability in this cooling medium. As was discussed in the 1978 contractors'review meeting, peak heat fluxes in superfluid helium have the potential of being two to threetimes that which occurs in normal helium. Design values for full cryogenic stability equatethe critical heat flux, q, with the joule heat generated when the current in the stabilizer
I p/A = qS
where p is the resistivity of the stabilizer and S is the surface area,translate directly to higher overall current densities.
(1)
Higher heat fluxes
Recent transient heat transfer studies at Wisconsin have shown further advantage to super-fluid helium. An extended period of "transient stability" appears to exist at higher heatfluxes than the steady state peak value. For example, under conditions where the steady statepeak may be lesswithout burnout.
eady state peak value. For example, under conditions where the steady stahan 1 W/cm , heat can be transferred at the rate of 4 W/cm for 250 msec
The above subcomponent studies have led to the fabrication and preliminary testing of amodel conductor.^'' A photomicrograph of the assembled conductor is shown in Fig. 3. Theconductor was prepared in the University of Wisconsin fabrication facilities.
Fig. 3. Photomicrograph of Assembled Model Energy Storage Conductor
The conductor component was chosen to match as closely as possible the full scale conduc-tor. A standard NbTi-Cu multifilament composite was chosen as the superconducting component.The conductor contains six wires, each capable of 900 A at 4.2 K and 2.1 T. The six web6061-T6 aluminum alloy cruciform was manufactured in industry in 4.5 m lengths. The cruciformhas a 9.3 mm diameter and a cross sectional area of 23 mm2. The skin and wedge were extrudedfrom high purity aluminum with a modest resistance ratio (RRR = P273|</p4 ?K^
of 150<
53

The fabrication procedure for the conductor is shown in Fig. 4. All components arechemically cleaned and mechanically abraided to break the oxide surface. The cruciform, super-conductor and wedges are then drawn down in the tubing which forms the skin. The first drawingstep brings the skin in contact with the other components. The second and last drawing stepbrings the conductor to final size and pierces the cruciform into the skin. The piercingprocess insures the formation of an integral conductor with good mechanical and electricalproperties.
Al ALLOYSTRENGTHMEMBER
NbTi/CuSUPERCONDUCTING
WIRE
Al ALLOY TUBE
PURE Al WEDGE
CLEAN AND PACKCOMPONENTS INTOTUBE
DRAW UNTIL TUBE CONTACTS WEDGES
Fig. 4. Fabrication Procedure Used in Making the Model Conductor
Planning is under way to test the model conductor in a magnetic field. The design capa-bilities of the conductor are 5400 A at 2 T and 4.2 K with full cryogenic stability.
STRUCTURES
The structural requirement for superconductive energy storage are for a large quantity oflow thermal conductivity, high load carrying support structure to transfer the radial and axialload from the 1.8 K magnet to the bedrock. The following is a list of important criteria forchoosing the appropriate material for supporting the magnet: low thermal conductivity, highcompressive strength, moderate fatigue life, and low cost.
In order to determine the best candidate material, numerous commercial fiber reinforcedcomposites have been tested, both for ultimate strength as well as fatigue life. This workhas been carried out at room temperature as well as in liquid nitrogen and liquid helium.Glass fiber reinforced polyester has evolved as the best material available, because it hascomparable strength to epoxy-fiberglass and is substantially less expensive. Additionally, thepolyester appears more resistant to thermal stock than the other composites.
Most of these compressive tests have been carried out in rod material. However, the strutdesign which has evolved uses sheets or plates of composite materials. Recent studies havebegun to look at sheet material both machined into rod and with rectangular cross section."2'The ultimate strengths of these materials along with previous measurements are shown in
54
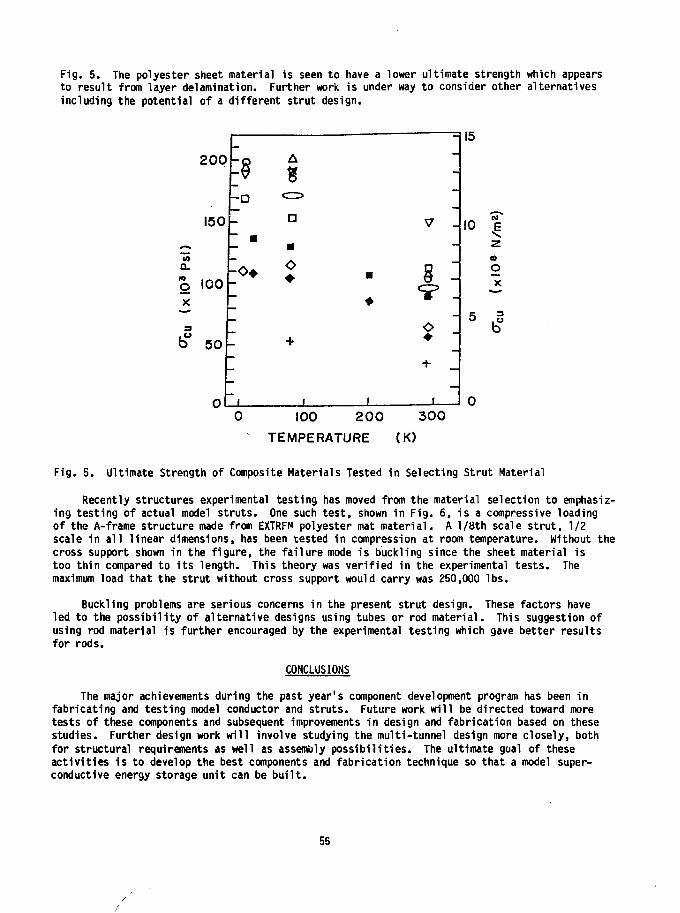
Fig. 5. The polyester sheet material is seen to have a lower ultimate strength which appearsto result from layer delamination. Further work is under way to consider other alternativesincluding the potential of a different strut design.
15
coO L10
O
200
150
100
50
0
:§- D
~ •
-<>•
A
<=>
a
• <>•
+
•
-
-
v _
§ :
i
-
- 10
ctO
- 5
0 IO0 200 300TEMPERATURE (K)
F ig . 5. Ult imate Strength of Composite Mater ials Tested in Select ing St ru t Material
Recently structures experimental t es t i ng has moved from the material select ion to emphasiz-ing tes t i ng of actual model s t r u t s . One such t e s t , shown in F i g . 6 , i s a compressive loadingof the A-frame s t ructure made from EXTRFN polyester mat ma te r i a l . A l / 8 t h scale s t r u t , 1/2scale i n a l l l i near dimensions, has been tested in compression at room temperature. Without thecross support shown in the f i g u r e , the f a i l u r e mode i s buckling since the sheet material i stoo t h i n compared t o i t s length . This theory was v e r i f i e d i n the experimental t e s t s . Themaximum load tha t the s t ru t without cross support would carry was 250,000 l b s .
Buckling problems are serious concerns i n the present s t ru t design. These factors haveled to the p o s s i b i l i t y of a l te rna t i ve designs using tubes or rod ma te r i a l . This suggestion ofusing rod material i s f u r the r encouraged by the experimental t es t i ng which gave bet ter resu l tsfo r rods.
CONCLUSIONS
The major achievements during the past year 's component development program has been infabr i ca t ing and tes t ing model conductor and s t r u t s . Future work w i l l be directed toward moretests of these components and subsequent improvements i n design and fab r i ca t ion based on thesestud ies. Further design work w i l l involve studying the mul t i - tunnel design more c lose ly , bothfo r s t ruc tura l requirements as well as assembly p o s s i b i l i t i e s . The ul t imate goal of thesea c t i v i t i e s i s t o develop the best components and fab r i ca t i on technique so tha t a model super-conductive energy storage un i t can be b u i l t .
55
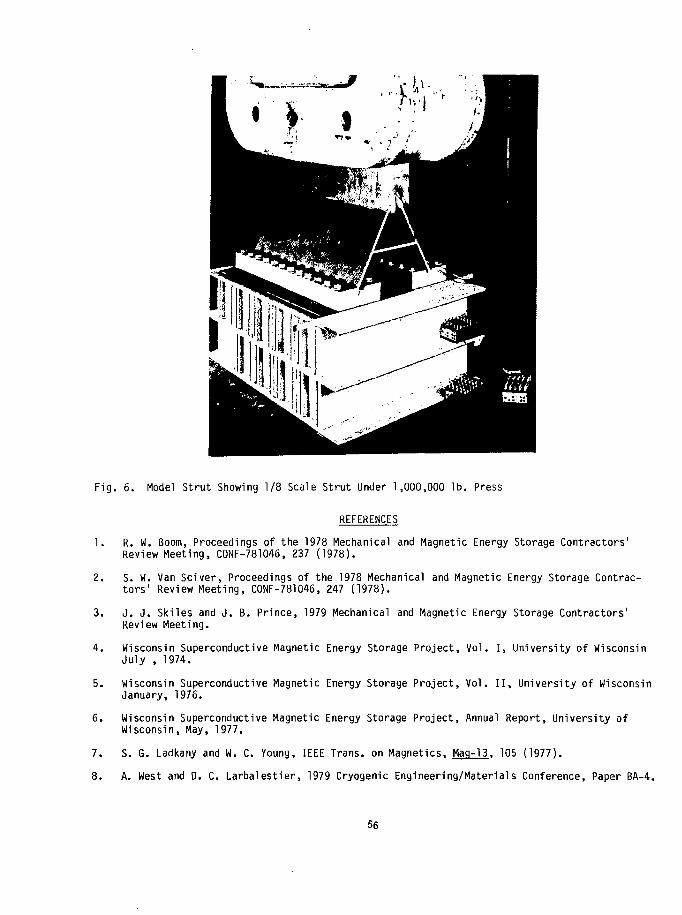
Fig. 6. Model Strut Showing 1/8 Scale Strut Under 1,000,000 lb. Press
REFERENCES
1. R. W. Boom, Proceedings of the 1978 Mechanical and Magnetic Energy Storage Contractors'Review Meeting, CONF-781046, 237 (1978).
2. S. W. Van Sciver, Proceedings of the 1978 Mechanical and Magnetic Energy Storage Contrac-tors' Review Meeting, CONF-781046, 247 (1978).
3. J. J. Skiles and J. B. Prince, 1979 Mechanical and Magnetic Energy Storage Contractors'Review Meeting.
4. Wisconsin Superconductive Magnetic Energy Storage Project, Vol. I, University of WisconsinJuly , 1974.
5. Wisconsin Superconductive Magnetic Energy Storage Project, Vol. II, University of WisconsinJanuary, 1976.
6. Wisconsin Superconductive Magnetic Energy Storage Project, Annual Report, University ofWisconsin, May, 1977.
7. S. G. Ladkany and W. C. Young, IEEE Trans, on Magnetics, Mag-13, 105 (1977).
8. A. West and D. C. Larbalestier, 1979 Cryogenic Engineering/Materials Conference, Paper BA-4.
56
9. S. W. Van Sciver and K. T. Hartwig, 1979 Cryogenic Engineering/Materials Conference,Paper KA-3.
10. S. U. Van Sciver, Cryogenics, J9, 385 (1979).
11. K. T. Hartwig, 1979 Cryogenic Engineering/Materials Conference, Paper KA-2.
12. Z.G. Khim, 1979 Cryogenic Engineering/Materials Conference, Paper EB-6.
57

PROJECT SUMMARY
Project Title:
Principal Investigator:
Organization:
Project Goals:
Project Status:
Contract Number:
Contract Period:
Funding Level:
Funding Source:
"Superconductive Energy Storage"
R.W. Boom
531 Engineering Research BuildingUniversity of WisconsinMadison, Wisconsin 53706(608)263-5027
To develop hardware components, produce engineering systemdesigns, procure manufacturing and assembly equipmentdesigns, revise cost estimates, and assess operationalefficiencies for large underground superconductivestorage systems.
Component development in three areas: cryogenics, conductorand structures is under way to be completed in FY-81.Rock mechanics design and experimentation is under wayto be completed in FY-81. Parallel efforts supported bythe Wisconsin Utilities are under way on the same schedulein five other areas: magnetics, environmental studies,system design, electrical, and safety.
EY-76-C-02-2844-000
FY-78
$600 K
U.S. Department of EnergyDivision of Energy Storage
59

ELECTRICAL ENGINEERING CONSIDERATIONS FORDIURNAL SUPERCONDUCTIVE STORAGE DEVICES
J. J. SkilesEnergy Research CenterUniversity of WisconsinMadison, Wisconsin 53706
J. S. Prince, Jr.Wisconsin Electric Power Company231 W. Michigan AvenueMilwaukee, Wisconsin 53201
ABSTRACT
A report i s given of e lectr ical studies at the University of Wisconsin associated with thedesign and operation of superconductive magnetic energy storage (SMES) systems u t i l i zed fore lec t r ic u t i l i t y load level ing. The power delivery capabi l i ty of the phase controlled thyr is torinductor-converter (I-C) bridge and the necessity for minimizing or compensrting for the reac-t i ve power drawn from the power system by the I-C unit are ident i f ied as major power systemconsiderations. A System Planning Analysis for Evaluating SMES i s suggested.
INTRODUCTION
Superconductive magnetic energy storage (SMES) designs for load leveling on power systemsare based on a superconductive coi l in a l iqu id helium dewar which stores dc magnetic energyand is interfaced to an electr ic power system through a ful l -wave, three-phase, Graetz bridgecapable of reversible converter or inverter operation^1 ' as shown in Fig. 1 .
ma cmiKOiaD REVERSIBLEPOHER AC/DC BRIDGE CONVERTER
l D E W
SUPERCONDUCTIVE IWUCTORO W N E D
Fig. 1. Basic Circuit Elements for Superconductive Energy Storage Inductor-Converter (I-C)Unit for Power System Applications
60
The electrical insulating properties of helium limit the allowable dc voltage across thesuperconductive coil from less than 10 KV to a few tens of KV in most designs. The economicsof scale'2' favor large energy storage capability and units as large as 10,000 MWh capacityhave been proposed, with power ratings as high as 300 MW to 500 MW. This corresponds to dccoil currents in the range of 300,000 amperes or more.
The Graetz bridges use commercially available power thyristors with phase angle controlto regulate the power through the bridge. Available thyristors do not have 10 KV or 300,000amp capacities in single units and consequently the bridges are constructed of a number ofthyristor modules in series and in parallel to obtain the necessary voltage and current ratingof the bridge. Continued progress in power semiconductor technology will probably result insimpler designs with individual thyristors with higher voltage and current ratings than arecurrently available.
The requirement for series and parallel connection of modules, although complicating thedesign, is not all on the negative side. Isolation of failed thyristor modules will permitcontinued operation of the unit at reduced power rating. Also, a variety of control schemesare possible with multiple modules that is advantageous in controlling reactive power drawnfrom the system and in minimizing power frequency harmonics introduced into the system.
The favorable experience with high voltage inductor-converter (I-C) phase controlledthyristor bridges in high voltage dc transmission terminals and with heavy current pulsedpower supplies suggests that the Kraetz bridge circuit will not be a major design problem infull-size SMES storage units suitable for power system use. As will be discussed later, acomplicating design consideration is the possibility that the I-C bridge should be designedfor constant power capability while the coil is in the discharge mode.
MAJOR ELECTRICAL CONSIDERATIONS
A number of major electrical problems have been identified and reported in the literature.Many are interrelated. These problems include:
1. Bridge kW capability
a. Constant powerb. Constant voltagec. Hybrid design
2. Consequences of phase control
a. Introduction of harmonicsb. Reactive power problems and power factor controlc. Choice of control algorithms
3. Power system operation
a. Steady-state peak shaving and choice of operating cycleb. Use as a regulating machinec. Transient over-voltage behaviord. System stability considerationse. Reliability; forced outage rates and duration of outagesf. Generation reserve requirements
61

BRIDGE kW CAPABILITY
Conventional fossil-fueled and nuclear-fueled generating units can be operated at almostall times up to the maximum power capability of the generator. As it is common to think of anSMES unit as equivalent to a conventional gpnerator when discharging stored energy, the powercapability of an SMES unit should be examined.
The power transferred between the I-C bridge and the superconducting coil is given by
p = V Dwhere E Q is voltage across the coil and I™ is current in the coil.
Conventional converters would operate at constant voltage and thus the power capabilitywould vary linearly with the coil current. As the SMES unit is discharged, the capability ofdelivering three phase ac power to the power system is similarly reduced. This varying powercapability, dependent on the state of charge of the storage system, represents a new variablein the planning and operation of power systems with SMES installed.
A solution, but costly, is to design the bridge for constant power capability. TransrexDivision of Gulton Industries has investigated one possible constant power design for theUniversity of Wisconsin SMES project. Series-parallel switched groups of converter moduleswere also investigated by General Electric in a study for the Los Alamos Scientific Labora-tory.^ * The configuration investigated by Transrex uses three different thyristor con-verters (A, B, and C), of different sizes, that can be bypassed or connected in series orparalleled to approximate a constant power capability as shown in Fig. 2.
7
6
S
J-
2-
1 -
fl-
R
500 «
CAPABILITY
— SESIES —
(A)
. PARALLEL M
50 100 150 ZOO 250 300LKA
Fig. 2. Power Capability Curve
The conceptual design used to approximate a constant power capability also providesanother approach to controlling the reactive power drawn by the converter.
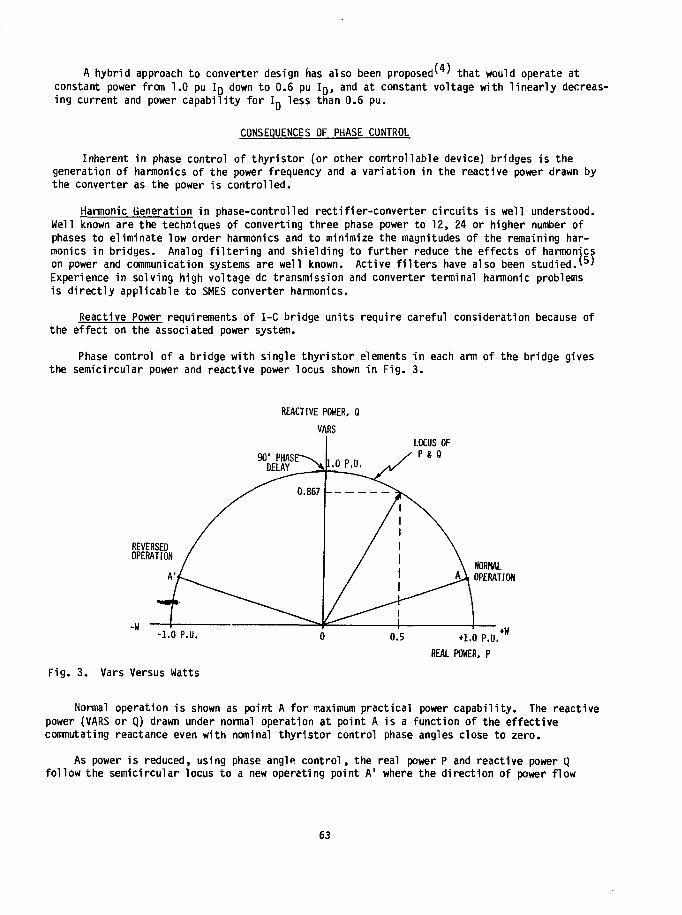
A hybr id approach to converter design has also been proposed' ' that would operate atconstant power from 1.0 pu I D down to 0.6 pu In» and at constant voltage with l i n e a r l y decreas-ing current and power capab i l i t y f o r I D less than 0.6 pu.
CONSEQUENCES OF PHASE CONTROL
Inherent i n phase cont ro l of t h y r i s t o r (or other con t ro l lab le device) bridges i s thegeneration of harmonics of the power frequency and a va r ia t i on in the react ive power drawn bythe converter as the power i s con t ro l l ed .
Harmonic Generation in phase-control led r ec t i f i e r - conve r t e r c i r c u i t s i s wel l understood.Well known are the techniques of converting three phase power to 12, 24 or higher number ofphases to e l iminate low order harmonics and to minimize the magnitudes of the remaining har-monics i n br idges. Analog f i l t e r i n g and shie ld ing to fu r the r reduce the e f fec ts of harmonicson power and communication systems are wel l known. Act ive f i l t e r s have also been studied. '*•)Experience in solving high voltage dc transmission and converter terminal harmonic problemsis d i r e c t l y appl icable to SMES converter harmonics.
Reactive Power requirements of I-C bridge uni ts require careful consideration because ofthe e f fec t on the associated power system.
Phase control of a bridge wi th s ing le t h y r i s t o r elements i n each arm of the bridge givesthe semicircular power and react ive power locus shown in F ig . 3 .
REACTIVE POWER, Q
MRSLOCUS OF
P 8 0DELAY
-W
REVERSEDOPERATION
NORMALOPERATION
-1.0 P.U. 0.5 +1,0 P.U.'
HEAL POWER, P
Fig. 3. Vars Versus Watts
Normal operation is shown as point A for maximum practical power capability. The reactivepower (VARS or Q) drawn under normal operation at point A is a function of the effectivecommutating reactance even with nominal thyristor control phase angles close to zero.
As power is reduced, using phase angle control, the real power P and reactive power Qfollow the semicircular locus to a new operating point A1 where the direction of power flow
63

through the converter has been reversed. Reactive power is still drawn from the system, how-ever. To minimize the reactive power drawn from the system the phase angle should be close to180° (150° or more). Note that operation at low values of real power with phase angles near90° results in excessive reactive power demands on the power system (near 1.0 pu) and must beavoided if possible.
Minimizing or compensating for the reactive power drawn from the power system is a majorconcern. Possible approaches include:
1. Special phase angle control and/or switching of series-parallel combinations ofconverter bridge thyristor and transformer modules that keep most units operating with near 0°or 180° phase angles on the thyristor controls at any time to minimize reactive power.'"'
2. Voltage tap changing of the transformers connecting the converter to the power system.
3. Switched power factor correcting capacitors.
4. Synchronous condensers.
Voltage tap changing transformers, switched capacitors, and synchronous condensers havethe disadvantages of cost and operational reliability considerations. The effectiveness ofpower correcting capacitors is reduced during periods of low voltage troubles on the systemwhen they may be needed the most.
POWER SYSTEM OPERATION
Numerous studies have been conducted on the application of SMES units to peak shaving.A.D. Little investigated several alternative storage cycles in a study for the Department ofEnergy. )
The dynamic performance of SMES units on power systems and transient over-voltage behaviorhave been studied.(°»9)
SMES units have the capability of improving the transient stability of power systemsbecause they can respond within a few cycles to damp oscillations on the system.O0»H)
Little attention has been given to the reliability, forced outage rates prediction, orsystem reserve requirements with SMES units on a system. However, these characteristics mustbe studied in more detail for proper evaluation of the value of SMES units and operatingcharacteristics of associated power systems.
SYSTEM PLANNING ANALYSIS OF SMES
Much of the research to date on SMES has been related to component development and systemdesign, studies of the electrical effects on power system and performance of the I-C bridge,and system optimization to reduce construction and operational costs. Most of the work onsystem economics has been concerned with general studies of typical systems.
The optimum kW and kWh ratings of storage units, and indeed their worth to a utility, canonly be determined by detailed studies of the particular utility system involved. Utilitiesserving neighboring geographic areas may have quite different daily, weekly, seasonal andannual load factors, generation mixes, fuel costs, load projections, etc.
Whenever a storage unit is first added to a system it is likely that the economics will notbe optimum if the bulk of the existing generation was selected without consideration for
64

storage. The economics may improve in later years as older janeration is retired or displacedby newer generating units installed for use with storage on the system.
Realistic system planning studies of the possible use of storage should cover a timeperiod starting when-storage could first be available and continuing over a period of perhaps25 years.
Parameters for a planning study would include:
. Start with a 1988, or later, system
. A 25 year planning period
. Use load forecasts including anticipated impacts of time-of-use rates and loadmanagement
. Study different storage cycles; daily, 5 day, 7 day cycles
. Study constant power, constant voltage and hybrid I-C alternatives (unless one alterna-native is clearly established beforehand as the best)
The planning study can be conveniently divided into four major categories:
1. Preliminary Analysis: Determine
a. Tolerable range of MW and Mwh ratingsb. Timing of needc. Transmission requirementsd. Regulatory interface: licensing and accounting
2. Operational Analysis: Study
a. System lossesb. System reliabilityc. System stabilityd. System reserve requirementse. Operational cycle to be usedf. Institutional problemsg. Intangible benefits and costsh. Maintenance scheduling
3. Economic Analysis
a. Capital requirements/yearb. Operational costs/yearc. Fuel requirements/year
4. SMES Unit Design Recommendation
a. MW and MWh ratingsb. Storage cyclec. Reactive power compensationd. Design reliability
CONCLUSIONS
The focus of research and development efforts on SMES to date at Wisconsin has been pri-marily on development of components, optimization of designs to lower costs, and on studies ofthe operating characteristics of SMES units in power systems under normal and abnormal system
65
conditions. These studies have led to refinements in component designs and to better estimatesof the cost of constructing SMES units.
Future efforts will include more detailed system planning analysis of SMES units in actualpower systmes. As SMES units have some characteristics that are not identical to normal systemgeneration, new analysis techniques will have to be evolved to aid the system planner.
The progress of SMES component development, SMES system design and SMES electrical inter-face design will continue to be closely coordinated and integrated with the SMES electricalpower system use studies reported on in this paper.
ACKNOWLEDGEMENTS
The authors wish to acknowledge the contributions of H. A. Peterson to the understandingand solutions to many of the electric power system problems associated with SMES. Al Mihm,Bruce Erickson and Lloyd Grove of the Wisconsin Electric Power Company have also contributed tothis report.
REFERENCES
1. H. A. Peterson, N. Mohan and R. W. Boom, "Superconductive Energy Storage Inductor-ConverterUnits for Power Systems," IEEE Transactions on Power Apparatus and Systems, Vol. PAS-94,No. 4, July/August 1975, pp. 1337-1346.
2. University of Wisconsin Superconductive Energy Storage Project Report, Vol. 1, July 1, 1974,p. IX-6.
3. "Design Study: Thyristor Converter Stations for Use with Superconductive Magnetic EnergyStorage," Electric Utility Systems Engineering Department-General Electric, for the LosAlamos Scientific Laboratory.
4. H. A. Peterson, private correspondence.
5. University of Wisconsin Superconductive Energy Storage Project Report, Vol. II, January1976, pp. VIII-10 to VIII-18.
6. University of Wisconsin Superconductive Energy Storage Project Report, Vol. 1, July 1, 1974,pp. II-l to 11-34.
7. "An Evaluation of Superconductive Magnetic Energy Storage," Draft Final Report, A. D.Little, Inc., April 19, 1979, pp. 3.2-3.5.
8. Reference 2, pp. IV-1 to IV-28.
9. University of Wisconsin Superconductive Energy Storage Project 1976 Annual Report,May 1, 1977, pp. VIII-1 to VIII-29.
10. P. C. Krause and D. M. Triezenberg, "Hybrid Computer Study of a SMES Unit for DampingPower System Oscillations," Proceedings of the 1978 Mechanical and Magnetic EnergyStorage Contractors' Review Meeting, DOE, October 1978, pp. 264-269.
11. R. L. Cresap and J. F. Hauer, "Power System Stability Using Superconducting MagneticEnergy Storage Dynamic Characteristics of the BPA System, Proceedings of the 1978 Mechani-cal and Magnetic Energy Storage Contractors' Review Meeting, DOE, October 1978, pp. 254-262.
66

Project Title:
Principal Investigator:
Organization:
Project Goal:
Project Status:
Contract Number:
Contract Period:
Funding Level:
Funding Source:
PROJECT SUMMARY
An Evaluation of Superconducting Magnetic Energy Storage Systems
James Nicol
Arthur D. Little, Inc.Acorn ParkCambridge, MA 02140
To evaluate the degree to which the nation and its electricutilities might benefit from the development of SuperconductingMagnetic Energy Storage Systems and to evaluate the nature andseverity of the technical barriers which must be overcome.
The investigation has been essentially completed; the onlyremaining tasks involve editorial modifications of the DraftFinal Report. Two general questions were examined, they were1) if the present conceptual designs and the associated costsare correct, will the SMES system be of benefit to the electricutilities? and 2) can equipment built according to the presentconceptual designs meet the utilities' operating requirements?
To answer the first question, we extended the comparison methodologybeyond its present state of development. Our analysis shows thatthe SMES system may compete favorably with alternate storagesystems when all systems are sized to deliver the same amount ofenergy to the load. This favorable outcome is the direct resultof the high efficiency with which SMES can accept and deliverenergy.
To answer the second question, the subsystems and proposed designsfor the superconducting magnetic energy storage system werereviewed. It was clear that several major technical barriers mustbe overcome before a successful SMES unit can be constructed onthe scale envisioned by the proponents. Although there is littlereason to doubt that the technical problems can eventually besolved, it is not clear at this point that the solutions will beeconomically acceptable. The major problem areas appear to lie indeveloping a design which can be constructed in the field to meetthe stringent vacuum performance requirements, with adequatereliability and with the ability to be maintained in the event offailure.
31-109-38-4917
FY '79
$55,000
U.S. Department of Energy, Energy Storage Systems Division,Via Argonne National Laboratories
67

AN EVALUATION OF SUPERCONDUCTING MAGNETIC ENERGY STORAGE
Bette M. WinerArthur D. Little, Inc.Acorn ParkCambridge, MA 02140
ABSTRACT
The object of this investigation into the benefits and likely costs of SuperconductingMagnetic Energy Storage (SMES) Systems was to determine if continued R&D support by DOE isjustified. The results of the study indicate that due to the high efficiency with which theSMES System could accept and regenerate ac electrical energy, an SMES unit can compete econom-ically with alternative advanced storage technologies if 1) its capital costs and the efficien-cies are within the estimated range, and 2) the unit is sized so as to allow it to perform thesame task proposed for alternative generator types and no more. However, the present SMESSystem design is unlikely to be able to meet the electric utilities' requirements of reliability,maintainability and system protection;and the costs of a unit which could meet these require-ments are unknown. In addition, there is considerable uncertainty about the design and cost ofmajor subsystems and the environmental impact of the magnetic field. Thus, while continuedsupport of R&D programs for the SMES system may appear to be justified, the goal of this workshould be providing information to allow a final assessment of the ability of SMES to help meetthe nation's future energy needs.
INTRODUCTION AND SUMMARY
This investigation was undertaken to help decide if additional support from DOE for thedevelopment of an SMES System could be justified by the benefits that might accrue. Super-conducting magnetic energy storage involves converting electrical energy into energy stored inthe magnetic field of an electromagnet constructed of superconducting wire. The key to thisprocess is that the storage is essentially lossless because superconducting wire has noelectrical resistance to dissipate energy. The chief difficulties lie in the fact that super-conducting materials lose their electrical resistance only at temperatures near absolute zero;thus the entire system must be enclosed in a refrigerated vacuum vessel. Most of the lossesin SMES are the energy used for running the refrigerator and in converting ac power to dc andback again. The following areas were addressed:
1) The present state of technical development; additional development required; technicaland environmental problems to be solved; realism of assumption that problems can besolved at acceptable costs; likely cost of an SMES unit built to the present conceptualdesign.
2) Usefulness and economic desirability of SMES to the electric utility industry;assuming cost to be within the specified range.
To address the first area, the major subsystems and the proposed designs for the SMES magnetwere reviewed. Several major technical barriers must be overcome before a successful SMES unitcan be constructed on the scale envisioned by its proponents. There is little doubt that theproblems can be solved, but it is not clear that the solutions will be economically acceptable.The major problem areas appear to lie in designing reliable and maintainable hardware which canbe constructed to meet the stringent'vacuum performance requirements. (The present designrequires the magnet to be placed underground with significant impact on fabrication and maintain-ability.) There is also need for a better understanding of rock behavior under diurnal pressurefluctuations over a period of years. The range of capital costs estimated for the present SMESSystem design are in reasonable agreement with those presented in previous studies; the capitalcost of equipment designs which meet utility requirements for maintainability and system
68

protection are unknown.
To decide if SMES systems built to present .designs could be useful and economically attrac-tive to the electric utility industry, a new comparison technique was developed. We comparedalternative storage systems sized to deliver the same amount of energy to the load each year;except for the storage systems under evaluation, the power system characteristics were the samefor each case. This approach extends the techniques previously used to compare energy storagesystems to the next level of complexity. The results of our analysis show clearly that SMESsystems may indeed compete economically with alternative storage and conventional power systems.This favorable outcome is the direct result of the efficiency with which SMES can accept anddeliver energy.
SMES SUBSYSTEMS*
An SMES system will consist of the following major subsystems.
o The superconducting magnet
o The cryogenic container
o Structural containment for the magnet
o Refrigeration and vacuum systems
o Power conditioning equipment
These will each be discussed in the following paragraphs.
The Superconducting Magnet System
The Superconducting Conductor
Historically, whenever a superconductor, like NbTi or NboSn, is expected to carry largecurrents, it is stabilized by encasing it in copper to prevent thermal run-away should the super-conductor revert to the normal phase with normal ohmic resistance.
In principle, aluminum is an attractive alternative to copper because it is much lessexpensive. Unfortunately the successful use of aluminum-cladded superconductor requires theresolution of unsolved metallurgical problems. If these are resolved, the cost of aluminumstabilized conductor should be reasonably close to the predictions of its proponents. If coppermust be used, conductor costs will be substantially greater.
Two types of conductor designs have been considered for use in the SMES magnet: modular,copper stabilized conductor and monolithic, aluminum stabilized conductor. The modular design isattractive because the basic modules could be manufactured off-site and shipped to the site inrelatively long lengths for final assembly. Thus, critical processing would be performed in a•facility designed for quality production. Monolithic conductors would need either on-site man-ufacture or manufacture in short lengths and on-site assembly with a large number of conductorjoints. Both of these alternatives are riskier than the modular design.
Magnet Design
The present conceptual designs for the magnet are scaled-up versions of smaller magnetdesigns, i.e. either a single solenoid or the segmented solenoid shown in Figure 1. However,the designs have been driven by economic considerations to sizes for which there is no experience(See Figure 2). Thus, it cannot be stated unequivocally that a large SMES magnet can be built;nor is there experience to determine the service reliability of equipment built to thesespecifications. The cost of a more self-evidently maintainable design might eliminate theSMES from economic competition.
R. W. Boom, "Superconductive Diurnal Energy Storage Studies," Proc. of the 1978 Mechanicaland Magnetic Energy Storage Contractors' Review Meeting, Oct. 1978, Luray, VA., U.S. Dept. ofEnergy Report CONF-781046 and personal communication giving revisions to March 1979.
69

I-DEWAR CONTAINING THE
SUPERCONDUCTINGWINDING
GUARD MAGNETIJ
-ACCESS SHAFT
IROCK TUNNEL—jll H,
IN
H,
T
Figure 1. Schematic of SUES System Installed in Bedrock (University of Wisconsin)
d
1 300
I 2 3 4 5 « 7 I » K>ENERGY STORAGE — MWhr > IOOQ
, Figure 2. Radius of SUES vs. Energy Storage Capacity and Magnetic Field for Solenoid
The University of Wisconsin has considered how to provide for magnet protection and continuedoperation should a portion of the superconductor fa i l . The magnet is to be separated into twenty-fou^igdependent sections (with separate dewars and leads) with multiple shorting switches toallow each section to be discharged independently. However, the discharging of one section andthe shorting of others would result in unbalanced forces. The integrity of the support strutsand rock under these conditions is questionable; i f the fai led section is not to collapse,additional inter- and intra-coi l structure may be required. The cost of this structure mightbe prohibitive.
The proposed underground placement of the SMES resulted from analyses indicating that thecost of structural containment above ground would be prohibitive. The proposed use of rockconfinement and support implies that a large portion of the magnet might have to be disassembledin order for any repairs to be affected. Providing for component replacement in the undergroundenvironment may well cost more than above-ground placement. Another option might be to reduceor internally balance the forces suff ic ient ly so as to allow for above-ground placement atreasonable cost.
70

Cryogenic Container
The proposed cryogenic container design is notable in three important aspects:
1) its size and the fact that it must be erected in the field;
2) a requirement to withstand substantial diurnal pressure variations, andP
3) the liquid superfluid helium bath at 1.8 K.Despite the very large scale-up from existing dewar systems, it appears that a large-scale
system can successfully retain superfluid helium for long periods of time provided (1) themechanical details of the system are thoroughly tested in the laboratory and on small-scaleproduction assemblies; (2) the field fabrication is performed by skilled technicians under closesupervision; and (3) as the system is constructed, the plating and welds are rigorously testedby x-ray and vacuum mass spectrometer leak detectors.
The existing designs for the superfluid helium dewar and vacuum container could probablynot be rigorously tested for vacuum leaks under field assembly, or, in the event of failure,be repaired in the field. It is not clear how closely a more self-evidently reliabledesign will resemble those used for cost estimates and for this evaluation. Thus it isdifficult to put limits upon a variation from present cost estimates. Little is presentlyknown about the ability of aluminum cryogenic containers to withstand flexing for many cyclesover long periods (10^ cycles in 30 years) and retain their integrity.
Structural Containment of the Magnet
There is very little information available on the ability of rock to withstand the large,daily-cycled stresses proposed to be imposed on the walls of the cavern which cycle daily. Thisquestion has been investigated at the University of Wisconsin, but few definitive answers havebeen obtained to date.
Two recent independent engineering estimates of the cost of excavation agree reasonablywell both in cost estimate (about 25% of the total SMES project) and in acknowledged uncertainty(about a factor of two). The large cost uncertainty derives from the difficulty in estimatingsubsurface conditions in advance. In addition, these estimates rest on a number of optimisticassumptions concerning the following areas:
(1) the excavation volume required for a reliable and field maintainable SMES,
(2) water seepage during the construction and operation phases,
(3) the rock treatment required to resist cyclic magnet loads over many years.
It appears technically feasible to place a SMES under ground but with large uncertainty in cost.It is imprudent to assume that no new geotechnical problems will arise during system life;accessibility to the underground space after the magnets are installed may be critical. Thesefactors make it extremely difficult to reliably determine excavation costs at this time.
Refrigeration and Vacuum Systems
The refrigeration and vacuum systems being considered for SMES differ from current commercialand industrial practice only in scale and performance. The refrigeration system is the source ofthe major energy loss in the system and must therefore be designed for optimum efficiency. Nomajor scale-up difficulties are expected.
Power Conditioning Equipment
The two types of power conditioning systems (ac/dc convertors) investigated for SMES arecharacterized either by:
o constant voltage across the magnet - implying that the unit's power delivery orcharging rate capability will depend on the SMES state of charge, and

o constant input/output power capability - independent of SMES state of change butimplying higher cost.
Both approaches use relatively conventional Graetz bridges with solid-state thyristors. Allpresent utility generators have a constant power capability. Units may be derated temporarilybecause of maintenance problems, but this is easily accommodated. A unit whose power ratingvaries continuously during the day is far beyond utility experience and would require additionalsystem reserves to maintain system integrity. General Electric estimates that constant powerconditioning (Imax/I in = 3,) will cost $60-80 per kW. More importantly, the General Electricconverter design requires the magnet to withstand 17 kV across the terminals. The presentUniversity of Wisconsin SMES design could not tolerate such a high voltage. The baseline designbeing investigated by Los Alamos could tolerate such a voltage and is more expensive.
The conversion efficiency at these high-current, low voltage systems has been estimatedbetween 96.5% and 98.5%. This would yield a round-trip efficiency between ?3% arid 97%.As will be shown later, the economic analysis is relatively insensitive to the exact magnitudeof the efficiency for most of the situations considered.
System Costs
In accordance with the conditions of this study,we have not developed SMES capital orother costs ab initio. The starting point was the costs estimated by the University ofWisconsin for its most recent "Revised Design, 1978." We have scrutinized the methods ofestimation and the date supporting these costs. For each subsystem we used University ofWisconsin scaling laws to develop our own estimates of potential cost variations. (The"baseline" unij^for cost estimation purposes had a storage capacity of 10 GWh at a magneticfield of 2.5 T ) The results of these calculations,are presented in Figure 3. The capitalcost may be as high as $120/kWh for the smallest unit considered and as low as $34/kWh for thelargest. These costs are very similar to those estimated by previous reviewers of thistechnology.
Figure 3.SMES System Capital Costs(1976$) vs Storage capacityand Magnetic Field
ENERCr - M B * I BOO
* Ibid, page 2.** R.W. Boom et al; "Magnet Design for Superconductive Energy Storage for Electric Utility Systems,"
Proc. of Conference on Superflywheel and Superconductive Storage, Asilomar, CA., Feb. 8-13 1976.
72

Environmental and Safety Problems
These problems stem from the presence of the stray magnetic field of the solenoid. Atground level the magnetic field of the baseline design ranges from approximately twice that ofthe earth's field at a distance of 2,800 meters from the center of the solenoid to 1,600 timesthe earth's field directly above the magnet.
The field of the coil will remain at 1 Gauss (2 times the earth's field) or higher withina volume which extends to a height of approximately 2,600 meters above the surface of the earthdirectly over the center of the coil. The presence of this field may affect: animal life(particularly birds), mankind and devices which mankind uses, and instrumentation (e.g. magneticcompasses used by aircraft). Available information suggests that human exposure to fields ashigh as 100 Gauss may not be harmful provided the exposure is not excessively long; other infor-mation indicates also that equipment such as cardiac pacemakers may operate in fields up to10 Gauss. There is no information on the effects on animals of magnetic fields. Clearly thenit would be desirable to ensure that a region at least 1,200 meters in radius (the 10 Gaussradius) should be closed to access toy man and perhaps animals at ground level. Air space closureis a more different question requiring further investigation.
COMPARATIVE ANALYSIS OF ELECTRIC UTILITIES STORAGE SYSTEMS
Generation capacity, once purchased, is scheduled for operation to minimize theoperating costs of the system; thus, operating decisions are based only on thevariable or deferrable operating costs of the various facilities. Thus, the energyany generating plant will deliver during its life depends on 1) system load as afunction of time and 2) the relative operating costs of all other generators inthe utility system. The "cost" of energy from a storage generator is equal to thecost of the energy delivered to storage during the charging portion of the cycle(Mc) divided by the cycle efficiency; the "value" of energy from a storage generatoris equal to the cost of delivering this same energy from conventional sources (Md).Storage use is determined by the criterion that the marginal "cost" of the storedenergy should be less than or equal to its marginal "value""! Additionally, thelimits on power and energy capacity cannot be exceeded and the energy placed intostorage multiplied by the cycle efficiency must equal the energy taken out of storage.These constraints are indicated in Figure 4.
The limited energy capacity of the storage reservoir can help determine the "value"of the stored energy. When the energy in the reservoir is limited, the schedule isset so as to obtain the highest possible "value" for the stored energy. Higher "value"for the limited stored energy can be obtained by saving it to displace only the mostcostly conventional generation. When the "value" of the stored energy is increased,the maximum acceptable "cost" of the stored energy is also increased when consideringstorage operating over a weekly cycle (see Figure 5). This fact results in a stronginterdependence between the efficiency, reservoir capacity and the amount of energydelivered.
The two curves beginning at point A in Figure 5 are for two different types ofstorage units with different cycle efficiencies but charged with the same amount ofenergy at the beginning of the week. Since the amount of week-night recharge energythat can be economically justified for the less efficient unit is less than that forthe more efficient unit, the less efficient unit runs out of energy before the endof the week. In order to avoid this, it would have had to start with more energyin the reservoir (dotted line beginning at point B). If the reservoir of a particulartype of storage unit is small enough to justify full charge and discharge of the uniteach day, the amount of energy that can be delivered becomes a simple function of thereservoir capacity. However, if there is either an increase in the amount of energyto be delivered or a decrease in the amount of high cost energy to be displaced, theless efficient machines will have to be larger, possibly large enough to operate overthe weekly cycle and then the required storage capacity would be an extremely sensitivefunction of cycle efficiency.
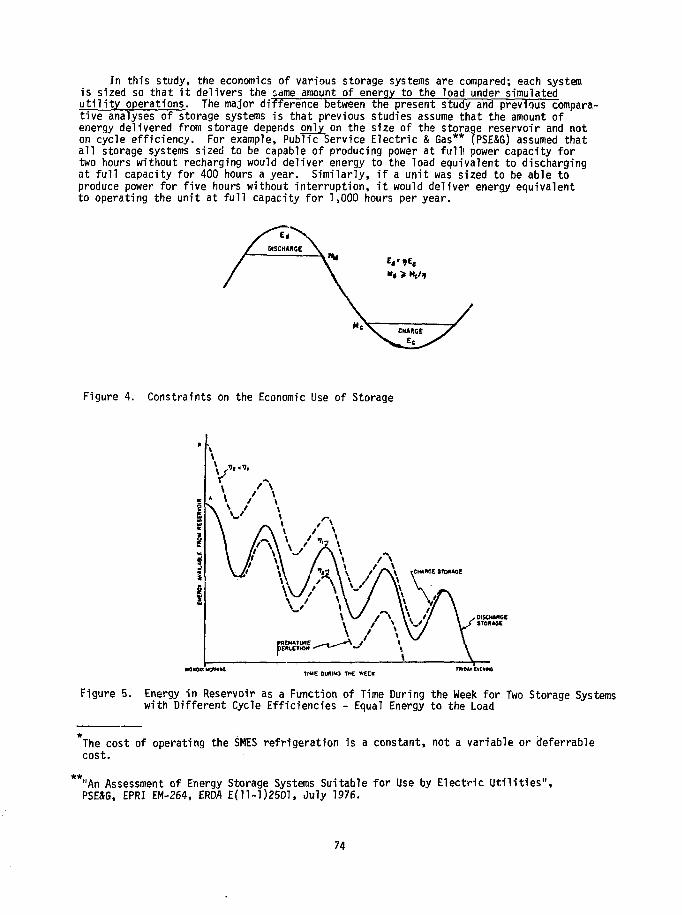
In this study, the economics of various storage systems are compared; each systemis sized so that it delivers the same amount of energy to the load under simulatedutility operations. The major difference between the present study and previous compara-tive analyses of storage systems is that previous studies assume that the amount ofenergy delivered from storage depends only on the size of the storage reservoir and noton cycle efficiency. For example, Public Service Electric & Gas** (PSE&G) assumed thatall storage systems sized to be capable of producing power at fulll power capacity fortwo hours without recharging would deliver energy to the load equivalent to dischargingat full capacity for 400 hours a year. Similarly, if a unit was sized to be able toproduce power for five hours without interruption, it would deliver energy equivalentto operating the unit at full capacity for 1,000 hours per year.
Figure 4. Constraints on the Economic Use of Storage
V--
PREMATUREpEffLETtOH
TIME OURING THE WECKFRtDAT CVENMC
Figure 5. Energy in Reservoir as a Function of Time During the Week for Two Storage Systemswith Different Cycle Efficiencies - Equal Energy to the Load
The cost of operating the SMES refrigeration is a constant, not a variable or deferrablecost.
"An Assessment of Energy Storage Systems Suitable for Use by Electric Utilities",PSE&G, EPRI EM-264, ERDA E{ll-l)2501, July 1976.
74

The present study does not accept the previous assumptions, but extends the analysisto the next level of complexity. Using a model utility and a model load, we firstcalculate the capacity of storage generators required to deliver specific amountsof energy to the load as a function of the cycle efficiency of the storage system.The economic comparisons between different types of storage and conventional generatorsare then performed for these appropriately (not equally) sized uni^s and, thus, makesthe correct allowance for storage efficiency.
While the storage cycle efficiency, the ratio of the amount of energy availablefrom the storage reservoir to the amount of energy delivered to the storage reservoir,is an important determinant of system usefulness, it is neither the only efficiencyassociated with storage nor need it be the only determinant of the "value" of the storedenergy for a specific utility. This distinction is important for two of the candidatestorage systems - Superconducting Magnetic Energy Storage and Compressed Air EnergyStorage (CAES). The former requires electrical energy in order to maintain its lowtemperature but this is unrelated to the decision to operate, and the latter requiresthe use of costly fuel in order to discharge; neither of these requirements is reflectedin the cyole efficiency. The cost of the fuel required to discharge CAES needs to beconsidered when calculating the marginal "cost" and "value" of the stored energy.
SIMULATION OF UTILITY OPERATIONS
In this study we used simplified models of the utility load and generation costsin order to obtain an estimate of the energy economically available from a specificstorage unit. The following assumptions were made:
A) Assumptions Concerning Power Demand
• The fractional variation of power demand with time would not change withthe years, i.e., the shape of the load curve is constant from year to year.
• The ratio of storage capacity to the model utility's yearly peak demandwould not change. (This would be the case if there were no growth inpower demand or if sufficient storage generation capacity were added eachyear to keep pace with power demand growth.)
B) Assumptions Concerning the Economics of Conventional Generation
• The operating costs of all conventional generators will increase at the sameexponential rate.
• Additions of generating capacity would maintain the assumed dependenceof incremental operating costs on power delivered.
• Units are removed for scheduled maintenance so as to leave unchangedthe dependence of the incremental cost of energy from conventionalgenerators on the power delivered, expressed as a percent of seasonalpeak demand.
The composite result of these assumptions is that a simulation of utility operations forone year is equally valid for all years within the planning horizon. In these calcula-tions it was assumed that the utility generation mix contained a storage system witha power capacity of 500 MWe (6.25% of the yearly peak demand.* Using these assumptionsthe amount of energy that can be economically delivered to the load from a storage systemwith a given size of reservoir and input/output efficiency can be calculated. Thesevalues can be manipulated and plotted to yield Figure 6, a plot of the storage reservoircapacity (in units of hours of storage capacity) required for the delivery of specificamounts of energy each year plotted against the cycle efficiency. The curves in
For a complete description of the assumed electric utility load and costs, see "An Evalua-tion of Superconducting Magnetic Energy Storage - Draft Final Report", ADL, July 1, 1979.
75
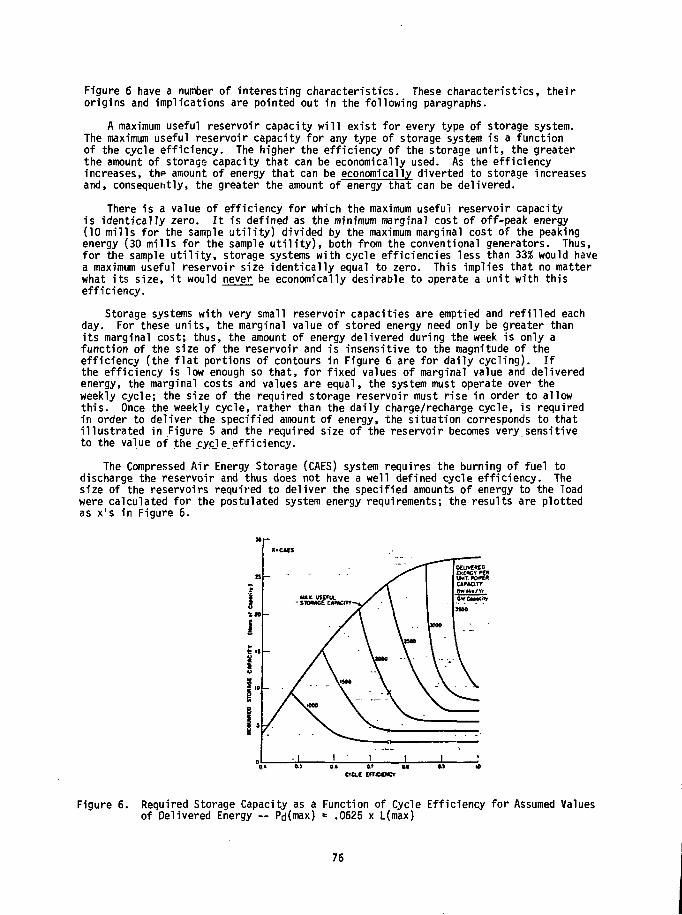
Figure 6 have a number of interesting characteristics. These characteristics, theirorigins and implications are pointed out in the following paragraphs.
A maximum useful reservoir capacity will exist for every type of storage system.The maximum useful reservoir capacity for any type of storage system is a functionof the cycle efficiency. The higher the efficiency of the storage unit, the greaterthe amount of storage capacity that can be economically used. As the efficiencyincreases, thp amount of energy that can be economically diverted to storage increasesand, consequently, the greater the amount of energy that can be delivered.
There is a value of efficiency for which the maximum useful reservoir capacityis identically zero. It is defined as the minimum marginal cost of off-peak energy(10 mills for the sample utility) divided by the maximum marginal cost of the peakingenergy {30 mills for the sample utility), both from the conventional generators. Thus,for the sample utility, storage systems with cycle efficiencies less than 33% would havea maximum useful reservoir size identically equal to zero. This implies that no matterwhat its size, it would never be economically desirable to operate a unit with thisefficiency.
Storage systems with very small reservoir capacities are emptied and refilled eachday. For these units, the marginal value of stored energy need only be greater thanits marginal cost; thus, the amount of energy delivered during the week is only afunction of the size of the reservoir and is insensitive to the magnitude of theefficiency (the flat portions of contours in Figure 6 are for daily cycling). Ifthe efficiency is low enough so that, for fixed values of marginal value and deliveredenergy, the marginal costs and values are equal, the system must operate over theweekly cycle; the size of the required storage reservoir must rise in order to allowthis. Once the weekly cycle, rather than the daily charge/recharge cycle, is requiredin order to deliver the specified amount of energy, the situation corresponds to thatillustrated in Figure 5 and the required size of the reservoir becomes very sensitiveto the value of the cycle,efficiency.
The Compressed Air Energy Storage (CAES) system requires the burning of fuel todischarge the reservoir and thus does not have a well defined cycle efficiency. Thesize of the reservoirs required to deliver the specified amounts of energy to the loadwere calculated for the postulated system energy requirements; the results are plottedas x's in Figure 6.
Figure 6. Required Storage Capacity as a Function of Cycle Efficiency for Assumed Valuesof Delivered Energy — Pd(max) = .0625 x L(max)
76

No matter how large the storage reservoir, for any given utility there is a maximumamount of energy that can be delivered economically from a storage generator haying aspecific cycle efficiency. For the utility modeled here, a storage generator withcycle efficiency of .8 and maximum power rating of 500 MWe cannot economically delivermore than 1300 GW-hrs per year; it would be cheaper to use conventional generationcapacity to meet a greater need.
The storage reservoir capacity needed to allow a storage system with a certainefficiency, to deliver a specific amount of energy each year to the load is obtainedfrom Figures and listed in Table 1 for the different types of storage. Using thestorage system costs given in Table 2, the range of total capital costs for each typeof unit was calculated. The "present worth of all future revenue requirements" (pwafrr)for each type of plant operating in the expected manner were calculated using specificfinancial assumptions.*
The assumption was made that the cost of off-peak energy is the same for all candi-date storage systems. The assumption is very close to being strictly true if allstorage systems are operating on a daily cycle; the amount of off-peak energy requiredis very small and its cost varies very slowly with variations in the amount required(the amount required is inversely proportional to the cycle efficiency). When comparingone storage system operating over a daily cycle with another operating over a weeklycycle, the situation becomes more complex; the energy used to partially recharge thereservoir during weeknights has a higher cost than the energy used to completelyrecharge this same unit during the weekend. Calculations of the weighted averageof the marginal costs of off-peak energy for a number of circumstances indicatesthat they are all within 1 mill/kWh of the assumed 15 mills/kWh. The weighted costof the off-peak energy for the more efficient equipment (e.g., the SMES) sized tooperate over a daily cycle, is less. Ignoring this difference introduces a slightbias against the more efficient equipment.
A second assumption was that the type of generation capacity displaced by storagedepends only on the amount of energy delivered from storage; this assumption acknowledgesthose provisions of the Industrial and Utility Fuel Use Act of 1978 which do not allowthe construction of oil-fired generators expected to operate more than 1500 hours peryear. Thus, the type of facility being displaced and its value can be assumed to dependonly on the amount of energy delivered by the storage unit.
The "pwafrr" for each type of storage system was divided by the total energy deliveredduring the life of the plant and subtracted from the appropriate levelized life cyclecosts for conventional generators performing the same service. The results are presentedin Figure 7. The empty boxes are the values for these storage systems if their cycleefficiencies are at the high end of the ranges** indicated in Table 1; the shaded boxesare the results if the lower efficiency had been used. The width of the boxes reflectsthe uncertainties in the capital costs of the various units (Table 2).
Figure 7 indicates that jjf the SMES system can be constructed for the estimated costsand jf_ the SMES system cycle efficiency is above 90%, it will be able to compete econ-omically both with conventional generation capacity and with the other candidate storagesystems. That it can compete when the reservoirs are small and the amount of energydelivery each year is low is not surprising; several previous studies have shown thisto be true. The prediction that the SMES can compete for high energy delivery ratesis a new result; its competitive edge derives from the fact that the other storagesystems require a weekly cycle and a large reservoir to perform a task while the SMESsystem can perform the same task using a series of daily cycles and a small reservoir.
For a detailed listing of the financial assumptions, see "An Evaluation of SuperconductingMagnetic Energy Storage - Draft Final Report", ADL, July 1, 1979.
For CAES, the empty box represents the situation where extra fuel is required to dischargethe reservoir and the shaded box represents the situation where no fuel is required andthe cycle efficiency is 70%.
77

Table 1. Required Storage Reservoir Size Storage Generation Equals 6.25% of Maximum Load
Storage Type
Underground PumpedHydrostorage
Compressed AirEnergy Storage
Batteries
SuperconductingMagnetic EnergyStorage
Efficiency
.67 - .72
.7 - (A)
.75 - .8
.93 - .97
Energy DeliveredPer Year
(kWh per kW cap.)
100015002000
100015002000
1000150020002500
100015002000250030003500
Required
(kWh cap.
34.59.5
34.59.5
34.56.514.5
34.55.578.511.5
Storage Cap
per kW cap
- 7.5- 20
- 5- 14.5
- 9.5- 22
- 9.5- 17
(A) Every kilowatt-hour removed from storage requires .742 kWh of electrical energy to beplaced into storage plus the combustion of 3980 3tu's of fuel.
Table 2. Assumed Costs of Storage Alternatives
Storage Type
UPH
CAES
Pb/H+ Batt.
Adv./Batt.
SMES
C $/kW
115-1502
215-3052
60-902
60-902
60-803
Cs $/kW
12-162
2-52
50-702
20-402
36-1244
Rate
.21
.18
.21
.18
.22
0&H1
$1.6/kw/yr
$5.3 mills/kWh
$2.7 mills/kWh
$2.7 mills/kWh
$3.2/kW/vr5
1. Sourqe: Public Service Electric and Gas Co., "An Assessment of Energy Storage SystemsSuitable for Use by Electric Utilities", EPRI EM-264 and ERDA E(ll-l)-2501, July 1976.
2. Source: The Aerospace Corporation, "Characterization and Applications Analysis of EnergyStorage Systems", Aerospace Report No. ATR-77(7538-l), December 1977.
3. Source: General Electric, "Design Study - Thyristor Converter Stations for Use withSuperconducting Magnetic Energy Storage Systems", Order No. L68-27996-1, Nov. 1978.
4. Source: Costs used included economies of scale and are indicated in Figure 3.5. Source: $3.2 kW/yr plus the cost of energy used to run the vacuum and refrigeration equip-
ment. The latter is assumed to be 2<t/kWh and to increase at the rate of 8% peryear. The fixed 0&M cost is twice the 0&M cost assumed by PSE&G. Both figuresare relatively arbitrary; we are slightly more pessimistic thanwas PSE&G.
78

Figure 7. Levelized Life Cycle Cost Difference Between Storage and Conventional Generation
FUTURE R&D REQUIREMENTS
Any future work to develop a large capacity SMES for utility load leveling service shouldlogically contain the following four elements.
1. Development of a baseline system design to meet utility operating require-ments and specified objectives for constructability, maintainability andsystem protection.
2. Experimental and analytical research in Key areas to achieve the objectivesof the baseline system at reasonably predictable costs.
3. Revision of the baseline design in light of the research results.
4. If the revised baseline design appears to meet cost contraints, theconstruction, test and operation of a small demonstration unit.
The first two elements should be done at the same time and in close collaboration, theresults of each acting as a guide for the other.
79

Project Title:
Principal Investigator:
Organization:
Project Goals:
Contract Number:
Contract Period:
Funding Level:
Funding Source:
PROJECT SUMMARY
"Force Balanced Magnetic Energy Storage Coil"
O.K. Mawardi
Case Western Reserve UniversityUniversity CircleCleveland, Ohio 44106
A preliminary feasibility study has been completed to determine theeconomics of a novel design of a superconductivity coil to be usedfor magnetic energy storage.
The Force Compensated coil is made up of two coil systems with amechanical structure tying them together and subject to opposingforces generated by the two coils.
Since the structure is self-contained within its cryostat, it ispossible to exceed the fundamental material limitation on inductorsize. Furthermore, the structure can be made considerably smallerthan that needed for conventional coils.
The economies of this system is shown to be capable of achievingsavings of upwards of 40% when compared to a ronventional system.
LASL - 1996H
FY'78
$40K
U.S. Department of Energy, Division of Energy Storage Systemsthrough the Los Alamos Scientific Laboratory
81
A FORCE BALANCED MAGNETIC ENERGY STORAGE SYSTEM
0. K. Mawardi, H. Nara and M. GrabnicCase Western Reserve University
Cleveland, Ohio 44106
ABSTRACT
A novel scheme of constructing coils suited for inductive storage system is described. Bymeans of a force-compensating method, the reinforcement structure can be made considerablysmaller than that needed for conventional coils. The economics of this system is shown to becapable of achieving savings of upwards of 40% when compared to a conventional system.
INTRODUCTION
The use of energy storate systems is recognized, nowadays, as an accepted procedure forthe load levelling of an electric power generating network.0) One specific scheme of energystorage, viz., the superconducting magnetic energy storage systems (SMES) has attracted a greatdeal of attention.(2) This is because SMES offer some very desirable operational features fromthe point of view of siting advantages, minimal environmental impact, rapid dynamic responseand high efficiency of performance.
The earlier studies on SMES concentrated on inductors of conventional shapes.^) Althoughseveral magnetic and support structure configurations were considered with a view towardsminimizing costs, it became apparent that for the energy storage capacities of interest to theutilities (i.e., in the range 10 to 10,000 Mwh) the cost of the support structure for the magnetexceeded by far the cost of the cryogenics as well as that of the superconductors.
In order to sustain the very large mechanical forces between the conductors it was pro-posed (4) to use bedrock for the former of the magnets. The resulting increased cost of thismethod of construction places SMES at an economic disadvantage by comparison to other energystorage systems, hydroelectric for instance.(5)
Recently, a novel scheme for an economically acceptable magnet support structure wassuggested.\°> Preliminary calculations indicated that with this scheme the cost of the struc-ture could be reduced by a substantial fraction. In this paper more precise estimates for thecost of the structure have been obtained. These estimates were derived on the basis of apreliminary feasibility study which is described here.
UNDERLYING CONCEPT OF NEW SCHEME
The concept of a force-free coil is not new. Fermi and Chandrasekhar^ ' in particular havespeculated on the configuration of current carrying plasmas in which the currents and theirinduced magnetic fields are everywhere parallel. This idea was later extended to coil design.The configuration of a force-free coil is inferred from the solution of the equation
0.x i = 0 (1)
82

One special solution of Eq. (1) is a helical conductor of infinite length and wound witha pitch of 45° on a cylindrical former (Fig. la). The combination of several helical conduc-tors all wound with the same pitch and on the same cylindrical former is also force-free. Itis noticed that all these coils are equivalent to a current in the axial direction and anothercurrent in the azimuthal direction.
Suppose that one constructs an array of two sets of conductors. The first consists ofaxial conductors placed on a cylindrical former, while the second set consists of circularcoils wound on the same cylindrical former but nested inside it (Fig. 1b). If the surfacecurrent densities for the two sets of conductors are equal, then the combination of the twocoils is force-free. In this manner the single force-free coil has been transformed in twocoils which are force-compensated.
Fig. l(a). Helical force-free coil wound with a pitch of 45° on a cylindrical former;Fig. l(b) Force-compensated coils consisting of azimuthal and axialconductors; Fig. l(c) Force compensated coils of toroidal shape.
Whereas coils of infinite length are truly force-compensated, coils of finite length arenot because of the fringing of the magnetic field at the ends. To obtain a physically realiz-able force-compensated system of finite dimensions, the infinitely long cylinder is transformedinto a torus. It can be shown, that the transformation required to preserve Eg. (1) will leadto a torus with a cross section os shown in Fig. (lc). By inspection of Fig. (lc) it appearsthat indeed the forces from the two sets of coils (poloidal and toroidal) do Qgpose and compen-sate each other. The details of a formal proof has been published elsewhere.W
83

DESIGN FEATURES OF THE SYSTEM
The feasibility study reported here was performed for a SMES of 10 Mwh capacity and forwhich the maximum magnetic field was 5 teslas. Since, half of the energy is stored inside thetorus (i.e., contributed by the poloidal coils) while the other half contributed by thetoroidal coils is ouside the torus, one readily finds that the mean major radius required is20 m. The accurate shape and dimensions for the poloidal coils are shown in Figure 2. The
Fig. 2 Shape of poloidal coils and critical dimensions.
profile of the cross section is given in parametric form by the cartesian coordinates (see Ref.8)
x = exp (60.99 - 6.6 cos*)/20.36)
y = 6.6 sin *
(2)
(3)
where <f> varies between 0 and 2n.
a) DESIGN OF POLOIDAL COILS
Having defined the dimensions of the poloidal coils one needs to determine the crosssection of the conductors, as well as the number of poloidal coils to store the stated energy.It is convenient to design the coils such that one layer of conductors will be sufficient toproduce the required magnetic field of 5 T. It can be shown that if one defines the conductorsize by a x b where a is the thickness of the conductor and b its width then one can showthat the number of turns N satisfies the equations
N = 2iT 1° ?min £q 2J (4)max
and (5)
-7In the above R 4 = 16.53 m, EL.U • 5 T, y« = 3w x 10 , q is the space factor for winding andnnn max o otaken as 90%; and J the allowed current density is 3000 amps/cmhand is found from
The total current on the other

T _ 4.16 x 10⁸ ,,.
I g (6)
If we set I = 105 amps, it follows that N = 4160 turns, a = 2.28 cm and b = 14.6 cms. Theconductors are proposed to be constructed of individually insulated subconductors each ofwhick is separately cryostable when carrying a fraction of the total current.
b) DESIGN OF TOROIDAL COILS
When the number of discrete toroidal coils is selected, the number of turns for toroidalcoil is fixed from the force-compensation requirement. A more stringent criterion, however,is found from stress considerations. Each of the poloidal coils is approximated to a beamsubjected to a number of concentrated forces located at the contact "points" with the toroidalcoils. A structural matrix analysis program was developed and the cases of 10, 20, 40 and 60toroidal coils were investigated. On the basis of the stresses found in the poloidal coils itwas decided that at least 60 toroidal coils are needed for a safe design.
Having decided on the number of toroidals there remains to be determined the turns percoil as well as the cross section of the toroidal coils. The distribution of the number ofturns follows at once from the force compensation criterion. The cross section of the conduc-tors on the other hand has to satisfy the stability requirement, viz., that any one coil willnot collapse should it quench and hence carry no force compensate.' current.
It is known from the theory of elasticity^ ' that a circular ring subjected to a uniformforce on its rim will collapse if the pressure exceeds a critical value that varies inverselywith the cube of the radius. Using this criterion one obtains the following minimum sizes forthe toroidal coils.
oi l position
15
1015202530
Radius(m)
14.4214.9417.2420.0023.2126.0727.49
STRUCTURAL
No. o f turns
24242020201818
STABILITY OF THE SMES
Conductor Dimensions(cms)
2.26 x 14.62.28 x 14.62.28 x 17.522.28 x 17.522.28 x 17.523.04 x 14.63.04 x 14.6
In the previous section, the number and cross sections of the toroidal coils were selectedto satisfy the criteria for static stability. Since the critical force for the collapse of aring varies inversely with the cube of the radius it is obvious that the poloidal coilsconstructed with conductors of comparable cross sections would satisfy the stability criterionif the toroidal coils do. Indeed, this was found to be the case.
What remains to be checked is whether the SMES is statically stable under its own deadweight and when no current circulates in the coils. In addition one must determine the effectsof the thermal stresses on the SMES.
Numerical computations were made with a coded program referred to as STRESS for thestatics of the poloidal coil under a variety of constraints. The effect of the toroidal coilson the poloidal coils was represented by 60 springs as shown in Fig. 3. It was observed thatuse of "roller" supports on all four anchoring locations of the perimeter of the poloidal coilsallows the maximum release of the thermal stresses. It was also observed that the conductorsprovide adequate stiffness to have the structure maintain its shape under its dead weight.
85
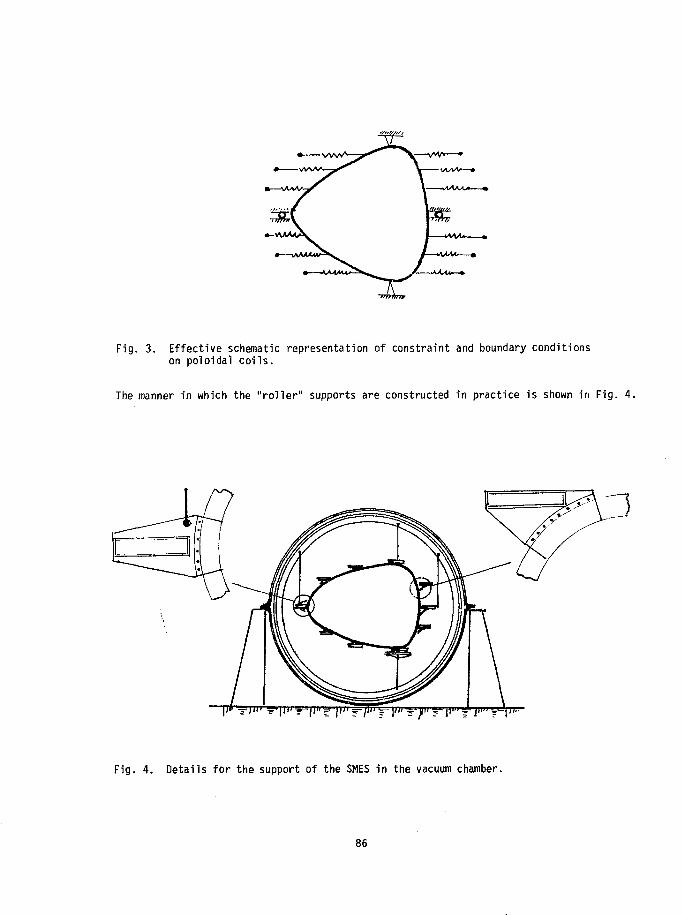
Fig. 3. Effective schematic representation of constraint and boundary conditionson poloidal coils.
The manner in which the "roller" supports are constructed in practice is shown in Fig. 4.
Fig. 4. Details for the support of the SMES in the vacuum chamber.
86

CAPITAL COST OF FORCE-COMPENSATED SMES
The items which significantly contribute to the cost of the system are
a) superconductorsb) reinforcement structure
dewarrefrigeration
e) interface to the power system.
Hassenzahl et aJL, have already carried out the economics for a toroidal SMES. ' Alarge fraction of~their calculations can be adapted to the present case after important modi-fications are introduced as explained below.
a) SUPERCONDUCTORS
It is well known to magnet designers that cylindrical coils satisfying the Brooks cri-teria('i) have the optimum design from the point of view of cost of conductor per unit ofmagnetic energy stored. It turns out that coils wound on a torus in the poloidal directionwould use almost twice as much conductors as a Brooks coil storing the same magnetic energy.
In our case, the SMES stores half the energy in poloidal coils and the other half intoroidal coils. The winding factor for the toroidal coils is only slightly less than thatof the Brooks coil.O2) Consequently, our system would use approximately 1.5 times the amountof conductors needed in a Brooks coil and not twice. The conductors needed hence cost1.5/2.0 = 75% of that of a conventional toroidal system.
b) REINFORCEMENT STRUCTURE
In all previous SMES considered, the magnetic forces were contained through structuresextraneous to the coils. An estimate of the mass of reinforcement structure needed can beobtained by means of the theorem of the virial which leads to the expression
E pM = K — • £ (7)
w
where < is a dimensionless constant relating to the efficiency of the use of support struc-tures, K >_ 1 , p is the density of the support material, o is the working stress in thematerial, E is the magnetic energy stored and M is the mass of the support.
In our case, since the magnetic forces are compensated by the coils themselves, noextraneous structures, other than the connecting straps described in the previous section,are needed. Indeed, it is easy to check that when the criterion of Eq. (7) is applied tothe coils, the mass of conductors alone is more than adequate to sustain the stresses.Defining a mean minor radius r and mean major radius R for the torus, and a mean maqneticfield intensity in the torus the right hand side of (7) is
K((2TTR x vr2) | ^ ) ^ - (8)
Rearranging the terms we can write the above
K(^TTR x 2irr ab
b is the width of the conductors as defined in section III, and a the space factor for thewinding. We now notice that the quantity between parenthesis is the mass of the poloidal coils.
87

Now for fields of the order of 5 teslas, r is approximately 6m, b is 14.60 cm., a - 90%, andaw is 30,000 lbs/ins Introducing all these quantities in (9) and using K = 1.1, i.e., assuminga ~\0% factor of safety it appears that 92% of the mass of the conductors would have beensufficient to accomodate the internal stresses. When the connecting straps estimated to be 10%of the mass of the conductors are added to the conductors, we secure a margin of safety of 20%.
The actual cost of the structure is hence taken to be 10% of the cost of the conductors,
c) DEWAR
The cost of the Dewars used in conventional SMES is high because of the reinforcementneeded when warm reinforcement is used. Cold reinforcement leads to considerably lesseramounts. The lowest costs quoted in Hassenzahl's report are for forced helium flow in hollowconductors and for cold reinforcement.
In our case, since the structure is freely suspended and does not need extraneous rein-forcement, we will assume the cost of 1750 $/m2 for the dewar as though it used forced flowsince the cryogenic installation for our system is simple.
The summary of the cost are given below. All costs are 1975 prices. We have extra-polated our costs to the larger rating of 3.9 x 10⁷ MJ. Our system is compared to that oftwo conventional SMES of toroidal geometry with warm and cold reinforcement structure respec-tively. The numbers are taken from Hassenzahl, et_ a_L (Ref. 10).
TABLE I
Energy Stored (MJ)
Superconductor Cost
Dewar Cost
Structure Cost
Mining Cost
ac-dc Convertor
Misc. Costs
Total (x 106s)
Conventional
Warm Reinforcoiient
3.9 x 10⁷
342
340
228
105
54
51
1,120
Cold Reinforcement
3.9 x 10⁷
222
300
1,014
-
54
51
1,641
; Force Compensated
3.9 x 10⁷
166
300*
25
-
54
51
595
It is believed that the cost of the dewar is overestimated as it included a certain amountof reinforcement which is not needed.
CONCLUSION
The simplicity of construction of the force-compensated coil is reflected in the substan-tial reduction in the cost of the system. In addition, to the several advantages alreadymentioned in the introduction, the new system has the convenient feature of easy accessibilitysince the whole system is at ground surface.
88

ACKNOWLEDGEMENT
This work was supported in part by the Energy Storage Division, Department of Energy,through the Los Alamos Scientific Laboratory.
REFERENCES
1. G. D. Friedlander. IEEE Spectrum 1, 58, (1964); Wisconsin Superconductive Energy StorageProject (1974).
2. W. V. Hassenzahl et al., "The Economics of Superconducting Magnetic Energy StorageSystems for Load Levelling", LA-5377-MS, Los Alamos Scientific Laboratory, New Mexico,(1973).
3. M. S. Lube'il, et al., "The Economics of Large Superconducting Toroidal Magnets forFusion Reactors", Oak Ridge National Laboratory Report ORNL-TM-3927.
4. J. R. Powell et al., "Warm Reinforcement and Cold Reinforcement Magnet Systems forTokomak Rusion Reactors: A Comparison", Brookhaven National Laboratory BNL-17434 (1972).
5. R. A. Huse et al., "International Conference on Large High Voltage Systems", 31-07 (1976).
6. 0. K. Mawardi, "Design of a Force-Free Inductive Storage Coil", Los Alamos ScientificLaboratory LA-5953-MS (1976).
/. E. Fermi and S. Chandrasekhar, Astrophys. J. V[8, 116, (1953).
8. 0. K. Mawardi, "Force Compensated Magnetic Energy Storage Systems". Report submittedto Energy Storage Division, Department of Energy (1979). Also publication in press.
9. A. E. Love, "Treatise on th^ Mathematical Theory of Elasticity" (D&ver Publications,NY) p 424.
10. See Ref. 2.
11. F. W. Grover, "Formulas for Mutual and Self Inductance", Bulletin of the Bureau ofStandards 8, 1 (1912), p 112.
12. See Ref. 6.
89

Project Title:
PROJECT SUMMARY
Energy Storage in Superconductive Magnets: A demonstration
Principal Investigator: Carl H. Rosner
Organization:
Project Goals:
Project Status:
Contract Number:
Contract Period:
Funding Level:
Funding Source:
Intermagnetics Genera! CorporationP.O. Box £56, New Karner RdGuilderland, NY 12084
To provide a ready-visual understanding of superconductivemagnetic energy storage (SMES) and its potential.
To demonstrate the interest, versatility and reliability ofelectro-magnetic energy storage systems, a model demonstra-tion system was designed and built by Intermagnetics (IGC)to the specifications of Los Alamos Scientific Laboratory.The system consists basically of a small 50K gauss super-conductive magnet with an associated cryostat, a chargingpower supply and an energy conversion circuit. On-goingstudies at the University of Wisconsin, Los Alamos NationalLaboratory and elsewhere are becoming increasingly moreoptimistic in their assessments of the advantages of usingSMES systems.
The electric energy stored in the magnet virtually withoutloss until needed, operates a 50 W light bulb, a spark dis-charge system or a tape recorder. Provision has been madeto connect any one of these items, all of them simultaneouslyor any other suitable appliance requiring a 12 V or 110 voltpower source.
This system has already been operated for many cycles and hasa virtually unlimited and undiminished cycling capability.The drawback is, of course, the requirement for continuouscooling.
There appear to be no insurmountable problem that would pre-vent the ready scale-up of this system by factors of 10 to10,000 times the level of energy stored in this system. Theengineering and economic challenges are being addressed inthe aforementioned studies. To confirm the utility of SMESit is expected that systems storing 10-1000 Mj will be con-structed within the next 3-5 years.
In addition, the ongoing developments of even larger super-conductive magnets, superconductive motors and generators,etc. will allow a more realistic assessment of the practicaland economical potential of SMES systems during the sametime-frame.
4-L69-2475L-1
July-August 1979
$24.9K plus Intermagnetics Corporate Support
U.S. Department of Energy, Division of Energy Storage Systems
91

ENERGY STORAGE IN SUPERCONDUCTIVE MAGNETS:. A DEMONSTRATION
Carl H. RosnerIntermagnetics General Corporation
P.O. Box 566, New Kamer RoadGuilder!and, NY 12084
ABSTRACT
The possible utilization of superconductive magnets as efficient energy storagesystems has been proposed and explored a number of times during the past 15 years.In order to clearly demonstrate the salient features of such a system, an operationalmodel was constructed. Using a superconductive magnet having a stored energy capabilityof 20,000 joules, the system includes a cryostat as well as charging and dischargeequipment. The energy can be discharged in a 50 w light bulb, a spark-gap, a tape-recorder, or any appliance that can operate at 12 or 110 volts.
INTRODUCTION
In its simplest form, an electro-magnet can be considered to be an "all electricbattery," where electric energy is stored in the form of magnetic flux, maintained bya continuously circulating electric current. Such magnets in the form of inductorshave been useful in electro-technology ever since the discovery of electricity. Usingconventional copper wire has involved the acceptance of associated power losses.
Since the early 1960's the use of superconductive magnets as more efficientenergy storage medium has repeatedly been advocated and explored. In addition theinherent energy conservation potential of superconductive technology has wide-rangingapplication possibilities in the electric power industry as well as for signal/computingdevices. The principal approaches to energy storage in electrical systems are shown in Fig.
1. MTTBff BECnP-PPI1«L
mumwmun~M0 j/ot3
(UIID-KID)
• 200 j /ot3 J 1 *» ' * < « " C T I ° " ELEcnwKS
2 . UUC1IIIB ELECTHO-SWIC
TI. mum . ^ ( ELECTNMMCTIC
»M0 j/a? j J , E,-*LI2
(wracoaKTivi)
Fig. 1. Approaches to Energy Storage in Electrical Systems.
92

Their relative merits are indicated by cogpcubic centimeters. The ready avail abilitythat is addressed in this article.
gparing the energy density in joules pery of superconductors presents an opportunity
SUPERCONDUCTIVE ENERGY STORAGE
Electro-magnetic energy storage systems (EM-ESS) utilizing superconductors wouldrequire large and ideally loss-less inductances. Progress made in the understandingof design and fabrication problems associated with ever-larger superconducting magnetsis directly applicable to the development of EM-ESS systems. Many of the earlier studieshave concluded that technical complexities and resultant high first costs would seeminglyrule out EM-ESS systems for practical application. However, recent technical develop-ments, as well as dramatic price increases in oil supplies and realization of its finiteavailability, has rekindled strong interests in more closely examining the real meritsof EM-ESS.
To demonstrate the interest versatility and reliability of EM-ESS, a model demon-stration system was designed and built by Intermagnetics (IGC). The system consistsbasically of a small 50 k gauss superconductive magnet with an associated cryostat, acharging power supply and an energy conversion circuit. The system components areshown in Fig. 2.
SUPERCONDUCTING jMAGNET |
CRYOSTAT
Fig. 2. Intermagnetics S.C. Energy Storage System.
93

In view of the fact that the demonstration magnet only stores about 20,000 joules andthat none of the components were specially designed for EM-ESS applications, no claimsas to economic or small size accomplishments can be made here. Nevertheless, if oneexamines the list of advantages and disadvantages shown in Fig. 3, a meaningful set ofpossibilities emerges that invites closer scrutiny.
ADVANTAGES AND DISADVANTAGES
TECHNICALLY PROVEN
SCALABLE FROM KW TOMW RANGE
UNLIMITED NUMBER OF CHARGE/DISCHARGE CYCLES
HIGHLY EFFICIENT
NO MOVING PARTS
ALL ELECTRIC INPUT/OUTPUT
ENVIRONMENTALLY ATTRACTIVE
CAN BE LOCATED ALMOST ANYWHERE
EASE OF MAINTENANCE
LOW OPERATING COST
VARIABLE DUTY CYCLE
POSSIBLE TO CHARGE AND DISCHARGEFROM I TO 1,000 HOURS
COMPARABLE TO HYDRO-ELECTRICPOWER STORAGE
Fig. 3. Energy Storage in Superconductive Magnets: Advantages and Disadvantages.
EXPENSIVE AT LOW POWER LEVELS
REQUIRES CONTINUOUS CRYOGENICREFRIGERATION
REQUIRES SHIELDING OF STRAY-MAGNETIC FIELDS
REQUIRES MECHANICAL SUPPORTSTRUCTURES FOR CONTAINMENTOF MAGNETIC FORCES
REQUIRES ELECTRICAL CONVERSIONEQUIPMENT
SYSTEM COMPLEXITY MAY LIMITUSEFULNESS TO SPECIALPURPOSE APPLICATIONS
RELATIVELY HIGH FIRST COST
94

In particular, on-going studies at the University of Wisconsin, Los Alamos NationalLaboratory and elsewhere are becoming increasingly more optimistic in their assess-ments.
The demonstration system shown here contains a l l the features and requirementsof almost any EM-ESS systems. Its operation Fig. 4. is quite straight forward.
1 . CHARGE S .C , MAGNET
2 . CLOSE S . C . SWITCH
3 . DISCONNECT POWER SOURCE
4 . DISCHARGE THROUGH 'LOAD"
5. REPEAT
Fig. 4. Superconductive Magnetic Energy Storage: Principle of Operation.
A power supply converts a-c power from the power line outlet into a d-c current used tocharge the superconductive magnet. When the magnet is fully charged, it can be "short-circuited" with a superconducting switch, whereupon the power line source can be dis-connected. As long as the system remains cold, the energy in the EM-ESS system isvirtually loss-less.
When it is desired to extract the energy from the superconductive magnet, the"load" is connected across the magnet and the superconductive switch is opened.Electric current now flows through the "load." In the demonstration system, we haveprovided for this load to be either a 50 w light bulb, a spark discharge system or atape recorder. Provision has been made to connect any one of these items, all of themsimultaneously or any other suitable appliance requiring a 12 V or 110 volt powersource.
The system has already been operated for many cycles and has a virtually unlimitedand undiminished cycling capability. The major drawback is, of course, the requirementfor continuous cooling.
There appears to be no insurmountable problems that would prevent the ready scale-upof this system by factors of 10 to 10,000 times the level of energy stored in this system.The engineering and economic challenges are being addressed in the aforementioned studies.To confirmthe utility of EM-ESS it is expected that systems storing 10-1000 Mj will beconstructed within the next 3-5 years.
95

In addition, the ongoing developments of every larger superconductive magnets,superconductive motors and generators, etc. will allow a more realistic assessment ofthe practical and economic potential of EM-ESS systems during the same time-frame.
ACKNOWLEDGEMENT
The fabrication of the superconductive energy storage demonstration system wassponsored, in part, by the Advanced Physical Methods Branch, Division of Energy StorageSystems, Department of Energy.
96

SESSION 2. COMPRESSED AIR ENERGY STORAGE
97

Project Title:
Principal Investigator:
Organization:
Project Goals:
Project Status:
Contract Number:
Contract Period:
Funding Level:
Funding Source:
PROJECT SUMMARY
Compressed Air Energy Storage Technology Program
W.V. Loscutoff
Pacific Northwest LaboratoryP.O. Box 999Richland, Washington 99352(509) 946-2768
Reservoir Stability Studies - Develop design and stability criteriafor long-term operation of underground reservoirs used for CAES inorder to accelerate the commercialization of the concept.
Advanced Concepts Studies - Develop and assess advanced technologiesfor CAES that require little or no supplementary firing by petroleumfuels in order to eliminate the dependence of CAES on these fuels.
The reservoir stability criteria studies are progressing satisfac-torily. Program milestones attained have been the development ofpreliminary design and stability criteria for the three major typesof storage reservoirs from surveys of existing information andcompletion of some of the initial porous rock and salt numericalstudies. All subcontracts are in place for the numerical andlaboratory studies. Field studies project plans are being pre-pared and are scheduled for initiation during FY-1980.
The advanced concepts studies are screening the major advanced tech-nologies, thermal energy storage (TES), fluidized bed combustion (FBC)and coal gasification. The screening should be completed in FY-1980.Decisions on more comprehensive studies and development of one ormore advanced concepts are planned for late FY-1980 or early FY-1981.Development and evaluation of equipment for all CAES concepts iscontinuing.
EY-76-C-06-1830
FY1979
$65 K
Department of Energy, Division of Energy Storage Systems
99
COMPRESSED AIR ENERGY STORAGE PROGRAM OVERVIEW
W.V. LoscutoffPacific Northwest LaboratoryRichland, Washington 99352
ABSTRACT
The DOE Compressed Air Energy Storage (CAES) Technology Program consists of a group ofinterrelated studies directed at developing a new technology to improve the cost and efficiencyof electrical power utilization and reducing the consumption of petroleum fuels. The programhas two major elements — Reservoir Stability Studies and Advanced Concepts Studies. TheReservoir Stability Studies are aimed at developing long term design and stability criteria forunderground reservoirs used in CAES plants. The Advanced Concepts Studies are directed atdevelopment of CAES configurations that will require little or no petroleum fuels for firingof the turbines.
In this overview, we summarize the program efforts during FY-1979, outline specific tasks,indicate current progress, identify future activities, and point out milestones and accomplish-ments.
INTRODUCTION
Compressed air energy storage is a technique for supplying electric power to meet peakload requirements of electric utility systems. It incorporates a modified state-of-the-artgas turbine and an underground reservoir — an aquifer, a salt cavity or a mined hardrockcavern. The compressor and turbine sections of the gas turbine would be alternately coupled toa motor/generator for operation during different time periods. During nighttime and weekendoff-peak periods, low-cost power plants not using petroleum fuels would be used to compressair which would be stored in the underground cavern. During the subsequent daytime peak-loadperiods the compressed air would be withdrawn from storage, mixed with fuel, burned and expandedthrough the turbines to generate peak power. This concept reduces the consumption of premiumfuels by more than 60 percent for conventional CAES systems. Some advanced CAES concepts donot require any premium fuels at all.
Studies have shown that the CAES concept is technically feasible and, with a proper utilitypower generation mix, is economically viable. CAES systems offer several advantages overconventional systems used by utilities for meeting peak load requirements. Replacement ofcurrent gas turbines by CAES plants could result in annual savings of more than 100,000,000barrels of oil. The net annual oil saving would be greater in the future. CAES plants are notlimited to the same degree of siting difficulties faced by conventional pumped hydro plants.Finally, a well designed CAES plant should have a smaller adverse impact on the environmentcompared to a conventional peaking plant. '
In view of the potential benefits that the concept offers, the Department of Energy (DOE)has undertaken a comprehensive program in order to accelerate commercialization of thetechnology. The Pacific Northwest Laboratory (PNL) was selected by DOE as the lead laboratoryfor the CAES Technology Program. As such, PNL is responsible for assisting the DOE in programresponsibilities for planning, budgeting, contracting, managing, reporting and disseminatinginformation. Under subcontract to PNL are a number of companies, universities and consultantsthat are responsible for various facets of the program. The funding for this program was$2,235K, broken down into J1.600K for Reservoir Stability Studies, $575K for Advanced Conceptsand $60K for Environmental Concerns. This report presents an overview of the activities byPNL and its subcontractors during FY-1979 on the Reservoir Stability Studies and AdvancedConcepts Studies.
100

OBJECTIVE AND SCOPE OF WORK
The CAES Technology Program has evolved into two basic research and development elementsand a supporting effort on environmental concerns. Recognizing that long term reservoirstability is a key issue to successful commercialization of CAES technology, the ReservoirStability Studies element has the major emphasis in the early phases of the program. Recognizingalso that the petroleum fuel requirements of conventional CAES systems may be an obstacle tolarge scale acceptance of the concept, the Advanced Concepts Studies element has been establishedand will dominate the research and development activity during the latter phases of the program.In support of the two major program elements, a study of potential environmental concernsassociated with the commercialization of CAES has also been initiated.
The objectives of the program are as follows:
, Reservoir Stability Studies - Establish design and stability criteria for large undergroundair reservoirs in salt domes, hard rock, and porous rock formations that may be used forair storage in utility applications.
• Advanced Concepts Studies - Develop advanced CAES technologies that would eliminate thedependence of CAES systems on petroleum fuels.
• Environmental Concerns - Identify and evaluate potential environmental impacts associatedwith commercialization of CAES technology.
The Pacific Northwest Laboratory leads this program and is providing the required programmanagement effort. Under- subcontract to PNL, Re/Spec is providing support on behavior of hardrock caverns; Serata Geomechanics and Louisiana State University are studying the behaviorof salt cavities; University of Wisconsin and Los Alamos Scientific Laboratory are supportingthe studies on porous rock reservoirs; United Technologies Research Center, Argonne NationalLaboratory, Massachusetts Institute of Technology and Knutsen Research Services are supportingthe advanced concepts research efforts. The program organization is shown in Fig. 1.
CAES TECHNOLOGY PROGRAM FUNCTIONAL ORGANIZATION
COMPRESSED AIR ENERGY STORAGETECHNOLOGY PROGRAM
PROGRAM MANAGERPACIFIC NORTHWEST LABORATORY
TECHNICAL SUPPORT QUALITY ASSURANCE
, I ,
i HAM) ROCK SO A. SUN' HARD HOCK MUM IT| HAND DOCK UW IT
s
POHOUI HOCK crc • ronovt ROCK * O A IUM • MOWIAM MVICMTMCRMMfCHmOP • POMOUB HOCK MUM >T • MOMAM OUtOANCE
• HWOWK DOCK UMI »T • MOOUCT MVKW
i MKWIAM INTIMATION
KMUTKNftEt. ,
' CAEI/Tf t ICONOMtCI
> tVAL 4 INT. OP MMfLTI
Fig. 1. CAES Technology Program Functional Organization
101

The program is organized into tasks and associated subtasks, as shown graphically in Fig. 2.It should be noted that while the task entitled "Environmental Concerns11 appears as part of thework structure outline, it is funded by the Division of Environmental Control Technology and,thus, outside the responsibility of the Division of Energy Storage Systems. No presentationson this task will be made in this report.
tO * SUHVE'DEVELOP PRELIM DlftlCNANO %
NUMERICAL ST Of HOCIKHAVfOfl
OfVtLO* WTENHM OCIIGNANO ITAiKITY CMITtWIA
lACOMATOflYST OF HOC•EHAVlOX
UPDATE DEtlQN ANDITAW1ITY CRITERIA
ftfio sruotesOEVELOP FWAl OEtlONAND iTAXLITY CRITERIA
11 1
CAEI TECHNOLOGY P
11
WOGRAU
1, . u o « .
1
Fig. 2. CAES Technology Program Work Structure Outline
The master schedule of milestones and activities developed to accomplish the plannedtasks in a timely fashion is shown in Fig. 3. The overall program effort is keyed on developingthe required design and stability criteria for underground reservoirs, and to developing CAESconcepts that do not require any petroleum fuels.
The first milestone marks the development of preliminary design and stability criteria forunderground CAES reservoirs. These criteria are updated as numerical and laboratory studiesare completed. The final reservoir design and stability criteria are scheduled to be developedfollowing the completion of field studies.
In the Advanced Concepts Studies, the major point is a decision by DOE, backed by thefeasibility studies, to proceed to a commercial-scale development/demonstration program. Theinitiation of one or more of the advanced CAES projects marks the major milestones in theprogram.
PROGRESS TO DATE
RESERVOIR STABILITY STUDIES
FY-1979 has seen a number of new activities start and milestones reached. These includethe following elements:
• Develop preliminary design and stability criteria for- porous rock reservoirs- salt cavities- hard rock caverns
• Complete initial numerical model development for the behavior of salt cavities.
• Complete initial laboratory studies of air-water-rock interactions.
102

MILESTONE/ACTIVITY FISCAL YEAR
A. RESERVOIR STABILITY STUDIES
1. STATE-OF-THE-ART SURVEY
2. NUMERICAL STUDIES
3. LABORATORY STUDIES
4. FIELD STUDIES
5. DESIGN AND STABILITY CRITERIA
B. ADVANCED CONCEPTS STUDIES
1. CAES/FBC
2. CAES/TES
3. CAES/CG
4. NEW CONCEPTS
C. ENVIRONMENTAL CONCERNS
1979
Vfa
1980
A10
Au
1981
A-13
1982
A/hA
i"A15/N
1983 1984AFTER1984
LEGEND
IX3
O-
NITIATE ACTIVITY
COMPLETE ACTIVITY
DOE DECISION POINT
A16
A16
1 COMPLETE S O A SURVEY
. 2\ • UPDATE SO A Sl/RVEY
/3^ COMPLETE NUMERICAL STUDIES
/j\ COMPLETE LABORATORY STUDIES
ys\ • COMPLETE FIELD STUDIES
L. ESTABLISH PRELIMINARY DESIGN AND STABILITY
* — CRITERIA
/A UPDATE DESIGN AND STABILITY CRITERIA
/ 'a \ ESTABLISH FINAL DESIGN AND STABILITY CRITERIA
/ s \ COMPLETE CAES/FBC FEASIBILITY STUDY
/<X • COMPLETE CAES/TES FEASIBILITY STUDY
. •Ui • COMPLETE CAES'CG FEASIBILITY STUDY
^ Z \ DOE DECISION TO PROCEED ON DEVELOPMENT OFADVANCED TECHNOLOGIES
Ak INITIATE ADVANCEO CAES DEVELOPMENTDEMONSTRATION PROJECT
/ < S - COMPLETE EVALUATION OF ADVANCED CONCEPTS
flS\ - COMPLETE STUDY OF ENVIRONMENTAL CONCERNS
AB\ • DEVELOPMENT. DEMONSTRATION PROJECTS COMPLETEO
Fig. 3. CAES Technology Program Milestones
• Complete numerical studies of moisture effects on air storage in porous rock.
• Complete a study of welibore thermal effects on a porous rock reservoir.
• Initiate laboratory studies of salt.
, Initiate laboratory studies of hard rock.
o Design a flow facility for laboratory studies of porous rock.
• Develop initial project plans for field studies.
Those tasks that have been identified as being completed have been documented and reports onthese subjects are available from PNL.
Major activities in FY-1979 that are not listed as milestones or accomplishments but thatwill impact milestones in FY-1980 and FY-1981 include the following:
• Numerical hard rock cavern studies.
• Numerical porous rock reservoir studies.
• Laboratory hard rock studies.
• Laboratory salt studies.
103

• Laboratory porous rock studies.
• Initiation of field studies.
A summary of the foregoing activities is shown in the milestone chart in Fig. 3 together withanticipated completion dates, where applicable. The final milestone in this series of studiesis the development of realistic design and stability criteria for CAES reservoirs that wouldfacilitate the commercialization of CAES technology.
ADVANCED CONCEPTS STUDIES
The major milestones, accomplishments and activities in the Advanced Concepts Studies duringFY-1979 were the following:
• Complete CAES/TES and CAES/soiar studies by HIT.
• Select preferred FBC concept for CAES systems.
• Obtain preliminary results from studies of effects of hot air injection on porous rock.
• Compare major CAES/TES studies using standard methods, parameters and values.
• Initiate DOE-TVA study of advanced CAES systems.
• Continue evaluation of coal gasification as an alternative fuel for CAES systems.
• Examine and evaluate a number of novel advanced CAES concepts, e.g., two tank low pressureratio system.
• Summarize rotating machinery requirements for advanced CAES.
• Initiate preliminary conceptual designs of CAES plants for the three types of air storagereservoirs.
Future major activities in the Advanced Concepts Studies project include the following:
• Complete feasibility studies of the major types of advanced CAES technologies.
• Select the preferred technologies for further development, leading to a demonstration ofthe technologies.
• Complete evaluation and initiate development, when necessary, of equipment for advancedCAES technologies.
SUMMARY AND CONCLUSIONS
In this overview, I have outlined the current CAES Technology Program and indicated Itsprogress. In conclusion of this overview, I would like to state a number of conclusionsresulting from previous and current studies.
• Low risk component design exist for near-term CAES plants.
• While near-term CAES plants can save significant amounts of petroleum fuels, they arestill dependent on these fuels. It is important to eliminate this dependence in the nearfuture. Fortunately, it appears that we do have this option.
• Economic attractiveness of CAES, especially advanced technologies, is enhanced relativeto simple cycle gas turbines by the continuing escalation of petroleum fuel prices.
The papers that will follow this overview will be more specific and detailed on some ofthe major topics and conclusions regarding CAES technology.
104-

Project Title:
Principal Investigator:
Organization:
Project Objectives:
Project Status:
Contract Number:
Contract Period:
Funding Level:
Funding Source:
PROJECT SUMMARY
Numerical Modeling to Predict Behavior of Underground Hard RockCaverns Used for Compressed Air Energy Storage
Dr. Arlo F. Fossun
RE/SPEC Inc.P.O. Box 725Rapid City, SD(605) 343-7868
57709
Develop numerical models to evaluate the thermal/mechanical/hydrological behavior of compensated CAES caverns in hard rockand perform numerical modeling to establish stability anddesign criteria.
This project is divided into the following phases and tasks:
(1) TASK 1-1: Establish Major Generic Rock Property "Characteristics(2) TASK 1-2: Formulate Conceptual Numerical CAES Simulation
Model3) TASK II-l: Establish CAES Criteria/Modeling Procedures4) TASK II-2: Parametric Evaluations by Use of Numerical CAES
Simulation Model(5) TASK II-3: Formulation of CAES Stability and Design Criteria
The project status is as follows:
(1) The major generic rock property characteristics have beenidentified and quantified to the extent possible through anextensive literature survey.
(2) A conceptual numerical CAES simulation model has been formulatedwhich can be used in an integrated or a discrete manner.
(3) Modeling procedures have been established for the constructionphase of a CAES cavern and are currently in development forthe operational phase.
(4) Parametric evaluations by use of discrete elements of thenumerical CAES simulation model are underway.
(5) The formulation of CAES stability and design criteria is inprogress. Current work is centered around air leakageconsiderations.
Special Agreement No. B49407-A-H/Prime Contract EY-76-C-06-1830
August 31, 1978 - November 30, 1979
$150,551
Pacific Northwest Laboratories, Battelle Memorial Institute
105

NUMERICAL STUDIES OF COMPENSATED CAES CAVERNS IN HARD ROCK
Paul F. GnirkTerje Brands hangGary D. CallahanJoe L. RatiganRE/SPEC Inc.P. 0. Box 725
Rapid City, SD 57709
ABSTRACT
The primary purpose of this paper is to present some results of thermal, mechanical, anda i r leakage modeling analyses for compensated CAES caverns in hard rock. Particular atten-t ion is drawn to the influence on the in situ (pre-mining) stress state on pre-operationalcavern stabi l i ty and operational air leakage. Consideration is also given to the region ofcyclic temperature perturbation around an operational CAES cavern and the time required toachieve a quasi-steady temperature f ie ld in the rock mass. Where possible, the implicationsof the modeling results are qualitatively confirmed by comparison with case history data andobservations.
INTRODUCTION
The underground layout of a compensated compressed air energy storage (CAES) system inhard rock can be visualized as a collection of parallel storage caverns, each of which is con-nected at either end by inclined entries to common (air and water) crosscut tunnels. As shownin Fig. 1, the crosscut (air) tunnel on the upward inclined end is connected to the surfacecompression and generation equipment by an air shaft. On the downward inclined end, thecrosscut (water) tunnel is connected to a water inlet/outlet shaft which in turn connects to asurface water reservoir. Water from the surface reservoir provides a compensating head formaintenance of constant air pressure (with varying volume) in the storage caverns. This isdesignated a "wet" system due to the rise and fall of water in the caverns during thewithdrawal (generation cycle) and injection (compression cycle) of compressed air. In order toprevent air ejection through the water shaft, the base of the shaft, as well as any inter-mediate water storage caverns, must be situated at greater depth than that of the air storagecaverns. Due to turbine machinery limitations and pressure losses during the generationcycle, a maximum air pressure of about 7 to 7.5 MPa (1,000 to 1,080 psi) is allowed, whichdictates a facility depth of about 715 to 765 m (2350 to 2500 ft.).
Although the internal pressure in the storage caverns is constant, the rock is subjectedto a daily temperature cycle due to alternating contact with hot air (conpression cycle) andwater at "ambient" temperature (generation cycle). More specifically, the operational cyclewill involve a period of seven days with compression/inactive cycles on Saturday and Sundayand compression/inactive/generation/inactive cycles on each weekday. For design purposes,the useful life of a compensated CAES cavern system is designated to be 30 years, or approxi-mately 11,000 temperature cycles. Although generation will occur only on week days, tem-peratures will fluctuate in the caverns during the weekend due to cooling of the compressedair and fall of the water in the caverns.
106

"U TUBE"HATER SEAL
Fig. 1. Schematic Representation of a Compensated CAES Cavern System.
The purpose of the numerical modeling program is to establish procedures for predictingthe thermal/mechanical/hydrological response of caverns to compensated CAES operating con-ditions, and to develop corresponding design and stability criteria for such cavern systems inhard rock. This effort is complimentary to past and present programs involving preliminarydefinition of stability and design criteria (1-5) and laboratory studies of appropriate rockproperties (6). The basic elements of a CAES numerical simulation model and of the probabi-listic approach to cavern design for the excavation phase have been discussed previously(5,7).
Over the course of the numerical modeling program, a dual approach has been selected,leading to the same end point, viz.:
(1) Integrated (Conceptual) Approach: Development of a comprehensive numerical model ofcoupled thermal/mechanical/hyd rol ogi cal behavior for compensated CAES caverns, incor-porating the probabilistic design approach, with case history simulations and para-metric evalutions.
(2) Discrete (Practical) Approach: Use of discrete elements of an overall numericalmodel to perform parametric evalutions of post-excavation and operation cavern stabi-lity, thermal perturbation into the cavern rock, drawdown during cavern construction,and air leakage.
The distinction between the two approaches lies in the relative level of sophistication. Theintegrated or conceptual approach seeks to incorporate a creative blend of theory andexperience from cavern construction through operation, such that theoretical projections canbe employed as a design tool when the base of empirical knowledge is restricted. The discreteor practical approach seeks to provide parametric information of immediate use to thedesigner for distinct phases of construction and operation; the generalization of this infor-mation to situations involving event complexity and strong coupling of phenomena, however, isnot immediately straightforward. The two approaches do have commonality in that phenomenolo-gical mechanisms of rock behavior must be identified in the sense of constitutive laws andused appropriately in the modeling efforts to formulate criteria for rock stability and airleakage.
107

For the purpose of t h i s paper, we have chosen t o present some resu l ts tha t have beenachieved in t h i s study by use of the discrete approach. The s t a b i l i t y o f CAES caverns a f t e rexcavation and p r i o r t o operation is discussed from the viewpoints of geometry and i n s i t ust ress s ta te , fol lowed by incorporat ion of those resu l ts in to design c r i t e r i a based on exten-s ive case h is tory knowledge. Preliminary resu l ts are given f o r the extent of thermal per tur -bat ion in the rock around compensated CAES caverns f o r extreme l i m i t s of temperaturef l u c t u a t i o n during operat ion. F inal ly ' , a comparison between predicted and observed a i rleakage from a cavern i n hard rock i n Sweden i s presented. For completeness, the above topicsw i l l be preceded by b r i e f discussions of the appropriate generic rock propert ies and theessent ia l numerical techniques. I t must be emphasized tha t much of the information presentedi n t h i s paper represents resu l ts obtained during the early phases of t h i s program.
GEOTECHNICAL AND THERMAL/MECHANICAL ROCK PROPERTIES
In general, the ve r t i ca l i n s i t u , or pre-mining, stress i n a hard rock mass can be takenas the weight of the overburden. For a co l l ec t i on of a l l rock types and groups of the hardrock var ie ty (igneous, metamorphic, and sedimentary), the ve r t i ca l stress gradient averagesabout 0.0268 MPa/m on the basis of bulk d e n s i t y " ) . This value i s reasonably consistent w i ththose given by Brown and Hoek(8) of 0.027 MPa/m and Haimsom9) of 0.025 MPa/m. For igneousand metamorphic rocks i n pa r t i cu la r , we have deduced average values of 0.0269 MPa/m and 0.0282MPa/m, respect ively ( 2 ) .
Although the ve r t i ca l stress i s r e l a t i ve l y easy t o quant i fy on the basis o f rock densi ty ,the hor izontal in situ stress i s qu i te var iable over North America, and may range from 0.5 t o2.0 o r greater at depths of 700 t o 800 m, as shown i n F ig . 2. C lear ly , t h i s in situ stress i ss i t e spec i f i c , and, as shown l a t e r , i t s inf luence on cavern s t a b i l i t y can be s i g n i f i c a n t .
COLFFlCIErtl OF LAURAL EARTH STRLSS, Ko • <Tmll/<T7
o
500
1000
lsOG
2000
250C
3000
)I
1
m
_
1 D
|
1 7 3
^ Z x ^ (AFTER HAIHSON (9)
X P ^ / WITH crz - 0.025 Z)
v^0 1 / (AFTER BROWN t HOEK (8)^ \ l * v WITH (Tz • 0.027 Z)
1-.' ^^SN^ 1500 + 0 5
[' ^ ^ ^ i oo , OiJ
J ^1 • I&ilEOUS 1 AFTER DATA COK."|L-
,1 o METAMORPHlCf ATION BV BROWN
° M c SEDIMEilTARYl AND HOEK (81II 1 I I 1
F ig . 2. Coef f ic ient of Lateral Earth Stress(Average Horizontal In S i tu Stress)as a Function of Depth.
HYWAUL1C CONDUCTIVITY (M/Sl
10'9 ID"8 10"7 10*& 10"5 10'"
150 -
Fig. 3.
—O BEST FIT FUNCTION BY BUT.ESS ( 1 1 )• KTH F I G . J FROM GUSTAFSSON* SNOK l2Sf.8! .O»(K) - - 0 . 6 LOF(Z)+»)
-• CARLESOK 1 OLSSEN (101" CARLSSON S 0LSSEN (10)
-° CARLSSON t OLSSEN (10)SGU KRAKEMALA Kl
Compilation of Fiald Data andEmpirical Relationships forHydraulic Conductivity as a Fun-ction of Depth for Igneous andMetamorphic Rock fiasses (AfterStille, et al.{12)).
108

Carlsson and OlssonU0) have investigated hydraulic conductivity as a function of depthfor some Swedish rock masses which have vir tual ly no primary permeability, only secondary per-meability. Their investigation indicated a decrease in hydraulic conductivity with depth, butthe data were highly scattered and limited to relatively shallow deaths (generally less than175 m). Employing data from the above study and others, Burgessl11) and St 11 le , et a l . ' 1 2 )have developed a mean relationship for hydraulic conductivity as a function of depth (see Fig.3) . We note that a single measurement by Carlsson and OlssonuO) a t a depth of about 300 mindicates a hydraulic conductivity which is approximately two orders of magnitude less thancalculated from the preceding relationship. For the present study, as well as for other simi-lar studies, l i t t l e permeability and fissure deformation data have been found in the l i t e ra -ture for hard rock regions at depths below 400 m.
For the purpose of this study, we have chosen the mean and extreme values given in Table 1for the material p rop^ ies of a generic hard rock. In general, the extreme values encompassthe range of measures ts reported in the l i terature for igeneous, metamorphic, and sedimen-tary rocks.
TABLE 1
Mean and Extreme Values of Thermal/Physical/Mechanical Properties for Generic Hard Rock
PROPERTY
Young's Modulus (GPa)
Poisson's Ratio
Cohesion (MPa)
Angle of Internal Friction (Deg.)
Density (kg/m3)
Thermal Conductivity (W/m-K)
Thermal Diffusivity ( lO-V/s)
Specific Heat (J/kg-K)
Coefficient of Thermal Expansion (1/K)
MEAN
50
0.25
35
35
2,730
2.90
1.15
935
8.0
EXTREMES
25/75
0.15/0.40
10/60
20/50
2520/2875
1.85/3.95
0.90/1.35
835/1035
6.25/9.75
NUMERICAL SIMULATION PROCEDURES
For the purpose of the numerical modeling discussed in this paper, use was made of theSPECTROM series of finite-element codes as developed by RE/SPEC over the past eight years.
109

SPECTROM i s pa r t i cu la r l y appl icable t o problems i n rock mechanics, invo lv ing d iscrete orcoupled phenomena in the thermal, mechanical, and hydrological realms of rock behavior. Usei s made of isoparametric elements, w i th capab i l i t i es f o r handling nonlinear and anisotropicmater ia l proper t ies, time-independent and time-dependent nonlinear material response throughp o s t - f a i l u r e , and two and three dimensional geometries. Each of the codes w i th in the serieshas been extensively val idated wi th closed-form analy t ica l solut ions and ava i lab le commercialf in i te -e lement codes on CDC CYBERNET, and wi th laboratory and i n s i t u (or f i e l d ) case h is torydata where avai lab le.
POST-EXCAVATION CAVERN STABILITY
OBJECTIVES AND RANGE OF PARAMETERS
The purpose of this aspect of the study was to evaluate the influence of cavern geometryand spacing and coefficient of lateral earth stress on the stability of caverns prior toCAES operation. The computed stress fields in the rock mass following excavation are appli-cable strictly to an elastic medium which is devoid of joints or other structural discon-tinuities. When inelastic deformation of the medium is not considered, or does not occur, thestress perturbation is independent for all practical purposes of the sequence of excavation.In addition, the solutions are strongly statically determinate, which implies negligibledependence on elastic properties. CO*PETEHT IGNEOOS ROCK
DEPTH • reo MC, • 200 MM.
88Ul UJ
i!88SI
V///////////Ai.o i.s i.o t.a
HEItHT-TO-WIDTH HATK) OF CAVEIHt, H/W
0.5 1.0 IM 1.0
IN SITU STRESS RATIO'
Fig. 4. Boundary Stress Concentration in theRib of a Single Cavern for a Range ofHeight-to-width (H/W) and In SituStress (KQ) Ratios.
Fig. 5. Post-Excavation Stability of a SingleCavern in Competent Igneous Rock ata Depth of 760 m (Support Requirementsafter Hoek (14)).
110

The cavern excavation is assumed to be situated at a f loor depth of 760 m, and the ver-t i ca l in s i tu stress gradient is taken to be 0.0269 MPa/m. Consideration was given to singlecaverns with height-to-width ratios ranging from 0.5 to 3.0, and to a sequence of threecaverns in parallel with height-to-width ratios of 1, 1.5, and 2 and extraction rat ios of 20,40, and 60%. In a l l instances, the cavern width was chosen as a constant 10 m, with the radi iof the arched crown and r ib - f loor intersections being 10% of the cavern height and 5% of thecavern width, respectively. In the discussions that follow we have chosen compressivestress to be algebraically posit ive.
SINGLE CAVERNS
Figure 4 i l lus t ra tes the influence of height-to-width rat io H/W and in s i tu stress rat ioKo on the stress concentration factor in the central r ib boundary (side wall) of a singlecavern. The stress concentration factor is defined as the rat io of the tangential ( in th iscase, vert ical) stress in the r ib and the in s i tu (pre-mining) vert ical stress. Clearly, asboth H/W and Ko increase, the vert ical stress in the r ib changes from compression to tension.For high values of Ko, the induced arching action above and below the cavern tends to"stretch" the r i b . As demonstrated later in th is paper, th is stretching action w i l l giver ise to zones of predominate a i r leakage in the r i b sections of the cavern.
*« V 1M B^ • • • J J
width ratalJ13)).
As a point of qualitative validation of the results given in Fig. 4, as regards cavernsstability, we draw attention to the Flygmotor CAES caverns in Sweden which have a height to
ratio of approximately 0.3 and are situated at a depth of about 90 m (see Bergman, et)). For the generally high horizontal in situ stresses at that depth, as illustrated
previously in Fig. 2, the ribs of the caverns have remained exceptionally stable over manyyears of daily operation (we note that the temperature fluctuations in the caverns are onlynominal). For this case history situation, the boundary stress concentration in the rib isprobably compressive, but of relatively low magnitude.
Figure 5 is an illustration of the application of the elastic stress results to practicaldesign considerations as regards need for artificial support. We have plotted the ratio ofthe maximum compressive boundary stress in the cavern roof and the uniaxial compressivestrength of a competent igneous rock (200 MPa) to Ko for a range of values of H/W. Superposedon this plot are the artificial support needs, as deduced from correlations by Hoek U 4 )based on extensive case history data. For an H/W of 1.5 to 2, which is of interest to CAEScavern design, the in situ stress ratio must be less than 1.3 to 1.5 in order to avoid the useof heavy artificial roof support, such as blocked steel sets and concrete arches.
MULTIPLE CAVERNS
Figure 6 illustrates the influence of extraction ratio and in situ stress ratio on thevertical stress concentration in the rib of the central cavern in a three-cavern array, for acavern height-to-width ratio of 2. For extraction ratios of 20 to 40% and a range of Ko from1 to 2, the vertical pillar stress is compressive and of the order of 50 to 140% of the in situvertical stress. For extremely high horizontal stresses, such as may occur at shallow depth,one could anticipate a vertical tensile stress in the pillar rib. As a point of qualitativevalidation, we draw attention to the case history described by Anttikoski and Saraste ( 1 " forthree oil storage caverns in parallel near Helsinki. The caverns have a H/W of 2 and anextraction ratio of 30 to 40%, and are situated in an in situ horizontal stress field of about15 MPa (Ko = 10 to 15). Through a combination of field observation and finite element analysis,they concluded that perhaps 60 to 90% of the pillars were in a state of tension and the cavernroofs were heavily stressed in compression. The formation of horizontal fractures across thepillars was deduced from the adjustment of oil levels between adjacent caverns to a commonelevation.
Ill

In Fig. 7, we have combined the results for the stress concentrations in the cavern roofswith the uniaxial compressive strength of a competent igneous rock to illustrate the need forartificial roof support for ranges of H/W and Ko and a constant extraction ratio of 40%, Theartificial support needs have been deduced, as before, from case history correlations by HoekH 4 ) . For an H/W of 1 to 2, only light support in the form of rock bolts and wire mesh isrequired to maintain cavern roof stability after excavation, for a value of Ko between 1.25a n d 1 > 7 5 t COMPETENT IGNEOUS ROCK
DEPTH • 760 MC. • 200 M/>o
0 0269 MPc/M
1 7 7 7 /' / / / / /HEAV1 SUPPORT SUCH At SLOCKED / ,
•'STEEL SEtS AHO COHCRETt ARCHCS
Fig. 6.
10. 40. 49.EXTRACTION RATIO <%>
Boundary Stress Concentrations in thePi l lar Rib of the Central Cavern ina Three-Cavern Array.
MO IENERAL SUffORT KQUIHCDPKOVIDCD THAT ALL lOUMDAKYSTRESSES ARt COMPRESSIVE
Fig. 7.
IN SITU STRESS RATIO • K, • -jjr
Post-Excavation Stability of anArray of Three Caverns in CompetentIgneous Rock at a Depth of 760 m(Support Requirements after Hoek(14)).
GENERAL REMARKS
The preceding results, although only a representative sample of those accumulated to datein this study, clearly indicate the need for site specific in situ stress data for the designof CAES caverns. A slight alteration in cavern geometry in relation to the artificial supportneeds can be perhaps an economic trade-off which deserves thoughtful attention from theviewpoints of rock stability and air leakage. In general, the results indicate that enhancedrock stability can be achieved with an array of caverns as compared to a single cavern, atleast from the viewpoints of pre-operational considerations for CAES in hard rock.
112

• THERMAL PENETRATION INTO CAES CAVERN WALL
In order to' investigate the cyclic thermal effects in the rock during CAES operation, acavern was chosen with a height and width of 20 m and 10 m, respectively. The compensatedcavern was considered to be initially full of water at 10°C. The top 2 m were assumed to con-tain compressed air at all times and the bottom 0.5 m to contain water at all times. Thus, theoperational height of the cavern over the compression and generation cycles was 17.5 m. Thecycle time was taken to be one day, with the conpression and generation cycles separated intoalternating 12 hour periods. The air/water interface was supposed to move at a constant velo-city over the operational height of the cavern. Compressed air inlet temperatures of 75°C and150°C were considered. The cavern was assumed to be 750 m deep and the geothermal gradientwas taken to be 25°C/km. Finally, the rock type was chosen to be igneous, with the followingthermal properties: thermal conductivity = 2.9 W/m-K; specific heat = 935 J/kg-K; thennaldiffusivity =1.3 E-06 n^/s.
7.9 M BELOW CAVERN CROWN
I "
! ROC
•>"I"
ISit
• \
i
(\
K AT0*C
r
//( \
J—!
\ TUR ' IS0 * C
L Tun • TS *C^ ^ 1 t±ltHRS. t*t4HRS.
1-WATER AT »• eCAVERM AIR/WATER TEUK CYCLE
CrCLES ' I . I
- • 22.8
- INITIAL TEHFERATURE OF ROCK
I . I . I . '
AIR TCHfCAVCRM MR/W»Xtl>Tint. CYCLt
ROCK ATJO"C—•
7.3 « BELOW CAVERN CHOWNI Hit HR$. I • MWII,
- IMITUL TEMPERATURE OF ROCK
. TO mu. totmoAirr TEUKRATME to *e (WATER) -
IJO t.0 S.0 4.0 f . 0
DISTANCE INTO CAVERN WALL (hi)
IO *O *O 4.0
DISTANCE INTO CAVERN WALL M
*J>
Fig. 8. Temperature Distribution in a CAESCavern Wall in Igneous Rock During theCompression Cycle.
Fig. 9. Temperature Distribution in a CAESCavern Wall in Igneous Rock Duringthe Generation Cycle.
113

Figures 8 and 9 illustrate the temperature distributions along a horizontal line intothe rock at a distance of 7.5 m from the crown of the cavern. The cavern wall (depending onelevation) is defined to be at the water temperature (10°C) or the compressed air temperature(75°C or 150°C) throughout the compression and generation cycle periods. The temperature inthe first meter of the cavern wall is seen to rise substantially within the first five cyclesof cavern operation. The region beyond one meter is relatively unperturbed by the cyclic tem-perature boundary on the cavern wall and undergoes continuous heating. The temperature risesbetween the twentieth and fiftieth cycles are much less. At the fiftieth cycle, temperatureincreases are quite small and the first meter of the cavern wall is near a steady oscillatorytemperature distribution with small temperature increases.
If the initial temperature of the material is the same as the mean of the oscillatory sur-face temperature, the temperature distribution reaches a steady oscillatory motion much morerapidly than if the initial temperature of the medium is above or below the mean of the har-monic surface temperature. For the CAES system discussed above, the analytical solution indi-cates that the transient portion of the solution will contribute to thermal oscillation within5 meters of the cavern wall for the life of the cavern. However, the majority of the tran-sient is damped within the first one hundred cycles.
One of the more important aspects of this simulation is the location and magnitude of thethermal gradients. The largest thermal gradients occur early in time and within the firstmeter of the cavern wall, indicating that this region will be the most critical as regardsthermally induced stresses.
CASE HISTORY SIMULATION OF CAVERN AIR LEAKAGE
In an effort to provide a test case for our proposed numerical model for air leakage,RE/SPEC subcontracted with Hagconsult AB to document the history and geometry of the FlygmotorCAES cavern system near Trollhatten, Sweden (Bergman, et al.U^v). The CAES system is used tosupply compressed air for wind tunnel testing of aircraft engines.
The Flygmotor cavern system was excavated in a biotite gneissic rock mass at a depth ofabout 90 m during 1949-51 and has a volume of approximately 12,000 m^ of usable storage. Thesystem is water-compensated, and due to the low height of the individual caverns (3.8 m),essentially provides a constant air pressure source. The cavity is normally charged five tosix times a day and has experienced approximately 30,000 unload-load cycles sinceconstruction.
Following cavity excavation, a tightness test was performed in September of 1951. Thecavern was pressurized to 830 kPa without water compensation and the pressure drop was moni-tored for 24 hours. This test was repeated twice for a total of three continuous tests. Theresults are given as follows:
TEST NO. PRESSURE DROP AIR LEAKAGEkPa/day %/day
1 29.4 3.62 27.0 3.33 39.2 4.8
Although these air leakage rates are high and might well be unacceptable in most CAES appli-cations, they were acceptable to Flygmotor.
114
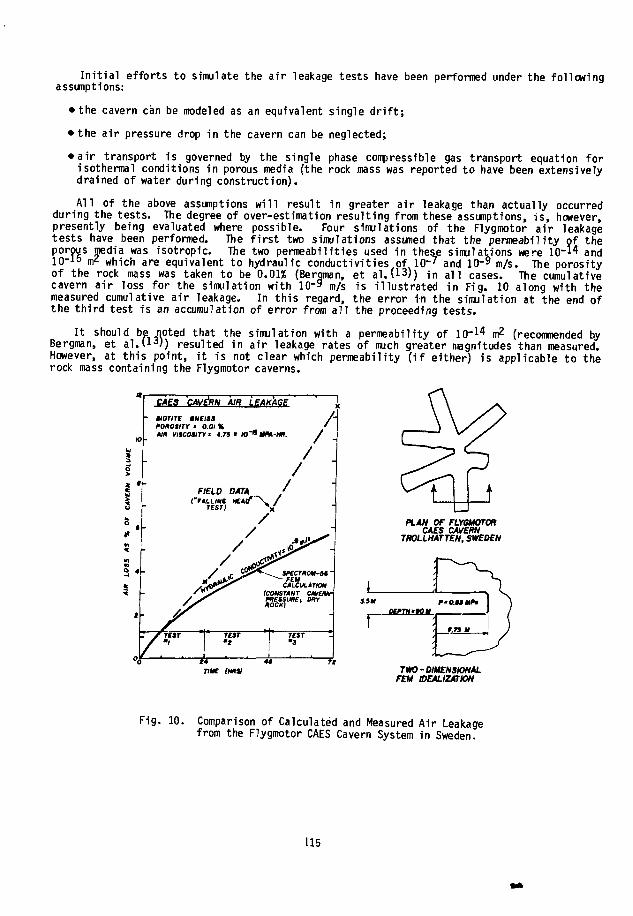
I n i t i a l efforts to simulate the air leakage tests have been performed under the followingassumptions:
• the cavern can be modeled as an equivalent single d r i f t ;
• the air pressure drop in the cavern can be neglected;
• a i r transport is governed by the single phase compressible gas transport equation forisothermal conditions in porous media (the rock mass was reported to have been extensivelydrained of water during construction).
A l l of the above assumptions w i l l result in greater air leakage than actually occurredduring the tests. The degree of over-estimation resulting from these assumptions, us, however,presently being evaluated where possible. Four simulations of the Flygmotor a i r leakagetests have been performed. The f i r s t two simulations assumed that the permeability of theporous media was isotropic. The two permeabilities used in these simulations were lO"1 4 and10" l b m' which are equivalent to hydraulic conductivities of 10"7 and 10"9 m/s. The porosityof the rock mass was taken to be 0.01% (Bergman, et a l . ( 1 3 ) ) in a l l cases. The cumulativecavern a i r loss for the simulation with 10"9 m/s is i l lustrated in Fig. 10 along with themeasured cumulative air leakage. In this regard, the error in the simulation at the end ofthe th i rd test is an accumulation of error from a l l the proceeding tests.
I t should be noted that the simulation with a permeability of 10"14 m2 (recommended byBergman, et a l . ( 1 J / ) resulted in air leakage rates of much greater magnitudes than measured.However, at this point, i t is not clear which permeability ( i f either) is applicable to therock mass containing the Flygmotor caverns.
CAE3 CAVERS AIR LEAKAGE
PLAN OF FLYGMOTORCAES CAVERN
THOLLHATTEN, SWEDEN
TWO-DIMENSIONALFEU IDEALIZATION
Fig. 10. Comparison of Calculated and Measured Air Leakagefrom the Flygmotor CAES Cavern System in Sweden.
115

The f inal two simulations used the empirical permeability/normal stress relationship deve-loped by Burgess"1). This formulation assumes that:
• equivalent porous media permeability is a function of the normal stress across a jo in t setat an assumed orientation.
• the relationship can be determined from f ie ld measurements which preferentially measurehorizontal permeability wherein normal pressure on the discontinuities is equal to theweight of the overburden.
Prior to making the a i r leakage calculations with the empirical permeability relationship,an elastic stress analysis of the Flygmotor caverns was performed for the purpose of obtainingthe normal stress distributions across assumed jo int sets at vertical and horizontal orien-tat ions. The analysis was undertaken for coefficients of lateral earth stress of 5.5 and 10,which are typical measured values in hard rock at a depth of about 100 m (see Fig. 2) . Withthese stress results and the stress-dependent permeability relationship, the a i r leakage wasfound to be approximately a factor of 30 greater than that measured. In effect, the coef-f ic ien t of lateral earth stress was found to have only a minor influence on the volume of airleakage. However, the location of leakage in the cavern (roof versus rib) is strongly depen-dent on the in s i tu stress rat io, with the higher value giving rise to a greater loss of a i rthrough the cavern r ibs.
The over-estimation in the a i r leakage is due to several factors. F i rs t ly , the empiricalpermeability/stress relationship was derived with a bias towards the greater values of per-meability (S t i l l e , et a l . f 1 ^ ) ) . Secondly, the assumed two-dimensional model of the Flygmotorcavity is extremely important in evaluating the percent air loss. In this regard, the cavernsystem was modeled as an equivalent volume disc with a height of 3.5 m. The a i r loss fromth is simulation was signif icantly lower than that obtained with the two-dimensional analysis.
ACKNOWLEDGMENTS
The contents o f t h i s paper are der ived from work performed under Special Agreement No.B-49407-A-H (Prime Contract EY-76-C-06-1830) w i t h P a c i f i c Northwest Laborator ies o f B a t t e l l eMemorial I n s t i t u t e f o r the U.S. Department of Energy. The authors are indebted t o Landis D.Kannberg, Terry J . Doherty, and Walter V. Loscutof f o f BPNL f o r t h e i r t echn ica l guidance andass is tance ; t o A r lo F. Fossum f o r h is cons t ruc t i ve suggestions and var ied techn ica lassistance; and to Jul ie S. Annicchiarico for her thoughtful attention in typing themanuscript.
LIST OF REFERENCES
1. D. S. Port-Keller and P. F. Gnirk: "CAES and UPHS in Hard Rock Caverns: I . Geologicaland Geotechnical Aspects", RE/SPEC Project Summary Rpt. RSI-0076, Prepared for Battel lePacif ic Northwest Lab. (197971
2. P. F. Gnirk, D. S. Port-Keller, and H. Waldman: "CAES and UPHS in Hard Rock Caverns: I I .Thermal/Mechanical/Chemical Rock Properties", RE/SPEC Project Summary Rpt. RSI-0078,Prepared for Battel le Pacific Northwest Lab. (1975H
3. P. F. Gnirk and D. S. Port-Keller: "Preliminary Design and Stab i l i ty Crite la for CAESHard Rock Caverns", Proc. DOE 1978 Mech. and Magnetic Energy Storage Contractors' ReviewMtg., Luray (1978), pp. 364-373.
116

4. P. F. Gnirk: "CAES and UPHS in Hard Rock Caverns: I I I . Preliminary Stabi l i ty and DesignCriteria for Compressed Air Energy Storage Caverns", RE/SPEC Project Summary Rpt.RSI-0079, Prepared for Battelle Pacific Northwest Lab. (1975JI
5. A. F. Fossun: "On the Analysis Procedures for Formulation of Stabi l i ty and DesignCriteria for CAES in Hard Rock Caverns: I . Excavation Phase", RE/SPEC Topical Rpt. RSI--0077, Prepared for Battelle Pacific Northwest Lab. (1979).
6. A. F. Fossum: "Laboratory Testing of Hard Rock Specimens for Compensated CAES Caverns",Proc. DOE 1979 Mechanical and Magnetic Energy Storage Contractors' Review Mtq.. WashingtonD.C. (1979).
7. P. F. Gnirk and A. F. Fossum: "On the Formulation of Stabi l i ty and Design Criteria forCompressed Air Energy Storage in Hard Rock Caverns", 14th Intersociety Energy ConversionEngrng. Conf., Boston (1979), V. 1, pp. 429-440.
8. E. T. Brown and E. Hoek: "Trends in Relationships Between Measured In Situ Stresses andDepth", In t . J . Rock Mech. Min. Sc i . , V. 15 (1978), pp. 211-215.
9. B. C. Haimson: "The Hydrofracturing Stress Measuring Method and Recent Field Results",In t . J . Rock Mech. Min. Sc i . , V. 15 (1978), pp. 167-178.
10. A. Carlsson and T. Olsson: "Variations of Hydraulic Conductivity in Some Swedish RockTypes", Rockstore 77 (1977), V. 2, pp. 301-307.
11. A. Burgess: "Groundwater Movements Around a Repository: Regional Groundwater FlowAnalyses", KBS Teknisk Rapport 54:03 (1977).
12. H. S t i l l e , A. Burgess, U. E. Lindblom: "GrounoVater Movements Around a Repository:Geological and Geotechnical Conditions", KBS Teknisk Rapport 54:01, (1977).
13. M. Bergman, J. Lundberg, and K. Windelhed: "Case History Examination of CompensatedCom?ressed-Air Storage Caverns in Gneissic Rock at Trollhattan, Sweden", RE/SPEC TopicalRpt. RSI-0091, Prepared for Battelle Pacific Northwest Lab. (1979).
14. E. Hoek: "The Role of Modeling in the Design of Nuclear Waste Repositories: The DesignEngineer's Viewpoint", LLL/ONWI Workshop on Thermomecham'cal Modeling for a Hardrock WasteRepository, Berkeley (1979).
117!

PROJECT SUMMARY
Project Title:
Principal Investigator:
Organization:
Project Objectives:
Project Status:
Contract Number:
Contract Period:
Funding Level:
Funding Source:
Establishment of Design and Stability Criteria Through LaboratoryTesting of Hard Rock Specimens Subjected to Loadings and Environ-mental Conditions Appropriate to a Compressed Air Energy StorageCavern
Dr. Ar'io F. Fossum
RE/SPEC Inc.P.O. Box 725Rapid City, SD(605) 343-7868
57709
Investigate the properties of hard rock specimens, from formationssuitable for CAES under the cyclic conditions imposed by a CAESinstallation, by means of laboratory scale testing and formulatepreliminary design and stability criteria for CAES caverns.
This project is divided into the following five phases:
18(3)
4)5)
Determine Significant Rock PropertiesProcure SpecimensSelect Specific Procedures for Rock Characterization beforeand after TestingConduct Laboratory Scale Testing of Rock SpecimensFormulate Stability and Design Criteria
The project status is as follows:
(1) The significant rock properties have been determined for whichdata are lacking and a study is nearing completion which seeksto find representations between certain rock properties andthe rock petrography.
(2) Large quantities of quarry rock have been obtained from fourmajor generic rock groups. Additional granitic specimenswill be obtained from at-depth conditions.
(3) Specific procedures for rock characterization before andafter testing have been selected and are proceeding accordingto the project plan.
(4) Sample preparations, conditioning, and laboratory scaletesting are all underway.
(5) The methodology for formulating stability and design criteriabased on this testing program, the state-of-the-art survey,and the numerical modeling program is being formulated.
Special Agreement No. B-51295-A-E/Prime ContractEY-76-C-06-1830.
March 2, 1979 - August 5, 1980
$205,925
Pacific Northwest Laboratories, Battelle Memorial Institute
119
LABORATORY TESTING OF HARD ROCK SPECIMENS FOR COMPENSATED CAES CAVERNS
A. F. FossumRE/SPEC Inc.P. 0. Box 725
Rapid City, SD 57709
ABSTRACT
Laboratory scale testing and its role in the formulation of compressed air energy storage(CAES) cavern stability and design criteria are discussed with viewpoints toward fundamentaland special tests. Fundamental testing provides numerical values of parameters between stressand strain. In addition to the initial elastic constants, six fundamental coefficient materialfunctions are identified of which five require data fitting. The constitutive equationsdeemed appropriate are inelastic but incrementally linear and involve a combination of incre-mental plasticity and fracturing material theory. Special testing provides answers to specificquestions related to rock behavior in thepresence of CAES operating conditions. For example,"How is the load bearing capacity and stiffness of rock affected by thermomechanical cyclingin the presence of moisture under pressure?" These and other similar questions must beanswered by testing rock in systems which reproduce the operating conditions as closely aspossible.
INTRODUCTION
Laboratory scale testing provides a means for addressing those unknowns which may affectthe technical and economic feasibility of Compressed Air Energy Storage (CAES) from the stand-point of the response of underground caverns to pressure, temperature, and moisture fluc-tuations occurring during the periodic charge and discharge operations. Results from suchtesting, together with other Pacific Northwest Laboratory sponsored programs, should culminatein the formulation of design and stability criteria for CAES caverns to ensure their longlifetime suitability and encourage early commercialization of the CAES concept.
The pertaining CAES operating conditions of primary interest include the following:
(1) Initial vertical and horizontal in situ stresses and hydraulic pressurescorresponding to cavern depths of 500 to 1000 meters (vertical stress gradients rangefrom 0.0282 MPa/m for metamorphic rocks to 0.0247 MPa/m for sedimentary rocks with anintermediate value of 0.0269 MPa/m for igneous rocks).(1) In general, for thesedepths, the maximum horizontal in situ stress may be substantially greater than thevertical in situ stress, by a factor of two or more. (1) The water pressure may betaken as 0.01 MPa/m;
(2) Inlet air temperatures from 50 to 150°C,
(3) Compensating water temperatures from 0 to 20°C,
120

(4) Initial rock temperatures (the geothermal gradient varies from region to region withan average value of approximately 28°C/Km'i));
(5) A useful life of approximately 10,000 cycles, or 30 years.
The specification of CAES caverns in hard rock immediately categorizes the situation toone involving igneous (granitic), possibly metamorphic, and certain sedimentary (limestones,marbles, dolomites) rocks. At the pressures and temperatures mentioned above, these rocksbehave in a brittle manner in which the modes of inelastic behavior are microcracking and fric-tional sliding on fissure surfaces. This type of behavior is dominant for crustal conditionsas opposed to at-depth conditions where the pressure-temperature regime is conducive to duc-tile rock behavior involving dislocation processes. Thus, consideration must be given to theinfluence of joints or planes of weakness, permeability, and groundwater presence. In addi-tion, the cyclic temperature fluctuations will induce cyclic thermomechanical stresses whichmay degrade the strength and stiffness properties of the rock structure and lead toprogressive global and/or local instabilities.
ROLE OF LABORATORY TESTING
The role of laboratory scale testing in the formulation of stability and design criteriais two-fold. On the one hand, parameters necessary in conducting analyses must be determinedexperimentally by testing rock specimens in systems which induce homogeneous stresses andstrains. These parameters are fundamental parts of the expressions relating stress and strainand as such characterize the rock under consideration. Such expressions are derived within therealm of general theories, the structure of which mist satisfy a number of physical prin-ciples. Many times these fundamental physical requirements are conceived following the obser-vation of experimental behavior.
On the other hand, laboratory scale testing can provide an understanding of some charac-teristics of the real world in the absence of a theory encompassing the known behavior and forwhich analytical or numerical solution techniques fail. In this case testing seems to be, andoften is, the only available approach possible within the time limitations imposed. In thestudy at RE/SPEC, testing is being conducted for both purposes. For discussion purposes,reference will be made to fundamental testing and special testing in the context of the abovedefinitions.
FUNDAMENTAL TESTING
The essence of an analysis of a CAES cavern, for the purpose of formulating stability anddesign criteria, is the ability of the engineer to predict the mechanical behavior of a rockmass supported and loaded in a specified manner from controlled experiments on simple rockbodies. This requires the engineer to foniuiate constitutive equations and to solve boundaryvalue problems.
In the current context, constitutive equations are the relations between stress andstrain. In addition to stress and strain, the constitutive relations for rock are likely toinvolve other measurable physical quantities such as time, temperature, and quantities calledinternal parameters for which a direct measurement cannot be made. However, the effects ofinternal parameters can usually be expressed in terms of stress or strain history.
121

A knew!edge of the deformation mechanisms is valuable in suggesting particular forms forphenomenological constitutive relations. Since CAES Caverns are proposed for the brittletemperature-pressure regime, the observed macroscopic inelastic strain may be considered asthe outcome of a chain of events including frictional sliding on microscopic fissures,attended by the outgrowth of localized tensile cracks from the tips of the fissures, andoverriding of asperities. Dilatancy is thought to be the cumulative effects of these latterfeatures. The criterion separating elastic from inelastic behavior for rock is pressuredependent because of the frictional nature of rocks. This type of pressure dependence is dif-ferent than that which has been observed in metals arising from microporosity. The latter ischaracterized by a description in which the pressure dependence of the criterion separatingelastic from inelastic behavior is fully matched by inelastic dilatancy. This type of beha-vior is not observed in the laboratory testing of rocks.
In general, the behavioral aspects of rock are complicated indeed and the phenomenologicalapproach to the description of rock behavior leads to sophisticated constitutive relations.But, in order for the analyst to obtain realistic results, the use of such relations is infact necessary. Fortunately finite element methods render structural analyses with sophisti-cated constitutive relations feasible. Nonetheless, one must be mindful of the degree ofaccuracy called for in a particular rock mechanics analysis and simplify the description in ajudicious manner, such that the important or dominant characteristics which affect the struc-tural behavior significantly under the prevailing conditions are considered.
The two broad categories of constitutive relations are those in which increments of stressand strain are linearly related, and those in which the relation is nonlinear. The firstincludes the incremental or flow theories, the total or deformation theories, and hypoelasti-city. The second includes the endochronic theory. The premise is taken here that incremen-tally linear inelastic constitutive laws are appropriate for the degree of accuracy called forin the analysis of CAES caverns under the pertaining conditions.
Fundamental Requirements of an Incremental Approach
The essential ingredients of an incremental approach to rock behavior are the following:
(1) A criterion marking the onset of inelastic rock behavior;
(2) Rules relating the stress and stress increments or decrements to the strainincrement;
(3) Hardening and softening rules;
(4) Limit or failure criteria at which instability results.
In much of the rock mechanics literature, a tacit equivalence seems to exist between item (4)and item (1) and as a result little data exist for items (l)-{3). Constitutive laws existhowever which include all of the essential features for a structural analysis and which areappropriate to the study of CAES caverns(2). These constitutive laws combine familiar incre-mental plasticity and fracturing material theory and provide nonlinear triaxial constitutiverelations which are incrementally linear. The dominant characteristics accounted for in theserelations, which may be important to CAES cavern performance, are internal friction, pressuresensitivity, inelastic dilatancy due to microcracking and friction, strain hardening, strainsoftening, degradation of elastic moduli due to microcracking, and hydrostatic nonlinearitydue to pore collapse. In addition, special hardening rules can be incorporated which permit
122

inelastic response during unloading, reloading, and cyclic loading, as experienced at the.periphery of a CAES cavern during the periodic charge and discharge operations. For compen-sated systems, which are of interest in this study, cyclic loading is induced by the periodicheating and cooling of the cavern wall corresponding to charging when hot air is injectedinto the cavern, and discharging when cold water displaces the hot air.
Generally speaking, the constitutive relations mentioned above require, in addition to theinitial elastic constants, six independent scalar coefficients. These coefficients arematerial functions of the invariants of stress and strain. The initial elastic constants areshear modulus and bulk modulus. The six inelastic material functions are identified asfollows:
(1) Plastic hardening modulus;
(2) Fracturing compliance;
(3) Internal or plastic friction coefficient;
(4) Volumetric fracturing compliance coefficient;
(5) Plastic dilatancy factor;
(6) Fracturing dilatancy factor.
Of these six functions, only one has been determined theore t ica l ly^ ) . The fracturing d i la -tancy factor has been determined by a theoretical argument based on a micromechanics model inwhich the effective elastic constants of a randomly microcracked elastic material are calcu-lated by the self-consistent method for composites(3). The remaining f ive functions mustbe determined empirically by the f i t t i n g of test data.
Figure 1 demonstrates how incremental plast ic i ty is combined with fracturing materialtheory to obtain a real is t ic plastic-fracturing theory. The behavior depicted in Fig. lb pre-vails at very low confining pressure as well as in the later stages of uniaxial compression.
Plastic Fracturing Plastic-Fracturing0
Strain(b)
Fig. 1. Elements of Elastic-Plastic-Fracturing Behavior.
123
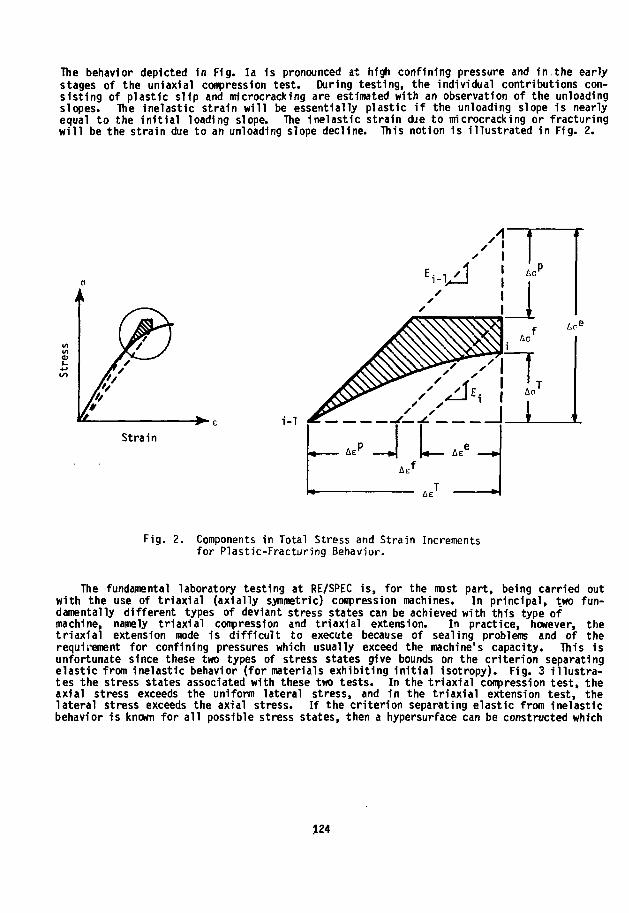
The behavior depicted in Fig. la is pronounced at high confining pressure and in the earlystages of the uniaxial compression test. During testing, the individual contributions con-sisting of plastic slip and microcracking are estimated with an observation of the unloadingslopes. The inelastic strain will be essentially plastic i f the unloading slope is nearlyequal to the ini t ia l loading slope. The inelastic strain due to microcracking or fracturingwi l l be the strain due to an unloading slope decline. This notion is illustrated in Fig. 2.
i c c
StrainAer
/AH
- J I— ''At. ! IT
Ac1
Ac
Fig. 2. Components in Total Stress and Strain Incrementsfor Plastic-Fracturing Behavior.
The fundamental laboratory testing at RE/SPEC is, for the most part, being carried outwith the use of triaxial (axially symmetric) compression machines. In principal, two fun-damentally different types of deviant stress states can be achieved with this type ofmachine, namely triaxial compression and triaxial extension. In practice, however, thetriaxial extension mode is difficult to execute because of sealing problems and of therequirement for confining pressures which usually exceed the machine's capacity. This isunfortunate since these two types of stress states give bounds on the criterion separatingelastic from inelastic behavior (for materials exhibiting initial isotropy). Fig. 3 illustra-tes the stress states associated with these two tests. In the triaxial compression test, theaxial stress exceeds the uniform lateral stress, and in the triaxial extension test, thelateral stress exceeds the axial stress. If the criterion separating elastic from inelasticbehavior is known for all possible stress states, then a hypersurface can be constructed which
124
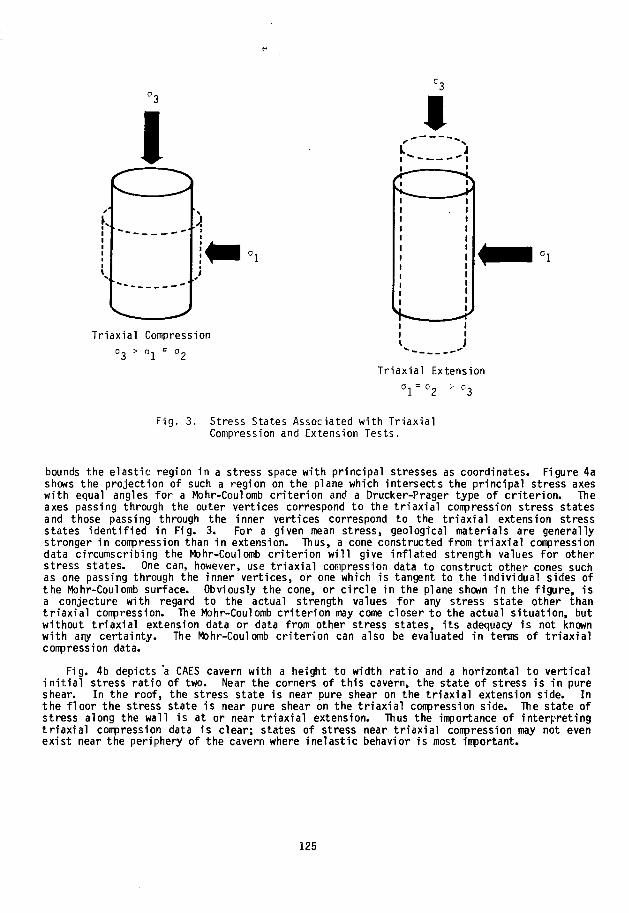
1 I
k
Triaxial Compression
Triaxial Extension
° r ° 2 =• °3
Fig. 3. Stress States Associated with TriaxialCompression and Extension Tests.
bounds the elastic region in a stress space with principal stresses as coordinates. Figure 4ashows the projection of such a region on the plane which intersects the principal stress axeswith equal angles for a Mohr-Coulomb cri ter ion and a Drucker-Prager type of cr i ter ion. Theaxes passing through the outer vertices correspond to the t r iax ia l compression stress statesand those passing through the inner vertices correspond to the t r iax ia l extension stressstates identif ied in Fig. 3. For a given mean stress, geological materials are generallystronger in compression than in extension. Thus, a cone constructed from t r iax ia l compressiondata circumscribing the Mohr-Coulomb cr i ter ion w i l l give inflated strength values for otherstress states. One can, however, use t r iax ia l compression data to construct other cones suchas one passing through the inner vertices, or one which is tangent to the individual sides ofthe Mohr-Coulomb surface. Obviously the cone, or c i rc le in the plane shown in the f igure, isa conjecture with regard to the actual strength values for any stress state other thant r iax ia l compression. The Mohr-Couiomb cri ter ion may come closer to the actual situation, butwithout t r iax ia l extension data or data from other stress states, i t s adequacy is not knownwith any certainty. The Mohr-Coulomb cri ter ion can also be evaluated in terms of t r iax ia lcompression data.
Fig. 4b depicts a CAES cavern with a height to width ratio and a horizontal to verticali n i t i a l stress rat io of two. Near the corners of this cavern, the state of stress is in pureshear. In the roof, the stress state is near pure shear on the t r iax ia l extension side. Inthe f loor the stress state is near pure shear on the t r iax ia l compression side. The state ofstress along the wall is at or near t r iax ia l extension. Thus the importance of interpretingt r iax ia l compression data is clear; states of stress near t r iax ia l compression may not evenexist near the periphery of the cavern where inelastic behavior is most important.
125

•TriaxialCompression
PureShear
TriaxialExtension
Drurker-Prager Type
Mohr-Coulomb
= 2 o
Yield Surfaces in Stress Space
(a)B BCAES Cavern
Fig. 4. Types of Stress States Around a Cavern andTheir Location in Stress Space.
With this awareness, the material functions mentioned earlier are being evaluated with theuse of triaxial compression tests. A determination of the type of hardening that exists andthe study of intrinsic corners that may develop in the loading surface (hypersurface in stressspace) cannot be accomplished with this test.
Other aspects which are being considered include the following:
(1) Influence of temperature and moisture on rock properties;
(2) Influence of type, orientation, and spacing of joints on rock properties;
(3) Degradation of strength and stiffness of rock under cyclic loading with and withoutthe presence of temperature, moisture, and confining pressure.
These considerations fall under the realm of special testing.
SPECIAL TESTING
Special testing refers to those tests which have rather a singular purpose. These tastsare somewhat out of the ordinary but provide information which can be used as the basis for anunderstanding of rock behavior under circumstances which are difficult to model, or for which asufficiently general theory does not exist. Although a conpensated cavern will not experiencemuch internal pressure change, the thermally-induced stress variations can be substantial.Therefore, the reduction in strength and stiffness and the change in permeability of rock isbeing investigated as a function of stress cycles.
126

Generally speaking, the fatigue life of a specimen consists of three phases, namely,nucleation, progagation, and rupture. There is not a clear distinction between nucleation andpropagation, but rupture refers to fracture under a quarter cycle of loading.
Rocks exhibit several damage mechanisms which can progress independently or in interactionwith each other. Because of the complex microstructural nature of rocks, the characterizingand monitoring of the damage process during cyclic loading is difficult at best. The likelydamage mechanisms include matrix cracking, grain boundary cracking, and fracture of embeddedminerals. For a brittle material such as rock, rupture is due to the formation, growth, andcoalescence of microcracks. Since one expects, for this type of material, that the nucleationperiod is long compared with the propagation period, the Palmgren-Miner rule is probably ade-quate for prediction of fatigue life. Correspondingly, one of the types of fatigue testingbeing conducted at RE/SPEC is the uniaxial load controlled fatigue test. The data from thesetests can be presented graphically as stress-life (S-N) curves. Since the fatigue lifedepends on numerous variables including mean stress (steady component stress), range ofstress, loading frequency, temperature, moisture content, and specimen size, a method forscreening, as outlined by Plackett and Burmanl4), is being employed involving a design ofoptimal multifactorial experiments.
In addition to the cycles-to-fa1lure data, cyclic stress-strain curves are being obtainedperiodically throughout the test so that modulus decay can be characterized. These data areimportant to thermal stress calculations since these stresses are directly proportional to themodulus of elasticity.
Another special cyclic loading test which will be conducted at RE/SPEC is one in which acylindrical test specimen is subjected to a confining pressure and a cyclic axial load. Theconfining fluid, which will be alternately cold water and hot air, will be allowed to makecontact with the test specimen. By maintaining the preloaded test specimen at a constantlength, cyclic thermal stresses will be induced by the exchange of hot air and cold water. Iffailure does not occur after a specified number of cycles, the specimen will be broken and theresidual strength recorded. The axial preload, confining pressure, and water and air tem-peratures will be chosen to be representative of an operating CAES cavern.
Other testing either in progress or proposed for the future include the guarded hot platetest for the determination of thermal conductivity as a function of temperature, and charac-terization tests for the determination of bulk density, grain size range, porosity, and per-meability. In addition, modal petrographic and chemical analyses are in progress.
Finally, upper and lower bound representations have been established which give effectivethermal conductivity of a generic rock as a function of the thermal conductivities and volumefractions of the constituent minerals.
REFERENCES
1. Debra S. Port-Keller and Paul F. Gnirk, "CAES and UPHS in Hard Rock Caverns: I .Geological and Geotechnical Aspects", Project Sumary Report RSI-OO76, Prepared forPacific Northwest Laboratories, Battelle Memorial Inst i tute under Special Agreement No.B-51225-A-L, Prime Contract EY-76-C-06-1830, (January 19, 1979).
2. Zdenek P. Bazant and Sang-Sik Kim, "Plastic-Fracturing Theory for Concrete", Journal ofthe Engineering Mechanics Division, ASCE, Vol. 105, No. EM3, pp. 407-428, (1979)":
3. B. Budiansky and R. J. O'Connell," Elastic Moduli of Cracked Solids," InternationalJournal of Solids and Structures, Vol. 12, pp. 81-97, (1976).
4. R. L. Plackett and J. P. Burman, "The Design of Optimal Multifactorial Experiments",Biometrika, Vol. 33, pp. 305-325, (1946).
127
Project Title:
Principal Investigator:
Organization:
Project Goals:
Project Status:
Contract Number:
Contract Period:
Funding Level:
Funding Source:
PROJECT SUMMARY
Air-Water-Rock Interactions
J.A. Stottlemyre
Pacific Northwest LaboratoryP.O. Box 999Richland, Washington 99352(509) 946-2733
To investigate potential physical and chemical property alterationsunder simulated CAES reservoir conditions. Establish a CAES porousmedia laboratory for future site specific evaluation. Generatedata in support of site selection and reservoir stability criteria.
Quartzose sandstones are exhibiting good property stability inheated, humidified air environments as simulated in autoclavesystems. Due to this observation and the inherent inability toadequately simulate field conditions in autoclaves the followingcourse is being pursued: 1) Autoclave tests will be used toscreen CAES candidate rock types only, 2) Successful candidaterocks will then be tested in a heated, triaxially loaded pressurevessel which permits adequate control of temperatures, stresses,advective flow rates, humidities and cycling frequencies, 3) Futureemphasis will be on making measurements under carefully simulatedfield conditions and investigating the phenomena of thermal fatigueand hydrolytic weakening of potential CAES reservoir rocks.
EY-76-C-06-1830
FY1979
$50K
Department of Energy, Division of Energy Storage Systems
129

PERMEABILITY AND FRIABILITY ALTERATIONS IN QUARTZOSE SANDSTONES EXPOSED TO ELEVATEDTEMPERATURE HUMIDIFIED AIR
J.A. Stottlemyre, R.L. Erikson, and R.P. SmithPacific Northwest LaboratoryRichland, Washington 99352
ABSTRACT
The feasibility of elevated temperature Compressed Air Energy Storage concepts may depend,to a major extent, upon the physical and chemical stability of reservoir rocks to new environ-mental conditions. This paper is based on preliminary autoclave studies of quartzose sand-stones exposed to simulated CAES subsurface conditions. The properties of primary concern areabsolute gas permeability, friability, and compressibility. Independent variables includetemperature (50-300°C), pressure (20-120 bars), experiment duration (14-56 days), and environ-ment (dry air, humidified air, or brine). Preliminary observations, based mi a very limiteddata set, are: 1) quartzose sandstones exposed to dry air exhibit excel1.nit pr:perty stabilityunder all test conditions, 2) samples undergo significant disaggregatio i .vhen exposed to brineat temperatures as low as 100-150°C, and 3) when exposed to humidified air at elevated tempera-ture. Preliminary results indicate sandstones may be suitable storage media for heated, humidair as long as elevated temperature zones are relatively free of mobile liquid phase water.
INTRODUCTION
The economic and technical feasibility of Compressed Air Energy Storage (CAES) technologydepends to a major extent on locating, developing, and maintaining a suitable subsurfacereservoir. One area of uncertainty is the physical and chemical stability of the reservoirmedium, e.g., sandstone aquifer or crystalline rock to new subsurface environmental conditionsassociated with CAES operations. Of primary interest are potential changes in permeability,friability, and compressibility of sandstone due to elevated temperatures, humidities, andoxidation potentials.
This paper is a synopsis of a recent laboratory investigation concerning the potentialeffects of heated, humidified air on quartzose sandstones. Information is presented in thefollowing sequence: 1) anticipated reservoir environment, 2) experimental facilities andprocedures, 3) multivariate experimental strategy, 4) data analysis and conclusions, and 5)summary recommendations.
ANTICIPATED RESERVOIR ENVIRONMENTS
Numerical models^ ' have been utilized to estimate the temperature, pressure, and moisturelevels as a function of injection air temperature, radial distance from any given well, andtime. Example curves for temperature and pressure are shown in Figs 1 and 2 and are based onthe reference data presented in Table 1. In a CAES reservoir, moisture will be derived fromtwo sources: 1) residual or irreducible water left in the porous rock after initial air bubbleexpansion, and 2) water vapor entrained in the injected air stream. This moisture will begradually removed from the near well zones via evaporation with undersaturated injection air.Fig. 3 presents a possible dehydration history for the reference reservoir.0)
130

IB I
ICSCRVOIR UDIUS. lm>
Fig. 1. Thermal Development Around AnInjection/Production Well.
TIIKOFKK. a*
Fig. 2. Reservoir Air Pressure Variations
14.6m RADIUS
TABLE 1. Reservoir Parameters for Base CaseComputer Simulation (Wiles 1979)
ParameterGeometry
Reservoir Diameter (m)Well Diameter (cm)
PropertiesPorosity (%jPermeability (m2)Rock Thermal Conductivity (w/m-°C)Rock Thermal Capacity (MJ/m3.°c)
Operating ConditionsNominal Pressure (MPa)Mass Flow Rate
Injection (kg/s.m)Extraction (kg/s-m)
Initial Reservoir Temperature (K)Air Injection Temperature (K)
Reference Value
122IB
205.0xl0"13
2.162.62
5.07
0.180.163)2505
Fig. 3. Possible Dehydration History forReference Reservoir
These computations are necessary to establish limits on the expected subsurface reservoirconditions. From this data, it appears that a certain zone of rock surrounding each well willbe exposed to heated humidified air for an extended period of time. It is therefore necessaryto simulate these environmental conditions, to the degree possible, in laboratory investigations.
EXPERIMENTAL FACILITIES AND PROCEDURES
To adequately simulate anticipated field conditions, the sample should be heated, loadedtriaxially, and ventilated with air of known humidity, temperature, and flow rate. Measure-ments of principal concern include the pressure drop along the axis of the rock core, axial
131
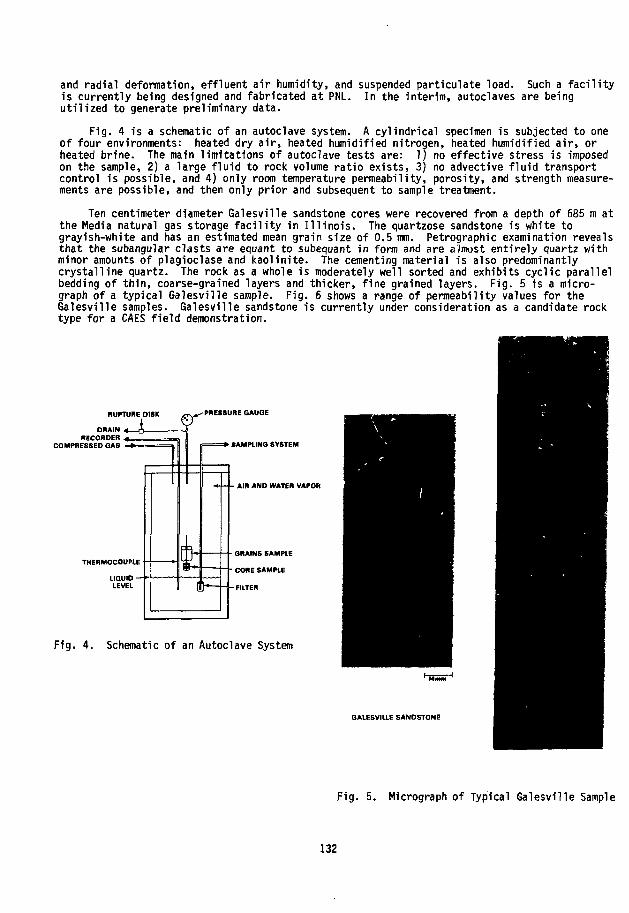
and radial deformation, effluent air humidity, and suspended particulate load. Such a facilityis currently being designed and fabricated at PNL. In the interim, autoclaves are beingutilized to generate preliminary data.
Fig. 4 is a schematic of an autoclave system. A cylindrical specimen is subjected to oneof four environments: heated dry air, heated humidified nitrogen, heated humidified air, orheated brine. The main limitations of autoclave tests are: 1) no effective stress is imposedon the sample, 2) a large fluid to rock volume ratio exists, 3) no advective fluid transportcontrol is possible, and 4) only room temperature permeability, porosity, and strength measure-ments are possible, and then only prior and subsequent to sample treatment.
Ten centimeter diameter Galesville sandstone cores were recovered from a depth of 685 m atthe Media natural gas storage facility in Illinois. The quartzose sandstone is white tograyish-white and has an estimated mean grain size of 0.5 mm. Petrographic examination revealsthat the subangular clasts are equant to subequant in form and are almost entirely quartz withminor amounts of plagioclase and kaolinite. The cementing material is also predominantlycrystalline quartz. The rock as a whole is moderately well sorted and exhibits cyclic parallelbedding of thin, coarse-grained layers and thicker, fine grained layers. Fig. 5 is a micro-graph of a typical Galesville sample. Fig. 6 shows a range of permeability values for theGalesville samples. Galesville sandstone is currently under consideration as a candidate rocktype for a CAES field demonstration.
RUPTURE DISK
DRAINRECORDER
COMPRESSED GAS
THERMOCOUPLE
PRESSURE GAUGE
SAMPLING SYSTEM
AIR AND WATER VAPOR
GRAINS SAMPLE
CORE SAMPLE
FILTER
Fig. 4. Schematic of an Autoclave System
GALESVILLE SANDSTONE
Fig. 5. Micrograph of Typical Galesville Sample
132

! -
M i l SWUE SAMSHK, H1IN0I5
. • «s wmamtno I B KMEMIUTY
. . : • : : • • ! • ! *
Dl K D I H B H I U I I HI Oil Hi 0!) DM IU Jl J! Jl J4
Fig. 6. Range of Permeability Values forGalesville Samples
MULTIVARIATE EXPERIMENTAL STRATEGY
The main objectives of the experiments are: 1) identify independent variables that havesignificant impact on the response of the rock, 2) identify those independent variables thathave relatively small influence and therefore can be held constant in future experiments, and3) identify trends in the data pertaining to CAES reservoir design and/or operating criteria.A Placket-Eurman experimental design was selected to systematically investigate the mainresponse characteristics of the dependent variables to various combinations of the maximum andminimum magnitudes of the independent variables. The variables and their ranges are listed inTable 2.
The cores are reacted in: 1) a dry air environment, 2) a water vapor and pure nitrogenenvironment, 3) a water vapor and air environment, and 4) a brine environment. Table 3illustrates the percent change in gas permeability and "friability". Friability is basically aqualitative term which refers to the potential for individual grains to dislodge from the rockmatrix. The friability test involves a carefully controlled point loading of the specimen andis designed to address changes in intergranular contact strength. Temperature, liquid watersaturation, and duration of the experiment were found to be the most significant independentvariables controlling permeability, porosity and friability alterations. Figures 7 and 8 showthe percent changes in gas permeability and "friability" for various combinations of thesethree variables. The changes are listed inside the circles as either increasing {}) or decreasing(f) a certain percentage over the pretest level.
TABLE 2. Range of Independent Variables TABLE 3. Test Matrix for Screening Experiments
IndependentVariable
Pressure (bars)
Temperature (°C)
Time (months)
Oxygen content ( ' )
Carbon dioxide content ( ' )
Stirr ing frequency (per day)
Liquid saturated environment
Air and vapor saturated envirominent
Minimum Value
60
50
0.5
0.0
0.0
0
No
No
Maximum Value
120
300
2.0
21.0
0.)
S
Ves
Yes
•Dependent Variables - Gas permeability. Liquid pemeability. Fr iabi l i ty , Pore
0 II Io u t0 0 0S 0 1S 0 0S 21 00 0 0S 21 0
1 R•0
S 0 0.0 II
N
r
T
a
« l u
4 ii4u471t l J4914n
• l !
I K
»
InIn4a4j>«M111IX4nlat*
[1 O M ^ l
4 »1 <lIffil«>4I w4 a4 u1 N4"i4 'i
IT
133
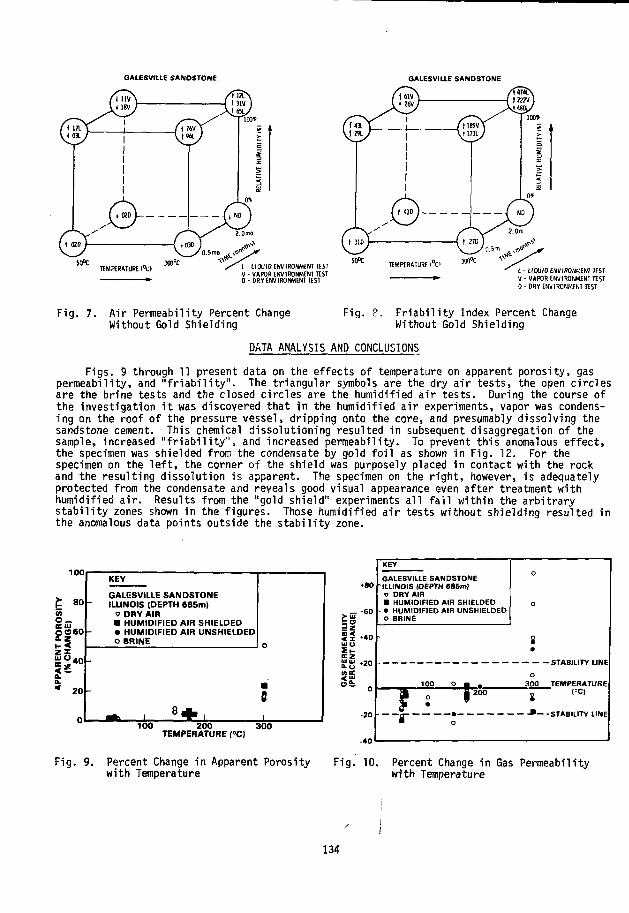
GALESVILLE SANDSTONE GALESVILLE SANDSTONE
TEMPERATURE (°C) L UQUW ENVIRONMENT TESTV • VAPOR ENVIRONMENT TESTO-DRYENVIRONMENTTEST
I • LIQUID ENVIRONMENT TEST
V • VAPOR ENVIRONMENT TEST
D - DRY ENVIRONMENT TEST
Fig. 7. Air Permeability Percent Change Fig. 8.Without Gold Shielding
Friability Index Percent ChangeWithout Gold Shielding
DATA ANALYSIS AND CONCLUSIONS
Figs. 9 through 11 present data on the effects of temperature on apparent porosity, gaspermeability, and "friability". The triangular symbols are the dry air tests, the open circlesare the brine tests and the closed circles are the humidified air tests. During the course ofthe investigation it was discovered that in the humidified air experiments, vapor was condens-ing on the roof of the pressure vessel, dripping onto the core, and presumably dissolving thesandstone cement. This chemical dissolutioning resulted in subsequent disaggregation of thesample, increased "friability", and increased permeability. To prevent this anomalous effect,the specimen was shielded from the condensate by gold foil as shown in Fig. 12. For thespecimen on the left, the corner of the shield was purposely placed in contact with the rockand the resulting dissolution is apparent. The specimen on the right, however, is adequatelyprotected from the condensate and reveals good visual appearance even after treatment withhumidified air. Results from the "gold shield" experiments all fall within the arbitrarystability zones shown in the figures. Those humidified air tests without shielding resulted inthe anomalous data points outside the stability zone.
100
80 -
OO60
20 -
KEY
GALESVILLE SANDSTONEILLINOIS (DEPTH 685m)
? DRY AIR• HUMIDIFIED AIR SHIELDED• HUMIDIFIED AIR UNSHIELDEDo BRINE
-
0
9
100 200 300TEMPERATURE (°C)
. _ «60> at
to
KEY
GALESVILLE SANDSTONEILLINOIS (DEPTH 685m)
DRY AIRHUMIDIFIED AIR SHIELDED
- • HUMIDIFIED AIR UNSHIELDEDo BRINE
STABILITY LINE
o300 TEMPERATURE
<=C)
•—-STABILITY LINE
Fig. 9. Percent Change in Apparent Porositywith Temperature
Fig. 10. Percent Change in Gas Permeabilitywith Temperature
134
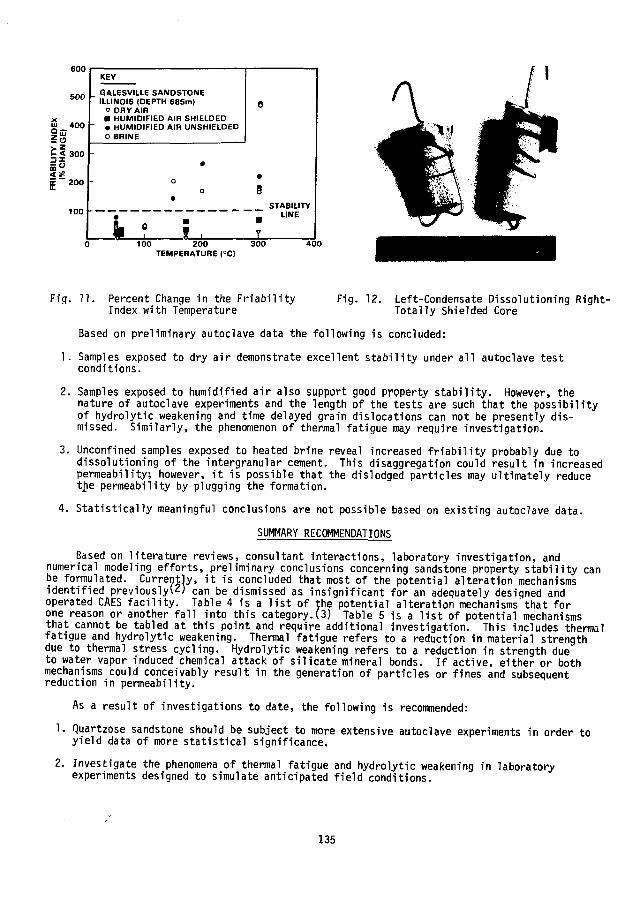
600
500 -
i': 300 -
200 -
100
KEY
GALESVILLE SANDSTONEILLINOIS (DEPTH 685m)
v DRY AIR• HUMIDIFIED AIR SHIELDED
" • HUMIDIFIED AIR UNSHIELDEDo BRINE
•
o0
•
i • ;
e
•9
STABILITYa LINE
Y100 200
TEMPERATURE (°C)300 400
Fig. 11. Percent Change in the FriabilityIndex with Temperature
Fig. 12. Left-Condensate Dissolutioning Right-Totally Shielded Core
Based on preliminary autoclave data the following is concluded:
1. Samples exposed to dry air demonstrate excellent stability under all autoclave testconditions.
2. Samples exposed to humidified air also support good property stability. However, thenature of autoclave experiments and the length of the tests are such that the possibilityof hydrolytic weakening and time delayed grain dislocations can not be presently dis-missed. Similarly, the phenomenon of thermal fatigue may require investigation.
3. Unconfined samples exposed to heated brine reveal increased friability probably due todissolutioning of the intergranular cement. This disaggregation could result in increasedpermeability; however, it is possible that the dislodged particles may ultimately reducethe permeability by plugging the formation.
4. Statistically meaningful conclusions are not possible based on existing autoclave data.
SUMMARY RECOMMENDATIONS
Eased on literature reviews, consultant interactions, laboratory investigation, andnumerical modeling efforts, preliminary conclusions concerning sandstone property stability canbe formulated. Currently, it is concluded that most of the potential alteration mechanismsidentified previously^; can be dismissed as insignificant for an adequately designed andoperated CAES facility. Table 4 is a list of the potential alteration mechanisms'that forone reason or another fall into this category.(3) Table 5 is a list of potential mechanismsthat cannot be tabled at this point and require additional investigation. This includes thermalfatigue and hydrolytic weakening. Thermal fatigue refers to a reduction in material strengthdue to thermal stress cycling. Hydrolytic weakening refers to a reduction in strength dueto water vapor induced chemical attack of silicate mineral bonds. If active, either or bothmechanisms could conceivably result in the generation of particles or fines and subsequentreduction in permeability.
As a result of investigations to date, the following is recommended:
1. Quartzose sandstone should be subject to more extensive autoclave experiments in order toyield data of more statistical significance.
2. Investigate the phenomena of thermal fatigue and hydrolytic weakening in laboratoryexperiments designed to simulate anticipated field conditions.
135

3. Investigate the possibility of participate plugging should either or both of the abovemechanisms result in significant particle generation within the sandstone matrix.
4. Investigate porous media desaturation and effective thermal diffusivity properties toensure validity of numerical modeling conclusions.
5. Extend analyses to other potential CAES rock types besides quartzose sandstones.
6. Initiate field investigations of the elevated temperature CAES concept in the near future.
TABLE 4. Potential Alteration Mechanisms TABLE 5. Potential Alteration MechanismsConsidered Unlikely Under CAES Still Requiring Investigation
Conditions
• Clay swelling and dispersion • Thermal fatigue under CAES conditions
• Mineral dissolutioning and scaling • Hydrolytic weakening of silicate minerals
• Fluids incompatibility under CAES conditions
• Increased compressibility • Particulate plugging
• Redox reactions • Thermo-mechanical plugging (marginal)
• Casing corrosion
• Well completion cement degradation
REFERENCES
1. L.E. Wiles, The Effects of Water on Compressed Air Energy Storage in Porous RockReservoirs. TNL-2869, Pacific Northwest Laboratory, Richland, WA, March 1979.
2. J.A. Stottlemyre and R.P. Smith, "Potential Air/Water/Rock Interactions in a PorousMedia CAES Reservoir", PNL-SA-7284, Proceedings of the 1978 Mechanical and MagneticEnergy Storage Contractor's Review Meeting. CONF-781046, Luray, VA, Oct. 1978.
3. J.A. Stottlemyre, R.P. Smith and R.L. Erikson, Potential Physical and Chemical PropertyAlterations in a Compressed Air Energy Storage Porous Rock Reservoir. PNL-2974,Pacific Northwest Laboratory, Richland, WA, September 1979.
BIBLIOGRAPHY
J.A. Apps, E.L. Madsen and R.L. Hinkins, The Kinetics of Quartz Dissolution andPrecipitation, 1978.
J.D. Blacic, Hydrolytic Weakening of Quartz and Olivine, Ph.D. Thesis, University of California,Los Anageles, CA, 1971.
J.J. Day, B.B. McGlothlin, and J.L. Huitt, Laboratory Study of Rock Softening and Meansof Prevention During Steam or Hot Water Injection, Gulf Research & Development Co., Pittsburgh,TO, May 1967.
E.C. Donaldson, B.A. Baker and H.B. Carroll, Particle Transport in Sandstones, Energy Research& Development Administration, SPE 6905, 1977.
D.T. Griggs, "Hydrolytic Weakening of Quartz and Other Silicates", Geophys. J. Roy. Astron.Soc^, 14: 19-21,1967.
C.H. Hewitt, Analytical Techniques for Recognizing Water Sensitive Reservoir Rocks, 'larathonOil Co., Littleton, CO, August 1963.
136

T. Marshall and A. Hugill, "Corrosion by Low-Pressure Geothermal Steam", Corrosion by NationalAssociation of Corrosion Engineers, Vol. 13, May 1957, p. 329t.
G.W. Morey and J.M. Hesselgesser, The Solubility of Some Minerals in Superheated Steam atHigh Pressures, The Geophysical Laboratory, Carnegie Institution of WA, Washington, D.C.,June T9TT
H.H. Somerton, A.H. El Shaarani and S.M. Moharak, "High Temperature Behavior of RocksAssociated with Geothermal Type Reservoirs", Preprint 4897, Soc. Pet. Engrs., April 1974.
W.H. Somerton and A.K. Mathur, "Effects of Temperature and Stress on Fluid Flow and StorageCapacity of Porous Rocks', Proceedings 17th Rock Mechanics Symposium, 1976.
J.A. Stottlemyre, Preliminary Stability Criteria for Compressed Air Energy Storage jji PorousMedia Reservoirs. PNL-2456, Pacific Northwest Laboratory, RichlamT, WA, June 1978.
J.A. Stottlemyre and R.P. Smith, "Potential Air/Water/Rock Interactions in a Porous Media CAESReservoir", PNL-SA-7284, Proceedings of the 1978 Mechanical and Magnetic Energy StorageContractors' Review Meeting"! C0NF-78T54B7~Luray, VA, Oct. lU78~.
R.M. Weinbrandt, H.J. Ramey, Jr., F.J. Casse', "The Effect of Temperature on Relative andAbsolute Permeability of Sandstones", SPE 4142, Soc. Pet. Eng. J-, July 1975.
137

Project Title:
Principal Investigator:
Organization:
Project Goals:
Project Status:
Contract Number:
Contract Period:
Funding Level:
Funding Source:
PROJECT SUMMARY
Fluid/Thermal Analysis for Porous Media Reservoirs
L.E. Wiles
Pacific Northwest LaboratoryP.O. Box 999Richland, Washington 99352(509) 946-2049
Develop a two-dimensional (r-z geometry) model for dry porous mediareservoirs to predict the reservoir pressure and temperatureresponse under conditions of daily air mass cycling. Use this datato provide design guidelines for the efficient and stable operationof the reservoir. Provide the data to parallel efforts that alsowill provide such guidelines. These efforts are the structuralanalysis, experimental work, and field studies.
The model was applied to the parameters that entered the analysis byvirtue of inclusion of the vertical dimension. These parametersincluded the wellbore heat transfer and conditions that causedvertical flow perturbation in the porous zone. The analysis ofthese parameters was completed and a topical report should beavailable soon.
EY-76-C-06-1830
FY1979
$94 K
Department of Energy, Division of Energy Storage Systems
139
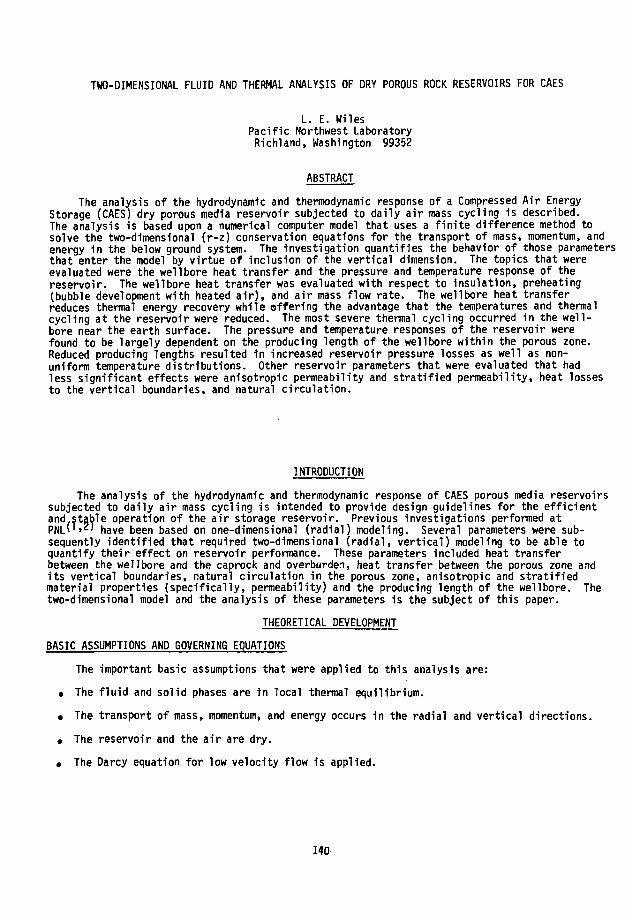
TWO-DIMENSIONAL FLUID AND THERMAL ANALYSIS OF DRY POROUS ROCK RESERVOIRS FOR CAES
L. E. MilesPacific Northwest LaboratoryRichland, Washington 99352
ABSTRACT
The analysis of the hydrodynamic and thermodynamic response of a Compressed Air EnergyStorage (CAES) dry porous media reservoir subjected to daily air mass cycling is described.The analysis is based upon a numerical computer model that uses a finite difference method tosolve the two-dimensional (r-z) conservation equations for the transport of mass, momentum, andenergy in the below ground system. The investigation quantifies the behavior of those parametersthat enter the model by virtue of inclusion of the vertical dimension. The topics that wereevaluated were the well bore heat transfer and the pressure and temperature response of thereservoir. The wellbore heat transfer was evaluated with respect to insulation, preheating(bubble development with heated air), and air mass flow rate. The wellbore heat transferreduces thermal energy recovery while offering the advantage that the temperatures and thermalcycling at the reservoir were reduced. The most severe thermal cycling occurred in the well-bore near the earth surface. The pressure and temperature responses of the reservoir werefound to be largely dependent on the producing length of the wellbore within the porous zone.Reduced producing lengths resulted in increased reservoir pressure losses as well as non-uniform temperature distributions. Other reservoir parameters that were evaluated that hadless significant effects were anisotropic permeability and stratified permeability, heat lossesto the vertical boundaries, and natural circulation.
INTRODUCTION
The analysis of the hydrodynamic and thennodynamic response of CAES porous media reservoirssubjected to daily air mass cycling is intended to provide design guidelines for the efficientand.stable operation of the air storage reservoir. Previous investigations performed atPNI_('»Z) have been based on one-dimensional (radial) modeling. Several parameters were sub-sequently identified that required two-dimensional (radial, vertical) modeling to be able toquantify their effect on reservoir performance. These parameters included heat transferbetween the wellbore and the caprock and overburden, heat transfer between the porous zone andits vertical boundaries, natural circulation in the porous zone, anisotropic and stratifiedmaterial properties (specifically, permeability) and the producing length of the wellbore. Thetwo-dimensional model and the analysis of these parameters is the subject of this paper.
THEORETICAL DEVELOPMENT
BASIC ASSUMPTIONS AND GOVERNING EQUATIONS
The important basic assumptions that were applied to this analysis are:
• The fluid and solid phases are fn local thermal equilibrium.
• The transport of mass, momentum, and energy occurs in the radial and vertical directions.
• The reservoir and the air are dry.
• The Darcy equation for low velocity flow is applied.
140

Additional assumptions are described in a topical report to be issued by PNL. The applicationof these assumptions results in the following set of equations that describe the transport ofmass, momentum and energy in the reservoir.
. Conservation of mass
f | |JUPW) = 0 (1
. Conservation of momentum in the radial direction
< £ ) (*PU) = -• f£ (2)
• Conservation of momentum in the vertical direction
(^) (*>w) = -• || + *pgz; and (3)
• Conservation of energy
|¥j()-*)psCsT + * PC VTJ + Ifr (r*puCpT) + (»PwCpT) - 1 1 , (rKr g ) - *- [Kz g ) = 0 (4)
A definition of nomenclature is given in Table 1.
BOUNDARY CONDITIONS
The reservoir geometry used in this study is shown in Fig. 1 where the region of influenceof a single well is shown as a vertical cylinder with the wellbore at the center. Theapplicable regions of the overburden, caprock, porous rock and basement rock are shown. Theproducing length of the wellbore is the section of the wellbore in the porous zone throughwhich air can pass. At the wellhead the mass flow rate is continuously specified. During thereservoir charge cycle the temperature is specified. During reservoir discharge or when thereservoir is closed, the temperature at the wellhead is obtained from local equilibriumconditions. The outer radial boundary of the single well reservoir is insulated to the trans-port of mass and energy. The vertical boundaries of the porous zone are insulated to thetransport of mass. The earth surface and the bottom of the basement rock are insulated to thetransport of energy. The schedule for weekly air mass cycling is depicted in Fig. 2.
REFERENCE CONDITIONS
The foundation of the analysis is a set of reference conditions for the reservoir geometry,material properties and operating conditions. The values given to these parameters are providedin Table 2. Unless otherwise specified, these values apply throughout the discussion ofresults.
SOLUTION
A detailed outline of the solution method of the governing equations will be provided in atopical report to be issued by PNL. Briefly, the solution is achieved with a numerical computermodel which is based on finite difference techniques.
ANALYSIS AND RESULTS
The development of the multi-dimensional numerical model has provided the capability toinvestigate several important aspects of reservoir behavior that were previously beyond theconsideration of the available one-dimensional models. The additional phenomena that could beevaluated were generally related to either the wellbore heat transfer problem or to thoseparameters that introduced vertical fluid and thermal perturbations in the porous zone.
141

TABLE T. Nomenclature
C - Heat canactty of rocV
C (C ) - Constant pressure (constant volume) specific heat of air
g - Gravitational acceleration 1n vertical direction
fc (k ) - Pertneabi}ity in radial direction (vertical direction)
K (K } - Effective thernal conductivity of norous rock in radial
r z direction (vertical direction}
P - Pressure of air
r - Radial coordinate
t Time
T - Temperature
u - Radial velocity of air
w - Vertical velocity of air
z - Vertical coordinate
*• - Porosity
n (,.t) - Density of air (rock)
i- - Viscosity of air
518.
30.
121.
0.
3".
Reference
2 m
5 m
2 m
17 m
5 m
Value
(!700
(
(
(
(
20*
500
100
400
7
100
md
ft)
ft)
ft)
in)
ft)
TABLE 2. Reference Reservoir Conditions
Parameter
Geometry
Reservoir Depth
Vertical Thickness
Reservoir Diameter
Well Diameter
Completion Length
Properties
Porosity
Permeability
Rock Thermal Conductivity
Rock Thermal Capacity
Operating Conditions
Nominal Pressure
Air Flow Rate
Injection
Extraction
Percent of Air Cycled
Injection Temperature
Earth Surface Temperature
Geothermal Gradient
Initial Reservoir TemperaturesDetermined by Geothermal Conditions
(39.!
5070 kPa (50 atm)
12S
232°C (450»F)
21.1°C (70°F)
0.0017°C/m (O.O0rF/ft)
OUTER RESERVOIRDIAMETER
EARTHSURFACE
PRODUCINGLENGTH
Fig. 1. Geometry for Two-Dimensional Analysis
THME OF WEEK. DAYS
Fig. 2. Reference Weekly Reservoir PressureCycle
142

WELLBORE HEAT TRANSFER
Heat losses between the wellhead and the reservoir can have a significant impact onthermal energy recovery, thermal cycling, and thermal distributions. The parameters that wereidentified as having an impact on the wellbore heat transfer included wellbore insulation,preheating, air storage volume and reservoir depth. Wellbore insulation involves the modelingof an annular region of insulating material around the wellbore. Preheating refers to theheating of the underground system by injecting heated air during bubble development. The airstorage volume and reservoir depth will affect the optimum air mass flow rates and, therefore,the thermal energy entering the underground system. The depth also establishes the length overwhich the heat transfer may occur. To characterize the thermal response for these parameters,six cases were defined for analysis. These are outlined in Table 3. Each case was simulatedfor 1-yr of air mass cycling. Only the results for the insulated and preheated conditions areprovided here. The cases involving storage volume and depth (cases 5 and 6, respectively)basically only involve the rate of thermal energy entering the underground system. This willaffect the magnitude of the results compared to the reference conditions but the same charac-teristic behavior is observed. Details of the analysis of these parameters is left to thetopical report to be issued by PNL.
Case
1
2
3
4
5
6
TABLE 3 .
Ini t ia lThermal
Conditions
Geothermal
Preheated
Geothermal
Preheated
Geothermal
Geothermal
Parametric Cases for
Wel1 boreInsulation
No
No
Yes
Yes
No
No
ReservoirDepth
(m) ( f t )
51R.2 (1700)
518.2 (1700)
518.2 (1700)
5ln.Z (1700)
51H.2 (1700)
1036..1 (3100)
wellbore
ReservoirThickness(m) ( f t )
30.5
30.5
30.5
30.5
61.0
30.5
(100)
(100)
(100)
(100)
(200)
(100)
Heat Transfer
OtherConditions
Reference
Double A i rMass Flow Rates
Double A i rMass Flow Rates
A summary of the results for the thermal energy recovery is shown by Fig. 3. The resultsare compared with the results obtained by the one-dimensional model which employed essentiallythe same reservoir and operating conditions. The one-dimensional result essentially represents,for comparative purposes, a perfectly insulated wellbore.
Thermal cycling of the air in the wellbore during the first week of simulated reservoiroperation is shown in Fig. 4 for the reference conditions. Thermal development doesn't changethe shape of the cycles although the amplitude of the cycles diminishes and the temperaturesgenerally increase in time.
Insulation
The insulation is represented by a 10.2 cm (4.0 in) annulus with an I.D. of 20.3 cm (8.0in). The conductivity of the insulation was 0.216 w/m-°C (0.125 Btu/hr-ft-°F). The volumetricheat capacity of the insulation (p.C}) was 0.724 MJ/m
3-°C (10.8 Btu/ft3-°F).
Thermal cycling of the air in an insulated wellbore is shown in Fig. 5 for the first weekof simulated reservoir operation. The interesting point of this result is that the thermalcycling of the air in the wellbore is actually greater for tht insulated case than for thereference case for which there is no insulation. One explanation that serves to support thisresult is based upon consideration of the controlling heat transfer medium. During a chargingcycle the heat transfer between the air in the wellbore and the surrounding material iscontrolled by the heat conductance of the surrounding material. During reservoir closure theheat transfer is controlled by the low conductance of the air in the wellbore. Also, thiscycling only represents the cycling of the air temperature in the wellbore. The heat capacityof the surrounding material is so large by comparison to the heat capacity of the air that the
143

100
KUJ
§msoKUJZui<
UJ
80
60
40
20
REFERENCEPREHEATEDINSULATEDINSULATED & PREHEATED1 -DIMENSIONAL RESULT
± ±10 20 30
TIME, WKS40 50
Fig. 3. Effect of Wellbore Heat Transfer on Thermal Energy Recovery
260.01500)
F 104.40 («00)
ui§ 148.9Jj (300)c1 93.3u< (200)
37.8(100)
260.0
-"I /' 1 11 1
1 11
- 11\ 1
1
..30.5 m (100 ft)
' i r\ n!\
1I\
1
A A i\ V^V >i \ l\
518.2 m|1700 ft)1 1 1
1 I ii I '1 ; J
i
(600)
uT 204.4^1400)
S 148.9= (300)
5X" 93.3£ (200i-
37.8(100)
>
ff1
^\ y\ (
i !\ !\\ !
1
518.2 m (1700 ft)
'XL\\\ ^\ '<
i
1«\\\\s
30.5 m
r ! i
Ai \
\
\
) \
\l(100 ft)
1
\l \
\l
24 48 72 96 120TIME OF WEEK, HRS
144 168 48 72 96 120TIME OF WEEK. HRS
168
Fig. 4. Thermal Cycling in the ReferenceReservoir, Week 1
Fig. 5. Thermal Cycling for an InsulatedWell bore, Week 1
amplitude of the thermal cycling in the surrounding material decreases rapidly from the surfaceof the well bore.
Preheating
In Fig. 3 the effects of preheating are shown by curves 2 and 5 which should be comparedto curves 1 and 4, respectively. The effects of preheating on thermal energy recovery are seento dissipate after only about 20 weeks. In addition to the initial improvement of thermalenergy recovery, preheating reduces the amplitude of the initial thermal cycling althoughtemperatures are generally higher. However, the effects of preheating dissipate rapidly sothat after 1 year the thermal cycling of the preheated case is indistinguishable from thenonpreheated case.
144

RESERVOIR ANALYSIS
The reservoir analysis was intended to characterize the fluid and thermal response of thereservoir to conditions that were encountered in the porous zone by virtue of inclusion of thevertical dimension. The principal measure of the fluid response was the quasi-steady-statedifference between the wellbore boundary pressure and the reservoir average pressure. Thispressure difference represents the work required to overcome fluid friction in the porous zone.The thermal response that was of interest was the temperature distribution. In general, factorswhich perturb the flow field and the resultant quasi-steady-state pressure difference alsoaffect the temperature distributions because the primary mode of energy transport is byconvection.
Pressure Response
The parameters that were identified as important to the pressure response that required theinclusion of the vertical dimension to permit their evaluation were the producing length of thewellbore, and anisotropic and stratified permeability. The producing length of the wellboreproved to be the more important of these parameters. In Fig. 6 the quasi-steady-state pressuredifference is plotted against the permeability ratio. The large effect of the producing lengthon the pressure loss suggests that the flow area at the well bore-porous material interface isextremely important. At this Interface the porous zone flow velocities are at their maximumvalues. The series of lines in Fig. 6 are drawn for various producing lengths in a 30.5-m-thick (100-ft-thick) reservoir. The producing lengths begin at the top of the porous zone.
The large effect of the producing length on the pressure loss suggests that the flow areaat the well bore-porous material interface is extremely important. At this interface the porouszone flow velocities are at their maximum values. These flow velocities dominate the reservoirpressure loss. The results dealing with producing length suggest the importance of extendingthe producing section of the wellbore through the entire reservoir thickness, to the extentpossible, to avoid excessive flow losses.
The results shown in Fig. 6 suggest that the permeability ratio has a much smaller impacton pressure loss in the reservoir. For these cases the horizontal permeability was fixed at500 md. Since flow from the wellbore is predominantly radial, for the case of the producinglength being equal to the reservoir thickness, there is no noticable effect of the reducedvertical permeability on the pressure response. For producing lengths less than reservoir
690(100)
a.<
2CO
ai(A(0
345(50) 15,2 (50)
22.9 (75)
30.5 (100)
10 0.5 1.0
VERTICAL PERMEABILITY/HORIZONTAL PERMEABILITY
Fig. 6. Quasi-Steady-State Pressure Difference Versus the Permeability Ratiofor Various Producing Lengths m ( f t ) , Reservoir Thickness = 30.5 m (100 f t )
145

thickness, a portion of the air must expand vertically after entering the porous zone. As theair moves away from the wellbore, the vertical flow area increases dramatically so thatvertical flow velocities are small. As a result, the contribution of the vertical flow to thepressure drop is small even for cases of significantly reduced vertical permeability andreduced producing lengths.
The effects of stratification of permeability were evaluated by modeling a 3.81-m-thick(12.5-ft-thick) layer of 100 md material, the top of which was 15.2 tn (50 ft) from the top ofthe porous zone. The surrounding material was fixed at 500 md. A series of cases wereevaluated whereby the producing length of the wellbore, beginning at the top of the porouszone, terminated above, within, and below the low permeability layer. The effect on thepressure response for these cases was similar in magnitude to the effect of the permeabilityratio.
Thermal Response
Since the primary mode of energy transport in the porous zone is by forced convection, thethermal behavior of the porous zone will be largely determined by the mass transport. Factorsaffecting the mass transport that would affect the radial uniformity of the flow and thatrequired the two-dimenstonal modeling for analysis included the producing length of the wellboreand stratified permeability. In addition, phenomena is present, even in homogeneous reservoirs,that adds to the maldistribution of thermal energy in the reservoir. These include naturalcirculation, heat losses to the vertical boundaries and non-uniform flow distribution from thewellbore. However, these additional effects are of less importance. A discussion of theiranalysis will be provided in the topical report to be issued by PNL.
An example of the effect of the flow disturbance on the thermal distribution is shown inFig. 7 where vertical temperature profiles for various radii are shown for the referencereservoir and for a case in which the producing length is 7.62 m (25 ft). This flow disturbanceconcentrates the thermal energy at the top of the reservoir. The thermal energy concentrationand the steep thermal gradients may present problems from the standpoint of the structural andgeochemical stability of the reservoir. Figure 7 is composed of data taken during the firstweekly cycle.
Even in the homogeneous reference reservoir vertical temperature gradients exist, as shownin Fig. 7. These result from non-uniform flow distributions caused by the headering effect ofthe wellbore. These temperature gradients, once developed, stablize quickly, apparently due tothe balancing effect of other heat transfer mechanisms.
CONCLUSIONS AND RECOMMENDATIONS FOR FURTHER STUDY
The results of the computer analysis have led to quantification and characterization ofcertain behavior of the underground CAES system that could only be addressed by a multi-
502.9(1650)
518.2(1700)
2.8(9.2)
1.6(5.4)
1.6(5.4)
^T--------f_V^-------k-.-.-r=-------1--
GEOTHERMAL
533.4(1760) 37.8
(100)
I93.3 148.9(200) (300)
TEMPERATURE. °C (°F)
204.4(400)
Fig. 7. Vertical Temperature Distributions at Various Radii (m (ft)) for Producinq LengthsOf 30.5 m (100 ft) (Solid Lines) and 7.62 m (25 ft) (Dashed Lines)
146

dimensional model. According to the results obtained by the numerical modeling, the followingstatements can be made regarding the effects of the vertical parameters of the reservoir.With regard to well bore heat transfer:
• The recovery of thermal energy can be significantly reduced due to heat losses in thewell bore.
• Wellbore thermal insulation was shown to provide significant potential for improvingthermal energy recovery.
• Heat losses from an uninsulated wellbore reduce the thermal cycling and lower thetemperature in the porous zone.
• While wellbore insulation improves thermal energy recovery, the wellbore and porous zoneare exposed to greater extremes of thermal cycling and higher temperatures.
• Preheating the reservoir may result in significantly improved thermal energy recoveryand reduced thermal cycling during the initial weeks of reservoir operation.
• The effects of preheating are rapidly dissipated.
With regard to thermal behavior in the porous zone:
• The most important factor in determining the thermal distribution in the porous zoneis the forced convection flow field.
With regard to the fluid behavior in the porous zone:
• The producing length should be maximized to avoid excessive pressure losses.
• Reduced vertical permeability does not significantly affect the overall pressure loss inthe porous zone.
• Stratification of permeability has a greater effect on pressure loss in the reservoirwhen the producing section extends through the layer.
The results of this investigation led to the next phase of model development. Theimportance of the producing length of the wellbore with regard to reservoir pressure loss wa^shown. For porous zones having a liquid phase water boundary below the air storage zone, the"producing length will necessarily be less than the storage zone thickness. This will berequired to prevent the production of water in the wellbore due to water coning. The degreeof water coning will depend on such parameters as producing length, air mass flow rates,permeability/saturation relationships, storage zone thickness, and water zone thickness.Development of the model and the analysis of these and other subsequently identifiedparameters will constitute the next step of this research effort.
REFERENCES
1. G.C. Smith, L.E. Wiles and W.V. Loscutoff, Numerical Analysis of Temperature and FlowEffects in a Dry, One-Dimensional Aquifer Used for Compressed Air Energy Storage.PNL-2546, Pacific Northwest Laboratory, RiZhTand, WA, February~T9~79.
2. L.E. Wiles, The Effects of Water on Compressed Air Energy Storage in Porous RockReservoirs. PNL-2869, Pacific Northwest Laboratory, Richland, WA, March 1979.
3. G.C. Smith and L.E. Wiles, "Analysis of Underground Porous Reservoirs for CompressedAir Energy Storage", Proceedings 1978 Compressed Air Energy Storage Symposium, Vol 1,Pacific Grove, CA, 197JT
147

Project Title:
PROJECT SUMMARY
"Testing of Galesv i l le Sandstone under Compressed Ai r StorageConditions"
Principal Invest igator : James D. Blacic
Organizat ion:
Project Goals:
Project Status:
Contract Number:
Contract Period:
Funding Level:
Funding Source:
Geological Research Group, G-6Los Alamos Sc ien t i f i c LaboratoryP. 0. Box 1663, MS 978Los Alamos, NM 87545FTS 843-6815
To determine the thermomechanical propert ies of Galesv i l lesandstone at temperatures, pressures and cyc l i c stresses ap-propr ia te to an aquifer compressed a i r energy storage system.
Laboratory tests have demonstrated that the e last ic andstrength proper..' c Galesville sandstone are temperature andpressure dependt.... Young's modulus varies in a nonlinearfashion with respect to dif ferential stress and effectiveconfining pressure. Modulus increases with increasing effec-t ive pressure over the range 0-31 MPa, and with increasingtemperature over the range 37-120°C. Poisson's ratio decreasesmarkedly to values as low as 0.1 with both increa nri effectivepressure and increasing temperature.
Preliminary tests indicate th?4 compressive strength variationwith effective pressure can bi_ expressed in terms of a linearMohr-Coulomb relation at 37°C, but a nonlinear Mohn-Coulombbehavior is exhibited at 120°C.
The effect of cyclic compressive stress at 37°C on thermo-mechanical properties is mainly a strong reduction in Poisson'srat io . There is no apparent effect of cyclic loading on com-pressive strength or Young's modulus for up to 10,000 cycles of20 MPa differential stress.
Battelle P.0.#63737-A-H, directed under "Reservoir Stabi l i tyCriteria Studies," #C8-01-01-03-2 PNL 85002.
March, 1979 - Sept., 1980
$133K
BatteHe PNL, Energy Programs Division
149
THERMO-MECHANICAL PROPERTIES OF GALESVILLE SANDSTONE
J. D. Blacic, P. H. Halleck, and P. D'OnfroGeosciences Division, G-6
Los Alamos Scientific LaboratoryLos Alamos, New Mexico 87545
ABSTRACT
Elastic and strength properties of Galasville sandstone are temperature and pressuredependent over the range appropriate for an aquifer compressed air energy storage system.At 37°C, Young's modulus increases from 23 GPa at ambient pressure to 47 GPa at 31 MPaeffective pressure while Poisson's ratio decreases from 0.30 to 0.22. At 120°C, Young'smodulus increases from 28 GPa at ambient pressure, to 60 GPa at 33 MPa effective pressurewhile Poisson's ratio decreases from 0.22 to 0.08. Under ambient conditions, tensilestrength is 4 MPa. At 37°C, ultimate compressive strength increases from 70 MPa at am-bient pressure to 200 MPa at 32 MPa effective pressure. At 120°C, strength increases from56 MPa at ambient pressure to 262 MPa at 30 MPa effective pressure. Cyclic loads of 20MPa at 37°C and 10.4 MPa effective pressure indicate no effect on Young's modulus ardultimate strength up to 10,000 cycles; Poisson's ratio is reduced 28%.
INTRODUCTION
As part of the evaluation of water-saturated aquifers for a compressed a^r energystorage (CAES) system, we have determined elastic and strength properties of a sandstone.The goal of this work is to evaluate the effects of temperature, pressure, and cyclicloading on thermo-mechanical properties to support modeling studies of an aquifer CAESsystem.
The sample material is Cambrian Galesville sandstone from Warren County, Illinoisobtained from Illinois Power Company cores. Reservoir analysis indicates that our samplesrange in permeability from 100 to 600 millidarcies and in porosity from 15 to 24%. Theaverage grain size is approximately 0.1 millimeters. Composition is 98% quartz nonuni-formly cemented by dolomite.
EXPERIMENTAL TECHNIQUE
Test samples are right circular cylinders 2.5 cm diameter by 6.3 cm long. Jacketedsamples are tested in a triaxial, externally heated pressure vessel using silicone oil aspressure transmitting medium. Axial load is applied at a constant displacement rate witha servo-controlled hydraulic testing machine. Sample strains are determined with an in-ternal system consisting of three axial and three radial LVDT displacement gages. Volumestrain is calculated from the average axial and radial strains.
Normal test procedure is as follows: the jacketed sample is first saturated by pump-ing water through it at low pressure. Confining pressure is then applied followed byargon pore pressure and finally the sample is heated. The gas pore pressure is appliedthrough a small separate reservoir. At temperatures above boiling, water vapor may pass
150
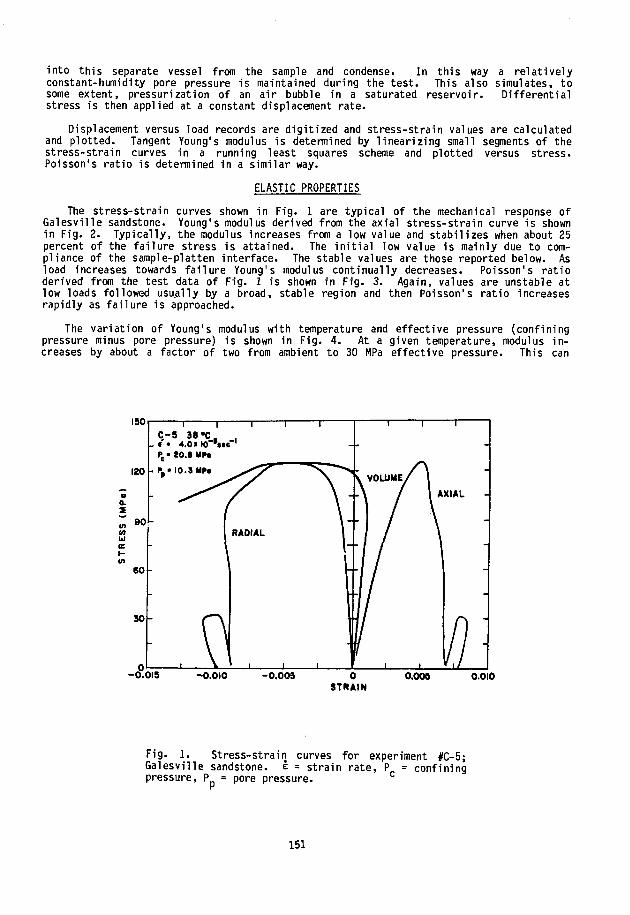
into this separate vessel from the sample and condense. In this way a relat ivelyconstant-humidity pore pressure is maintained during the test. This also simulates, tosome extent, pressurization of an air bubble in a saturated reservoir. Differentialstress is then applied at a constant displacement rate.
Displacement versus load records are digitized and stress-strain values are calculatedand plotted. Tangent Young's modulus is determined by linearizing small segments of thestress-strain curves in a running least squares scheme and plotted versus stress.Poisson's ratio is determined in a similar way.
ELASTIC PROPERTIES
The stress-strain curves shown in Fig. 1 are typical of the mechanical response ofGalesville sandstone. Young's modulus derived from the axial stress-strain curve is shownin Fig. 2. Typically, the modulus increases from a low value and stabilizes when about 25percent of the fai lure stress is attained. The in i t i a l low value is mainly due to com-pliance of the sample-platten interface. The stable values are those reported below. Asload increases towards fai lure Young's modulus continually decreases. Poisson's ratioderived from the test data of Fig. 1 is shown in Fig. 3. Again, values are unstable atlow loads followed usually by a broad, stable region and then Poisson's ratio increasesrapidly as fai lure is approached.
The variation of Young's modulus with temperature and effective pressure (confiningpressure minus pore pressure) is shown in Fig. 4. At a given temperature, modulus in -creases by about a factor of two from ambient to 30 MPa effective pressure. This can
150
120
aa.
90
60
30
1 1 rC/-5 38 K.I • 4.0» 10 ' l i e '
-0.015
RADIAL
-0.010 -0 .003 0.009 0.010
Fig. 1. Stress-strain curves for experiment #C-5;Galesville sandstone, e = strain rate, P = confiningpressure, P = pore pressure. c
151

60 90STRESS (MPo)
Fig. 2. Young's modulus as a function of dif ferentialstress for experiment #C-5.
30 60 90STRESS (MPa)
Fig. 3. Poisson's ratio as a function of dif ferentialstress for experiment #C-5.
152

QALESVILLE SANDSTONE
10 20
EFFECTIVE PRESSURE (MPo)30
Fig. 4. Young's modulus of Galesville sandstone as afunction of temperature and effective pressure.
reasonably be explained as being due to crack and pore closure at pressure. Somewhatsurprisingly, modulus also increases substantially with increasing temperature. A pos-sible explanation is that porosity is reduced as a result of differential thermal expan-sion but we have no evidence as yet that this is so.
Variation of Poisson's ratio with pressure and temperature is shown in Fig. 5.Poisson's ratio is significantly reduced by both increasing pressure and temperature.This suggests that at the maximum temperature and pressure conditions of a CAES environ-ment very low values of Poisson's ratio are likely for this sandstone.
STRENGTH PROPERTIES
As shown in Fig. 1, failure of the samples is reflected in onset of nonlinearstress-strain behavior. There is substantial "plasticity" at the highest pressures andtemperatures. Failure occurs by faulting on one or more inclined shear zones accompaniedby considerable crushing and disaggregation. The effective principal stresses at theultimate strength of each test is represented in Mohr circle plots in Figs. 6 and 7. At
153

o.s
0.4
O.I
GALESVILLE SANDSTONE120 *C37 «C
10 20 30EFFECTIVE PRESSURE (MPo)
40
Fig. 5. Poisson's ratio of Galesviile sandstone as afunction of temperature and effective pressure.
ISO
a.S
"80uiIEI-10
' 1 ^ ' I ' I I IGALESVILLE SANDSTONE
37 «CSTRAIN RATE 4 xiO~5«tc"'
I I
40 BO 120 160EFFECTIVE NORMAL STRESS (MPo )
200
Fig. 6. Mohr circle diagram for Galesvilie sandstoneat 37°C.
154

160GALESVILLE SANDSTONE
120 *CSTRAIN RATE 4 « 10"* • « '
-20 6 20 40 SO SO K» 120 140 160 180 200 220 240 260 280EFFECTIVE NORMAL STRESS (MP»)
Fig. 7. Mohr circle diagram for Galesville sandstoneat 120°C.
38°C, results are well represented by a linear Mohr envelope with a cohesion of 18 MPa andcoefficient of internal friction of 0.78. However, at 120°C the Mohr envelope is highlynonlinear. Increasing temperature reduces the uniaxial strength but apparently increasesthe triaxial strength. In view of the limited amount of data, this result could be indi-cative of sample variability.
The tensile strength at ambient conditions was determined to ba 4 +0.5 MPa. This isan average of 15 indirect measurements using the Brazilian test.
CYCLIC LOADING
The effects of cyclic loading have been evaluated at 37°C, 20.7 MPa confining pressureand 10.3 MPa pore pressure (Table 1).
TABLE 1. Stress Cycles of 20 MPa: Effect on Young's modulus(AE) and Poisson's Ratio (Av)
Av%
-6
-12
-28
Cycles
100
1,000
10,000
AE2
+9
0
-1
There is no consistent effect of a 20 MPa cyclic load on Young's modulus. The ob-served variation is judged to be due to sample variability. There appears to be a con-sistent reduction of Poisson's ratio due to cyclic loading with up to a 28% reduction at10,000 cycles. No effect on ultimate strength was observed outside that judged to be dueto sample variability.
155

Project Title:
Principal Investigator:
Organization:
Project Goals:
Project Status:
Contract Number:
Contract Period:
Funding Level:
Funding Source:
PROJECT SUMMARY
Reservoir Stability - Structural Analysis for Porous CAES
J.R. Friley
Pacific Northwest LaboratoryP.O. Box 999Richland, Washington 99352(509) 946-2295
Acquire/develop analysis capabilities to treat the structuralbehavior of porous rock reservoirs subject to CAES type loadconditions. Apply this capability in analyzing a generic site toassess the structural response and thus gain insight into potentialareas of concern (or lack of same) regarding reservoir stability.
After briefly reviewing several modeling techniques (finite dif-ference method, BIE method, finite element method), it was decidedthat the finite element method was the logical analysis tool toaddress porous structural modeling. An existing finite elementprogram (ADINA) developed by K. Bathe of MIT was studied and sub-sequently modified to enable treatment of pore pressure structuraleffects. In addition, graphics enhancements were added.
Utilizing this analysis tool, site loading conditions of a genericsite were utilized to study site response during the first year ofsite operation. Tensile stresses were found to exist only in the caprock region. The effects of this on reservoir performance, however,is as yet unknown.
Fatigue stresses of any significant magnitude were found to existonly in the well bore vacinity. The significance of this behavior,however, cannot be assessed until (1) well casing/rock interactioncapability has been added to the code, and (2) fatigue (at temper-ature) data becomes available.
Porous rock stress levels were evaluated using Mohr Coulomb data forGalesville sandstone (100°F) obtained from LASL. A safety factorof 3 resulted. "At temperature" MC evaluations have not as yetbeen made, however.
In FY-80, the addition of well casing/rock interaction capabilityand the acquisition of "at temperature" material properties willsubstantially improve our response prediction capabilities.
EY-76-C-06-1830
FY1979
$2,175K B0/$2,715K BA
Department of Energy, Division of Energy Storage Systems
157

STRUCTURAL RESPONSE OF A GENERIC POROUS SITE
J. R. FrileyPacific Northwest LaboratoryRichland, Washington 99352
ABSTRACT
Structural response of a hypothetical compressed air energy storage (CAES) porous rocksite was investigated. Emphasis was placed on gross response of the porous rock site ratherthan detailed behavior in the wellbore vicinity. Structural loading conditions considerednonuniform thermal loading, pore pressure loading, in situ and overburden effects. Loadingconditions corresponding to several stages of site development and operation were investigated.
Both mean and cyclic structural response of the reservoir were investigated by utilizingthermal and pore pressure loadings corresponding to various times of a one year thermal/flowsimulation. Attention was focused on several areas of site structural behavior. These includedtensile stress levels in. the site caprock, fatigue stress levels in the cap and porous rockmassess, and margin of safety values for the porous rock based upon a Mohr-Coulomb failureenvelope for Galesville sandstone.
Results from these investigations indicate that zones of significant structural responseare concentrated in the wellbore vicinity. This is especially true of the caprock mass and isattributed largely to the assumption of casing Insulation made in the thermal/flow simulation.
INTRODUCTION
Structural response of a porous compressed air energy storage site is not as yet fullyknown. Undoubtedly, these response characteristics will depend heavily on influences which aresite dependent. These influences include elastic and inelastic properties of the rock thick-nesses, geometries of the rock forms involved, and placement techniques used during wellcompletion.
In order to gain some insight into the structural behavior of such a site, computer basedanalyses of a hypothetical site have been performed. The purpose of this presentation is todescribe these analyses and to indicate what response modes might be anticipated in an actualsite based upon these results.
Structural features of a porous CAES site will now be described with reference to Fig. 1.Most likely, the^oY^us reservoir to be used is initially saturated wi**P»water. If this is thecase, then an initial drying period or "bubble development" will be necessary before, cyclicoperation of the site occurs. It is anticipated that this initial pressurtzation will be ofmoderate temperature and pressure levels and that no significant damage to the rock forms willoccur.
After some initial charging, the reservoir will be loaded in a cyclic fashion by theutility. Hot pressurized air will be produced and stored during periods of excess generatingcapacity. During periods of peak demand, air will be drawn from the reservoir and utilized bysome turbomachinery system for generation of additional power. It is anticipated that such aperiodic operation will have both daily and weekly components.
158

TYPICALISOTHERM" " |
OVERBURDEN
CAP ROCK
POROUS ROCK
BASE ROCK
Fig. 1. Cross Sectional View of a Generic Porous Site
ANTICIPATED STRUCTURAL TRENDS
During the initial period of site operation, the temperature of the various rock masseswill be very nearly equal to the ambient temperature at the site depth. During operationheated areas will be concentrated in the central regions of the site adjacent to the well bore.For rock types felt to be suitable for applications such as this, air pressure in the porouszone will be quite uniform and is thought not to be a significant contributor to site loading.
Heated regions will be wider in the porous rock than in the cap rock since thermal energyis transferred by flow as well as conduction in this region. In addition, insulating groutmaterial will likely be used in well completion to reduce thermal losses. As a result, typicalisothermal contours will likely be as shown in Fig. 1. This heated region is likely to besmall during initial periods of site operation and gradually increase in expanse as siteoperation continues.
In the porous zone, the heated central regions will expand against the cooler confiningouter regions both axially and radially and give rise to central compressive stress levels.Some tensile hoop stress components in the outer region can thus be anticipated as a result ofthis behavior.
Vertical thermal expansion of this central core in the porous zone well bear against thecap rock. The effect this has on cap rock stress will depend to a large extent on the cap rockstiffness and perhaps more importantly, the stiffness of the overburden directly above the caprock. For relatively weak overburden, this vertical loading will tend to cause tensile stresslevels at the top surface of the cap rock due to flexure.
Since thermal effects are more pronounced in the porous zone than in the cap rock or baserock, some radial stretching of the cap and base rock regions can be anticipated due to radialexpansion of the porous zone. This radial expansion will likely cause tensile hoop stresses inthe cap and base rock regions and cotnpressive stresses in the central porous zone.
In addition to stress contributions due to thermal and pore pressure loading, -fn-situstress levels initially existing at the stte depth will be a contributor to rock stresses.While in-situ stresses vary with geographic location, they are tn general compressive (verti-cally and laterially) and tend to increase with site depth. Thus, tensile components caused bybehavior modes described previously will likely be reduced partially or totally by in situstress effects.
159

ANALYSIS DESCRIPTION
Structural investigations were performed for loading conditions incurred during the firstyear of simulated site operation. Thermal and pressure loading conditions used in theseanalyses were taken from independently performed thermal/flow investigations.^ Thus, nocoupling effects between the structural and flow modeling were considered. While this assumeddecoupling might lead to questionable results for liquid flow cases, the assumption seemsreasonable in view of the compressibility ratio of air to porous rock. Further discussions offlow in an elastic porous material may be found in references 2, 3, and 4.
The analysis procedure used to model structural behavior made use of the poro-elasticformulation (Ref. 2). In this formulation, stress-strain equations and equilibrium equationstake the following form using indicia! notation:
c i = (Pf)«.-i + Em,! (EH " EfAi)1 J 1J IJKI Kl U M
£o = T T ^ (1 ' 8 )P + aT
a..j - stress tensorP - pore pressureE-. -j - elasticity tensorfik7'fiii " Kronecker delta
c^i - total straine - initial strainE - Young's modulusB - Bulk modulus ratio of porous rock to interpore material
(assumed to be .25 after Reference 2)v - Poisson's Ratio
T - temperature above stress/strain free temperature
f - rock porosity
The structural analyses performed made use of therfinite element method.' ' The computerprogram used was a modified version of the ADINA code.v6»7) j n e axisymmetric model used withthis program is shown in Fig. 2. All elements are quadratic isoparametric elements and twopoint Gaussian quadrature was used throughout. Initial calculations were performed withboundary conditions as illustrated in Fig. 2 and with material properties shown in Table 1.
Since the purpose of this investigation was to model gross reservoir response, thestructural effects of the well casing were neglected and the central region was considered tobe solid. It was felt that while this assumption will cause some inaccuracy in localizedregions close to the wellbore, the overall response of the reservoir will only be slightlyaffected.
160
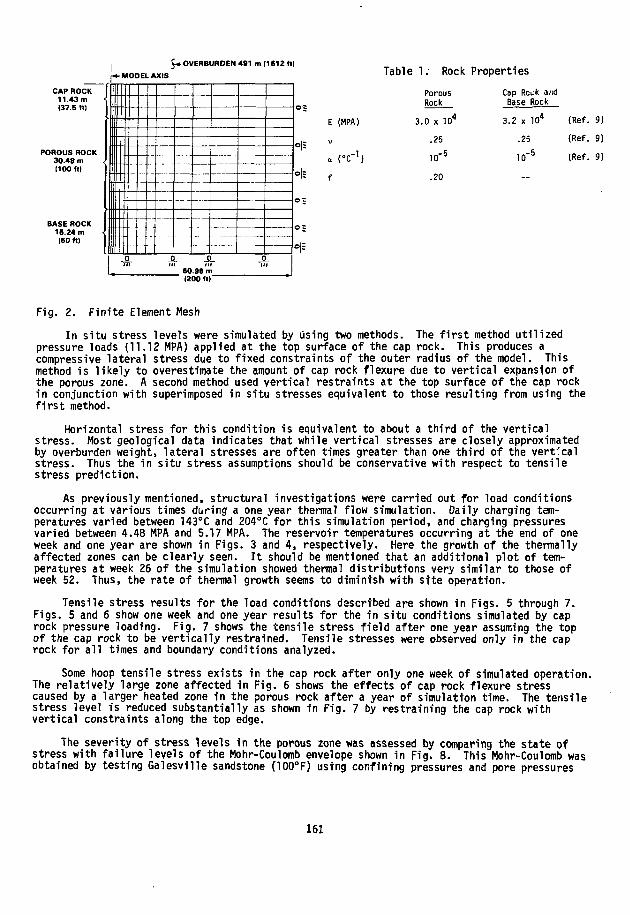
| 5-* OVERBURDEN 491p.- MODEL AXIS
CAP ROCK 1 UXL11.43 m(37.6 ft)
POROUS ROCK30.48 m(100 ft)
BASE ROCK15.24 m {ISO ft)
IiI -
w\t1-\tI-
•m 7?
. . . . .
60.96 m1200 ft
ml 1612ft
NJ
1
o =
°-
E (MPA)
V
o (°C - )
f
Table 1 . Rock
PorousRock
3.0 x 10⁴
.25
ID" 5
.20
Properties
Cap Rock andBase Rock
3.2 x 10⁴
.25
io-5
(Ref.
(Ref.
(Ref.
9)
9)
9)
Fig. 2. Finite Element Mesh
In situ stress levels were simulated by using two methods. The first method utilizedpressure loads (11.12 MPA) applied at the top surface of the cap rock. This produces acompressive lateral stress due to fixed constraints of the outer radius of the model. Thismethod is likely to overestimate the amount of cap rock flexure due to vertical expansion ofthe porous zone. A second method used vertical restraints at the top surface of the cap rockin conjunction with superimposed in situ stresses equivalent to those resulting from using thefirst method.
Horizontal stress for this condition is equivalent to about a third of the verticalstress. Most geological data indicates that while vertical stresses are closely approximatedby overburden weight, lateral stresses are often times greater than one third of the verticalstress. Thus the in situ stress assumptions should be conservative with respect to tensilestress prediction.
As previously mentioned, structural investigations were carried out for load conditionsoccurring at various times during a one year thermal flow simulation. Daily charging tem-peratures varied between 143°C and 204°C for this simulation period, and charging pressuresvaried between 4.48 MPA and 5.17 MPA. The reservoir temperatures occurring at the end of oneweek and one year are shown in Figs. 3 and 4, respectively. Here the growth of the thermallyaffected zones can be clearly seen. It should be mentioned that an additional plot of tem-peratures at week 26 of the simulation showed thermal distributions very similar to those ofweek 52. Thus, the rate of thermal growth seems to diminish with site operation.
Tensile stress results for the load conditions described are shown in Figs. 5 through 7.Figs. 5 and 6 show one week and one year results for the in situ conditions simulated by caprock pressure loading. Fig. 7 shows the tensile stress field after one year assuming the topof the cap rock to be vertically restrained. Tensile stresses were observed only in the caprock for all times and boundary conditions analyzed.
Some hoop tensile stress exists in the cap rock after only one week of simulated operation.The relatively large zone affected 1n Fig. 6 shows the effects of cap rock flexure stresscaused by a larger heated zone in the porous rock after a year of simulation time. The tensilestress level is reduced substantially as shown in Fig. 7 by restraining the cap rock withvertical constraints along the top edge.
The severity of stress levels in the porous zone was assessed by comparing the state ofstress with failure levels of the Mohr-Coulomb envelope shown in Fig* 8. This Mohr-Coulomb wasobtained by testing Galesville sandstone (100°F) using confining pressures and pore pressures
161

100806040
_60.96 m_(200 ft)
Fig. 3. Temperature Contours (CC) at the Endof One Week
140
120
_60.96 m(200 ft)
Fig. 4. Temperature Contours (°C) at the Endof One Year
.5 MPA
.60.96 m_(200 ft)
7 4.0 MPA2.0 MPA
6.0 MPA N-5MPA
_60.96 m_(200 ft)
Fig. 5. Tensile Stress at the End ofOne Week
Fig. 6. Tensile Stress at the End ofOne Year
162

T (MPA) = 17.3 +(O-m-P)TAN38°
Mohr Coulomb Failure Envelope forGalesville Sandstone (Ref. 8)
60.96 mr (200 ft)
Fig. 7. Tensile Stress at the End of OneYear (Cap Rock Restrained)
(8)similar to those of the model.v ' Safety factors were defined the radius ratio of two circles.The denominator being the radius of Mohr's circle (three dimensional) for the point in questionand the numerator being the radius of the concentric circle which is tangent to the Mohr-Coulomb envelope. This is illustrated in Fig. 8. Contour plots of Mohr Coulomb safety factorsare shown in Figs. 9 and 10 for weeks one and 52, respectively. These safety factor valuescorresponded to the model of Fig. 2 with axial loading to simulate the overburden. Thecorresponding values for the case of vertical constraints were very similar, however. As canbe seen from these figures, failure based upon t!.:s criteria will not occur.
Unlike most geologic structures, loading of a porous CAES site will be cyclic in natureand fatigue damage is a potential failure area to be addressed. In order to gain some insightinto fatigue severity, the model shown in Fig. 2 was analyzed by applying differential thermalloading experienced during a 24 hour cycle. This differential loading was obtained andcorresponding analyses were performed for several times during the one year simulation so thatfatigue stress trends as a function of time could be studied. Resulting shear stress valuesfor the middle of the cap and porous regions are shown in Figs. 11 and 12, respectively.
These figures suggest that fatigue stresses of any significant magnitude in the cap rockare very concentrated in the well bore vicinity. Due to the assumption of neglecting thecasing, however, the magnitude shown in Fig. 11 is only of qualitative value. Fatigue stresslevels are somewhat greater in the porous rock than in the cap rock. As could have perhapsbeen anticipated, the central region is the most severely stressed. Due to the assumptionmentioned above, these stress levels too should be considered only qualitatively.
CONCLUSIONS
Structural response trends are described with considerations given to the assumptionsmade in carrying out the analyses. In this context, stress levels in the cap rock andporous rock zones in the well bore vicinity should not be considered quantitatively accurate.These stress levels will be influenced by:
• The size and wall thickness of the casing
• The locations along the casing which are grouted into place
163

Fig. 9. Mohr Coulomb Safety Factors at theEnd of One Week
60.96 m_"(200 ft)
Fig. 10. Mohr Coulomb Safety Factors at theEnd of One Year
M
3 3
0 5 10 15 20 25 30RADIUS m
Fig. 11. Cap Rock Cyclic Shear Stress
a.Z
AFTER 1 WEEK
AFTER 1 YEAR
10 15 20 25RADIUS m
30
Fig. 12. Porous Rock Cyclic Shear Stress
164
• The degree of fracturing produced during the well drilling
• The termination level of the casing in the porous zone.
Plans are underway to address some of these localized features in FY-80.
Certain general response trends described in this paper, however, are thought to besomewhat general and independent of well completion details. These response trends are:
• Significant tensile stresses if existing at all will likely occur within the cap rockaway from the porous media interface.
• Fatigue stress levels are markedly higher in the near wellbore porous zone rather than inthe cap rock.
REFERENCES
1. L.E. Wiles, "Fluid Flow and Thermal Analyses for CAES in Porous Rock Reservoirs",Proceedings of_ the 1978 Mechanical and Magnetic Energy Storage Contractor's ReviewMeeting. NTlS CONF-781046
2. A. Lubinski, "The Theory of Elasticity for Porous Bodies Displaying a Strong PoreStructure", Proceedings of the Second U.S. Congress of Applied Mechanics, 1954.
3. K, G. Stagg and O.C. Zienkiewicz, Rock Mechanics in Engineering Practice, John Wiley &Sons, New York, NY, 1968. ~
4. R. P. Mordgren, "Strength of Well Completions", Eighteenth Symposium on Rock Mechanics,Johnson Publishing Co., Boulder, CO, 1977.
5. O.C. Zienkiewicz, The Finite Element Method, 3rd Edition, McGraw Hill, 1977.
6. K.J. Bathe, Static and Dynamic Geometric and Material Nonlinear Analysis Using ADINA.MIT Report 82448-2, 1977.
7. K.J. Bathe, ADINA-A Finite Element Program for Automatic Dynamic Incremental NonlinearAnalysis, MIT Report 82448-1, 1976.
8. J. Blacic, "Cyclic Thermo-Mechanical Properties of Aquifers", Proceedings of the 1979Mechanical and Magnetic Energy Storage Contractors Review Meeting. NTIS CONF-781046,1979.
9. CRC Handbook for Applied Engineering Science, 2nd Edition, CRC Press, Cleveland, OH, 1973.
165

PROJECT SUMMARY
Project Title: "Laboratory Test of Salt Specimens Subjected to Loadingsand Environmental Conditions Appropriate to a CompressedAir Energy Storage Reservoir".
Principal Investigator: Robert L. Thorns
Organization:
Project Goals:
Project Status:
Louisiana State University (LSU)Institute for Environmental StudiesBaton Rouge, Louisiana 70803(504) 388-8521
To test rock salt and develop a data base for long-termstability criteria for compressed air energy storage (CAES)caverns in rock salt. Long-term stability criteria alsowill be formulated on the bases of test data.
The test program is divided into two phases, i.e., (1) cyclictemperature and pressure tests on cylindrical rock saltspecimens at LSU, and (2) in-situ tests on boreholes in saltin the Jefferson Island mine in south Louisiana.
Six laboratory test units have been assembled to the extentthat conventional triaxial "strength" tests and uniaxialcreep tests can be performed on 100 mm (4 in.) diametercyclindrical specimens of rock salt. Controls and thermalloading components for simulating cyclic CAES environmentsare being assembled into the test units. Preliminary cyclicuniaxial testing has been performed on salt from the AveryIsland dome in the LSU laboratory.
Salt specimens suitable for laboratory terts have been ob-tained from four Louisiana domes, and also from the Huntorfsalt dome in West Germany. The Huntorf dome is the site ofthe world's first operational CAES facility. The Huntorfcores will be used for baseline tests corresponding to appar-ently successful CAES reservoirs in dome salt. The probabilityappears high also for obtaining test specimens from beddedsalt in the Permian Basin of the U.S.
Four boreholes (or coreholes) have been drilled at a test sitein the Jefferson Island mine. The holes will be used for in-situ tests, and have diameters and lengths of 108 mm (4.25 in.)and 760 ram (30 in.) respectively. Cores taken from these holesare part of the specimens on hand at LSU. A protective shedwith lighting and 110 AC power has been erected over the site.A hydraulic stress cell has been installed in an observationborehole to determine the lateral state of stress in the minefloor.
167

In-situ tests on slant holes drilled beneath mine pillars(so as to encounter large confining stresses) have beendelayed because the Jefferson Island mine was classifiedto be "gassy" by the Mining Safety and Health Administration(MSHA) in mid summer, 1979. This work will be implementedwhen access to an appropriate site becomes available.
Contract Number: Subcontract B-67966-A-H, Prime Contract EY-76-C-06-A-H.
Contract Period: Oct. 77 - Dec. 78.
Funding Level: $198,631
Funding Source: Battelle- Pacific Northwest Laboratories
168

LABORATORY STUDIES OF SALT RESPONSETO CAES CONDITIONS
R. L. ThornsLouisiana State University
Institute for Environmental StudiesLSU, Baton Rouge, LA 70803
ABSTRACT
A testing program is described for establishing a data base on rock salt response and forformulating long-term stability criteria for cyclic loadings typical of operational compressedair energy storage (CAES) caverns. The program is divided in two generalized laboratory phases,i.e., (1) cyclic temperature and triaxial stress tests at LSU, and (2) in-situ cyclic tempera-ture and pressure tests in boreholes in salt mines. Accomplishments to date and work still tobe done are reported and summarized.
INTRODUCTION
Currently there is no significant data in the literature on the response of rock salt tocyclic loading conditions which simulate the environment around a compressed air energy storage(CAES) cavern. A relevant data base is prerequisite for rational design and operation of CAEScavern systems. The foregoing report summarizes accomplishments to date and work still to bedone on establishing a data base from generalized laboratory tests appropriate to CAES applica-tions. When adequate, the data base will be used to formulate long-term stability criteria forCAES cavern systems in salt formations.
OBJECTIVES AND SIGNIFICANCE OF STUDY
The objectives of the current study include: (1) performing laboratory tests, in a gener-alized sense, on rock salt under CAES cavern loading conditions; and (2) subsequently estab-lishing a data base and formulating long-term stability criteria for CAES caverns in salt for-mations.
Considerable interest has been shown recently in geostorage in salt formations. Withoutgoing into detail, most frequently considered storage applications in salt, e.g., oil or gas,involve cavern pressure loadings of only a relatively small number of cycles. Further, stor-age of liquids generally involves only small rates of pressure change in storage caverns; andstorage of solid wastes obviously would not ordinarily involve loading rate effects. Thus,little work has been done or reported on cyclic loading or loading rate effects for salt. How-ever, at least one case has been reported where rapid depressurization of a test cavern in saltcaused associated roof collapse.") Also, from considerable work on other polycrystallinematerials, i.e., structural metals, it can be anticipated that cyclic loadings could cause pos-sible undesirable "fatigue" effects in rock salt caverns.
Rational engineering design implicitly requires realistic and relevant data on materialbehavior. Thus a specialized test program has been initiated to obtain data suitable for designof CAES caverns. The data will be reported in a format which should be generally useful forplanning and operating CAES cavern systems. Long-term stability criteria for CAES caverns alsowill be presented as a logical extension of the data analysis. It should be noted that site
169

specific tests generally will still be required to furnish input for the long-term stabilitycriteria which will be formulated through this study. However, the present study will providea basis for testing and data analysis relative to CAES in salt formations in general.
SCOPE OF TEST PROGRAM
As noted previously, the study includes two major testing phases: a series of tests atLSU on salt specimens from a number of locations; and in addition, a series of in-situ tests onboreholes in south Louisiana salt mines. Both of these series of tests are included in thescope of "generalized" laboratory testing for this study. Further, limited numerical modelingis incorporated in planning of tests and for data correlation and analysis.
The series of tests at LSU will be carried out principally with six triaxial test machinescapable of exerting coupled cyclic temperature fields and axial and confining stresses on cylin-drical salt specimens. "Standard" salt test specimens have diameters and lengths of 10 cm(4 in.) and 20 cm (8 in.) respectively. Confining stresses (pressure) up to 34,500 kPa (5004psi) and axial stresses up to 77,625 kPa (11,259 psi) can be applied. This is adequate to sim-ulate most stress environments for salt caverns at depths ranging from 610 m (2001 ft) to1524 m (5000 ft). This range extends over the most likely depths for construction of CAEScaverns.
For the second testing phase, in-situ cyclic pressure and temperature tests will be per-formed in boreholes in the floor and possibly beneath pillars in salt mines. Tests performedin boreholes beneath pillars would include effects of relatively large confining pressures inthe essentially undisturbed surrounding salt. Possible deterioration of the surrounding rocksalt fabric versus numbers of loading cycles will be monitored.
Effects to be monitored in both the triaxial and borehole tests include related displace-ments (strains), loading environments, and microseisms versus time or numbers of load cycles.(2)In addition, possible deterioration of the surrounding rock salt fabric will be noted.
The geological setting of the salt specimens tested also will be described. For example,possible effects of gas entrapped in the salt will be noted. Gas entrapped in salt can causeblowouts (gas outbursts) such as the one that occurred recently at the Belle Isle salt mine insouth Louisiana. Blowouts should be a significant concern in site selection for CAES caverns,and thus are included as factors in long-term stability criteria for storage in salt. (3)
A large number of index tests are planned for correlation of data from more time consumingtriaxial tests. Uniaxial tests and the "split cylinder" or "Brazil" tests will be used forthis purpose. The split cylinder test employs the failure load of diametrically loaded short,e.g., 2.5 cm (1 in.), cylinders.
Applied test loads will be selected on the basis of preliminary numerical modeling so asto span loading environments anticipated for CAES caverns. Basic test parameters will incor-porate sufficient detail to uniquely define typical loading cycles for particular tests. Forexample, Fig. 1. is a schematic of a typical loading cycle for a triaxial extension cycle creeptest performed in the laboratory.
Anticipated results from the testing program will include "failure surfaces" associatedwith stress environments and numbers of load cycles. Long-term stability criteria will bededuced for CAES caverns based on the test program results.
WORK PLAN
The preceeding text has included some detail on the overall objectives, significance, andscope of the study. Therefore, only major topics in the general work plan are listed in thissection. The topics essentially follow in order the time sequence of the major steps in thestudy.
170

Confining Stress
(— Period Of Typical loading Cycle
Axial Stress
Temperature
Fig. 1. Typical Cyclic Triaxial Extension Test Loading
1. Obtain salt cores for testing from south Louisiana salt mines and other opportune sitessignificant for CAES.
2. Test cores in LSI) laboratory under simulated CAES loading environments.3. Test boreholes for in-situ behavior in salt mines.4. Correlate laboratory and in-situ test data.5. Report data and present stability criteria.
A more detailed project plan has been prepared for this study which incorporates the abovemajor steps.
ACCOMPLISHMENTS TO DATE
Major Accomplishments to date include the following items,
1. Salt core acquisition from: south Louisiana salt mines (Jefferson and Avery Islands),north Louisiana coreholes (verbal approval - Vacherie and Rayburn's domes), WestGermany (Huntorf dome, gas storage wells, with operational CAES plant in same dome).
2. Laboratory at LSU for cyclic CAES loadings, with six test units, is approximately 75%complete.
3. Boreholes and enclosing shed have been completed for testing in the floor of theJefferson Island salt mine.
4. Plans have been completed for performing tests in boreholes slant-drilled beneath minepillars. Implementation of this effort has been delayed because of recent "gassy-mine"classification of Jefferson Island salt mine.
: 5. Preliminary testing has been performed on Averv Island salt. There are some indica-tions that cyclic loading causes more severe effects than static loading. Figure 2
171

depicts results for a uniaxial creep test on Avery Island salt. It corresponds veryclosely to test results obtained by other workers for salt from the Tatum dome insouth Missippi.(4)
TIME.30
HOURS60 70
Fig. 2. Uniaxial Creep Test for Avery Island Salt, 1750 psi (12064 kPa)
WORK TO BE DONE
Work remaining to be done under this study includes the following items at the time ofthis review.
1. The laboratory at LSI), now approximately 75% finished, will be completed. Late equip-ment delivery has delayed completion of the laboratory.
2. Loading and monitoring system for boreholes in the floor of the Jefferson Island minewill be installed and tests initiated. Tests in slant holes beneath pillars have beendelayed because of a recent gassy mine classification; however, this test may be movedto another mine or carried out at a later date.
3. Test data from a variety of salts, including the Huntorf salt, will be analyzed. TheHuntorf salt should furnish highly significant data because the first operationalCAES plant is located in that dome.
4. Results will be reported along with lo1 -term stability criteria based on test data.
SUMMARY
Work is well along on providing generalized laboratory test facilities for simulatingeffects of CAES caverns in rock salt. A unique feature of the facility is the parallel devel-opment of in-situ testing in salt mines. Testing of salt srooimens has been initiated at LSU,and testing in a south Louisiana mine is close to initiatio.:. Tests will become increasinglysophisticated and specific as equipment now on order is received and assembled into testingunits.
172
REFERENCES
1. H. U. Rohr, "Mechanical Behavior of a Gas Storage Cavern in Evaporitic Rock," Proc. 4thInternational Symposium on Salt, V. II, Northern Ohio Geological Society, 1974, p. 93-100.
2. B. C. Haimson and K. Kim, "Acoustic Emission and Fatigue Mechanism in Rock," Proc. FirstConference on Acoustic Emission/Microseismic Activity in Geologic Structures and Materials,H. R. Hardy, Jr., and F. W. Leighton, Eds., Trans Tech Publications, 1977, p. 35-55.
3. R. L. Thorns and J. D. Martinez, "Preliminary Long-Term Stability Criteria for CompressedAir Energy Storage Caverns in Salt Domes," Report for Battelle-PNL, Special AgreementB-54804-A-L, Prime Contract EY-76-C-06-1830, Institute for Environmetal Studies, LouisianaState University, August 1978, p. 7.
4. A. P. Boresi and D. C. Deer, "Creep Closure of a Spherical Cavity In An Infinite Medium(With Special Application to Project Dribble, Tatum Salt Dome, Mississippi)." For: Holmesand Narver, Inc., Las Vegas Division, May, 1963, p. P.10.
ACKNOWLEDGEMENT
This work was performed for Battene-Pacific Northwest Laboratories, under Prime ContractEY-76-C-06-A-H, Subcontract No. B-67966-A-H.
173

Project Title:
Principal Investigator:
Organization:
Project Goals:
Project Status:
Contract Number:
Contract Period:
Funding Level:
Funding Source:
PROJECT SUMMARY
Field Studies Planning, Salt and Porous Media
T.J. Doherty
Pacific Northwest LaboratoryP.O. Box 999Richland, Washington 99352(509) 946-2793
To plan field studies in salt and porous media with the two objectivesof extending reservoir stability numerical and experimental studies insitu conditions and supporting reservoir evaluation efforts of theutilities in the development program.
Directed small scale studies are being conceptualized to validate thedesign and stability criteria inside time and cost constraints.Liaison with the utilities performing salt and porous media CAESsystem development projects is underway.
EY-76-C-06-1830
FY1979
$65K
Department of Energy, Division of Energy Storage Systems
175

COMPLEMENTARY AND POTENTIAL CAES FIELD STUDIES
T.J. DohertyPacific Northwest LaboratoryRichland, Washington 99352
ABSTRACT
Field studies at PNL form an integral part of the transition from concept examination andapplied research to development and demonstration of CAES technology. Small scale directedstudies for three media types are presently in a conceptual phase. Porous media work isdirected towards determining in situ permeability changes and wellbore desaturation. A shallowaquifer high temperature injection test is in planning. The key concern 1n salt is the effectof air penetration and temperature at high strain, low confining stress conditions. Benchscale or small in-situ cavern experiments are being examined for feasibility and cost. Anin situ study of hard rock reservoir parameters is awaiting detailed prioritization of key areasof concern.
INTRODUCTION
Studies of reservoir stability seek to establish design and stability criteria that willallow efficient utilization of geologic structures for compressed air energy storage over usefulfacility lifetimes. Four types, of studies will contribute to the identification of finaldesign and stability criteria.
The first phase of the reservoir stability studies was a state-of-the-art-survey (Fig. 1)of existing knowledge if the field of geologic storage, with supplemental knowledge from relatedtechnologies. This baseline information was condensed into preliminary design and stabilitycriteria and was evaluated to direct later studies in the areas of insufficient knowledge.These criteria will be confirmed, modified, or updated as results of later studies becomeavailable.
STATE OF THE ART STUDY
NUMERICAL STUDIES
EXPERIMENTAL STUDIES
FIELD STUDIES
DESIGN AND STABILITY CRITERIA
Fig. 1. Reservoir Stability Structure
176
The next two phases are experimental studies and numerical studies of the response of thegeologic storage media to CAES operational loadings. Experimental and numerical studies arebeing carried out concurrently, and are phased in such a way that numerical work can supportand guide the experimental studies and results from tests of material response can beincorporated into numerical modeling. Both of these phases are making contributions to thedesign and stability criteria as the results of their studies confirm or deny the initialpostulates. Also, as a direct result of numerical and experimental studies, new ground isbeing covered in the field of geological engineering which allows a prioritization of the keyareas of concern for each type of geologic structure under CAES operational conditions. Thesestudies are well underway for porous media aquifer storage and for domal salt storage schemes,and are in the preliminary stages for hard rock materials. Results from these studies haveindicated that many of the postulated failure mechanisms will not present problems. A fewcritical items have indicated potential for problems. These are being carefully examined.
The fourth phase of the criteria generation and confirmation process is the area of fieldstudies. Field studies form an integral part of the transition from concept examination andfeasibility determination to actual development and demonstration of CAES technology. Theproducts of this series of studies, from numerical through experimental to field studies, aredesign and stability criteria for long life utilization of geological reservoirs for CAESapplications.
The field studies project is within the PNL Reservoir Stability Study, which concentrateson determining geological constraints to CAES operation. Also,ongoing, is a joint developmentprogram with DOE-STOR and EPRI that is to demonstrate conventional CAES plants in the U.S. indifferent geologic media. This program is performing preliminary system design and is in theprocess of site selection and exploration. Total system development is the purpose of thisdemonstration program.
The CAES field studies task has two responsibilities that are necessary to the validationand acceptance of the design and stability criteria being formulated with Reservoir StabilityStudies:
1. Extension of CAES numerical and experimental results and conclusions to in situ conditions.
2. Support of baseline studies dealing with exploration and monitoring of the geologicalreservoirs currently ongoing in the development program.
Two methods have been chosen to address these responsibilities in a timely and cost-effective manner. The first method entails performance of directed small scale field studiesof parameters that have been identified as critical to CAES reservoir operation. A full scaleoperational test facility for conventional and advanced CAES reservoir testing would requirelong time periods for siting and construction, and would not fit within the budget, scope ortime frame of the technology program as presently outlined. Data from such a facility wouldalso not be available in sufficient time to be useful to the design process in the paralleldevelopment program. Knowledge of reservoir response has increased greatly since initiationof the reservoir studies and it is felt that the critical parameters affecting the integrityof CAES storage reservoirs have been identified. Directed small scale studies to examinethese critical items in situ, can be performed in relatively short time periods and within areasonable budget.
The second method involves establishing a working relationship with the developmentprogram in that area*of their project that is concerned with exploration and monitoring oftheir reservoir. The data needs and operational conditions of the development programdo not coincide exactly with that of the technology program. Operational conditions plannedfor the demonstration reservoirs do not cover the range of temperatures, pressures, and otherconditions that should be covered in order to determine constraints on CAES reservoirs.Nevertheless, the data resulting from the development program will provide full scale baselineinformation to the small scale field studies.
177

DIRECTED SMALL SCALE FIELD STUDIES
Small scale tests are planned for design and construction that will examine the keyparameters of CAES reservoir behavior. Numerical and experimental tools developed as part ofthe program will be utilized to aid test design and will themselves be verified. Thiswill be done by utilizing these tools to predict performance of the tests to determine thelevel of accuracy or utility they have with respect to in situ conditions. Pre and post testcoring and/or material examination will be performed to quantitatively evaluate correlationbetween lab and field testing conditions.
Upon completion of a testing sequence, comparisons between prediction and performancewill be made, and correlation noted. From these, conclusions about the validity of the designand stability criteria or recommendations and modifications can be made.
The three media for CAES reservoirs being examined by Reservoir Stability Studies areporous formations, domal salt, and hard rock. This discussion addresses 'eld study conceptsbeing developed for porous media and domal salt.
POROUS MEDIA STORAGE RESERVOIR
The concept under development for porous media is based on utilizing near surfaceLower Paleozoic sandstones. These formations, particularly the Galesville, have been studiedby CAES researchers and are fairly well characterized. The specific formations should bewithin 100 meters of the surface, primarily so that drilling and casing costs (Fig. 2) will bereasonable. Formation closure and caprock seal integrity will be considerations but may notbe primary ones. The present thinkiny is to develop a reasonably small bubble at moderatepressure over a period of a few months by cool air injection. Once a bubble has been developedsufficiently to clear water from a two well doublet, hot air injection would be initiated in onewell and air withdrawal in the other, maintaining some overpressure to insure crossflow. Thisprocess would be reversed after some cycle time, and the heated region about the now reversedinjection well would be cycled by the opposite cool air flow. Once established, this procedurewill result in a crossflow that will deposit heat at the injection well and pick up heat atthe withdrawal well. This should closely simulate flow, temperature, and drying conditions ina porous medium near the wellbore region under warm air cycling during the early period ofCAES operation.
Confined moist air flow tests on down hole cores are planned for FY-1980. Laboratoryversus in situ permeability from aquifer study and gas storage experience have been foundto be somewhat different, often markedly so. An in-situ test under CAES conditions willindicate if permeability trends remain consistent with lab results. Numerical studies indicatethat near wellbore stresses due to the temperature gradient") are much higher than in-situstresses and that the heated area near the wellbore is well within the desaturated area(2).These trends can be confirmed in-situ by establishing a flow thermal gradient in an aquifer.
Well instrumentation and a small hole array in the bubble region, as indicated by Fig. 3,will allow monitoring of pressure, temperature and saturation in the formation. Well headtemperature, pressure and flow monitoring will be the key measurements for monitoring permeabilitychanges. Other tools to aid permeability change and desaturation rates that are available fordata gathering before and during testing are listed below:
• Thermistor - An electrical resistor using a semiconductor whose resistance varies in aknown manner with temperature. *.
• Thermocouple psychrometer - Measures the dewpoint at high relative humidities and givestemperature and saturation data.
• Heat dissipation units - Short time temperature drop is measured after a heat sourcepulse. Thermal diffusivity correlates with degree of saturation.
178

I 1«U»F.
HEATER PUMP
.PIEZOMETER WELL
o oo
• ao
INJECTION/WITHDRAWAL -WELL
n O
P • ®'—CLOSED INSTRUMENT WELL LOGGING TOOL KCLE
Fig. 2. Porous Media Field Test Schematic Fig. 3. Test Site Layout
• Piezometer - Hollow tubes at various depths to indicate hydrostatic pressures and allowfor sampling.
• Tracer test - A fluorinated hydrocarbon gas is mixed with the injection air in knownconcentration. Water and air samples are taken from piezometer wells periodically to beanalyzed by a gas chromatograph. Tracer concentrations indicate air movement patterns.
• Electric logs - Used in the wells before casing so that the surrounding formation may bedefined.
• Single point resistivity - This log will establish the boundary between strata of differingresistivity and aid in lithologic correlation.
• Spontaneous potential log - This log records natural potentials which enhance data fromthe resistivity log for lithology and bed thickness evaluation.
• Radiation logs - These logs are used in open wells to monitor saturation and porosity inthe areas of interest during testing.
• Neutron-Gamma log - This is a porosity log used for baseline data.
• Neutron-Epithermal Neutron log - This log measures water content, indicating porositybelow a water surface and formation moisture above.
• Cement bond log - This log detects gaps in the cement between casing strings.
• Galvanic instrumentation - Detection of casing deterioration during testing.
As stated previously, this plan is in a conceptual phase, but some progress has beenmade. The key test parameters have been identified and a work plan to complete the conceptualdesign by December has been formulated and implemented. Technical management will be handledat PNL along with some instrumentation related functions and test operation, but the majorsite selection exploration, drilling and construction will be placed with consultants andsubcontractors familiar with the geology and working environments.
SALT TEST CONCEPT
Numerical and experimental studies to date have indicated that stable performance can beexpected under CAES operation, but both modeling and experiment indicate that the key itemensuring good performance is the surface quality of the wall cavity. In this area, thenumerical models predict high strain, which affects salt permeability. Experimental resultsindicate an onset of opacity affecting the salt quality under high strain cyclic loading. A
179

change in permeability, such as increase in secondary permeability, also results in some airpenetration into the rock structure, which reduces the confinement (Fig. 4). This couldfurther lower the salt performance in the near well region. Salt is very sensitive in itsstrength and flow parameters to changes in temperature. Minor temperature changes fromcompression/extraction or moderate injection temperatures would also affect the near surfaceregion. These phenomena are under investigation in ongoing numerical and experimental work,but these studies, due to limited sample size, may not be able to address sufficient scale toindicate the true field performance of a domal salt.
The pertinent operating parameters for such a study would require a well confined saltbody, a solutioned cavity surface, and cyclic air pressure and temperature within the cavity.Examination methods could include wall coring or visual methods. Closure displacement measure-ments would also be important.
The requirement for a confined salt body has led investigators to address two concepts.Both are fairly flexible at this stage as the key issue to be recolved is whether mine owner/operators will allow development of the test concepts within their facilities.
The first concept is extension of the LSU^3' in-mine borehole tests to a small solutioncavity (Fig. 5). This concept would be convenient for instrumentation and advanced boring.Coring from adjacent openings could be utilized to obtain post test cores. It is possible thecavity could be located so that it can be mined directly from a lower level allowing directaccess. Some contacts have been made on general feasibility with mine operators but noindication of commitment has been received as most of the operators are presently dealing withthe new gassy mine classification problems.
The other concept would be to utilize the early startup phase of a standard solution mine.The small cavity (Fig. 6) could be cycled at an accelerated time rate. Some available opticalinstruments have been identified for visual and dimensional examination of the cavern and thepossibility of post-test side coring the smaller cavern is under investigation. One disadvantageof the concept is that the test area becomes the property of the mine operator after M smining commences.
Progress on getting approval of this general concept has been good. Preliminary discussionswith mine management on details and schedules are in progress and it is hoped that testdevelopment can be initiated in FY-1980. A conceptual design report, with a mine operatorapproved site, is planned for inclusion in the December 1979 salt field studies plan.
AIR PENETRATION
IN SITUSTRESSES
AIRPRESSURE -
HIGHLY STRAINEDNEAR WALL SALT
Fig. 4. Mechanism for Reducing Effective Confinement
180

\ \
Fig. 5. Salt Concept In-Mine Fig. 6. Salt Concept in Solution Mine
DEVELOPMENT PROGRAM RELATIONSHIP
The DOE-EPRI CAES development programs, presently being performed by utilities, have astheir purpose total system demonstrations. Public Service Indiana (PSI) has responsibilityfor the porous media CAES concept. Middle South Services (MSS) is carrying out its study onCAES application to domal salt structure. Both of these programs are at the stage of siteselection and are formulating site exploration plans. The reservoir stability studies cansupport the utility studies and benefit from these studies by:
1. Facilitating interchange of data and providing special test data on demonstration siteexploration cores.
2. Providing technical support with numerical and experimental tools.
3. Proposing instrumentation supplements at demonstration sites to extend the explorationand monitoring data base beyond minimum needs.
We have initiated liason with both PSI and MSS and have requested information on theirexploration phases. The level of involvement in the development program will be determinedonce we have the opportunity to examine the exploration and site selection decisions of theutilities and they respond and comment on our proposals. Firm arrangement for mutuallybeneficial cooperation could be included in the December 1979 field studies plan documents.
CONCLUSION
Directed small scale field studies for salt and porous media are being identified toconfirm design and stability criteria developed in the Reservoir Stability Study. In additionutility direction is being sought in order to create a field study demonstration programrelationship that will be mutually beneficial.
REFERENCES
1. J.R. Friley, Structural Response of a Generic Porous Site. PNL-SA-7918, presented at the2nd Annual Mechanical & Magnetic Energy Storage Contractors Review Meeting, Washington,D.C., 1979.
2. L.E. Wiles, The Effects of Water on Compressed Air Energy Storage in Porous Rock Reservoirs.PNL-2869, Pacific Northwest Laboratory, Richland, Washington, March 1979.
3. R.L. Thorns, Laboratory Studies of Salt Response to CAES Conditions, presented at the 2ndAnnual Mechanical & Magnetic Energy Storage Contractors Review Meeting, Washington, D.C.,1979.
181

Project Title:
Principal Investigator:
Organization:
Project Goals:
Project Status:
Contract Number:
Contract Period:
Funding Level:
Funding Source:
PROJECT SUMMARY
Advanced Concepts Studies CAES
R.T. Allemann
Pacific Northwest LaboratoryP.O. Box 999Richland, Washington 99352(509) 946-2151
Develop and assess advanced technologies for CAES that requirelittle or no supplementary firing by petroleum fuels in order toeliminate the dependence of CAES on these fuels.
The advanced concepts studies are screening the major advancedtechnologies, thermal energy storage (TES), fluidized bed com-bustion (FBS), and coal gasification (CG). The screening shouldbe completed in FY1980. Test facilities for thermal energystorage and comprehensive cost analysis are the other major tasksand are also directed toward defining criteria and recommendinga CAES system to be demonstrated.
EY-76-C-06-1830
FY1979
$575K B0/$700K BA
Department of Energy, Division of Energy Storage Systems
183
ADVANCED CONCEPTS STUDIES
R.T. Allemann and M.K. DrostPacific Northwest Laboratory
PO Box 999Richland, Washington 93352
ABSTRACT
The objectives of this program are to reduce or eliminate the dependence of CAES systemson petroleum fuels. The approach has been to evaluate improved cycles, equipment capabilities,coal firing methods, and thermal energy storage as applied to CAES. The evaluations haveincluded both technical and economic studies. Preliminary results show technical promise forCAES systems integrated with coal fired fluid bed combustion, with thermal energy storage, andcoal burning steam plants. The latter system uses advanced indirect thermal energy storagethat shows economic benefits over direct thermal energy storage. A review of coal gasificationshows potential benefits when coupled with a CAES peaking plant.
INTRODUCTION
Compressed air energy storage is a feasible technology that has been demonstrated. Manystudies in the U.S. have determined its probable economics and electric power costs. Thepotential difficulty arises from the use of petroleum fuel in the compressed air energy storagecycle. Such fuels are becoming more expensive and indeed may be unavailable for electricalpower generation. The advanced concepts CAES program is directed toward reduction andelimination of the need for petroleum fuels in the CAES cycle. The term "advanced" in thiscontext is used in that |ense, not in the sense of more sophisticated equipment. This paper isa review of the 1979 Advanced Concepts Studies being carried out as part of the Compressed AirEnergy Storage program by DOE .
CONCEPTS CONSIDERED
This year the advanced CAES studies have been directed toward technical and economicevaluation of reduced or no-oil/CAES concepts. These include the following:
j CAES/Thermal Energy Storage Technical and Economic Studies
• ^AES/Coal Gasification Technical Studies
• CAES/Fluidized Bed Combustion Technical and Economic Studies
• CAES Cycle Evaluations Technical.
Specific tasks during 1979 include the following elements, some of which have been or willbe submitted as reports:
• Incremental Cost Analysis of Advanced Concept CAES Systems by C.A. Knutsen (KnutsenResearch)
• Economics of TES for CAES by S.C. Schulte (PNL)
• Coal Fired Fluid Bed CAES by A.J. Giramonti (UTRC)
184

• CAES/Solar and CAES/TES Studies by G. T. Flynn (MIT)
• Review of Compressor and Turbine Limitations by Hi Bomeiburg (PNL)
. Direct Coupled Steam on CAES Cycles by M.K. Drost (PNL)
• Review of Coal Gasification with CAES by G.L. DeHaan and R.T. Allemann (PNL), and
• New Concepts Studies by R.T. Allemann (PNL)
The first of these tasks was reported in a paper presented at a recent IECE Conference inBoston. The next two tasks will be presented at this conference. In this paper, I shallbriefly summarize some of the other tasks and outline the direction of the Advanced ConceptsStudies.
RESULTS OF REVIEW OF COAL GASIFICATION/CAES
The use of low BTL) gasified coal is a potential means for eliminating the need forpetroleum fuels by a CAES plant. It has the potential advantage over temperature limitedthermal energy storage/CAES and FBC/CAESof being able to supply high temperature air topresent and future turbines. Several technical feasible cycles were analysed for near termuse. Comparisons were made with longer term coal gasification concepts as described by A.J.Giramonti in the 1978 Energy Storage Symposium and with magnetohydrodynamic long term concepts(also coupled with CAES).
These results, partially shown in Table 1, indicate that coal gasification/CAES appears tobe technically feasible in the near term and may have potential improvements in heat rate inthe long term. Further development and economic evaluations appear to be needed. It should benoted that in view of the extensive coal gasification research and development conducted by DOEand industry, and in view of the fact that only minor modifications would be required tointegrate a coal gasification system into CAES, this task has been primarily concerned with theanalysis and evaluation of data to assist the DOE with decisions on which advanced CAESconcepts to develop further.
TWO RESERVOIR CLOSED CAES CYCLE
A technical analysis was made of an advanced CAES cycle suggested by H. Bomelburg of PNL.It is a closed cycle in which the air is passed between two high pressure compensated storagecaverns by the compressor and turbine. The schematic is shown in Fig. 1. The formula at thebottom is the air path in the cycle. The air goes from low pressure store (AS]) through
TABLE 1. CAES Performance Summary
Mameof
System
]«. BaseSystem forComparison
IB. Cogas/CAESw/Recuperator
IC. Cogas/CAESH/waste Heatsteam Cycle
2. AFBC/CAES
3. PfBC/CAES
4. MHD/CAESOntion 1
5. MHD/MESODtion 2
Base Mode
Output Heat Ratek» (W) Btu/kK-hr
3,960
2,560
4,272
1,400
1,160
(961)
1961)
10,550
14,220
11.638
19,650
18,000
M03
7.103
Generation Mode
Output Heat RatekH (UK] Btu/kW-hr
9,020
7, SOS
9,207
6,395
6.455
(1.395)
(1,392)
4,745
4.938
5,833
4,440
4,198
6.021
5,468
CompressionHode
OutputkW (HK)
-5,280
-2,595
- B81
-3,755
-3.695
(•5B4)
(•5«8)
- Round TripHeat RatekU ( » )
10,600
13.246
12.190
14.614
13.994
7,94]
7,575
EquivalentStorage
Efficiency
94.Ot
95.01
89. U
96.Ot
96.0'
56.4*
77.6!
'Compression tine is equal to generation time for all cycles
185

compressor (C) to high pressure storage reservoir (AS2). During generation the air goes fromAS2 through turbine (T), trim cooler (q) to lower pressure storage reservoir (ASi). Theadvantages of this cycle are a low temperature rise (Fig. 2) due to low pressure ratio ofcompression and expansion, and high storage efficiency of about 72-75% (Fig. 3). The dis-advantage appears to be the relatively large storage volume required (Fig. 4). Table 2 shows acomparison with other systems. The two reservoir concept requires a volume that is nearlythree times larger than the underground pumped hydro storage and thus would not appear to becompetitive. Because of the very large storage volumes required, we have not proceeded with aneconomic evaluation.
RESULTS OF REVIEW OF DIRECT COUPLED STEAM/CAES CYCLES
As part of PNL's evaluation of advanced compressed air storage concepts, PNL has evaluatedthe performance of a direct coupled coal fired steam/CAES plant. The direct coupling of thetwo types of cycles provides benefits for each cycle and improves the overall performance ofthe facility. This concept was examined because it gives the potential for substantiallyreducing or eliminating the use of petroleum fuel and satisfy the peaking power requirements ofutilities.
A schematic of the Direct Coupled Steam/CAES cycle is shown in Fig. 5. The steam cycle istypical of current steam power plant technology with multiple stages of feedwater heating andreheat. There has been three modifications to the steam cycle; the steam turbine can beclutched to either the compressor train of the CAES cycle or to a generator, some feedwaterheating is provided by the heat of compression from the compressor train of the CAES cycle andthe hot reheat steam is used to charge a thermal storage unit. The hot reheat steam ispartially desuperheated and returned to the steam plant intermediate pressure turbine.
uT
I
660.0
600.0
460.0
400.0
360.0
AS, C AS2 Tq T AS,
Fig. 1. Two Reservoir Cycle
S
i 300.0
260.0
160°F
3.'' 4.0 4.6 6.0
OVERALL PRESSURE RATIO
Fig. 2. Storage Temperature (T2) as a Functionof Pr, P-|, and Tj
186

ss.o
3.E 4.0 4.5 CO
OVERALL PRESSURE RATIO
6.6 3.6 4.0 4.6 E.O
OVERALL PRESSURE RATIO
Fig. 3. Storage Efficiency as a Function of Fig. 4. Storage Volume as a Function ofPressure Ratio, Initial Pressure Pressure Ratio, Initial Pressure,and Initial Temperature and Temperature
TABLE 2. Two Reservoir Cycle Results Comparison
Storage Efficiency X
Storage Depth ( f t )
Specific Storage Volune(ft3 /kW-br out)
Turbine, Compressor PressureRatios
TecUnoiogy Risk
Two ReservoirClosed System
CAES
•v70
2000/6500
18.3/8.2Total 26.5
3.25
low
65
Hoderate
187

MTIC OR DRAW M i l
STEAM/WATfH
COMMIII IDAW
Fig. 5. Cycle Arrangement Close Coupled Steam/CAES CycleTES Heated with Hot Reheat Steam
The cycle has been modified so that compressed air is heated during discharge by heatstored in the thermal storage unit. The CAES cycle can be either an adiabatic CAES/TES cycleor a hybrid cycle that uses both TES and fuel.
The thermal storage is assumed to be a molten salt thermocline storage, where thermalenergy is stored as sensible heat in a mixture of molten salt (HITEC or Draw salt) and rock.This type of thermal storage unit is being developed for solar thermal applications.
During the charge cycle, the steam turbine is clutched to the CAES system compressor trainto compress air for storage underground. The helt of compression, which is normally rejected,is used for feedwater heating in the steam cycle. Hot reheat steam ts used to charge storageand is the expanded in the steam cycle intermediate and low pressure turbines.
During discharge, the steam turbine is clutched to its generator and steam is extractedfor feedwater heating to replace the heat of compression. Discharge air is heated from thethermal storage and expanded in the air turbine which is shafted to a generator.
Using the steam heated TES arrangement, the maximum temperature of air entering the airturbine is around 510°C. Cycle performance can be improved by adding a petroleum fuelcombustor on the discharge of the air heater to obtain a higher temperature before expansion inthe air turbine.
The Direct Coupled Steam/CAES concept has several advantages over a separate steam plantused to provide power to a CAES plant. Generator, motor and transmission line losses areeliminated for charging power. A substantial fraction of the heat of compression is recoveredand petroleum fuel consumption is reduced or eliminated by providing air heating from thethermal storage. It should be noted that the steam generator does not cycle and that the steamcycle and CAES cycle are commercially available.
The arrangement can operate in a no petroleum fuel mode but there is a substantialperformance penalty because of the low temperature of the air entering the air turbine. Inaddition, using hot reheat steam for charging storage reduces the performance of the steamcycle. To avoid these problems, two alternate cycles were considered; one in which thestorage media is directly heated in the steam generator and one which uses a fluid bedcombustor.
188

Jj Direct Heating arrangement is similar to the steam heated arrangement discussed aboveexcept that the molten salt is directly heated in the steam generator (see Fig. 6). This givesa slightly higher temperature in storage and improves the performance of the steam cycleparticularly in the no petroleum fuel case. This arrangement has the disadvantage of requiringa major redesign of the steam generator.
An advanced arrangement has also been considered (see Fig. 7). In this concept an FBC isused as the steam generator for the steam cycle. In addition, the FBC is used to heat airwhich in turn is used to charge a pebble bed thermal storage unit. During discharge, air fromstorage is passed through the thermal storage and is heated. It is assumed that the airtemperature on the discharge side of storage reaches 815°C. The air which is used to chargestorage goes directly to the air turbine during discharge. This arrangement improves per-formance of the Direct Coupled Steam/CAES cycle particularly for the no petroleum fuel case.The major disadvantage is that both the FBC and the thermal storage require development.
The performance of the various cycles was determined for a base case, a reduced petroleumfuel case, and a no-petroleum fuel case. The basa case is a typical CAES facility with the HPturbine fired to 1000°F and the LP turbine fired to 1500°F. Several reduced petroleum fuelcases were considered and the one with the lowest heat rate was selected. This was a DirectCoupled Steam/CAES plant which used the steam heated TES arrangement and a hybrid GlendenningA-5 cycle for the CAES (Fig. 5). Several no petroleum fuel cases were considered and two arepresented. The first is a near term arrangement which used the direct heated TES arrangementand a conventional CAES cycle with both the LP and HP turbines heated (Fig. 6). The second isan advanced arrangement which uses an FBC for the steam generator and a hybrid Gendenning A-5cycle for the CAES (Fig. 7).
The reduced petroleum fuel case resulted fn a 60% reduction in petroleum fuel use from4400 Btu/kW-hr to 1600 Btu/kw-hr but with an 11% increase in overall heat rate. The no-petroleum fuel cases eliminated the use of petroleum fuel and increase the overall heat rate by10% for the direct heated arrangement. The advanced arrangement both eliminated the use ofpetroleum fuel and decreased the overall heat rate (see Table 3).
The results indicate that the direct coupled steam/CAES concept has promise. Furtherstudies will be needed to improve performance calculations and to determine the economics ofthis concept.
* / \ Mfl TUMINE
Fig . 6. Cycle Arrangement Close Coupled F ig . 7. Cycle Arrangement Close CoupledSteam/CAES Cycle TES Di rec t l y Heated Steam/CAES Cycle Advanced Cycle
189

TABLE 3. Summary of Results for Direct Coupled Steam/CAES Cycle
Concept
Base
Reduce Petroleum Fuel
No Petroleum Fuel
No Petroleum Fuel
Arrangement
Separate
Steam Heated
Direct Heated
Advanced
Net Heat RateBtu/kk-hr
10,700
11,200
11,900
10,100
Petroleum Heat RateBtu/kW-hr
4,400
1,900
0
0
DIRECTION OF ADVANCED CONCEPTS STUDIES
The thrust of the advanced concepts/CAES work is to develop and evaluate existinginformation required to assist the DOE in deciding on which advanced concept or concepts topursue to the demonstration phase. The evaluation depends upon the results of technical andeconomic studies that have been done. Inputs for the evaluation have come and are expected tocome from all areas of the industry. Work by the CAES participants such as EPRI, UTRC, CEGB,TVA PEPCO, Acres American, PSI and Middle South Services, will be especially important to asound decision. Current planning calls for a recommendation by PNL to the DOE, on whichadvanced concepts should be considered for the demonstration phase, by the end of FY-1980. Adecision by the DOE on the recommendation may be made in FY-1981.
190

THE ECONOMICS OF THERMAL ENERGY STORAGE FOR COMPRESSEDAIR ENERGY STORAGE SYSTEMS
by
S.C. SchultePacific Northwest LaboratoryRichland, Washington 99352
ABSTRACT
The costs of compressed air energy storage (CAES) systems utilizing thermal energy storageare compared with the costs of conventional CAES systems and combustion gas turbine systems.Comparisons are made on the basis of system energy cost levelized over system operating lifetime(mills/kWh). The comparison was performed by Pacific Northwest Laboratory for the Department ofEnergy using information from reference studies by the Massachusetts Institute of Technology,Central Electricity Generating Board and Knutsen Research Services.
System energy costs were estimated using information from three reference CAES/thermalenergy storage studies, a recent PNL research effort, and the EPRI Technical Assessment Guide.Capital investment cost estimates and system operating requirements were obtained from thereference studies. Current turbine fuel and compression energy prices were obtained from a July1979 PNL research effort. Economic and financial input assumptions and a discounted cash flow-required revenue computational methodology were taken from the Technical Assessment Guide. Useof such a "normalization" procedure results in system energy cost estimates that are both real-istic and comparable.
Two principal conclusions resulted from the study. First, given today's fuel prices andthe expected fuel prices in the 1980's, conventional CAES systems yield lower energy cost esti-mates than combustion gas turbine systems. Second, thermal energy storage/adiabatic CAESsystems yield equivalent and, in some instances, slightly lower energy cost estimates thanconventional CAES systems while requiring considerably less turbine fuel oil.
INTRODUCTION
The cost of energy from COP1 dtitic 1 compressed air energy storage {CAES) systems is highly•dependent upon the cost of the curbine ruel oil used in this system. Due to the uncertainty andrapid escalation of fuel oil prices, this dependence upon fuel oil decreases the economic attrac-tiveness of conventional systems and increases the attractiveness of systems that require littleor no fuel.
The purpose of the study described in this paper was to assess the costs of one group ofalternative near term CAES system concepts that require little or no turbine fuel. These alter-native systems utilize thermal energy storage. In these systems, a thermal energy storagedevice is heated or charged using the heat of compression. Thermal energy is then stored foruse during the system's power generation cycle. During power generation, compressed air ispassed through the thermal energy storage device resulting in heating of the compressed air.The additional heat available from thermal energy storage replaces heat that in conventionalsystems would be generated by burning fuel oil. This substitution results in a decrease insystem fuel cost. If the decrease in fuel cost more than offsats increases in compressionenergy cost and thermal energy storage device cost, the net effect of utilizing thermal energystorage is to reduce system energy costs. Under these circumstances, CAES/thermal energy stor-age systems are economically more attractive than conventional CAES systems.
The measure of system cost or economic performance used in the comparison is system energycost levelized over the system's operating lifetime. The cost estimates are reported in 1979price levels in terms of mills/kWh.
The study was performed by Pacific Northwest Laboratory for the Division of Energy StorageSystems, the Department of Energy.
192

APPROACH
The approach taken to assess economic performance was to develop and compare alternativesystem levelized energy cost estimates. Estimates were developed for CAES systems utilizingthermal energy storage, conventional CAES systems, and combustion gas turbine systems. Assess-ments of economic performance were based on these energy cost estimates.
The procedure used to develop energy cost estimates is shown in Figure 1. It is importantto recognize that this paper is not reiterating the findings of the reference studies. Thestudy reported in this paper uses the reference studies as sources of input information only.In most instances, this study's energy cost estimates are different from the reference studyestimates. This results from the use of very current (July-August 1979) price information inthis study and outdated price information (pre-1979) in the reference studies.
SOURCE:
INPUT:
REFERENCESTUDIES
EPRITECHNICAL
ASSESSMENTGUIDE
CAPITAL INVESTMENT COST ESTMATESSVSTEM OPERATING REQUIREMENTS
JULY 1979FUEL AND COMPRESSION
ENERGY PRICES
RESULT:
FINANCIAL AND ECONOMICASSUMPTIONS
DISCOUNTED CASH FLOW-REQUIRED REVENUE METHODOLOGY
I
SYSTEM LEVELIZEDENERGY COST
ESTIMATES
FIGURE 1. Levelized Energy Cost Estimating Procedure
The reference studies are as follows:
Advanced Compressed Air Energy, Central Electricity Generating Board, March 1979.liminary Draft. ) U )
(Pre-
• Incremental Cost Analysis of Advanced Concept Compressed Air Energy Storage Systems,Knutsen Research Services, July 1979. (Preliminary Draft.)(•*)
lications,0
• Application and Design Studies of Compressed Air Energy Storage for Solar AMassachusetts Institute of Technology, February 1979. (Draft Final Report.
The type of consolidation/update study described in this paper is useful in two respects.First, such a study reports the results of different studies collectively. Credibility isenhanced when independently generated studies arrive at similar conclusions. Second, this typeof study provides for the updating of previously generated studies whose conclusions are invalidbecause they were based on now outdated input. Often, different yet valid conclusions can bedrawn from older studies that are reworked with current input. Both these reasons indicate theusefulness of a consolidation/update study to the compressed air energy storage developmentprogram.
SYSTEM DESCRIPTIONS
Four generic near term peaking system concepts were examined in this study. Two compressedair energy storage (CAES) systems utilizing thermal energy storage, one conventional fired CAES
193

system, and one combustion gas turbine system. The conventional CAES system and combustion gasturbine system were included in the analysis for comparative purposes. The four generic systemconcepts are as follows:
• CAES/One Stage TES/Hybrid• CAES/Two Stage TES/Adiabatic• Conventional CAES• Combustion Gas Turbine
Simplified system diagrams are shown in Figure 2 for the conventional CAES system concept, inFigure 3 for the one stage thermal energy storage/hybrid system concept, and in Figure 4 for thetwo stage thermal energy storage/adiabatic system concept. The one stage thermal energy stor-age/hybrid system utilizes thermal energy storage and is fired {i.e., requires fuel oil tooperate). The two stage thermal energy storage/adiabatic system operates adiabatically (i.e.,is not fired). The conventional CAES system does not use thermal energy storage and is fired.The reference conventional CAES system is assumed to be of second generation design.
AIR STORAGE
FIGURE 2. Conventional CAES FIGURE 3. CAES/One Stage TES/Hybrid
FIGURE 4. CAES/Two Stage TES/Adiabatic
System designs, operating requirements, and capital investment cost estimates were takenfrom the reference studies. This information was used as input to the calculation of levelizedenergy cost. This information is shown in Table 1.
194

TABLE 1. System Descriptions
• PNL SystemDesignation
ReferenceStudy
CEGB^2'
Knutsen^
Knutsen^3'
Knutsen^
MIT*1*
CEGB(2)
Knutsen^3'
Knutsen'3 '
ReferenceStudy SystemDesignation
A5-Hybrid
TES-1
TES-4
TES-3
Systems A-H
2nd GenerationBrown Boveri
Reference
GT
ECONOMIC ANALYSIS
FuelHeat Rate(Btu/kWh)
2,646
4,074
3,545—
--
4,085
4,416
14,000
Coefficient ofPerformance
(kWh Out/kUh In)
.95
1.31
1.13.65.70
1.20
1.45
—
CapitalInvestment
Cost(1979 $/kW)
304.
344.
355.
580.334.
266.
292.185.
CAES/One Stage TES/Hybrid
CAES/One Stage TES/Hybrid
CAES/One Stage TES/Hybrid
CAES/Two Stage TES/Adiabatic
CAES/Two Stage TES/Adiabatic
Conventional CAES
Conventional CAES
Combustion Gas Turbine
The computational methodology utilized to estimate levelized energy cost was taken fromthe EPRI Technical Assessment Guide.(4) Economic and financial input assumptions utilized inthe analysis were also taken from the Technical Assessment Guide. Turbine fuel prices andcompression energy cost estimates were developed specifically for this study by a PNL surveyeffort.(5,6)
Reference CAES system designs are based on. near term (pre-1985) design technology. Esti-mates reflect expected costs of commercial generating systems existing as part of a mature CAESeconomy (i.e., tenth plant built of a like technology). Estimates do not reflect costs forprototype or first of a kind systems. CAES systems are assumed to be owned and operated by aregulated electric utility company.
Three sets of input assumptions were used in the analysis. Base case assumptions reflectthe most realistic input assumptions. Sensitivity Case 1 assumptions consist of assumptionstypical of those used in previous year CAES/thermal energy storage studies. Sensitivity Case 2input assumptions represent input for a low capacity factor/1000 hour operation per year system.Assumptions are shown in Table 2. In the table, only those sensitivity case inputs that differfrom base case inputs are shown.
TABLE 2. Economic Assumptions
First Year of Plant OperationPlant Capacity FactorPlant LifetimeCost of CapitalFixed Charge RateCompression Energy Cost (1979)Turbine Fuel Cost (1979)General Inflation RateCapital Escalation RateOperating and Maintenance
Escalation RateCompression Energy Escalation
RateTurbine Fuel Escalation RateGas Turbine Technology
Base CaseHost RealisticAssumptions(July 1979)
1985.25 (8 Hr Discharge)
30 YrlOJS/Yr15X/Yr
15 Hills/kWh$5/106 Btu
6%/Yr6%/Yr
6%/Yr
7X/Yr8X/Yr
Near Term
Sensiti. ityCase 1
Year 1978Assumptions
20 Mills/kWh$3.33/106 Btu
7VYrAdvanced
SensitivityCase 2
Low CapacityFactor
Assumption
.12
195
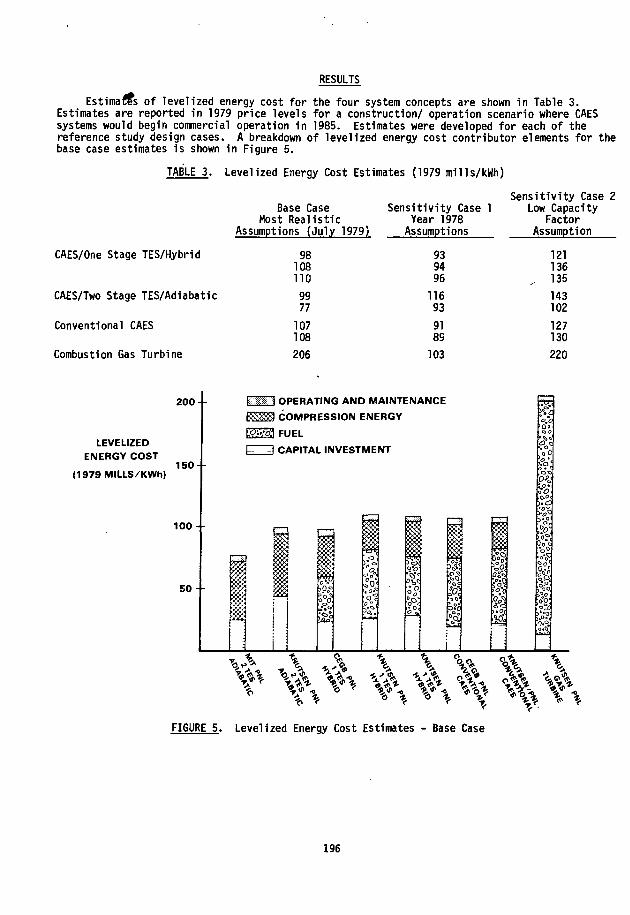
RESULTS
Estimates of levelized energy cost for the four system concepts are shown in Table 3.Estimates are reported in 1979 price levels for a construction/ operation scenario where CAESsystems would begin commercial operation in 1985. Estimates were developed for each of thereference study design cases. A breakdown of levelized energy cost contributor elements for thebase case estimates is shown in Figure 5.
TABLE 3. Levelized Energy Cost Estimates (1979 mills/kWh)
CAES/One Stage TES/Hybrid
CAES/Two Stage TES/Adiabatic
Conventional CAES
Combustion Gas Turbine
Base CaseMost Realistic
Assumptions (July 1979)
98108
no9977
107108
206
Sensitivity Case 1Year 1978
Assumptions
939496
116939189
103
Sensitivity Case 2Low Capacity
FactorAssumption
121136
„ 135
143102
127130220
LEVELIZEDENERGY COST
(1979 MILLS/KWh)
200 -
150
100 -
50
J i l l OPERATING AND MAINTENANCE
COMPRESSION ENERGY
CAPITAL INVESTMENT
FIGURE 5. Levelized Energy Cost Estimates - Base Case
196

CONCLUSIONS
A ranking of the economic performance of the four systems is shown in Table 4. Rankingswere based on levelized energy cos.t estimates.
TABLE 4. Ranking of Systems Based on Energy Cost Estimates
Sensitivity Case 2Base Case Sensitivity Case 1 Low Capacity
Most Realistic Year 1978 FactorAssumptions (July 1979) Assumptions Assumption
CAES/One Stage TES/Hybrid 2 2 1
CAES/Two Stage TES/Adiabatic 1 4 1
Conventional CAES 3 1 1
Combustion Gas Turbine 4 3 4
The most significant conclusion that can be made from examination of the rankings is thatrelative economic performance or ranking is very dependent upon turbine f\iel oil and compressionenergy price. System ranking differs significantly depending upon the set of price assumptionsutilized in the analysis. Base assumptions were developed from very current (July 1979) priceinformation. These inputs reflect recent increases and uncertainty in fuel oil prices. Sensi-tivity Case 1 input assumptions were developed to match assumptions used in reference studies.Recent price increases and uncertainty are not reflected in these earlier year study assumptions.Energy cost estimates for systems that burn fuel oil are very sensitive to input assumptions.Energy cost estimates for systems that burn little or no fuel are relatively insensitive toinput assumptions. Relative rankings of systems will vary depending upon the input assumptioncase utilized due to this difference in assumption sensitivity.
This study makes four conclusions with respect to the economic performance of compressedair energy storage (CAES) systems using thermal energy storage. These conclusions are asfollows:
• CAES system energy cost estimates are very sensitive to changes in fuel oil prices andcompression energy costs.
• CAES system energy cost estimates are less sensitive to changes in system capital invest-ment cost.
• CAES systems appear less costly than combustion gas turbine systems.
• Previous studies have reported that dramatic fuel oil price increases would make CAES/thermal energy storage systems cheaper than conventional CAES systems. Fuel oil priceshave increased dramatically. Adiabatic CAES systems using thermal energy storage nowappear slightly less costly than conventional CAES systems.
REFERENCES
1. G. T. Flynn and J. L. Nash-webber, Application and Design Studies of Compressed AirEnergy Storage for Solar Applications, Massachusetts Institute of Technology, Lexington,Massachusetts, February 1979. (Draft Final Report)
2. I. Glendenning, Advanced Compressed Air Energy, Central Electricity Generating Board, March-wood Engineering Laboratory, Southampton, SEZ, England, March 1979. (Preliminary Draft)
3. C. Knutsen, Incremental Cost Analysis of Advanced Concept Compressed Air Energy StorageSystems, Knutsen Research Services, Bothell, Washington, July 1979. (Preliminary Draft)
4. Technical Assessment Guide, Electric Power Research Institute, Palo Alto, California, EPRIPS-866-SR, June 1978.
197

5. P ia t t ' s OITgram Price Report, HcGraw H i l l Publishing Company, New York, New York.
MonthlJune~T
6. Monthly Energy Report, U.S. Department of Energy, Energy Information, DO£/EIA-0035/6(79),
198
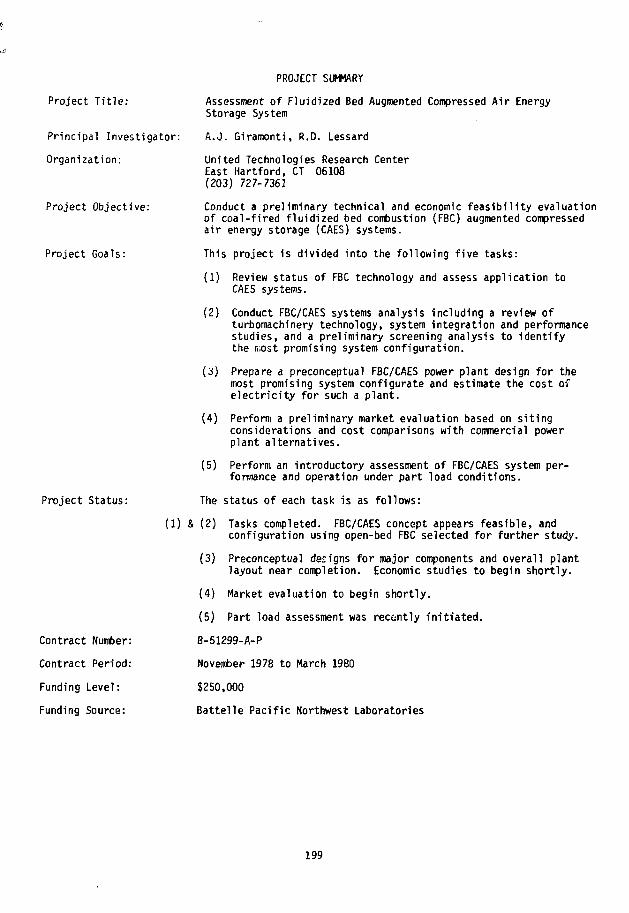
Project Title:
Principal Investigator:
Organization:
Project Objective:
Project Goals:
Project Status:
Contract Number:
Contract Period:
Funding Level:
Funding Source:
(1)
PROJECT SUMMARY
Assessment of Fluidized Bed Augmented Compressed Air EnergyStorage System
A.J. Giramonti, R.D. Lessard
United Technologies Research CenterEast Hartford, CT 06103(203) 727-7361
Conduct a preliminary technical and economic feasibility evaluationof coal-fired fluidized bed combustion (FBC) augmented compressedair energy storage (CAES) systems.
This project is divided into the following five tasks:
(1) Review status of FBC technology and assess application toCAES systems.
(2) Conduct FBC/CAES systems analysis including a review ofturbomachinery technology, system integration and performancestudies, and a preliminary screening analysis to identifythe most promising system configuration.
(3) Prepare a preconceptual FBC/CAES power plant design for themost promising system configurate and estimate the cost ofelectricity for such a plant.
(4) Perform a preliminary market evaluation based on sitingconsiderations and cost comparisons with commercial powerplant alternatives.
(5) Perform an introductory assessment of FBC/CAES system per-formance and operation under part load conditions.
The status of each task is as follows:
& (2) Tasks completed. FBC/CAES concept appears feasible, andconfiguration using open-bed FBC selected for further study.
(3) Preconceptual designs for major components and overall plantlayout near completion. Economic studies to begin shortly.
(4) Market evaluation to begin shortly.
(5) Part load assessment was recently initiated.
B-51299-A-P
November 1978 to March 1980
$250,000
Battelle Pacific Northwest Laboratories
199
PRELIMINARY EVALUATION OF COAL-FIREDFLUID BED COMBUSTION-AUGMENTED COMPRESSED AIR
ENERGY STORAGE POWER PLANTS
Albert J. GiramontiUnited Technologies Research CenterEast Hartford, Connecticut 06108
ABSTRACT
This paper presents the highlights of an ongoing program to assess the technical andeconomic feasibility of advanced concepts for generating peak-load electric power from acompressed air energy storage (CAES) power plant incorporating a coal-fired fluid bed combus-tor (FBC). Specifically, it reviews: the design and operating considerations involved withintegrating an atmospheric fluid bed combustor (AFBC) or a pressurized fluid bed combustor(PFBC) with a CAES system to yield practical system configurations; the integration of systemconfigurations; the parametric performance of these system configurations; and the preliminaryscreening which considered performance, cost, and technical risk and which led to the identi-fication of an open-bed PFBC/CAES system as having the greatest near-term commercializationpotential.
INTRODUCTION
An energy storage system which could be attractive for future electric utility peak-powerapplications is a modified gas turbine power system utilizing underground storage of veryhigh pressure compressed air. In the compressed air energy storage (CAES) concept (1),synchronous gear clutches would be used to uncouple the compressor and turbine so that theycould operate during different time intervals. During low-load, off-peak periods the com-pressed air would be withdrawn from storage, mixed with fuel, burned, and expanded throughthe turbine to generate power. One such system using petroleum fuel is currently in operationin West Germany (2), and others of this type are deemed likely in the foreseeable future.
A potential long-term weakness of the CAES concept, as presently implemented, is itsreliance on petroleum fuels during the power generation mode. It is appropriate, therefore,to investigate advanced CAES concepts designed to substitute a domestically more abundantfuel, such as coal, for petroleum. Direct combustion of pulverized coal in gas turbines wasattempted in the 1950's but proved unsuccessful because of problems with ash slagging,erosion, and corrosion associated with high combustion temperatures (3). An improvedapproach to coal combustion utilizing fluid bed combustors (FBC), offers the promise ofsolving some of these problems by permitting the combustion process to take place at lowtemperature.
Application of a FBC to the CAES concept creates the potential for a large number ofpossible FBC/CAES power plant system configurations incorporating atmospheric fluid bedcombustors (AFBC) or pressurized fluid bed combustors (PFBC). In principle, all of theseconfigurations would use a coal-fired FBC to replace the petroleum-fired burner. A verysimplified schematic representing possible PFBC and AFBC/CAES system configurations is shownin Fig. 1. If a PFBC were used, high-pressure air could be fed into the combustor. The
200

combustion gases from the PFBC would then be cleansed and expanded through the turbine.Another possible approach (not shown in Fig. 1) would be to split the airflow prior to thePFBC feeding a portion of the high-pressure air through heat transfer tubes immersed in thebed and the remaining portion into the combustor. The combustion gases would then be cleansedi\nd mixed with the clean heated air prior to expansion. If an AFBC were used, high-pressureair would be heated in tubes immersed in the bed and then expanded through the turbine. Theturbine exhaust air would then be fed into the combustor to provide the combustion air. Thecombustion gases from an AFBC are at atmospheric pressure and could not be mixed with theheated air, as in the PFBC, but would be directed to the stack after transferring its thermalenergy to the high pressure air (not shown in Fig. 1).
The purpose of this paper is to review the analysis performed to select a F8C/ CAES•system configuration which has the potential for attractive performance and cost characteris-tics combined with near-term commercialization potential. The study program on which thispaper is based is being supported by the Batte!le Pacific Northwest Laboratory under Sub-contract No. B-51299-A-P as part of thair Contract No. EY-76-C-O6-183O with the Department ofEnergy.
INTEGRATION CONSIDERATIONS
Integrating the fluid bed combustor, gas turbine, air storage and heat transfer equipmentinto an efficient, uncomplicated, and inexpensive power plant requires an appreciation of theoperational and design limitations associated with each of these major subsystems to ensurecompatability among them. In previous years, conceptual design studies of petroleum-firedCAES power plant systems have been conducted by several organizations (4, 5, and 6). Inthese studies considerable effort was expended to ensure that compatability does exist amongthe gas turbine, air storage, and heat transfer equipment. By effectively using the resultsfrom these studies attention can be focused upon the novel feature of the FBC/CAES powerplant system, i.e., the substutition of a coal-fired FBC for the petroleum-fired combustor.
BED EXIT TEMPERATURE
The operating conditions which can be expected from both the FBC and CAES turbomachineryare significantly influenced by their designs. In an earlier publication (7), the designtechnologies associated with both these subsystems were reviewed. From that review it can bestated that the most critical operating condition is the bed exit temperature, because theturbine inlet temperature is dependent on the bed temperature and the means chosen to transferthe thermal energy from the bed to the expansion gas.
The choice of bed temperature is influenced by many considerations, the most importantof which are achieving a high combustion efficiency, avoiding ash sintering, maximizingsulfur retention, obtaining high heat transfer rates to in-bed t s, limiting the temperatureof heat transfer surfaces in the bed, and reducing emissions of alkali metal salts. Weighingthese sometimes opposing considerations results in an indication that the bed operatingtemperature should be maintained within the range of 775 to 900 C (1425 to 1650 F) with 850 C(1560 F) being a representative value.
If an open-bed PFBC were used in the CAES power plant and the combustion gases expandedin the gas turbine after particulate cleanup, then the turbine inlet temperature would atmost be equal to the bed temperature (Fig. 2a). Turbine inlet temperatures of this magnitude
201

are characteristic of operating conditions used two decades ago and would not produce themaximum performance potential from current gas turbines that operate at temperatures around1095 C (2000 F). The reduced temperatures would, however, tend to inhibit potential erosionand corrosion resulting from participates and alkalies entrained in the hot gases.
If an AFBC or a PFBC with tubes immersed in the bed were used in the CAES power plant,then the turbine inlet temperature might be limited to 550 C (1020 F) for near-term applica-tions. The air in immersed tubes is constrained to this temperature despite the higher bedtemperature by a concern for the integrity of tube metal which, while being required tocontain pressurized air, is being subjected to a high-temperature corrosive environment inthe fluid bed. By maintaining the air temperature below 550 C {1020 F), it is possibleto keep the outside tube metal temperature below a level (650 C (1200 F)) which can beconsidered to be within the corrosion limit of current commercially available materials.Obviously, maintaining the expansion air temperature at this level severely restricts thenumber of viable system configurations which could be considered because of the reducedperformance that would be associated with a turbine inlet temperature of this magnitude.
For an AFBC, one approach around this limitation would be to place convection heatexchanger surface in the freeboard above the bed where it is possible for gas temperatures toreach 1000 C (1830 F) due to combustion in the freeboard (Fig. 2b). Since the corrosiveenvironment in the freeboard is much less severe than in the bed due to the absence of thesulfur acceptor, the outside metal temperature of the convective heat exchanger tubes canapproach 800 C (1470 F) for commercial alloys. Accordingly, the exit air temperature couldbe as high as 750 C (1380 F).
For a PFBC with tubes immersed in the bed, the turbine inlet air temperature can exceedthe maximum immersed tube air temperature of 550 C (1020 F) because the combustion gases at850 C (1560 F) are mixed with the tube exit air prior to the turbine. However, this mixingwill result in the turbine inlet temperature being at some level below the bed temperature.
BED PRESSURE AND FLUIDIZING VELOCITY
Bed pressure and fluidizing velocity are also important operating parameters. Theselection of operating pressure will influence combustion efficiency, sulfur retention,nitrogen oxides emission, and capital cost. Operation at elevated pressure (PFBC) willproduce beneficial results for all of these parameters as opposed to operation at atmosphericpressure (AFBC). The fluidizing velocity must be controlled within fairly narrow limits,i.e., 0.75 to 1.4 m/s (2.5 to 4.5 ft/sec) for a PFBC and 0.75 to 2.5 m/s (2.5 to 8 ft/sec)for m AFBC. Operation within this range will establish good bed fluidization, providesufficient oxygen for combustion, and limit elutriation of bed particles.
Both pressure and velocity significantly affect combustor capital cost. The size of theFBC is reduced with increasing pressure and fluidizing velocity because the mass flow rateincreases, thereby increasing the power output per unit bed area. This effect is graphicallyillustrated in Fig. 3.
SYSTEM CONFIGURATIONS
The FBC/CAES system integration incorporated, the system design philosophy used by UTRCin previous studies (4, 6, and 8) wherein the turbomachinery contains both low- and high-pressure components. In such a system the low-pressure compressor is used to raise the air
202

to an intermediate-pressure level (typically 16 bar (atm)), after which the booster compressoris used to increase the pressure to a level compatible with the storage reservoir pressure(typically 40 to 80 bar (atm), with 66 bar (atm) 'jsed in this study). The high-pressureexpansion turbine and low-pressure turbine perform the reverse role. Using this systemdesign philosophy as a basis, it is then possible to introduce the key components associatedwith the fluid bed combustor and turbomachinery which might be unique to a specific FBC/CAESapplication.
Several FBC/CAES system configurations were studied; some of the more promising arediscussed here. The compression system was unchanged among these configurations; consequently,the only variations in the system configurations are in the manner in which the stored airwould be heated and expanded.
PFBC/CAES SYSTEM CONFIGURATIONS
In the open-bed PFBC/CAES configuration (Fig. 4), air from the recuperator at approxi-mately 60 bar (atm) would be expanded through the expansion turbine and used for combustionin an intermediate-pressure (16 bar (atm)) open-bed PFBC. The gases would then be expandedto almost atmospheric pressure in the low-pressure turbine and cooled in the recuperator. Thetemperature into the expansion turbine would be relatively low, thus, leading to relativelylow power output. To increase the power output from the expansion turbine, other systemconfigurations were investigated which would increase the temperature into the expansionturbine.
One approach would be to utilize a very high pressure (VHP) PFBC operating at about 60bar (atm). Air from the recuperator would be used for combustion in the VHP PFBC (Fig. 5),expanded in the expansion turbine, and then used for further combustion in the intermediate-pressure PFBC. The twice combusted gas would then be expanded in the low-pressure turbine.This system exhibited the best performance of all the FBC/CAES systems that were studied.
Another approach to increase the temperature into the expansion turbine and, thus,increase the expansion turbine output would be to put in-bed air heater tubes in the PFBC.High-pressure air from the recuperator would pass through tubes in an intermediate-pressurePFBC (Fig. 6). The air would be heated to 550 C (1020 F) and then expanded through theexpansion turbine. The air would then be used for combustion in the PFBC and expandedthrough the low-pressure turbine. The air temperature exiting from the in-bed tubes would belimited to 550 C (1020 F) because of the corrosion problems identified previously.
AFBC/CAES SYSTEM CONFIGURATIONS
The use of an AFBC would do away with the potential problems of turbomachinery materialcorrosion and erosion because only clean air would be expanded through the turbines. Severalbasic AFBC/CAES system configurations were studied, all of which used immersed tubes in thebed and external convective heat exchangers using energy in the hot AFBC exhaust gases. Oneof these configurations is depicted in Fig. 7. Air from storage would be preheated inthe recuperator, heated to 550C (1020F) in tubes placed within the bed, and then furtherheated in the convective heat exchanger prior to expansion. The hot AFBC combustion gases(at 1000 C (1830 F); would be used to heat the expansion and low-pressure turbine inlet airand reheat the combustion air going to the AFBC. The combustion gases are then mixed with
203

the low-pressure turbine exhaust air which was not used for combustion. The resultingmixture is passed throuqh the recuperator to preheat the air from storage.
Both counterflow and parallel flow heat exchangers were investigated with the objectiveof obtaining as high a temperature as possible into the turbines while limiting the averageheat exchanger metal temperature to 800 C (1472 F). The counterflow arrangements are capableof heating the turbine air up to about 740 C (1370 F), but they would require a maximum metaltemperature around 870 C (1600 F). In the parallel flow arrangement a pinch condition wouldlimit the maximum air and metal temperatures to about 690 C (1270 F) and 715 C (1320 F),respectively.
PARAMETRIC PERFORMANCE
The level of performance that a CAES power plant could achieve depends greatly on thesystem operating conditions and component performance characteristics selected. The pertinentcomponent values for the F8C and turbomachinery were estimated for use in the performanceanalysis. Operating and performance characteristics for the remaining CAES equipment werebased on previous studies conducted by UTRC (Refs. 4, 6, and 8). The more important parametersare identified in Table I, and the performance results are summarized in Table II.
PFBC/CAES SYSTEMS
Four sets of operating conditions were simulated for the open-bed system configurationdepicted in Fig. 4. First, the range of operating pressure which could be expected fromcurrent PFBC technology and which could be applied to the intermediate-pressure PFBC in anear-term CAES application, i.e., 10 to 15 bar (atm), was bracketed. Next, the effect onperformance of an evolution in technology was simulated; first, by increasing bed temperature50 C (90 F) above existing temperatures to 900 C (1650 F), then by increasing the bed pres-sure to 20 bar (atm) from 15 bar (atm) along with the elevated temperature of 900 C (1650 F).In reviewing both the output power and round trip heat rate resulting from this exercise, itcan be seen that the increase in bed temperature produced a more marked improvement inperformance than did the increase in bed pressure.
As noted before, the system configuration of Fig. 5 with a very high-pressure open bedPFBC produced very attractive performance characteristics. Two sets of operating conditionswere investigated for the intermediate-pressure PFBC representative of near-term technology(15 bar, 850 C (15 atm 1560 F)) and slightly advanced technology (20 bar, 900 C (20 atm, 1650C)). The bed temperature for the VHP PFBC was taken to be the same as for the intermediate-pressure PFBC, while the bed pressure corresponded to the air pressure at the exit ofthe recuperator (58 bar (atm)).
The system configuration of Fig. 6 with immersed tubes was the most extensively investi-gated system configuration, with seven sets of operating conditions simulated. Five of theseseven sets were used to bracket the current technology bed operating condition of 850 C (1560F) and 15 bar (atm). First, it was bracketed by bed pressure, 10 bar (atm) and 20 bar (atm)then it was bracketed by bed temperature, 775 C (1420 F) and 900 C (1650 F). An effectsimilar to that observed for the simple open bed resulted; i.e., a variation in bed tempera-ture produced more significant improvements in performance than variations in bed pressure.
204

To evaluate the effect that air storage pressure would have on systen performance,the storage pressure was alternately increased then decreased by 20 percent. In viewing theperformance resulting from these two simulations, it can be seen that increased storagepressure leads to increased power at the expense of a slight increase in heat rate. Theresults of this exercise could also be used to approximate the performance that could beexpected in constant volume or porous media storage reservoirs wherein the pressure duringcompression and generation would vary over a similar range ( 6 ) . It can be shown that theperformance of a variable pressure air storage system would be comparable to that obtainedfrom a constant pressure air storage reservoir when the constant air storage pressure isequal to the average pressure of the variable pressure reservoir.
AFBC/CAES SYSTEMS
Three sets of operating conditions were simulated for the AFBC/CAES system configurationof Fig. 7. The first two simulations provided for counterflow heat exchangers in the convec-tive zone above the free-broad, and the last provided for a parallel flow heat exchanger. Inthe first of the counterflow simulations, the expansion turbine air bypassed the convectiveheat exchangers. Consequently, the expansion turbine inlet temperature reflected the immersedtube air exit temperature of 550 C (1022 F). In the second of the counterflow simulations,the expansion turbine air did pass through the heat exchanger where it was heated to 740 C(1370 F). For the parallel flow simulation, the expansion turbine air also passed throughthe heat exchanger where it was heated to 690 C (1270 F).
The counterflow simulations produced the better performance results because of thehijher turbine inlet conditions. Of the two counterflow configurations, the second one inwhich both the expansion and low turbine inlet air streams were heated to the maximum tempera-tu-e produced the better performance. However, the maximum metel temperature would be muchlower in the parallel flow arrangement.
PRELIMINARY SCREENING ANALYSIS
The objective of the screening analysis was to identify the FBC/CAES system that has thegreatest potential for near-term commercialization and also has attractive performance, lowcost, and low technical risk. The performance results are covered in the previous section;cost and risk characteristics are presented below.
COST CHARACTERIZATION
Cost characterizations were estimated for each of the major subsystems of the FBC/CAESsystem: the fluid bed combustor, the heat transfer equipment, and the CAES aboveground andunderground equipment. To these direct costs were added approximations for the indirect,owning, and operating costs. The cost values used in this analysis are preliminary innature, but they are internally consistent and suitable for comparison purposes within theguidelines of the current effort. The relative cost rankings are given in Table III.
RISK ASSESSMENT
A major concern when investigating a novel power system is proper evaluation of therisks associated with its commercialization. Not only is there a technlogical risk in that
205
the power system may not meet performance expectations, but there is also an economic risk inthat the developer may not earn an acceptable return on his investment.
Areas in which R&D on fluid bed combustion is required include: coal and sorbentfeeding, coal distribution, combustor design, hot gas cleanup, disposal of output solids,tube bundle design, load following and control, and regeneration of sorbent. The existenceof unknowns in these areas poses a potential risk to the commercialization of the FBC/CAESpower plant system concept. Obviously, success in some areas is more vital to the conceptthen in other areas. For the open-bed PFBC/CAES system, hot gas clean up is important. Forthe FBC/CAES systems with immersed tubes, tube bundle design and load following are important.Consequently, in assessing these systems greater weight was subjectively assigned to thoseareas.
Relatively little risk is associated with the turbomachinery in AFBC/CAES applications.However, areas in which R&D on turbomachinery for PFBC/CAES applications is required include:hot gas cleanup, participate erosion, corrosion, combined erosion/ corrosion, deposition,combined deposition/ erosion/corrosion, damage contro7 techniques, and alkali metal control.In this assessment, particulate erosion and alkali erosion received greatest weight.
Many of the corrosion concerns expressed about the turbomachinery are similar to thosefor the high-temperature convective heat exchangers. These concerns occur primarily for theAFBC systems because hot AFBC exhaust gases bathe the hot side of the convective heat ex-changers. Metal operating temperature, therefore, is an important risk consideration.
It should be noted that most of these risk areas are being addressed as part of anextensive DOE combined cycle development effort ( 9). However, the rapid cycling requirementfor CAES systems in peaking applications is significantly different from the intermediate-and base-load requirements of the combined cycle program. Accordingly, some of the load-following requirements of FBC/CAES systems require special attention.
The approach used in this study was to estimate the relative technical risks for each ofthe three key development areas discussed above — the FBC system, the turbomachinery and theheat exchangers. A subjective ranking system was used to represent the range from no risk(equipment commercially available) to high risk (design unknowns, R&D required). The resultof the risk evaluation is presented in Table III.
COMMERCIALIZATION
The discussion of technical risk, and its associated R&D requirements, leads directly tothe issue of commercialization. The term commercialization date, for the purpose of thisstudy, is defined as the earliest date at which both the buyer (electric utility) and theseller (equipment manufacturer) would agree to sign a contract based on standard commercialterms and conditions. Typically, the first date of commercial operation would follow thecontract signing by three to ten years,\depending on the time required to obtain the necessarypermits and construct the plant.
Estimates of the commercialization date are provided in Table IV for the FBC/CAESsystems considered. These estimates are based primarily on the development requirements ofFBC technology, which was judged to be the pacing item. These projections are consistentwith the degree of technical risk reflected in the risk analysis.
206
PBC/CAES SVSTEM SELECTION
The results of the FBC/CAES screening analysis are summarized in Table III. The openbed PFBC/CAES system was identified as an attractive candidate system. This is based mainlyon the relatively low risk for the PFBC design (no tubes in bed), the moderate costs, and therespectable round trip heat rates which this system exhibited. The open bed VHP PFBC/CAESsystem exhibits superior performance but has high risk. Consequently, this concept maybecome a future candidate once better design and costing data become available. The PFBC/CAESsystem with low-temperature air tubes is also an attractive candidate. Its cost and heatrate are lower than for the open-bed PFBC/CAES system; however, because of the tubes in thebed the risk is increased slightly. The AFBC/CAES system with low-temperature air tubes wasjudged to be questionable for commercial applications. This system would have low riskresulting from the lack of turbine corrosion/erosion problems, but it also has relativelyhigh cost and poor performance.
From the above, it is clear that both the PFBC/CAES-open bed and PFBC/CAES-immersedtube systems are attractive. The latter has lowest cost and heat rate, but it could notbecome commercial until about 1990. The former has lowest risk and could be commercializedshortly after 1985.
Based upon the potential for earlier commercialization, the PFBC/CAES-open bed systemconfiguration (Fig. 4) was selected for more detailtd evaluation. The bed operating condi-tions chosen for this system are 15 bar (atm) and 850 C (1560 F).
The recommended open bed system has several promising future growth options which tendto reduce costs and lower fuel consumption. Figure 8 graphically depicts two possibleevolutionary growth paths from the recommended open bed PFBC system. The upper path containsthe nearer term options. Without tubes in the bed, it should be a relatively easy matter toincrease bed temperature to 900 C (1650 F) and to increase bed pressure to 20 atmospheres.When the technology for very high pressure beds is developed, one could be added to thesystem to improve performance. The lower path involves placing tubes in the bed. First, lowtemperature tubes would be added with metal temperatures limited to about 650 C (1200 F).Eventually, high temperature tubes could be added where the metal temperature would approachthe bed temperature.
CONCLUDING REMARKS
The open bed PFBC/CAES system concept seems to be an attractive and logical near-termpower plant option. It has lew risk, early commercialization potential, and acceptableperformance and cost. Furthermore, this system has several growth versions promising lowercost and improved performance. This system is currently undergoing more extensive preconcep-tual design and analysis.
207

REFERENCES
1. Giramonti, A. J., Lessard, R. D. Blecher, W. A. and Smith, E. B., "Conceptual Design ofCompressed Air Energy Stage Electric Power Systems", Applied Energy, October 1978.
2. Herbst, C. M. Hoeffins, M. ana Stys, Z. S. "Huntorf 290 MW Air Storage System EnergyTransfer (ASSET) Plant Design, Construction and Commissioning", Proceedings of the 1978Compressed Air Energy Storage Symposium, Vol. 1, 1979.
3. Tabakoff, W., "Erosion Study in Turboitiachinery Affected by Coal and Ash Particles - PhaseI", University of Cincinnati Annual Progress Report FE-2465-5, 1978.
4. Giramonti, A. J., et al, "Preliminary Feasibility Evaluation of Compressed Air StoragePower System", United Technologies Research Center Report R76-952161-5, NTIS PB 259-281/4GI,December 1976.
5. Bush, J. B., et al: " Economic and Technical Feasibility Study of Compressed Air Storage",General Electric Company Report COD-2559-1, March 1976.
6. Hobson, M. J. Heath, E. G. Lessard, R. D. and w. A. Adent, " Feasibility of CAES inCalifornia", California Energy Resources Conservation and Development Commission Report500-002, May 1978.
7. Lessard, R. D., Giramonti, A. J. and R. L. Sadala, "Coal Fired Fluid Bid Compressed AirEnergy Storage Power Plants: A Preliminary Technical Assessment", Proceedings of the14th Intersociety Energy Conversion Engineering Conference, August 1979.
8. Davison, W. R. and Lessard, R. D. "Study of Selected Turbomachinery Components forCompressed Air Energy Storage Systems", United Technologies Research Center ReportR77-952923-5, November 1977.
9. Fiebus, H. et al, " Commercialization Strategy Report for Advanced Electric GenerationTechnologies", Department of Energy Report, T1D-28839, 1979.
208
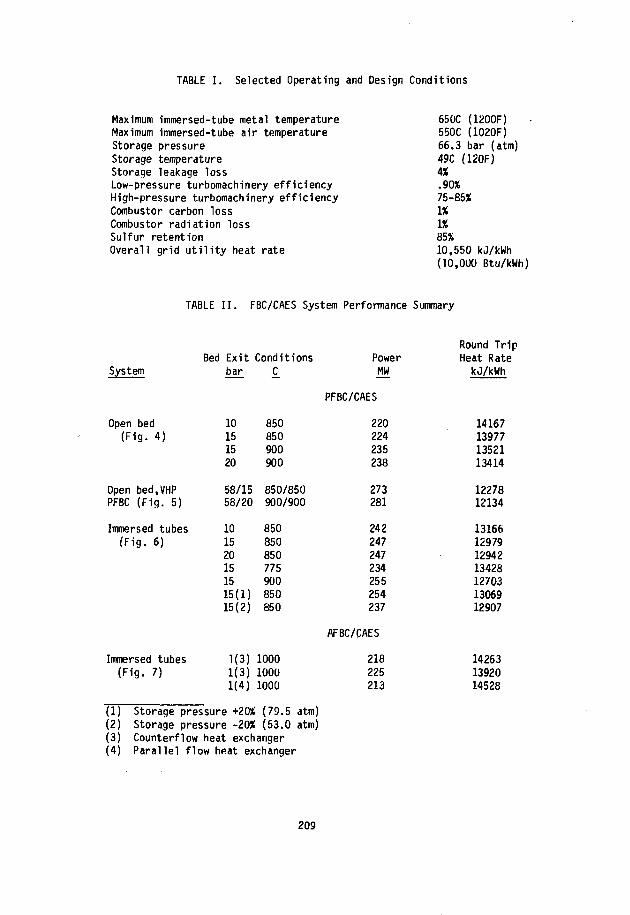
TABLE I. Selected Operating and Design Conditions
Maximum immersed-tube metal temperatureMaximum immersed-tube air temperatureStorage pressureStorage temperatureStorage leakage lossLow-pressure turbomachinery efficiencyHigh-pressure turbomachinery efficiencyCombustor carbon lossCombustor radiation lossSulfur retentionOverall grid utility heat rate
650C (1ZOOF)550C (1020F)66.3 bar (atm)49C (120F)4%.90%75-85*IX1%85%10,550 kJ/kWh(10,000 Btu/kWh)
TABLE II. FBC/CAES System Performance Summary
System
Open bed(Fig. 4)
Open bed,VHPPFBC (Fig. 5)
Immersed tubes(Fig. 6)
Immersed tubes(Fig. 7)
Bed Exitbar
10151520
58/1558/20
101520151515(1)15(2)
1(3)1(3)1(4)
ConditionsC
850850900900
850/850900/900
850850850775900850850
100010001000
PowerMw
PFBC/CAES
220224235238
273281
242247247234255254237
AFBC/CAES
218225213
Round TripHeat RatekJ/kWh
14167139771352113414
1227812134
13166129791294213428127031306912907
142631392014528
(1) Storage pressure +20% (79.5 atm)(2) Storage pressure -20% (53.0 atm)(3) Counterflow heat exchanger(4) Parallel flow heat exchanger
209

TABLE III. FBC/CAES Screening Analysis Results
System
PFBC/CAES-open bed
PFBC/CAES-open bed,VHP PFBC
PFBC/CAES-tubes
AFBC/CAES-tubes
H = highM = moderateL = low
Risk
L
H
M
L
Cost
M-L
?
L
H
Heat Rate
H-M
L
L
H
Prognosis
At t rac t i ve candidate
Future candidate
At t rac t i ve candidate
Questionable
TABLE IV. Commercialization Date Projections
System
PFBC/CAES-open bed
PFBC/CAES-open bed,VHP PFBC
PFBC/CAES-immersed tubes
AFBC/CAES-immersed tubes
Date
1985+
1995+
1990"
1985+
210
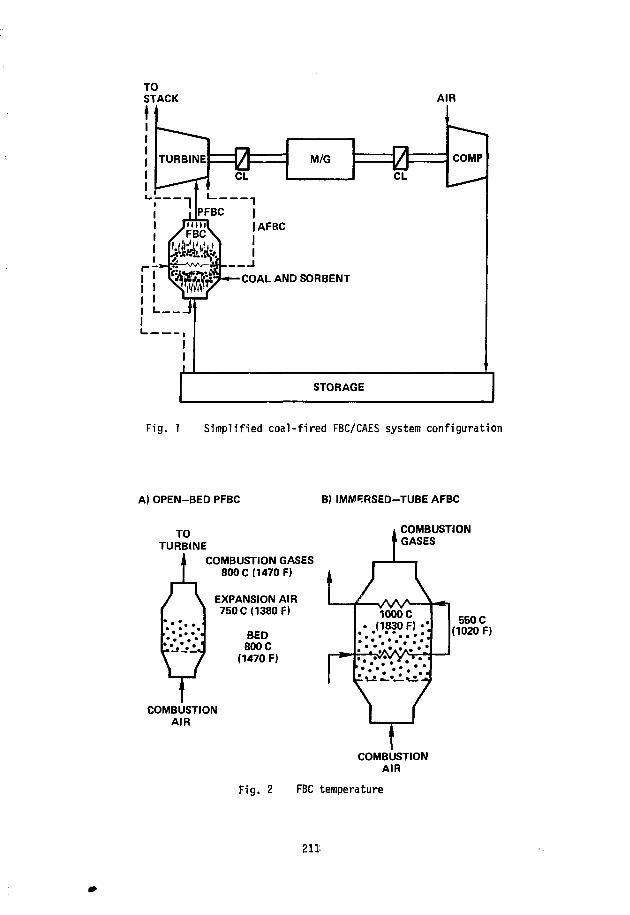
AIR
Fig. 1 Simplified coal-fired FBC/CAES system configuration
A) OPEN-BED PFBC B) IMMFRSED-TUBE AFBC
TOTURBINE
COMBUSTION GASES800 C (1470 F)
EXPANSION AIR750 C (1380 F)
BED800 C
(1470 F)
COMBUSTIONAIR
COMBUSTIONGASES
550 C(1020 F)
COMBUSTIONAIR
Fig. 2 FBC temperature
211:

oUJ
0.5 -
0.2 I
50
15 BAR (ATM)
8 BAR(ATM)
1 BAR(ATM)
I I
20
1 2 3
FLUIDIZING VELOCITY (M/S)
u .I
oc
I
<UJ
<
aHI
DO
Fig. 3 Effect of f l i i id iz ing velocity and operatingpressure on power flux
COMPRESSORTRAIN
TOSTACK
Fig. 4 Coal-fired PFBC/CAES system configuration with open bed
212

COMPRESSORTRAIN
TOSTACK
Fig. 5 Coal-fired PFBC/CAES.system configurationwith open beds and a very high-pressure PFBC
TURBINES
LT
COALA N D _SORBENT
PFBC
ET =0=
f FSEC
TOSTACK
CLM/G
CL
AIR-1
COMPRESSORTRAIN
IC IC IC
AC
COOLINGAIR
STORAGE
Fig. 6 Coal-fired PFBC/CAES system configuration with tubesimmersed in bed
213
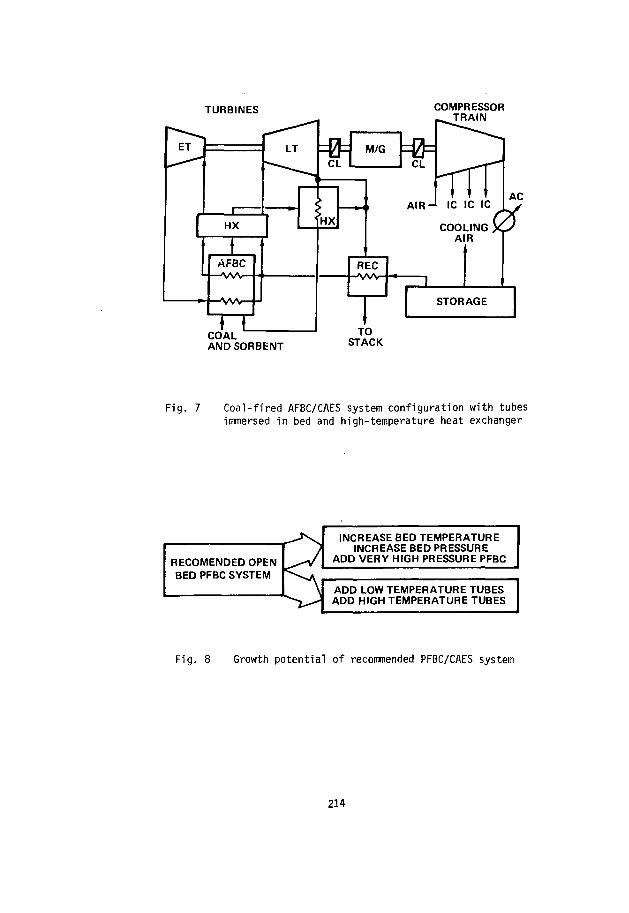
TURBINES COMPRESSORTRAIN
ANDSORBENTTO
STACK
Fig. 7 Coal-fired AFBC/CAES system configuration with tubesimmersed in bed and high-temperature heat exchanger
RECOMENDED OPENBED PFBC SYSTEM
INCREASE BED TEMPERATUREINCREASE BED PRESSURE
ADD VERY HIGH PRESSURE PFBC
ADD LOW TEMPERATURE TUBESADD HIGH TEMPERATURE TUBES
Fig. 8 Growth potent ia l of recommended PFBC/CAES system
214

SESSION 3: UNDERGROUND PUMPED HYDRO STORAGE
215

Project Title:
Principal Investigator:
Organization:
Project Goals:
Project Status:
Contract Number:
Contract Period:
Funding Level:
Funding Source:
PROJECT SUMMARY
"Evaluation of Reversible Pump/Turbines for Underground HydroelectricPumped Storage "Power Plants"
John R. Degnan
Allis-Chalmers CorporationHydro-Turbine DivisionP.O. Box 712York, Pennsylvania 17405(717) 792-3511
Generation of preliminary machine designs and corresponding hydraulicperformance for pump turbines with the following characteristics:
1. 350 megawatt single stage units for rated heat conditionsof 500, 750 and 1000 meters
2. 350 megawatt double stage units for rated heat conditionsof 1000 and 1500 meters
3. 350 and 500 megawatt multistage units for rated headconditions of 1000, 1250 and 1500 meters.
Project the cost for the various alternate machine designsdeveloped in order to generate parametric cost relations as afunction of head and power capacity.
It should be noted that this document addresses only the initialtwo phases of a large development project extending into 1982. Theproject is concerned with not only the conceptual development ofmechanical and hydraulic designs but actual model testing at proto-type heads.
The project's first phase was completed and reported during 1978.The second phase is in progress with extensive work being done todevelop the multistage concept. Preliminary designs are completeand are currently being analyzed so that the designs can be finalized.
31-109-38-5078
Phase II - May 25, 1979 - September 30, 1979
$132K
Argonne National Laboratory
217
COMPARISON OF SINGLE, DOUBLE AND MULTISTAGE PUMP/TURBINE EQUIPMENTFOR UNDERGROUND PUMPED STORAGE SERVICE
John DegnanAllis-Chalmers CorporationHydro-Turbine Division
Box 712York, Pennsylvania 17045
ABSTRACT
This, paper attempts to summarize the significant design considerations found during thedevelopment of single, double and multistage reversible hydro machinery for the Under-ground Pumped Hydro Storage project (UPHS) currently funded through the U.S. Departmentof Energy (D.O.E.). This year's study involves the following major objectives:
1. Complement the 500 MW Pump/Turbine equipment developed last year for UPHS with 350MW machinery.
2. In addition, develop efficient multistage pump/turbine designs for the operatingconditions used in the designing of all the Allis-Chalmers single and double stagemachinery for UPHS so far.
3. Establish parametric relations for the cost of reversible hydro machinery as afunction of head, capacity and number of stages.
Examples of the preliminary designs for the different staged machines are included inthis paper. Special design considerations and conclusions as to the feasibility andlimitations of each type of marine are drawn according to their expected cost, mechan-ical and hydraulic considerations.
INTRODUCTION
The D.O.E. continued to fund the UPHS program in 1979 in order to extend the designknowledge and cost data developed during the first phase of the program in 1978. Withregard to the reversible hydro machinery, the following development work has been re-ported or is in progress:
350 MW single stage pump/turbines were developed for rated head conditions of500, 750 and 1000 M complementing the larger 500 MW units as documented in(1).
350 MW double stage pump/turbines have been designed for rated head conditionsof 1000 and 1500 M. These units have been developed according to designcriteria consistent with the previously designed double stage units describedin (2).
Development of the multistage concept as it applies to pump/turbine technologyis required in order to accommodate a growing demand for higher and higherhead conditions. 350 and 500 MW nongated reversible multistage pump/turbinesare being developed to accommodate base loads at rated heads of 1000, 1250 and1500 M.
These designs will provide additional engineering and manufacturing cost data in theprescribed head range while allowing for direct comparison with the gate regulateddouble stage units as they relate to hydraulic performance, mechanical design, associ-ated powerhouse requirements, etc.
218

SINGLE STAGE PUMP/TURBINES
MECHANICAL DESIGN
Fig. 1 exemplifies the single stage concept by showing the 500 M nominal head, 350 MWmachine distributor section. Fig. 2 shows some design variations required to accommo-date the smaller machine configuration of the 1000 M, 350 MW pump/turbine. Note, forinstance, the different gate bushing designs. Due to the small size of the latter unit,it is impossible to access the inside of the headcover for gate placement and removal.The 1000 M machine is therefore equipped with the special bearing cartridge serving bothupper journal bearings as well as providing thrust restraint against the upper collar.The special bearing cartridge is inserted and secured to the top headcover deck from thepit area rather than from inside the. headcover.
Also note that the 1000 M machine requires an outside gate operating linkage again dueto the relatively small machine size. The more conventional inside linkage can fit intothe larger 500 M machine. The main disadvantage of the outside linkage arrangement isthat it requires a more complex servomotor anchorage into the powerhouse as well as amore expensive pit liner. In spite of this, it is a proven alternative means of gateregulation when the machine size cannot accommodate the conventional linkage arrange-ment.
The remaining machine components have been sized according to criteria consistent withthe 500 MW machines described in (1). The reader may consult the reports and paperslisted in the references for details concerning the machine designs.
F I G . 1 - UNajXRCUNO HIGH ItAD Pit OBJECT-AIKONNE NiTLL*B-SCO METERS
219

HYDRAULIC PERFORMANCE
One of the most important parameters characterizing a hydraulic machine is its specificspeed. In general, for high head pumping an upper limit in the selection of specificspeed can be placed by consideration of the losses attributable to flow in the watercasing. This is because at higher specific speeds casing losses have the strongestinfluence on efficiency. One of the most important parameters characterizing a hydrau-lic machine is its specific speed. In general, for high head pumping a lower specificspeed must be selected relative to the peak efficiency point, however, a lower limitmust also exist since losses associated with disk friction and leakage increase rapidlyat lower specific speeds. With the impeller and other mechanical losses relatively con-stant, these considerations leave a rather narrow band of specific speeds from which tochoose. A similar distribution of losses must be considered in the turbine mode inorder to decide the best specific speed with respect to hydraulic performance. Thereare advantages to choosing the highest feasible specific speed such as reduced unit andpossibly powerhouse size, reduced waterhaamer load and increased efficiency. An in-creased potential for cavitation accompanies these advantages, however, but the result-ing increase in submergence may or may not be a significant cost in a UPHS plant sincethis cost is indeed a small percentage of the overall excavation expenses necessary todevelop such a plant.
Related to the selection of specific speed is a problem of matching the prototype speedwith an available synchronous speed. This becomes increasingly difficult as the headrequirements increase since with the increasing head there are few available synchronousspeeds for a given power rating. Fig. 3 shows this. For a given head and unit capa-city, specific speed must therefore be adjusted to correspond to an available synchro-nous speed. With so few synchronous speeds available at high heads, there are manybenefits to be derived by close coordination between the customer and designer in se-lecting unit capacity for high head plants. Such coordination will aid in the selectionof a design that has an optimum balance of efficiency, speed, submergence and size.
For the high heads being considered in UPHS, the cavitation phenomena is an especiallyimportant design consideration. It is very important that impellers and other waterpassage obstructions be virtually free of imperfections or discontinuities which could
220

lead to cavitation bubble formation. During the design and production phases of such aplant, care should be taken to use cavitation resistant material such as A296 GR CA-6NMstainless steel and assure proper water passage finishes avoiding distortion of the asdesigned shapes. It should be noted here that as machine size decreases, difficulty inaccessing critical water passages to do the necessary surface finishing increases. Theassociated extra manufacturing costs must reflect this.Table 1 indicates characteristic parameters for the UPHS single stage pump/turbines.
Available H = 1000 mSynchronous u =0.51Speeds (60 Hz) KS = 16.03
1200.0 170900.0 300 I720.0 475 j600.0 675 i514.3 925450.0400.0360.0327.3300.0276.9257.1240.0225.0211.8200.0189.5180.0171.4163.6
FIG
P. =CJ =KS =
. 3 t
TABLE 1 Summary
Nominal Head, H (M)Rated Power (MW)Flow, Q (M**3/s)Speed, N (RPM)Runaway Speed (RPM)Pump Specific Speed,
N (q,p)(Units = NQ **.5/H**.75;Expected Best Efficiencj
Pump (%)Turbine (%)
Shaft Diameter (M)Spiral Case Inlet
Diameter (M)Runner Outside
Diameter (M)Runner Pad Height (M)Number of Runner
BucketsNumber of Wicket
Gates
50035070400560
31.
r93.92.1.
2.
4.0.
7
20
500 m H0.51 to11.34 K
225
275-7325 1,400 1475 7550650750 i
AVAILABLE
of Single
75035050600840
65 29
0 921 91067 0
362 1
796 3.435 0.
7
20
= 250 n= 0.72
3 = 11.
225250
35
"T300 |350375425475525575
POWER i
Stage
60
35927
810
874325
iII
AvailableSynchronousSpeed(60 Hz)
SELECTIONS
156150.144.138.133.128.124.120.116.112.109.105.102.100.94.92.90.87.85.83.
(MW)
50053610151990730877
Design Parameters
1000350349001260
29.
91.90.0.
1.
3.0.
7
20
51
34813
442
003262
500500100327458
30.95
92.692.41.270
2.718
5.8180.488
7
20
H =w =
1 =
75050070514720
30
92911
2
40
7
10
250 m0.7211.35
625 I675 1725 f800
.02
.3
.8
.118
007
507352
H =0! =
g
1000500527201008
29
91900
1.
3.0.
7
20
125 m1.01
= 11.34
240260280305325350375400430455 18485510540605635670705740775
2
79991
594
701274
221
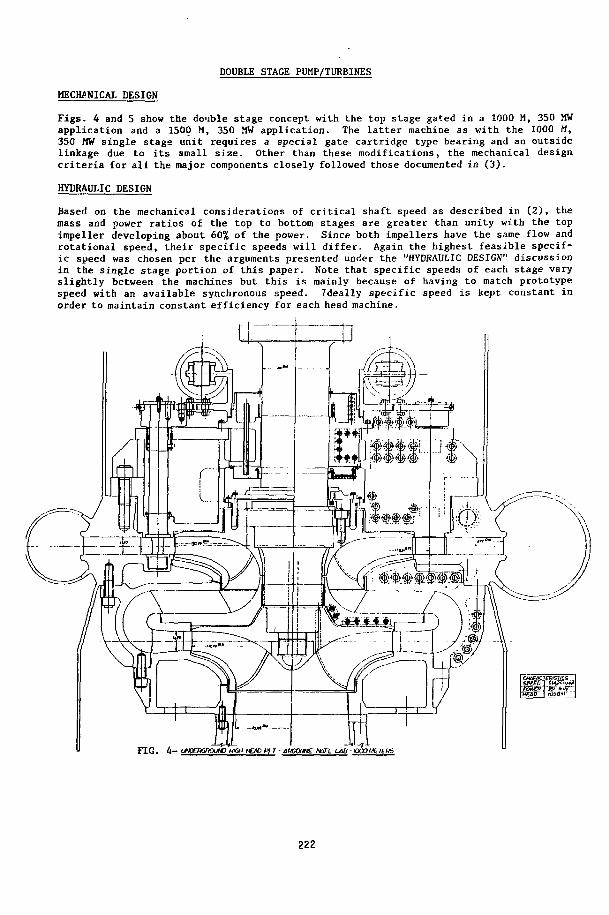
DOUBLE STAGE PUMP/TURBINES
MECHANICAL DESIGN
Figs. 4 and 5 show the double stage concept with the top stage gated in a 1000 M, 350 MWapplication and a 1500 M, 350 MW application. The latter machine as with the 1000 M,350 MW single stags unit requires a special gate cartridge type bearing and an outsidelinkage due to its small size. Other than these modifications, the mechanical designcriteria for all the major components closely followed those documented in (3).
HYDRAULIC DESIGN
Based on the mechanical considerations of critical shaft speed as described in (2), themass and power ratios of the top to bottom stages are greater than unity with the topimpeller developing about 60% of the power. Since both impellers have the same flow androtational speed, their specific speeds will differ. Again the highest feasible specif-ic speed was chosen per the arguments presented under the "HYDRAULIC DESIGN" discussionin the single stage portion of this paper. Note that specific speeds of each stage varyslightly between the machines but this is mainly because of having to match prototypespeed with an available synchronous speed. Ideally specific speed is kept constant inorder to maintain constant efficiency for each head machine.
F I G . 4 - UNDERGROUND HIGH HEM PIT- ARGONHE WT'l LAB -KXOME7ERS
222

FIG . 5 ~ H HEAP P / T-4PGQNNE NATL UIS-l3X> HCT&S
Table 2 indicates characteristic parameters for the UPHS double stage pump/turbines.
TABLE 2 Summary of Double Stage Design Parameters
Nominal Head, H (M)Rated Power (MW)Flow, Q (M**3/s)Speed, N (RPM)Pump Specific Speed, N (q,p)
Units = NQ **.5/H **.75TopBottom
Expected Best Efficiency (%)PumpTurbine
Shaft Diameter (M)Spiral Case Inlet Diameter
(M)Runner Outside Diameter (M)
TopBottom
Runner Pad Height (M)TopBottom
Number of Runner BucketsNumber of Wicket Gates
100035035.
514.
34.25.
91.90.1.
1.
4.3.
0.0.7
20
73
3635
01118
676
552993
286338
125035028.6720.0
36.4226.87
90.089.51.168
1.327
3.1852.680
0.2290.2677
20
150035023.
900.
36.26.
89.88.0.
1.
3.2.
0.0.7
20
80
2273
08927
219
195803
211249
100050051.450.
36.26.
91.90.1.
1.
4.3.
0.0.720
.50
164
00321
873
552830
318375
125050040.
600.
36.26.
90.89-1.
1.
3.3.
0.0.720
.8
.0
2574
05194
588
820216
269318
150050033720
3425
861
1.
3.2.
0.0.7
20
.6
.0
.43
.40
.0
.5
.118
.391
.474921
229274
223

MULTISTAGE PUMP/TURBINE
MECHANICAL DESIGN
350 and 500 MW machines are currently being designed at Allis-Chalmers for operationalheads of 1000, 1250 and 1500 meters. Theoretically these machines can be of a regulatedtype with all the stages independently gated or they can be designed as base load typemachines with no gates. Practically speaking, only the latter choice is feasible due tothe extreme complexity of independently governing the multiple stages not to mention therelated expenses, questionable reliability and potential maintenance problems. Actuallysome degree of load leveling can be realized with a power plant containing severalungated units by choosing to operate a selected number of the units according to theline demand. Fig. 6 shows the preliminary design of a 1500 M, 500 MW unregulated four-stage pump/turbine.
Given capacity and head parameters, the starting point to initiate such a design is tochoose the number of stages and specific speed. These will essentially set the machinesize and according, to the shafting system design, the fundamental critical speed can bedetermined. As in the double stage units described in (2), the lateral critical speedpresents the first major problem in the design process. The designer must decide anacceptable relationship between operational speeds and the critical speeds. The conven-tional single stage machines can be designed with the first critical a good 40% greaterthan the maximum runaway speed. This is the safest and most conservative approach andis used whenever possible to ensure avoidance of dynamic problems in the shafting system.In the design of double stage hydro machinery it is very difficult to satisfy thiscriteria without adding some type of intermediate lateral support or even a lower tur-bine guide bearing; however, with multistage equipment including 5 and 6 stages itbecomes unreasonable to adhere to such a conservative criteria even with the lowerturbine guide bearing. In attempting to satisfy this rigid design criteria on multi-stage hydro machine designs, the tendency is to progressively increase shafting systemstiffaess which probably increases the runner size and thus mass and machine cost. Theincreased runner mass substantially detracts from the positive effects on critical speedgiven by the increased shaft stiffness. Another ill effect is a resulting reducedmachine efficiency and increased potential for cavitation (6). Some multistage machin-ery, especially in the compressor industry, have been designed to operate between thefirst and second critical speeds with success. Some of these required special journalbearing designs in order to control half frequency whirl, a dynamic phenomena exhibitedby the shafting tending to whirl around its journal bearings at half the machine'srotational speed. This dynamic response associated with operational speeds above thecritical can cause serious damage to the bearings if left unchecked (7). A 5 stage
machine currently being developed at Allis-Chalmers employs special shoe type journalbearings whose wedge effect should alleviate this dynamic problem. The 4 stage machineshown in Fig. 6 has its critical speed 20% above the maximum runaway speed.
Design experience of multistage hydro machinery at heads approaching 1500 M is prac-tically nil. Only one multistage pump/turbine is currently operational: La Coche,France, with an 80 MW capacity and 940 M Head. High head pump design experience is pre-sently being researched in order to verify our preliminary designs. The followingpoints summarize the important design considerations in multistage pump/turbine devel-opment uncovered thus far:
Size and mass of the largest components with respect to the capacity limita-tions of both foundry and transportation facilities including the limitationsassociated with underground power plant handling devices.
High flow velocities and associated corrosive effects.
224

FIG- 6 - UNDERGROUND HIGH .HEAD P/T-ARGONNE NAT'l LAB-1500 METERS
225

Material selection to accommodate corrosion problems and highly stressedcomponents. Fig. 7 shows an axisymmetric finite element model of the 4 stageunit in order to assess the various components' stress levels.
Vibration and noise.
Critical speed of shafting system; bearing design and stiffness.
Design limitations of the electrical generator/motor as it relates to speedselection of the pump/turbine.
FIG. 7 4 STAGE PUMP TURBINE DISTRIBUTORSECTION-FINITE ANALYSIS
226

HYDRAULIC DESIGN
Specific speed selection for multistage pump/turbines are under the same restrictions asmentioned for the double and single stage machines except that the potential hazards dueto cavitation are less exaggerated. This is because the total machine head is distri-buted across a number of stages thus lowering the fluid velocities and allowing higheracceptable specific speeds. A related advantage in using multiple stages is that thesubmergence need not be as deep as in single and double stage equipment in order toinhibit cavitation. Actually mechanical and manufacturing considerations become moreand more a dominant consideration for specific speed selection as more stages are added.This is because specific speed has such a strong influence on machine size which direct-ly relates to the problems associated with critical speed and attaining and inspectingstringent water passage finishes. Another practical limitation in selection of specificspeed is the maximum allowable generator rotational speed. Currently, this limitingspeed appears to lie between 720 and 900 RPM.
Preliminary designs for the stationary water passage shapes have been determined as afunction of minimum head loss and the experience of multistage pump design. Certainlymechanical constraints of the stationary components also influence the water passageshape such as required stay vane strength, lower turbine guide bearing influence on thedraft tube design and perhaps most significantly, lateral shaft stiffness dictatingshaft diameter as it relates to the critical speed problem.
ECONOMICS
Engineering and manufacturing costs for the single and double stage hydro machinerypresented in this paper have been estimated and provide a data base from which gener-alized cost estimates can be made as a function of head, capacity and machine type. Theparametric relations are provided in Figs. 8 and 9. Note that the data has been normal-ized to a value which is, of course, dependent on the market at a given point in time.For the most part these relative cost values are sufficient in helping to choose theoptimum selection of equipment for a given installation. The multistage machine designsare not yet completed and therefore the cost data is incomplete at the time of thiswriting.
7.5 6.0 8.5 9.0-8.5 9.0 -9.5 10.0
FIG. 8 RELATIVE COST OF SINGLEPUMP TURBINES
FIG. 9 RELATIVE COST OF DOUBLE STAGEPUMP TURBINES
227

CONCLUSION
The well established single stage pump/turbine concept is the cheapest, Most efficient,•ost versatile and reliable solution for use in power plants; however, a head limitationof about 1000 H seens apparent today. The double stage concept with its top stageregulated is the next logical solution to accoModate increased head conditions. Theconcept has been developed with acceptable expected efficiencies and no Major obstaclesfor finalization. The operating conditions of these Machines are naturally less flex-ible due to the narrowing band of near peak efficiency when compared with single stagemachinery. Finally, the recent efforts being Made to develop a general Multistagepump/turbine concept seem to indicate that in spite of its inflexible allowed operatingconditions, it has the advantage of accommodating high heads at least twice those ofcurrent experience. This ability is an essential factor in considering the feasibilityof some UPHS sites. The accompanying price tag includes (6):
High equipment cost.
No per unit load regulation.
An expensive pump priming procedure requiring a "watered up" unit with arelatively large power demand of about 50% of the rated pump capacity. Anunwatered pump start with a single stage machine typically needs only about10% of its rated power.
Synchronous condensing is not possible without a Method to dewater the ma-chine .
REJJ tuCES
1. "Final Report Underground Pumped Storage Plant For Argonne National LaL ...itoryDevelopment - Task I-A", Allis-Chalmers, Hydro-Turbine Division, September, 1978.
2. "Final Report Underground Pumped Storage Plant For Argonne National LaboratoryDevelopment - Task I-B", Allis-Chalmers, Hydro-Turbine Division, September, 1978.
3. "Final Report Underground Pumped Storage Plant For Argonne National LaboratoryDevelopment - Task II-A, II-B", Allis-Chalmers, Hydro-Turbine Division, May 30,1979.
4. Degnan, J., "Evaluation of One and Two Stage High Head Pump/Turbine Design ForUnderground Power Stations", presented to the U.S. Department of Energy at theMechanical and Magnetic Energy Storage Technology Meeting, October, 1978.
5. Chacour, S. A.; Degnan, J. R.; LoSasso, D. M.; Webb, D. R.; "Design ConsiderationsFor a 1000 Meter Head, 500 Megawatt Single and Double Stage Reversible Pump/Tur-bine", presented at the ASME Spring Meeting, Niagara Falls, New York, June, 1979.
6. Rodrique, P., "The Selection of High Head Pump/Turbine Equipment For UndergroundPumped Hydro Energy Storage Application", presented at the ASME Spring Meeting,Niagara Falls, New York, June, 1979.
7. Pinkus, 0., "Experimental Investigation of Resonant Whip", Transactions of ASMESummer Meeting, July, 1956.
228
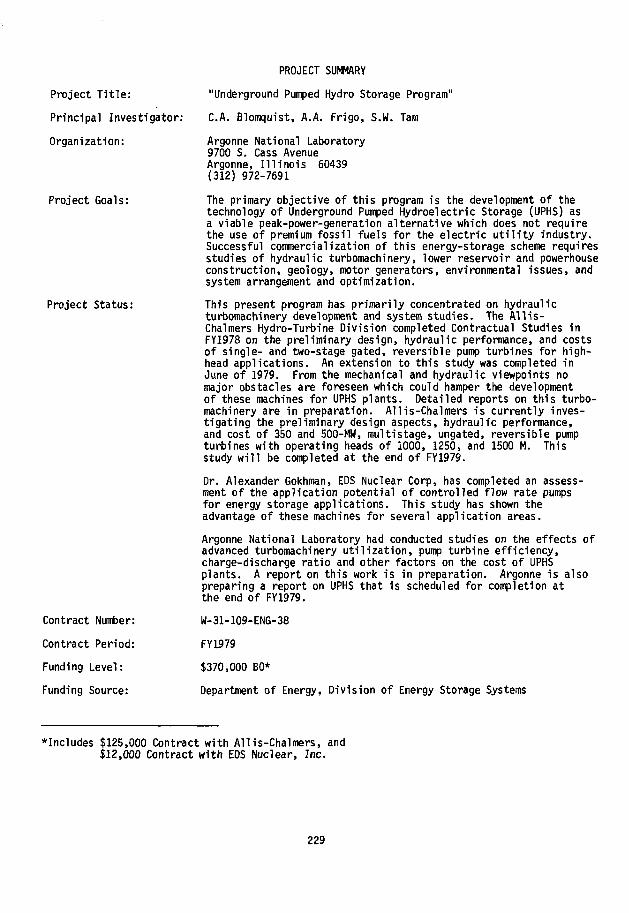
Project Title:
Principal Investigator:
Organization:
Project Goals:
Project Status:
Contract Number:
Contract Period:
Funding Level:
Funding Source:
PROJECT SUMMARY
"Underground Pumped Hydro Storage Program"
C.A. Blomquist, A.A. Frigo, S.W. Tam
Argonne National Laboratory9700 S. Cass AvenueArgonne, Illinois 60439(312) 972-7691
The primary objective of this program is the development of thetechnology of Underground Pumped Hydroelectric Storage (UPHS) asa viable peak-power-generation alternative which does not requirethe use of premium fossil fuels for the electric utility industry.Successful commercialization of this energy-storage scheme requiresstudies of hydraulic turbomachinery, lower reservoir and powerhouseconstruction, geology, motor generators, environmental issues, andsystem arrangement and optimization.
This present program has primarily concentrated on hydraulicturbomachinery development and system studies. The Allis-Chalmers Hydro-Turbine Division completed Contractual Studies inFY1978 on the preliminary design, hydraulic performance, and costsof single- and two-stage gated, reversible pump turbines for high-head applications. An extension to this study was completed inJune of 1979. From the mechanical and hydraulic viewpoints nomajor obstacles are foreseen which could hamper the developmentof these machines for UPHS plants. Detailed reports on this turbo-machinery are in preparation. Allis-Chalmers is currently inves-tigating the preliminary design aspects, hydraulic performance,and cost of 350 and 500-MW, multistage, ungated, reversible pumpturbines with operating heads of iOOO, 1250, and 1500 M. Thisstudy will be completed at the end of FY1979.
Dr. Alexander Gokhman, EDS Nuclear Corp, has completed an assess-ment of the application potential of controlled flow rate pumpsfor energy storage applications. This study has shown theadvantage of these machines for several application areas.
Argonne National Laboratory had conducted studies on the effects ofadvanced turbomachinery utilization, pump turbine efficiency,charge-discharge ratio and other factors on the cost of UPHSplants. A report on this work is in preparation. Argonne is alsopreparing a report on UPHS that is scheduled for completion atthe end of FY1979.
W-31-109-ENG-38
FY1979
$370,000 B0*
Department of Energy, Division of Energy Storage Systems
•Includes $125,000 Contract with Allis-Chalmers, and$12,000 Contract with EDS Nuclear, Inc.
229

TURBOMACHINERY CONSIDERATIONS FORUNDERGROUND PUMPED HYDROELECTRIC STORAGE PLANTS (UPHS)
S.W. Tam, A.A. Frigo and C.A. BiomquistArgonne National LaboratoryArgonne, Illinois 60439
ABSTRACT
UPHS plant costs for plants equipped with advanced reversible pumped turbines have beenconsidered. Equipment used includes single-and two-stage reversible pump turbines foroperating heads from 500 to 1500 m. The effects of machinery costs, operating heads, plantconfigurations and sizes have been taken into account. The results indicate that the use ofadvanced machinery seems to push the minimum UPHS plant cost to heads greater than 1500 m.The employment of advanced reversible pump turbines seems to be economically attractive. It isshown that pump-turbine efficiencies and the so-called charge/discharge ratio are very impor-tant design parameters for UPHS applications and the interactive effects of these parametershave been analysed. The results show that under certain conditions a pump-turbine optionwith a higher charge/discharge ratio at the expense of somewhat lower operating efficiency canbe desirable.
1. INTRODUCTION
The application of UPHS for electric u t i l i t y peaking service is enhanced by the use ofrelatively high head (>1000 m) and large capacity (>350 MW) turbomachinery.1'7 These con-straints are presently not mutual. High-head but small capacity (<150 MW) turbomachinesare currently available as multistage reversible pump turbines or tandem units (Pelton-typewaterwheel and multistage storage pump). Large capacity Francis turbines are available forlow head operation, e.g., 700 MW @ 87-m head. Single-stage reversible pump turbines areunder construction for output powers of 315 MW at 625 m, and 508 MW at 384 m. Recent designstudies2 have shown the technical feasib i l i ty of advanced machinery such as 500-MW-capacity,single-stage, reversible pump turbines at a 1000-m head, and two-stage, gated, reversiblepump turbines with an operating head of 1500 m.
The choice of turbomachinery for UPHS plants rests ultimately on economic consider-ations. The results of preliminary cost analyses are discussed in this paper. The principalobjective is the comparison and contrasting of the costs associated with the ut i l izat ion ofstate-of-the-art pump turbines and those associated with advanced machinery.
Recently, UPHS plant costs have been estimated.3 The turbomachinery options chosen areeither state-of-the-art or a sl ight extension of currently available technology. A total ofseven different UPHS plant configurations was considered. The major plant characteristicstogether with the relevant cost information are l isted in Table 1. Major conclusions are:
(1) For a fixed plant size and type of machinery, the minimum plant cost ($/kW)seems to occur in the head range of 1200-1500 m.
(2) Multistage reversible units appear to be the most economical machineryoption.
(3) A plant capacity of 2000 MW represents the most economical plant size, wheninterest during construction and escalation are added.
In this work, advanced turbomachinery is considered for UPHS plant configurationssimilar to those shown in Table 1, thus providing a common basis for comparison. Civil engi-neering costs from Reference 3 (updated to Sept 78 dollars) have been ut i l i zed. The ad-vanced machinery considered includes single-stage, reversible pump turbines and two-stage,reversible pump turbines. These machines represent considerable extension to the state-of-the-art reversible pump-turbine technology. At present»single-stage, reversible, Francis-type pump turbines have been designed for operating heads as high as 625 m (Bajina BastaStation in Yugoslavia) and for power outputs up to about 500 MW (Bath County Plant in
230

Virginia, U.S.A.)- Theoretically, there are no maximum head limitations for these types ofmachines. However, manufacturers have acted cautiously in the development of higher-headand power-output equipment. Increases have occurred in small increments rather than inlarge jumps. At the present time, high-head technology for single-stage pump turbines forpower applications is actually lagging that for boiler feed pumps where multistage machinesdeveloping heads as high as 1150 m per stage have already been built and operated.
Preliminary engineering design and cost studies of higher-head and greater-output,single-stage, reversible, Francis-type pump turbines (SSRPT) have been conducted by Allis-Chalmers Hydro-Turbine Division for ANL.2 Three separate high-head machines have been investi-gated. The three units are designed to produce a power output of 500 MW while operating underheads of 500, 750, 1000 m respectively. (Table 2)
A similar design analysis has been carried out on two-stage reversible pump-turbines(TSRPT) with operating heads at 1000, 1250 and 1500 m (Table 3). At present, there are no knownoperating gated TSRPT. Performance characteristics2'" of these pump-turbineshave been utilized to investigate UPHS plant costs for plants equipped with such advancedturbomachinery. Major factors that have been considered include machinery costs, operatingheads, plant configurations and sizes. It turns out that pump-turbine efficiencies aswell as the so-called charge/discharge ratios of the machines are very important elements.The interacting effects of these factors will be analyzed.
2. UPHS COST ESTIMATES
2.1 MACHINERY COSTS
Using the cost data from the Allis-Chalmers'study, cost functions with operating headas a parameter were generated for both the single- and two-stage machines. The generalform of these functions is: cost = a(head)b, where a and b are constants. The cost dataand functions for the single- and two-stage machines are shown in Figs. 1 and 2. Over theapplicable head range, the data are reproduced with an error of less than 2%. These costfunctions are used in subsequent analyses.
Note that tfie cost per unit for both types of machines decreases as the operating headincreases. One major reason for this result is that the machine size becomes smaller asoperating head increases.1'7
The costs shown in Figs. 1 and 2 are Sept 78 values chosen to be consistent with costs ofall other components (such as civil engineering costs) considered in this study. Installationcosts of pump turbines are estimated to be 30% of the machinery cost, which is on the highside of such estimates.
2.2 THE EFFECT OF PLANT CONFIGURATION
There are two major UPHS plant configurations — the one-drop and the two-drop schemes.The one-drop scheme is similar to conventional pumped hydro storage except that the lowerreservoir is an underground cavern and the upper reservoir is at ground level. At present,for operating heads considered favorable for UPHS (>_ 1000 m ) , only multistage reversiblepump turbines or tandem units can be utilized for the one-drop scheme.1'7
The two-drop scheme has a small intermediate reservoir located halfway between theupper and lower reservoirs. Two powerhouses are located near the lower and intermediatereservoirs, respectively. This arrangement allows the use of turbomachinery with half thetotal operating head of the UPHS plant. Single-stage reversible machines for this headrange (500-600 m) are available.
Recent studies3 have indicated that the one-drop scheme with multistage units is themost economical choice. A simple estimate was made to determine the possible cost savingsif two-stage gated reversible pump turbines are used for the various UPHS plant configurations.The results are listed in Table 4 and indicate that the two-stage unit becomes increasinglyfavorable when compared to multistage, single-stage (two-drop scheme), and tandem units.Consequently, most of the subsequent cost comparisons will be made between two-stage and
231
multistage reversible pump turbines. However, other turbomachinery will be considered whenthe effects of efficiency are addressed.
2.3 THE EFFECT OF PLANT SIZE
The C.T. Main study3 indicated that the optimum UPHS plant capacity is approximately2000 MW when multistage, reversible pump turbines are installed. In order to determine ifoptimum capacity remains unchanged when two-stage machines are used, cost estimates weremade for a one-drop UPHS plant with a 1200-m head. Both 500-MW, and 350-MW, two-stage,reversible pump turbines were considered. The resultant percentage savings in plant costwhen compared to multistage machines are shown in Fig. 3. These savings are somewhat in-sensitive to plant size, which means that the selection of multistage or two-stage unitsdoes not affect the optimal size of a UPHS plant. Subsequently, all discussions are basedon a UPHS plant capacity of 2000 MW.
2.4 COST ESTIMATES FOR UPHS PLANTS
The results of the Main study3 indicate that multistage reversible units representthe most promising turbomachinery option. Therefore, this machine was chosen to be com-pared with the two-stage gated unit, which is the only advanced category machine designedto operate above 1000 m.
The cost ($/kW) for a 2000-MW UPHS plant similar to Scheme I in Table 1, but employingfour 500-MW, two-stage, reversible pump turbines as a function of operating head, is shown inFig. 4. For comparison purposes, the plant cost1* utilizing multistage units is also shown.The two-stage cost curve decreases rather rapidly with increasing head; however, the incre-mental change in the cost decreases as a 1500-m head is approached. If a minimum costexists, it is probably beyond a 1500-m head.
For heads above 1000 m, the two-stage reversible pump turbine is the best choice. Thepoint denoted by single-stage is the cost for a similar UPHS plant utilizing 900-m-head,single-stage, reversible pump turbines. The cost data shows that it is economically thebest machine choice for operating heads less than 1000 m. Other advantages include relativesimplicity in design and somewhat better efficiency than multistage or two-stage units.The main drawback of this machine is that the feasibility of its operation beyond 1000 m iscurrently unknown.
2.5 THE EFFECT OF PUMP-TURBINE EFFICIENCIES
It was shown that the direct cost in using the two-drop configuration or tandem unitsare, in general, higher than other schemes. However, the single-stage reversible pumpturbines used in the two-drop scheme operate at a much lower head (for each drop) and,hence, generally have a better efficiency than two-stage or multistage machines of the sametotal capacity and total operating head. Tandem units also have a somewhat better operatingefficiency. The product of the turbine and pump mode efficiencies ntnD can be one to twopercentage points higher than corresponding two-stage units.2»I> Since the expected UPHSplant lifetime is about 50 years, cost savings or penalties due to differences in r\tr\D mustbe considered in evaluating turbomachinery options. The effect will be addressed in 5parametric manner.
Pertinent factors that must be considered are:
(1) types of base load plants (nuclear or coal-fired) supplying the pumping energyto the UPHS plant,
(2) fuel costs for each type of baseload plant, and
(3) number of hours of annual operation for the UPHS plant.
The baseline UPHS plant considered has a 50-year life and a 70% overall efficiency Theeffective UPHS plant efficiency n e is given by
n = 0.7 (1.-6). (!)
232

where 6 is a measure of the change in plant efficiency due to a change in the product of theturbine and pump efficiencies, n+rip- If the original efficiency product is (ritip)o> thenthe new product ntip is related to 6 by
. (2)
The yearly fuel saving or penalty, A ($/kW per year), in year zero dollars was f i r s tcalculated for various fuel costs, hours of annual operation, and relative differences inpump-turbine efficiencies, S.
For these values of A, capitalized values, P ($/kWJ were calculated using
0 + i ) n - 1 f 3 iP = A (3>
i(l + i)n
where n = plant lifetime (years) and i = escalation rate.5 The results of this analysisfor n = 50 and i = 0.08 are plotted in Figs. 5 to 8.
Using these figures for a UPHS plant utilizing lower efficiency machinery, the follow-ing observations are obtained:
(1) The effective cost penalty, P, resulting from the lower pump-turbine efficiencyis less for nuclear baseload plants than for coal-fired ones. This result is basicallydue to the lower nuclear-fuel cost.
(2) The cost penalty for 6 = 2 % and 1800 hours of annual operation is not negligible.Typically it is approximately 9.6 $/kW for coal and 5.5 $/kW for nuclear baseloadplants (Figs. 5 to 8), which tends to reduce the attractiveness of advancedmachinery. However, for moderate differences in pump-turbine efficiency, fortypical baseload plant fuel costs and for typical UPHS p.lant utilization, thiscost penalty is still not large enough to alter the conclusion that two-stagemachines offer the most cost effective option for heads over 1000 m (Table 4).
(3) In situations where pumpturbine efficiency differences are large (6 = 4%), thefuel costs (coal or nuclear) are high and the UPHS plant is extensively utilized(hours of annual operation >2500), the effective cost penalty, P, can be a sub-stantial amount (Figs. 5 and" 7).
3. CHARGE/DISCHARGE RATIO
3.1 THE EFFECTS OF CHARGE-DISCHARGE RATIO
In designing pump turbines for pumped storage applications, machinery efficiency is an .important element to be considered, because of the long lifetime (=50 years) of the machinery(see Section 2.5). However, the so-called charge/discharge ratio, r, must also be takeninto account in pump-turbine design considerations. This factor is defined as the ratio ofthe average pumping load to the rated generation capacity. The averaging should be performedover the designed cyclic operating period of the pumped-storage plant. For example, plantscan be designed to operate on a daily, weekly or even longer cycle.
A pump turbine that has a charge/discharge ratio of close to 1 is said to have anelectrically balanced design, and the output is roughly the same as the pumping load. Onthe other hand, a high r value (1.3 or 1.4) means the generation time, Te, is comparable tothe pumping time, Tp. Therefore, the pump discharge rate, Qp, is about the same as theturbine discharge rate, Qj. The pump turbine is then in a hydraulically balanced mode.
The significance of r is that the larger this ratio, the longer the available generationtime for a given amount of pumping time. The generation time TQ is related to the pumping
233

time Tp by the equation
TG = % Tp (4)
Here nu is the overall UPHS plant efficiency. Average values over the charge/dischargecycle of the pumped-storage plant should be used. Typical values of r and the associatedenergy storage capacity (in hours) for several conventional pumped storage plants are listedin Table 5. Note that except for Cabin Creek all plants listed have a charge/dischargeratio greater than or equal to 1. For Cabin Creek if a plant efficiency of about 70%(which is typical for pumped storage plants) is assumed, a pumping time of 8.9 hours is re-quired to obtain the 5.8 hours of generation time listed in Table 5. In this case, the Tprequired is substantially more than Tg, which is reasonable if:
(1) supplementary pumping time (i.e., time in which load demand is relativelylow) is available and
(2) the implied additional storage cost is acceptable.
To illustrate these points consider a pumped storage plant that has been designed tosupply 6 hours (TQ) of peak power each weekday. Suppose the plant efficiency nu is,70% andthat the charge/discharge ratio is 1.0. From equation 4 a pumping time of 8.6 hours isrequired each weekday to supply the 6 hours of generation time required by the grid.Assume further that the maximum available pumping time each weekday as allowed by the gridis 8 hours. One way this difference can be taken up is via supplementary pumping duringthe weekend. The amount of weekend pumping required in this example is 0.6 x 5 = 3 hrs,which translates into additional storage of 3 x 0.7 = 2 hours. Hence, this pumped-storageplant will have to have a designed storage capacity of about 8 hours instead of the 6 hoursstorage capacity that the grid actually requires. This result represents 30% more storagecapacity with a corresponding increase in the associated storage cost.
However, if the pump turbines used in this hypothetical storage plant have a highercharge/discharge ratio of 1.4 with the same operating efficiency as before then equation 4predicts that Tp = TQ. In this case no supplementary pumping is necessary, end no addition-al storage capacity beyond the 6 hours needed to supply the utility grid is required. Thisresult represents a substantial cost reduction if the storage component is a significantpart of the total plant cost.
On the other hand there are some constraints on developing turbomachinery with highcharge/discharge ratios, particularly for reversible machines. A larger r (1.5) means theaverage pumping load is equal to 1.5 times tiie turbine load. For a reversible machine itis difficult to optimize performance characteristics for both the pumping and turbiningmodes with such a significant difference in operational requirements. The necessarycompromise generally leads to an overall lower pump-turbine efficiency.
Furthermore, a higher r value will require a higher generator-motor rating to meetthe higher pumping load requirement. The turbomachinery (pump turbines) will have to belarger to handle the increased quantity of water. There will be corresponding increases inthe size of some structures and equipment (e.g. powerhouse and cranes) to house and handlethese larger pieces of machinery. All these factors will lead to a higher plant cost.Previous estimates5 have indicated that to change the charge/discharge ratio from 1.0 to1.4 will add about 20% to those affected components of the plant cost (i.e. civil structuressuch as powerhouses, equipments, motor-generators and pump turbines). In addition, it maybe necessary to add the additional (capitalized) cost due to differences in pump turbineefficiencies. Detailed cost differences will depend upon such things as the specificmachinery used, powerhouse design, and plant configuration. Balanced against these con-straints is the cost savings due to the reduction in storage costs. This cost component ismainly represented (particularly for UPHS plants) by the construction cost of the lowerreservoir.
In this section, the results of a parametric analysis of the effects of the charge/dis-charge ratio on the trade-offs between the general increase in the balance-of-plant cost andthe cost reduction in the storage component are presented. The implications on the design
234
philosophy of high head turbomachinery for UPHS application will be considered.
Section 3.3 is devoted to a performance analysis of single-stage reversible pumpturbines over the head range of 500-1500 m. Actual preliminary design data will be utilized.The main focus will be on the charge/discharge ratio. Several modes of turbine operationwill be considered.
3.2 PARAMETRIC ANALYSIS
In analyzing the trade-off effects discussed in the previous sections several importantparameters need to be brought into consideration including the maximum pumping time per day,the generation time per day as required by the utility grid, underground cavern cost, coaland nuclear baseload plant fuel costs, effective UPHS plant efficiency, charge/dischargeratio and types of turbomachinery employed.
Supplementary pumping during the weekend (if required) will lead to additional storagerequirement. The additional specific storage cost ($/kW), AS, can be obtained from thefollowing relation
AS ($/kW) = Cu Np/T x 3600 x 5 x Q T x (TJJ - aT[j)/plant capacity (5)
where
Cu = underground cavern construction cost ($/m3)
Np/T = number of pump/turbines
Qj = mean turbine flow rate (mVsec)
Tg = daily generation time (hrs) required
TjJ = maximum daily pumping time (hrs) available
a = (charge/discharge ratio) (average plant efficiency (nu)
In equation 5, a 5 weekday peak generation cycle has been assumed. In the followinganalysis the baseline case consists of a UPHS plant of 2000MW capacity, operating at a1200-m head, with an overall plant efficiency of 70%, a charge/discharge ratio of 1 (i.e.an electrically balanced turbomachinery design) and 8 hours of available daily pumpingtime. The change in AS was also calculated for a charge/discharge ratio of 1.4 (i.e. ahydraulically balanced pump/turbine design) with the same turbine mean discharge-rate re-quirement.
Within this framework factors that were considered include:
(1) different grid requirements of respectively six hours, eight hours, and tenhours of daily generation;
(2) possible reduction in overall UPHS plant efficiency nu from the baseline caseof 70% to 69% and 67%; and
(3) two different sets of turbomachinery—330-HW, multistage, reversible pumpturbines (MSRPT)3 and 500-MW, two-stage, reversible pump turbines (TSRPT). l » 2
With factor 2, the cost penalty involved for both coal and nuclear baseload plantshas been estimated using results already obtained in Section 2.5 and Figs. 5-8. Forfactor 3, the main effect is on the increase fn the balance-of-plant costs. A 20% in-crease in the cost of the powerhouse, equipment shaft, and equipment such as cranes,motor generators and pump turbines has been considered.5 Recent construction cost data3
235

(updated to Sept 78 dollars) have been utilized, and for MSRPT leads to an increase ofabout $21.3/kW in the plant cost. For TSRPT the cost increase is about $18.6/kW.
The results of the analysis are displayed in Figs. 9-12. Some pertinent observations are:
(1) The variations in the balance-of-plant cost and in the capitalized cost fromchanges in plant efficiency are two important cost components when varying r values are con-sidered. These two cost components can be comparable in magnitude for some ranges of pumpingenergy costs, plant utilization and plant efficiency changes. (Fig. 9).
(2) For a 6 hour generation time, the savings from a storage cost reduction due to in-creasing r from 1 to 1.4 is neutralized by the increase in both the balance-of-plant cost andthe capitalized cost resulting from a reduction in plant efficiency. In these cases, it isprobably not beneficial to design turbomachines for high values of r. (Fig. 9, 11).
(3) When the generation time is 8 hours or more, an increase in r leads to cost savingsfrom reductions in storage costs that outweighs the other associated cost increases. In thesecases r should be considered a very important design parameter. Sacrifices in efficiency(within reasonable limits) from increasing r may have to be accepted.
3.3 CHARGE/DISCHARGE RATIO FOR SSRPT
The foregoing discussion is best illustrated with the results of the recent Allis-Chalmers-ANL study..2 Using actual design data from this study for the SSRPT, the charge/discharge ratio and the ratio of generation time, Tg to pumping time, Tp has been estimated.Two turbining modes were selected to provide a lower and upper bound to the charge/dischargeratio, r, at adequate performance levels. Mode A considers maximum power generation at theminimum head. It provides high power generation over a relatively limited time. Mode Bconsiders power generation at maximum efficiency at the minimum head. This mode provideslonger power generation times at a reduced level. Performance characteristics for bothmodes are summarized in Table 6. It should be noted that the ratio Tq/Tp for Mode A isless than Mode B, which means that Mode B operation is preferable unless power generationat an increased level over a limited time is desirable. An instructive way of looking atthe issues is illustrated in Fig. 12, where Tg is plotted against T p for both Mode A and Bat a 1000-m nominal head. For a daily pumping time of say eight hours, a 30% increase inr (from Mode A to B) is equivalent to an almost 40% increase in the effective storagecapacity. The high cost of the underground reservoir makes Mode B operation economicallyattractive illustrating the importance of a high charge/discharge ratio in turbomachinerydesign considerations particularly when storage cost is significant.
4. CONCLUSIONS
From the results of the system studies presented, the following conclusions can bedrawn:
(1) The utilization of advanced turbo-machinery seems to push the minimum UPHS plantcost beyond a head of 1500 m.
(2) The percentage savings in plant costs using advanced machinery is somewhat in-sensitive to variation in plant capacity (1300-2700 MW).
(3) For heads at or below 1000 m, single-stage, reversible pump turbines seem to bea logical choice. For heads above 1000 m, the present work indicates that two-stage, re-versible pump turbines represent an economically attractive option. A significant costreduction results when a plant with two-stage reversible units is compared with two-dropconfiguration plants or plants equipped with tandem units. However, this cost reductionmay be diminished when differences in pump turbine efficiencies are considered. Becauseof the long plant and machinery lifetime, seemingly small differences in performance canresult in nonnegligible cost penalties or benefits.
236

4. Increasing the charge/discharge ratio will reduce the relative storage cost. Thisreduction is accompanied by increases in the balance-of-plant cost and cost penalties re-sulting from possible reduction in turbomachinery efficiency. The cost benefit will dependon the amount of generation capacity required. For large enough generation time a costsavings from reduction in storage cost will outweigh the other associated cost increases.In these cases some sacrifices in efficiency from increasing the charge/discharge ratio maybe acceptable. Both this and other factor3 discussed in Section 3.2 illustrate the pointthat evaluation of both capital cost and performance are essential in making a judiciouschoice of turbomachinery options for UPHS application. Maximizing operating efficiency isonly one among several important aspects in pump/turbine selection considerations.
ACKNOWLEDGMENTS
The research activities in underground pumped hydro storage, of which this paper is apart, were funded by the Division of Energy Storage Systems, Office of Energy Technology,U.S. Department of Energy.
REFERENCES
1. C.A. Blomquist, S.W. Tarn, and A.A. Frigo, "Turbomachinery Options for an UndergroundPumped Hydro Storage Plant," paper presented at the proceedings of the 14th Inter-society Energy Conversion Engineering Conference, Boston, Aug. 5-10, 1979.
2. Allis-Chalmers Corp., unpublished studies for Argonne National Laboratory (ANL),Oct. 1978.
3. "Underground Pumped Hydroelectric Storage. An Evaluation of the Concept," FinalReport. Solicitation No. 6-07-DR-50100, Chas. T. Main, Inc., Nov. 1978.
4. C.A. Blomquist, A.A. Fn'go, and S.W. Tam, ANL unpublished study.
5. D.G. Newman, "Engineering Economic Analysis: Engineering Press, 1976, pp. 50-53.
6. PSE&G "An Assessment of Energy Storage Systems Suitable for Use by Electric Utilities,"Vol. Ill EM-264 EPRI project 225 ERDA E(ll-l)-2501 July, 1976.
7. P. Rodrique, "The Selection of High-head Pump-turbine Equipment for Underground PumpedHydro Energy Storage Application," Proceedings of the ASME 1979 Spring Meeting, NiagaraFalls, New York, June 18-20, 1979.
237
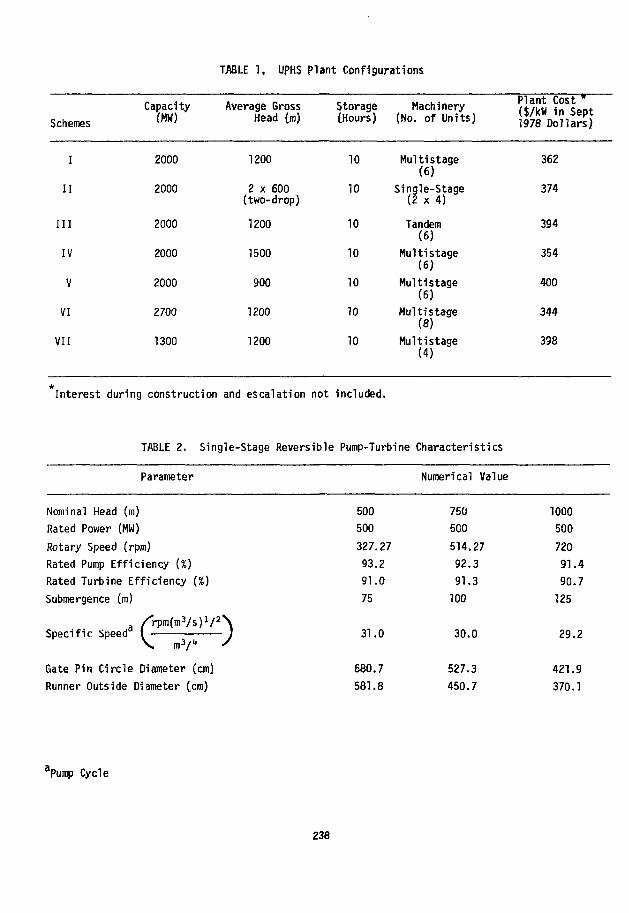
TABLE 1, upHS Plant Configurations
Schemes
CapacityCMW]
Average GrossMead (m)
Storage Machinery(Hours) (No. of Units)
Plant Cost($/kW in Sept1978 Dollars)
I
II
III
IV
V
VI
VII
2000
2000
2000
2000
2000
2700
1300
1200
2 x 600{two-drop)
1200
1500
900
1200
1200
10
10
10
10
10
10
10
Multistage(6)
Single-Stage(2 x 4)
Tandem(6)
Multistage(6)
Multistage(6)
Multistage(8)
Multistage(4)
362
374
394
354
400
344
398
Interest during construction and escalation not included.
TABLE 2. Single-stage Reversible Pump-Turbine Characteristics
Parameter Numerical Value
Nominal Head (m)Rated Power (MW)
Rotary Speed (rpro)Rated Pump Efficiency (%)Rated Turbine Efficiency (%)
Submergence (m)
Specific Speed" cGate Pin Circle Diameter (cm)Runner Outside Diameter (cm)
500500
327.2793.2
91.0
75
750500
514.2792.391,3100
1000500
72091.490.7
125
31.0
680.7581.8
30.0
527.3450.7
29.2
421.9
370.1
aPump Cycle
238

TABLE 3. Two-Stage Reversible Pump-Turbine Characteristics
Parameter Numerical Value
Nominal Head (m)
Rated Power (Mw)
Rotary Speed (rpm)
Rated Pump Efficiency (%)
Rated Turbine Efficiency (%)
Submergence (m)
First Stage Head (m)
Second Stage Head (m)
/'rpm(m3/s)1/2'\First Stage Specific Speeda I • —j 36.1 36.3 36.4 34.4
N m 3/" y
1000
500
450
90.
90.
75
400
600
6
0
1250
500
600
89.
89.
85
500
750
6
5
1250
350
720
89.6
89.6
85
500
750
1500
500
720
88.
88.
100
600
900
3
4
/•rpmdnS/s)1/^*! - -ASecond Stage Specific Speed*! ^ - -A 26.6 26.7 26.9 25.4
Gate Pin Circle Diameter (cm) 519.Z 435.6 363.2 396.2
Top-Stage Runner Outside Diameter (cm) 455.1 382.0 318.5 347.5
Bottom-Stage Runner Outside Diameter (cm) 383.0 321.6 268.0 292.1
a Pump Cycle
TABLE 4. Percentage Saving in Plant Cost When Two-StageReversible Pump Turbines Are Used Instead ofthe Turbomachinery Listed
Machinery Type Savings ($/kW)a Percentage Saving {%)
Multistage ReversiblePump Turbine 16 4.4
Single-stage ReversiblePump Turbine (Two-Drop) 28 7.5
Tandem Unit 48 12.2
a1978 dollars.
239

TABLE 5. Charge/Discharge Ratio and Energy Storage8for Representative Pumped Storage Plants.
Plant
Charge/DischargeRatio
(Pump Load/Plant Capacity)
1.07
1.301.050.93
1.291.001.13
1.25
1.111.04
1.01
Enerqy Storaqe (hours)kWh/kW of Plant
7.7
8.814.2
5.8
11.28.5
11.6
9.0
94.05.6
24.0
Taum SaukYarks CreekMiddy RunCabin CreekSeneca (Kinzua)North fieldBlenheim-Gil boaLudingtonJocasseeBear SwampRacoon Mountain
aadapted from "An Assessment of Energy Storage Systems Suitable for Use by Electric Utilities,"Vol. Ill, EM-264 EPRI Project 225, ERDA (ll-l)-2501, July 1976. (Ref. 6)
TABLE 6. Some Performance Characteristics ofSingle-stage Reversible Pump Turbines. (Ref. 2)
Nominal Head(m)
500
750
1000
aCharge/Di scharge
Mode
AB
AB
AB
Ratio.
Capaci ty(MW)
430325
475350
500365
ra
1.071.42
0.961.31
0.911.24
Tg/Tpb
0.741.00
0.650.91
0.600.85
Generation Time/Pumping Time.
240

105
55500
,COST($IO*/UNIT)• 6785.24 « ( HEAO IN mI"0*1*
750
HEAD (m)
1000
Fig. 1. Single-Stage Reversible Pump-Turbine Cost (.500 MW Size)
105
95
65 -
551000
•COST<$ IOS /UNIT)= 13690.54 i (HEAD IN » ) " 0 " 5
1250
HEAD ( m )
1500
Fig. 2. Two<>Stage Reversible Pwnp^Turbine Cost (500 MW Size)
241

- 6
Sz
3 21-
TWO-STAGE (500MW UNIT SIZE) VS.MULTISTAGE (333 MW UNIT SIZE)-
TWO-STAGE (350 MW UNIT SIZEIVS.MULTISTAGE (333 MW UNIT SIZE)-
1300 1700 2100
PLANT CAPACITY (MW)
2500
Fig. 3. Percent Savings in UPHS Plant Cost ($/kW) at 1200m Head
§ 3 6 0 1 - \S|NGLE- STAGE^
I
.MULTISTAGE
TWO-STAGE
I1100 1300
HEAD (m)1500
Fig. 4. UPHS Plant (2000 MW) Cost <$/kW)
242

J500 2000 2500HOURS OF ANNUAL OPERATION
Fig. 5. Capitalized Value ($/kW) for 4% Difference in Pump-Turbine Efficiency (50 YearsLifetime at 8%)
HOURS OF ANNUAL OPERATION
Fig. 6. Capitalized Value ($/kW) for 1* Difference in Pump-Turbine Efficiency (50 YearsLifetime at 8%)
243

1500 2000HOURS OF ANNUAL OPERATION
2500
Fig. 7. Capitalized Value ($/kW) for 4% Difference in Pump-Turbine Efficiency (50 YearsLifetime at 8%)
1000 1500 2000HOURS OF ANNUAL OPERATION
2500
Fig. 8. Capitalized Value ($/kW) for IX Difference in Pump-Turbine Efficiency (50 YearsLifetime at 8%)
244

*T
COST
(NP
LAN
INCR
EASE
30
20
10
n
333MW MSRPT
~500MWTSRPT
IS
1 1
6 8DAILY HOURS OF GENERATION
10
Fig. 9. Increase in Balance-of-Plant Cost and Pumping Energy Cost Vs. Daily Hours ofGeneration
CO
o
5 100oX
<xzo
«=0.7(iju = 70%)- = 0.94(^=67%)
= 69%)
333 MWMSRPT /
6 8
DAILY HOURS OF GENERATION
10
Fig. 10. Additional Excavation Cost Vs. Daily Hours of Generation for 333 MW MSRPT
245

oo2
o5 100oX
«= 0.7(^=70%)
" = 0.94(^=67%)
« =0.97(^=69%)
500 MWTSRPT y
/
6 8DAILY HOURS OF GENERATION
10
Fig. 11. Additional Excavation Cost Vs. Daily Hours of Generation for 500 MW TSRPT
Fig. 12. TG Vs. T p for SSRPT with 1000 M Head
246

Project Title:
PrincipalInvestigator:
Organization:
Project Goals:
Project Status:
Contract Number:
Contract Period:
Funding Level:
Funding Source:
PROJECT SUMMARY
Assessment of the Application Potential of the Pumps with Controlled FlowRate for Energy Storage
Alexander Gokhman
EDS Nuclear Inc.220 Montgomery StreetSan Francisco, CaliforniaTelephone (415) 544-8199
94104
The goal of this project was to conduct the economical analysis (based onthe results of the preliminary design accomplished by the University ofMiami in October 1978) in order to justify the spendings of the governmentand private industries for experiments with model turbine-pumps and forconceptual design of the machine by one of the vendors.
The project was completed in June 1979 and final report was submitted toArgonne National Laboratory in July 1979.
The results of the project are being evaluated at Argonne NationalLaboratory, DOE, EPRI and Bureau of Reclamation (Department of Interior).
31-109-3810
April 5, 1979 - July 1, 1979
$12,000
Argonne National Laboratory
247

ASSESSMENT OF THE APPLICATION POTENTIALOF THE PUMPS WITH CONTROLLEDFLOW RATE FOR ENERGY STORAGE
Alexander Gokhman, Nail OzboyaEDS Nuclear Inc.
220 Montgomery StreetSan Francisco, CA 94104
ABSTRACT
The present project covers the comparison of the turbine-pumps and pumps with controlledflow rate with the alternative equipment for the different areas of application. Theanalyses showed the definite advantage of these new machines for the main areas ofapplication.
INTRODUCTION
The Turbine-Pump with Controlled Flow Rate (TPCFR) was invented in 1975 by Dr. AlexanderGokhman.U) In this machine the flow rate is regulated by means of change of the waterpassage height in both turbine and pump modes. In order to change the height of the waterpassage, TPCFR has additional adjustable hub in the runner and movable upper cover in thewicket gate. Both these additional parts can move along the axis of the machine.(')» (3)
No other Turbine-Pump connected to a synchronous motor-generator can efficiently regulatethe flow rate in the pump mode. Neyrpic, a leading hydraulic machinery manufacturer inFrance, made an attempt to develop a turbine-pump which would regulate the flow rate in thepump mode by means of a wicket gate placed between the spiral casing and runner. Such a pumpcan regulate the flow rate only by increasing the head losses significantly. Consequently,it has low efficiencies at flow rates smaller than the maximum flow rate.
The effective regulation of flow rate and consequently power in the turbine mode can beprovided only in one-stage machines. The conventional multi-stage turbine pumps cannotregulate power in the turbine mode, however, there is a recent development by Allis-Chalmerson two-stage turbine-pumps with the wicket gate in the upper stage which would allowregulation of power in the turbine-mode. This machine has several disadvantages. (4)Consequently with the modern tendency toward high-head pumped-storage plants which requiretwo-stage machines only TPCFR can provide efficient regulation of power in both turbine andpump modes. The ability of TPCFR to regulate flow rate in the pump mode makes it veryattractive for pumped-storage plants and storage of energy generated by solar andwind-electrical plants, and solar-mechanical applications.
In 1977, the U. S. Department of Energy funded a research project on the preliminarydesigns of one and two stage TPCFR's at University of Miami, Coral Gables, Florida. Thepresent study is based on the results of that project which was successfully completed in1978.I3' The comparisons evaluated in this study are preliminary in order to justify thespendings of the government and private industries for experiments with model turbine-pumpsand for conceptual design of the machine by one of the vendors.
The detailed economical comparisons for the commercialization of TPCFR can be based onlyon the results of the experiments mentioned above and on the conceptual design. In thepresent project the authors tried to show the positive features of TPCFR by means of thequantitative comparison of this new machine with alternative equipment for typical conditions.
248

COMPARISON OF THE TURBINE-PUMP WITH CONTROLLED FLOW RATE WITHALTERNATIVE EQUIPMENT (FOR HUMPED-STORAGE FLANTS7
One of the possible application areas for one and two-stage TPCFR'S is pumped-storageplants. These pumped-storage plants may have the lower reservoirs underground or above theground. The alternative machines in this case are conventional one and two-stageturbine-pumps, two-stage turbine-pumps with wicket gate at the upper stage (Allis-Chalmers)and one-stage turbine-pumps with wicket gate utilized in the pump mode (Neyrpic).
The daily power demand graph which was chosen for the economical analysis (see Fig. 1.),is a hypothetical graph for a medium size system of the Northern U.S.A. with two peaks ofpower; one in the morning, and one in the evening. The maximum and minimum powers of thesystem in December and January are taken to be 4000 MW, and 1050 MW, correspondingly. Thetechnical minimum of system is taken as 1500 MW. It is clear from Figure 1 that thepumped-storage plant can be charged between hours 0:00 and 6:00 (when the demand to thesystem is lower than the technical minimum) and that pumped-storage plant can work in theevening peak between hours 16:30 and 19:30 augmenting the thermal plants. Consequently thepumped-storage plant does not only redistribute the energy within one day but also decreasesthe installed power of the thermal-electric plants of the system.
P.(MW)
4000 -I
3000 •
2000 -
1000 •
Peak Energy
.Technical Ninitaum
)ff-Peak Energy
12 14 20 24 t <hr)
Fig. 1. Daily Graph of the Power Consumption of the System
The graph of the power available for the pumped-storage plant charging, Pc= Pc(t),based on the daily power demand graph for December and January, is presented on Fig. 2.maximum power of this graph is 450 MW. The graph of peak power Pp= Pp(t) in which thepumped storage has to work is presented in Fig. 3.
The
For the calculation of energy stored and produced by pumped-storage plant the maximum ofPc= PcU) is taken in June and July as 550 MW and the average maximum is as 500 MW. Itis further assumed that the curves, Pc = Pc (t), with maximum powers of 450 MW and 550 MWcover 25% of the year and the curve with the maximum power of 500 MW covers 50% of the year.In order to simplify the calculation of the energy available for charging and the calculationof the guaranteed power of the pumped-storage plant during the evening peak, the graphs Pc* Pc (t) and Pn * Pn (t) are considered as symmetric parabolas with vertices at themaximum points. Consequently the analytical representation of Pc = Pc (t) is
249

(6t - t2) (for 0.0< tj<6.0)
where Pre Pc maj, is the maximum of the curve. And the analytical representation of Pp =(t) for December and January is:
Pp = 4000 - 960-(t - 18r (for 16.5< t< 19.5) (2)
«000
Y/////X \
P - 4000 - 960< (t - 1
Fig. 2. Daily Graph of the Power Available forthe Pumped-Storage Plant Charging
Fig. 3. Daily Graph of Work of thePumped-Storage Plant in the Peak
For economical comparison, two pumped-storage plants are considered; one equipped withtwo TPCFR's and conventional machines and the other equipped with alternative equipment.
As given in Reference 5, the capital cost of 1 kW of installed power for Oil SteamElectric Power is $425 and for Pumped- Storage Plant is $150 in 1970 dollars, therefore, ifthe yearly rate of inflation is assumed to be 5%, these costs are approximately 41% higherin 1977 dollars, since (1 + 0.05)' = 1.407. Consequently in 1977 dollars, for thermalplants, the cost of 1 kW is $598 and for pumped storage plant, the cost of 1 kW is $211.The cost of one kW of installed power is taken to be $100 for the conventionalturbine-pumps, and $120 for TPCFR as it was done in the Feasibility Analysis of the FinalReport on the Preliminary Design of TPCFR.(3)
The following rates are used for the electrical energy consumption. For the peakenergy, the rate is 4£/kW-hr, for the off-peak energy, the rate is 2t/kW-hr.
CONVENTIONAL ONE-STAGE TURBINE-PUMPS
The following alternatives are under consideration.
. Pumped-storage plant equipped with two TPCFR's and conventional one-stageturbine-pumps.
250

Pumped-storage plant equipped with conventional one-stage Turbine-Pumps.
The head of the pumped-storage plant is taken to be 500 m., since this head is veryclose to the most economical head for the one-stage turbine pumps. The combined efficiencyof charging and discharging of the energy for both alternative plants under considerationis taken as 0.80.
a) Pumped-Storage Plant Equipped with Two TPCFR's and Conventional Turbine-Pumps
Since the pumped-storage plant can continuously regulate the flow rate, the energyavailable daily for charging according to (1) is
6
E = f -S-PS. (6t .- t2)dt
0
or
c max »"'
Therefore, the daily available energy for discharging in peak is ED = E«n = 3.2'PC max.So in December and January Ep = 3.2-450 = 1440.0 MW-hr.
The installed power of the pumped-storage plant, P^ is the power of this plant workingin December and January in the peak with available energy Ep = 1440.0 MW-hr.
Formula (2) introduces Pp as a function of time. But one can use Stieltjes integral inorder to find the function Pi = Pi (Ep) (See Fig. ?.), so
4000E p = 2 - J T . d P p (4)
4000 - Pj
where x= t - 18 and t <.18.From formula (2)
T = - W 4 0 0 - Pn (5)
/960- p K 'or
4000
E = 0.06455 • U4000 -P • dP (6)
4000 - Pj
and
En = 0.06455 - i - PT3 / 2
p T ^ I
251

therefore,
Pj = 8.143-Ep2/3 (7)
Finally the installed power
Pj = 8.14334-{1440.0)2/3 = 1038.4 MM
Consequently the pumped-storage plant can be equipped with five machines with a power of207.7 MM for each machine. Two of these machines are accepted to be TPCFR and three to beconventional.
The daily energy for charging with maximums 450 MM, 500 MM and 550 NW by equation (3) are
(Ec) 450 = 1800 MW-hr.
(Ec) 5oo = 2000 HJ-hr.
(Ec) 5 5 0 = 2200 MW-hr.
And therefore the total energy available for charging during the year is
or
<E c) y = 365-[0.25-(Ec)450 • 0.50-(EC)500 + 0.25-(Ec)550]
(Ec) = 7.3-108 kW-hr.'y
And the output of the energy in peak during one year
(E p) y = (Ec)y-0.80 = 5.84-108 kW-hr.
b) Pumped-Storage Plant Equipped with Conventional Turbira-Pumps
The energy available for charging can not be completely used by the plant and dependson the power of the smallest unit of .the plant. The following cases are underconsideration.
b-1) Four machines with the unit power Py = Pj/5 and eight machines with the unit power
APU = P ^ O .
b-2) Four machines with the unit power Pu = Pj/5 and four machines with the unit powerAPU = Pr/20.
b-3) Four machines with the unit power Pu = Pj/5 and two machines with the unit powerAPU = Pj/10.
b-4) Five machines with the same unit power (P = Pj/5).
252

The charging energy by Pumped-Storage Plant with power of the smallest unit PM can bejbtained using (1). Indeed the power of the plant in pumping mode can be expressed as
(P c) k = k A P u (8)
where k is an integer, and
l ± k l k m a x l ^
The values of time ( t ^ and (t2)|c corresponding to (P,.)^ are obtained from (1)
•(6t - t2)
or
. k«AP -9(t, 2 ) k = 3 7 h - p
u (9)' c max
Therefore the Charging Energy (See Fig. 2.)
k maxE = £ AP -[(t,). - ( t A ]C k=1 U i. K I K
or using (9)
k max / k « A PEn = n • I 6-AP / 1 - - p — ^ (10)p k=l u c max
Since this plant can regulate the power in turbine mode, the relation between Ep = T E Cand Pj is the same, as for the plant equipped with TPCFR (by formula (7). It is clearfrom the formula (10) and (7) that the values of Pi for cases b-1, b-2, b-3, and b-4 canbe calculated only by means of iterations. The results of calculation of Pu and Pj arepresented in Table 1.
TABLE 1. Installed Power and the Power of the Smallest Unit
CasePu (MW)
Pr (m)
b-125.2
1008.0
b-249.2
984.0
b-391.7
917.0
b-4176.5
838.0
After Pi is calculated it is relatively easy to determine the energy output of thepumped-storage plant. The results obtained by using equation (10) are tabulated inTable 2. Also included in the table are the annual energy output of the pumped-storageplant for each case.
253
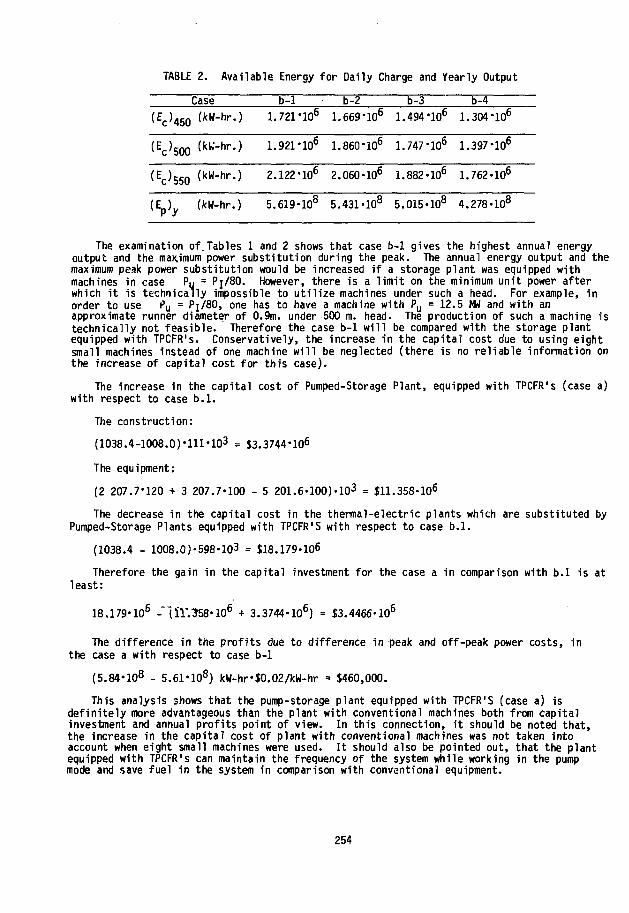
TABLE 2. Available Energy for Daily Charge and Yearly Output
Case
<Ec>450 (kW-hr->
(E c ) 5 0 0 (kW-hr.)
(E c ) g 5 0 (kW-hr.)
(E ) (kW-hr.)
b-11.721
1.921
2.122
5.619
•106
•106
•106
•108
b-21.669
1.860
2.060
5.431
•io6
•106
-106
•108
1
1
1
5
b-3.494
.747
.882
.015
•io6
•106
-106
•108
b-41.304
1.397
1.762
4.278
•io6
•106
-106
•108
The examination of.Tables 1 and 2 shows that case b-1 gives the highest annual energyoutput and the maximum power substitution during the peak. The annual energy output and themaximum peak power substitution would be increased if a storage plant was equipped withmachines in case Py = Pi/80. However, there is a limit on the minimum unit power afterwhich it is technically impossible to utilize machines under such a head. For example, inorder to use Pu = Pi/80, one has to have a machine with Pu = 12.5 MW and with anapproximate runner diameter of 0.9m. under 500 m. head. The production of such a machine istechnically not feasible. Therefore the case b-1 will be compared with the storage plantequipped with TPCFR's. Conservatively, the increase in the capital cost due to using eightsmall machines instead of one machine will be neglected (there is no reliable information onthe increase of capital cost for this case).
The increase in the capital cost of Pumped-Storage Plant, equipped with TPCFR's (case a)with respect to case b.l.
The construction:
(1038.4-1008.0)'lll-103 = $3.3744'106
The equipment:
(2 207.7*120 + 3 207.7-100 - 5 201.6-100)-103 = $11.358-106
The decrease in the capital cost in the thermal-electric plants which are substituted byPumped-Storage Plants equipped with TPCFR'S with respect to case b.l.
(1038.4 - 1008.0)-598-103 = $18,179-106
Therefore the gain in the capital investment for the case a in comparison with b.l is atleast:
18.179-106 -~lHyj58-106 + 3.3744-106) = S3.4466-106
The difference in the profits due to difference in peak and off-peak power costs, inthe case a with respect to case b-1
(5.84-108 - 5.61-108) kW-hr-$0.02/kW-hr = $460,000.
This analysis shows that the pump-storage plant equipped with TPCFR'S (case a) isdefinitely more advantageous than the plant with conventional machines both from capitalinvestment and annual profits point of view. In this connection, it should be noted that,the increase in the capital cost of plant with conventional machines was not taken intoaccount when eight small machines were used. It should also be pointed out, that the plantequipped with TPCFR's can maintain the frequency of the system while working in the pumpmode and save fuel in the system in comparison with conventional equipment.
254

CONVENTIONAL TWO-STAGE TURBINE PUMPS
The method of comparison with respect to operation in the pump mode is identical to themethod described in Section 2.1.1. However, in the turbine mode, conventional two stageturbine-pumps cannot regulate the power and consequently cannot accept the fluctuations inthe power of the system and maintain the frequency. Therefore, the frequency of the systemhas to be maintained by thermal plants which causes additional fuel losses in comparisonwith storage plants equipped with TPCFR's.
Consequently, ir the case of two-stage machines TPCFR is much more advantageous thanthe conventional machines not only in the pump mode but also in the turbine mode.
TWO-STAGE TURBINE-PUMPS WITH WICKET GATE AT THE UPPER STAGE
This machine is analysed in detail in reference 4. From this analysis it is clear thatthis machine does not have the main positive feature of two-stage machines which is todivide the total head among the stages. Consequently this machine can be considered as amore complicated and expensive than one-stage conventional machine without any additionalpositive features and hence, no further analysis is required.
ONE-STAGE TURBINE-PUMPS WITH WICKET GATE UTILIZED IN THE PUMP MODE
This machine is analysed in detail in reference 3. The operation of this machine inthe turbine-mode is identical to conventional one-stage turbine-pumps. In the pump-modethe flow rate is regulated only by direct losses of the head as shown in the hydraulicanalysis mentioned above. If the machine is designed to pump the water to the upperreservoir height at optimum conditions, it will not be able to pump any water duringregulation that is at loads smaller than optimum. If it is desired to pump water atconditions other than optimum, the machine has to be designed for larger power which willconsequently increase the capital cost significantly. Therefore, this machine does notoffer any advantage at all on the conventional one-stage machines, and hence, no furtheranalysis is required.
COMPARISON OF PUMP WITH CONTROLLED FLOW RATE WITHALTERNATIVE EQUIPMENT
The possible utilization areas for the pump with controlled flow rate (PCFR) aresolar-electric power plants, solar and wind mechanical applications and irrigation andwater supply applications. These cases will be analysed in detail in the followingsections. The alternative equipment for these application areas are the one-stageconventional pumps.
CONVENTIONAL ONE-STAGE PUMPS FOR SOLAR-ELECTRIC POWER PLANTS
The combination of a solar electrical plant with pumped storage forms the solar complexelectrical plant.(°) In this arrangement, the storage plant comprises separate pumpsworking at night on off-peak energy and during the day time on solar energy and theturbines giving energy to the system during the peak time.
The cost of 1 kW of power of the solar electrical plant is very high compared to thecost of 1 kW of pumped-storage plant. The utilization of conventional pumps in thepumped-storage plant will lead to inevitable losses of power during operation up to thecapacity one unit. These losses will drastically increase the cost of 1 kW of power of thesolar complex electrical plant. On the other hand, the utilization of the pump withcontrolled flow rate will eliminate these losses, but slightly increase the price of the 1kW of the pumped-storage plant still resulting in smaller cost of 1 kW of the solar complexelectrical plant. As an illustration of the point let us consider the solar complexelectrical plant (SCEP) participating in the electrical system of South Florida (latitude24°N) without utilizing off-peak energy. Also let us assume that SCEP will reliably workin the period from March through September. Obviously the worst months for the plant are
255
March and September since the amount of solar energy received is the smallest and therequirement of the plant to the system is highest in these months. If we make the furtherassumptions that the plant has to work two hours during the peak time with 1109 MM and theratio of sunny days in this region is 80% during these months, the energy which has to beproduced by the solar electrical plant on a sunny day becomes
E _ 1109-103.2sd °-8-nps
where
n p s = 0.8 is the efficiency of the pumped-storage plant.
Therefore
E s d = 3.467-106 kW-hr
The distribution of solar insolation on a sunny day in March can be introduced as aparabola with maximum power P01- at noon and the smallest power of 0.6 P^ at 8.00 and16.00. For simplicity let us assume the efficiency of the solar electrical plant isconstant. Therefore the same curve will represent the power output of the solar electricalplant (see Fig. 4.).
The cost of 1 kW of solar electrical plant is approximately $2000 and the cost of 1 kW ofthe conventional pumped-storage plant equipped with pump-turbines is $211.(5), (7) Let ussay there are five pumps with 100 MW capacities at this pumped-storage plant and the cost ofthe pump with controlled flow rate is 20% higher than the conventional pump, since theconventional pump does not have a distributor and the labor in the case of new pump is moreexpensive. The cost of the equipment at the pumped-storage plant can be assumed as $100/kW.Therefore, we can roughly say that the cost of 1 kW of the pumped-storage plant with separatepumps and turbines is approximately $311 ($lll/kW for the construction, $100/kW for theturbines and $100/kw for the pumps).
Now it is possible to compare the cost of SCEP equipped with conventional pumps with thatof SCEP comprising the conventional pumps and two PCFR's (two pumps of this kind can providecontinuous regulation of power).
a) SCEP Equipped with Conventional Pumps and Two PCFR's
The analytical expression for the parabola representing the output of solar electricalplant is
P = P o-U - 0.025-(t - 12)2) (11)
where Po is the maximum output of solar electrical plant. Consequently the total energyproduced by the plant is
16Esd = (Po*(1 ' °-025*(t " 12)2)-dt = 6.933-PQ
Esd = 3 - 4 6 7 ' 1 0 6 k w " n r
Since
Po = 500«103 kW
256

P (MW1
600Output of Solar ElectricalPlant and Input to StoragePlants
P (MW)
600 Output of Solar Electrical Plant^
Input to Storage Plants
9 10 11 12 13 14 15 16 t (hr)
a. Storage Plant with two Pumpswith Controlled Flow Rate
11 12 13/ 14 15\ 16 t Chr)
b. Storage Plant with ConventionalPumps
Fig. 4. Pumped Storage as Energy from Solar Electric Plant.
Now it is possible to find the costs of-SCEP parts, remembering that there are fivepumps, three of them being conventional.
Cost of solar electrical plant = 500-103-2000= $ 1-109
Cost of construction of pumpedstorage plant
Cost of conventional pumps
Cost of two PCFR's
Cost of turbines
= 1109*103'lll= $ 0.1231-109
= 3-100-103-100= $ 0.030-109
= 2-100-103-120= $ 0.024-109
= 1109-103-100= $ 0.1109-109
Therefore the total cost of SCEP is
C = $ 1.2880-109
and the cost of 1 kW of power is
k =1.2880-109
s-1109-lO^
= $ 1161.41 /kW
257

b) SCEP Equipped with Five Conventional Pumps
In order to have a reliable comparison, it is necessary to find the optimum capacity ofone pump unit which gives minimum Po which is required for the same value of ESA to beproduced by step regulation. As can be seen from Fig. 4., Po should be larger than 5PU,otherwise one unit will never work. Also the the smallest P is equal to 0.6Pp, therefore,only two steps are possible. As follows from the figure 4 and the formula (11)
d " b %(t2 zl ' VT2 V £ J V 2 'where
1-5-k.
and
v o
After some manipulation
E s d = kp- Po« (12.65'( v T ^ k ^ + •/P47k^ ) + 24) (13)
Now it is possible to find the value of kp which will give minimum Po. If werewrite (13) as
p0 =
where
F(kp) = kp'(12.65 • ( vT-5-k + /T-4'kp ) + 24)
The necessary condition for the minimum Po is
or from (14)
and since Esd/F(kp)z is not zero, the condition is
258
or
(12.65-(/f^k" +A-4'k) + 24) - k -(31.625 1 + 25.3 1 ) = 0p p p •l-S-k / 1 4 k
and
12.65 (A-5-kp + A-4-kp) + 24k = 1 <f (15)
p 31.625 x + 25.3 *
The method of iteration applied to (15) gives k = 0.1877
Therefore, from (14) PQ = 552.163-103 kW and Pu = 103.64-103 kW
In this case, the costs of SCEP parts are:
Cost of solar electr ical plant = 552.163-103-2000= $ 1.1043-109
Cost of construction of pumpedstorage plant = 1109-103-100
= $ 0.1231-109
Cost of pumps = 5 103.64-103-100= $ 0.05183-109
Cost of turbines = 1109-103-100= $ 0.1109-109
The total cost of SCEP is C = $ 1.3779-109 and the cost of 1 kW of power is
k = 1-3901-109 .. , 1 2 5 3 . 4 7 / k w
1109-10-*
So even in the case when PCFR is accepted to be 20% more expensive than the conventionalmachines, the utilization of this pump decreases the total cost of 1 kW by approximately 8%.However, from the weight comparison it is not clear PCFR is more expensive than theconventional machine at all. All those considerations show that PCFR is very attractive forsolar complex electrial plants.
The economical comparison provided above shows not only the advantages of the new pump incomparison to the conventional pumps but it clearly introduces the advantage of using thecombinations of solar electrical plants with pumped-storage plants. Indeed the cost of 1 kWof solar plant was accepted as $ 2000, however, in combination with pumped-storage, the costof 1 kW of SCEP immediately dropped to $ 1150.
CONVENTIONAL ONE-STAGE PUMPS FOR SOLAR AND WIND MECHANICAL APPLICATIONS
Two general schemes can be considered for the solar and wind mechanical application.
a) The Mechanical Energy Generated by the Sun (Using a Collector and a Heat Engine) or Hind(Using a Wind Mill Without Generator) is Directly Applied to the Pumps.
259
In this case the pumps without ability to regulate the flow rate are not directlyapplicable without significant loss of energy, since it is impossible to adjust the speed ofthe prime mover (heat engine, propeller of a wind mill) shaft with the speed of a pump shaftwihout additional regulating devices. Consequently, it is more advantageous to use PCFR's inthis case,b) The Energy Generated by the Sun or Wind is First Converted to Electricity Via D.C. or
A.C. Generators and* chen Applied to the Pumps."
For the case in which photovoltaic cells or DC generators are used, the conventionalpumps are more advantageous due to their simplicity and lower cost, since it is possible toadjust the speed of the shaft of the DC moter to the power. For the case in which ACgenerators are used, it is more advantageous to us CPFR'S.
CONVENTIONAL ONE-STAGE PUMPS FOR IRRIGATION AND WATER SUPPLY APPLICATION
In the case of irrigation, PCFR can provide significant savings, especially if theirrigation of hillside fields is considered, since it can regulate the head providing thesame flow rate for the top of the hill as well as for the foot of the hill and save water andenergy.
For the water supply systems without special elevated water reservoirs, the utilizationof CPFR'S will result in considerable energy savings, since the water use demand can becontinuously followed. The conventional pump always exceeds the water demand unless thewater demand is equal to sum of outputs of the pumps, therefore, causing waste of energy.
CONCLUSIONS
From the analysis of the application potential of the turbine-pumps and pumps withcontrolled flow rate the following conclusions have been made.
The most attractive application of the turbine-pumps with controlled flow rate (TPCFR) isfor high head pumped-storage plants. Two TPCFR in combination with conventionalturbine-pumps will provide the pumped-storage plant with the ability to regulated powercontinuously and with high efficiency in both pump and turbine modes.
The utilization of the TPCFR is definitely advantagous both from capital investment andannual profits point of view.
The most attractive application of the pumps with controlled flow rate (PCFR) is instorage systems of solar-electric plants, etc. since these pumps can continuouslyregulate power with high efficiency. The utilization of PCFR decreases the capital costof one kilowat of installed power for these plants.
It is appropriate to begin laboratory experiments with TPCFR and PCFR and also toinitiate the conceptual designs for these machines by one of the vendors.
There is an immediate demand of solar and wind electrical plant storage systems for ruralareas of the U.S.A. In order to satisfy this urgent demand it ir; possible to start thetechnical design and production of small machines of this new type. The power of thesemachine should be no more than 1 MW. and the diameters no more than lm. These machineswill sucessfully operate under a head around 100m.
REFERENCES
1. A. Gokhman, "Multi-Stage Turbine-Pump with Governing", Patent Application No. 618 964,October 2, 1975.
2. A. Gokhman, N. Ozboya, "Multi-Stage Turbine-Pump with Controlled Flow Rate", Proceedingsof the 1978 Mechanical and Magnetic Energy Storage Contractor's Review Meeting, U.S.Department of Energy, Luray, Virginia, 1978.
260

3. A. Gokhman, N. Ozboya, "Multi-Stage Turbine-Pump with Controlled Flow Rate", Final Reportfor D.O.E., University of Miami, 1978.
4. A. Gokhman, "Assessment of the Application Potential of the Pumps with Controlled FlowRate for Energy Storage", Final Report for Argonne National Laboratory, #01-0720-1039,EDS Nuclear Inc., San Francisco, 1979.
5. C. Braun, et al., "The Target Capital Costs for the Implementation of Fuel Cells andElectric Storage Devices within the National Energy System", Proceedings of HydrogenEnergy Short Course, Albuquerque, New Mexico, 1976.
6. A. Gokhman, "Complex Solar Electric Plants of Large Capacity", Alternative EnergySources, An International Compedium, Hemisphere Publishing Corporation, Washington, 1979,volume 3.
7. F. A. Blake, "Central Receiver Solar Thermal Power", Proceedings, Solar Technology in theSeventies, Winnipeg, Canada, August, 1976.
261

SESSION 4: SOLAR MECHANICAL ENERGY STORAGE
263
PROJECT SUMMARY
Project Title: "Mechanical Energy Storage for Photovoltaic/Wind Project"
Principal Investigators: H. M. Dodd, B. C. Caskey, and H. E. Schildknecht
Organization:
Project Goals:
Project Status:
Contract Number:
Contract Period:
Funding Level:
Funding Source:
Sandia Laboratories, Division 4716, Albuquerque, New Mexico 87185(505) 264-8835
The goal of this project is to identify and develop mechanicalenergy storage technologies for eventual conmercialization, withthe emphasis on solar (sun and wind) sources. The projectutilizes results of systems analysis, special studies, anddetailed design studies to define areas for hardware demonstra-tion projects. The resulting cost and performance data will beavailable for consideration by industry. The project involvesboth Sandia in-house analysis and contracts with universitiesand industries.
System analysis has identified flywheel energy storage as themost promising of the mechanical energy storage technologies forresidential applications. Therefore, special study and detaileddesign study contracts (three with universities, two withindustries) address various aspects of stationary flywheelenergy storage. These contracts are essentially complete andprovide the basis for systems analysis that will yield a recom-mendation on construction of a demonstration flywheel system.
A study of industrial compressed air has been completed. Itshowed that no compressed air storage was in place that could beused by industry for charging from solar sources. Also, evenwith "free" underground caverns, economics do not favor solar/wind powered industrial compressed air systems before the year2000.
Initial results from a study of low head underground pumpedhydro storage indicate that the system may have economicpotential.
A detailed evaluation of residential flywheel energy storagesystems is under way. In addition to the cost and performancedata generated from study contracts, time-of-use pricing andenergy sell-back are included in the study.
This project will be transferred in its entirety to LawrenceLivermore Laboratory effective October 1, 1979.
C8-03-02-02-03
October 1977 - September 1979
FY1979 - $553,000
DOE, Division of Energy Storage, Advanced Physical Methods Branch
265

SOLAR MECHANICAL ENERGY STORAGE PROGRAMOVERVIEW AND SYSTEMS ANALYSIS RESULTS
B. C. CaskeySandia Laboratories
Systems Analysis Division 4716Albuquerque, New Mexico 87185
ABSTRACT
The current status of the Solar Mechanical Energy Storage Program is de-scribed, along with the remaining activities before Lawrence Livermore Labora-tory assumes program responsibility in October, 1979. Contractor results arepresented in other papers; preliminary system analyses results for residentialflywheel energy storage systems (FESS) are presented. Various phases of theprogram have addressed small-to-intermediate applications of photovoltaic/windenergy storage utilizing flywheels, compressed air and low head undergroundpumped hydro technologies.
INTRODUCTION
In 1977, the U.S. Department of Energy (DOE) assigned to Sandia Labora-tories (SLA) the primary responsibility for the Mechanical Energy Storage forPhotovoltaic/Wind program. Activities for that year included development ofan optimizing systems analysis computer program called ENERA and subsequentanalyses using it. Henry M. Dodd, et al., presented a paper in September 1977entitled "An Assessment of Mechanical Energy Storage for Solar Systems."(1)This paper and subsequent studies, all of which compared only the variousmechanical storage concepts with each other, concluded that flywheel systemsare the most promising for residential applications. Therefore, the primaryemphasis has been on the development of low-cost stationary flywheel technology.Other activities include a more detailed investigation of pneumatic-energystorage systems for industrial applications, low-head pumped-hydro storage, andcontinuing systems analysis efforts. The program has been described at varioustimes in references 2, 3, and 4.
To continue this work in future years, DOE has asked Lawrence LivermoreLaboratories (LLL) to assume the responsibility for the project. PacificNorthwest Laboratory (PNL) will assist LLL in some areas, i.e., compressed airand pumped-hydro activities.
SCOPE
This program is concerned with mechanical-energy storage modes that maybe used in conjunction with solar (including wind) inputs supplying small-to-intermediate loads. Since, for central-station utility applications, energystorage would be tied to the grid rather than to a solar energy source, thisprogram does not address central station applications.
Sandia Laboratories is a US Department of Energy (DOE) facility. This workwas supported by the Division of Energy Technology, US DOE, under ContractDE-AC04-76DP00789.
266

CONTRACTS
During FY79, seven contractors (4 industry, 3 university or college) sup-ported this program. All efforts are either completed or close to completion.In subsequent papers at this meeting, the results of each contract will bepresented. Additionally, MIT Lincoln Laboratory's Flywheel Energy Storageand Conversion System project will be presented during this session as Sandiais the project's technical monitor.
The seven contracts are:
FLYWHEELS
FESS with Photovoltaic InputFESS with Wind Turbine SupplyCellulosic FlywheelsFlexible FTywheelsVariable Inertia Flywheel
LOW-HEAD PUMPED HYDRO
Pumped Aquifer Storage System
INDUSTRIAL COMPRESSED AIR
Wm. M. Brobeck & AssociatesGarrett-AiResearchUniversity of MinnesotaTexas ASMUnion College
- The BDM Corporation
Applications for Solar/Wind - Jalar Associates
SYSTEMS ANALYSIS
SOLSTOR
Improvements to the project-developed ENERA code have resulted in a newcode (SOLSTOR) which includes the following significant features:
Time-of-day electricity pricing
Energy seliback to the utility
Off-peak storage charging
Simple, nonpredictive storage utilization logic
Energy flow paths for SOLSTOR when configured for a FESS and a photovol-taic (PV) collector are shown in Fig. 1.
Fig. 1 SOLSTOR Energy Flow Paths Example
267

Each component in SOLSTOR is characterized by a "size," an efficiency,and a cost. The cost includes fixed and variable terms, with the variableterm (cost per unit of size) also allowing for possible economies of scale.
The collector output and load demand are calculated on an hourly basisfrom TMY weather data (insolation and outside air temperature).
Economic parameters supplied to SOLSTOR include tax rates, tax credits,inflation rates, fuel escalation rates, the electricity sellback ratio, andutility electric rates. These electric rates may vary with time-of-day andwith the season of the year.
SOLSTOR performs a search over the multi-dimensional space (maximum of8 dimensions) to find the lowest life cycle system cost. This "optimal" con-figuration specifies the sizes of all components.
In order to achieve the best cost performance, all possible energy flowpatterns are allowed. Collector energy may 1) satisfy the load, 2) chargestorage, or 3) be sold to the utility. Storage may be charged from eitherthe collector or the utility. Simple priority logic dictates the appropriateallocation of energy for each option.
PRELIMINARY RESULTS
Preliminary results have been obtained using SOLSTOR configured with aflat plate PV collector and a FESS. The economic assumptions used for allruns were:
System Life 20 Years
Base/Price Year 1980
Initial Operation Year 1986
Tax Bracket 30%
Property Tax 0%
Tax Credit 20%
Down Payment 20%
Cost of Capital 10%
Inflation Rate 5%
Purchased Electricity Escalation 8% & 11%
These conditions were selected to be representative for an individualhomeowner.
Some of the system assumptions were: \
268

ARRAY
FESS
LOCATIONS
RESIDENCE
ELECTRICITYCOSTS (tf/kWh)
New York
$117/m2 + $1047; 1156 Efficiency; Flat Plate
$748*(size in kWh) 0" 8 3 + $1500
New York, Phoenix
1520 ft2; All Electric with Heat Pump
1:1
Phoeni x
SummerWinter
SummerWinter
13.911.2
5.154.51
PEAK:OFF PEAK
3:1
22.8:7.618.5:6.17
3.14:2.717.14:2.38
6:1
27.3:4.5521.9:3.65
9.51:1.598.33:1 .39
O&M 1.5% of Initial Capital
The array costs represent DOE's 1986 goal of 50<t/Wp (1975$) converted to1980$ and with markups, installation, and other system costs added.
The FESS costs were based on preliminary figures from Brobeck on produc-tion runs of 100,000 units. The $1500 fixed cost is for site preparation(underground pit) and installation. An economy of scale factor was calculatedfrom point designs at 10 and 50 kWh sizes. Although Brobeck presented thenumbers as production costs (not prices), no markup was included for this pre-liminary study. The function used results in $656/kWh and $415/kWh for the10 and 50 kWh units, respectively.
The 1:1 electricity costs were provided by the utilities in New York andPhoenix. The 3:1 and 6:1 ratio costs were determined so -.hat the total elec-tric bill for a customer (without this solar/storage system) would not change.Off peak rates were in effect on weekends and from 9PM-9AM in summer or8PM-8AM in winter.
Figure 2 displays SOLSTOR results for optimal system configurations atPhoenix. The life cycle cost ratio is the annualized life cycle system costplus net purchased electricity divided by the annualized cost of purchased elec-tricity if no system was used. It provides a measure of the goodness of thesystem; negative values indicate that the homeowner would make money (receivea check from the uti1ity)--probably an unrealistic condition.
SELLBACK
RATIO
0.0
0.25
0.50
0.75
L IFE CYCLE
COST RATIO
1:10.89
0.87
0.78
0.52
1;1
0.80
0.77
0.55
0.22
fi-l0.76
0.72
0,11)
0.09
ARRAY SIZE
(H2>
,Jil13.
53.
150.
150.
* i
17.
59.
150.
150.
B-1
48.
61.
150.
150.
HESS SIZE
CKWH)
•U l ,0.
0.
0.
0.
* . !0.
0.
0.
0,
K.I
0.
0.
0.
0.
SELLBACK
RATIO
0.00
0.75
n.5d
1.75
L IFE CYCLE
COST RATIO
hi.0.79
0.71
n.5n
Hi ?i
3:40.69n-">9
n.?7
-n.tf.
6:1
0.65
(1.51
D.lfi
-n. in
ARRAY SIZE
( H 2 )
52.
19,Kn.
ISQi
3: ]
51.
1511.
1511.
151.
55.
15(1.
15(1.
15(1.
FESS S IZE
CKUH)
0.
n.
n.n.
n.0.
n.n.
6:1
0.
(i.
i i .
( i.
3X ELECTRICITY ESCALATION61 ELECTRICITY ESCALATION
Fig, 2. Preliminary SOLSTOR Results for Phoenix.
269

These results show that a FESS (with the costs assumed) is not viable inPhoenix in 1986, although PV-only systems are attractive. The array size waslimited to 150 m2, which completely covers the residence roof.
Figure 3 presents SOLSTOR results for New York. Although less insolationis available at New York, the high electricity rates generally yield more costeffective, larger systems when compared to Phoenix. FESSs are used in somecombinations of time-of-day and sell back ratios.
SELLBACK
RATIO
0,0
0.25
0,50
0.75
L IFE CYCLE
COST RATIO
1:1
0.85
0.81
0.62
0.12
i l l
0.77
0,65
1,10
0.15
hil
0.71
0.58
0.30
0.00
ARRAY SIZE
(M 2 )
1:1
50.
120.
150.
150.
l i l
55,
150,
150.
150.
hil
76.
150.
150.
150.
FESS SIZE
U H H )
.1:1,0,
0,
0.
0,
);l0,
0.
0.
0.
6:1
11.
0.
0.
21.
3% ELECTRICITY ESCALATION
SELLBACK
RATIO
0.00
0.25
0,50
0,75
L IFE CYCLE
COST RATIO
1:1
0.71
0.67
0.18
0.28
i:l
0.65
0.52
0,27
0,01
6:1
0.58
0.11
0.13
-0.23
ARRAY SIZE
CM2)
1:1
138.
150.
150.
150.
r-i112,
15(1,150.
150.
Pil
103.
T?0i
150.
150.
FESS SIZE
(KWH)
1;129.
0.
0,
0.
hi20.
n.0.
0.
Brl
l i .
n.16.
13.
62 ELECTRICITY ESCALATION
Fig. 3. Preliminary SOLSTOR Results for New York
Off peak charging is evident when FESSs are used at 6:1 time-of-day ratio,but not at lower ratios.
To portray the relative amounts of energy flows in various paths, Fig. 4is presented. It represents a case {0.25 sellback, 6:1 time-of-day ratio) thatutilizes all possible modes of operation.
PV FLAT PLATE ARRAY150 M2, i' 1.11
20 .1
FESS
, „ - 0.72.7
7.1
13.0,
0.8,
1.9
INVERTER14 >H
n - 0.957
12.«
o.a1.8
8.5 <-
L
15.2
SELLBACK - 0.25TOD PRICING 6:161 ELECTRICITY ESCALATIONta 165 7200720-10
[ECTir-IER3.6 «»1-0.97
S0LSI09 ' » " T.0V RESULTS
(FLOHS «h ; * HWH/Y)
Fig. 4 SOLSTOR Energy Flow Results
270
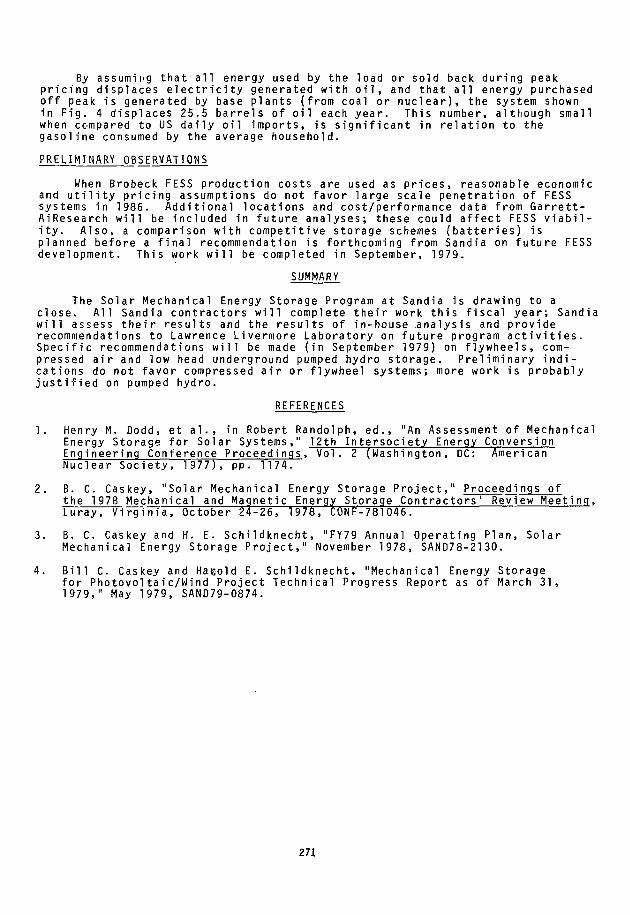
By assuming that all energy used by the load or sold back during peakpricing displaces electricity generated with oil, and that all energy purchasedoff peak is generated by base plants (from coal or n u c l e a r ) , the system shownin Fig. 4 displaces 25.5 barrels of oil each year. This number, although smallwhen compared to US daily oil imports, is significant in relation to thegasoline consumed by the average household.
PRELIMINARY OBSERVATIONS
When Brobeck FESS production costs are used as prices, reasonable economicand utility pricing assumptions do not favor large scale penetration of FESSsystems in 1986. Additional locations and cost/performance data from Garrett-AiResearch will be included in future analyses; these could affect FESS viabil-ity. Also, a comparison with competitive storage schemes (batteries) isplanned before a final recommendation is forthcoming from Sandia on future FESSdevelopment. This work will be completed in September, 1979.
SUMMARY
The Solar Mechanical Energy Storage Program at Sandia is drawing to aclose. All Sandia contractors will complete their work this fiscal year; Sandiawill assess their results and the results of in-house analysis and providerecommendations to Lawrence Livermore Laboratory on future program activities.Specific recommendations will be made (in September 1979) on flywheels, com-pressed air and low head underground pumped hydro storage. Preliminary indi-cations do not favor compressed air or flywheel systems; more work is probablyjustified on pumped hydro.
REFERENCES
1. Henry M. Dodd, et al., in Robert Randolph, ed., "An Assessment of MechanicalEnergy Storage for Solar Systems," 12th Intersociety Energy ConversionEngineering Conference Proceedings, Vol. 2 (Washington, DC: AmericanNuclear Society, 1 9 7 7 ) , pp. 1174.
2. B. C. Caskey, "Solar Mechanical Energy Storage Project," Proceedings ofthe 1978 Mechanical and Magnetic Energy Storage Contractors' Review Meeting,Luray, Virginia, October 24-26, 1978, CONF-781046.
3. B. C. Caskey and H. E. Schildknecht, "FY79 Annual Operating Plan, SolarMechanical Energy Storage Project," November 1978, SAND78-2130.
4. Bill C. Caskey and Haeold E. Schildknecht, "Mechanical Energy Storagefor Photovoltaic/Wind Project Technical Progress Report as of March 31,1979," May 1979, SAND79-0874.
271

PROJECT SUMMARY
Project Title:
Principal Investigator:
Organization:
Project Goals:
Project Status:
Contract Number:
Contract Period:
Funding Level:
Funding Source:
Conceptual Design of a Flywheel Energy Storage System
F. C. Younger
William M. Brobeck & Associates1235 Tenth StreetBerkeley, California 94710(415) 524-8664
The development of a conceptual design for aflywheel energy storage system suitable for on-site interfacing with small scale solarenergy sources. The basic design objective isto provide a generous margin of safety and aboveaverage reliability and efficiency at the lowestpractical cost.
A basic concept for a flywheel energy storagesystem to interface with solar energy sources hasbeen studied. This concept utilizes a constantvoltage motor/generator directly connected to aflywheel rotor. The field current of the motoris controlled to maintain the voltage level at theoptimum operating voltage of the array of photovoltaiccells. When a surplus of electrical energy fromthe solar source occurs, the voltage of the arraytends to rise above the set voltage of the motor/generator, and surplus power drives the motor toaccelerate the flywheel. When a deficiency in solarenergy occurs, the voltage of the array tends todrop below the set voltage, and power is drawn fromthe flywheel via the generator.
A variety of motor types and rotor types have beenstudied to arrive at a conceptual design to meetthe program objectives. A fiber-composite rotordriving a separately-excited dc motor appears asthe most economical way to satisfy the basicrequirements. Design details have been examinedto confirm the dynamic stability of the rotorsuspension system and to determine the energylosses and system efficiency.
Optimization studies, design layouts, detailedspecifications, and cost estimates have been made.A final report is being prepared.
07-3663
July 1978 - August 1979
$139,053
Sandia Laboratories
273

FLYWHEEL ENERGY STORAGE SYSTEM CONCEPTFOR A RESIDENTIAL PHOTOVOLTAIC SUPPLY
Francis C. YoungerWilliam M. Brobeck & Associates
1235 Tenth StreetBerkeley, California 94710
ABSTRACT
A conceptual design of a flywheel energy storage system suitable for on-siteinterfacing with small scale solar energy sources has been developed. The basicdesign objective was to provide a generous margin of safety and above averagereliability and efficiency at the lowest practical cost. This paper describes thebasic design concept and the general approach to the conceptual design of the energystorage system. The basic concept to interface with solar energy sources utilizesa constant voltage motor/generator directly coupled to a flywheel rotor. Thevoltage level of the motor is maintained at the optimum operating voltage of thearray of photovoltaic cells and permits peak power tracking. Power is drawn fromthe flywheel-driven generator when the voltage output of the array drops below itsoptimum value and power is delivered to the flywheel via the generator (thenoperating as a motor) when the voltage rises above the optimum value. A varietyof motor types and flywheel rotor types has been studied to arrive at a conceptualdesign to meet the program objectives. A fiber-composite rotor driving a separately-excited motor satisfies the basic requirements. To obtain acceptable efficiency andlow rundown losses, the. flywheel operates in a vacuum and has a combination ofmagnetic thrust support and ball bearings to reduce bearing friction in an economicalfashion. The need for rotary vacuum seal is eliminated by the use of a hermetically-sealed magnetic ur-wer coupling.
INTRODUCTION
The Flywheel Energy Storage System (I-ESS) is intended to enhance the value andutility of small solar power generating plants. The timely development of economicalenergy storage concepts is crucial in many solar power applications. The variablenature of solar energy severely limits its applications if some practical storagesystem is not made available. Batteries, pumped-hydro, compressed air, thermaland mechanical energy storage all offer the potential for suitable systems applications.Economic factors may favor one system in a particular application and yet anotherin a different application depending upon their performance and cost characteristics.However, at present accurate cost and perfonnance characteristics do not exist foremerging technologies. New designs with generous margins of safety have not yetbeen demonstrated for mechanical energy storage systems. A concept which could leadtoward a practical demonstration is presented.
This paper describes the effort for the development of a conceptual design for aFESS suitable for on-site interfacing with small scale solar energy sources. The newdesign has as objectives a generous margin of safety, high reliability and efficiencyobtained at the lowest practical cost. The design is for a stationary application, inwhich no cost premiums are allowed for minimizing size and weight. The basic design
274

objective is a system which can be economically manufactured in existing industrialfac i l i t i es using conventional production methods.
Attainment of.the highest practical charge/discharge efficiency is a high pr ior i tygoal. This requires very careful attention to design detai ls, as well as the selectionof the most appropriate engineering concept.
BACKGROUND
The FESS f o r use w i th a small r es i den t i a l so la r energy source was studied andconceptual ly designed under cont rac t to Sandia Laborator ies , Albuquerque, New Mexico,as par t o f a program supported by the U. S. Department o f Energy, Ass is tantSecretary f o r Energy Technology, D iv is ion o f Energy Storage Systems. Early work /•,<on t h i s program, i t s goals and ob jec t i ves were described a t a previous review meeting. 'The goals have not s i g n i f i c a n t l y changed since tha t review meet ing, but the conceptualdesign has evolved during the course o f the study as ways o f improving the designto g ive greater r e l i a b i l i t y , lower losses, and lower costs were uncovered.
The program ob jec t i ve i s the design o f storage un i t s su i t ab le f o r use w i th smallto in termediate scale so la r sources. The nominal energy storage capaci ty i s i nthe range o f 5 kWh to 100 kWh; the s p e c i f i c requirements are f o r the de ta i l ed designof a 10 kWh storage system and fo r a de ta i l ed cost estimate f o r a 50-kWh system.The requi red power r a t i n g o f the 10-kWh system is 5 kW. These un i ts are to have ane l e c t r i c a l i n te r face f o r 60 Hz/220 Volts single-phase power. The cont ro l system mustmaintain the desired frequency and voltage over the f u l l r o t o r operat ing speed range.
The round - t r i p e f f i c i e n c y f o r charging and discharging must exceed 70 percent .This requires tha t the one-way e f f i c i e n c y exceed 84 percent . The ra te o f loss o fstored energy due to f r i c t i o n and windage must not exceed 5 percent per hour.
The design must have a generous f a c t o r o f safety and high r e l i a b i l i t y . I t mustbe designed f o r a l i f e expectancy o f at leas t twenty years dur ing which a minimumof 10,000 charge/discharge cycles may be encountered. These cycles cover the f u l lspeed range o f the design. Allowance may have to be made f o r any overspeed tes tswhich might occas iona l ly be performed.
PROJECT DESCRIPTION
The p ro jec t i s d iv ided i n to four main tasks covering (1) the basic system concept;(2) o p t i m i z a t i o n ; (3) design of a 10-kWh u n i t ; and (4) est imate f o r a 50-kWh u n i t .
The basic system concept e f f o r t and subsystem opt ions cons is t o f an evaluat iono f workable engineering concepts and the narrowing down o f choices to the bestsubsystem opt ions . Subsystem opt ions inc lude f lywheel c o n f i g u r a t i o n , ma te r i a l s ,f lywheel housing and containment, sea ls , type o f motor/generator , suspension system,mounting, c o n t r o l s , a u x i l i a r i e s , and ins t rumenta t ion . Problems o f sa fe t y , e f f i c i e n c y ,losses end p a r a s i t i c loads, manu fac tu rab i l i t y , maintenance, and economics are considered.
Various f lywheel conf igura t ions and mater ia l combinations have been consideredf o r energy storage systems. I t has been shown tha t high energy densi ty i s p o t e n t i a l l yachievable w i th mater ia ls possessing a high s t rength- to -we ight r a t i o . In manyengineering app l i ca t ions l i g h t weight i s very important and a premium may be paid f o ra material with a high strength-to-weight rat io . However, for a u t i l i t y application,additional expense merely to save weight is unreasonable. The appropriate designcri ter ion is maximum energy at minimum cost.
275

CONCEPTUAL DESIGN
The FESS concept integrated with a residential photovoltaic (PV) supply isshown in Fig. 1. The FESS acts as an energy buffer between the direct currentPV supply and the alternating current utility power source to permit an optimumutilization of the available solar energy. The PV supply represents a variablevoltage dc source with its voltage dependent upon its temperature and current andupon the solar insolation. With increasing insolation, the available PV energywill rise and may exceed the load demand of the home; excess power is then divertedfor storage in the flywheel shown in the pit below the garage floor. This storedenergy is subsequently recovered to supply electrical energy to the home when theavailable solar energy is inadequate to satisfy the demand.
In addition to providing an energy storage capacity via the flywheel, the FESSprovides the necessary energy conversions to match the requirements of the variousportions of the integrated system. These include the conversions from mechanical(kinetic) energy to electrical energy, from dc to ac, and the tracking of optimum dcvoltages. Figure 2 shows the general flow of power and main system elements. Thegenerator coupled to the flywheel provides the electrical to mechanical energyconversion using adjustable field current to provide control of the power flow. Thegenerator converts mechanical energy into electrical energy to discharge the flywheelwhen there is a demand for its energy or it acts as a motor to reverse the energyflow when there is a surplus of solar energy.
The link shown between the solar unit, the generator, and the power conditioneris a dc link set at the voltage which optimizes the power output of the PV cells.This optimum value of voltage depends upon the temperature of the PV cells and thesolar insolation. The voltage is controlled by the field excitation of the generatorand the flywheel speed. As the flywheel speed increases, the field current is reducedto maintain the desired voltage, The power conditioner provides the required dc to acconversion.
The flywheel/generator system is shown in Fig, 3 and 4. The main elements are theflywheel, motor/generator, vacuum vessel and the flywheel suspension system. Thesuspension system consists of support bearings to carry the flywheel weight and dynamicloads and damper assemblies to prevent whirl instabilities.
TEN-KWH FLYWHEEL
The flywheel as shown in Fig, 5 is a biannulate rim supported by tension-balancedpolar-catenary spokes which bridge the zone between the hub and the rim. This fly-wheel is similar to the one described at a previous review meeting.(2) For the 10-kWhunit, the biannulate rim, consisting of a fairly thick portion filament wound withE-glass/epoxy and a thin circumferential overwrap of Kevlar 49/epoxy, has an outsidediameter of 1.267 m and an inside diameter of 1.038 m. The glass/Kevlar interfacediameter is 1.249 m. The rim axial length is 333 mm. The relatively large amountof the inexpensive E-glass keeps the cost down and the high modulus Kevlar 49overwrap suppresses the radial tension stresses which otherwise would occur in athick rim. This design permits a high volumetric energy density as a large percentof the swept volume of the flywheel is occupied by highly stressed fiber-compositematerial. The rim weight is 278 kg and the total weight is 411 kg. For 10-kWhof available energy, the peak stored energy is 13.5 kWh at 9800 rpm, and the energydensity is 32.8 Wh/kg.
A 584-mm diameter hub reduces the radial space between the hub and rim to allowthe Kevlar 29 spokes to be short enough to provide adequate rigidity to maintain hub/rimconcentricity.
276

The large hub is strengthened by a pre-stressed Kevlar 49 overwrap which partial lyresists the centrifugal loading on the aluminum portion. The radial stresses in thehub web are minimized by i ts conical shape.
A high margin of safety for the rotor is provided by designing to a low stresslevel. The stresses in the fiber-composite biannulate rim are shown in Fig. 6. TheKevlar 49 overwrap has the higher stress primarily because i t has a higher modulusof elast ic i ty.
DRIVE MOTOR
The motor generator for converting electrical energy to flywheel kinetic energyis shown in Fig. 7. The motor is a separately-excited three-phase alternatorconnected to run as a brushless dc motor by using electronic commutation <vid a shaftposition sensor. The design is based on reasonable modifications to an existing9 kVA aircraft alternator. The unit has two slip rings for field excitation current.An additional slip ring is shown for control of excitation current for the magnet coilsfor a synchronous magnetic coupling used to transmit power across a non-magnetic vacuumbarrier. This magnetic coupling and vacuum barrier are also shown in Fig. 7. Theouter portion of the coupling is driven by the motor and holds the magnet coilwindings. The inner portion which is attached to the flywheel via a 12.7-mm diameterquill shaft is driven synchronously as a salient pole machine running on reluctancetorque. The gap between the inner and outer portion is occupied by a vacuum barriershown as a "yacuum interface can."
SUSPENSION SYSTEM
The suspension system consists of a combination of precision ball bearings anda magnetic thrust bearing as shown in Fig. 8 and 9. The magnetic thrust bearingsupport 90 percent of the rotor weight and is shown as two parts in Fig. 8. The upperpart labeled "wound lifting mag. (stationary)" is the portion that is electricallyenergized to attract the lower part labeled "lifting mag. (rotating)." Both partsare silicon iron with an outside diameter of 273 mm and the gap between them is anearly uniform .76 mm with very little runout. The geometry of the combined bearingsystem is designed to insure that the gap between these two parts remain constanteven if the rotor were experiencing a small precession with nutation.
A small amount of precessional motion is permitted by the flexibility of thesuspension system. The upper and lower bearing supports are mounted in rubber padswhich permit a limited amount of motion and which provide damping to prevent dynamicinstability. The system operates above the critical speed and asynchronous whirlmodes can be excited unless adequate damping is provided.
CONTROL SYSTEM
The FESS control system maintains the optimum flow of power from the PV supplyby diverting excess power from the PV supply to the flywheel when the available solarpower exceed the demand of home and by taking power from the flywheel when the demandis greater than that available from the PV supply. For a given insolation andtemperature of the PV cells, there is an optimum dc voltage where the maximum poweris drawn from the PV supply. If the load demand increases above this maximum poweroutput, it would cause the voltage output of the PV supply to drop excessively.This voltage drop will be prevented and power diverted from the flywheel if theoutput voltage of the generator is set at the optimum value. Similarly if theload demand decreases, the voltage of the PV supply tends to rise as the currentfalls. This rise in voltage and loss of current will also be prevented by havingthe output voltage set at the optimum value because as the PV output voltage rises,the generator becomes a motor and diverts power to the flywheel.
277

The FESS control system continuously monitors the dc bus voltage and sets i t toa value which maximizes the power output of the PV supply. The set point voltage isproduced through an integrated c i rcui t pulse width modulator that regulates the f ie ldcurrent of the generator. A schematic diagram for the control system is shown inFig. 10.
The c i rcui t for the electronic commutation of the three-phase motor is alsoshown. A three-phase waveform generator develops the control signals for the six powertransistors which drive the motor. The developed signal is a periodic three-phasesquare wave. The frequency of operation is a direct function of the rotor speed asthe clock signal is generated from the rotor position sensor. A unique feature isthat the l ine voltage is monitored to prevent common devices from turning on simul-taneously. This allows the conduction angle of the waveform to approach a maximumof 120°.
The power transistor c i rcui t for driving the motor is shown in Fig. 11. Thedrive electronics consists of NPN Darlington Transistors and diodes for the driveand generation modes. The transistors that are referenced to ground are drivendirectly through current-amplifiers while the transistors that are referenced to .hepositive bus are driven from optical-isolators through current amplifiers. Theoptical-isolators are referenced to a voltage that is 5 Volts below the positivebus. This voltage is developed through an integrated c i rcui t chopping regulator.
EFFICIENCY AND OPTIMIZATION
Rundown losses at 10,000 rpm are l isted in Table 1. Total losses are 150 wattswhich correspond to 1.5 percent per hour. The pie graph in Fig. 12 i l lustrates therelative magnitude of the rundown losses.
TABLE 1. Rundown Losses at 10,000 rpm
Component
Main bearingsBottom damper bearingsMagnetic coupling bearingsMagnetic lift excitationMagnetic lift hysteresisMagnetic lift eddy currentOil lube pumpWindage
Losses in watts
3622330420233
Total 150
Rundown losses vary with speed and will decrease as the speed is reduced. Amajor factor in rundown losses is windage. In order to minimize this the enclosureis evacuated. For the windage loss in Table 1, the vacuum level is 2 x 10"? atmospheres.
Power conversion efficiency is a function of power level and speed. At the maximumpower level of 5 kW, the average efficiency over the operating range is 71 percent.This value drops with lower power level until it reaches zero at zero power.
278

COST ESTIMATE
TEN-KWH SYSTEM
Layout drawings, specifications and cost estimates for a prototype and for serialproduction quantities of the 10 kWh, 5 kW flywheel energy storage system have beenprepared based upon the developed concepts. Serial production costs are based uponestimates of costs for fabricating components to designs and methods of fabricationtypical of mass-production techniques.
In the quantity-production costs estimates the tooling costs has not beenestimated and, in general, the material and production cost has been based upon theassumption of production quantities of 100,000 sets of parts where die costs are of theorder of a few cents per part. Then for each factor of ten reduction in quantity anincrease of 17.6 percent in cost was assumed. This method of estimation is valid forthree to four decades in quantity reduction but becomes unrealistic for small quantitieswhere alternate methods of fabrication become dominant.
Table 2 shows the estimated 10 kWh total system cost for various quantities ofproduction. In quantities of 100,000 units per year, the total production cost isestimated to be $5057 or $505 per usable kilowatt-hour stored.
TABLE 2, Estimated 10 kWh Total System Cost
Quantity
lof104105105
MechanicalParts
7085584549554445
Represents the change fromin-house design.
FIFTY-KWH SYSTEM
Controller PeakPower Tracker
536478441412
Inverter
795276'235200
a commercially purchased unit
Total
8416659956315057
to an
In estimating the cost of the 50-kWh, 10 kW FESS, heavy dependence was placed uponthe methods and unit costs developed for the 10-kWh storage system. Because of thegreater weight of materials in the larger unit, break points in material cost occurfor a small number of units.
The rotor assembly proper was scaled by a factor of 50/10 for all componentsin weight and a factor of AfS in all dimensions,
Table 3 gives the estimated 50 kWh total system cost including the mechanicalassembly, the electrical controller assembly and the synchronous inverter. Inproduction quantities of 100,000 units per year, the estimated total system costis $18,561. This amounts to a $371 initial capital cost per usable kilowatt-hourstored for the 20-year lifetime unit.
279

TABLE 3. Estimated 50 kWh Total System Cost
Quant i ty Mechanical
103io|
105
aRepresents thehouse des ign.
25,86022,34019,56017,695
change from a
CONCLUSIONS
Controller
706623564516
commercially
Inverter
1589485a
411350
purchased unit
AND RECOMMENDATIONS
Total
28,15523,44820,53518,561
to an in
This design study indicates that a reliable, efficiency flywheel energy storagesystem can be manufactured at a reasonable cost.
It is recommended that a prototype model be produced to demonstrate theviability of the concept.
REFERENCES
1. F. C. Younger, "Conceptua1 Design of a Flywheel Energy Storage System," Proceedingsof the 1978 Mechanical and Magnetic Energy Storage Contractors' Review Meeting,Luray, Virginia, October 1978.
2. F. C. Younger, "A Composite Flywheel for Vehicle Use," Proceedings of the 1978Mechanical and Magnetic Energy Storage Contractors' Review Meeting, Luray,Virginia, October 1978.
280
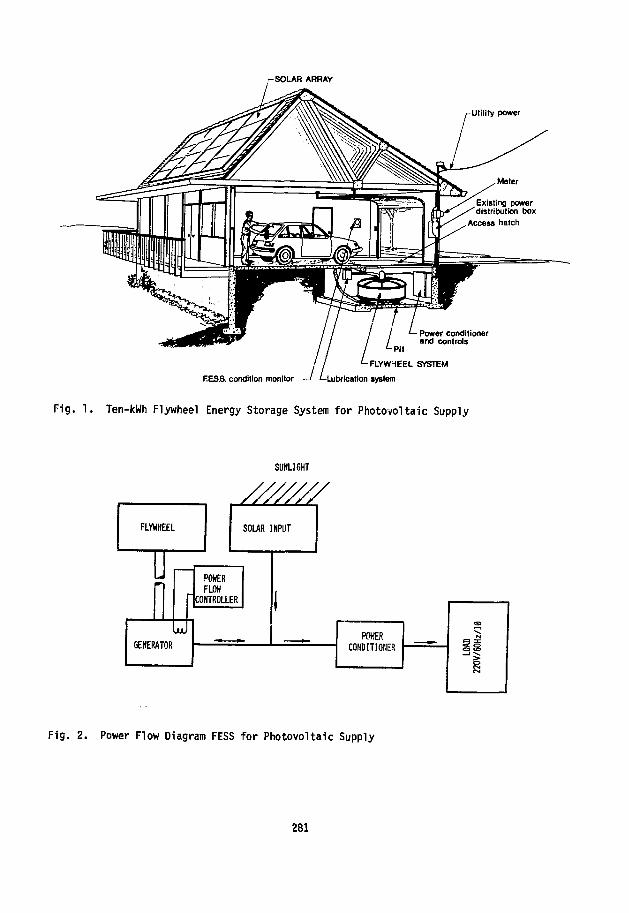
-SOLAR ARRAY
Utility power
Pit
FLYWHEEL SYSTEM
Power conditionerand controls
F.ESS. condition monitor - ' ^Lubrication lystem
Fig. 1. Ten-kWh Flywheel Energy Storage System for Photovoltaic Supply
SUNLIGHT
FLYWHEEL SOLAR INPUT
POWERFLOW
CONTROLLER
GENERATOR
Fig. 2. Power Flow Diagram FESS for Photovoltaic Supply
281
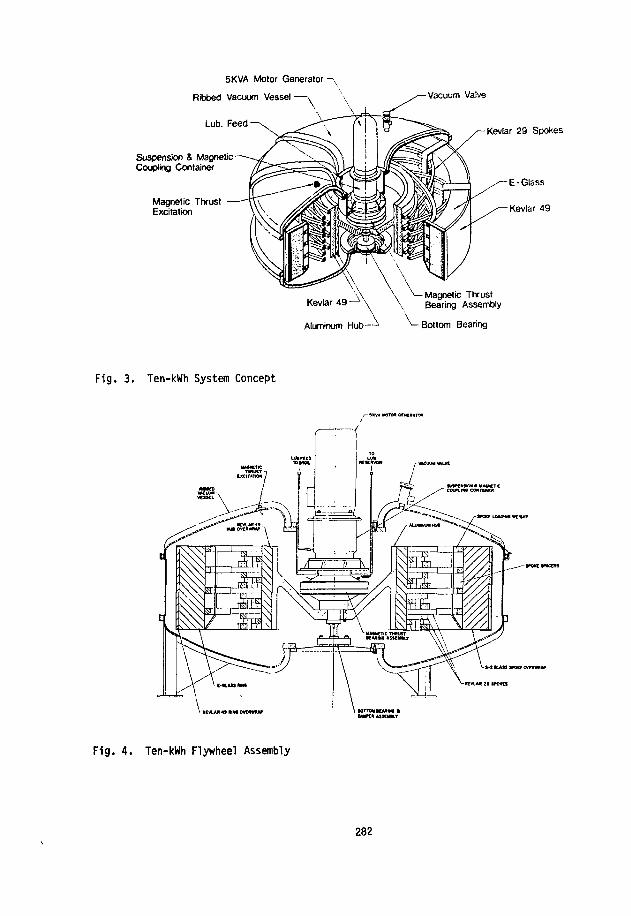
5KVA Motor Generator -
Ribbed Vacuum Vessel
Lub. Feed
Suspension & MagneticCoupling Container
Magnetic ThrustExcitation
Vacuum Valve
Kevlar 29 Spokes
Kevlar 49
Aluminum Hub
^— Magnetic Thrust\ Bearing Assembly
^•Bottom Bearing
Fig. 3. Ten-kWh System Concept
5KV* MOTOR Of NCRATO"
9 K K E LMOHM WEWHT
Fig. 4. Ten-kWh Flywheel Assembly
282

Spoke Weight
Spoke
Hub
Spacer
F ig . 5. Ten-kWh Flywheel
120-
I 110-X
g 100-
£ 8t>-
5 60-
20-
0-
ROTOR BIH 7AHGEfTlAL STRESS VS. RVfUS
10.000 RPH B0TAT10HAI SPEED
22
RADIUS 11 INCHES
Fig. 6. Stresses in Biannulate Rim of Flywheel
KEVLAR49
283
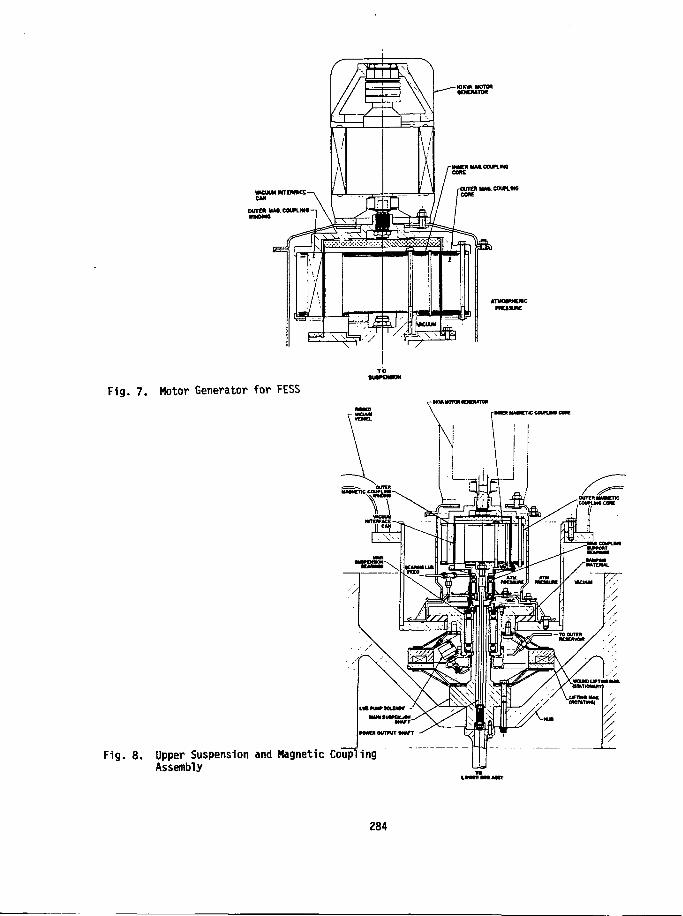
Fig. 7. Motor Generator for FESS
TKCUPLMtCOK
Fig. 8. Upper Suspension and Magnetic CouplingAssembly
284
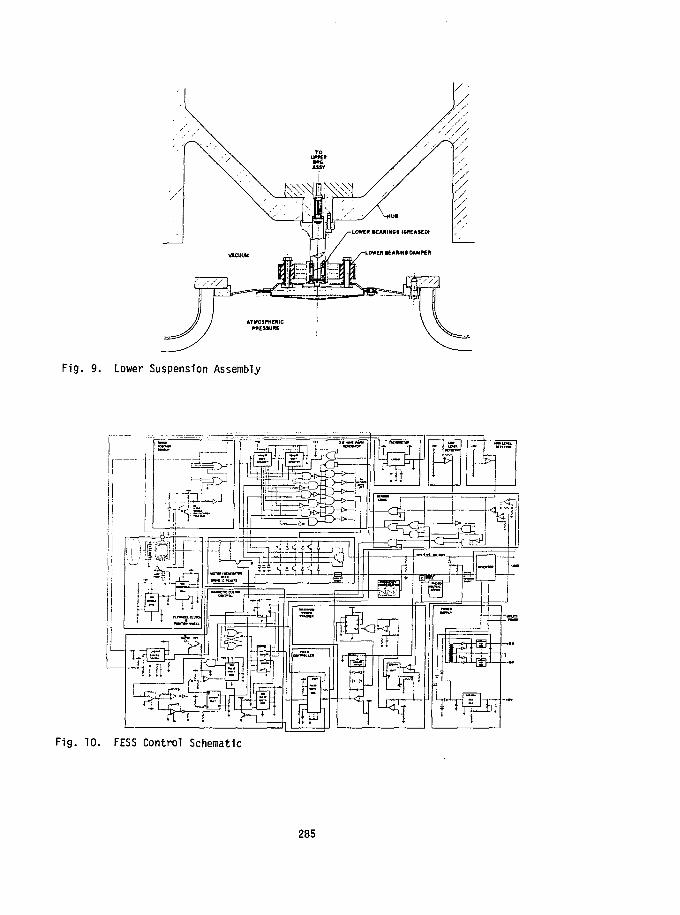
Fig. 9. Lower Suspension Assembly
Fig. 10. FESS Control Schematic
285

Fig. 11. Power Transistor Circuits
RUNDOHN LOSS CHART
10,000 RPM - NO LOAD
Fig. 12. Rundown Loss Chart
286

Project Title:
Principal Investigator:
Organization:
Project Goals:
Project Status:
Contract Number:
Contract Period:
Funding Level:
Funding Source:
PROJECT SUMMARY
Residential Flywheel with Wind Turbine Supply
Theodore W. Place
AiResearch Manufacturing Company of California2525 W. 190th StTorrance, California 90509
To identify a cost-effective mechanical storage device,which, when used with a wind turbine, would replace orsupplement utility power.
A system composed of a gearbox, variable transmission,a generator, and a hermetically sealed flywheel hasbeen selected. A tradeoff of components resulted inthe selection of a synchronous generator; variable belttransmission; and a hermetically sealed, magneticallycoupled, magnetically levitated, E-glass compositerotor assembly. The analysis defined the geometry, thesafety, and the reliability of the design of a 10 kw-hrsystem. The 10 kw-hr design was defined in a layoutdrawing, and then extrapolated to a 50 kw-hr design.Cost estimates of both the 10 kw-hr and the 50 kw-hrsystems are complete. A final report has been submittedfor approval, thus completing the program.
07-9093
FY '78
$135K
U.S. Department of Energy, Division of Energy StorageSystem
287
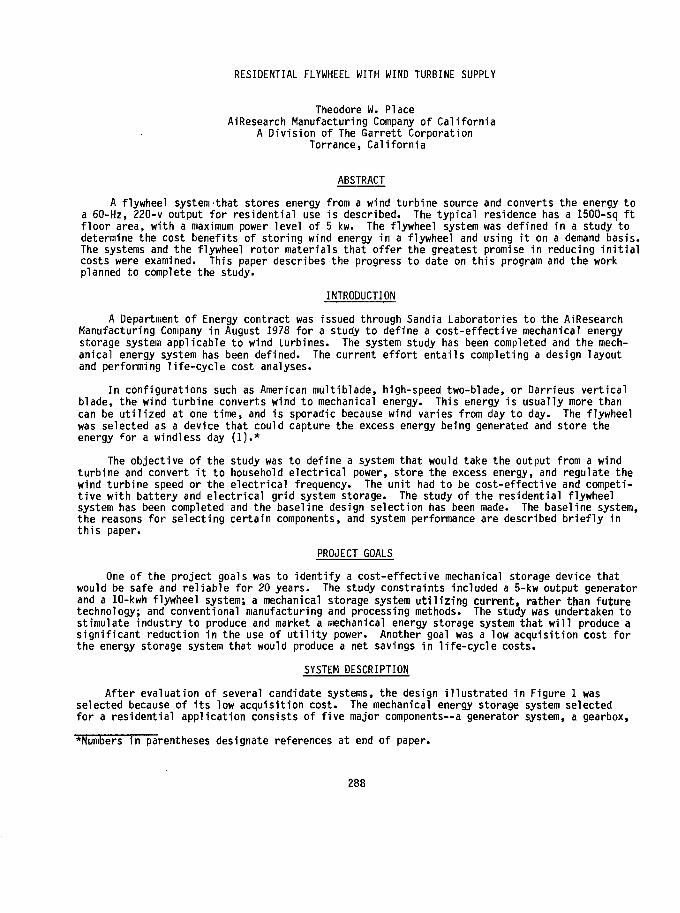
RESIDENTIAL FLYWHEEL WITH WIND TURBINE SUPPLY
Theodore W. PlaceAiResearch Manufacturing Company of California
A Division of The Garrett CorporationTorrance, California
ABSTRACT
A flywheel system that stores energy from a wind turbine source and converts the energy toa 60-Hz, 220-v output for residential use is described. The typical residence has a 15OO-sq ftfloor area, with a maximum power level of 5 kw. The flywheel system was defined in a study todetermine the cost benefits of storing wind energy in a flywheel and using it on a demand basis.The systems and the flywheel rotor materials that offer the greatest promise in reducing initialcosts were examined. This paper describes the progress to date on this program and the workplanned to complete the study.
INTRODUCTION
A Department of Energy contract was issued through Sandia Laboratories to the AiResearchManufacturing Company in August 1978 for a study to define a cost-effective mechanical energystorage system applicable to wind turbines. The system study has been completed and the mech-anical energy system has been defined. The current effort entails completing a design layoutand performing life-cycle cost analyses.
In configurations such as American multiblade, high-speed two-blade, or Darrieus verticalblade, the wind turbine converts wind to mechanical energy. This energy is usually more thancan be utilized at one time, and is sporadic because wind varies from day to day. The flywheelwas selected as a device that could capture the excess energy being generated and store theenergy for a windless day (1).*
The objective of the study was to define a system that would take the output from a windturbine and convert it to household electrical power, store the excess energy, and regulate thewind turbine speed or the electrical frequency. The unit had to be cost-effective and competi-tive with battery and electrical grid system storage. The study of the residential flywheelsystem has been completed and the baseline design selection has been made. The baseline system,the reasons for selecting certain components, and system performance are described briefly inthis paper.
PROJECT GOALS
One of the project goals was to identify a cost-effective mechanical storage device thatwould be safe and reliable for 20 years. The study constraints included a 5-kw output generatorand a 10-kwh flywheel system; a mechanical storage system utilizing current, rather than futuretechnology; and conventional manufacturing and processing methods. The study was undertaken tostimulate industry to produce and market a mechanical energy storage system that will produce asignificant reduction in the use of utility power. Another goal was a low acquisition cost forthe energy storage system that would produce a net savings in life-cycle costs.
SYSTEM DESCRIPTION
After evaluation of several candidate systems, the design illustrated in Figure 1 wasselected because of its low acquisition cost. The mechanical energy storage system selectedfor a residential application consists of five major components—a generator system, a gearbox,
•Numbers in parentheses designate references at end of paper.
288

WINDTURBINE
CLUTCH
M
In60 Hz220V
AC
GENI
VOLT.REG
GEARBOX
FLYWHEELCONTROLLER
VARIABLESPEED
TRANS-MISSION
\A 'X
MAGNETICCOUPLING
CLUTCH
FLYWHEEL
Fig. 1. System Description with ac Generator
a variable-speed belt transmission, a flywheel storage system, and a control system. In thesystem analysis, candidates for each of the above components were substituted into the perform-ance and cost analysis to finalize the system.
The mechanical design of the system was constrained by the requirement that shaft powerbe supplied at a constant 125- or 175-rpm speed, depending on which test data were to beevaluated (2). The output of the system was defined by Sandia Laboratories as 5-kw, 60-Hz,220-v electrical supply.
To evaluate system performance, two preselected test sites were used--one of high and oneof low wind activity. The wind data in kilowatt hours were obtained for a typical week ineach of the four seasons. *
The electrical demand was calculated for an all-electric house with a floor area of 1500sq ft as a model for the system. The electrical demand data were then correlated with the windinput data for the system.
COMPONENT DESCRIPTIONS
The selection of the components for the total system first emphasized low acquisition cost.Although system performance was secondary, a minimum input/output efficiency of 70 percent wasrequired. In addition, the parasitic losses could not exceed 500 w at the 10 kw-hr storagelevel. The total unit had to be reliable and meet safety requirements.
FLYWHEEL
The flywheel rotor had to be defined in terms of shape, material, weight, and vacuumenvironment. The complete flywheel system includes bearings, coupling, and the structurehousing the rotor. The variables considered in selecting the baseline flywheel system arediscussed below.
Flywheel Material
The flywheel rim materials that were considered and the selected design are shown inFigure 2, which also indicates the relative costs to produce the complete rotor at a modestproduction rate of 10,000 per year. Material selection was based on the acquisition costof the rotor; the lowest cost design was selected. The use of a composite material such asE-glass and epoxy also reduced the cost of the flywheel housing.
Flywheel Shape
The shapes of steel or isotropic material flywheels are limited to a solid disc, whereasa concentric ring design is used for the composite material flywheel. Figure 3 illustrates
289

STEEi.
4340
MARAGING
HSLA
COMPOSITE
EGLAS
KEVLAR
0.5 1.0 l.S 2.0 2.5
STEELROTOR
COMPOSITEROTOR
•LAMINATED <-\DISK H
• CONCENTRIC W^RINGS m J
• 4 SPOKED HUB ~ f f r \
Vi
\
- Jl "ijr-
Fig. 2. Flywheel RotorManufacturing Cost
Fig. 3. Flywheel RotorCandidate Shapes
the shape factor (Kc) that is used in calculating energy density (3). The second variable forconsideration was the length-to-diameter ratio; the selected minimum diameter was 2.0 ft, andthe selected maximum diameter was 6.0 ft.
Vacuum for Flywheel
The flywheel system windage losses will be insignificant if the cavity pressure is main-tained between 1 and 10 microns. Figure 4 shows that the loss is insensitive to the length-to-diameter ratio. The thermal limit is listed on the 100-micron line. Pressures higher than100 microns will start to deteriorate the outer fibers of the composite flywheel and eventuallyresult in an unuseable flywheel.
Flywheel Sizing
Figure 5 shows a flywheel with an outside diameter of 60 in., a rim internal diameter of51 in., and a wheel made up of four segments that was recommended as a result of this study.The aluminum center hub is made from aluminum sheet, stamped out, and brazed into a single hub.The rotor weight is 710 lb, and it operates at a speed of 7110 rpm.
1200
1000
£ 800
\ 600
w
§ «oo
200
0
- -
MINI IFLYWHEEL DESIGN
• EauiIVALENT1
MAXI
. .
ERII
MJfl
HE
U_
*••
Efnt
«EL
_
s
1•E
10
—
I I I
y
ERM«T
/ /
f
\ ,
IAL
10 100 1000FLYWHEEL CAVITY PRESSURE IN MICRONS
I5796 A
Fig. 4. Effect of Length/Diameter RatioVersus Windage Losses
Fig. 5. Ten kw-hr CompositeE-glass Flywheel
290

Flywheel Bearings
Ball, roller, magnetic, and hydrostatic bearings were evaluated for performance and cost.The magnetic bearings were selected because of their low parasitic losses, high reliability,and acceptable cost (4). Although the cost of the magnetic bearings was 1.5 times that of theroller bearings, this increase was considered acceptable because of the low dollar impact.
Flywheel Seals
In addition to a hermetically sealed, magnetically coupled unit, carbon and ferrofluidseals were considered. The magnetically coupled hermetic unit was selected because of its verylow parasitic losses, high reliability, and acceptable cost impact.
Flywheel Structure
The flywheel containment housing had to be sealed and evacuated to provide the requiredenvironment for the flywheel. The containers considered in the cost evaluation were a her-metically sealed metal container, a metal and concrete container, and a metal container withearth embankment or pit. As a result of the analysis, the simple metal container was selectedbecause it was the least expensive and would contain a composite flywheel failure. In addition,no other structure to dissipate torque reaction from a flywheel failure was required.
TRANSMISSION
The function of the transmission is to provide a variable speed input to the flywheelsystem to store or extract mechanical energy as a result of a speed change of the flywheel.The transmission was selected from among the candidates listed in Figure 6. Because thetransmission is placed between the 1800-rpm gearbox and the flywheel and because the designhorsepower is approximately 26 hp, it appeared that either the traction or the variable-pulleyrubber belt would satisfy the design. The relative costs listed in Figure 6 show the variable-pulley rubber belt to be most attractive on a first-cost basis. The analysis showed that thebelt drive with a simple shift satisfies the starting requirements of the flywheel, and meetsthe performance and cost requirements (see Figure 7).
10.000
100.000
10,000
1.000
100
10 100 1.000 10,000 100.000RATED OUTPUT SPEED, ItPM i io ioo i.ooo
RATED POWER CAPACITY, HP
10,000
Fig. 6. Design Rationale for Selectionof Transmission Options
Fig. 7. Cost Rationale for Selectionof Transmission Options
MOTOR/GENERATOR
The main function of the motor/generator (M/G) was to provide a nominal 220 rms (110-v,line-to-neutral, single-phase) at a nominal 60 Hz. In the motor mode, it can be used to startthe wind turbine, using the utility as a power source.
291

The motor/generator also could be applied as a velocity governor for the wind turbine if itis referenced to the utility to maintain an accurate 60-Hz frequency. If it is not referencedto utility frequency, the flywheel and continuously variable transmission must be controlled toprovide the required frequency. The frequency would then be accurate enough for all householdenergy loads, except synchronous clocks.
The three M/G types that are commercially available as well as technically acceptable arethe (a) salient pole synchronous alternator; (b) squirrel cage induction alternator; and (c)separately excited dc generator.
The salient pole synchronous alternator is the most easily controlled of the three candi-dates. With slip rings to transfer dc field current to the rotor, voltage regulation can bereadily accomplished. It cannot control sudden overloads because it will lose synchronism ifpull out torque is exceeded. Amortisseur windings are required if it is to be used as a startingmotor.
The squirrel cage induction alternator is capable of continuous, near-synchronous operationdespite short-term overloads. However, its efficiency is not as high as that of the synchronousalternator unless it is controlled to a low-slip operation. In general, it is less stable thanthe synchronous alternator under variable loads and operates at a lower power factor.
The separately excited dc generator is readily voltage-regulated, reasonably efficient,capable of absorbing overloads, and capable of wide variations in speed under loaded conditions.However, it must be augmented with a solid-state inverter to provide the household 60-Hz power;thus the beneficial operating characteristics are offset by the high cost of the requiredinverter.
The salient pole synchronous alternator was selected as the best unit for the design.
SELECTED DESIGN
The selected design for the flywheel is shown in Figure 8. By mounting the flywheel ver-tically on a quill shaft, dynamic problems of the flywheel are eliminated. It is significantthat the machining of the cover section is confined to the bearing area. The bottom sectionmay be deep-drawn like a bathtub, with wide-open tolerances that would take advantage of con-trolling cost through minimum machining. The generator and belt drive is mounted in a verticalmanner to take advantage of the vertical shaft from the wind turbine supply. Excluding the costof the wind turbine, the system costs are estimated at $4050 for 10,000 units per year and$2885 for 100,000 units per year.
WINDMILLSHAFT INPUT
A.C. GENERATOR/MOTOR
Fig. 8. Ten Kw-Hr Flywheel Energy Storage Unit
292

SYSTEM PERFORMANCE#»•
System input/output efficiency is 76 percent; that is, 76 percent of the captured windenergy is delivered to the residence as electrical energy. The performance of this systemwas simulated in a computer, using the performance of the selected components. The wind dataand electrical demand were input to the computer program. An example of the computer outputusing the Blue Hill, Massachusetts test site is as follows:
Residential EnergyDemand Supplied by
Season Wind, percent
Spring 33.7Summer 55.7Autumn 51.0Winter 58.0
EXTRAPOLATION OF 50 KW-HR UNIT
The 10 kw-hr unit could be easily converted to a 50 kw-hr unit by increasing the rotorlength, and by increasing the rotor length and containment band from 8 to 40 in. No otherchanges in the flywheel storage module would be required. The generator would be increasedfrom 5 to 10 kw as a study requirement. The transmission or variable-belt unit would beparallel to a differential gear unit that is coupled to the flywheel assembly. A cost anal-ysis shows that while the energy storage capacity is increased by a factor of five, the costis increased to only three times the baseline unit.
SUMMARY
The flywheel energy storage unit meets the objectives of: (1) low aquisition cost, (2)safety and reliability, and (3) efficiency. The flywheel energy storage unit uses existingtechnology and is conventionally manufactured.
RECOMMENDATIONS
The technology for developing prototype flywheels with turbine supplies is now matureenough to warrant fabrication of prototype units. Such development, coupled with a modestventure analysis, should be sufficient to encourage the industry to market these units forresidential use.
REFERENCES
1. Banas, J. F., and W. N. Sullivan, "Engineering of Wind Energy Systems, Sandia Laboratories,SAND75-0530, January 1976.
2. Blackwell, B. F., "The Vertical Axis Wind Turbine, How It Works," Sandia Laboratories,SAND74-0160, December 1974.
3. Towgood, D. A., "An Advanced Vehicular Flywheel System for ERDA Electric Powered PassengerVehicle," presented to U.S. Department of Energy, CONF 771053, October 1977.
4. U.S. Department of Energy Report, "Economic and Technical Feasibility Study for EnergyStorage Flywheels," HCP/MI066-01, May 1978.
293

Project Title:
Principal Investigator:
Organization:
Prc
Project
Contract Number:
Contract Period:
Funding Level:
Fundinq Source:
PROJECT SUMMARY
"Investigation of the Technical and Economic Feasibility of UsingPumped Well-Water Energy Storage Systems"
Gerald E. Weinstein
The BDM Corporation2600 Yale Blvd. S.E.Albuquerque, New Mexico 87106(505) 843-7870
To determine the technical and economic feasibility of storingsurplus solar and wind energy for rural applications using asmall hydro/mechanical system that pumps water from an aquifer toa surface reservoir and recovers energy by returning the water tothe aquifer.
An analysis of user demand, institutional and legal issues, andaquifer characterization has been completed. Determination ofengineering feasibility is in progress and economic analysis willbegin shortly.
The user demand investigations have identified rural applicationswhere the storage of surplus solar or wind energy is key to theseenergy sources meeting energy demands. This study has alsodetermined generic load profiles for use with energy availabilitycurves to determine storage requirements.
The institutional <.nd legal issues study has identified waterrights as a real property right owned and possessed by theindividual user in the State of New Mexico. Certain portions ofNew Mexico have been declared Underground Water Basins withinwhich the usage and storage of water is regulated. In addition,the Water Quality Control Commission has established regulationsand standards for discharges into underground water. Review ofall these issues has identified no barriers that rule out thedevelopment of aquifer hydro/mechanical energy storage systems.
The aquifer characterization has identified those characteristicswhich are required for the aquifer to perform according torequirements determined by the system engineering of the entiresystem. In particular, it was determined that the aquifer shouldhave a hydraulic conductivity greater than 1000 gal/day-ft^.
Engineering considerations in establishing technical feasibilityinclude: efficiency, control systems, equipment, and sizing.Central to technical feasibility is the integration of energyavailability and demand with off-the-shelf equipment capabilities.Off-the-shelf turbine/generators-pump/motors have been identifiedand control systems are being investigated.
13-6485
April 11, 1979 to September 30, 1979
$41,000.00
Sandia Laboratories, AlbuquerqueDivision 2324
295

FEASIBILITY STUDY OF ASMALL PUMPED AQUIFER STORAGE SYSTEM
FOR SOLAR AND WIND ENERGY
Arthur J. MansureThe BDM Corporation
2600 Yale Blvd., S.E.Albuquerque, New Mexico 87106
ABSTRACT
The technical and economic feasibility of storing surplus solar and wind energy inrural locations is being investigated for a small hydro/mechanical system that pumps waterfrom a subsurface aquifer to a surface reservoir and then recovers the energy by allowingthe water to return to the aquifer. An analysis of rural user energy demands, institu-tional and legal issues, and aquifer characterization has been completed. The availabilityof equipment to operate the system has been investigated and it has been determined, withthe exception of specialized control equipment, that off-the-shelf equipment exists thatmeets rural installation and maintenance needs. A system design that integrates thecomponents, based on energy availability and user demand, is in progress. Economic analysiswill follow completion of the engineering study.
INTRODUCTION
As a result of today's increased awareness of the environment and limited naturalresources, it has become imperative to conserve and/or better utilize the Earth's existingenergy, especially the renewable energies -- wind and solar. One reason that these freeforms of energy have not been exploited is the lack of economically feasible methods toharness and store these forms of energy so that man can use them to fit his needs. Techno-logical discoveries are continually advancing the state of the art of extracting theseenergies (i.e., photovoltaics, solar heat collectors, wind machines, etc). However,without efficient storage capability, these advances are of limited usefulness.
The concept of an aquifer based hydro/mechanical energy storage system (Figure 1) maybe one feasible solution to this dilemma. Such a storage system is appropriate for rurallife styles, because it uses equipment already available and maintainable in rural areasand can be incorporated into existing farm or ranch systems. In principle, it would bebased upon equipment such as a turbine/pump that can perfc-m ri'ltiple functions and systemelements such as wells and reservoirs that have other farm ana ranch uses. Thus, thestorage system would be an integral part of rural life support systems and would promote aconservation approach to energy usage. In addition, such a system would make maximum useof existing equipment and thereby reduce costs.
CONCEPTUAL SYSTEM DEFINITION
The assessment of the feasibility of any conceptual system is only as valid as theassumptions defining the system. This study is determining "he variables that are pertinentto the description and operation of this storage system and evaluating the effects ofthese parameters on the technical and economic feasibility of the system. Some valueshave been assumed; some have been determined by engineering and economic data of availableequipment; others have been determined from statistical data bases.
A surplus of solar and wind energy is assumed. This energy will be supplied to thestorage system in appropriate 60 Hz A.C. form. The purpose of the storage system is tomake energy available when needed on a cost-effective basis.
296

WIND
SMALLCOMMERCIALOPERATION
Fig. 1. Aquifer Hydro/Mechanical Energy Storage System
This system is considered for the small farm, ranch, or isolated rural business.Power produced will be used on the premises (i.e., no power will be sold); however, thepower system will tie in with a standard commercial power network grid. Utility powerwill be available for emergency use and for times when statistically unusual weatherpatterns preclude the production of surplus energy. Utility power will also be used tosatisfy the high peak demands occurring occasionally in lieu of oversizing of the equip-ment. This concept is felt to be more cost-effective.
For the initial concept, it is assumed that power requirements on the storage systemdo not exceed 5 kW peak and 60 kWh daily. Albuquerque meteorological data has been usedto characterize the solar and wind availability throughout the day. Five kW is a reasonablelower limit for this concept; the system could, however, be scaled up to 30 kw, at whichpoint multiple wells will be required.
LOAD DESIGN REQUIREMENTS
This part of the study has identified electrical requirements (peak kW and total kwhof storage) and demand curves for rural applications including dairy, chicken (egg), andpig farms, as well as small beef feedlots and a store/trading post. Each of these unitsincluded a dwelling.
For all of these applications, there was found to be insignificant variation betweensummer and winter demands, as long as no significant space heating load was considered.The chicken farm was determined to have a night-time load of 10 kW and a day-time load of27.4 kW. The other operations were determined to have night-time loads ranging from 4 to7 kW and day-time loads of the same range or less indicating a clear need for energystorage so that solar or wind energy collected during the day can be used at night.Figure 2 shows the power required curve for the beef feedlot user, the user consideredmost representative of the group (excluding the chicken farm).
297
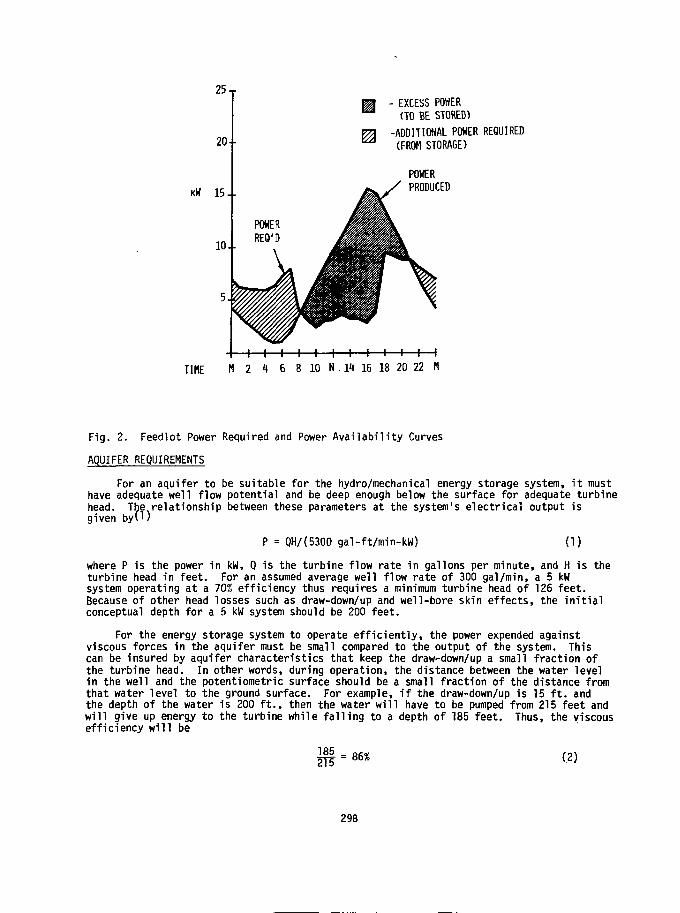
25 T
1 5 - .
EXCESS POWER(TO BE STORED)
ADDITIONAL POWER REQUIRED(FROM STORAGE)
POWERPRODUCED
TIME M 2 t\ 6 8 10 N . 14 16 18 20 22 M
Fig. 2. Feedlot Power Required and Power Avai labi l i ty Curves
AQUIFER REQUIREMENTS
For an aquifer to be suitable for the hydro/mechanical energy storage system, i t musthave adequate well flow potential and be deep enough below the surface for adequate turbinehead. The relationship between these parameters at the system's electrical output isgiven bvO)
P = QH/(5300 gal-ft/min-kW) (1)
where P is the power in kW, Q is the turbine flow rate in gallons per minute, and H is theturbine head in feet. For an assumed average well flow rate of 300 gal/min, a 5 kWsystem operating at a 70% efficiency thus requires a minimum turbine head of 126 feet.Because of other head losses such as draw-down/up and well-bore skin effects, the initialconceptual depth for a 5 kW system should be 200 feet.
For the energy storage system to operate efficiently, the power expended againstviscous forces in the aquifer must be small compared to the output of the system. Thiscan be insured by aquifer characteristics that keep the draw-down/up a small fraction ofthe turbine head. In other words, during operation, the distance between the water levelin the well and the potentiometric surface should be a small fraction of the distance fromthat water level to the ground surface. For example, if the draw-down/up is 15 ft. andthe depth of the water is 200 ft., then the water will have to be pumped from 215 feet andwill give up energy to the turbine while falling to a depth of 185 feet. Thus, the viscousefficiency will be
1 8 5 - fifi*
2T5~- 86%(2)
298
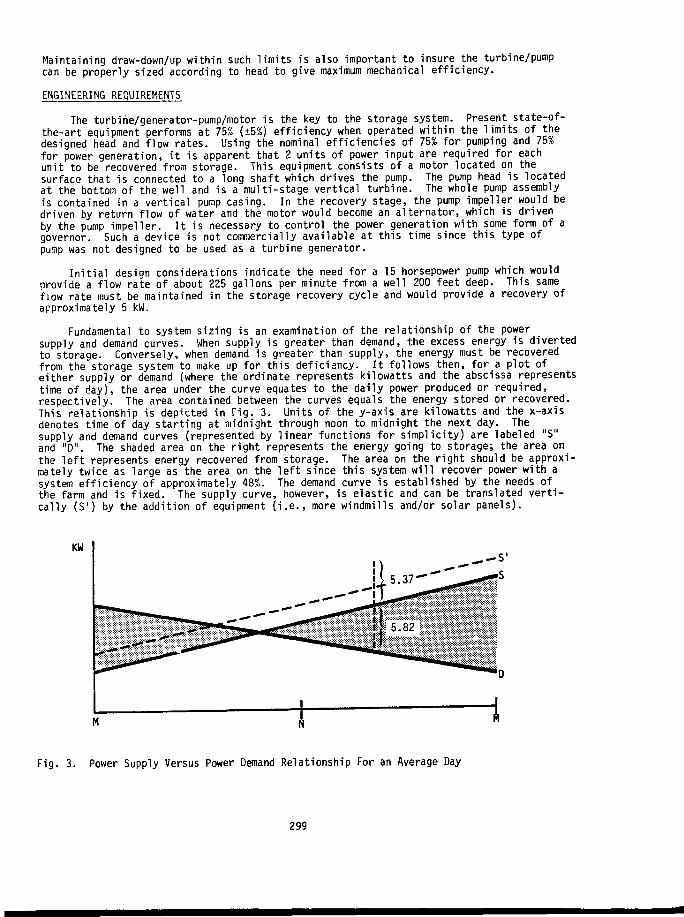
Maintaining draw-down/up within such limits is also important to insure the turbine/pumpcan be properly sized according to head to give maximum mechanical efficiency.
ENGINEERING REQUIREMENTS
The turbine/generator-pump/motor is the key to the storage system. Present state-of-the-art equipment performs at 75% (±5%) efficiency when operated within the limits of thedesigned head and flow rates. Using the nominal efficiencies of 75% for pumping and 75%for power generation, it is apparent that 2 units of power input are required for eachunit to be recovered from storage. This equipment consists of a motor located on thesurface that is connected to a long shaft which drives the pump. The pump head is locatedat the bottom of the well and is a multi-stage vertical turbine. The whole pump assemblyis contained in a vertical pump casing. In the recovery stage, the pump impeller would bedriven by return flow of water and the motor would become an alternator, which is drivenby the pump impeller. It is necessary to control the power generation with some form of agovernor. Such a device is not commercially available at this time since this type ofpump was not designed to be used as a turbine generator.
Initial design considerations indicate the need for a 15 horsepower pump which wouldprovide a flow rate of about 225 gallons per minute from a well 200 feet deep. This sameflow rate must be maintained in the storage recovery cycle and would provide a recovery ofapproximately 5 kW.
Fundamental to system sizing is an examination of the relationship of the powersupply and demand curves. When supply is greater than demand, the excess energy is divertedto storage. Conversely, when demand is greater than supply, the energy must be recoveredfrom the storage system to make up for this deficiency. It follows then, for a plot ofeither supply or demand (where the ordinate represents kilowatts and the abscissa representstime of day), the area under the curve equates to the daily power produced or required,respectively. The area contained between the curves equals the energy stored or recovered.This relationship is depicted in Fig. 3. Units of the y-axis are kilowatts and the x-axisdenotes time of day starting at midnight through noon to midnight the next day. Thesupply and demand curves (represented by linear functions for simplicity) are labeled "S"and "D". The shaded area on the right represents the energy going to storage; the area onthe left represents energy recovered from storage. The area on the right should be approxi-mately twice as large as the area on the left since this system will recover power with asystem efficiency of approximately 48%. The demand curve is established by the needs ofthe farm and is fixed. The supply curve, however, is elastic and can be translated verti-cally (S1) by the addition of equipment (i.e., more windmills and/or solar panels).
KW
Fig. 3. Power Supply Versus Power Demand Relationship For an Average Day
299

Also shown on Fig. 3 is the breakeven point. A pump rated at 15 horsepower equatesto 11.2 kW. This pump will not run on a power supply of less than 11.2 kW without damagingthe motor. Likewise, if more power than 11.2 kW is available, the pump cannot use it topump additional water. For times when the available surplus power is less than 11.2 kW,a sufficient quantity of power will be purchased from commercial sources to reach the 11.2kW level so that the pump may operate. Since the system operates at 48% efficiency, weexpect to recover only 5.4 kW of energy (11.2 x 48% = 5.4). If 5.4 kW were purchased and5.8 kW were produced, the system would just break even. This breakeven point is denotedby the vertical dashed line. Energy produced to the left of this line does not economicallywarrant storage and is wasted. Thus, proper sizing of the equipment requires balancingavailable power, demand, and minimum motor power requirements.
INSTITUTIONAL AND LEGftL ISSUES
In New Mexico, water rights are a real property right owned and possessed by theindividual user. In addition, certain portions of New Mexico have been declared Under-ground Water Basins within which the usage and storage of water is regulated. The WaterQuality Control Commission has established regulations and standards for discharges intounderground water. Review of all these issues has identified no barriers that prevent thedevelopment of aquifer hydro/mechanical energy storage systems.
AQUIFER CHARACTERIZATION
In addition to aquifer productivity and depth requirements, the requirement that theaquifer draw-down/up be limited places limits on aquifer hydraulic conductivity and thick-ness. Aquifers can be either confined or unconfined; preliminary calculations indicatethat, within safe yield production, differences between draw-down/up for confined andunconfined aquifers are typically only a factor of 2. For this study, the aquifer typewith the larger draw-down/up (confined aquifer) has been assumed.
Draw-down/up is the local fluctuation in the water table or potentiometric surfacecaused by the production or injection of the well. When a well is being produced, thepumping causes a local pressure reduction sufficient to set up the pressure gradient thatcauses additional water to flow into the well. Unsafe production of the well occurs whenlocal depletion of water exceeds one-half the depth from the water table or potentiometricsurface to the bottom of the aquifer. During injection (or in this study, returning thewater to the aquifer) the water level in the well must stand sufficiently above the watertable or potentiometric surface to supply the necessary force to drive the water back intothe aquifer against the viscous forces that retard flow through a porous media.
Table 1 shows the results of quasi-steady state draw-down/up calculations. Thesecalculations assume .7 foot well radius, 1,050 ft. drainage radius, and 300 gal/min flowrate. The table implies the hydraulic conductivity should be greater than 3.8 x 10² gal/day-ft?.
TABLE 1. Draw-Down/Up as a Function ofAquifer Thickness and Hydraulic Conductivity
K(gal/day-ft2) Thickness (ft)a
25 75 100 200 400
GravelCoarse SandMedium Sand
Fine Sand
Sandstone
7.3.3.
1.
3.
2
78
10
X
X
X
X
X
103
10J
10102
101
35-
-
-
12
18-
-
11
14
46-
01
72384
00
3
1242
a Draw-down/up is le f t blank i f safe yield conditions would beexceeded.
300

Time dependent constant production calculations for a medium sand aquifer 75 feetthick indicate the draw-down/up will be 23.8 feet after 12 hours. This is considerablylarger than the 18 feet given in Table 1 and is a result of the fact that quasi-steadystate calculations assume the water is derived by recharge rather than from storage. Thissignificant draw-down/up, in a period comparable to the usage of the stored energy, indicatesthe need for detailed analysis of cyclic production (net zero water production) to determineif production and recharge effects cancel, thereby, resulting in small draw-down/ups.
Figure 4 shows the draw-down/up that results from 6 hours of pumping followed by a6 hour delay before recharge, for a medium sand aquifer 100 ft. thick. The figure indicatesthat the basic draw-down/up given in Table 1 serves to bound hydraulic conductivities andaquifer thickness.
300
FLOW RATE(GAL/MIN)
0--
-300+
15-
\
10-
DRAW-DOWN/UP(FEET)
5-
MEDIUM SAND (K = 3.8X10
GAL/DAY FT^)
THICKNESS 100 FEET
HOURS
Fig. 4. Draw-Down/Up During Cyclic Production
8 10 12
In summary, the requirements that characterize an aquifer suitable for use in anaquifer hydro/mechanical energy storage system are
(1) Depth to water table or potentiometric surface - 200 feet minimum.(2) Well productivity - 200 gal/min. minimum.(3) Hydraulic conductivity greater than 1,000 gal/day-ft2 minimum.
These requirements, plus considerations of institutional and legal issues, have led to theidentification of the regions shown on Fig. 5 as the best regions in New Mexico for aquiferhydro/mechanical energy storage projects.
301
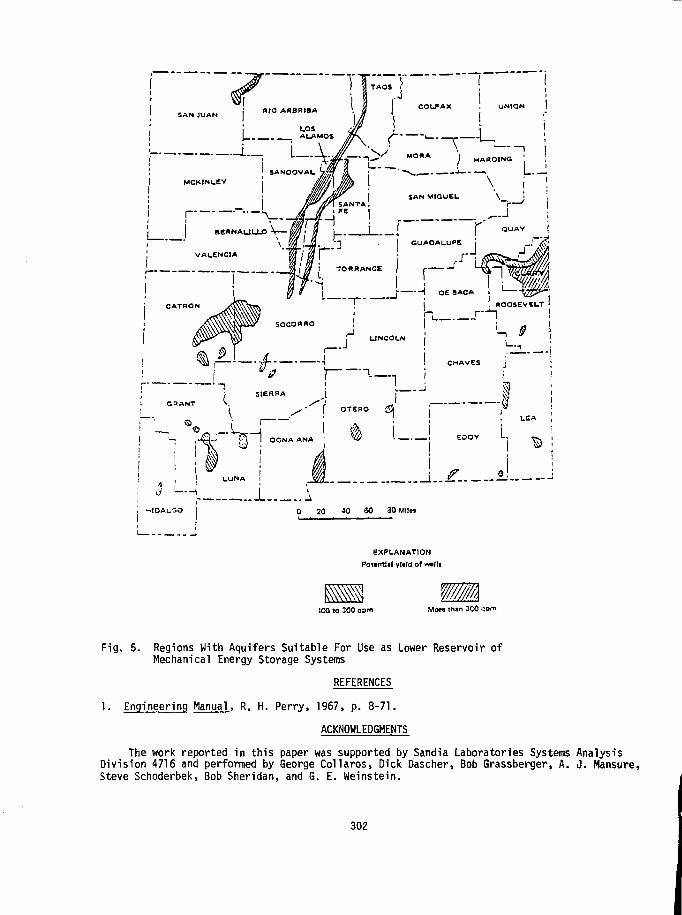
EXPLANATION
PoTtmlil vltld of vwfli
ICO to 200 gpmW//////A
Mor* than 3C0 com
Fig. 5. Regions With Aquifers Suitable For Use as Lower Reservoir ofMechanical Energy Storage Systems
REFERENCES
1. Engineering Manual, R. H. Perry, 1967, p. 8-71.
ACKNOWLEDGMENTS
The work reported in this paper was supported by Sandia Laboratories Systems AnalysisDivision 4716 and performed by George Collaros, Dick Dascher, Bob Grassberger, A. J. Mansure,Steve Schoderbek, Bob Sheridan, and G. E. Weinstein.
302

Project Title:
Principal Investigator:
Organization:
Project Goals:
Project Status:
Contract Number:
Contract Period:
Funding Level:
Funding Sources:
PROJECT SUMMARY
Industrial Compressed Air Application for Solar Energy Conversion/Storage Devices.
Laurence B. McEwen
JALAR ASSOCIATES1321 Chestnut StreetSan Francisco, CA 94123(415) 771-1544
To ascertain the feasibility of utilizing solar energy devicesand compressed air energy storage to supply power for industrialcompressed air systems.
Contract has been completed, the final report was deliveredJuly 18, 1979.
The fulfillment of this effort entailed the performance of threeseparate tasks. The first task established a profile of installedindustrial compressed air capacity, the characteristics of plantair usage, and quantified the energy required to produce this air.The results of this task provided a perspective for the potentialenergy savings that might occur from subsequent work.
The second task evaluated the technical feasibility of the conceptwhile the third task determined the economic viability ofspecific and representative approaches.
The primary conclusions of the study are as follows:
1. Significant fossil energy savings could be accomplished ifplant air could be produced from solar sources. (.2 quad-rillion BTU's annually).
2. The concept is technologically feasible, and enhanced, in mostcases, by the use of energy storage.
3. The concept is not economically viable either currently orin the immediate future.
4. There is a good opportunity for energy conservation in that90% of all air compressor energy is currently being dis-carded as waste heat.
07-9091
FY '77
$68K
U.S. Department of Energy, Division of Energy Storage System.
303

INDUSTRIAL COMPRESSED AIR APPLICATIONS FORSOLAR ENERGY CONVERSION/STORAGE DEVICES
L. B. McEwen and J . W. Swain
JALAR ASSOCIATES
1321 Chestnut S t r e e t 40 Denton RoadSan Francisco , CA 94123 Wellesley, MA 02181
ABSTRACT
Survey of Industrial Compressed Air, its uses and energy requirements.Investigates the feasibility of utilizing solar/wind energy conversion systemswith or without compressed air energy storage devices to supply power forindustrial compressed air. None of the scenarios depicted in the study wereeconomically attractive at this time. The main reason this conclusion wasscaling the solar energy conversion devices to displace only ten percent ofa plant's electrical load, thereby severely limiting the scope of potentialsavings. Technological improvements, reduction in capital costs, more rapidrises in utility rates or an abrogation of fossil fu.il supplies would benecessary before further pursuit of this concept is warranted.
INTRODUCTION
The purpose of this contract effort, managed D\ Sandia Laboratoriesand funded by the Energy Storage Systems Division, S. Department ofEnergy, was to determine the feasibility of utilizing solar energy devicesand compressed air energy storage to supply power for industrial compressedair systems. The fulfillment of this effort entailed the performance ofthree separate tasks. The first task established a profile of installedindustrial compressed air capacity, the amount of plant air normally used,and the energy required to produce this air. The results provided aperspective for the potential energy savings that might accrue from subse-quent work. The second task evaluated the technical feasibility of usingenergy from solar sources to power industrial compressed air systems eitherdirectly or through the employment of energy conversion or storage devices.Should such an arrangement be technically feasible, then the purpose oftask three was to determine the economic viability of specific and repre-sentative approaches.
The principal findings of this study were as follows:
1. Significant energy savings could be accomplished if plant air couldbe produced from solar energy (.2 quadrillion BTU's annually).
2. The production of plant air by means of solar energy devices withor without compressed air storage systems is technologicallyfeasible.
304

3. The economic viability of any such arrangement is not encouragingfor the immediate future. This is due primarily to the limitationof savings to compressed air generation only (10% of industrialpower costs).
4. There is a good prospect for energy conservation in that 90% of allair compressor energy is currently being discharged as waste heat.
Task I, the investigation of industrial compressed air usage, centeredon detailed observations of eighteen industries situated throughout theUnited States. These collectively account for approximately 40% of theNation's industrial energy demand. Findings regarding compressed air useand energy demand were then translated to the remaining industries to ascer-tain the maximum energy savings that might be realized through the applica-tion of solar energy to industrial air systems.
The energy required to produce compressed air in 1976 was 0.2 quadril-lion BTU's or 1.6 percent of total industrial energy consumption (12.6 quads).Installed compressed air capacity was estimated to be 50 million cubic feetper minute (CFM).
Table I summarizes the expected values for plant air loads and compressedair energy requirements for the eighteen industries studied. Eleven ofthese industries show a compressed air power requirement of over 1,000 kW,large enough for testing industrial-scale solar energy conversion devices.Compressed air storage facilities were not present in any of the industriesstudied. Some plants, however, did utilize receivers to dampen surges indemand, thereby reducing compressor cycling.
Task 2 concluded that several applications of solar energy conversiondevices were, indeed, technically compatible with industrial air compressorrequirements. Although no attempt was made to design an ideal system,several promising scenarios were identified. Both photovoltaic (PV) andwind enercrv conversion systems (WECS) were found suitable for applicationto industrial compressed air systems. Because of the relatively minor rolewhich compressed air production plays in industrial energy consumptionhowever, most utility-scaled solar energy conversion schemes (which tendto be capital intensive) were found to be not suitable for this study.Among the photovoltaic and wind energy conversion system approaches, flat-plate photovoltaic arrays, and both horizontal axis and vertical axiswind turbine designs were found to be suitable. Adequate operating dataappears to have been compiled on these technologies. Concentrating photo-voltaic arrays also appear suitable, but were not regarded as sufficientlydeveloped for consideration in this study.
Rotary screw, reciprocating and centrifugal air compressor designswere found to be suitable for generating compressed air in these applica-tions. Rotary screw compressors were suggested because of their low cost,low starting torque, and high ratio of output to weight. Reciprocatingcompressors were recommended due to their high efficiency and relativelylow operating speeds for direct drive applications. Centrifugal designswere the most commonly employed compressors in applications of over 5,000cubic feet per minute (CFM). Scroll and other experimental compressorswere not deemed suitable as they are still in the developmental stage,and have not been demonstrated at appropriate scales.
Compressed air storage, although technically feasible utilizingeither underground caverns or high-pressure vessels, was not deemed tobe suitable for industrial compressed air applications due to unfavorableeconomics of scale. Only in the case of an existing cavern, in which thehigh initial costs of excavation might be avoided, could compressed airenergy storage costs be brought into line for industrial compressed airapplications.
305

Having established the scope of potential energy benefits of theconcept and the technological feasibility of the approach. Task 3 thenfocused on the economic merits. In order to establish the economicfeasibility of combining industrial scale compressed air requirementswith solar energy sources, three different scenarios were proposed,depicting a range of scales and different applications of solar energywith compressed air energy storage. The first scenario consisted of asmall scale energy supplement to an existing plant utilizing a photo-voltaic power source with a small (two hour) compressed air storage system.The second application involved a large scale horizontal axis wind turbinefarm supplying power for compressed air to a central facility providingheating, cooling and compressed air services to an industrial park. Thelast scenario involved the application of an intermediate scale verticalaxis wind turbine supplying compressed air directly to a remote indus-trial site situated in an undeveloped country. This application wasdesigned to present the most favorable circumstances for an evaluationof a wind power/compressed air energy storage installation. All threescenarios relied on the availability of an existing cavern that wassuitable for the particular compressed air energy storage application.
In order to determine the value of each of the scenarios, it wasfirst necessary to establish a base case cost of providing compressedair service to the industries involved. This was done bv annualizinathe capital cost of a conventional compressed air system, adding the annualoperating and maintenance and utility costs required to provide air serviceand dividing that sum by the quantity of air produced during the year.These calculations yielded a cost per unit quantity of air. In like manner,the costs of producing air utilizing first solar power, and then solar powerwith a compressed air energy storage system were calculated. Each of thesecalculations was then projected for a period of 15 years from a 1985 startdate. These projections assumed an annual inflation rate of 8 per cent andan annual increase in the cost of electrical service of 13 per cent; 5 percent over the assumed inflation rate.
A summary of the results of these economic analyses is contained inTable II. The first scenario fails to yield attractive pay back rates(5 year period) from either the use of photovoltaics or photovoltaicswith energy storage until the year 2000, or 15 years after initial opera-tion. Again in the second scenario, in which a central facility providesair to an industrial park, there are no economically attractive optionsduring the first five years of operation. However, beginning in 1995and continuing throughout the remaining life of the project, savingsbecome attractive with the implementation of wind power, with or withoutenergy storage. These attractive savings depend on utility charges thatcontinue to escalate at an annual rate of 13 per cent. In the lastscenario, an undeveloped site in a third world country, although energystorage makes the approach technically feasible, satisfactory savingsagain do not appear until 1995, or ten years after construction.
The unattractive immediate economic findings in all three scenarioscan be attributed to several key economic parameters. The primary con-straint on economic benefits is the small portion of utility costs whichare subject to savings. Only 10 per cent of utility expenses for theindustries concerned are the result of compressed air generation. There-fore the high capital costs required to implement any of these systemsfor use with compressed air generation can be ammortized over only asmall portion of total utility costs. The most promising economics areassociated with the second scenario, primarily because any electric poweroutputs from the wind energy conversion system which are in excess ofcompressed air energy requirements can displace other plant electricaldemand. In the third scenario, the mechanical output of the WECS pre-vents any alternative uses of output power, and mandates the inclusionof energy storage to even achieve technical viability.
306

In the last scenario, an evaluation was made of generating.electricityby means of an air-driven turbine. The inefficiency of the air turbineat pressures and temperatures compatible with industrial compressed airsystems, however, makes the production of electricity by means of airturbines non-competitive with conventional diesel generators. Specifically,power from air is almost three times as expensive as from conventionaldiesel generators, even given the high fuel costs (150% of projected U.S.prices) used for this exercise.
In conclusion, none of the scenarios depicted in this study, whichutilized solar power and compressed air storage devices to supply indus-trial air, were economically attractive. In every instance, satisfactoryrates of return did not appear until ten years after construction. Improve-ments in technology, reduction in capital costs, more rapid rises inutility rates or an abrogation of fossil fuel supplies would be necessarybefore further pursuit of this concept is warranted.
Table 1. Compressed Air Requirement PlantSummary
INDUSTRY
Aircraft Assembly
Appliance Mfg.
Automobile Assembly
Automobile Mfg.
Brewing
Chemical Mfg.
Construction (Indust.)
Food Processing
Glass Container Mfg.
Heavy Construction (Dams)
Heavy Electrical
Mining (Iron)
Oil & Gas Drilling
Packaged Goods Mfg.
Paperboard Mfg.
Steel Production
Textile Mfg.
Tool & Die Mfg.
AVERAGEPLANT AIRLOAD (CFM)
7,500
8,000
20,000
30,000
6,000
15,000
185
1,000
9,000
5,000
13,600
24,000
2,850
1,500
9,500
40,000
1,000
600
AVERAGEPLANT AIRREQUIRE-MENT (kW)
1,250
1,300
3,300
5,000
1,000
2,700
60
170
1,500
840
2,350
4,000
475
250
1,600
6,500
175
100
% TOTALENERGYCONSUMED
3.4
3
4
6
1.5
3
N/A
.5
3.6
4.8
.75
7.5
.1
2.7
.6
1.8
.4
2.9
Weighted average of sample industries 1.6%
307

Table 2. Summary of Economic Analysis (K$)
Scenario I
Base Case
(PV, No Storage)
PV + Storage
Scenario II
Base Case
Wind
Wind + Storage
Storage Only
Scenario III
Base Case
Wind
Wind + Storage
Add'lCapital
Investment(1985)
452
1,170
1,340
7,500
19,100
19,700
600
1,800
5,600
6,200
1985
32
37
—
—
--
—
—
Annual
1990
59
68
110
1,012
—
178*
78
Savings
1995
108
126
3,660
5,466
769
1,200*
1,000
10
13
1
3
2
2000
200
231
,126
,652
,586
,000J
,800
* Hypothetical savings, since this option was found to be technically notviable.
308

PROJECT SUMMARY
Project Title:
Principal Investigator:
Organization:
Project Goals:
Project Status:
Contract Number:
Contract Period:
Funding Level:
Funding Source:
"An Overview of Contracts With Colleges and Universities forAdvanced Flywheel Concepts"
Harold E. Schildknecht
Sandia Laboratories, Division 23E4, Albuquerque, New Mexico 87185FTS 475-2402
To identify and develop advanced flywheel concepts that offer poten-tial advantages over traditional approaches to flywheel energystorage systems.
A 12-month contract with the University of Minnesota to study celiu-losic flywheels is scheduled for completion in September, 1979. Amajor portion of the work completed to date has been the design andfabrication of the special apparatus required to evaluate strengthand durability of plywood test specimens and experimental hub-to-rotor bonds. The plywood specimens are equilibrated at either ^ 1 2 %or <*. 0.1% moisture content and then tensile tested. Comparing theresults shows the low moisture-content specimens to have approximate-ly 18% lower average tensile strength. Apparatus has also beendesigned and fabricated to facilitate bonding metallic hubs toplywood rotors and dynamically balancing the bonded assemblies.
A 14-month contract with Union College to study a band-type variableinertia flywheel (BVIF) is scheduled for completion in August, 1979.This concept provides a varying moment of inertia during rotationthrough the transfer of coiled flexible bands between the flywheel'shollow outer casing and inner hub. The equations of motion werederived for two BVIF design variants and incorporated into computercodes. A proof-of-concept model was designed and built forcomparing actual and computer-simulated BVIF operation. Results todate support the viability of the concept for specific ioadconditions.
A 12-month contract with Texas ASM University to study a flexibleflywheel concept is scheduled for completion in September, 1979.Primary emphasis has been placed on developing a gimballed supportsystem to suppress the flywheel's nonsynchronous whirl tendencies.This includes designing the system, building a small demonstrationmodel, deriving the equations of motion, developing computer codes,and incorporating the gimbal mechanism into a medium size flexible-flywheel test stand. Results to date indicate that a properlydesigned gimballed support system will place the whirl instabilityboundary above a reasonably high maximum working speed.
C8-03-02-02-3 SOL/100
FY'79
$106K
U. S. Department of Energy, Division of Energy Storage Systems
309
AN OVERVIEW OF CONTRACTS WITH COLLEGESAND UNIVERSITIES FOR ADVANCED FLYWHEEL CONCEPTS
Harold E. SchildknechtSandia Laboratories
Division 2324, P. 0. Box 5800Albuquerque, New Mexico 87185
ABSTRACT
The Solar Mechanical Energy Storage Project work performed under the direction of SandiaLaboratories includes contracts with one college and two universities for studies on advancedflywheel concepts. The three institutions involved and their respective advanced-concept pur-suits are as follows: University of Minnesota, cellulosic flywheels; Union College, variableinertia flywheel; and Texas A4M University, flexible flywheel. The primary objectives of thecontract with the University of Minnesota are to evaluate the physical properties of cellulos-ic materials (primarily plywood) relative to suitability for flywheels, and to developinexpensive methods of metallic-hub attachment and dynamic balancing for cellulosic flywheels.Of particular interest is the effect of prolonged vacuum exposure on plywood strength anddurability. The contract with Union College is to characterize the dynamics of their proposedband-type variable inertia flywheel and determine if it offers potential advantages in theareas of economy, reliability and efficiency. The Texas A&M contract is primarily directed atstudying the rotational characteristics of a flywheel configuration featuring flexible spokesand rim, with particular emphasis being placed on devising practical methods for suppressingundesirable whirl modes. All three of the above contracts are scheduled to be completed bySeptember, 1979.
INTRODUCTION
In 1977, the U. S. Department of Energy (DOE, formerly ERDA) designated SandiaLaboratories the lead laboratory for the national Solar Mechanical Energy Storage Project.Shortly thereafter, a comparative-analysis was made of leading candidates for mechanicalenergy storage systems. The results showed flywheel systems to be the most promising for res-idential applications. By virtue of that finding, major emphasis has been placed on develop-ing low-cost flywheel technology. This is being largely accomplished through contracts withindustrial firms, colleges, and universities. The contracts with industry are primarily toobtain design details and cost figures on comparatively state-of-the-art flywheel energystorage systems, whereas the college and university contracts are aimed specifically atstudying advanced concepts. The three contracts placed to date for advanced flywheel studiesare as follows:
Cellulosic Flywheel -- University of Minnesota, Minneapolis, MinnesotaVariable Inertia Flywheel -- Union College, Schenectady, New YorkFlexible Flywheel -- Texas ASM University College Station, Texas
This paper presents the highlights of each of the aoove contracts.
310
CELLULOSIC FLYWHEELS, UNIVERSITY OF MINNESOTA
BACKGROUND
Several leading proponents of flywheel energy storage systems have recognized for sometime the potential of wood and other natural forms of cellulose as inexpensive and renewablesources of material for flywheels. The moderately high strengths and low densities typicalof natural cellulosic fibers provide specific-energy capabilities (the ratio of tensilestrength to density) comparable to some commonly used steels. In addition, cellulosic-materials processing has long been an established technology in this country as evidenced bythe abundance of woodworking, plywood, composite board and paper industries. In light ofthese attributes, the use of cellulosic flywheels in energy storage systems where size andweight are secondary to cost is seen as potentially competitive with flywheels made from moretraditional materials such as steel and fiber-composites.(1)
The results from the spin-testing of experimental wood disks at the Applied PhysicsLaboratory (APL) of Johns Hopkins University suggests the feasibility of utilizing moderateperformance wood flywheels in stationary energy storage applications.(2) These tests reveal-ed the tendency of wood disks to fail by shredding. This implies significantly greaterinherent safety for wood than for steel flywheels, with the resulting need for less elaborateand costly failure-containment vessels. The APL experimentation also identified a need todevelop economical and reliable methods for attaching hubs to wood flywheels.
Preliminary research at the University of Minnesota (U of M) on flywheels in generalculminated in a comprehensive review and bibliography on flywheel technology by ProfessorA. G. Erdman and graduate student D. L. Hagen.(3) Their study showed virti 11y no work beingdone outside of APL to further the development of cellulosic flywheels. As a result, theybegan an investigation into the physical properties of cellulosic materials from the stand-point of suitability for use in flywheels. The investigation served to identify areas ofcellulosic-materials evaluation and characterization that were inadequate and in need ofadditional research. This need and the potential benefits were brought to the attention ofSandia in the form of an unsolicited proposal from the U of M.
CONTRACT ACTIVITIES
A contract was placed with the U of M in 1978 for a study pertaining to cellulosic fly-wheels. It is 12-months duration, costing $41K, with Erdman and Hagen the principal andassistant investigators, respectively. The main objectives of the contract are:
• Evaluate the physical properties of cellulosic materials relative to suitability forflywheels.
•Develop inexpensive methods of metallic hub attachment and dynamic-balancing forcellulosic flywheels.
What currently appears to be the most promising method for-constructing cellulosic flywheelsis to laminate individual plywood disks into a rough cylindrical block and then turn and sandthe block to finished dimensions. In view of plywood's apparent preeminence among competingforms of cellulose for flywheel use, emphasis is being placed on evaluating the physicalproperties of plywood tensile-test specimens. Of particular interest is the effect that pro-longed vacuum exposure (i.e., such as would be experienced in an evacuated flywheel housing)will have on strength and long-term durability.
A major portion of the work completed to date under the contract has been the design andfabrication of special routing dies, fixtures, and grips. These items were required to formplywood test specimens and to adapt existing tensile and fatigue test machines for theevaluation of those specimens.
311

The plywood tensile and fatigue testing activity has primarily involved the measurementof changes in strength of the test specimens when vacuum dried from •*, 12 percent moisturecontent (representative of 50 percent ambient RH) to less than 0.1 percent. Both the tensiletest and fatigue test machines afe fntteci%ith environmental chambers for maintaininghumidity control during testing. The tensile-test machine has been specially equipped formaking high resolution stress/strain and acoustic emission measurements, and for recordingand processing the measurements data using microcomputer supplemented data-acquisition equip-ment (Fig. 1). Statistical analysis of these data is expected to provide valuable insightinto the relationship between load and damage rate, and thereby assist in predicting long-term durability for plywood flywheels.
Two existing flexural fatigue-testers were modified into a composite machine that cansimultaneously apply a transverse moment (represents rotor Imbalance) and a cyclic torque(represents rotor acceleration/deceleration) to a hub/rotor interface. This machine iscurrently being used to evaluate the strength and fatigua resistance of elastomeric bonds forattaching metallic hubs to plywood rotors. Load cells and position transducers are utilizedto monitor flexure-induced stress and creep in the bonds.
The use of an elastomeric bond in the hub/rotor interface avoids the penalty incurred bydrilling a hole through the center of the rotor for shaft retention ( 50% resultant loss inusable energy-storage capacity), plus assists the composite rotor/hub assembly (flywheel) tospin about its mass moment of inertia at speeds greater than first critical. However,attaching the hubs so that the shaft centerlines will be collinear with each other and theprincipal spin-axis of the rotor can be both difficult and expensive. Hence, a dynamicbalancing machine was designed and built which is used to locate the mass moment of inertiaof a spinning rotor. The hubs are attached after the geometrical location of the principalspin-axis is identified.
^ | Uu> CEI
STRAIN
Fig. 1. Tensile-Test Machine Schematic
Birch was selected as the wood speciesfor the plywood test specimens due to i ts highspecific energy and commercial avai labi l i ty .Approximately 300 Finnish birch specimens havebeen tensile tested to date. The specimenswere formed from 9-ply one-half inch plywoodso that the face veneers were either paral le l ,normal, or 45 degrees to the tensile-stressaxis. About half were equilibrated at 50 per-cent RH (^ 12% moisture content), while thebalance were vacuum dried (< 0.1% moisturecontent). The vacuum dried specimens havemeasured an average 18 percent waker thantheir 50 percent-RH equilibrated counterparts.I t is currently theorized that the orientationof the outer veneers with respect to thetensile-stress axis may have been a principalfactor in the amount of strength loss. Over700 16-ply test specimens have been formed forchecking that theory.
The fatigue testing of plywood specimensand hub-to-rotor elastomeric be (ids is inprogress, but insufficient data has beenacquired to date to reasonably predictperformance trends.
This contract is scheduled for completionin September, 1979.
312

VARIABLE INERTIA FLYWHEEL, UNION COLLEGE
BACKGROUND
The energy stored in a rotating flywheel is governed by the relation
E = 1/2 Iui2
where E is kinetic energy, I is the moment of inertia of the flywheel about its spin axis, andID is the angular rate. Thus, for stored energy to be extracted, the rotational rate mustdecrease. However, in a typical energy storage application, the device which the storagemedium drives is required to provide electrical power at constant frequency. An example is aflywheel driving an alternator. Without provisions to compensate for the flywheel's drop inspeed, the alternator's output frequency will drop correspondingly. A commonly used methodfor reconciling this rotational-rate incompatibility is by adding a continuously variabletransmission to the output shaft of the flywheel. This approach, while technically practical,incurs the dual penalties of additional cost and reduced efficiency for the overall system.
Since low cost and high efficiency are essential to the successful commercialization offlywheel energy storage systems, It would be desirable 1f a means could be devised to extractenergy without creating the aforementioned problem of rotational-rate incompatibility.Re-examination of the flywheel energy equation suggests such a possibility; it is to vary theflywheel's moment of inertia around the axis of rotation such as to compensate for the energyoutflow with minimal change in rpm. Mechanisms of this type are called variable inertiaflywheels (VIF).
Between 1974 and 1977, while at Ohio State University, D. G. Uliman (now Dr.) was the co-investigator in a literature search for information on mechanical VIF's.(4) The mostinteresting concept encountered was for a coiled band type VIF (BVIF). As shown in Fig. 2,
three separate parts comprise the basic config-uration; namely, the inner hub, hollow outercasing and flexible band. The hub is mounted1n the center of the outer casing and is freeto rotate therein within the limits allowed bythe colled band connecting the two parts. Theband is similar in appearance and mounting tothe mainspring of a clock. During flywheelrotation, centrifugal force causes the band toconform to the Inside periphery of the hollowcasing; however, if an external load is appliedto the inner hub, the band will begin to wraparound the latter part. The amount and rate ofband transfer taking place from the casing ontothe inner hub will depend on a variety offactors including band stiffness, centrifugalforce, applied torque and the rotational-ratedifference between the two parts. However, thenet effect is a reduction in the moment ofinertia of the outer casing about its spin axiswith a resulting force imbalance that favors anIncrease in rotational rate. This inducesgreater centrifugal force on the band and, dueto the attendant increase in the band'sreactive-torque capacity, tends to compensatefor the load Induced slow down of the innerhub.
Fig. 2. Colled Band-Type Variable Inertiab Flywheel (BVIF)
313

The relationships between forces, applied and reactive torques, rotational rate differ-ences and momentum represent a complex problem in dynamic balance, but one that has to beanalyzed to adequately understand the potential of the BVIF. When his literature searchfound no evidence of these kinds of analyses, Ullman undertook the job and made it thesubject of his doctoral dissertation.(5) In 1978, Ullman moved to Union College (UC). UCsubsequently submitted an unsolicited proposal to Sandia for a BVIF study.
CONTRACT ACTIVITIES
A contract was placed with UC in 1978 for a study pertaining to a BVIF. It is 14-monthsduration, costing $25K, with Ullman the principal investigator. The objectives of the con-tract are to characterize BVIF dynamics and to determine if the concept offers advantages inthe areas of economy, reliability, and efficiency. This is to be accomplished through thefollowing task assignments:
• Model and analyze dynamics of basic BVIF configuration
• Model dynamics of BVIF with fixed ratio power recirculation
• Construct and test a proof-of-concept model
The first activity after contract placement was to develop the equations of motion for theBVIF in its simplest form. This configuration, called Type I, is where two nested bandsconnect the outer casing and inner hub, and the external load is applied to the latter. Thus,the rotational rate of the outer casing is in response to the tension in the bands. Theequations of motion were derived and written into a computer code for dynamic simulation ofthe system. The Type I configuration appears to have no practical value for energy storageapplications; however, understanding its dynamics was necessary before proceeding to the morepromising Type II arrangement.
The Type II BVIF configuration (Fig. 3) isessentially an extension of the Type I in thesense that, in addition to being joined by thecoiled bands, the outer casing and inner hubare connected by an integral gear set. Thegear set is fixed ratio, meaning that the rota-tional rates of the two parts will always be inconstant ratio. A significant advantage of theType II configuration is that band transfer iscontrolled by circulating power through twolinks rather than one. This provides greaterdesign versatility and increased adaptabilityto specific load conditions. Primary emphasishas been placed on the analysis and testing ofthe Type II configuration. This includes thederivation of the highly nonlinear equations ofmotion for the fixed ratio power recirculationsystem and the incorporation of those equationsinto a computer code for dynamic simulation ofthe system. A linearized adaptation of thecomputer code was also developed which hasproved a useful complement to its nonlinearcounterpart.
A more complex gearing system has alsobeen considered which would utilize a planetarygear train. For this system, the load is
Fig. 3. Type II BVIF With Fixed RatioPower Recirculation
314

connected to the planet gear which jo ins , and is free to orbi t around, the inner hub andouter casing gears. Since three rather than two elements of gearing determine the torquebalance, this system is considered to be potentially more versatile than the Type I I .However, i t has received only cursory examination under this contract.
A proof-of-concept BVIF model was designed and fabricated which can independentlyincorporate the Type I and Type I I configurations for dynamic response test ing. The modelhas been of only l imited usefulness through much'of the program due to frequent d i f f i cu l t ywith the bands binding in the outer casing. However, the recent addition of a band-guidancereel to the head of the inner hub alleviated the problem and permitted rel iable dataacquisition.
The work of this contract is essentially complete, including the submittal of a draftcopy of the f inal report. The results indicate that the Type I I BVIF can be configured as arelat ively high density flywheel which w i l l maintain nearly constant rotational rate underspecific load conditions while releasing energy. This indicates a probable efficiency advan-tage for the device over tradit ional f ixed-inert ia flywheel designs. However, whether theadditional advantages of economy and re l i ab i l i t y can be achieved under penalty of the BVIF'sgreater complexity remains to be proved.
FLEXIBLE FLYWHEEL, TEXAS A&M UNIVERSITY
BACKGROUND
The idea o f a f lywheel w i th f l e x i b l e r i ng and spokes f o r s t o r i ng k i ne t i c energyor ig ina ted w i th Dr. R. T. Schneider o f the Univers i ty o f F lor ida (U o f F) i n 1975.(6) Hisob jec t i ve was to develop an economical, r e l i a b l e and safe energy storage device tha t wouldincrease the use o f so lar -der ived e l e c t r i c a l power f o r res iden t i a l and small commercialapplications.
A flywheel test faci l i ty was established at the U of F in 1976. The subsequent testingof prototype flexible flywheels verified Dr. Schneider's prediction that the configurationwould be self-centering and balancing. However, i t also disclosed an unexpected problem withrotational instability. Following the discovery of the problem, Dr. J\ M. Vance of U of F, arecognized authority in rotor dynamics, joined the project. Shortly thereafter, the natureof the instability was identified as nonsynchronous whirl. The consensus was that internaldamping in the flexible ring and spokes provided the driving force for the whirl.
The fundamental flexible flywheel configuration is shown in Fig. 4. I t basicallyconsists of a flexible ring which is centrally suspended from an overhead shaft by means ofequispaced support lines. The ring is made from a continuous length of synthetic cord orrope that is repetitively coiled into an approximate toroidal shape of the desired size andweight. A moderate amount of cross-sectional support is provided by either a woven sleeve ora single overlay of helically wound cord. Contrary to the conventional fiber-composite f ly-wheel rim, the ring utilizes no bonding material, but depends on spin-induced centrifugalforce for circumferential rigidity.
The potential advantages of the flexible flywheel configuration are the following:
•The spinning ring is in pure tension, thereby loading its fibers in the direction(longitudinal) of maximum strength.
•No bonding material present to create elasticity mismatch problem.
•Self-centering and balancing due to its flexible suspension system.
315
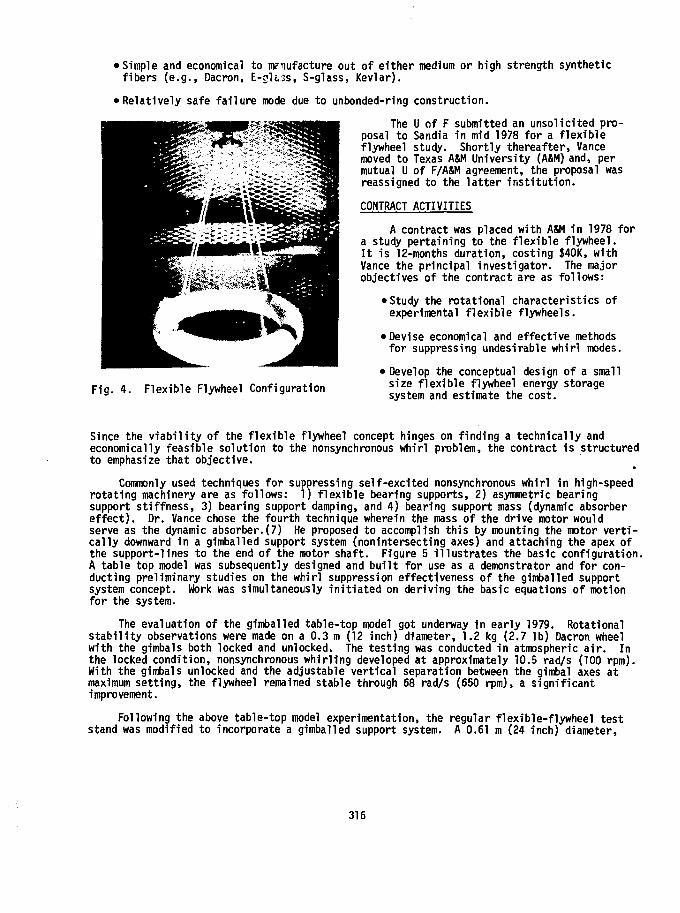
• Simple and economical to mfiufacture out of either medium or high strength syntheticfibers (e.g., Dacron, E-gUss, S-glass, Kevlar).
• Relatively safe failure mode due to unbonded-ring construction.
The U of F submitted an unsolicited pro-posal to Sandia in mid 1978 for a flexibleflywheel study. Shortly thereafter, Vancemoved to Texas ASM University (ASM) and, permutual U of F/A&M agreement, the proposal wasreassigned to the latter institution.
CONTRACT ACTIVITIES
A contract was placed with ASM in 1978 fora study pertaining to the flexible flywheel.It is 12-months duration, costing $40K, withVance the principal investigator. The majorobjectives of the contract are as follows:
• Study the rotational characteristics ofexperimental flexible flywheels.
• Devise economical and effective methodsfor suppressing undesirable whirl modes.
• Develop the conceptual design of a smallsize flexible flywheel energy storagesystem and estimate the cost.Fig. 4. Flexible Flywheel Configuration
Since the viability of the flexible flywheel concept hinges on finding a technically andeconomically feasible solution to the nonsynchronous whirl problem, the contract is structuredto emphasize that objective.
Commonly used techniques for suppressing self-excited nonsynchronous whirl in high-speedrotating machinery are as follows: 1) flexible bearing supports, 2) asymmetric bearingsupport stiffness, 3) bearing support damping, and 4) bearing support mass (dynamic absorbereffect). Dr. Vance chose the fourth technique wherein the mass of the drive motor wouldserve as the dynamic absorber.(7) He proposed to accomplish this by mounting the motor verti-cally downward in a gimballed support system (nonintersecting axes) and attaching the apex ofthe support-lines to the end of the motor shaft. Figure 5 illustrates the basic configuration.A table top model was subsequently designed and built for use as a demonstrator and for con-ducting preliminary studies on the whirl suppression effectiveness of the gimballed supportsystem concept. Work was simultaneously initiated on deriving the basic equations of motionfor the system.
The evaluation of the gimballed table-top model got underway in early 1979. Rotationalstability observations were made on a 0.3 m (12 inch) diameter, 1.2 kg (2.7 1b) Dacron wheelwith the gimbals both locked and unlocked. The testing was conducted in atmospheric air. Inthe locked condition, nonsynchronous whirling developed at approximately 10.5 rad/s (100 rpm).With the gimbals unlocked and the adjustable vertical separation between the gimbal axes atmaximum setting, the flywheel remained stable through 68 rad/s (650 rpm), a significantimprovement.
Following the above table-top model experimentation, the regular flexible-flywheel teststand was modified to incorporate a gimballed support system. A 0.61 m (24 inch) diameter,
316
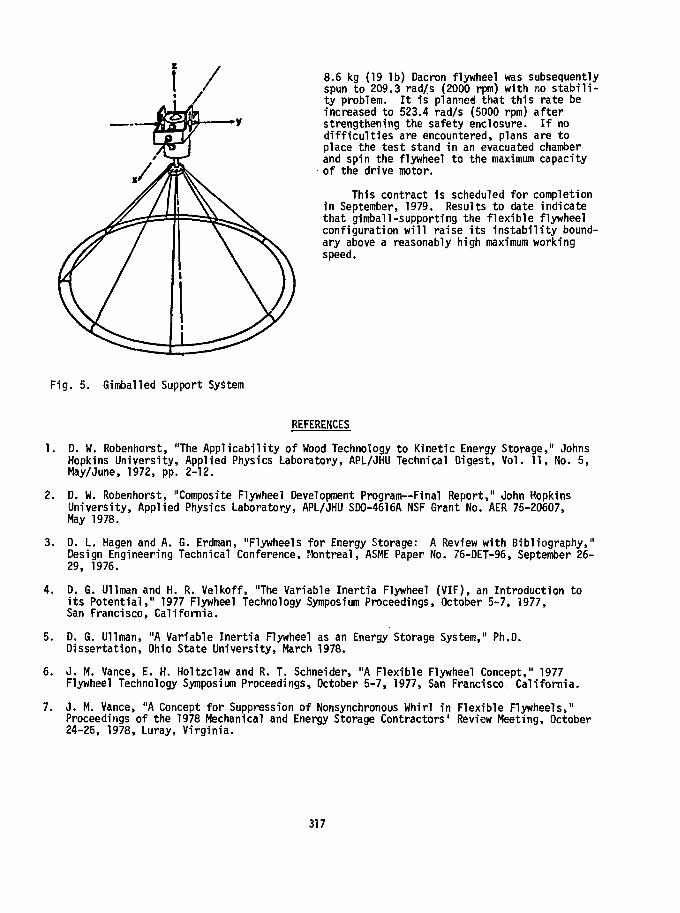
8.6 kg (19 1b) Dacron flywheel was subsequentlyspun to 209.3 rad/s (2000 rpm) with no s tab i l i -ty problem. I t 1s planned that this rate beincreased to 523.4 rad/s (5000 rpm) afterstrengthening the safety enclosure. I f nod i f f icu l t ies are encountered, plans are toplace the test stand in an evacuated chamberand spin the flywheel to the maximum capacityof the drive motor.
This contract 1s scheduled for completionin September, 1979. Results to date indicatethat gimball-supporting the f lexible flywheelconfiguration w i l l raise i ts ins tab i l i ty bound-ary above a reasonably high maximum workingspeed.
Fig. 5. Gimballed Support System
REFERENCES
1 . D. W. Robenhorst, "The A p p l i c a b i l i t y o f Wood Technology t o K i n e t i c Energy S to rage , " JohnsHopkins U n i v e r s i t y , App l ied Physics Labora to ry , APL/JHU Technical D iges t , V o l . 1 1 , No. 5 ,May/June, 1972, pp. 2-12.
2. D. W. Robenhorst, "Composite Flywheel Development Program—Final Repor t , " John HopkinsU n i v e r s i t y , App l ied Physics Labora to ry , APL/JHU SD0-4616A NSF Grant No. AER 75-20607,May 1978.
3. D. L. Hagen and A. G. Erdman, "Flywheels f o r Energy Storage: A Review w i t h B i b l i o g r a p h y , "Design Engineer ing Technical Conference, Mont rea l , ASME Paper No. 76-DET-96, September 26-29, 1976.
4 . D. G. Ullman and H. R. V e l k o f f , "The Var iab le I n e r t i a Flywheel ( V I F ) , an I n t r o d u c t i o n t oi t s P o t e n t i a l , " 1977 Flywheel Technology Symposium Proceedings, October 5 -7 , 1977,San Francisco, California.
5. D. G. Ullman, "A Variable Inertia Flywheel as an Energy Storage System," Ph.D.Dissertation, Ohio State University, March 1978.
6. J. M. Vance, E. H. Holtzclaw and R. T. Schneider, "A Flexible Flywheel Concept," 1977Flywheel Technology Symposium Proceedings, October 5-7, 1977, San Francisco, California.
7. J. M. Vance, "A Concept for Suppression of Nonsynchronous Whirl in Flexible Flywheels,"Proceedings of the 1978 Mechanical and Energy Storage Contractors' Review Meeting, October24-26, 1978, Luray, Virginia.
317
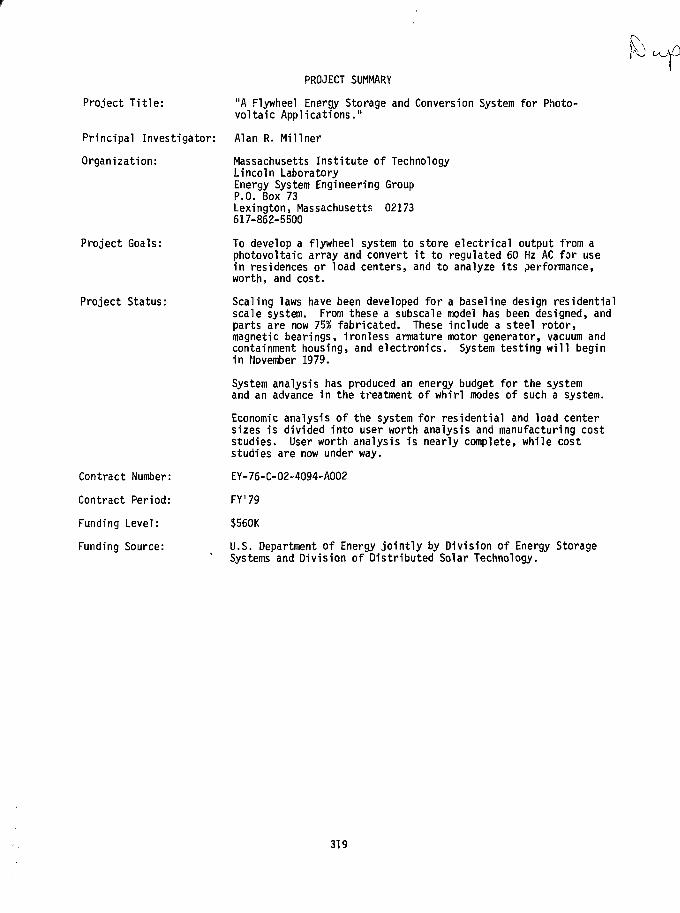
Project Title:
Principal Investigator:
Organization:
Project Goals:
Project Status:
Contract Number:
Contract Period:
Funding Level:
Funding Source:
PROJECT SUMMARY
"A Flywheel Energy Storage and Conversion System for Photo-voltaic Applications."
Alan R. Mi liner
Massachusetts Institute of TechnologyLincoln LaboratoryEnergy System Engineering GroupP.O. Box 73Lexington, Massachusetts 02173617-862-5500
To develop a flywheel system to store electrical output from aphotovoltaic array and convert it to regulated 60 Hz AC for usein residences or load centers, and to analyze its performance,worth, and cost.
Scaling laws have been developed for a baseline design residentialscale system. From these a subscale model has been designed, andparts are now 75% fabricated. These include a steel rotor,magnetic bearings, ironless armature motor generator, vacuum andcontainment housing, and electronics. System testing will beginin November 1979.
System analysis has produced an energy budget for the systemand an advance in the treatment of whirl modes of such a system.
Economic analysis of the system for residential and load centersizes is divided into user worth analysis and manufacturing coststudies. User worth analysis is nearly complete, while coststudies are now under way.
EY-76-C-02-4094-A002
FY'79
$560K
U.S. Department of Energy jointly by Division of Energy StorageSystems and Division of Distributed Solar Technology.
319

COO-4094-57
A FLYWHEEL ENERGY STORAGE AND CONVERSION SYSTEM FOR PHOTOVOLTAIC APPLICATIONS*+
Alan R. MillnerMIT Lincoln Laboratory
P. 0. Box 73Lexington, Massachusetts 02173
ABSTRACT
Progress is described on a project to develop a flywheel energy storage unit for usewith photovoltaics in residential or load center applications. The unit employs a high-efficiency permanent-magnet motor-generator and cycloconverter electronics to convert DCinput to regulated AC output. It also tracks the maximum-power operating point of thesolar array. Magnetic bearings are used to support the motor.
The project includes fabrication of a scale model unit, scaling laws for residential andintermediate load center sizes, and worth and cost estimation. Fabrication of a subscalemodel is 75% complete. Scaling laws have been developed for components and user worth studiesperformed for this unit; manufacturing cost studies are in progress.
INTRODUCTION
Over the past year MIT/Lincoln Laboratory has been working on a flywheel interface andstorage technology (FIST) project to develop a system with the following major components:
Magnetic bearingsMotor generatorLow cost rotor (not part of the project)Power conditioning electronicsVacuum housing.
This unit is intended to be a complete interface between a solar photovoltaic (PV) array andan AC load. Applications include a single residence and a 100-kW load center as point designs,with emphasis on the residence as the first and smallest use. The project includes threemajor tasks(1).
1) To develop scaling laws for designs of a residential and 100-kWload center system,
2) To build a scale model working system.
3) To estimate cost and worth to potential users of a residentialand a 100-kW load center system.
*This work was sponsored by the U.S. Dept. of Energy.
+Progress Report For the Mechanical and Magnetic Energy Storage Annual Review, 19-22 August1979, Washington, DC.
320

The system concept 1s shown 1n an artist's sketch 1n Fig. 1. Design trade-offs showedadvantages of a simple rotor Interface with a lightweight, Inexpensive supporting structure1n the choice of bearings above and rotor below. Tha« key system elements are shown 1n thedesign layout Illustrated-In Fig. 2.(2) Magnetic bearings are at the top, motor-generatorbelow them, and the flywheel rotor attached by a quill shaft.
Fig. 1. Residential System Concept
Fig. 2. Subscale System Design Layout
321

Scaling laws have been derived and will be reported soon. Major conclusions are that themotor-generator and flywheel rotor scale upward with constant shape factor and charge-dischargerate. Scale of the magnetic bearings is slightly different, with the permanent-magnet sizegrowing slowly in relation to the rotor size up to the residential scale. Above this size anelectromagnet design should replace the permanent magnet because the resistive losses for aload center application are negligible. At a still larger scale, a combined bearing and motor-generator without permanent magnets becomes feasible but has not been designed in detail.Scaling of system parameters is given in Table 1, while component scaling is given in Table 2.
TABLE 1. Flywheel System Parameters
Parameters
Energy storedEnergy availablePower inputPower outputInput voltage max. voltsInput current max. amps.Output voltage RMS voltsMax. output current FMS amps, per phasePhases
TABLE 2.
Rotorweight, lb.diameter, in.length, in.max. speed, KRPM
Motor/Generatorpeak power, kW.avg. power, kW.diameter, in.magnet weight, lbs.
Units
kWhkWhkwkWDCDCAC
NO.
Component Point
Prototype
Subscale
1 to 4.6 to 2.50.50.6254002.5
no5.61
Designs
Residence
40-kWhResidence
4025810
40040
220 c.451
Load
500-kWhi Load Center
500325100100800260
t. 440130
3
Center
Magnetic bearing-6 per systemdiameter, in.gap, mils
Nominal dissipation, wattsperm, magnet designelectromagnet design50/50 design
PM designmagnet weight, lbs.
Electronicscrossover frequency wcHzmax. switching freq, kHz
500202015
.625
.50081.1
3.218
430072
.72
301.25
4000363615
108
16
930
430072
9.6
231.25
500,00084846.5
10010034
108
3257
430072
228
16.54
322

User worth studies are nearly complete for both sizes and will be reported at a futuredate. Major results are as follows:
1) Optimum flywheel usable storage capacity in stand-alone systems fora given solar array size is approximately 2 to 4 hours times thearray peak rating (energy capacity measured at the system output).As the price of diesel fuel rises, the optimum size of both arrayand flywheel increases.
2) Storage is desirable at a utility-interactive site only if less than 50%buy-back rates are available on a flat-rate basis. Time-of-use pricingmodifies this conclusion.
3) Choice of a stand-alone with diesel backup and storage or a utility-interactive system design without storage is determined by distancefrom the electric utility, with the cost of interconnection exceedingthe benefits between 5 and 15 miles distance, depending on costassumptions.
Manufacturing cost studies are now being conducted.
The subscale system rotating hardware is shown in Fig. 2. The status of each componentis described below:
1) Rotor and containment system: no bids were received for a test (steel)rotor and containment system, so an in-house deugn has been completedand is now in fabrication. This resulted in a two-month projectschedule slip, reported previously. The design will be available toother experimenters.
2) Magnetic bearings have been fabricated. An error in the numericalanalysis resulted in a design with excessive leakage and resulting lowlifting force. Adjustment of magnetic air gap and reduction of totalrotor weight from 500 to 390 pounds has been chosen to permit systemtesting; a redesigned bearing with full lifting capacity and air gapwill be built later to verify the design.
3) Motor-generator fabrication is 90% completed with no technical problems.
4) Cycloconverter electronics have been fabricated and 80% tested on asimulated motor-generator. A design improvement permits operation belowdesign spread with increased harmonic content.
5) Motor-drive electronics are 60% fabricated. The microprocessor-controlled maximum-power-point tracker has been completed and tested.
6) System dynamics analysis has proceeded by simulation. A generalizedflywheel whirl stability criterion has been derived, and an applicationmethod has been developed which uses linear non-rotating vibrationalmodes of the system from standard finite element programs. Calculationsof damping and torque requirements have been made to traverse whirlmodes of the system during initial spin-up. By design, there are nowhirl modes in the operating speed range of the system, as shown inFig. 3.
7) Test system (vacuum tank and support structure) modifications are inprogress. These include fabrication of the containment ring and Itssupports, and are the pacing items on project schedule.
Initial system testing is scheduled to begin in November 1979.
323

O, SPIN-RATE |Hl)
8" QUILL
Fig. 3. Spin-Whirl Dynamics.
The predicted system efficiency is calculated from an energy budget for the residentialsystem, shown in Table 3. Using a load prof i le from the G.E. PV Residential System DesignStudy'3) and two possible solar input prof i les, both giving an energy balance over a day, thesystem energy round-trip efficiency is approximately 70%. This figure 1s not very sensitive todetails of the Input/output pro f i le , as Figs. 4 and 5 show, due to the high efficiency of theInput/output equipment.
RESIDENTIAL F.I S I TYPICAL DAILY ENERGY BALANCE
30 ] •
F1g. 4. Load Profi le A
324
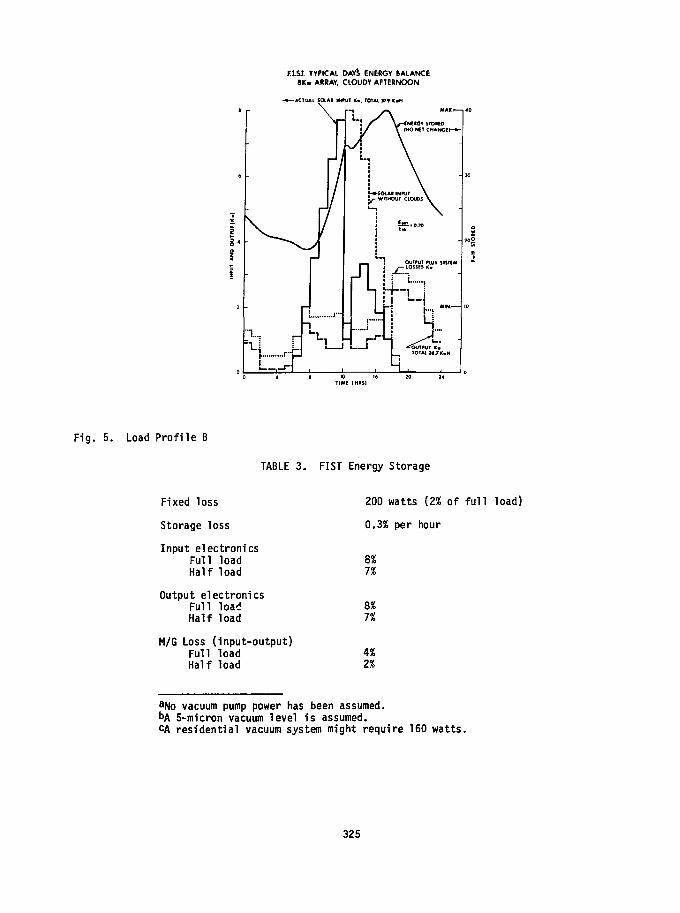
FIST. TYPICAL DAYS ENERGY BALANCE8Kw ARRAY, CLOUDY AFTERNOON
—ACTUAL SOtAI INPUT KB, TOTAL 37f K*H
16 70
Fig. 5. Load Profile B
TABLE 3. FIST Energy Storage
Fixed loss
Storage loss
Input electronicsFull loadHalf load
Output electronicsFull loadHalf load
M/G Loss (input-output)Full loadHalf load
200 watts {2% of full load)
0.3% per hour
8%7%
8%7%
4%2%
aNo vacuum pump power has been assumed.t>A 5-micron vacuum level is assumed.CA residential vacuum system might require 160 watts.
325

In the future, MIT/Lincoln Laboratory hopes to investigate on a subscale basis theimplications of:
- Utility-interactive flywheel electronics- Dynamics effect of low-cost rotors.
Also MIT/Lincoln Laboratory hopes to build a residential-sized system based on the result ofthis work, assuming that cost analysis results are favorable.
REFERENCES
1. A. R. Millner, "A Flywheel Energy Storage and Conversion System for PhotovoltaicApplications," COO 4094-48, International Assembly on Energy Storage, Dubrovnik,28 May - 1 June 1979.
2. A. R. Millner, R. D. Hay, "Flywheel Energy Storage Interface Unit for PhotovoltaicApplications," COO 4094-44, 14th Intersociety Energy Conversion EngineeringConference, Boston, 5-10 August 1979.
3. E. J. Buerger et al_., "Regional Conceptual Design and Analysis Studies for ResidentialPhotovoltaic Systems," SAND78-7039, Tech. Vol. II, prep, for Sandia Laboratories byGeneral Electric Space Division, Philadelphia, January 1979.
326

SESSION 5 i FLYWHEELS
327

PROJECT SUMMARY
Project T i t l e : Mechanical Energy Storage Technology Project
Principal Investigator: Thomas M. Barlow
Organization:
Project Goals:
Project Status:
Contract Number:
Contract Period:
Funding Level:
Funding Source:
Lawrence Livermore LaboratoryP. 0. Box 808, Mail Stop L-388Livermore, CA 94550(415) 422-8200
The goals of this project are to develop and evaluate mechanicalenergy storage for both vehicular and photovoltaic/wind applicationsand to maximize the commercialization potential of the technology.
The Lawrence Livermore Laboratory's (LLL) efforts in the development• of mechanical energy storage technology (MEST) were in i t iated in FY75.Our early efforts involved the development and characterization offiber-composite materials for use in l igh t performance flywheels.
In FY1977 and FY1978, respectively, the Project expanded to include (1)technical management of the development MEST technology for applicationto electr ic and hybrid vehicles and (2) evaluation of the laminateddisc rotor concept. Funding in the former area was provided under theElectric and Hybrid Vehicle RD«D Act of 1976 (Public Law 94-413).
In FY1979, the project was expanded as the Sandia Laboratory inAlbuquerque (SLA) began to transfer i t s act iv i t ies to LLL. Includedin this transfer are the technical management responsibility forflywheel rotor and mechanical component technology areas, as wellthat for photovoltaic and wind energy systems applications.
The project consists of into six tasks, as l is ted below. The estimatedFY1979 expenditure levels for each task is included; these estimatedcosts do not include the work reported separately by SLA.
o Transportation Applications $1,321,000o Photovoltaic/Wind Applications $36,000o Fiber Composite Materials Characterization $310,000o Flywheel Rotor Technology $520,000o Component Technology $213,000o Project Management and DOE Support $175,000
For the most part, the Project's act iv i t ies emphasize subcontracts toprivate industry. In-house act iv i t ies include technical management,material characterization, and tapered-thickness rotor conceptevaluation.
W-7405-Eng-48
Continuing
$845,000 FY1979 B/0 from E&HV Program$1,730,000 FY1979 B/0 from Energy Storage Program
U. S. Department of Energy
329

Project Title:
Principal Investigator:
Organization:
Project Goals:
Project Status:
Contract Number:
Contract Period:
Funding Level:
Funding Source:
PROJECT SUMMARY
Mechanical Energy Storage Technology Development
R. 0. Woods
Sandia LaboratoriesAlbuquerque, NM 87185(505) 264-7553
The selection of those mechanical components of flywheel energystorage systems that can be carried to their next stage ofevolution by efforts within the scope of the budget; the fundingof developmental work treating such components. The documen-tation of the state-of-the-art in component technology wheresuch information is scattered or fragmentary.
Efforts have treated the following components:
Rolling Contact BearingsMagnetic Bearings - Active and PassiveComposite Wheels - Hardware development, development of analytic
and testing techniques, material studies.
Composite Materials - Analysis, improved properties, vacuumoutgassing properties, fabrication andthermal characteristics.
Seals - Power dissipation, lifetimes, permeation rates.
Funding has been provided to other agencies for the testing ofenergy storage systems, and the groundwork has been completed fora program to deal with the problems of vacuum technology.
SOL 78
FY79
$980 K*
DOE, Division of Energy Storage Systems
Included in this project are the following:"Rotor Analysis," Keith Miller."Flywheel Rotor Analysis," Arlo Nord.
331

SANDIA ACTIVITIES OVERVIEW
R.O. WoodsSandia Laboratories
Advanced Energy ProjectsDivision 4715
Albuquerque, NM 87185
ABSTRACT
This presentation will mention all Sandia efforts in the field of components developmentduring FY79. Particular emphasis will be placed upon activities not reported at the October1978 review meeting. A complete list of the publications that were generated during thereporting period is included here and will be presented as a handout during the verbalpresentation.
INTRODUCTION
This program can most logically be discussed in terms of the four main tasks listed inViewgraph 1. Table I, which is included in the handout but not reproduced as a viewgraph,lists all the contracts that were active during FY79.
A. 40 WATT-HR/LB COMMERCIAL WHEELS
The largest single item in order of cost was the placing of contracts for the developmentof composite wheels with a nominal energy density of 40 watt-hr/lb. A strenuous effort wasmade to bring this part of the program to the attention of all potential suppliers; it washoped that some new sources would be developed. A note was placed in Commerce Business Dailyfor December 8, 1977, soliciting expressions of interest. Twenty-three replies were received,of which nineteen were credible candidates. A request for proposals was circulated to thosenineteen. Four contracts were placed in August 1978 after proposals had been evaluated bya panel of five Sandia persons working in relevant fields. The successful bidders (Viewgraph2) were:
1. Garrett AiResearch
This organization proposed a design that was a logical continuation of work that had beendone for the Army Mobility Equipment Research and Development Command (MERADCOM). Finaltesting of the original MERADCOM design had been partly supported by DOE via a Sandia FederalAgency Order. (The wheel was successfully spun to its design speed in September 1978, when aperipheral speed of 2800 FPS was reached. Energy density at this speed was 26 Whr/lb; animpressive level in itself, but all the more significant since much of the weight of the wheelwas in a brute force hub/spoke assembly that was used solely to test the rim.) The uniquefeature of this design is a rim that is wound in concentric layers, isolated from one anotherby films of teflon which cripple their bending stiffness. This allows the rim to be pressedon the cruciform spoke assembly by deforming it into a slightly square ("subcircular") shape.The same concept was used on the successfully tested rim. Spokes and hub of the presentdesign are formed by using a carbon-filament structure.
The program was concluded on schedule. As of July, we are awaiting delivery of thehardware. The effort was documented in Reference 1. (The list of publications is includedin the handout but not shown as a viewgraph.)
332

2. Rockwell International
The Rockwell design is based upon an earlier version that had been developed for use inspacecraft as an energy-storage and inertia! flywheel. Hardware delivery is scheduled nearthe end of FY79.
3. Hercules
The Hercules wheel is unique in that it is essentially monolithic, with the mass concen-trated near the periphery. This gives a very high volumetric energy density. Emphasis isplaced upon use of a polysulfone matrix, rather than the more common but less elastic epoxy,to minimize transverse stresses. As with the Garrett wheel, hub attachment is via an elasto-meric bond. Hardware delivery is scheduled near the end of FY79.
4. Hilliam M. Brobeck & Associates
The Brobeck design incorporates a rim concept that has become almost traditional. Itsunique feature is the use of "tension-balanced" spokes, in which an elaborate design matchesradial growth of the spokes to the centrifugal dilation of the rim. Stresses at the spoke/riminterface are thereby held constant. One specimen wheel has been shipped as of July 1979.A second is being fabricated.
B. UHEEL ANALYSIS AND TESTING
This has involved two testing campaigns which took place in R.M. Hargreaves' Livermorespin test facility, as well as extensive analytic work that resulted in publications bymembers of Sandia's staff and consultants at the University of 0klahoma(2-13) This was atightly-organized effort in which experiments were used to verify analytic predictions ofvibrational modes. The program was coordinated by E.D. Reedy, Sandia Laboratories. Theobjective was not to develop the ultimate wheel, but rather to perfect analytic tecnniquesthat would make it possible to predict the behavior of new wheel designs. For this reason,the test wheels themselves were workhorses rather than high-performance hardware.
As a parallel to the classical mechanics approach taken by the University of Oklahomagroup, a finite-element analysis using NASTRAN was implemented at Sandia by A.K. Miller.Corresponding analyses were performed using both techniques, and the results were used formutual checking. An extremely fruitful dialog has resulted that has led to refinements inboth computational techniques. Both sides of the effort will be described in presentationsthat are scheduled to be given at this conference.
A third experimental approach to investigating vibration has been taken by instrumentingwheels with multiple accelerometers, shocking them, and computer processing the accelerometeroutputs in real time. This work was done at Sandia's Albuquerque environmental test facil-ity!*^} Experiments of this kind make it possible to analyze vibrational modes withouthaving to spin the wheels. This provides very cheaply yet another check on the accuracy ofprediction models. A video tape presentation will display the technique.
Near the end of CY78, negotiations were begun that were aimed at establishing a flywheeltest center, either at Union Carbide's Y-12 plant or at the Applied Physics Laboratory,Johns-Hopkins. The choice of locations has not yet been made.
C. BEARINGS
Two bearings studies (Viewgraph 4) were under way at the beginning of the year; one byDraper Laboratory that treated the next generation of ball bearings as specialized for thevacuum environment, the other by Mechanical Technology, Inc., dealing with a hybrid magneticsuspension. A second contract was placed with MTI later in the year, following an open RFPtreating a fully magnetic suspension. The Draper Laboratory reportUw was delivered at theend of CY78 and represents a substantial contribution to mechanical bearing technology. In
333

it, the characteristics of retainerless ball bearings operating in vacuum were investigatedexperimentally and a computer model was developed that would predict the operating parametersof such bearings over a range of speeds and loadings. These data are now available for usein trade-off studies comparing mechanical (i.e., ball) bearings to other types.
The MTI contracts were also aimed at producing hard data for trade-off studies. In thefirst, the details of a hybrid magnetic/flu id-film bearing were worked out with enoughelaboration to allow realistic estimates t" be made of power consumption, load capability,bearing geometry, and lubrication systetr idracteristics. This work was documented inReference 17. (As of this writing, rele_ 3 of this document has been held up for patentconsiderations.)
The second MTI study, which was placed with this contractor after an open RFP failed tolocate another vendor, provides similar data for a system in which the entire mass of therotating assembly is to be supported magnetically. The specific intention was to provideinput to systems studies where scaling laws are needed to predict bearing operatingparameters for units ranging in capacity from 1 kW-hr and intended for use in vehicles, to100 kW-hr, intended for stationary applications. In all cases, operation in vacuo is assumed.Particular attention is required to the hardware aspects of the system such as: productioncosts vs. quantity, scaling laws for significant parameters, sensitivity to acceleration andvibration, maintenance considerations, lifetimes, and environmental problems. The contractoris currently in the process of producing the final version of his report.
D. VACUUM TECHNOLOGY
A number of aspects of vacuum technology relevant to flywheel applications were studiedduring FY79 (Viewgraph 5). These included a program by Ball Brothers Research that measuredthe outgassing properties of flywheel composite materials, a study by M. Baer, Sandia Labora-tories, of the aerodynamic heating of composite wheels, and a study of shaft seals by theFranklin Institute. A contract was also placed with the Applied Physics Laboratory to studyferrofluidic shaft seals, and.R.0. Woods issued a publication that discussed the overallvacuum technology problem.^ ' The latter is intended as background material to supplementan RFP, if and when an effort is made to locate a contractor capable of handling the entireprogram.
It has long been recognized that vacuum environment is necessary for the operation ofany high-performance flywheel system, but the acceptable pressures and gas loads due to out-gassing of composites were matters for speculation. For want of better information, manyworkers assumed that an adequately low pressure could be maintained by pumping at infrequentintervals and sealing-off the system. A Sandia-sponsored investigation of outgassing propertiesof the composite materials used in flywheels has established the magnitude of the gas load-In that study, the outgassing rates of six different materials were measured as a function oftime up to 100 hours. Similar data were also taken at elevated temperatures. The data arepresented in Reference 19.
The similarities between the conditions that exist at the surface of a composite flywhaeland those at the skin of a re-entering spacecraft were exploited to make use of existingSandia aerodynamic heating codes. Peripheral speeds of composite wheels can range as highas 1000 metres/second — a reasonable speed for a re-entering sounding rocket. Further,atmospheric pressure in the altitude range where re-entry effects become significant is in thevicinity of 10-3 to 10"* torr — a practical range for the pressure in a flywheel enclosure.When the similarities were brought to his attention, M. Baer was able to capitalize upon themby adapting a computer code that had been developed for re-entry heating calculations. Thiswas used to generate boundary conditions for another code that evaluated the internal tempera-ture fields of anisotropic bodies. Baer's work^ 0^ made it possible to set an upper limit tothe pressure at which composite wheels could operate. (For steady-state conditions, this willtypically be around 10"4 torr.)
334

It is generally thought that mechanics1 shaft seals will not be suitable for use in com-posite wheel systems because of the high running speeds and low tolerance of such systems forleakage. A contract was placed with Franklin Institute Research Laboratories aimed at testingthis supposition by documenting the practical range of running speeds determined by wear andpower consumption and to establish realistic permeation or leakage rates for present state-of-the-art seals. It was also required that the contractor suggest the most fertile line ofdevelopment for future seals technology. The results of this study were documented inReference 21.
Another type of seal is being investigated experimentally by the Applied Physics Labora-tory, Johns Hopkins University. This is the so-called "ferrofluidic" seal that uses a mag-netic fluid held to a shaft by a magnetic field. The APL program is scheduled to conclude inAugust.
E. MISCELLANEOUS
Funding was provided to MERADCOM to finish testing a complete flywheel energy storageunit that had been developed by Rockwell as a part of a cancelled program. These tests areto be performed during CY79. This unit embodies a number of engineering innovations and isunique as to size and designed performance levels. The test data will represent a substan-tial contribution to our knowledge of what is practically attainable in energy storagesystems. Tests are to be supervised by L. Amstutz of MERADCOM.
Materials research, aimed largely at improving the transverse properties of compositesfor flywheel use, was conducted by R.E. Allred of Sandia Laboratories. Means were investi-gated to modify the properties of a matrix by the addition of a rubbery phase, and to improvethe filament/matrix bond. These studies necessitated the development of improved test fix-tures, which have greatly reduced scatter in the test data. This work has been documented inReference 15.
PUBLICATIONS
1. SAND79-7019, "High-Energy-Density Composite Flywheel," AiResearch Manufacturing Co. ofCalifornia, April 11, 1979, Contractor's Final Report.
2. SAND78-7070, "Lateral and Tilt Whirl Modes of Flexibly Mounted Flywheel Systems," TheUniversity of Oklahoma, November 17, 1978.
3. SAND78-7O73, "Whirling Response and Stability of Flexibly Mounted, Ring-Type FlywheelSystems," The University of Oklahoma, December 12, 1978.
4. SAND78-7049, "Critical Speeds and Natural Frequencies of Rim-Type Composite-MaterialFlywheels," The University of Oklahoma, November 9, 1978.
5. "Design of Spoked-Rim Composite Flywheels," E.D. Reedy, Jr. and F.P. Gerstle, Jr.,Proc. 1977 Flywheel Technology Symposium, San Francisco, CA, October 5-7, 1977.
6. "A Composite-Rim Flywheel Design," E.D. Reedv, Jr., Proc. 23rd National SAMPE Symposiumand Exhibition, Anaheim, CA, May 2-4, 1978, SAMPE Quart. 9_, (3), p. 1, April 1978.
7. "Model Analysis of Stable Crack Growth," E.D. Reedy, Jr., Eng. Frac. Mech. 10_, (2), 1978.
8. "Sandia Composite-Rim Flywheel Development," E.D. Reedy, Jr., Proc. 1st Annual Mechanicaland Magnetic Energy Storage Contractors' Information-Exchange Conference, Luray, VA,October 24-26, 1978.
9. "Composite-Rim Flywheels: Spin Tests," E.D. Reedy, Jr. and H.K. Street, submitted forpublication 2/29/79, SAMPE Quart.
335

10. "Prediction of Creep Behavior for Filamentary Composites Under Stress ConditionsEncountered in Flywheels," C.W. Bert and T.L.C. Chen, Proc. of the 1977 FlywheelTechnology Symposium, San Francisco, CA, October 5-7, 1977, DOE CONF-771053, March1978, pp. 291-298.
11. "Critical Speed for Standing-Wave Instability in a Filament-Wound-Composite Ring-TypeFlywheel," C.W. Bert, Proc. of the 1977 Flywheel Technology Symposium, San Francisco,CA, October 5-7, 1977, DOE CONF-771053, March 1978, pp. 429-433.
12. "On Vibration of a Thick Flexible Ring Rotating at High Speed," C.W. Bert and T.L.C. Chen,Journal of Sound and Vibration, Vol. 61, no. 4, December 22, 1978, pp. 517-530.
13. "Research on the Dynamics of Band-Supported Flywheel Systems," C.W. Bert, C.A. Kocay,T.L.C. Chen, and J.P. Busby, Research Report OU-AMNE-78-8, November 1978; also SandiaLaboratories Report, SAND78-7074, February 1979.
14. Sandia Test Report #060564, "Modal Analysis of Two Composite Flywheels," A.R. Nord andCM. Grassham, January 1979.
15. "Improvement of Transverse Composite Strengths: Test Specimen and Materials Develop-ment," R.E. Allred, H.K. Street, and R.J. Martinez, Proc. 24th National SAMPE Symposiumand Exhibition, San Francisco, CA, May 8-10, 1979, pp. 31-50.
16. SAND79-7003, "Final Report on the Development of an Advanced Flywheel Bearing Perfor-mance Model," The Charles Stark Draper Laboratory, Inc., January 12, 1979.
17. SAND79-7007, "Application of Magnetic Suspensions and Fluid Film Bearings to EnergyStorage Flywheels," Mechanical Technology, Inc., January 1979.
18. SAND78-0944, "Vacuum Technology Requirements for Flywheel Energy Storage," R.0. Woods,August 1978.
19. SAND78-7O75, "Outgassing Tests of Fiber/Epoxy Composite Materials," Ball BrothersResearch Corp., Aerospace Division, December 13, 1978.
20. SAND78-0957, "Aerodynamic Heating of High-Speed Flywheels in Low-Density Environments,"M.R. Baer, October 1978.
21. SAND79-7011, "Seal Studies for Advanced Flywheel Systems," Franklin Research Center,February 1979.
22. "Use of Polymeric Materials in Energy Storage Systems," J.H. Swisher, in; PolymerMaterials Basic Research Needs for Energy Applications, Proc. of Workshop, CaseWestern Reserve University, Cleveland, OH, June 27-29, 1978.
23. Report #ALO-41/1, "Study of Heat Engine/Flywheel Hybrid Propulsion Configuration withElectrical Transmission System," AiResearch Manufacturing Co., Division of the GarrettCorporation, April 1978.
24. SAND79-1151, "Mechanical Energy Storage Technology Development — Annual Report,"R.0. Woods, July 1979.
336

TABLE I. Contracts Active During FY79
Contractor and Description
Brobeck Wheel
Hercules Wheel
Garrett Wheel
Rockwell Wheel
Draper Labs Bearings
MTI Hybrid Bearings
MERADCOM Garrett
Franklin Institute Seals
MTI Magnetic Bearings
Ball Brothers Outgassing
University of Oklahoma (1979)
MERADCOM Rockwell
APL (J-H) Seals
SandiaNo.
07-0291
07-0292
07-0293
07-6955
07-6996
07-6997
07-7095
07-71^1
07-71^2
07-7150
13-3832
13-2369
13-2396
Status(8/1979)
Active
Active
Concluded
Active
Concluded
Concluded
Concluded
Concluded
Active
Concluded
Active
Active
Active
StartDate
7/78
7/78
7/78
7/78
10/77
1/78
1/78
1/78
!+/781/78
10/78
12/78
12/78
337

rViewgraph 1 Viewgraph 2
MAJOR TASKS
1+0 WATT-HR/LB WHEELS
WHEEL ANALYSIS AND TESTING
BEARINGS
VACUUM TECHNOLOGY
l»0 WATT-HR/LB WHEELS
BROBECK
HERCULES
GARRETT
ROCKWELL
Viewgraph 3 Viewgraph h
WHEEL ANALYSIS AND TESTING
SLA IN-HOUSE PROGRAMS:
SPIN TESTSMODAL ANALYSISNASTRAN
UNIVERSITY OF OKLAHOMA
BEARINGS
MAGNETIC
MTI HYBRIDMTI FULLY-MAGNETIC
MECHANICAL
DRAPER LAB RETAINERLESSBALL BEARING
Viewgraph Viewgraph 6
VACUUM TECHNOLOGY
OUTGASSING
BALL BROTHERS RESEARCH
SEALS
FRANKLIN INSTITUTEAPPLIED PHYSICS LABORATORY
AERODYNAMIC HEATING
SLA
MISCELLANEOUS
MERADCOM TESTS
MATERIALS STUDIES
338

PROJECT SUMMARY
Project Title: Analysis of Composite-Material Flywheels for Vehicle Applications
Principal Investigator: Charles W. Bert
Organization: University of OklahomaSchool of Aerospace, Mechanical and Nuclear EngineeringNorman, Oklahoma 73019
Project Goals: To develop analytical capability to predict dynamic behavior of rim-typeflywheels supported by flexible bands in two configurations: spin-testconfiguration (quill shaft) and vehicle configuration (end-supported), tocorrelate predictions with spin-test results, to suggest design changes toimprove dynamic behavior, to investigate effects of nonlinearity of supportbands, and to investigate analytically problems of containment after bandfailure.
Project Status: The following linear analyses have been completed for the quill-shaftsystem: free whirling, stability, and forced whirling (response to rimunbalance and initial tilt). The results have been correlated with spin-test results and certain design improvements have been suggested to improvethe dynamic behavior of the system. The effects of a variety of vehicularsupport parameters (end-supported flywheel shaft) have also been investi-gated.
A string-column model has been devised to simulate the nonlinear action ofthe supporting bands connecting the rim to the hub. This model has beenused to determine radial restoring force and tilting moment as a nonlinearfunction of running speed, relative radial displacement, and relativetilting angle. A Runge-Kutta numerical-integration procedure has beendevised to determine the time response of the complete system includingthe nonlinear action.
Regarding containment, some preliminary calculations have been madeinvolving both strength arid frictional heating due to rubbing of the rimagainst the containment housing after failure of the supporting bands.It is difficult to utilize these results until some experimental measure-ments are made on impact dynamics and heat generation in these materialcombinations at these speeds.
Contract Number: 07-7843; 13-3832
Contract Period: Dec. 1, 1977-Nov. 30, 1978; Dec. 1, 1978-Sept. 30, 1979
Funding Level: $38 K; $33.6 K
Funding Source: U.S. Department of Energy, through Sandia Laboratories, Albuquerque, NM
339

ROTOR DYNAMICS:DYNAMICS OF RIM-TYPE FLYWHEELS SUPPORTED BY FLEXIBLE BANDS
Charles W. BertSchool of Aerospace, Mechanical and Nuclear Engineering
The University of OklahomaNorman, Oklahoma 73019
ABSTRACT
Certain high-performance, composite-material flywheel systems for energy storage on vehiclesdiffer significantly from turbine/compressor systems in two respects: the flywheel rim attach-ment to its hub is very flexible (especially in tilting) and these flexibilities depend upon ro-tational speed through centrifugal stiffening. This paper describes analysis of free whirling,suggestions for design improvements, stability analysis, response to unbalance and initial tilt,and nonlinear analysis of supporting-band action.
INTRODUCTION AND BACKGROUND INFORMATION
As part of the national effort to conserve petroleum as an energy source, there is interestin storing energy in hybrid automotive vehiclesi especially for short-distance, start-stop vehi-cles such as urban cars, delivery vehicles, etc. One candidate mechanical means of storing ener-gy in such a vehicle is a flywheel. Most flywheels developed to date have been rather heavy,rigid ones made of conventional, homogeneous, isotropic materials, such as high-strength steel.However, with the development of advanced filamentary composite materials, there is considerablepromise in the use of these materials in view of their high strength-to-weight values, since theenergy storage per unit weight is directly proportional to this parameter. Another advantage isthe less catastrophic nature of the failure of such flywheels; this advantage allows a lighterflywheel containment system.
One design concept to achieve high energy storage per unit weight is to have the compositeflywheel mass concentrated at fairly large radius (rim) and run at high speed (>30,000 rpm).High speed causes difficulties in attachment to the power-transmitting hub; thus, the attachmentmust also be of composite material. Composite material in turn results in a very flexible attach-ment, which causes quite different dynamic problems than those encountered previously in rotatingmachinery such as turbines and compressors.
In this investigation, the dynamic phenomenon of the whirling mode, generally recognized asone of the most catastrophic ones associated with rotating machinery, is carefully examined.Apparently the only previous analyses in the literature concerning the whirling dynamics of rim-type flywheels existing are due to McKinnon'-^and Bert and Chen*1 '. McKinnon considered freewhirling of a two-mass system having three degrees of freedom: hub tilting, hub translation,and rim tilting. In Ref. 2 these flexibilities were considered.plus the radial flexibility ofthe hub-flywheel connector.
In the present work, free whirling, forced whirling, and stability analyses are studied fora four-mass, eight degree-of-freedom believed to be the most appropriate model to describe theSandia flywheeU3>as installed in a quill-shaft, air-turbine-drive test facility.
The Sandia Laboratories experimental flywheel prototype (Fig. 1), for which the presentanalyses are intended to be applied, has a thick rim of hoop-wound graphite-epoxy attached to a
340

central aluminum hub by radially wound bands of aramid-epoxy (Fig. 2). The hub is attached tothe turbine through a relatively flexible steel flywheel shaft (a quill shaft cantilever-mounted,at the top, inside the turbine shaft). The steel turbine shaft is supported on two ball bearingsand carries the air-driven turbine. An external damper is located between the lower bearing andhub on the flywheel shaft. In Ref. 3, Reedy predicted that the design energy-storage goal of0.56 kwh (49.4 watt-hr/kg) is achieved at a rotational speed of 32,000 rpm and that the governingmaterial strength is reached at 39,850 rpm.
PROJECT DESCRIPTION AND RESULTS
HYPOTHESES
In the analyses presented here, the principal engineering assumptions are:1. The bearings (ball bearings) are isotropic and act as simple supports.2. All rotating components are geometrically axisymmetric, but provision is made for rim
mass-center eccentricity (static unbalance) and tilt.3. In the main analyses, all nonlinear effects are neglected. (However, in the latter
part of the paper, string/column action of the bands is investigated.)4. Although the shaft is vertical, pendulum action is small.5. The shafts and bands are modeled as discrete, massless elements with elasticity and
material damping; the damper is assumed to have viscous damping.6. The flywheel rim, flywheel hub, turbine disk, and damper are considered as discrete
rigid bodies. (For the flywheel rim this was confirmed in an earlier contract^,where it was found that the lowest natural frequency is 56,900 cpm.)
FREE WHIRLING AND SUGGESTED DESIGN IMPROVEMENTS
When a shaft with a rigidly attached rotor, overhung with respect to its supports, is ro-tated at constant speed, the centrifugal force produced by an eccentricity causes the disk totilt with respect to the axis of rotation. This tilting action, in turn, produces a gyroscopiccouple about the diametral axis of the disk. The sense of the gyroscopic couple is such that iteffectively stiffens the shaft at the speeds associated with forward precession and reduces theeffective stiffness at the speeds associated with retrograde (or backward) precession.
In the Sandia thick-rim flywheel (Fig. 2 ) ^ , the rim is connected to the hub by means ofrelatively flexible bands, in contrast to the usual case for overhung compressor disks whichcustomarily are rigidly attached to the shaft. Thus, it is clear that the rim and hub should beconsidered as two different masses rather than a single one. Except for Refs. 1 and 2 all exist-ing multi-mass disk-shaft system analyses are applicable only to the case when the flexible mem-bers connect to ground. In the case of the Sandia flywheel mounted in the spin-test facility, aflexible member (the bands) connects to an otherwise free mass (the flywheel rim).
In the whirling analysis, each rotor has two generalized displacements associated withtranslation (r) and rotation ($). For the flywheel depicted schematically in Fig. 1, there areeight generalized displacements {q,-} = (rr, <f>r, rn, <j>h, rt, *t, rd, $ d )
T . The subscripts r, h,t, and d refer to the rim, hub, turbine, and external damper, respectively. The correspondinggeneralized forces are {Q.} = (Fp, Mr, Fn, Mn, Ft, Mt, Fd, M d )
T . The connecting equations can bewritten in matrix form asJfollows:
{Qf} = [Ki;j] tqj> ; i, j = 1. 2, •••. 8 (1)
where [K-jj] is the stiffness matrix. Derivation of the compliance matrix, from which [Kjj] canbe obtained by inversion, was presented in Ref. 5, Appendix E.
Assuming normal-mode whirling with frequency u, one seeks the following solutions:
{q^ = (qy e i u t ; i = 1, 2, .... 8 (2)
where q^ is the amplitude of q-|. Putting Eq. (2) into Eq. (1), one gets the homogeneous linear
341
ralgebraic.equation set
-] + [N^]*. - [M^VHq^.} = 0 (3)
where [M-•] and [N. .] are 8x8 matrices,i j i j
Equation (3), referred to as a generalized eigenproblem, can be reduced to the standard-type eigenproblem by use of an appropriate transformation. Solving the eigenvalue problem, onecan obtain modal frequencies as a function of the rotational speed. Plots of these relationshipsare shown in Fig. 3 for both the forward and the retrograde branches. The intersections of theu vs. a curves with straight lines of the form a = na determine the so-called critical speeds(ncr) which correspond to the vali/es of running speed n at which dynamic instability may takeplace. The value n(= a/a) is called the order of the critical speed and it is usually either apositive or negative integer or its reciprocal. Lines corresponding to n = + 1 and n = + 2 areshown in Fig. 3.
Most investigators have emphasized the first order (n=l) critical speeds; some claim thatbackward-precession critical speeds are less dangerous than forward-precession ones. 'However,Yamada^6)observed experimentally retrograde as well as forward critical speeds of orders up to 8,and Thomson et al .'^detected several critical speeds of both retrograde and forward orders. InFig. 3 there are shown four first- and at least four second-order forward critical speeds in therotational speed range up to 50,000 rpm. The first-order critical speeds occur at about 700,7,600, and 38,100 rpm. In contrast, the experience of Refs. 1 and 7 suggest that higher-modeforward critical speeds of second order are most dangerous. It is noted that the amplituderatios 4>r/<f>n and rp/rn increase rapidly as the running speed approaches the fourth-mode, second-order forward critical speed (approximately 24,200 rpm). This is consistent with comparison be-between the present results and the experimental results in fef. 8 as discussed below.
The major differences in System B (twisted bands) as compared to System A are smaller out-of-plane band compliance and larger hub mass and axial moment of inertia (mn, J m n ) - It appearsthat this calculated fourth-mode, second-order forward critical speed was not associated with theexcessive amplitudes which occurred during spin tests in the vicinity of 29,000-30,000 rpm.Exactly which critical speed is most important is less certain. However, there is a distinctpossibility that it is a first-order forward one at the second mode. Further comparisons withexperimental results may be found in Ref. 5.
One of the objectives in designing the flywheel systems is either to eliminate the criti-cal speeds, if possible, in the operating speed range or to move them beyond the maximum opera-ting speed. In the Sandia System A and B designs, the two most dangerous critical speeds are thefirst-order forward one at the second mode, (flcr)i2» and the second-order forward one at thefourth mode, (a,.^)^- In Vlew of tne nearly identical performance of Systems A and B, it ispractically sufficient to present numerical results for only one system since these results areapplicable to the other system with an error of less than 0.5%.
Practical ways to increase (JW)i2 are: to increase the flexural rigidity (EIS) of the fly-wheel shaft, to decrease the hub's diametral mass moment of inertia, and to increase the angle ofthe bands with respect to the plane of the rim, $. It was found that {acr)zk is unaffected, but(flcr)i2 is increased by approximately 3% for each one-degree increase in $, ( n c r ) 1 2 is increasedby approximately 18% when Imn is reduced by 20%. Critical speed (s c r) 2^ remains unchanged forthe above two cases and for the case even when Is and $ are increased simultaneously. In orderto increase critical speed (S2cr)2"*' it 1S necessary to increase the stiffnesses of the flywheelshaft and turbine shaft as well as the angle <j> simultaneously. When the foregoing three para-meters are doubled simultaneously, critical speed (Qrr)2k is increased from 24,200 rpm to 31,800rpm and (iJcr)i2 is increased from 38,100 rpm to 41,700 rpm.
In addition to the work just described for the Sandia flywheel in the spin-test facility, aseries, of computations^was carried out for the Sandia design mounted between ball-bearingsupports, more typical of a vehicular mounting. Twenty-six different combinations of the follow-ing parameters were investigated: hub location along the shaft, upper and lower bearing-pedestal
342

spring constants, and the area moment of inertia of the shaft. Of the 26 cases considered,twenty were deemed to be satisfactory from a dynamic standpoint, in that they had no forward-precession critical speeds of first-or second-order in the desired operating speed range of8,000 to 32,000 rpm.
STABILITY ANALYSIS
Internal friction (damping) acts in rotating shafts provided that the whirling speed isdifferent from the shaft rotational speed. Internal friction has the effect of resisting shaftmotion and causes energy dissipation. It is well known that internal damping reduces the ampli-tude of a non-rotating vibrating system and thus stabilizes such a system. In rotating machin-ery, however, if the rotational speed is above the lowest first-order critical speed, the effectof internal damping is reversed, i.e., the amplitude of whirling vibration gradually builds upand finally leads to an unstable motion.
One can bring internal damping in the steel shaft and in the aramid-epoxy bands into theformulation by replacing the Young's modulus with a complex modulus
E = (1 + I"Y)E ; n < a. (4)
Also the external force acting on the flywheel shaft at the external damper (with viscous co-efficient Cj) is added. Thus, one obtains a matrix characteristic equation of the same form asEq. (3) except that now the "stiffness" matrix [K. -] is complex rather than real.
' 3The stability criterion is obtained by using the Routh concept directly by numerically
determining the complex roots. In general, the whirling frequencies are complex numbers, i.e.,w = OIR - iuiT- Thus, the solution can be written as {q^} = { q ^ e " ^ e1<JR*. The quantity up isthe damped frequency, while the quantity o>j is the growth factor. It is noted that if wj > 0,the amplitude will grow witl. time exponentially and the system will become unstable. On thecontrary if UT < 0, the system is in a stable condition. Values of Yc and yb are assumed to be0.005 and 0.0172, typical of steel and aramid/epoxy, respectively. Effects of the externalviscous damping coefficient CJ on the onset of instability are shown in Fig. 4. If Cj = 0, theonset of instability occurs at the lowest first-order forward critical speed. Only a small valuefor CA (less than 43.8 N-sec/m or 0.25 Ib-sec/in) is required to stabilize unstable motion asso-ciated with the first and third modes for n > ui. When the value of C^ is greater than approxi-mately 35.0 N-sec/m or 0.2 lb-sec/in, the onset of instability jumps up to 38,100 rom. Increas-ing the value of Cj has very little effect on increasing the onset of instability beyond 38,100rpm.
FORCED WHIRLING
Although the rotors used for high-speed flywheels can be well bala"c .1 in today's techno-logy, it is not possible to eliminate the initial unbalance completely, m.s initial balance(eccentricity) causes resonance in the neighborhood of first-order critical speeds. In the ab-sence of damping, the resonance response would build up and finally cause the failure of thesystem. Another source of excitation for first-order critical whirling is unavoidable initialflywheel tilt (equivalent to couple unbalance). To reduce the response amplitudes in the Sandiaflywheel system, there is an external damper located on the flywheel shaft as shown in Fig. 1.Here the frequency response of the system is studied, and minimum damping determined for a givenmaximum response allowance.
If a rotor is unbalanced with an eccentricity of e and initial tilt <j>0, the translationaldisplacement (r^) and tilt angle (<f>c) of the rotor mass center-can be expressed as
rc = r + i eiflt ; *c = * + *0 e
iJ2t (5)
The maximum values of eccentricity and initial tilt are 0.025 cm (0.010 in) and 0.13°.
Due to the geometric configuration of the Sandia system it is expected that the unbalance
343
and initial tilt mostly occur in the rim. Thus, only frequency responses excited by such kindsof geometric imperfections are studied. The governingmatrix equation of motion is Eq. (3) withthe addition of an excitation column matrix on the right side. Solving this equation on a digi-tal computer, one obtains response as a function of running speed. Typical responses induced byvim eccentricity are presented in Ref. 5.
In the Sandia spin-test setup, there is a "stop" installed in the system, which limits thehub translation to a maximum of 0.071 cm (0.028 in). To prevent the hub from hitting the "stop",an adequate amount of external damping should be present. Hub translational response induced bya combination of an exaggerated value of rim eccentricity, 0.071 cm (0.028 in), and an initialtilt of 0.15 deg. is given in Fig. 5. Even in this extreme, a Cj of 43.8 N-sec/m (0.25 lb-sec/in)is enough to keep the hub from hitting the "stop". Also, calculations related to allowableclearance at the damper show that this same amount of damping should be adequate.
NONLINEAR EFFECTS IN THE SUPPORTING BANDS
From the geometry of the bands supporting the flywheel rim (Fig. 2 ) , an analysis is madeto analytically model the radial force t 4 tilting moment as nonlinearly coupled functions ofrim-to-hub relative radial displacement and .It angle, and running speed. To simplify thegeometric 'ationships involved, the geometry is assumed to be that of a string, i.e., theeffect of axural rigidity of the bands on the deflected shape is neglected. However, theeffect of flexural rigidity on the buckling load is not neglected, i.e., it is assumed that whenthe net compressive load (on the compressive side of a tilted rim or on the compressed bands dueto in-plane displacement of the rim) in a given band reaches the calculated buckling based onappropriate boundary conditions, that band cannot carry any additional load. The modal shapeused to depict the band behavior depends upon the running speed; for example, the point of maxi-mum deflection shifts from the band midpoint (x/L = 0.5) to x/L = 0.57 when the speed is in-creased from zero to 30,000 rpm. If this change in deflected shape was not taken into account,the buckling load at 30,00 rpm would be overestimated by about 7.2% (the accurate value is ap-proximately 156% greater than the buckling load at zero speed). Figure 6 is a typical 3-D plotshowing tilting moment as a function of displacement (x) and tilt angle (<)>). The Runge-Kuttanumerical-integration technique is used to directly integrate the coupled nonlinear governingequations.
ACKNOWLEDGMENTS
The research reported here was sponsored by the Department of Energy through contracts fromSandia Laboratories. The author also acknowledges the use of computational capability of theUniversity's Merrick Computing Center. Appreciation is due to Drs. E. D. Reedy, Jr. and A. K.Miller of Sandia, and to Professor D. M. Egle of the University for helpful discussions. Thecomputations reported here were ably performed by T. L. C. Chen, former graduate research asso-ciate, and C. A. Kocay, graduate research associate. The manuscript was carefully typed by Mrs.Rose Benda.
REFERENCES
1. C.N. McKinnon, Jr., "Rotor Dynamic Analysis", Appendix B of "Evaluation of Selected DriveComponents for a Flywheel Powered Commuter Vehicle", Final Rept.,Contr. EY-76-C-0301164,Phase I, LMC Corp. (June 30, 1977).
2. C.W. Bert and T.L.C. Chen, "Lateral and Tilt Whirl Modes of Flexibly Mounted FlywheelSystems", Rept. SAND 78-7070, Sandia Laboratories (Dec. 1978); to appear in Shock andVibration Bulletin 49 (1979).
3. E.D. Reedy, Jr., "A Composite-Rim Flywheel Design", SAMPE Quart. £(3), 1-6 (Apr. 1978).
4. C.W. Bert and T.L.C. Chen, "On Vibration of a Thick Flexible Ring Rotating at Hiqh Speed",J. Sound Vib. 61 (4), 517-530 (Dec. 22, 1978).
344

5. T.L.C. Chen and C.W. Bert, "Whirling Response and Stability of Flexibly Mounted, Ring-Type Flywheel Systems", Rept. SAND 78-7073, Sandia Laboratories (Feb. 1979); to appear inJ. Mech. Design. Trans. ASME.
6. Yamada, Y., "On the Critical Speeds of a Rotor System Having an Asymmetrical Disk", Proc.4th Japan Nat. Cong. Appl. Mech., 381-384 (1954).
7. W.T. Thomson, et al., "Whirl Stability of the Pendulously Supported Flywheel System",J. Appl. Mech.. Trans. ASME 44, 322-328 (June 1977).
8. E.D. Reedy, Jr. and H.K. Street, "Composite-Rim Flywheels: Spin Tests", SAMPE Quart. 10(3), 36-41 (Apr. 1979).
9. C.W. Bert, et al., "Research on the Dynamics of Band-Supported Flywheel Systems", Rept.SAND 78-7074, Sandia Laboratories (Feb. 1979).
UNO (IMMKCTIONM.uuuao - cram)
I W (CRC.-WOUNOOMPHiTE - CPOXYI
Fig. 1 Schematic Diagram of the Sandia Fly-wheel System, as Installed in the Sandia-Livermore Spin-Test Facility
Fig. 2 Plan View of One Quarter of the SandiaThick-Ring Flywheel (System A)
345

»• id1 io*ROTATIONAL SPEED A ,RPM
10"
£ °
5 -100
' (17.5 H->
tTAILE
C^OJS Ib-lK/in .
<-C#-0J5 «
•
•
ROTATIONAL SPEED fl. RPM
Fig. 3 Free-Whirling Performance of SystemA. Mode identification: The number denotesthe mode number and the suffix denotes thebranch (F forward, R -v, retrograde). The H 4 Effects of External Viscous Damping Co-circles denote first- and second-order for- e f f i c i e nts Cd on the Stability Boundary for theward critical speeds and the squares first- Onset of I n s ? a b i l i t yand second-order retrograde critical speeds
«; 0020
MAX. ALLOWANCE
C.-O2S Ib-uc/ln*C3» N-itiMtr> 0021 in (0.071 cm]
5,000 7,000 * 36,000 as.000 40,000
•OTATIONAL SPEED ft, HPM
Fig. 5 Hub Translational Amplitude Response F19- 6 ^stor ing Moment About the y-Axis atto a Combination of Rim Eccentricity and 20,000 rpm as a Function of Out-of-Plane Tot ingIn i t ia l T i l t about the y-Axis and In-Plane Displacement along
the x-Axis
346

Project Title:
Principal Investigator:
Organization:
Project Goals:
Project Status:
Contract Number:
Contract Period:
Funding Level:
Funding Source:
PROJECT SUMMARY
Mechanical Energy Storage Technology Development
R. 0. Woods
Sandia LaboratoriesAlbuquerque, NM 87185(505) 264-7553
The selection of those mechanical components of flywheel energystorage systems that can be carried to their next stage ofevolution by efforts within the scope of the budget; the fundingof developmental work treating such components. The documen-tation of the state-of-the-art in component technology wheresuch information is scattered or fragmentary.
Efforts have treated the following components:
Rolling Contact BearingsMagnetic Bearings - Active and PassiveComposite Wheels - Hardware development, development of analytic
and testing techniques, material studies.
Composite Materials - Analysis, improved properties, vacuumoutgassing properties, fabrication andthermal characteristics.
Seals - Power dissipation, lifetimes, permeation rates.
Funding has been provided to other agencies for the testing ofenergy storage systems, and the groundwork has been completed fora program to deal with the problems of vacuum technology.
SOL 78
FY79
$980 K*
DOE, Division of Energy Storage Systems
Included in this project are the following:"Rotor Analysis," Keith Miller."Flywheel Rotor Analysis," Arlo Nord.
347

RECENT SPIN TESTS OF TWO COMPOSITEWAGON WHEEL FLYWHEELS
A. Keith MillerApplied Mechanics Division 5522
Sandia Laboratories^Albuquerque, New Mexico 87185
ABSTRACT
This paper briefly discusses some observations made of spin testsperformed on two variations of the Sandia "wagon wheel" flywheel. In onedesign, the graphite/epoxy rim was attached to the aluminum hub withtwenty-four thin Kevlar-49/epoxy spokes, while in the other design eightthicker graphite/epoxy spokes connected the rim to the hub. The testobjective was to compare the dynamic behavior of the two structurallydissimilar flywheels. The tests were limited to speeds less than 22,000RPM and only moderate torques were applied during the acceleration phaseof the tests in an attempt to detect speeds for previously predicted modesof vibration of the flywheel-spin-turbine system. Using proximity sen-sors, horizontal disturbances of the flywheel hub were detected for speedsless than approximately 6,000 RPM. These disturbances are believed to beassociated with predicted modes of vibration for the flywheel-spin-turbinesystem. No modes of vibration were sensed for the predicted possiblewhirl and torsional resonances in the speed range between 6,000 RPM and22,000 RPM. A squeeze film damper assembly which was attached to theflywheel spindle shaft is believed to have sufficiently dampened possiblewhirl modes so that they were undetectable in the speed range tested.The tests indicated that the squeeze film damper assembly successfullystabilized the flywheel-spin-turbine system when the damper functionedproperly; however, low frequency retrograde instabilities were inducedinto the system by the damper assembly when it was not operated withinprescribed parameters.
* This work was sponsored by the U.S. Department of Energy (DOE), underContract AT(29-l)-789.
+ A U.S. DOE facility.
348

INTRODUCTION
Results from a previous series of spin tests reported at the 1978Mechanical and Magnetic Energy Storage Contractor's Information ExchangeConference prompted further study into the dynamic response of the "wagonwheel" design [1]. The purpose of these previous tests was to demonstrablyspin the flywheels to the design speed. As reported in References 1 and2, one of the flywheels was actually spun to within six percent of itsdesign goal before failure of either the turbine spindle shaft, or theflywheel occurred. The cause of these failures was not conclusively deter-mined. As reported by Reedy [1], these test results indicated that abetter understanding of the dynamics of the rotors needed to be developed.
Basically two designs of a thick-rim rotor were spun in the testspreviously reported—the pin-wrapped design, and the wagon wheel design.Detailed descriptions of each of the designs can be found elsewhere [3,41.In general, the wagon wheel design seemed not to perform as well as thepin-wrapped. The wagon wheel design appeared to have a more severe vibra-tional response. As reported by Nord [5], the hub of the pin-wrappedflywheel is more compliant than the one for the wagon wheel design, whichmay be one reason why the pin-wrapped flywheel functioned somewhat better.Flaws in the rims of the wagon wheel flywheels were also detected whichmay have caused their poorer performance [1]. Additional tests of newwagon wheel flywheels were therefore needed.
During subsequent tests, attempts were made to detect speeds wheremodes of vibration were predicted, and to determine whether failures ofthe previous tests were caused by material failure within the rotors orby dynamic instabilities which forced the turbine spindle to break. Onewagon wheel flywheel of identical design to those previously tested wasfabricated by the Defense Division of the Brunswick Corporation. A varia-tion of design was incorporated into a second flywheel. Instead of havingtwenty-four thin Kevlar 49/epoxy spokes attaching the rim to the hub,eight graphite/epoxy spokes each three times thicker attached the rim tothe hub. This flywheel was also fabricated by the Brunswick Corporation.
BRIEF ANALYTICAL RESULTS
As an initial step in analyzing the dynamic response of the twovariations of the wagon wheel flywheel, finite element structural modelsof both flywheels were constructed. The normal modes of vibration pre-dicted by the structural models of only the flywheels (without the spinturbine) under unrestrained boundary conditions (free-free conditions)were compared to those obtained by experimental modal analysis techniques[5]. The models were refined until the predicted mode shapes and naturalfrequencies agreed with the experimentally determined ones.
Table 1 lists the modes and the corresponding frequencies obtainedfrom the experimental analysis and those predicted by the models. Vibra-tion modes were identified above 600 Hz but they are associated with rimflexures. These modes have been neglected in Table 1 since the resonantfrequencies change very little when the finite element models of the fly-wheels are attached to the model of the spin turbine. These frequenciesare also well above the operating speed of the flywheels. All of thepredicted frequencies shown in Table 1 are within fourteen percent ofthose measured for the twenty-four spoke flywheel, and within two percentfor the eight spoke flywheel.
349

Table 1. Experimentally Measured and Predicted Normal Modes of Vibration for Two Wagon Wheel Flywheels
ModeNumber
123
1234
Experimental
Natural Frequency(Hs>
101.77376.54629.19
109.55347.05412.23574.95
Modal Tests
Damping FactorPercent
0.781.002.45
2.161.221.590.79.
Mode Description
24-SPOKED FLYWHEEL
AxialTorsionalWhirl
8-SPOKED FLYWHEEL
AxialTorsionalFirst WhirlSecond whirl
Model Prediction
Natural Frequency(Hz)
86.8373.4635.3
108.5344.8407.4566.7
The experimentally verified mathematical models of the flywheelswere then attached to a finite element structural model of the Model 6100Barbour-Stockwell air turbine used in the spin tests. The normal modesof vibration of the flywheel-turbine (undampened) system were determinedneglecting the damper assembly in the system. The turbine damper assemblyis normally attached to the turbine spindle to provide stability to thesystem as it traverses through critical vibrational speeds. The firstnormal mode for the flywheel-turbine system, using the twenty-four spokedflywheel, is shown in Fig. 1 as an example of the analytical representationof the flywheel-turbine system.
Turbine ShaftRoller Bearings
Air TutbintLevitalion Air
Turbine Spindle
Flywheel
Fig. 1. First Lateral Bending Mode of Flywheel-Turbine Modal Frequency 6.15 Hz (369RPM)
350

Table 2 lists the normal modes and frequencies predicted from theflywheel-turbine model of the twenty-four spoked flywheel. Note thatonly one torsional mode is predicted for this system in the speed rangebetween approximately 4,000 and 32,000 RPM. Several vibration modesassociated with bending of the turbine spindle and axial motion of therim are predicted below 4,000 RPM however.
Table 2. Normal Vibrational Modes and Frequencies Predicted forthe Twenty-Pour-Spoked Flywheel-Turbine System Neglect-ing Squeeze-Film Damper Assembly
Mode Natural Frequency Mode DescriptionNumber (Hz)
1 6.15 First Lateral Bendingof the Turbine Spindle
2 8.08 Axial Motion of Flywheeland Turbine on AirSupport
3 44.08 Second Lateral Bendingof the Turbine Spindle
4 66.33 Axial Motion of theFlywheel Rim r.,
5 243.20 Combined Torsional Modeof Flywheel and Turbine-Spindle
6 637.00 Combined Third LateralBending of the TurbineSpindle and FirstFlywheel Whirl
351

Results of the flywheel-turbine system for the eight-spoked flywheelare not presented in detail here because the modes predicted below 20,000RPM are essentially the same as those shown in Table 1. One additionalmode which is associated with the first diametrical rotational mode ofthe hub (flywheel whirl) is predicted to be near 25,000 RPM for the eight-spoked flywheel mounted to the turbine.
The normal modes of vibration shown in Table 2 were predicted for astatic condition of the flywheel-turbine system; i.e., the system wasconsidered not to be rotating. An analysis of possible gyroscopicallyinduced whirl modes for a four-degree-of-freedom model of the twenty-fourspoked flywheel indicated that no whirl modes exist within the speed rangeof interest. This conclusion is the same as that reached by Bert, et al.,[6] for a similar four-degree-of-freedom model. However, a more complex,eight-degree-of-freedom model developed by Chen and Bert [7] indicates apossibility that several whirl modes may exist between 10,000 and 25,000RPM. There was no known way of assessing the strength of these possiblemodes however. It is possible such modes may be easily dampened to thepoint they become unobservable.
SPIN TEST DESCRIPTION
During the past year, two series of spin tests were performed at theSandia Laboratories Livermore facilities using a Model 6100 Barbcur-Stockwell six-inch diameter air turbine. Attempts were made to spin boththe twenty-four spoked and the eight spoked flywheels in the first seriesof tests. The maximum speed was limited to less than 20,000 RPM to ensurethat the flywheels would not be destroyed.
Horizontal displacements of the adaptor section attached to the topof the flywheel hub were monitored with two orthogonally placed proximitytransducers. The test plan was to limit the angular acceleration duringthe spin-up phase of the tests to a relatively low rate in an attempt toclearly identify speeds where there was disturbance of the horizontalposition of the hub which could be associated with critical natural fre-quencies of the system. Speeds of 10,000; 13,000; 15,000; 17,000; and20,000 RPM were to be maintained for approximately 60 seconds each duringthe spin-up portion of the tests in order to access the stability of theflywheels at those speeds. Upon completing the dwelling at 20,000 RPMthe flywheels would be allowed to coast down in speed with no reversingtorque applied. Critical speeds were expected to be more easily identi-fied by allowing the flywheels to drift through the speed range slowly.
Only the twenty-four spoked flywheel was spun during the second testseries. This second series of tests was essentially a repeat of thefirst, with only the oil feed rate to the squeeze-film damper assemblyincreased, and the flywheel rebalanced.
352

TEST RESULTS
Discussion of the test results will concentrate on the phenomenonobserved for the twenty-four-spoked flywheel because most of the testtime was devoted to this flywheel, and because most of the conclusionswere drawn from the information obtainedfrom this flywheel.
Several disturbances in the horizontal position of the hub of thetwenty-four spoked flywheel were noted below approximately 6,000 RPM.These disturbances were characterized by rapid increases and decreases inthe run-out (variation of the horizontal position) of the hub. Above6,000 RPM the pattern on the oscilloscope displaying the hub run-out sta-bilized into a toroidal shape. The diameter of the toroid (which is oneindication of horizontal run-out) increased proportionately to approxi-mately the square of the rotational speed. The rotation of the flywheelappeared to be stable at all of the constantly held speeds. However, theamount of horizontal run-out of the flywheel was believed to be approach-ing an operational limit at the 20,000 RPM mark. No sudden changes inthe behavior of the flywheel were noted during the spin-up portion of thetest for speeds above 6,000 RPM.
A very low frequency (approximately 3 Hz) retrograde whirl motiondeveloped as the twenty-four spoked flywheel drifted down in speed from20,000 RPM. The amplitude of this whirl increased approximately exponen-tially with time until the motion became so violent that the test had tobe stopped. Several attempts were maJe to allow the flywheel to driftdown in speed, all resulting in the development of the same, nearly clas-sical, instability.
The horizontal run-out of the hub of the eight-spoked flywheelappeared to be considerably greater at all speeds than observed for thetwenty-four-spoked flywheel. A somewhat similar pattern of behavior wasnoted. Rapid fluctuations in run-out occurred below 6,000 RPM, and morebenign motion was noted above that speed. The development of the retro-grade whirling instability appeared to be much more serious for thisflywheel. The instability would develop when repeated attempts were madeto dwell at 15,000 RPM, which forced termination of further testing ofthis flywheel.
Investigation into the possible cause of the low frequency retrogradewhirl of the flywheels during this first series of tests revealed that theoil pressure in the squeeze-film damper assembly was below normally pres-cribed conditions. An obstruction in the hose which supplies the feed oilto the damper assembly was removed, the oil pressure was increased, and asecond series of tests using only the twenty-four spoked flywheel wasperformed.
The follow-on test plan was identical to that used during the firstseries of spin tests. Rapid changes in the run-out were again observedbelow approximately 6,000 RPM. The oscilloscope display of the run-outwas not a perfect toroid above 6,000 RPM, as it had been during the firstseries of tests, as it was distorted into a much more narrow three-pointcrown shape. However, the amount of hub run-out did not increase withspeed as had been observed during the first series of tests. The flywheelhad been rebalanced dynamically prior to the second series of tests which
353

leads one to conclude that the increase in run-out during the first seriesof tests may have been the result of a slight unbalance.
The flywheel was completely stable at all speeds tested. The insta-bility as the flywheel drifted down in speed from 20,000 RPM was no longerobserved. The speed was gradually increased in the final test of thisseries until a gradual increasing of the hub run-out was observed at22,000 RPM. The tests were terminated at that speed.
It is important to note that reversing torque had to be applied toslow the flywheel to a stop below the 6,000 RPM level. The relativelylarge horizontal displacements sustained at the various critical speedsbelow 6,000 RPM required that those speeds be traversed as rapidly aspossible.
DISCUSSION OF RESULTS
While the original test objectives were not achieved, several tenta-tive results have been drawn from the experience.
First, it was demonstrated that the wagon wheel flywheel design couldbe smoothly driven to 22,000 RPM (the highest speed at which this designfailed during the 1977-1978 test series) under proper balancing of theflywheel and under a rather narrow set of operating parameters of theparticular drive turbine used. The gradual increase in the run-out asthe system was spun to 22,000 RPM in the final series of tests may havebeen a result of yet a small amount of dynamic u..balance in the rotor.It was concluded that to fully ascertain that possibility, the balance ofthe flywheel would need to be checked before higher speeds were attempted.
Related to the possible balancing problem, it was found from thisexperience that instrumentation which could simultaneously monitor thecenter of the flywheel with respect to the spin axis (the run-out), andthe angular position of the flywheel with respect to a fixed referenceframe may be needed to better separate dynamic effects caused by unbalancefrom those associated with possible vibrational frequencies. Gunter 18]has pointed out that, theoretically, the location of possible unbalancein a thin rotor can be obtained from monitoring these two measurements asthe system is spun through its first few critical speeds. By also moni-toring the planar tilt and knowing its relationship to the angular orien-tation of a flywheel, it may prove that dynamic unbalance of thick rotorsalso may be detectable at higher speeds (speeds greater than 5,000 RPM).
A final result found from these spin tests is that a squeeze-filmdamper assembly attached to the turbine spindle successfully stabilizesthe flywheel-turbine system at higher speeds. Theoretical development ofthe hydrodynamic forces within squeeze film dampers [9, 10, 11, 12] indi-cates that although dynamic instabilities can result from the use ofsqueeze-film dampers, such devices should be very effective in dampingpossible whirl modes induced by either coulomb damping, hysteresis dampingin the turbine spindle, or gyroscopic effects. The effectiveness of thesesqueeze-film damper assemblies in damping whirl modes appears to be ratherstrongly dependent on maintaining the oil pressure within reasonable oper-ating parameters [12], a fact apparently confirmed by these tests.
It is suggested that further investigation be made into the stabili-zation of pendulously supported flywheel spin tests using squeeze filmdamper assemblies.
354
REFERENCES
1. E. D. Reedy, Jr., "Sandia Composite-Rim Flywheel Development," Pro-ceedings of the First Annual Mechanical and Magnetic Energy StorageContractors' Information-Exchange Conference, Luray, Virginia,October 24-26, 1978, pp. 87-91.
2. E. D. Reedy, Jr. and H. K. Street, "Composite-Rim Flywheels: SpinTests," to be published.
3. E. D. Reedy, Jr. and F. P. Gerstle, Jr., "Design of Spoked-Rim Com-posite Flywheels," Preceedings of the 1977 Flywheel TechnologySymposium, San Francisco, California, October 5-7, 1977, pp. 99-110.
4. E. D. Reedy, Jr., "A Composite-Rim Flywheel Design," SAMPE Quarterly,Vol. 9, No. 3, pp. 1-6.
5. A. R. Nord, "Experimentally Determined Modes From Three CompositeFlywheels," 1979 Mechanical and Magnetic Energy Storage Contractors'Review, August 19-22, 1979, Washington, D.C.
6. C. W. Bert, T. L. C. Chen, and C. A. Kocay, "Critical Speeds andNatural Frequencies of Rim-Type Composite-Material Flywheels," SandiaLaboratories Technical Report, SAND78-7049, January 1979.
7. T. L. C. Chen and C. W. Bert, "Whirling Response and Stabilityof Flexibly Mounted, Ring-Type Flywheel Systems," Sandia LaboratoriesTechnical Report, SAND78-7073, February 1979.
8. Gunter, E. J., "Dynamic Stability of Rotor-Bearing Systems," NASHSP-113, Office of Technical Utilization, U.S. Government PrintingOffice, Washington, D.C., 1966.
9. John M. Vance, and Alan J. Kirton, "Experimental Measurement of theDynamic Force Response of a Squeeze-Film Bearing Damper," Journal ofEngineering for Industry, November 1975, pp. 1282-1290.
10. D. H. Hibner, R. G. Kirk, and D. F. Buono, "Analytical and Experi-mental Investigation of the Stability of Intershaft Squeeze FilmDampers, Part I: Demonstration of Instability," Journal of Engineer-ing for Power, January 1977, pp. 47-52.
11. P. N. Bansal and D. H. Hibner, "Experimental and Analytical Investi-gation of Squeeze Film Bearing Damper Forces Induced by Offset Cir-cular Whirl Orbits," Journal of Mechanical Design, Vol. 100, July1978, pp. 549-557.
12. E. Feder, P. N. Bansal, and A. Blanco, "Investigation of SqueezeFilm Damper Forces Produced by Circular Centered Orbits," Journal ofEngineering for Power, Vol. 100, January 1978, pp. 15-21.
355

rProject Title:
Principal Investigator:
Organization:
Project Goals:
Project Status:
Contract Number:
Contract Period:
Funding Level:
Funding Source:
PROJECT SUMMARY
"Modal Determination - Composite Flywheels"
A.R. Nord
Sandia LaboratoriesOrganization 1542Albuquerque, NM 87185
To provide experimental verification of the modal changes predictedby both classical and numerical analyses.
The testing program is complete. Data have been furnished to theengineers who are performing the theoretical analyses.
Does not apply.
FY79
$15K
U.S. Department of Energy, Division of Energy Storage Systems
357

EXPERIMENTALLY DETERMINED MODES OF THREE COMPOSITES FLYWHEELS*
A.R. NordSandia Laboratories
Vibration and Modal Testing DivisionDivision 1542
Albuquerque, NM 87185
ABSTRACT
Three composite flywheels were analyzed by the Vibration and Modal Testing Division ofSandia Laboratories. Modal analysis techniques were used to experimentally determine the modalfrequencies, damping, and complex mode shapes of the flywheels in a frequency range correspond-ing to the purposed operating speed range of the wheels. The wheels were suspended from softsupports during testing so the modes characterize the structures for an unrestrained boundary.Since the complex mode shapes for each modal frequency are best appreciated when viewed on adynamic display, a special videotape has been prepared to show the first mode shapes of thethree flywheel configurations. This paper serves as an introduction to and a summary of thevideotape and is not intended to be a complete description of the modal analysis work done onthe flywheels.
TEST PROCEDURE
The three flywheel configurations were instrumented, in a similar manner. The three photo-graphs show the location of accelerometers on the aluminum cubes every 90° around the top andbottom of the hub and around the rim. The 12- and 4-spoked wagon wheel design had accelerom-eters at the center of the rim only, but the pinwrapped model was instrumented with measure-ment points both at the top and bottom of the rim. Each measurement point was monitored in theaxial, radial, and tangential directions. The flywheels were suspended from soft rubber tubesattached to the hub and the structure was excited by tangential impacts to an aluminum blockalso secured to the hub.
In Figure 1 ("12-Spoked Flywheel"), an example of a 3-axis mounting block for accelerom-eters can be seen at station "4." Only the pickoff for tangential acceleration is showninstalled. The same is true of Figure 2 ("Pinwrapped Flywheel"). In this case, threetangential-motion sensors are shown at the top of the hub and a number of bare blocks can beseen on the rim of the wheel. Figure 3 ("Four-Spoked Flywheel") shows, in addition to a wheel,the instrumented hammer that was used to shock the wheels. It will be noted that the hammerincorporates an accelerometer which is used to give a time-domain readout of the drivingfunction.
Frequency response functions (transfer functions) were measured by effectively takingthe ratio of accelerometer response to the input hammer force in the frequency domain. Themodal parameters were extracted from the measured frequency response functions by fitting ananalytical expression to the measured data by an iterative routine on the analyzer/computer.The analytical function used to fit the measured response function contains the three modalparameters; frequency, damping, and complex amplitude. After each analytical function has anacceptable fit to the corresponding measured response function, the computer can display thestructure at each mode and show the relative motion of each measured point.
*This work supported by the U.S. Department of Energy, DOE.
358

MODAL RESULTS
The accompanying videotape shows the modes of each of the three flywheel configurationsthat were found near and below 600 Hz. The film discusses the similarity and the differencesof the modes and relates them to the flywheel's structure. The table below is a summary ofthese first modes on the three flywheels.
Mode
Axial
Torsional
Rim Twist with HubDeformation
1st Hub Rotation
2nd Hub Rotation
12-SpokedModel
102 Hz
376 Hz
629 Hz
4-SpokedModel
109 Hz
31*7 Hz
1+12 Hz
575 Hz
PinwrappedModel
70 Hz
153 Hz
299 Hz
1*86 Hz
que.The videotape shown at the conference will be archived at Sandia Laboratories, Albuquer-Arrangements for borrowing it can be made with the author of this paper.
The summary shows the simple axial and torsional stiffness of the two wagon wheel designsare very close, but the pinwrapped model is much softer. The 12-spoked model has one hubrotational mode above 600 Hz which should place this mode above the operating speed range.The 4-spoked flywheel*has two hub rotational modes below 600 Hz possibly well within theoperation range. The pinwrapped wheel has a rim twisting mode with some hub deformation wellin the operating range. This softer system with a much more flexible hub brings a mode intothis lower frequency range that was not observed in the other two wheels. The pinwrappedwheel's hub rotational mode is similar to but lower than the 12-spoked model.
359

Fig. 1. 12-Spoked Flywheel
Fig. 2. Pinwrapped Flywheel1.^
360

Fig. 3. Four-Spoked Fiywhee
361
Project T i t le :
Principal Investigator:
Organization:
Project Goals:
Project Status:
Contract Number:
Contract Period:
Funding Level:
Funding Source:
PROJECT SUMMARY
LLL Materials Program f o r Fiber-Composite Flywheels
J. A. Rinde and Ed Wu
Lawrence Livermore LaboratoryUniversity of CaliforniaLivermore, California 94550(415)422-7077, FTS 532-7077
The goals of this project are threefold: (1) to accelerate the wide-spread use of the fiber-composite flywheel by developing the necessaryengineering-design data on fiber composites, (2) to demonstrate thehigh-energy kinetics attainable with fiber-composite materials, and(3) to transfer the technology thus gained to the private sector.
During FY'79 the LLL materials program for fiber-composite flywheelshas worked in the areas of matrix resins, stress rupture, staticengineering properties, and fatigue or time-dependent engineeringproperties. We have tested the physical and mechanical properties ofa low-cost matrix-resin system suitable for service up to 150°C.Also, we have obtained results from stress-rupture tests on E-glassat load levels of interest to flywheel designers. Lifetimes at theselevels are longer than those of S-glass in previous tests. We havealso measured static engineering properties on a Kevlar-49/rubberized-epoxy* composite at 25 and 75°C. Properties did not decrease withinthis temperature range. Creep and fatigue tests have been performedover a wide range of stress levels. Both input loads and material-response strains were measured and used to correlate times to fa i lureunder creep and fatigue loading histories. Further development mayprovide a basis for predicting composite-flywheel structural l i f efrom laboratory tests.
W-7405-ENG-48
FY'79
$31 OK
U.S. Department of Energy, Division of Energy Storage
Reference to a company or product name does not imply approval or recommendation of theproduct by the University of California or the U.S. Department of Energy to the exclusion ofothers that may be suitable.
363

LLL MATERIALS PROGRAM FOR FIBER-COMPOSITE FLYWHEELS*
J. A. Rinde and Ed WuLawrence Livermore Laboratory, University of California
Livermore, California 94550
ABSTRACT
During FY'79 the LLL materials program for fiber-composite flywheels has worked in theareas of matrix resins, stress rupture, static engineering properties, and fatigue, or t ine-dependent engineering properties. Results are reported for physical and mechanical tests of alow-cost matrix-resin system suitable for service up to 150°C. Results of stress-rupturetests on E-glass at load levels of interest to flywheel designers are reported for the f i r s ttime. Lifetimes at these levels are longer than those of S-glass in previous tests. Staticengineering properties on a Kevlar-49/rubberized-epoxy composite are reported for tests at 25and 75°C. Properties did not decrease within this temperature range. Creep and fatiguetests were performed over a wide range of stress levels. Both input loads and material-response strains were measured and used to correlate times to fai lure under creep and fatigueloading histories. Further development may provide a basis for predicting composite-flywheelstructural l i f e from laboratory tests.
INTRODUCTION
The LLL materials program for fiber-composite flywheels was begun in 1975 to providerel iable engineering-design data on composite materials specif ical ly intended for flywheels.The two main c r i t e r i a for material selection for this program are high performance andreasonable cost.
Since 1975, in this program we have:• Generated engineering design data for Kevlar 49, S2-glass, and E-glass composites.• Spin tested thin-rim flywheel rotors of Kevlar- and glass-fiber composites and
correlated the results with the f ibers ' stat ic strength properties.• Developed and engineered a new fiber-composite flywheel design—a quasi-isotropic,
laminated, solid-disk rotor with a tapered pro f i le .t Characterized f lex ib le and rubberized matrix resins.• Investigated the transverse tensile properties as a function of matrix-resin modulus
for a series of S2-glass composites.• Conducted stress-rupture tests on Kevlar 49 and E-glass composites.
During the past year, we concentrated our efforts specif ical ly on new matrix resins,stress rupture of E-glass composites, engineering properties of a composite made with arubberized resin, and composite l i fetime under fat igue.
FORMULATION OF A LOW-COST MATRIX RESIN FOR HIGH-TEMPERATURE SERVICE**
Because commercial flywheels must be of low or moderate cost, we have begun characterizinga low-cost cycloaliphatic epoxy resin cured with a l iquid anhydride. This system has goodprocessing properties and high-temperature performance, but w i l l require more care during thefilament-winding process to achieve optimum properties. Cost of the resin system is $1.15/lb($2.50/kg).
The cycloaliphatic epoxy resin used in this formulation offers the advantages of lowviscosity, low cost, and high glass-transition temperature when properly cured. Becausecycloaliphatic epoxy resin cannot be cured with amines, they are generally cured withanhydrides. The particular anhydride we chose to use offers the advantages of being a l iquidat room temperature, being inexpensive, and providing good high-temperature performance. In
*This work was performed under the auspices of the U.S. Department of Energy by LawrenceLivermore Laboratory under contract No. W-7405-Eng-48.**Principal investigator: J. A. Rinde.
364

addition to the epoxy resin and anhydride, we have added a small amount of a l iquid rubber tothe formulation to decrease bri t t leness, but not enough to lower the glass-transitiontemperature signi f icant ly. The catalyst used is an imidazole that allows curing at re lat ivelylow temperatures and yet achieves high glass-transition temperatures. Table 1 presents theresin-system components and the amounts of each used.
TABLE 1. Components of Matrix Resin System Formulatedfor High-Temperature Service
Component Parts by weight
Cycloaliphatic epoxy resins; CY—1790
100O 0C-O-CH 2 Q O
Liquid anhydride curing agent
100
CH3
Flexibilizer; CTBN rubber
HOOC — J - (CH2 - CH = CH - CH2)X — <CH2 - CH)y K COOH
Cl\l
Catalyst; 2 ethyl 4 methyl Imidazole
N
NICH3
The propert ies of the uncured resin are very good fo r f i lament-winding. The res in systemhas both a low v iscos i ty and long gel t ime. The i n i t i a l v i scos i t y is only 0.38 Pa«s, and t h i sincreases to 0.72 Pa«s af ter 8 h at 25°C. Gel time at 2S°C is J6.6 h. ^ f c l l a t i o n of theres in can be accomplished in 2 h at 90°C, and f u l l cure can ba accomplished in 4 h at 150°C.Lower-temperature cures of t h i s mater ial are possible i f the cure time or the cata lystconcentration is increased. We have obtained good cures in 3 h at 120°C or 24 h at 100°C.
I t is well known that water af fects the cure of anhydride-cured epoxy resins by react ingwith the anhydride to form a d iac id . The diac id w i l l react with epoxy groups but with afunc t i ona l i t y of one, whereas the anhydride f u n c t i o n a l i t y is two. The overa l l resu l t ofmoisture is to reduce the cross- l ink density of the cured epoxy and therefore the glass-t rans i t i on temperature. Because of t h i s moisture s e n s i t i v i t y , more care must be taken in anymanufacturing processes involv ing these resins to reduce moisture pick-up. To measure theef fec t of moisture on the propert ies of the cured res in , we added l i qu i d water to the res insystem during mixing and cast resin sheets in the normal fashion. Figure 1 shows the ef fectsof adding 1.0 and 2.3% water to a anhydride-cur9d resin system. In th i s case, theg lass- t rans i t ion temperature is reduced by 20 to 25°C fo r each 1% water added. Also shown bythe f igu re is the decrease i n cross- l ink density wi th increasing water content. In the rubberyregion above Tg = +40°C the cross- l ink density is proport ional to the shear modulus.
365

rThe tensile properties of this resin system are presented in Table 2 for temperatures from
25 to 150°C. These preliminary data show that the modulus decreases by a factor of two andthe strength by a factor of 2.4 over this temperature range. He are performing tests to obtainmore precise values for the tensile properties on 150°C aged and unaged specimens.
TABLE 2. Tensile Properties of Matrix Resin System ofCY 179/CTBN/MTHPA/1MI (100/5/100/1)Cured 2 h at 90°C plus 4 h at 150°C
Temperature,°C
25100125150
Modulus,GPa
2.92.12.01.5
Maximumstress,MPa
70564229
Maximumstrain,
%
3.15.23.53.4
He have measured dynamic shear modulus-150 to 25O°C. These measurements confirmedextended the temperature range over which weapproximately constant, decreasing by about150°C. This temperature range is the regionof these shear measurements are presented intemperature for this resin cured at 150°C ismodulus peak in the temperature range from -brittle than amine-cured epoxy resins.
on the cured resin in the temperature range fromthe trends of the above tensile results andobserved these trends. The shear modulus isa factor of two as temperature went from -50 toof most interest to flywheel designers. ResultsFig. 2. He see that the glass-transitionabove 200°C. The moderate size of the loss
110° to -50°C shows that this resin is more
8 -
I 7o
c6 -
3
% water_ O
1.02.3
I—-^r-
"g, 4-
185160137
I i
1
\2.3
V1
11 0
\
1
1
Mb water
^ ,
1 i
50 100 150 200
Tempsrature — °C
250
Fig. 1. Effect of Hater Content on the DynamicShear Inodulus and Glass-Transition Temperaturefor an Ambydride-Cured Epoxy Resin
£I
= 9
Io /
i.I
I I I [Storage modulus
~_.—..^Loss modulus
Tan Delta
-150
—
—
\-
2.8
2.4
2.0S
1.6 ^c
1.2 ,-
0.80.4
-100 -50 0 50 100 150 200 250
Temperature — °C
Fig. 2. Dynamic Shear Moduli of CY 179/CTBN/MTHPA/1MI AT 1 Hz
ENGINEERING PROPERTIES OF KEVU'K 49/EPOXY COMPOSITES*
In a continuing e f fo r t to develop a data base for engineering design, we havecharacterized thermomechanical properties of Kevlar-49/epoxy composites. I n i t i a l l y , the epoxysystem chosen was XD7575.03/XD7114/Tonox 60-40 (called epoxy A). However, because XD7575.03became no longer commercially available, we later substituted an equivalent system, DER332/Kelpoxy G293/Heloxy 68/Tonox 60-40 (called epoxy B).
Principal investigator: H. T. Hahn.
366

200
150
100
50
0
-
-
I IMatrix
I I
• XD7575.03/XD7114/Tonox 60-40• DER332/T403 / " "AXD7818/T403 /
I I
•AIf Transverse
M—•m—vm ~
Longitudinal
2.5
2.0
X
1 1 - 5
1.0
0.5 -
-50 0 50 100Temperature — "C
150
• Ref.4A Ref. 5
Transverse strength =30MPa
Fig. 3. Effect of Epoxy Type on Thermal-Expansion Coefficients for Kevlar 49Composites
0 50 100Matrix strength - MPa
Fig. 4. Insensi t iv i ty of TransverseStrength to Matrix Strength for FiberComposites
Mechanical properties of Kevlar 49/epoxy A were reported at the 1978 Annual Review. Q)Since then we have determined i t s thermal properties. Figure 3 shows the effect that the typeof epoxy has on the thermal-expansion coefficients of the composite. Because the other twoepoxy systems shown in the f igure have lower glass-transit ion temperatures (~87°C for DER 332/T403 and ~76°C for XD7818/T40312)) than epoxy A (~104°c(3)), the rapid increase in thetransverse thermal-expansion coeff icient occurs at a higher temperature for epoxy A. Up to50°C, however, the transverse thermal expansion is f a i r l y independent of epoxy type. Thelongitudinal thermal expansion is very independent of epoxy type throughout the temperaturerange studied.
We determined some of the mechanical properties of Kevlar 49/epoxy B both at roomtemperature and at 75°C, which is the operating temperature expected in flywheels. Thepreliminary data (Table 3) indicate very good retention of mechanical properties.at 75°C.Additional tests are in progress.
To delineate the effect of matrix properties on matrix-controlled composite strength, wec r i t i c a l l y examined the data available in the l i terature.(4.5) Because we report the detailsin reference (6) , we here only summarize our conclusions:
• The transverse and shear strengths are rather insensitive to the matrix strength.(Figure 4 shows the transverse-strength behavior.) Thus, fa i lu re strain can be increased byusing a f lex ib le resin with l i t t l e sacri f ice of fa i lure stress.
• Whereas the elast ic analysis predicts the composite-to-matrix strength rat io to beless than unity and to increase with the matrix strength and the f iber content for thecomposites studied, the experimental data show the opposite trend (Fig. 4) . Thus, the elast icanalysis alone is not suff ic ient to model the composite. However, th is experimentalobservation can be explained by a model based on the average constituent stresses i f the matrixduc t i l i t y is assumed to increase with lower strength.
367
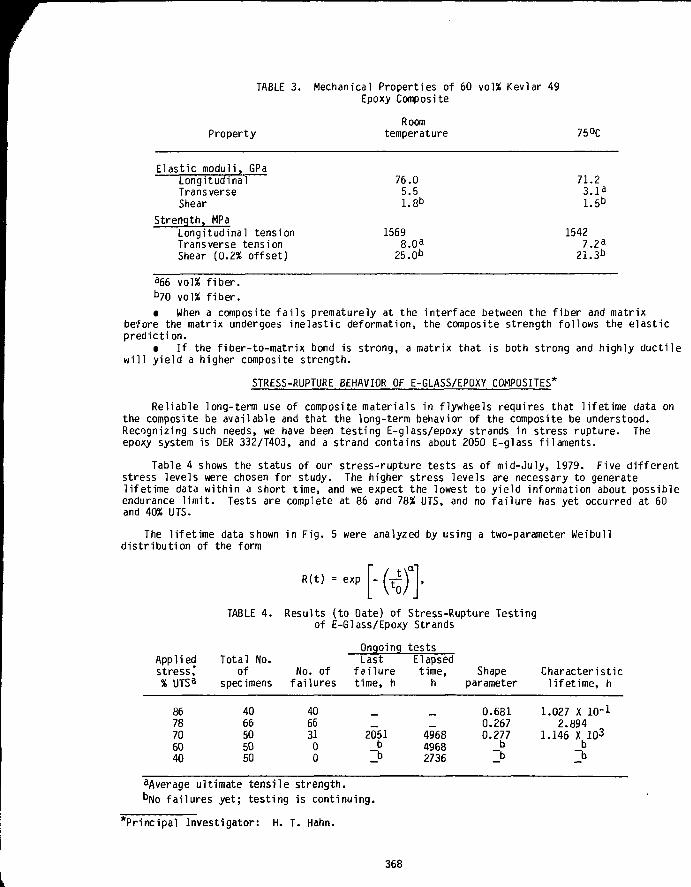
Property
TABLE 3. Mechanical Properties of 60 vol% Kevlar 49Epoxy Composite
Roomtemperature 75 °C
Elastic moduli, GPaLongitudinalTransverseShear
Strength, MPaLongitudinal tensionTransverse tensionShear (0.2% offset)
76.05.51.8b
15698.0a
25.0b
71.2
15427.2a
21.3b
^66 vol% f ibe r .b70 volX f i be r .• When a composite f a i l s prematurely at the interface between the f iber and matrix
before the matrix undergoes inelast ic deformation, the composite strength follows the e last icpredict ion.
• I f the f iber- to-matr ix bond is strong, a matrix that is both strong and highly duct i lew i l l y ie ld a higher composite strength.
STRESS-RUPTURE BEHAVIOR OF E-GLASS/EPOXY COMPOSITES*
Reliable long-term use of composite materials in flywheels requires that l i fe t ime data onthe composite be available and that the long-term behavior of the composite be understood.Recognizing such needs, we have been test ing E-glass/epoxy strands in stress rupture. Theepoxy system is DER 332/T403, and a strand contains about 2050 E-glass fi laments.
Table 4 shows the status of our stress-rupture tests as of mid-July, 1979. Five d i f ferentstress levels were chosen for study. The higher stress levels are necessary to generatel i fe t ime data within a short time, and we expect the lowest to y ie ld information about possibleendurance l im i t . Tests are complete at 86 and 78% UTS, and no fa i lu re has yet occurred at 60and 4056 UTS.
The l i fet ime data shown in Fig. 5 were analyzed by using a two-parameter Weibulld is t r ibut ion of the form
R(t) = exp \- ^
TABLE 4. Results (to Date) of Stress-Rupture Testingof E-Glass/Epoxy Strands
Appliedstress,'% UTSa
8678706040
Total No.of
specimens
4066505050
aAverage ultimate tensi lebNo fa i lures yet ; test ing
No. offailures
406631
00
OngoingLast
fai luretime, h
2051b
~b
strength,is continuing.
testsElapsedtime,
h
496849682736
Shapeparameter
0.6810.2670.277
b_b
Characteristicl i f e t ime , h
1.027 X 10⁻¹
2.8941.146 X 103
b~b
Principal Investigator: H. T. Hahn.
368

oa?I
90
80
70
60
40
30
o o o oooo
S-glass/epoxy l imi ts
E-glass/epoxy
o Results o f comple ted testso— Last fa i lure, tests are con t inu ing• — N o fai lures ye t , tests are con t inu ing
, , ,| , , , | , , , |
10,-2 101-1 10
Lifetime - h
10z 103 10" 10s
Fig. 5. Comparison of Lifetime Oata for Composite Strands, where the CurvesRepresent 1% (Left) and 99% (Right) of Failures
where R(t) is the probability of l i fetime greater than or equal to t . The shape parameter aand the characteristic l i fetime tg were determined by the method of maximum likelihood ateach stress level, and the results are given in Table 4. For comparison. Fig. 5 also shows thel-to-99% fai lure bands of S-glass/epoxy and Kevlar 49/epoxy strands.V-9) The stress-rupturebehavior of E-glass/epoxy at the stress levels studied differs from those of the other materialsin that the shape parameters are much smaller than unity, indicating a fai lure rate thatdecreases with time and large scatter.
The decreasing fai lure rate can be explained by the following fai lure process. Crackscreated by fracture of weak fibers can grow either normal or parallel to the f ibers. I n i t i a l l y ,these cracks are more l ikely to grow normal to the f ibers, leading to a catastrophic fa i lure.In such cases, the fa i lure rate is high. After the i n i t i a l period of possible normal-crackpropagation, the cracks tend to grow parallel to the f ibers, thereby relieving stressconcentrations on the neighboring f ibers. Thus the fa i lure rate of specimens that survive tothis period is lower because the ultimate fai lure is a result of stress rupture of fiberswithout stress concentrations. Over the entire l i f e span, therefore, the fa i lure rate decreaseswith time.
Once an E-glass/epoxy strand survives the i n i t i a l period of high fai lure rate, i toutperforms S-glass/epoxy at the same fraction of UTS (Fig. 5). Two factors seeir, to beresponsible for such behavior i;i our testing. F i rst , the E-g1ass/epo>-y strands used were muchlarger than the S-glass/epoxy strands, i .e . , ~2050 filaments versu? --200 filaments. Second,the test environment for the E-glass/epoxy was controlled better than for the S-glass/epoxy;the maximum relative humidity during testing was only 20% for the E-glass/epoxy but was abouttwice as high for the S-glass/epoxy. The larger size and lower humidity allow much lessmoisture concentration at the fiber/matrix interface of the E-glass/epoxy strands. Therefore,the E-glass/epxoy wi l l outlive the S-glass/epoxy because water accelerates crack growth inglass through stress-corrosion. This conclusion is borne out by the excellent stress-ruptureresistance of the E-glass/epoxy strands at 60% UTS.
Our study of stress-rupture behavior thus far indicates that the long-term lifetime ofE-glass/epoxy at low stresses in a controlled environment can be much larger than expected fromshort-term lifetimes at high stresses. Because a flywheel is run in a vacuum, the problem ofstress-corrosion does not exist in service. I t seems possible that E-glass/epoxy can be usedmore effectively in vacuum than in a moist environment.
369
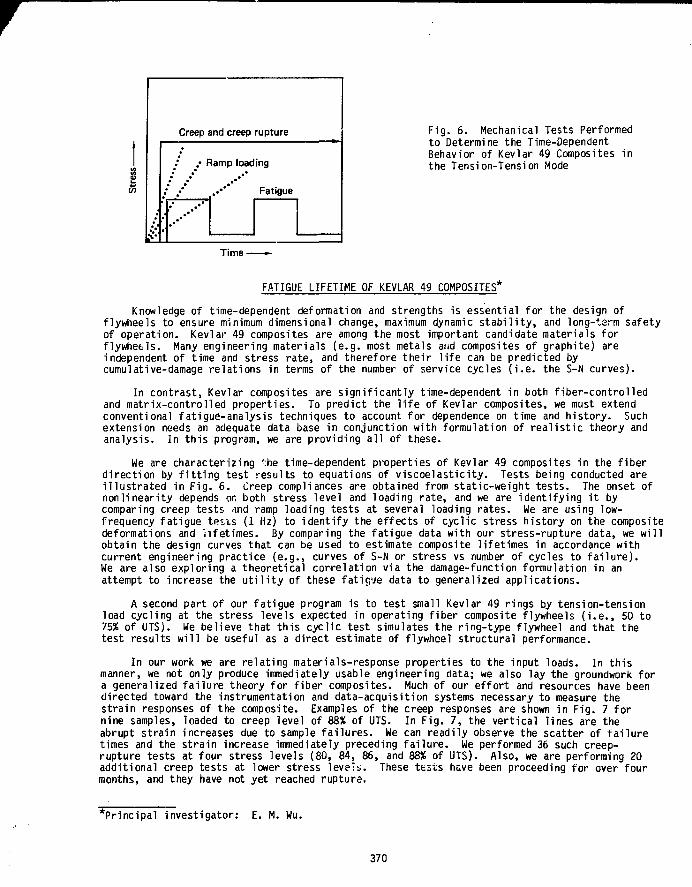
Creep and creep rupture
.• Ramp loading
/ // / m,'m' Fatigue
Fig. 6. Mechanical Tests Performedto Determine the Time-DependentBehavior of Kevlar 49 Composites inthe Tension-Tension Mode
Time-
FATIGUE LIFETIME OF KEVLAR 49 COMPOSITES
Knowledge of time-dependent deformation and strengths is essential for the design offlywheels to ensure minimum dimensional change, maximum dynamic s tab i l i t y , and long-t.£rm safetyof operation. Kevlar 49 composites are among the most important candidate materials forflywheels. Many engineering materials (e.g. most metals and composites of graphite) areindependent of time and stress rate, and therefore their l i f e can be predicted bycumulative-damage relations in terms of the number of service cycles ( i . e . the S-N curves).
In contrast, Kevlar composites are signif icantly time-dependent in both fiber-controlledand matrix-controlled properties. To predict the l i f e of Kevlar composites, we must extendconventional fatigue-analysis techniques to account for dependence on time and history. Suchextension needs an adequate data base in conjunction with formulation of real is t ic theory andanalysis. In this program, we are providing a l l of these.
We are characterizing the time-dependent properties of Kevlar 49 composites in the fiberdirection by f i t t i n g test results to equations of viscoelasticity. Tests being conducted arei l lustrated in Fig. 6. Creep compliances are obtained from static-weight tests. The onset ofnonlinearity depends on both stress level and loading rate, and we are identifying i t bycomparing creep tests and ramp loading tests at several loading rates. We are using low-frequency fatigue tests (1 Hz) to identify the effects of cyclic stress history on the compositedeformations and 'lifetimes. By comparing the fatigue data with our stress-rupture data, we wi l lobtain the design curves that can be used to estimate composite lifetimes in accordance withcurrent engineering practice (e.g., curves of S-N or stress vs number of cycles to fa i lu re) .We are also exploring a theoretical correlation via the damage-function formulation in anattempt to increase the u t i l i t y of these fatigue data to generalized applications.
A second part of our fatigue program is to test small Kevlar 49 rings by tension-tensionload cycling at the stress levels expected in operating fiber composite flywheels ( i . e . , 50 to75% of UTS). We believe that this cyclic test simulates the ring-type flywheel and that thetest results w i l l be useful as a direct estimate of flywheel structural performance.
In our work we are relating materials-response properties to the input loads. In thismanner, we not only produce immediately usable engineering data; we also lay the groundwork fora generalized fa i lure theory for fiber composites. Much of our effort and resources have beendirected toward the instrumentation and data-acquisition systems necessary to measure thestrain responses of the composite. Examples of the creep responses are shown in Fig. 7 fornine samples, loaded to creep level of 88% of UTS. In Fig. 7, the vertical lines are theabrupt strain increases due to sample fa i lures. We can readily observe the scatter of fa i luretimes and the strain increase immediately preceding fa i lure. We performed 36 such creep-rupture tests at four stress levels (80, 84, 86, and 88% of UTS). Also, we are performing 20additional creep tests at lower stress levels. These t ts ts have been proceeding for over fourmonths, and they have not yet reached rupture.
Principal investigator: E. M. Wu.
370
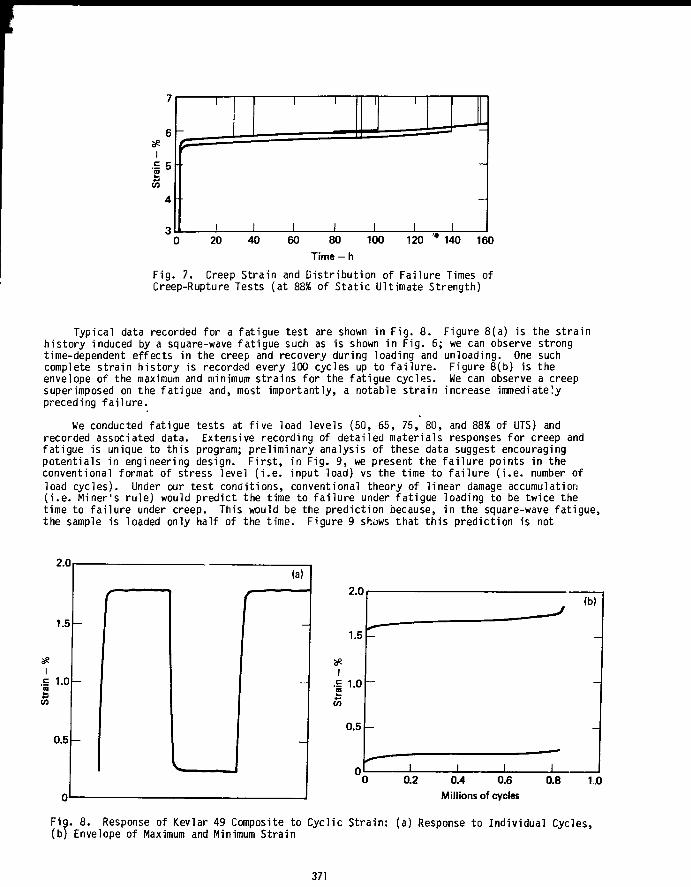
20 40 60 80 100 120 " 140 160
Fig. 7. Creep Strain and Distr ibut ion of Failure Times ofCreep-Rupture Tests (at 88% of Static Ultimate Strength)
Typical data recorded for a fatigue test are shown in Fig. 8. Figure 8(a) is the strainhistory induced by a square-wave fatigue such as is shown in Fig. 6; we can observe strongtime-dependent effects in the creep and recovery during loading and unloading. One suchcomplete strain history is recorded every 100 cycles up to f a i l u r e ,envelope of the maximum and minimum strains for the fatigue cycles.
Figure 8(b) is theHe can observe a creep
superimposed on the fatigue and, most importantly, a notable strain increase immediatelypreceding f a i l u re .
We conducted fatigue tests at f ive load levels (50, 65, 75, 80, and 88% of UTS) andrecorded associated data. Extensive recording of detailed materials responses for creep andfatigue is unique to this program; preliminary analysis of these data suggest encouragingpotentials in engineering design. F i r s t , in Fig. 9, we present the fa i l u re points in theconventional format of stress level ( i . e . input load) vs the time to fa i lu re ( i . e . number ofload cycles). Under our test conditions, conventional theory of l inear damage accumulation( i . e . Miner's rule) would predict the time to fa i lu re under fatigue loading to be twice thetime to fa i lu re under creep. This would be the prediction because, in the square-wave fat igue,the sample is loaded only half of the time. Figure 9 shows that th is prediction is not
1.5
Str
ain
- %
b
0.5
0
(a)
-
-
r
-
-
-
0.4 0.6Millions of cycles
0.8 10
Fig. 8. Response of Kevlar 49 Composite to Cyclic Strain: (a) Response to Individual Cycles,(b) Envelope of Maximum and Minimum Strain
371

0.0
vt
Z. 0.8o
I
I0.7 -
0.6
;
-
-
i
\ oo
\
i
o oID
\
\
•
q 1
o o c
~-
V"•• *\-1
r
Fatigue
1
Creep
-
-
10
Q.
I
1
L >?-*- '
•1
•
••
|
•
• •
1
o
1
c
O CCCC ^ ;
• Fatigueo Creep
0.1
0.1 10 102
Lifetime — h
104
10 102
Lifetime (tb) - h
103 104
Fig. 10. Cumulative Strain per Unit Stress, forboth Creep and Fatigue of Kevlar 49 Composite
Fig. 9. Stress-Rupture and Fatigue Life of Kev-lar 49 Composite
supported by our data, where the fatigue time to fai lure is shorter, instead of longer, thanthe creep time to fa i lu re . Our interpretation is that, for a time-dependent Kevlar composite,the l i f e under one load history cannot be used to predict the l i f e under another load historywhen only the load-input information is available. The practical consequence is that i flaboratory data collection is limited to recording the load input without also recording thematerial response, the laboratory data w i l l not yield satisfactory predictions of the l i f e of acomposite flywheel under a given service loading history. However, including the recordedmaterials response in the data analysis yields much improved correlations. Figure 10 shows thecumulative strain (the response) at failure vs the time to fai lure for creep and farigt.e. Wecan observe a general merging of both the creep-rupture and fatigue data. This indicates to usthat monitoring both the load input and the materials responses yields data that can be used topredict l i f e under general-service loading.
We also observed interesting results from the simulated structural-fatigue test of therings. The loading f ixture is a sp l i t "D" f ix ture. We applied axial cyclic loading (1 Hz) at50% of UTS. In this configuration, most of the ring is under cyclic tension but the point atthe sp l i t is under a complex contact stress concentration. We estimate this test to simulatethe contact stress where a spoke attaches to the rim in an actual flywheel. We have testedfive rings in this manner and periodically monitored the strain. The rings were tested up to10° cycles and did not f a i l . They were subsequently tested at a slow loading rate unt i lfa i lu re . (The times to fa i lure for this f inal destructive test were on the order of 10 h.) Weobserved two important phenomena: After 10^ cycles at 50% load, the residual strengthdecreased s l ight ly , by approximately 5%. Also, strain accumulated as in the tension tests, andthe material exhibited significant strain recovery when cycling loading was interrupted. Theeffect of the strain recovery on the l i f e of the ring is now being explored.
In summary, in the fatigue l i fe-t ime program we have collected a significant andcomprehensive amount of creep-rupture and fatigue data. These include recordings of both theload inputs and the material-response strains. Correlation between life-times under differentload histories appeared to be possible with these oata. Further development may provide thebasis of predicting flywheel structural l i f e from laboratory testing. We have also conductedstructural testing of rings to simulate rim-type flywheel stress states to bridge the gapbetween laboratory tests and flywheel applications.
REFERENCES
1. J. A. Rinde, Materials Program for Fiber Composite Flywheels, Lawrence Livermore LaboratorvRept. UCRL-81724 (1978). •"
2. L. L. Clements and R. L. Moore, "Composite Properties of an Aramid Fiber in aRoom-Temperature-Curable Epoxy Matrix," SAMPE Quarterly 9, 6 (1977).
372

3. J. A. Rinde, E. T. Mones, R. L. Moore, and H. A. Newey, An Epoxy Resin-Elastomer System forFilament Winding, Lawrence Livermore Laboratory, Rept. UCRL-81254 (1978).
4. R. M. Christensen and J. A. Rinde, Transverse Tensile Characteristics of Fiber Compositeswith Flexible Resins: Theory and Test Results, Lawrence Livermore Laboratory, Rept.UCRL-79983 (1977).
5. J. B. Snell and J. N. Schurb, "Scotchply Prepregs for Flywheel Applications," in Proc. 1975Flywheel Technology Symposium, U.S. ERDA document 76-85 (1975), p. 203.
6. H. T. Hahn, Effect of Constituent Properties on Composite Strength, Lawrence LivermoreLaboratory, Livermore, CA, UCRL-82051 (1978).
7. T. T. Cniao, J. K. Lepper, N. W. Hetherington, and R. L. Moore, "Stress-Rupture of SingleS-Glais, Epoxy Composites," J. Composite Mat. 6, 358 (1972).
8. T. T. Chiao, J. E. Wells, R. L. Moore, and M. A. Hamstad, "Stress-Rupture Behavior ofStrands of an Organic Fiber/Epoxy Matrix," in Composite Materials: Testing and Design (ThirdConference), ASTM Special Technical Publication 546 (American Society for Testing andMaterials, Philadelphia, 1974) p. 209.
9. R. H. Toland and T. T. Chiao, Stress-Rupture Life of Kevlar/Epoxy Spherical PressureVessels, Lawrence Livermore Laboratory, Rept. UCID-17755, Part 2 (1978).
373

Project Title:
Principal Investigator:
Organization:
Project Goals:
Project Status:
Contract Number:
Contract Period:
Funding Level:
Funding Source:
PROJECT SUMMARY
"High Energy Density Flywheel"
David L. Satchwell
AiResearch Manufacturing Company of California2525 West 190th StreetTorrance, California 90509(213) 323-9500
Fabricate two flywheel rotors, for later test, which have anenergy density of 80 Hh/Kg.
The contract is completed. Two 80 Wh/Kg rotors are ready fortests that will be conducted on a later contract.
AT(29-l)-789
August 1978 - May 1979
$267,759
Sandia Laboratories, U.S. Department of Energy,Division of Energy Storage Systems
375

HIGH-ENERGY-DENSITY FLYWHEEL
David L. SatchweliAiResearch Manufacturing Company of California
2525 W. 190th StreetTorrance, California 90509
ABSTRACT
This paper describes the design and fabrication of a flywheel rotor with an energydensity of 80 Wh/kg. The design features a multi-ring, S-glass and Kevlar compositematerial rim that is mounted on a graphite composite spoked hub. Composite materialflywheels have been constructed with identical rim design using spoked aluminum hubs.These aluminum hub flywheels have been successfully tested to energy densities of 53Wh/kg. The use of high strength-to-weight graphite composite material in place of thealuminum material significantly reduces the weight of the rotor assembly and therebyincreases the energy density. Graphite epoxy composite is chosen for the hub because ofits high modulus of elasticity, because of its light weight, and because of its highultimate flexural strength.
The hub consists of multiple slats, alternately bonded one upon another to form afour-spoke hub with rigid.cruciform shape. Hub testing was conducted on three hubsections 19.5 inch dia. by 1 inch thick; and consisted of compression testing across oneopposite set of spokes to determine the location, mode, and load at failure. Two hubswere cycled to an increased stress level that is equivalent to a full-life test. Twocomplete assembled rotors were made available for testing in a following phase.
INTRODUCTION
A flywheel has been designed and fabricated by Garrett-AiResearch to demonstratea high energy density of 80 w-hr/kg in the rotor. This is a 50f: increase over existingflywheel rotors. The rotor design consists of a multi-ring, sub-circular, S-glass/epoxycomposite and Kevlar/epoxy composite material rim that is mounted on a star hub ofgraphite composite material (see Figure 1). This work is being performed under a contractwith the Sandia Laboratories for the Department of Energy, Division of Energy StorageSystems.
376

TWO INNER S-2 GLASS EPOXY COMPOSITE
FIVE MIDDLE KEVLAR-29 EPOXY COMPOSITE
EIGHT OUTER KEVLAR-^ EPOXY COMPOSITE
-15 RINGS
-GRAPHITE COMPOSITECRUCIFORM HUB
SUBCIRCULARRIM
S304M
Fig. 1 Flywheel Rotor Configuration
Because of its multiring design, the rim can accommodate the radial stresses causedby centrifugal forces. Upon assembly, the rim is distorted from its round shape so thatwhen placed on an oversized star hub. the forces resulting from the rim trying to assumeits round shape hold it onto the hub. The graphite/epoxy composite material hub has asmall cross section and is very light, yet can withstand the forces imposed on it.
Two flywheel rotors have been fabricated that meet the above specifications, prod-ucibility studies have been completed, and a test plan has been written for a 100 cycletest with deceleration from 28,800 rpm to 9,500 rpm at a 37 kw power level.
MATERIALS SELECTION AND HUB FABRICATION PROCESS PROOF
Rings were made of S-2 Fiberglass/epoxy composite and of Kevlar-49 and Kevlar 29/epoxy composite. The epoxy matrix material, DOW DER 332, was qualified by hydrostatictesting of 19 inch diameter rings. Figure 2 is a photograph of the hydrostatic testfixture used to determine modulus of elasticity from tests of ring stretch vs. internalpressure. Ultimate strength data also was obtained on the test rings by bursting themin the fixture. Placement of the test ring in the fixture is shown in Figure 3.
377

r
Fig. 2. Hydrostatic Test Fixture
PRESSURE
oi II I
uLIPSEAL
/TEST SPECIMEN
Fig. 3. Hydrostatic Test Section
378

The hub, made of a graphite/epoxy composite, was fabricated by Structural CompositesIndustries, Inc. of Azusa, California. Graphite composite is chosen for this applicationbecause of its modulus of elasticity of 18 X 106 psi, its light weight of 6.05 Ib/cu. in.,and its ultimate flexural strength of 210,000 psi. The combination of these propertiesallows reducing the hub weight from 22.5 1b for an aluminum hub to 6.5 1b for the graphiteepoxy composite hub.
Three 1 inch axial length test hubs were fabricated to prove the fabrication process,and to allow testing of a hub under axial compression. These 1 inch test hubs are madefrom 15 slats stacked to form a 19.5 inch diameter rigid cruciform hub. Figure 4 is aphoto of the graphite slat, and Figure 5 is a photo of the 1 inch test hub.
Fig. 4. Slat with Peal Ply in Place
Fig. 5. 1 Inch Test Hub
379
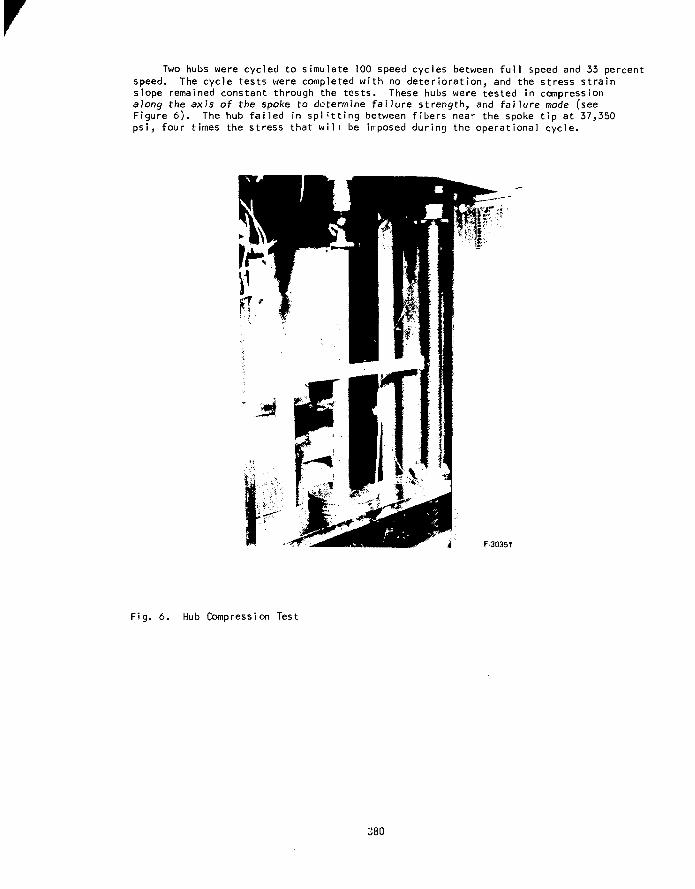
rTwo hubs were cycled to simulate 100 speed cycles between full speed and 33 percent
speed. The cycle tests were completed with no deterioration, and the stress strainslope remained constant through the tests. These hubs were tested in compressionalong the axis of the spoke to determine failure strength, and failure mode (seeFigure 6 ) . The hub failed in spl'tting between fibers near the spoke tip at 37,350psi, four times the stress that wili be imposed during the operational cycle.
F30351
Fig. 6. Hub Compression Test
380
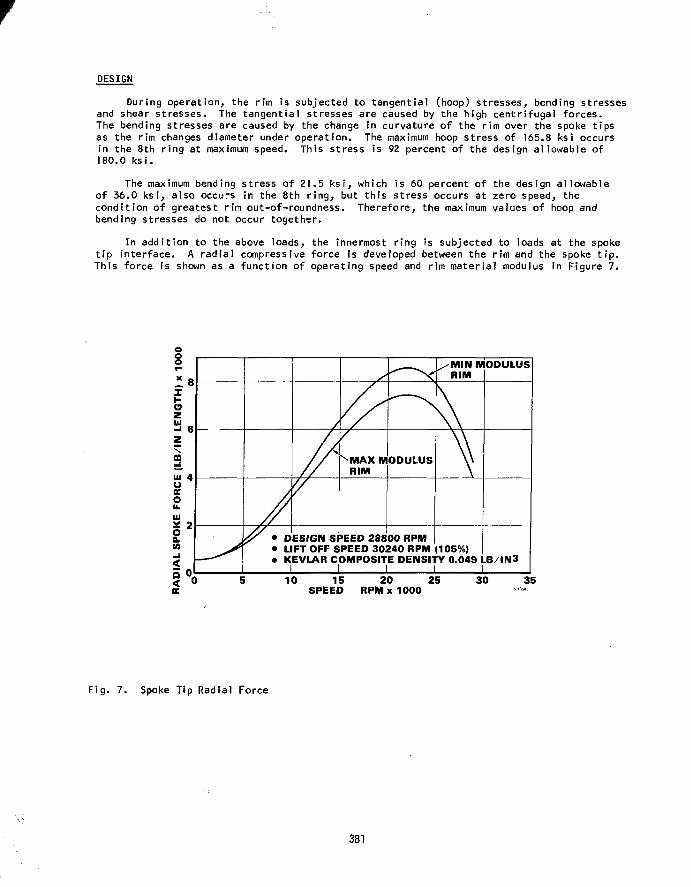
DESIGN
During operation, the rim is subjected to tangential (hoop) stresses, bending stressesand shear stresses. The tangential stresses are caused by the high centrifugal forces.The bending stresses are caused by the change in curvature of the rim over the spoke tipsas the rim changes diameter under operation. The maximum hoop stress of 165.8 ksi occursin the 8th ring at maximum speed. This stress is 92 percent of the design allowable of180.0 ksi.
The maximum bending stress of 21.5 ksi, which is 60 percent of the design allowableof 36.0 ksi, also occurs in the 8th ring, but this stress occurs at zero speed, thecondition of greatest rim out-of-roundness. Therefore, the maximum values of hoop andbending stresses do not occur together.
In addition to the above loads, the innermost ring is subjected to loads at the spoketip interface. A radial compressive force is developed between the rim and the spoke tip.This force is shown as a function of operating speed and rim material modulus in Figure 7.
o
sX(9
z
Iui 4UKOu.UJrCO
'MIN MODULUSRIM
-MAX MODULUSRIM
\ \
1• DESIGN SPEED 23800 RPM• LIFT OFF SPEED 30240 RPM (105%)• KEVLAR COMPOSITE DENSITY 0.049 LB/IN3
I I I I10 15
SPEED20 25
RPM x100030 35
Fig. 7. Spoke Tip Radial Force
381

The peak radial force is 8500 lbs per unit axial length at 22,800-rpm. The averagecompressive stress in the inner ring due to this force is 5.7 ksi. This is 50 per centof the design allowable compressive stress.
The hub supports the flywheel rims and must transfer all transient and steady loadsto and from the rim. Another load on the hub is its own centrifugal load. The variationwith rotational speed of the steady stress at the tip section and the root section isgiven on Figure 8. For the root, the maximum tensile stress of 81.5 ksi occurs at 28,800rpm. This stress is well below the expected 180 ksi fatigue limit for 10* cycles at astress ratio of 0.1. The highest compressive stress of 9,7 ksi occurs in the tip at20,u00 rpm. This stress which is 4 percent of the ultimate strength is expected to bewell below the required fatigue limit at 10* cycles.
ROOT SECTIONR=0.5 IN.
/TIP SECTIONR=9.61 IN.
Fig. 8. Spoke Stress Variation with Speed
A detailed finite element analysis has been performed at the spoke tip to determinethe magnitudes of the local stresses. Because of the relatively low transverse strengthof the unidirectional graphite epoxy hub, it is important to ensure that the compressiveforces at the spoke tip result in transverse stresses that do not exceed the allowablestrength.
Combining the radial forces, the bearing area available, the selected rim-to-hubinterference, and material properties, allows the geometry of the spoke tip to be deter-mined, as shown in Figure 9.
382

0.030"
O 0.0201
>OQ.
< 0.010
0.000"
I <£ OF HUB
\
1° 2° 3°ANGULAR LOCATION ON HUB TIP
Fig. 9. Hub Tip Pro f i le
HUB AND RIM FABRICATION
Two assembled ro to rs , as pictured in Figure 10, have been fabr ica ted .
Fig. 10. Two Assembled Rotors
383

rThe hub was fabricated by Structural Composites Industries, Inc., using the methods
developed and proven on the one inch hub sections. The rim is similar to theone developed for a vehicular propulsion system (see Figure 11).
Fig. 11. Flywheel Rim Modules
The hub slats were molded from multiple layers of pre-preg graphite fiber tape.Individual slats were stacked into a cruciform shape in an assembly mold. The stackwas loaded to a pressure at a specified stack height, and heated to cure the adhesivebond.
Each rim was wound individually on a cylindrical aluminum mandrel. The roving wasrun at a controlled tension and the fiber volume fraction was kept within the range of71-75 percent. Each ring was gelled after winding. Each successive ring was wound uponthe preceeding ring. The rim was removed from the mandrel and made ready for assemblyupon the hub.
The rotor was assembled in the fixture shown in Figure 12. The rim was stretchedsquarish so that the diametral measurement at the spoke was enlarged enough to allowthe oversized 4-spoke hub to be placed inside of the rim. The ram pressure was lowered,allowing the rim to spring tight upon the hub.
384

Fig. 12. Assembly Fixture
PRODUCIBILITY AND COST ANALYSIS
The costs and processes involved in the production of the flywheels were analyzed.Cost-effectiveness is affected mainly by the design configuration, by scaling for economicuse of materials, and by effective tooling and production techniques. Table 1 summarizesthe cost/producibiiity results.
TABLE 1. Flywheel Rotor Production Cost
Cost Element
Material /
Labor:
. Hub
Rim
TotalS/unit
Totaltool ing, S
1979 Cost, S
100/yr
370.44
1560.00
1872.00
3802.44
37,500
1000/yr
342.52
748.00
249.60
1340.12
110,500
10,000/yr
232.68
62.40
74.88
369.96
525,000
1984Cost, S
10,000/yr
169.17
62.40
74.88
306.45
525,000
385

TEST PLAN m
The flywheel rotors produced under this contract are ready for test under a separatecontract. The test will consist of 100 cycles from 9,500 rpm to 28,800 rpm and back to9,500 rpm at 37 kw power.
The AiResearch test facility shown in Figure 13 is capable of performing testing tothis flywheel to demonstrate the energy density of 80 Wh/kg.
Fig. 13. Composite Flywheel in Test Facility
386
PROJECT SUMMARY
Project Title: "Composite-Laminate Flywheel-Rotor Development Program"
Principal Investigator: Satish V. Kulkarni
Organization: University of California, Lawrence Livermore LaboratoryP.O. Box 808, Mail Stop L-338Livermore, CA 94550FTS 532-7128
Project Goals:
Project Status:
Contract Number:
Contract Period:
Funding Level:
Funding Source:
To develop a practical and economical prototype high-energydensity, composite-laminate rotor for hybrid flywheel/electric/ICE vehicles and stationary applications. 'In terms of energydensity, the objective is to obtain 88-Wh/kg (40 Wh/lb) atfailure with an operational range of 44-55 Wh/kg (20-25 Wh/lb)and an energy storage capacity of approximately 1 kWh.
The program is being conducted at the Lawrence Livermore Lab-oratory (tapered thickness 'Stodola' rotor concept) and theGeneral Electric Company (a-ply constant-thickness rotor con-cept). The LLL effort has been in the following three areas.
Proof-of-concept: (a) redesign of the 'Stodola' rotor by edgethickening and filament winding of ring around the disc to in-crease energy density; (b) develop a modified layup pattern toincrease the strength anisotropy of quasi-isotropic laminates;and (c) fabricate S2-g1ass and graphite/epoxy tapered-thicknessrotors.
Design/test correlation studies: (a) perform tests on variousS2-glass, graphite and Kevlar-49/epoxy quasi-isotropic lami-nate coupons to obtain design data and determine the laminatestrength anisotropy; (b) spin test S2-glass, graphite andKevlar-49/epoxy constant-thickness rotors to establish a rela-tionship between design data and failure speed; and (c) evalu-ate these rotors non-destructively to determine damage accumu-lation during spinning.
Materials and processes: (a) utilize the matched metal-die-compression molding process for fabricating rotors; and(b) investigate the feasibility of making low-cost rotors fromstructural sheet-molding compounds. Joint cooperative programshave been established with Owens-Corning and PPG Fiberglass inthis area.
During FY 1980, the above mentioned tasks will be continued.
W-7405-ENG-48
FY 1979
$520K (Total for LLL and GE)
U.S. Department of Energy
387
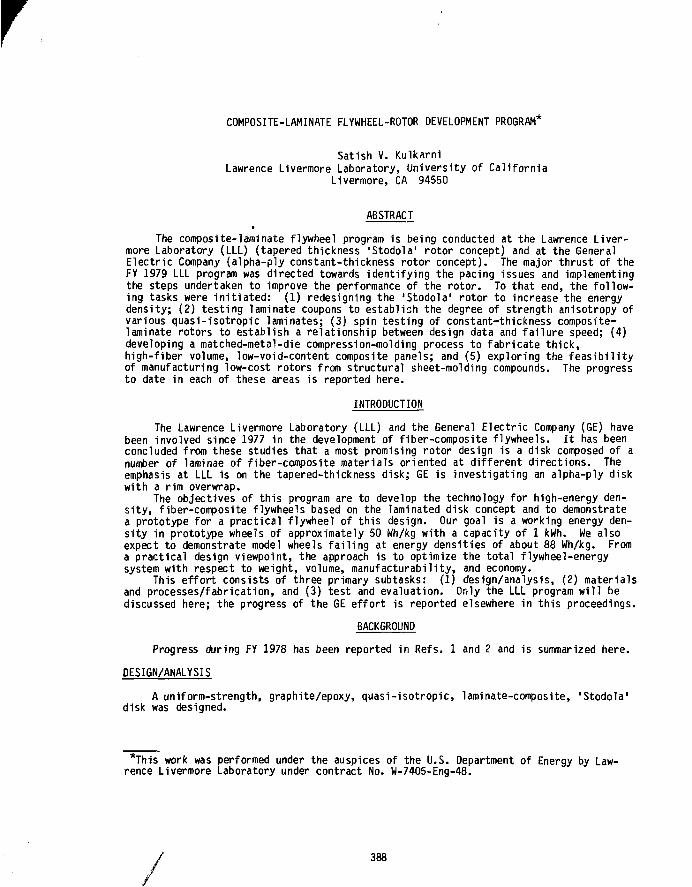
rCOMPOSITE-LAMINATE FLYWHEEL-ROTOR DEVELOPMENT PROGRAM*
Satish V. KulkarniLawrence Livermore Laboratory, University of California
Livermore, CA 94550
ABSTRACT*
The composite-laminate flywheel program is being conducted at the Lawrence Liver-more Laboratory (LLL) (tapered thickness 'Stodola1 rotor concept) and at the GeneralElectric Company (alpha-ply constant-thickness rotor concept). The major thrust of theFY 1979 LLL program was directed towards identifying the pacing issues and implementingthe steps undertaken to improve the performance of the rotor. To that end, the follow-ing tasks were initiated: (1) redesigning the 'Stodola1 rotor to increase the energydensity; (2) testing laminate coupons to establish the degree of strength anisotropy ofvarious quasi-isotropic laminates; (3) spin testing of constant-thickness composite-laminate rotors to establish a relationship between design data and failure speed; (4)developing a matched-metal-die compression-molding process to fabricate thick,high-fiber volume, low-void-content composite panels; and (5) exploring the feasibilityof manufacturing low-cost rotors from structural sheet-molding compounds. The progressto date in each of these areas is reported here.
INTRODUCTION
The Lawrence Livermore Laboratory (LLL) and the General Electric Company (GE) havebeen involved since 1977 in the development of fiber-composite flywheels. It has beenconcluded from these studies that a most promising rotor design is a disk composed of anumber of laminae of fiber-composite materials oriented at different directions. Theemphasis at LLL is on the tapered-thickness disk; GE is investigating an alpha-ply diskwith a rim overwrap.
The objectives of this program are to develop the technology for high-energy den-sity, fiber-composite flywheels based on the laminated disk concept and to demonstratea prototype for a practical flywheel of this design. Our goal is a working energy den-sity in prototype wheels of approximately 50 wh/kg with a capacity of 1 kWh. We alsoexpect to demonstrate model wheels failing at energy densities of about 88 Wh/kg. Froma practical design viewpoint, the approach is to optimize the total flywheel-energysystem with respect to weight, volume, manufacturability, and economy.
This effort consists of three primary subtasks: (1) design/analysis, (2) materialsand processes/fabrication, and (3) test and evaluation. Only the LLL program will bediscussed here; the progress of the GE effort is reported elsewhere in this proceedings.
BACKGROUND
Progress during FY 1978 has been reported in Refs. 1 and 2 and is summarized here.
DESIGN/ANALYSIS
A uniform-strength, graphite/epoxy, quasi-isotropic, laminate-composite, 'Stodola1disk was designed.
*This work was performed under the auspices of the U.S. Department of Energy by Law-rence Livermore Laboratory under contract No. W-7405-Eng-48.
388

A finite-element analysis of a truncated, graphite/epoxy, 'Stodola' rotor wasconducted to determine the stress redistribution resulting from the truncation and todetermine the magnitude of interlaminar stresses.
MATERIALS AND PROCESS/FABRICATION
A 1-in. thick, high-strength, Celion* 6000/5213 graphite/epoxy (0/+45/90),quasi-isotropic laminate was fabricated by Babcock & Wilcox, Alliance, Ohio, byutilizing the vacuum-bag/press-molding technique.
Bonding of hub was accomplished by Lord Corp., Erie. Pa., by employing elasto-mer ic inter1ayers.
Precision machining of rotor to the tapered thickness profile was done at LLL.Figure 1 shows the rotor with the hub attachment.
TEST AND EVALUATION
Spin testing of rotor was performed at Johns Hopkins University, Applied PhysicsLaboratory. Table 1 indicates the diagnostics of the spin test. The energy density
Fig. 1. Tapered-Thickness Graphite/Epoxy Quasi-Isotropic Composite-Laminate Rotor.
TABLE 1. Diagnostic of Tapered-Thickness, Celion 6000/5213,Graphite/Epoxy Flywheel Test
Predicted failure speed 50,000Predicted energy density 54 Wh/lbActual failure speed 36,000 rpmActual energy density 28.4 Wh/lbPredicted maximum straina at 50,000 rpm 0.0102Actual maximum strain at failure 0.0062Failure strain from (0/+45/90) 0.0095
laminate test (along 0° layer)Failure strain from (0/±45/90) 0.0066
laminate test (at 22.5° to 0° layer)
*Reference to a company or product name does not imply approval or recommendation ofthe product by the University of California or the U.S. Department of Energy to the ex-clusion of others that may be suitable.
389

obtained was about half the predicted value. Also, the actual strain at failure(0.0062) was in close agreement with that obtained from the off-axis laminate test(0.0066).
SUMMARY OF EFFORT DURING FY 1979
Because of the lower-than-expected performance of the 'Stodola' rotor, the programtasks were evaluated critically and certain pacing issues were identified. These areasof concern are listed below:
• Truncation of infinite 'Stodola' rotor reduces efficiency.• Finite-element analysis may not accurately predict interlaminar stresses.• Thick laminate technology is in an infant stage. Vacuum bag/press-molding
process is not amenable to a low-cost production type environment.• Machining of rotor is a time-consuming (and expensive) task requiring tight
tolerances. Also machining of a built-up composite part is contrary to the concept ofbuilding from scratch to avoid material waste.
• Quasi-isotropic laminates are not isotropic in strength (see Fig. 2). Hencefull-strength potential of laminate is not fully realized.
• Effect of biaxial stress field on laminate strength is not fully understood(also see Fig. 2).
• Both material and manufacturing costs are high.• Incomplete understanding of rotor/shaft dynamics leads to premature failures
during testing.• Failure mode is catastrophic for graphite/epoxy.• Test diagnostics are inadequate.Effort during FY 79 was directed primarily towards addressing these issues.
DESIGN/ANALYSIS
To increase the rotor efficiency, the rotor edge was thickened to "buy" back mass(Fig. 3a). Figure 4 illustrates that the energy density for the graphite/epoxy rotorcan indeed be increased about 5-105! by this approach.
(a)
"2U|1 < "i
Fig. 2. Certain Features of Quasi-Isotropic Composite-Laminate Strength, (a) StrengthAnisotropy. (b) Effect of Biaxial Stress.
39.0

(a)
Energydensity
Mass Optimum
A Mass
(b)FW ring
Fig. 3. Design Modifications to Improve Rotor Efficiency, (a) Edge Thickening,(b) Containment of Rotor in a Ring.
80
75
* 65
t 60ID
55
50 -
45
/ \ n = h c-0.014264r2-Theoretical energy density of ° t£ZL.
the infinite rotor
hQ = 1.02 in,
(Shaded area denotes Aweight)Material: Celion 6000/5213 graphite/epoxyLayup: 0/+ 45/90, ef = 0.012
rm,x = 1 2 i n
(34.5)(Based on ef = 0.0062)
AWt to obtain weightof infinite rotor
•JKL.Energy density of constant thickness rotori i _j i i i I | I
r-r
0 0.2 0.4 0.6 0.8 1.0 1.2 1.4 1.6 1.8 2.0
AW, Ib
Fig. 4. Variation of Energy Density with Edge Thickening of Rotor.
I f , in addition to the edge thickening, the rotor is contained in a filament-woundring of a higher specif ic modulus than the disk (Fig. 3b), the following would be theadded advantages:
• A compressive pre-stress would be induced in the disk.• A benign failure mode can be precipitated in the ring.
Such a "hybrid1.1 concept is also being employed by GE for the constant-thickness alpha-ply f lywheels .^ Parametric finite-element studies conducted for chopped-fiber
391

rotors contained in Kevlar-49 and graphite/epoxy rings demonstrate the validity of thisconcept.
A finite-element mesh, which follows the tapered thickness profile (Fig. 5a), candetermine the average values of interlaminar stresses (trz, in this case). A pre-ferred approach would be to utilize a mesh that follows the lamination pattern shown inFig. 5b. An increase in the magnitude of trz by about 10% has been obtained byusing the parallel meshing.
An investigation of the failure characteristics of quasi-isotropic compositelaminates has also been initiated. This study is being conducted at VillanovaUniversity, Villanova, Pa. The specific items to be addressed are:
• Anisotropic failure characteristics of quasi-isotropic composite laminates.• Effect of biaxial stresses on failure strength.• Treatment of interlaminar stresses in failure analysis of composite flywheels.• Influence of stacking sequence on damage initiation and propagation in laminated
composite rotors.
MATERIALS AND PROCESSES/FABRICATION
The major thrust of this subtask in FY 1979 has been in the areas of (1) fabri-cating by the matched-metal-die compression-molding process, continuous-fiber S2-glass,Kevlar-49, and graphite/epoxy panels for both coupon testing and machining constant andtapered-thickness rotors and (2) exploring the feasibility of making low-cost rotors byutilizing structural sheet-molding compounds.
Initially, S2-glaso/epoxy and graphite/epoxy laminates were made by 3M Co., St.Paul, Minnesota, and Babcock Wilcox, Alliance, Ohio, respectively, by using a vacuumbag/press-molding process. The thin panels were used for obtaining design data. Con-stant thickness rotors (see Figs. 6 and 7), which were machined from thick laminates,were spin tested to establish a relationship between failure speed and laminate testdata. Test data are given in Tables 2 to 4.
Test diagnostics of the tapered-thickness graphite/epoxy rotor (see Table 1)suggest there are two avenues open to further improve the performance of laminated-diskrotors: (1) to increase the basic strength of the composite and (2) to reduce thestrength anisotropy of the laminate.
With regard to the first option, the logical approach is to utilize a fabricationprocess that will result in laminates with a high fiber-volume fraction and a low voidcontent. The matched-metal-die compression-molding (MMDCM) process (as opposed to the
FLYWHEEL WITH CONTOUR MESHING
FLYWHEEL WITH PARALLEL MESHING
Fig. 5. Finite-Element Meshing for Tapered-Thickness Rotor, (a) Flywheel with ContourMeshing, (b) Flywheel with Parallel Meshing.
392
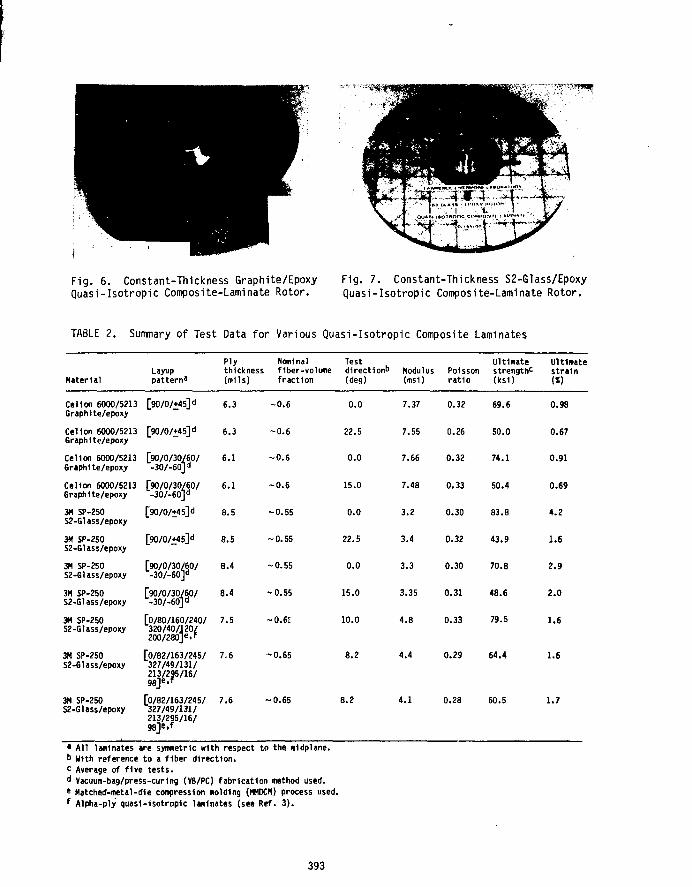
Fig. 6. Constant-Thickness Graphite/Epoxy Fig. 7. Constant-Thickness S2-Glass/EpoxyQuasi-Isotropic Composite-Laminate Rotor. Quasi-Isotropic Composite-Laminate Rotor.
TABLE 2. Summary of Test Data for Various Quasi-Isotropic Composite Laminates
MaterialLayuppattern8
Plythickness(mils)
Nominalfiber-volumefraction
Testdirection6
(deg)
Modulus(ms1)
Poissonratio
Ultimatestrength0
(ksi)
UltimatestrainW
Cell on 6000/5213Graphite/epoxy
Cell on 6000/5213Graphite/epoxy
Cell on 6000/5213Graphite/epoxy
Celion 6000/5213Graph1te/epoxy
3M SP-250S2-Glass/epoxy
3M SP-250S2-Glass/epoxy
3M SP-250S2-Glass/epoxy
3M SP-250S2-Glass/epoxy
3H SP-250S2-Glass/epoxy
[90/0/+45]d 6.3
[90/0/+45]d 6.3
[90/0/30/60/ 6.1-30/-60]d
[90/0/30/60/ 6.1-30/-60]"
[90/O/+45]d 8.5
8.5
0/ 8.4
3H SP-250S2-Glass/epoxy
3M SP-250S2-Glass/epoxy
[90/0/30/60/ 8.4-3O/-60]a
[0/80/160/240/ 7.5320/40/120/200/280Je>f
[0/82/163/245/ 7-6327/49/131/
[0/82/163/245/ 7.6327/49/131/213/295/16/
] e f
-0.6
-0.6
-0.6
-0.6
-0.55
-0.55
-0.55
-0.55
-0.6!
-0.65
-0.65
0.0
22.5
0.0
15.0
0.0
22.5
0.0
15.0
10.0
7.37
7.55
7.66
7.48
3.2
3.4
3.3
3.35
4.8
0.32
0.26
0.32
0.33
0.30
0.32
0.30
0.31
0.33
69.6
50.0
74.1
50.4
83.8
43.9
70.8
48.6
79.5
0.98
0.67
0.91
0.69
4.2
1.6
2.9
2.0
1.6
8.2
8.2
4.4
4.1
0.29
0.28
64.4
60.5
1.6
1.7
* All laminates are symmetric with respect to the nidplane.b With reference to a fiber direction.c Average of five tests.d Vacuum-bag/press-cur1ng (VB/PC) fabrication method used.e Matched-metal-die compression molding (MMDCM) process used.f Alpha-ply quasi-Isotropic laminates (see Ref. 3).
393

TABLE 3. Shear Strengths of S2-Glass/EpoxyComposite Laminate Made from MMDCM Process
Laminate TestUltimate strengths8
(ks i )
CO][±45]s
Short-beam shearUniaxial tension
11.5 (interlaminar)14.0 (in-plane)
^Average of five tests.
TABLE 4. Test Data Summary of Various Constant-Thickness,Quasi-Isotropic Laminate Rotors
Material
Gr/Ep
Gr/Ep
S-G/Ep
S-G/Ep
S-G/Ep
S-G/Ep
K-49/Ep
Lay-up
0/+45/90
O/J;45/90
0/+45/90
0/+30/i60/90
0/+45/90
0/+30/+60/90
O/+22.55/+45/+67.5/90
Nominalthickness(in.)
0.285
0.285
0.42
0.42
0.42
0.42
- -
Oiam.(in.)
12.3
13.5
16
1C
15
15
16
Predictedfailurespeed(rpm)
53,500
48,800
35,100
37,100
39,900
42,200
Actualfailurespeed(rpm)
4<S,50Oa
48,200
30,000b
30,000a
°maxfit failure(ksi)
49
69
Energydensityat failure(Wh/lb)
16.5
23.4
a Rotor failure attributed to shaft failure.k Test purposely stopped to conduct non-destructive evaluation.
conventional, vacuum-bag, autoclave-curing process) appears to be ideally suited forthis purpose and offers the advantages of:
High volume production.Excellent part reproducibil ity.Low labor requirement per unit produced.Minimum material scrap.Excellent design f l e x i b i l i t y (simple to complex shapes).Fully mechanized production capabil it ies.
This process has not been extensively used to date for fabricating fiber/epoxy-resincomposites for aerospace applications because of the following reasons:
• Capital investment for the mold is high.• Release of part from the mold when using epoxy resins is d i f f i cu l t .• The motivation for obtaining the optimum strength as a function of increasing
fiber-volume fraction did not exist.The aerospace industry typically ut i l izes the autoclave-curing process where the
applied pressures are of the order of 100 to 150 psi . One approach to increase thefiber-volume fraction is to increase the curing pressure (~300 to 500 psi). I t is notpractically feasible to obtain these pressures in an autoclave. Hence the MMDCM processwas used.
394

Also, i t should be borne in mind that an increase in fiber-volume fraction wi l lresult in an increase in the density of the composite. Based on analytical calcula-tions, the increase in strength more than compensates for the increase in density.Furthermore, there is an optimum fiber-volume content beyond which the compositestrength wi l l actually decrease. In this regard, care must be taken to avoid exces-sive bleeding of the resin.
For the present program, three; steel molds were fabricated by Ewald Associates,Detroit, Michigan, for the purposes of molding laminates of different sizes -mdthicknesses. In this manner, the scale-up of the process could be accomplished in amethodical manner. Also, special mold-release f i lm was used to fac i l i ta te release ofthe part from the mold after curing.
As mentioned earl ier, the second option available for increasing the energy densityis to modify the lay-up pattern to reduce the strength anisotropy. The various laminatelay-up or stacking patterns are indicated in Fig. 8. The optimum pattern depends on thetrade-off between the through-the-thickness local and global laminate-strength aniso-tropy. Such an optimum lay-up pattern has been used in the fabrication of the thicklaminates.
In summary, nine thick S2-glass/epoxies and high-strength graphite/epoxies (Celion6000/5213) are beir.T molded presently for the following purposes:
• To demonstrate an energy density of 40 Wh/lb (proof-of-concept).• To compare matched-die compression molding and vacuum-bag low-pressure press-
molding processes.• To assess the edge-thickening effect.• To determine the effect of various lay-up patterns.The strength anisotropy of quasi-isotropic laminates indicates that the most
optimum use of materials is achieved for a random orientation. Thus random chopped-fiber composites are possible candidates for flywheel applications. Data(4) for1-in., chopped, S2-glass/polyester sheet-molding compound (SMC) with 65% weight of f ibershow a tensile strength of 35 ks i . The potential exists to increase this value furtherto about 45 ks i . This is comparable to the off-axis strengths of some continuous-fiberquasi-isotropic laminates (see Table 2). In addition, the low material andmanufacturing costs provide the motivation to use these materials.
Joint cooperative programs have been established with Owens-Corning FiberglassCorp., and PPG Fiberglass Co. during FY 1979 to develop high-fiber-content, chopped
• Single pattern through the thickness
0/607-60
• Single pattern rotated through-the-thickness
0/60/-60, X + 0, X + 20, etc . . .
X
• All layers having different orientations
• Layup symmetric WRT mid-plane only
• Layup symmetric locally as well as WRT mid-plane
Fig . 8. Various Quasi-Isotropic-Laminate Lay-up Patterns for the Flywheel RotorConf igurat ion.
395

SZ-g'Uss SMC (ultimate strength objective: 45 ksi) and to utilize the MMDCM process tofabricate constant- and tapered-thickness rotors in a single step.
Two steel molds are currently being made for LLL by Gougler Industries, Kent, Ohio,for molding these rotors. The actual molding process will be developed jointly withOwens-Corning.
It is also important to identify the areas of concern associated with the use ofSMC and MMDCM.
• The curing process may induce residual stresses and internal cracking.• Appropriate placement of charge (SMC sheets) in the mold is necessary to insure
adequate flow and material homogeneity.• Fatigue/creep of SMC (partially alleviated by outer ring) may occur.In summary, the design goal is to obtain low-cost, moderate-energy-density rotors.Finally, since the "hybrid" (disk/ring) design is being actively considered,
another processing area being investigated both by LLL and GE is the direct filamentwinding of the outer ring on the disk.
TEST AND EVALUATION
In FY 1979 these activities consisted mainly of testing various composite laminatesto obtain design data and spin testing constant-thickness rotors.
In addition, the objectives of testing various quasi-isotropic laminates were toestablish degree-of-strength anisotropy and to determine the improvements in laminateproperties by utilizing the MMDCM process.
Table 2 shows the test results for the laminates made from both thevacuum-bag/press-curing and the MMDCM processes.(5) These data demonstrate thefollowing:
• The laminates are quite anisotropic in strength.• A major improvement in the modulus and strength of S2-glass epoxy laminae can be
obtained by using the MMDCM technique.The cured ply thickness is a measure of the increase in fiber-volume fraction.
Table 3 shows the in-plane and interlaminar strength of the S2-glass/epoxy laminates.The high values attest to the superior quality of the laminates. This process has beenutilized for graphite/epoxy test panels and scaled up for molding 1-in.-thick S2-glassand graphite/epoxy laminates. The ultimate measure of the adequacy of this will be, ofcourse, determined by the increase in the energy densities of laminated disc rotors.
Spin testing of constant thickness rotors was conducted primarily to establish arelationship between laminate data and failure speed and to ascertain the effect ofbiaxial stress on strength.
The results of the spin tests (conducted at GE, Schenectady, N.Y.) are tabulatedin Table 4. It is clear that the confidence level in predicting failure speeds has im-proved. Also, a moderately high value of energy density (23.4 Wh/lb) was obtained forone of the graphite/epoxy rotors. Figure 9 illustrates the failed rotor in the spintest chamber.
Because of the laminar nature of composite laminates and the existence of a strongphase (fiber) and a weak phase (matrix), fabrication defects are commonplace.Sometimes, these defects have an adverse effect on performance. Consequently, all thelaminates were evaluated nondestructively by utilizing the ultrasonic C-scan procedure.The objectives were to detect manufacturing defects (interlaminar debonds) after fabri-cation, to detect flaws resulting from machining and handling, and to detect damageaccumulation in rotors after spinning to a predetermined rpm.
For the graphite/epoxy rotor (Table 4), no significant damage was detected afterspinning it up to 35,000 rpm. However, for the S2-glass/epoxy rotor, damage was evidentafter 30,000 rpm.
During spinning, the laminated composite rotor is subjected to a biaxial state ofstress, and the effect of biaxial-stress field on laminate strength is not fullyunderstood. Ideally, the spin test is the best suited to obtain failure under abiaxial-tensile test. However, it is expensive to conduct such a test and to obtainsufficient data points to develop a certain confidence level. Alternative test methods,
396
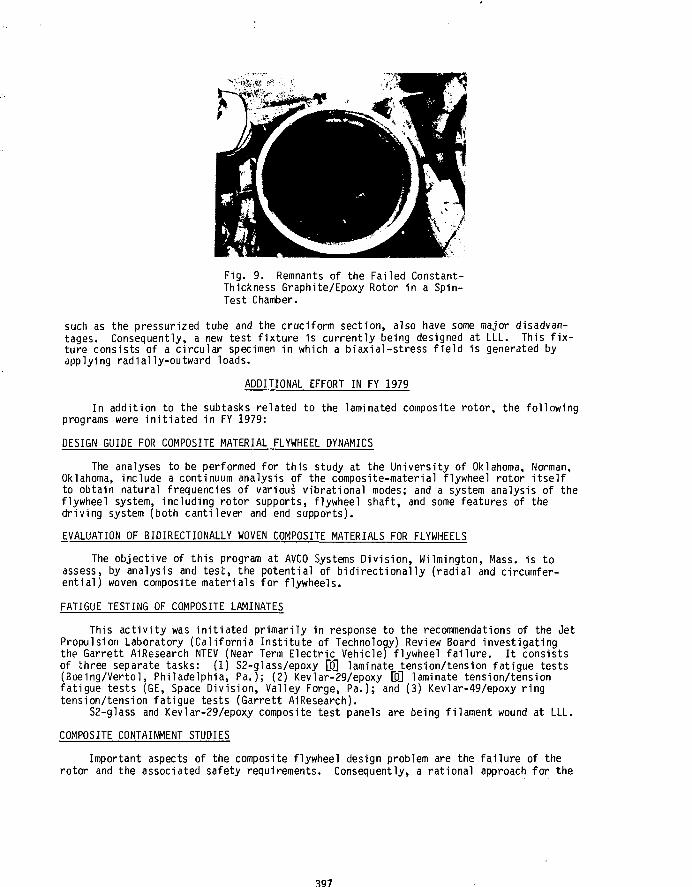
Fig. 9. Remnants of the Failed Constant-Thickness Graphite/Epoxy Rotor in a Spin-Test Chamber.
such as the pressurized tube and the cruciform section, also have some major disadvan-tages. Consequently, a new test fixture is currently being designed at LLL. This fix-ture consists of a circular specimen in which a biaxial-stress field is generated byapplying radially-outward loads.
ADDITIONAL EFFORT IN FY 1979
In addition to the subtasks related to the laminated composite rotor, the followingprograms were initiated in FY 1979:
DESIGN GUIDE FOR COMPOSITE MATERIAL FLYWHEEL DYNAMICS
The analyses to be performed for this study at the University of Oklahoma, Norman,Oklahoma, include a continuum analysis of the composite-material flywheel rotor itselfto obtain natural frequencies of various vibrational modes; and a system analysis of theflywheel system, including rotor supports, flywheel shaft, and some features of thedriving system (both cantilever and end supports).
EVALUATION OF BIDIRECTIONALLY WOVEN COMPOSITE MATERIALS FOR FLYWHEELS
The objective of this program at AVCO Systems Division, Wilmington, Mass, is toassess, by analysis and test, the potential of bidirectionally (radial and circumfer-ential) woven composite materials for flywheels.
FATIGUE TESTING OF COMPOSITE LAMINATES
This activity was initiated primarily in response to the recommendations of the JetPropulsion Laboratory (California Institute of Technology) Review Board investigatingthe Garrett AiResearch NTEV (Near Term Electric Vehicle) flywheel failure. It consistsof three separate tasks: (1) S2-glass/epoxy [0] laminate tension/tension fatigue tests(Boeing/Vertol, Philadelphia, Pa.); (2) Kevlar-29/epoxy EQ laminate tension/tensionfatigue tests (GE, Space Division, Valley Forge, Pa.); and (3) Kevlar-49/epoxy ringtension/tension fatigue tests (Garrett AiResearch).
S2-glass and Kevlar-29/epoxy composite test panels are being filament wound at LLL.
COMPOSITE CONTAINMENT STUDIES
Important aspects of the composite flywheel design problem are the failure of therotor and the associated safety requirements. Consequently, a rational approach for the
397
design of the containment must be evolved. To tha t end a program has been i n i t i a t e dat GE Space D i v i s i o n , Val ley Forge, Pa. t o assess the a p p l i c a b i l i t y of j e t -eng inefan-blade containment technology to f lywheel containment.
PLANS FOR FY 1980
Ef fo r t during FY 1980 w i l l e ssen t i a l l y invo lve e i the r the completion or the con-t i nua t i on of the ongoing tasks . However, the emphasis w i l l s h i f t from exp lora torydevelopment to the t e s t i n g of prototype r o t o r s . These spin tests w i l l include ro to rsdeveloped under Sandia sponsorship. A lso, studies i n the containment area w i l l beaugmented-.
SUMMARY
The status and progress of the composite-laminate flywheel-rotor developmentprogram during FY 1979 have been described. A critical evaluation of the effort wasmade initially, and certain pacing issues and areas of concern were identified. Appro-priate steps were undertaken to address these issues. It is believed that improvementsand modifications made in the design/analysis, processing/fabrication, and testing areawill lead to the realization of the project goals.
ACKNOWLEDGMENTS
I wish to acknowledge the contributions of Richard A. Larder and Michael A. Gerhardof LLL to the finite-element analysis studies.
REFERENCES
1. R. G. Stone, "The Laminated Disc Flywheel Program," in Proceedings of the 1978Mechanical and Magnetic Energy Storage Contractors' Review Meeting, U.S. Departmentof Energy CONF-781046 (Luray, Virginia, October 1978); also Lawrence LivermoreLaboratory, Report UCRL-81772, 1978.
2. S. V. Kulkarni, R. G. Stone, and R. H. Toland, Prototype Development of an OptimizedTapered Thickness Graphite/Epoxy Composite Flywheel. Lawrence Livermore Laboratory,Report UCRL-52623, November 1978.
3. R. P. Nimmer, K. Torossian, J. Hickey, and J. P. D. Wilkinson, Laminated CompositeDisc Flywheel Development, Lawrence Livermore Laboratory, Report UCRL-13973, January1979.
4. J. Kay, Owens-Corning Fiberglass Corp., Granville, Ohio (private communication).
5. J. C. Duke, Jr., Investigation of the Strength of the Fiber Reinforced CompositeLaminate Specimens, Virginia Polytechnic Institute and State University, VPI-79.26,prepared for Lawrence Livermore Laboratory under P.O. No. 4914709, August 1979.
398

Project Title:
PROJECT SUMMARY
Laminated Disc Flywheel Development Program
Principal Investigator: Ronald P. Nimmer
Organization:
Project Goals:
Project Status:
Contract Number:
General Electric Research and Development CenterP. 0. Box 43Schenectady, New York 12301(518)385-2370
To design, fabricate, test and evaluate laminated discs with filamentwound outer rings for application in high energy density flywheel energystorage units.
A plane stress analysis of the laminated flywheel disc with filamentwound outer ring has been carried out and the radial thickness of thering has been optimized to attain maximum energy density. Several dif-ferent materials have been considered and parametric studies have beenconducted to determine the impact of property variability upon the pro-posed design concept. The design offering the highest energy densitiesuses an S2-glass laminated disc with a filament wound outer rim.
One-inch thick laminated discs with 11-inch outside diameters are nowbeing hydroclavt>d routinely with void contents on the order of 1.655 byvolume and fiber volume ratios of 48%. Development of filament windingtechniques incorporating computer controlled winding equipment have beencompleted. Fiber volume ratios of 69 - 70% have been achieved forKevlar-49 rings and 63S5 fiber volume fractions have been attained forgraphite rings. Production of rings for flywheel assembly is nowunderway.
Tests of laminated composite discs have been initiated. Three testshave been completed on S2-glass discs and an additional three tests havebeen made with laminated graphite discs. The largest energy densityattained for the S2-glass discs was 40 Wh/Kg (18.4 Wh/lb). The highestenergy density recorded for the graphite test was 50 Wh/Kg (23 Wh/lb).Tests on flywheels fabricated with filament wound outer rings aroundlaminated S2-glass discs are scheduled to begin next.
LLL Subcontract No. 2479309
Contracting Period: FY 79
Funding Level: $199.4K
Funding Source: U. S. Department of Energy/Lawrence Livermore Laboratories
399

LAMINATED FLYWHEEL DISC WITH FILAMENT WOUND OUTER RING
R. P. NimmerCorporate Research and Development
General Electric CompanySchenectady, New York 12301
ABSTRACT
Lustenader and Zorzv1^ have shown that the energy density of a laminated composite fly-wheel can be improved if an outer ring of unidirectional composite is added to the rotor. Inaddition, they established the existence of an optimum thickness for the outer ring which pro-vides maximum energy density. The current work expands upon this basic concept and encompassesthe design, fabrication, test and evaluation of such a flywheel as a high energy density,mechanical energy storage unit. Analysis of this design concept has identified failure criteriaas wel' as potential advantages and disadvantages dependent upon material choice. Parametricdesign studies have been conducted to evaluate the impact of mechanical property variation uponthe available energy density. A laminated S2-glass disc with a filament wound, graphite outerring has been identified as offering the highest potential energy density for this design con-cept. The hydroclaving technique has been applied to manufacture laminated SZ-glass discs withvoid contents of 1.6%. Computer controlled filament winding has been applied for fabrication ofthe unidirectional outer rings. Burst tests to date have been conducted on laminated S2-glassdiscs without outer rings indicating energy densities in the 30 - 40 Wh/Kg (15 - 18 Wh/lb) range.Improved material and addition of filament wound outer rings are expected to raise these values.
INTRODUCTION
The composite flywheel concept currently under consideration of the General Electric Companyand illustrated in Figure 1 is a hybrid design using a laminated central disc with a unidirec-tional outer ring. The laminated composite disc received high ratings in the survey of designconcepts conducted by Huddleston, et al.'^) and has also been pursued by Hatchr3',Rabenhorst™) and Kulkarni, Stone and To1and(5J. High energy storage per unit swept out volumeand favorable dynamic characteristics are among its most often cited advantages. Lustenader andZorzi"' have illustrated that the energy density of such a flywheel could be substantially im-proved with application of a unidirectional composite outer ring. The current program addressesthe design, fabrication, tP"i. and evaluation of such a flywheel.
DESIGN AND ANALYSIS
Several different composite materials have been examined for application in the hybrid disc-ring composite flywheel. Since some of the material combinations require interference fits be-tween the components, the effect of this interference parameter upon achievable energy densityhas also been investigated. In addition, the impact of mechanical property variability in thecomposite material has been examined from the standpoint of its impact upon energy density.Since the flywheels designed and built in this program are flat, one-inch-thick discs, an ortho-tropic plane stress analysis has been applied.
LAMINATED E-GLASS DISC WITH KEVLAR-49 OUTER RING
The first material combination considered analytically was made up of a laminated, E-glasscentral disc with a filament wound Kevlar-49 outer ring. Based upon considerations of thermalcontraction the interference parameter 6 for this analysis was set at 0.002 where
400

. • £ ...and 5 is the interference dimension and Ro is the outside radius of the ring. The compositematerial properties pertinent to the analyses in this paper are collected in Table 1. Theoptimization curves for this baseline design are presented in Figure 2, which plots the energydensity at burst for four specific failure criteria versus the ratio of inside to outside radiiof the ring. The first failure considered is an a-disc fracture in biaxial tension and fiberbreakage at its center. Second, the unidirectional outer ring could fail circumferentiallythrough fiber breakage. Alternately, the outer ring could fail transversely. Finally, the outerring could simply spin away from the inner disc.
Considering these four modes of failure, it becomes apparent that the a-disc strength andthe radial ring strength govern the operating envelope for the E-glass Kevlar-49 design. Analy-sis indicates that the optimum inside to outside radius ratio for the outer ring is approxi-mately 0.85, and the corresponding energy density at burst for this design is approximately 26.5Wh/lb. This is a 30.7% improvement in predicted energy density over an E-glass disc without aKevlar-49 outer ring. It is noteworthy also that the interface pressure between disc and ring(at rest) for this optimized design is only about 2300 psi. The limiting value for this inter-face stress is considered to be 7400 psi for the Kevlar ring. Finally, it is interesting to notethat, as previously mentioned, for sufficiently thin outer rings (Rj/R0 > 0.95) no separationwill occur. For thicker rings, analysis indicates that a shrink fit is necessary to preventseparation within the wheel's operating range.
The interference fit chosen for the design of this hybrid wheel has a definite impact uponthe attainable energy density. Figure 3 describes the variation in the baseline design which canbe achieved by changing the interference fit between the disc and the ring. It can be seen fromFigure 3 that the energy density at burst for the shrink fit parameter <5 = 0.001 is 10% less thanthe attainable energy density for the baseline design with 6 = 0.002. Increasing the inter-ference parameter from 6 = 0.002 to 6 = 0.003 adds only about 4% in energy density. The benefitof increasing the shrink fit above s - 0.003 becomes increasingly less rewarding, since thebreakage of the circumferentially wound fibers in the ring now begins to govern, largely off-setting the improvements in the radial stress distribution of the ring. It should be pointed outthat on the basis of ease in fabrication, an interference parameter on the order of 6 = 0.002seems desirable.
In addition to the interference fit, the relative stiffnesses of the disc and the ring alsoplay a vital role in the design's performance. To prevent separation, the ring should be made ofa material with a larger specific circumferential stiffness (]i.\_/p) than the disc. However, thelongitudinal stiffness of Kevlar-49 composite can vary depending upon the fiber volume fractionachieved in winding. With this point in mind, analyses show that if the longitudinal moduli ofthe Kevlar-49 ring is reduced 10% to 10.8 x io6 psi, from the 12.0 x 10⁶ psi assumed in the designcharacterized by Figure 2, then the resulting energy density is reduced 13%.
Another material property which may vary based on the winding technique applied to ringfabrication is transverse strength. This property can also play a role in performance optimiza-tion. However, parametric analyses indicated that the expected variation in transverse strengthwould result in only about a ± 4% variation in attainable energy density with respect to thebaseline design of Figure 2.
LAMINATED S2-GLASS DISCS WITH KEVLAR-49 OR GRAPHITE OUTER RINGS
In order to improve the stored energy density of this flywheel design, S2-glass was alsoexamined as a candidate for the laminated central disc. In laminated form with an a-9 stackingsequence, the S2-glass offers almost 34% more strength than the E-glass as measured by standardtensile test. Since energy density is directly proportional to strength-to-density ratio, thiscould mean a substantial improvement in flywheel performance. On the other hand, the laminatedS2-glass disc is also about 20% stiffer than the laminated E-glass. This increased stiffness hasa detrimental effect upon the failure of the flywheel due to separation of disc and ring.
In order to quantify these effects, an optimization analysis was also applied to a hybridflywheel design consisting of a laminated S2-glass disc with a circumferentially wound outer ringmade of Kevlar-49. Results of this analysis indicated that although the S2-glass disc offeredhigher energy-density levels than the E-glass, an interference parameter of & = 0.003 would be
401

required to attain a 20% improvement in energy density by application of a Kevlar-49 outer ring.As can be seen from Fig. 2, application of a Kevlar-49 ring to an E-glass disc resulted in a 30%increase in energy density while also allowing smaller interference fits (6 = 0.002). Finally,the longitudinal stiffness of the Kevlar-49 outer ring would have an even more substantial effectupon the S2-glass Kevlar-49 hybrid flywheel's performance.
Since an outer ring made of a material with a larger specific modulus (E/p) than Kevlar-49could significantly improve the hybrid flywheel's performance, filament wound graphite epoxy wasconsidered as an alternative material for use in the outer ring. The disc and ring propertiesused in this design optimization are also displayed in Table 1 and the resulting design curvesare shown in Fig. 4. The performance of the hybrid flywheel with graphite ring characterized inthis figure is substantially different than the flywheel with a Kevlar-49 outer ring. First, thepredicted energy density is substantially higher, approaching 88 Wh/Kg (40 Wh/lb). At the sametime, lower interference fits can be used, thus simplifying assembly procedure. An interferenceparameter of s = 0.001 was used in this analysis. However, as can be seen from Fig. 4, sub-stantial energy densities can be reached without any interference fit if the outer ring is de-signed with an inside-to-outside radius ratio greater than 0.78.
FABRICATION
LAMINATED S2-6LASS DISCS
Material quality is always an important consideration in any structural member. For fly-wheels, quality as measured by strength-to-density ratios translates directly to improved energydensity. In addition, the previously discussed design analysis illustrated the impact of stiff-ness on the performance of the hybrid disc-ring flywheel. As a result, product quality has beenclosely monitored during this program. Consideration has been given to fiber-volume content,void fraction, and product uniformity of the wheels. In addition, fundamental gel characteristicdata has also been measured to insure similar cure and resulting quality in scaled up wheels tobe manufactured later in the program.
The laminated S2-glass discs under consideration are one-inch thick with nine or eleven inchoutside diameters and are fabricated with the hydroclaving technique. Variation in thickness hasbeen held to ± 0.002 inch. During a typical hydroclaving cycle the laminate disc is first heldunder a vacuum at elevated temperature. For relatively thick discs, it is felt that this methodmore efficiently eliminates the voids caused by trapped air and solvent vapor than the platenpressure applied during compression molding. Furthermore, in the second phase of the hydroclavingprocess, heat and hydrostatic pressure are applied to the laminates through a heat-and-pressuretransfer medium in a compounding tank. This approach enhances uniformity of thick laminates incomparison to compression molded discs. After lay-up and cure, the unmachined discs are elasto-merically bonded to an aluminum hub. The outer diameter is then machined using the hub as thecenter and the flywheel disc is dynamically balanced to within 0.25 gm-cm. Twenty laminateddiscs have been produced to date.
A number of these laminated wheels have been subjected to destructive tests to determinefiber-volume content, void fraction and uniformity. Uniform, quality material has been attainedin both the 10 and 12-inch discs. Void content has been held below 2% and the photomicrographsin Fig. 5 illustrate the marked improvement in this area with respect to previous 1-inch thicklaminated discs manufactured with compression molding techniques. The 48% fiber volume contentattained is perhaps 4 - 5 % less than what might be expected from compression molding of thinnerlaminates and can probably be explained in terms of the lower pressures (~ 100 psi) applied duringconsolidation with hydroclaving in comparison to compression molding.
FILAMENT WOUND OUTER RINGS
The outer rings for the hybrid flywheel will be filament wound on mandrels with the use ofcomputer controlled filament winding equipment. Details of the process used to produce theserings are given in Ref. 6. The void content in the Kevlar-49 rings ran from 4.5 - 5.5% while thevoid content in the graphite rings was measured as 0.95%. The relatively large void content ofthe Kevlar-49 rings in comparison to the graphite can be attributed to better wettability of thegraphite fibers. Vacuum bagging of the Kevlar-49 ring during cure did not appear to improve thevoid content. The fiber volume fraction for the Kevlar-49 rings has been measured as 69 - 70%while the fiber volume fraction for the graphite is approximately 63%. The photomicrographs of
402

Fig. 6 compares the cross section of a filament wound Kevlar-49 ring with the cross section of aring manufactured from preimpregnated Kevlar-49 tape. The superiority of the filament wound pro-duct in terms of fiber volume content is already visible. This sort of quality improvement trans-lates directly into higher circumferential stiffnesses and strengths, both vital ring character-istics previously discussed in the design analysis.
TESTING
The spin-pit facility used in this program is instrumented to collect a variety of data.The RPM-time history is monitored digitally as well as recorded on a strip chart. A secondstrip chart simultaneously displays the time histories of turbine RPM, tank vacuum pressure andshaft orbit magnitude. Tests are generally conducted at vacuum levels of 50 to 100 u of mercury.In addition, an attempt is being made to photograph failure of the flywheels. Breakage of thinwire wound on a shroud surrounding the flywheel is designed to set off a photographic flashduring failure.
Six spin tests have been conducted to date and the associated test results are presented inTable 2. Three of the tests involved laminated S2-glass discs without outer rings and three haveinvolved laminated graphite discs supplied by the Lawrence Livermore Laboratories. One of theS2-glass tests terminated in a system failure associated with the air turbine bearings and is notconsidered indicative of a flywheel failure. The highest energy density attained with a laminatedS2-glass test was 40.1 Wh/Kg (18.2 Wh/lb). One of the graphite wheel tests was nondestructive.C-scans were taken of the wheel before and after spinning the wheel to 35,000 RPM. Comparison ofthe results of these C-scans revealed no noticeable damage accumulating in the wheel at this level.The flywheel was subsequently broken at 48,200 RPM reaching an energy density of 51.5 Wh/Kg (23.4Wh/lb). The initial results displayed in Table 4 for both the S2-glass and the graphite laminateddiscs, indicate tip speeds attained to date in experiment are less.than the levels that wereoriginally expected. For the S2-glass, it was originally expected^ that a disc without holesshould reach approximately 884 m/s (2900 f/s). This corresponds to roughly 52 Wh/Kg (24 Wh/lb)energy density. These predictions were fundamentally based upon the assumption that failurewould occur when the stress in the center of the disc reached a level sufficient to break fibersat that location.
The lower failure speeds of the laminated S2-glass discs tested to date, and the presence ofvery fibrous debris after wheel bursts seem to call initial assumptions with regard to failuremechanisms in the laminated S2-glass flywheels into question. Although initial estimates withrespect to the ultimate strengths and speeds of these wheels were based upon the assumption thatthe wheel would fail when fibers were broken, burst tests to date have resulted in very fibrousdebris indicating minimal fiber breakage. Figure 7 compares debris from an elastomericallybonded S2-glass test with debris from a previous test made on an E-glass disc with bolted attach-ments. In two of the S2-glass tests, failure was associated with a rapid decrease in turbinespeed as shown in Fig. 8. It has been hypothesized that this effect is a result of a sudden in-crease in the flywheel's moment of inertia. In this light, failure modes associated with matrixdamage must be considered more closely. It is experimentally established that matrix damageoccurs at stress levels substantially less than the ultimate stress during tensile tests oflaminated coupons. This matrix damage in laminae oriented at an angle to the loading directioncan be identified by a change in the Young's modulus of the laminate. The approximate stresslevel at which such damage occurs can also be identified with classical laminate analysis. Theeffect of such matrix damage upon a flywheel disc at relatively low tip speeds must be calledinto question.
The presence of the balanced biaxial stress state at the center of the disc, forces thestresses in the individual layers of the disc to be identical throughout the thickness. As aresult, all pf these laminae will fail transversely at the same average stress level. A classi-cal laminate analysis of an S2-glass disc reveals that the matrix at the center of the disc willbegin to experience transverse failure at a balanced biaxial stress of only 134 MPa (19 ksi).This corresponds to a tip speed of approximately 387 m/s (1271 f/s). Of itself, this matrixfailure is not catastrophic since it is extremely localized in nature. The fibers still carryload through the center and are "potted" in undamaged epoxy farther out along the radius of thedisc. However, as the wheel accelerates from 387 m/s the area of matrix failure will spread outfrom the center over larger areas of the laminated disc. Eventually, the region of matrix failuremay spread over a region substantial enough to cause the ultimate failure of the disc - either asa result of associated wheel imbalance and shaft failure or as a result of final, rapid damage
403

propagation to the edge of the disc.
Although this sort of failure criterion is consistent with the debris observed to date,additional information is still required to measure its validity. C-scan information will ')eutilized in an attempt to identify this type of failure. It appears that in the nondestructivetest of the graphite wheel, a speed high enough to initiate substantial matrix damage may nothave been attained before the second C-scan. If such damage does indeed contribute to thefailure of laminated flywheels, a more flexible resin or stiffer fibers could help alleviate theproblem.
CONCLUSIONS
The hybrid disc-ring flywheel design has been analytically optimized for maximum energydensity. Parameter studies have been made to establish effects of mechanical property variation.The S2-glass disc with graphite outer ring appears most attractive from these analyses. Qualityfabrication of both laminated S2-glass discs and filament wound Kevlar-49 and graphite outerrings has been achieved. Tests are underway to experimentally determine achievable energy densitylevels with this design. Initial results indicate that matrix damage of the laminated discshould be closely considered.
REFERENCES
1. Lustenader, E. L. and Zorzi, E. S., "A Status of the 'Alpha-Ply' Composite Flywheel ConceptDevelopment," presented at SAMPE meeting, Anaheim, California, May 3, 1978.
2. Huddleston, R. L., Kelly, J. J., and Knight, C. E., "Composite Flywheel Development Com-pletion Report," (May 1 - September 30, 1976), Oak Ridge Y-12 Report Y-2080, May 1977.
3. Hatch, B. D., "Alpha-Cross-Ply Composite Flywheel Development," presented at 1977 FlywheelTechnology Symposium, October 5-7, 1977, San Francisco, California.
4. Rabenhorst, D. W. and Small, J. R., "Composite Flywheel Development Program: Final Report,"Johns Hopkins Applied Physics Laboratory Report SD0-4616A, April 1977.
5. Kulkarni, S. V., Stone, R. G., and Toland, R. H., "Prototype Development of an Optimized,Tapered-Thickness, Graphite/Epoxy Composite Flywheel," Lawrence Livermore Laboratory ReportUCRL-52623, November 1978.
6. Nimmer, R. P., Torossian, K. A., Hickey, J. S., and Wilkinson, J. P. D., "Laminated CompositeDisc Flywheel Development, First Semiannual Report," General Electric Research and DevelopmentCenter Report SRD-79-016, January 31, 1979.
404

RDC-23151-51
40
30
ENERGYDENSITY
AT BURST(WH/LB)
JO
10
-
.»
, _
- N O CRINCPOS
\ \
\X-
ISCSEPARATION
5IBLE
1
6 0 002
x:i
CIRCUMFERENTIALRING FAILURE
^ a - DISC FAILURE
•"»„, DISC-RINGSEPARATION
^ RADIAL RINGFAILURE
1 1
50.0
40.0
30.0
20.0
10.0
0
DISCFAILURE >>
NOSEPARATION
f
5 =0.001
\
\
>p
CIRCUMFERENTIALRING FAILURE
1.0 0.90 0.70
Fig. 1. a-Ply Disc with Kevlar-49 and GraphiteOuter Rings.
O.BOR,/Ro
RATIO OF INSIDE TO OUTSIDE RADII OF RING
DISC-RINGSEPARATION
RADIALRING FAILURE
0.6O
RDC-23151-54
Fig. 4. Design Curves for an S2-Glass Discwith Graphite Outer Ring.
H7SL*rga lnt»fl»minir Voldi
Fig. 5. Reduced Void Content.
117*Improved Umiruta1.6% Void Contant
RDC-23161-55
R/RRATIO OF INSIDE TO OUTSIDE RADIUS OF RING
RDC-23151-52
Fig. 2. Optimization Curves for the BaselineShrink Fit Design; E-Glass, a-9 Discwith Kevlar-49 Outer Ring.
ENERGYDENSITY
AT BUHST(WHLB)
0 001 0 002 0 003
INTERFERENCE PARAMETER .', (,', - h >
Pralmpragnatad Tapa
Fig. 6. Improved FiberOuter Rings.
Computar-ControNadFHamant Wlndkig
RDC-23151 -56
Volume Content in
ROC-23151-53Fig. 3. The Effect of Interference Fit
Parameter & on Flywheel Energy Densityfor the Baseline E-Glass Disc withKevlar-49 Ring.
405

TABLE 2TEST DATA SUMMARY
S2glas» Diec;Elaetomaric Bond
E-glMa Diac;Sorted AttiAttachments
RDC-23151-57
Fig. 7. Comparison of Debris from Burst Tests.
80,000
70,000
60,000
50,000TURBINE
SPEED
l r p m l 40,000
30,000
20,000 (-
10,000 [-
13
TIME (miniRDC-23151-58
S2 Glass•Epoxy
S2 Glass•Epoxy
S2 Glass•Epoxy
Graphite•Epoxy
Graphite•Epoxy
GraphiteEpoxy
STACKINGSEQUENCE
(0MS/45/S0)
(0/90/45/-4B)
(0/M/45/-45)
(W90/45/-45)
OUTSIDEDIA.cmtin)
22.54(8.6)
22.54(1.8)
22.54(8.B)
31.1(12.25)
34.3113.51
34.3(13.5)
TIP SPEEDAT BURST
m/a(lit)
760124*5)
73212230)
619120321
725(23781
628*120611
86212827)
t a = Angle Between Fibers of Adjacent Plies
"Nondestructive Test
ENERGY DEN.AT BURST
WhfKg(Wh)lb)
40.1(18.21
31.9114.51
26.6(12.11
36.3(16.51
27.4"112.42)
51.5123.4)
RDC-23151-60
Fig. 8. RPM Time-History of Laminated S2-GlassBurst Test.
TABLE 1MATERIAL PROPERTIES USED IN ANALYSIS
a-9 E-Glass Disc Properties
E = 2.6 X 10* psi> = 0.3
p = 0.066 Iblin3
o-9 S2-Glass Disc Properties
E - 3.05 X 10* psiv « 0.264
Kevlsr4» Outer Ring Properties
EL = 12.0 X 10* psiET - 0.7 X 10* psi
„„ = 0.35
"Lull = 1 > ° k "Oj ' =1.6ks!
p = 0.06 Iblin3
Unidirectional Material Properties forTypical Graphite Epoxy Composite
EL = 21.0 X 10s psiET - 1.4 X 10s psi
vL T=0.3ot - 2 5 9 ksi
"-j la^'Ln3
RDC-23151 -59
406

Project Title:
Principal Investigator:
Organization:
Project Goals:
Project Status:
Contract Number:
Contract Period:
Funding Level:
Funding Source:
PROJECT SUMMARY
"Low Cost Flywheel Demonstration"
David W. Rabenhorst
Applied Physics LaboratoryThe Johns Hopkins UniversityJohns Hopkins RoadLaurel, Maryland 20810301/953-7100
Demonstrate feasibility of producing flywheels for $50 per kwh, orbetter.
Develop low loss, long life bearings.
Demonstrate low cost flywheel and low loss bearings in a completeenergy storage system.
Project was successfully completed on May 31, 1979, and all goals weresatisfactorily achieved. The principal recommendation was for theengineering development of a full scale home-sized flywheel energystorage system.
EC-77-C-01-5085
FY 1978 and 1979
$355,190
U. S. Department of Energy, Division of Energy Storage Systems
407

DEMONSTRATION OF A LOW COST FLYWHEEL IN AN ENERGY STORAGE SYSTEM
David W. RabenhorstApplied Physics Laboratory
The Johns Hopkins UniversityLaurel, Maryland 20810
ABSTRACT
The Applied Physics Laboratory has been engaged for the past eighteen months in a programfor the Department of Energy involving the development of very low cost flywheels, such as thosewhich would be used in individual home or factory energy storage systems. A significant part ofthis program also included the development of low loss, long life bearing systems.
The flywheel development explored a number of promising low cost materials and producedflywheel configurations which were projected for a large scale production cost of about $50 perkilowatt hour. While this is comparable to the initial cost of competing lead-acid batteries,it is noted that, unlike the batteries, the flywheel would not have to be replaced several timesduring the life of the system.
The bearing systems evaluated were based upon the use of otherwise conventional ball bear-ings which were arranged in special configurations so as to minimize their requirements for sizeand rotation speed. Bearing configurations were demonstrated which exhibited losses of the orderof one watt per one hundred pounds of flywheel.
The success of this program warrants consideration of proceeding with a full scale systemdemonstration, based upon the design projections of the subject program.
INTRODUCTION
The Applied Physics Laboratory of The Johns Hopkins University (APL) has been engaged forthe past ten years in a variety of programs dealing with modern flywheel technology, flywheelcomponent and system design, flywheel applications, and the study of various flywheel programsin the United States and throughout the world. During the course of these programs it was con-cluded that many important flywheel applications would depend upon the development of very lowcost flywheels and flywheel system components. It was noticed that most of the flywheel researchprograms throughout the world were aimed at the development of flywheels capable of high energyto weight ratios and energy to volume ratios, with relatively little concern for the energy perunit cost that would justify the use of the flywheels in these applications. At the AppliedPhysics Laboratory emphasis was placed on the development of flywheel configurations having avery low cost potential. And here it should be noted that a low cost flywheel not only involvesvery low cost flywheel materials, but also very definitely requires consideration of simple, lowcost fabrication procedures.
The APL/Department of Energy low cost flywheel demonstration program was initiated on Octo-ber 1, 1977, and was brought to a successful conclusion on May 30, 1979. Total cost of this pro-gram was $355,190. All primary objectives were successfully achieved as follows: A full-size,1000 watt hour flywheel was demonstrated which had an estimated cost in large volume productionof approximately $50. per kilowatt hour. A ball bearing system was developed whose total losseswere comparable to the total losses in a totally magnetic suspension system. The low cost fly-wheel was successfully and repeatedly demonstrated in a complete flywheel energy storage systembased upon the use of ordinary house voltage and frequency. The experience gained in the hard-ware program was used to project the system design into a complete full-scale 30 kwh home typeflywheel energy storage system.
DISCUSSION OF APPLICABLE FLYWHEEL CONFIGURATIONS
The Laboratory had been experimenting with two flywheel configurations which appeared tooffer significant possibilities in the area of very low cost flywheels. The first of these wascalled the pseudo-isotropic or quasi-isotropic disc flywheel. The basic configuration of this
408

flywheel 1s illustrated in Figure 1, where it can be seen that the flywheel is composed of alter-nate layers of unidirectional composite material arranged precisely so that the resulting overallcomposite exhibits an isotropic stress capability in the plane of the flywheel. The most obviousadvantage of the pseudo-Isotropic configuration is the fact that it has a very high energy perunit volume, inasmuch as it occupies 100% of the spinning swept volume of the flywheel. It wasbelieved that a second major advantage was the overall simplicity of fabrication of this type ofconfiguration; however, it was subsequently determined that the fabrication of the pseudo-isotropic flywheel material was quite labor-intensive, and therefore involved higher fabricationcosts than was initially believed to be applicable.
Another problem was that for a given energy level, the pseudo-isotropic disc flywheel wouldhave to spin at approximately twice the rotational speed of a wound flywheel configuration. Thesystem studies had shown that anything that could be done to reduce the effective rotationalspeed of the flywheel, and particularly of the rotating bearing elements, would constitute an ex-tremely important cost-reduction factor over the 10-year life cycle of a flywheel energy storagesystem. Also, since the design intent for optimum economy in the pseudo-isotropic flywheel isto equalize the stress throughout the flywheel disc, it follows that the failure would be cata-strophic. This catastrophic failure releases all of the energy in the flywheel at essentiallythe same time, which is considerably more difficult to contain than in the case of the woundbare filament flywheel failure, where the failure is distributed over a much greater time. Thisis illustrated dramatically in Figure 2. Here we see the failure effects on two steel contain-ment rings made from one-quarter inch cold rolled welded steel. The fragments of the ring inthe background result from a single spin test to destruction of an eleven pound pseudo-isotropicflywheel containing a total energy of only 300-watt hours. The ring in the foreground made fromthe same material to the same general construction, is one which has survived more than 50 barefilament flywheel tests to destruction, many of which were at a much greater energy to weight ra-tio and total energy than was the pseudo-isotropic flywheel involving the ring in the foreground.
The flywheel configuration selected as having the most desirable features for the very lowcost flywheel is the wound bare filament configuration illustrated in Figure 3. Here it can beseen that, since all of the bare wound filaments are lined up nearly precisely with the tangen-tial force field, and since these tangential stresses vary as the square of the radius from thecenter of rotation, it is theoretically impossible for all of the tangential filaments to failat the same time. This fact has been proven repeatedly through dozens of spin tests of this barefilament flywheel configuration.
The absence of the matrix material throughout most of the flywheel also serves to improvethe material use efficiency in the flywheel fabrication. Like in other wound flywheel configu-rations, the performance is also related to the relationship between the inside wound diameterand the outside wound diameter of the flywheel. Maximum performance is achieved when the ratioof inside to outside diameters is unity. If tna inside wound diameter were zero (that is, awound solid disc), then the performance of the flywheel is exactly one-half of what it would bein the case of unity ratio.
Since the wound portion of the flywheel is a relatively thin ring, it was necessary to de-velop a suitable hub arrangement to permit the connection of this ring to the flywheel metalattach hub and rotating shaft. The requirement that the hub be capable of surviving at leastas high a rotational speed as the wound filament without the presence of these filaments waseasily met with hubs made from birch plywood. It was found that tapering plywood hub providedadditional structural efficiency of the hub material, by allowing a reduction in its weight andassociated cost. In the final configuration the plywood hub arrangement accounted for aboutfour or five percent of the total weight of the flywheel. The metallic hub, which was used toprovide the junction with the flywheel shaft, was bonded to the cellulosic hub by means of asuitable elastomeric bonding process. The elastomeric material readily accommodated the differ-ence in expansion rate (due to rotation) between the metal hub and the cellulosic hub.
The inner flange of the metallic hub was arranged to be adjusted radially in any directionin order to permit shifting the spin axis of the flywheel in the direction of imbalance, in or-der to achieve proper spin balance of the entire assembly. Once the correct location was estab-lished, the inner movable flange was epoxied in place. The installation of the flywheel in theenergy storage system involved the use of a relatively long thin flexible shaft which couldeasily accommodate any residual imbalance resulting from the initial balancing procedure. Coststudies of this configuration showed that In large scale production the target of $50. per kilo-watt hour of the fabricated flywheel could be readily achieved.
409

APPLICABLE LOW COST FLYWHEEL MATERIALS
The primary requirement for the low cost flywheel material is of course strength to weightper unit cost, which translates simply to energy per unit cost. However, while this is clearlythe most important requirement, there are certain other requirements which must be met in anymaterial considered for low cost flywheel application, and many materials were eliminated by vir-tue of not being able to meet these secondary requirements. The materials must be available inbillions of pounds. The material must be available in a form which will readily permit economi-cal fabrication into a flywheel without introducing other complications which would mitigate itsintrinsic low cost capability. In consideration of all of these things, three materials appearto be outstanding at the present time for applicability to the very low cost flywheel. The firstof these is steel wire. The type of steel wire considered for this program is that which is usedin making high pressure hoses, and in automobile tire manufacture. Its properties are well known,including its static fatigue and cyclic fatigue capabilities. Its large volume production costcan be ascertained with great accuracy, and its availability and suitability for low cost fly-wheel construction is adequate. Flywheels wound with low cost, nigh strength steel hose wire canstore approximately 14 watt hours per pound, which, with their projected cost of around $.60 perpound, result 1n a rather marginal energy to cost ratio as demanded by the program objectives.
The principal problem areas encountered in this program with the steel wire flywheel fabri-cation all appear to be capable of satisfactory solution. The first of these is the "slickness"quality. This tends to make the steel wire difficult to hold in place without employing severehelix winding angles, etc. A number of solutions to the "slickness" problem are immediatelyapparent. The wire can be coated with any number of surface roughening techniques in the processof manufacture, such as cadmium plating, etc.
The main problem which was encountered in the program involving the steel wire low cost fly-wheels was that of the wire "cast". The cast of a wire is determined simply by cutting a lengthof the wire (usually one meter) and letting it drop on the floor and measuring the free diameterthat the coil forms. If this diameter is much less than the working diameter of the flywheelwinding process, the flywheel is likely to have a wavy pattern once it is taken out of the wind-ing mandrels. Fortunately, wire straighteners are employed throughout the wire manufacturingand processing community which can be installed in the flywheel fabrication process. The wirestraightener is a relatively simple device consisting of a number of orthogonally located rollershaving been ground to notches in the shape of the outside surface of the wire. The bare filamentwire wound flywheels tested in this program to date have been consistently successful, and mate-rial efficiencies of the order of 80% have been achieved.
The second low cost flywheel material selected for evaluation in this program is vinyl-impregnated fiber glass. This material is similar in some respects to the fiber glass tire cordused in the manufacture of automobile and truck tires, with one notable exception. This is thatthe flywheel vinyl impregnated fiber glass is extremely tough, and can even be bent and flattenedon Itself with a sharp crease without failure. In contrast, the fiber glass cord used typicallyin tire manufacture will instantly break when it is bent on itself. The process for the impreg-nation of the fiber glass strands is a proprietary development of PPG Industries, Inc. of Pitts-burgh, Pa. Tensile strength of this composite over relatively long periods (minutes) appears tobe of the order of 264,000 pounds per square inch.
The vinyl Impregnated fiber glass material appears to have excellent characteristics asapplied to the flywheel fabrication process. The material stays in place and packs very densely.Often the completed flywheel has the appearance of being a fiber glass epoxy structure, when infact, there is no epoxy matrix in the areas in between the radial bonded areas. The ruggednessof this material 1s also evident from spin test to destruction, and at least one of these testflywheels has been spin tested four times after being inadvertently dropped to the chamber floorat peripherial velocities exceeding 2000 feet per second. The loose strands were merely trimmedoff, and in severe cases the flywheel was rebalanced and then respun successfully.
There are two principal difficulties which have been encountered in the use of the vinylImpregnated fiber glass in the present program. First, the fiber glass wound flywheel occupiesmore volume because of Its lower useable strength (50% of the ultimate tensile strength wasassumed). This fact 1s somewhat compensated perhaps in other flywheel applications by the factthat the vinyl impregnated glass flywheel exhibits considerably higher energy to weight ratiothan the other two types tested, being closer to 20 watt hours per pound. The second problemwhich was encountered Is the fact that during the course of the program the vinyl Impregnated
410

fiber glass material suddenly became unavailable, since PPG elected to cease its experimentalproduction. Assurances were given that the reasons for PPG abandoning this material had nothingwhatever to do with its technical feasibility, but that the market for which it had been devel-oped did not materialize. It was stated, on the other hand, that the process by which this ma-terial was made could readily be licensed to any material processer who would so desire.
The third material to be evaluated in the low cost flywheel program was Metglas* amorphousmetal ribbon. This material is a proprietary substance being developed by the Allied ChemicalCorporation of Morristown, New Jersey. Metglas ribbon is a metallic alloy which, being amor-phous, exhibits many glass-like properties. The form primarily used in the subject program wasa one half inch wide ribbon having a .002 inch thickness. Thus it can be seen that one of theprincipal advantages of Metglas ribbon in the flywheel fabrication process is the fact that itcan be wound to a given form about two orders of magnitude more quickly than a filamentarymaterial.
One of the problems with Metglas amorphous metal ribbon is that it has been a difficult ma-terial to achieve effective bond with the conventional epoxy materials. Allied Chemical reportsthat considerable progress has been made on the Metglas ribbon bonding problem, and a number ofpromising thermo-setting resins are now available for this purpose.
Also, Metglas ribbon is a relatively new material, and consequently it would be some timebefore its actual production cost will have been established. It appears that in large quanti-ties a Metglas metal alloy suitable for the low cost flywheel could cost in the range of $1. perpound or less.
Another problem, also associated with the newness of the material, is the relative incon-sistency of the tensile strength in a given spool of Metglas ribbon. The Metglas ribbon used todate has been in the so-called "as-cast" condition, wherein the ribbon has somewhat ragged edgeswhen viewed under a microscope. Processes for chemically polishing these edges to result in a20 or 30 percent improvement in the tensile strength are well along, and should be well stabi-lized within the next several months.
Once these problems with Metglas ribbon have been resolved, this promising new material willbe applicable to the low cost flywheel field, and also will be the subject of a number of futureprograms in the vehicular flywheel field. This projection stems from the fact that the Metglasoffers a very high energy per unit volume, primarily by virtue of the fact that its ribbon for-mat allows nearly 100% of the wound structure to be occupied by structural elements, as con-trasted to the round steel wire format which typically only occupies 60% to 70% of the woundstructure.
LOW LOSS, LONG LIFE BEARING INVESTIGATIONS
The Applied Physics Laboratory's basic approach to the low loss bearing problem is to con-sider variations of configurations of conventional rolling contact bearings. By focusing the de-sign efforts on bearing load relief and bearing rotating element low rotational speeds, a seriesof bearing concepts have been demonstrated which appear to have extremely low losses and pro-jected long life times in the flywheel environment. Effectively, by lowering the bearing loadsto an absolute minimum and by holding the rotational speed to an absolute minimum, the bearingsthemselves can be made exceptionally small. It is obvious then that the smallest bearing willproduce the lowest losses for a given mass supported. It is equally obvious upon further studythat the bearing rotating at the lowest effective rotational speed will also produce the minimumlosses, while at the same time achieving orders of magnitude longer projected lifetime.
By hanging the flywheel on a vertical shaft, it can be seen that the principal axial loadon the bearing is that from gravity on the spinning mass. This axial load is reduced by the ap-plication of permanent magnets, which are designed to remove 95% of the gravity load of the spin-ning mass. This simple passive magnetic system (costing about $2, in production) could easilyhave been designed to remove 100% of the load; however, the bearings require a certain pre-loadin order to operate most effectively. Witn the flywheel shaft in a vertical position, the lat-eral loads imposed on the bearings result solely from flywheel imbalance. The residual imbalanceloads are effectively eliminated by placing the flywheel on a flexible shaft, which shaft nutates
A registered trade mark of Allied Chemical Corporation.
less than l/1000th of an inch due to the residual imbalance loads in the flywheel. Thus, in itsfinal Installation, the bearing loads are operating at only 5% of the initial axial load andprobably less than 15! of the initial radial loads. As a result, the bearings required to supportthe rotating equipment can be a tiny fraction of the size that would otherwise be required, thusallowing further reduction in losses.
The effective rotational speed of the bearings can easily be reduced by one of the followingmethods. First, if the bearings are functionally placed one within the other, as illustrated inFigure 4; and, if the geometry is so arranged that each bearing is the same diameter at the sametime, then the effective rotational speed of each of the bearings will be approximately half ofwhat it otherwise would have been without this series bearing arrangement. Spin tests of such abearing configuration (Figure 5) indicate that a bearing system of sufficient size to supportthe flywheel assembly had a total drag at 10,000 rpm of less than one watt, which is considerablylower loss than one would anticipate with a totally magnetic suspension system.
A second means of reducing bearing element effective rotational speed is illustrated in theFigure 6 sketch. Here the bearing rotating elements are simply placed inside of a much largerroller, so that the effective rotational speed can be reduced considerably, (sometimes as muchas a factor of ten). This concept will be particularly applicable to even higher performanceflywheels, where the rotational speed is considerably higher.
Due to the size of the flywheel and the energy level achieved, the nominal maximum rota-tional speed is 14,400 rpm. Using the series concept alone, the effective rotational speed isreduced to 7200 rpm. If, in addition to this, a slow roller configuration having only 5 to 1roller ratio were also employed, the effective rotational speed on the bearings would be 1440rpm. Needless to say, a bearing having only 5% of its design load and 10% of its design rota-tional speed would represent a considerable improvement in bearing losses and bearing projectedHfetire.
FLYWHEEL ENERGY STORAGE DEMONSTRATION SYSTEMS
As stated in the foregoing, one of the principal objectives of the flywheel low cost demon-stration program was to incorporate the flywheel into a complete energy storage system capableof operating in the typical individual home voltage and frequency requirements. Two systems weredeveloped during the program for this purpose. The first system involved an early checkout ofthe electrical equipment using off-the-shelf rugged components, etc., and an aluminum slab fly-wheel. This ruggedized system known as System #1 was utilized to check out the operating charac-teristics of the electrical equipment while the development work on the low cost bare filamentwound flywheel configuration was in process. In addition to working out the electrical systemproblems, the System #1 served a useful purpose in allowing the development of the proper fly-wheel suspension system to enable operation of the flywheel throughout its complete rotationalspeed range without encountering dangerous vibration at the various critical speeds.
The flywheel in this system is a laminated aluminum disc which, while storing only half theenergy of the final flywheel assembly, nevertheless operates at essentially the same rotationalspeed range as the #2 demonstration system. The motor/generator and control system are the sameas those in system #2. The rotating machine is a squirrel cage induction motor designed to op-erate between 3600 and about 15,000 rpm. Its design is based upon an off-the-shelf unit havingmoderately high performance.
The control system is designed to accept the energy from a 115 VAC source, transfer thisenergy Into the flywheel, allow storage of the energy in the flywheel for an unspecified period,and finally to transfer the energy from the flywheel into a 115 VAC electrical load. It receives115 volt, one phase, 60 Hertz Input power, rectifies it to a controlled level DC voltage, andinverts it to controlled frequency three phase AC voltage. The control system is arranged toprovide constant current per phase, so that the motor produces a constant torque up to the pointwhere the line voltage reaches 230 VAC at 120 Hertz. At this point the motor is producing inexcess of four HP. However, over the entire rotational speed range, the average power Input andoutput 1s of the order of two kilowatts. A block diagram of the electrical system 1s shown inFigure 7, while Figure 6 Illustrates the system components used In the #1 demonstration unit.
System #2 incorporates the optimized components to demonstrate the very low cost flywheelIn Its operating environment. The system Itself was not intended to be a very low cost system,Inasmuch as off-the-shelf parts were used throughout, and typically these were not optimized for
412

the system. The principal differences between this and System #7 were as follows: First, thebare filament flywheel (Figure 9) was substituted for the aluminum flywheel used in System #1.Secondly, small, magnetically unloaded oiled bearings were used in place of the ruggedizedsealed, greased bearings of System #1. The magnetic relief system is illustrated in Figure 10.This system employing inexpensive ceramic magnets is relatively small compared to the rest of thesystem. It should serve to increase the projected life of the bearings in this flywheel energystorage system to at least 10 years duration.
CONCLUSIONS AND RECOMMENDATIONS
There are a number of interesting conclusions and recommendations that can be drawn from thesubject program as follows:
CONCLUSIONS:
1. The very low flywheel production cost - $50. per kilowatt hour can be achieved withseveral available materials.
2. The best flywheel configuration for the low cost application appears to be the barefilament flywheel.
3. Magnetically load-relieved mechanical bearings look very promising for the low cost,long life flywheel system, as well as for other flywheel applications.
4. Operation of a flywheel energy storage system appears to be definitely feasible forthe individual home and other stationary applications.
5. The subject program involved a variable speed induction generator electronically con-trolled to produce a constant electrical output. The component costs of the systemchosen seem to warrant a thorough investigation of a constant speed generator with avariable transmission and flywheel system.
RECOMMENDATIONS:
1. The successes of the subject program appear to warrant the immediate institution of afull-scale home storage flywheel energy storage system program involving perhaps a 30kilowatt hour unit.
2. An in depth investigation of the merits of a constant speed generator system should beconducted.
3. Continued R&D on Metglas flywheels should be initiated in order to determine their ul-timate potential, not only for stationary flywheel energy storage systems but for ve-hicular flywheel systems as well.
Fig. 1 Pteudo-isotropic flywheel concept.Fig. 2 Containment comparison between P-l disc and
bare filament flywheels.
41-

Fig. 3 Typical bare filament test rotor.7
• Power How, rnotoring
• Power (low, generating
60 Hz. 1 phase116 Volt24 amp 14 400 to
7200 rpm12 amp 7200 to
3600 rpm
Stationary housing
Fig. 7 Block diagram of energy storage system.
Fig. 4 Series bearing concept.
Fig. 8 Demonstration system components.
Tapend hub nlate5
Fig. 5 Series bearing test assembly.
High rpm shaft
Low rpm disc
Small (low drag|
bearing
Steel wire ~" ' ^ "12.25 x 2.25 in.)
Fig. 9 Sketch of one kWh rotor.
Fig. 6 Slow-roller bearing concept. Fig. 10 Magnetic bearing relief unit.
414
PROJECT SUMMARY
Project Title:
Principal Investigator;
Organization:
Project Goal:
Project Status:
Contract Number:Contract Period:
Funding level:
Funding Source:
"Flywheel Evaluation Program"
Robert S. Steele, Jr.
Union Carbide CorporationNuclear DivisionP. 0. Box Y, 9998 MS-2Oak Ridge, TN 37830FTS 624-1837
To provide DOE with the ability to comprehensively evaluate highperformance composite flywheels.
Assembly of the basic spin test facility is complete. Facilitycapabilities will be demonstrated at the completion of FY 1979.These basic capabilities include determination of the ultimatespeed and momentum transfer at failure of flywheels performing atenergy levels up to 2 kWh.
W-7405-eng-26
October 1, 1978 - September 30, 1979
$175,000
Lawrence Livermore Laboratories
415

OAK RIDGE FLYWHEEL EVALUATION LABORATORY
R. S. SteeleUnion Carbide Corporation, Nuclear Division
P. 0. Box Y, Building 9998, MS 02Oak Ridge, TN 37830
ABSTRACT
The final assembly and proof testing of the Oak Ridge Flywheel EvaluationLaboratory (ORFEL) spin test facility has been completed as specified in the FY1979 goals for the Oak Ridge Y-12 Plant's flywheel program. The spin facility isqualified to test flywheels with energy levels of up to 2 kWh.
The comprehensive evaluation of a flywheel design requires that it be subjectedto several destructive and nondestructive tests, including detailed quantitativeanalysis of the test data. The consideration of these requirements is a majorfeature in the immediate plans of the ORFEL.
INTRODUCTION
The FY 1979 Oak Ridge Y-12 Plant* Flywheel Program goal is to complete the in-itial assembly begun in FY 1978 of the Oak Ridge Flywheel Evaluation Laboratory(ORFEL) and to begin the evaluation of prototype flywheels. This is in keepingwith our overall goal of providing DOE with the ability to comprehensively evaluatehigh-performance flywheels.
The current Y-12 program is an extension of the UCC-ND Composite Flywheel Dev-elopment program!1»2) initiated on May 1, 1976. That program was completed inSeptember 1977 with the design, fabrication, and testing of a band-wrap flywheeldesign. The FY 1978 Flywheel program!3) at Y-12 was concerned with the fabri-cation of a spin test facility capable of testing rotors with up to 2 kWh energylevels. This work was not completed in FY 1978 but carried over into FY 1979. Thecurrent status of that program is the subject of this paper.
* Operated by Union Carbide Corporation, Nuclear Division for the US Department ofEnergy.
416

The funding level in FY 1979 has been $175,000 and began in April 1979. Theschedule for the Oak Ridge Flywheel Evaluation Laboratory is presented in Figure 1.
1. FACILITY ASSEMBLY
a. SPIN PIT & INSTRUMENTATION
b. CALIBRATION WITH DUMMY
c. ULTIMATE SPEED SERIES
d. MOMENTUM TRANSFER SERIES
e. DATA PRESENTATION
2. PROGRAM PLANNING
3. PLANNED QUALITY
FY 1979
f |s MAR
APR
MAY I JU
L
TEST DATE-" fi1 1
TEST OATES— (
TEST DATES-"
REPORT DATE - "
AUG
SEP
£
FY 1980
OCT
AON is I
£-3
0
Fig. 1. Current Schedule for the Flywheel Evaluation Laboratory
FACILITY STATUS
The spin test area is located in Building 9766 at the Oak Ridge Y-12 Plantsite. The 10- x 10-foot spin pit and its instrumentation and control console arearranged in a 50- x 34-foot room as indicated in Figure 2.
FLYWHEEL EVALUATION LABORATORY FLOOR PLANBUILDING 9766
Fig. 2. Floor Plan of the Flywheel Evaluation Laboratory
417
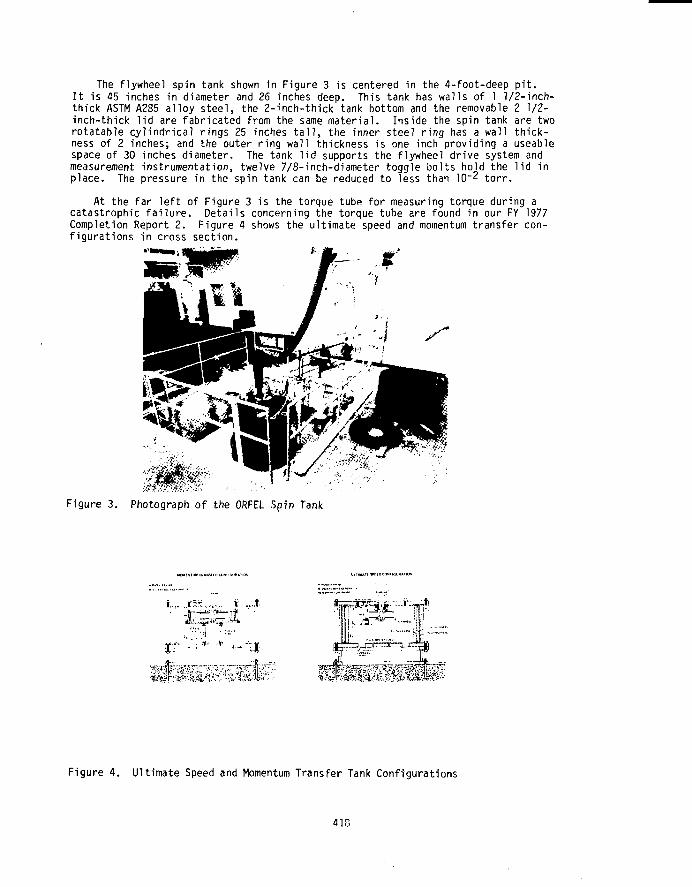
The flywheel spin tank shown in Figure 3 is centered in the 4-foot-deep pit.It is 45 inches in diameter and 26 inches deep. This tank has walls of 1 1/2-inch-thick ASTM A235 alloy steel, the 2-inch-thick tank bottom and the removable 2 1/2-inch-thick lid are fabricated from the same material. Inside the spin tank are tworotatable cylindrical rings 25 inches tall, the inner steel ring has a wall thick-ness of 2 inches; and the outer ring wall thickness is one inch providing a useablespace of 30 inches diameter. The tank lid supports the flywheel drive system andmeasurement instrumentation, twelve 7/8-inch-diameter toggle bolts hold the lid inplace. The pressure in the spin tank can be reduced to less than 10~2 torr.
At the far left of Figure 3 is the torque tube for measuring torque during acatastrophic failure. Details concerning the torque tube are found in our FY 1977Completion Report 2. Figure 4 shows the ultimate speed and momentum transfer con-figurations in cross section.
t,..
Figure 3. Photograph of the ORFEL Spin Tank
f jfSS.,,,-,. if ...,t
\W*r»-* I
Figure 4. Ultimate Speed and Momentum Transfer Tank Configurations
418

Fig. 5. ORFEL Instrumentation Console
The instrumentation a.id control console is currently configured as shown inFigure 5. The operati" " limits for the ORFEL test stand are as follow:
. Maximum kinetic energy of the test flywheel can be up to 2 kWh.
. Maximum rotational velocity can be up to 60,000 rpm.
. Maximum tank pressure during a test will be less than 10"2 torr.
. Maximum mass eccentricity of the test unit can be up to 0.020 inch duringthe test.
. Maximum couple unbalance of the test unit can be up to 175 in -lbs duringthe test.
. Test unit must fit within a 30-inch-diameter by 25-inch-tall cavity.
APPLIED PHILOSOPHY OF TESTING
The effort to develop a capability for comprehensive evaluation has requiredthe Y-12 program to determine not only what tests must be preformed but to developa philosophy of how they are to be carried out. First in our mind is that thefacility be safe for personnel. Several extensive safety reviews, drawing upon thewide expertise available in Oak Ridge, have been performed in an effort to meetthis criterion. Secondly, data acquired during a test must be quantitative ratherthan
419
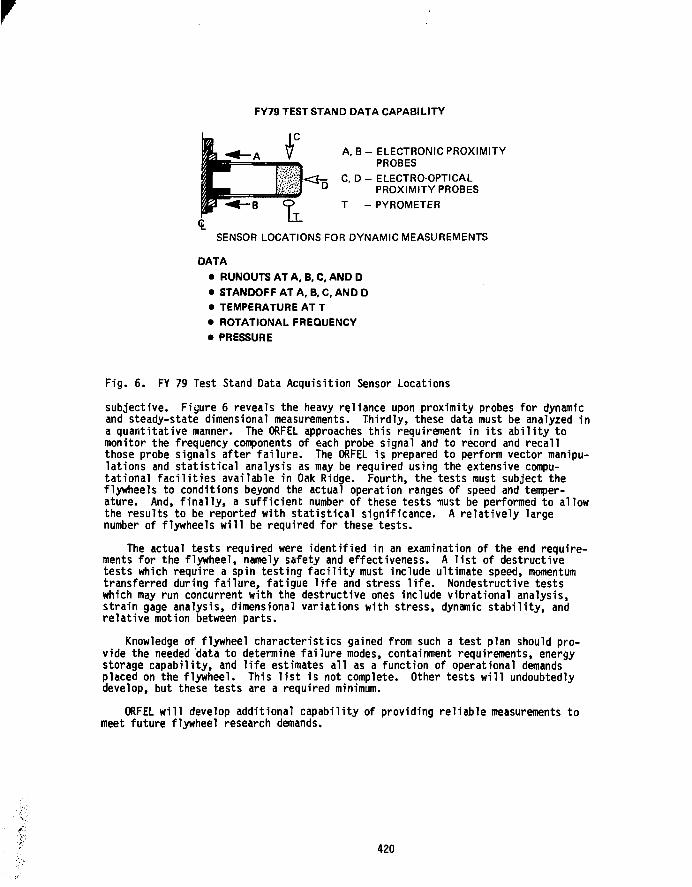
FY79 TEST STAND DATA CAPABILITY
A, B - ELECTRONIC PROXIMITYPROBES
C D - ELECTRO-OPTICALD PROXIMITY PROBES
T - PYROMETERIT
SENSOR LOCATIONS FOR DYNAMIC MEASUREMENTS
DATA
• RUNOUTS AT A, B, C, AND D• STANDOFF AT A, B, C, AND D• TEMPERATURE AT T• ROTATIONAL FREQUENCY• PRESSURE
Fig. 6. FY 79 Test Stand Data Acquisition Sensor Locations
subjective. Figure 6 reveals the heavy reliance upon proximity probes for dynamicand steady-state dimensional measurements. Thirdly, these data must be analyzed ina quantitative manner. The ORFEL approaches this requirement in its ability tomonitor the frequency components of each probe signal and to record and recallthose probe signals after failure. The ORFEL is prepared to perform vector manipu-lations and statistical analysis as may be required using the extensive compu-tational facilities available in Oak Ridge. Fourth, the tests must subject theflywheels to conditions beyond the actual operation ranges of speed and temper-ature. And, finally, a sufficient number of these tests must be performed to allowthe results to be reported with statistical significance. A relatively largenumber of flywheels will be required for these tests.
The actual tests required were identified in an examination of the end require-ments for the flywheel, namely safety and effectiveness. A list of destructivetests which require a spin testing facility must include ultimate speed, momentumtransferred during failure, fatigue life and stress life. Nondestructive testswhich may run concurrent with the destructive ones include vibrational analysis,strain gage analysis, dimensional variations with stress, dynamic stability, andrelative motion between parts.
Knowledge of flywheel characteristics gained from such a test plan should pro-vide the needed data to determine failure modes, containment requirements, energystorage capability, and life estimates all as a function of operational demandsplaced on the flywheel. This list is not complete. Other tests will undoubtedlydevelop, but these tests are a required minimum.
ORFEL will develop additional capability of providing reliable measurements tomeet future flywheel research demands.
420

IMMEDIATE FUTURE
By January 1980 the ORFEL will have demonstrated its basic capabilities by com-pleting the ultimate speed and momentum transfer tests using the UCC-ND bandwrapdesign flywheel. At that time we expect to begin evaluation of prototype flywheeldesigns for the Department of Energy's Mechanical Energy Storage program.
Concurrent with that work we must expand our capabilities to meet our user'sneeds. Of immediate need is a failure imaging technique and a flywheel brake foruse in fatigue testing. A third highly desirable testing capability is an early-warning-of failure detection technique. The quantity and quality of these develop-ment programs, of course, depend the funding support they receive.
SUMMARY
The Oak Ridge Flywheel Evaluation Laboratory will complete its FY 1979 objectivesand become a productive member of the high performance flywheel effort early in FY1980. Our basic capabilities will be testing for ultimate speed, failure mode, andcontainment requirements of prototype flywheel designs. A great potential existsfor their comprehensive evaluation using the considerable expertise available inthe Oak Ridge complex. The only constraints are time and money.
REFERENCES
1. R. L. Huddleston, J. J. Kelly, and C. C. Knight, Jr.; "Composite FlywheelDevelopment Completion Report" (May 1 - September 30, 1976), i-2080; UnionCarbide Corporation Nuclear Division, Oak Ridge Y-12 Plant, Oak Ridge,Tennessee, May 11, 1977.
2. R. L. Huddleston, J. J. Kelly, C. E. Knight, R. E. Pollard, and D. w. Post,"Composite Flywheel Development Completion Report" (October 1, 1976 - September30, 1977), Y-2117; Union Carbide Corporation-Nuclear Division, Oak Ridge, Y-12Plant, Oak Ridge, Tennessee, May 1978.
3. B. B. Smith, "Flywheel Test Facility" in Proceedings of the 1978 Mechanical andMagnetic Energy Storage Contractors' Review Meeting, Conf-781046, pg. 76.
421

Project Title:
Principal Investigators:
Organization:
Project Goals:
Project Status:
Contract Number:
Contract Period:
Funding Level:
Funding Source:
PROJECT SUMMARY
Army Flywheel Program
C.J. Heise, L. I. Amstutz
Army Mobility Equipment Research and Development CommandDRDME-EAFort Belvoir, Virginia 22060(703) 664-4587
To develop flywheel energy storage technology appropriate foraveraging peak loads on mobile electric power sources.
A steel flywheel energy storage module of 30 kWh capacity hasbeen designed and bui l t by Rocketdyne under contract numberDAAG53-75-C-0278. This equipment is being subjected to athorough checkout and evaluation. I t w i l l subsequently beincorporated into an electric power supply for further eva-luation.
In an attempt to improve safety while reducing weight andvolume composite rotor development has been undertaken inparallel with the steel flywheel ef for t . Contract DAAG53-75-C-0270 with AiResearch has resulted in multiring rim typerotors with storage capability in excess of 20 Wh/lb. Theserotors are at a stage of development where they may beseriously considered for incorporation in future energystorage systems demonstrations. Contract DAAG53-75-C-0269with AVCO has part ia l ly developed a more compact biaxialstrength rotor which has recently demonstrated storagecapability greater than 30 Wh/lb.
13-2369
FY 79
$132k
Sandia Laboratories, Albuquerque
423

ARMY FLYWHEEL PROGRAM
C. J. HeiseL. I. Amstutz
US A m y MERADCOMFort Belvoir, Virginia 22060
ABSTRACT
This paper describes the U.S. Army MERADCOM flywheel program with emphasis on theevaluation of a 30 kWh energy storage module. In this module advanced steel flywheeltechnology is used to achieve a high energy storage density. The systematic evaluationbeing undertaken will serve to confirm the design procedures and indicate where changesare needed. This information will be useful in guiding future energy storage systemsdevelopments.
INTRODUCTION
This paper is the result of cooperative DOE and DOD funding in the exploratorydevelopment of flywheel technology. The Army Mobility Equipment Research and Develop-ment Command, MERADCOM, at Fort Belvoir, became interested in mechanical energy storagefor use with Army electric power generating equipment in FY75. Since then MERADCOM hasmanaged a development program totaling $1,688/100 including $162,000 of DOE funds. Thisparticipation by DOE has been of critical importance in terms of realizing the greatesttechnological advancement from these efforts. The overall program includes three con-tracted efforts:
30 kWh steel flywheel energy storage module, Rocketdyne.
Multiring rim type composite rotor, AiResearch.
Biaxial strength composite rotor, AVCO.
DOE funds were used last year to partially fund testing of i multiring rim type rotorwhich had been built using Army funds. The results obtained contributed to furtherdevelopment work which has been funded exclusively by DOE. This multiring rim approachhas been extensively discussed in earlier proceedings ll« 2) and will not be furthertreated here. DOE funds were not directly applied to the biaxial strength rotor program,however, DOE participation in our overall program contributed to our ability to fundthe July 79 rotor tests at the Naval Air Propulsion Test Center. The test results wereinstructive and encouraging (>30 Wh/lb). This type of rotor is expected to be more ex-pensive than the multiring rim type but also considerably more compact. Additionalexploratory development will be required before such composite rotor is ready for in-corporation in an energy storage system development. The main topic of this paper isthe 30 kWH steel flywheel energy storage module. This module was designed and builtusi j DOD funds. DOE is providing a substantial portion of the cost of a systematiccheck out and evaluation of the module. It is expected that the information gainedduring this phase of the effort will contribute to future mechanical energy storageprojects.
This paper describes the 30 kWh module, gives anticipated performance character-istics, and describes the tests which are presently underway.
424
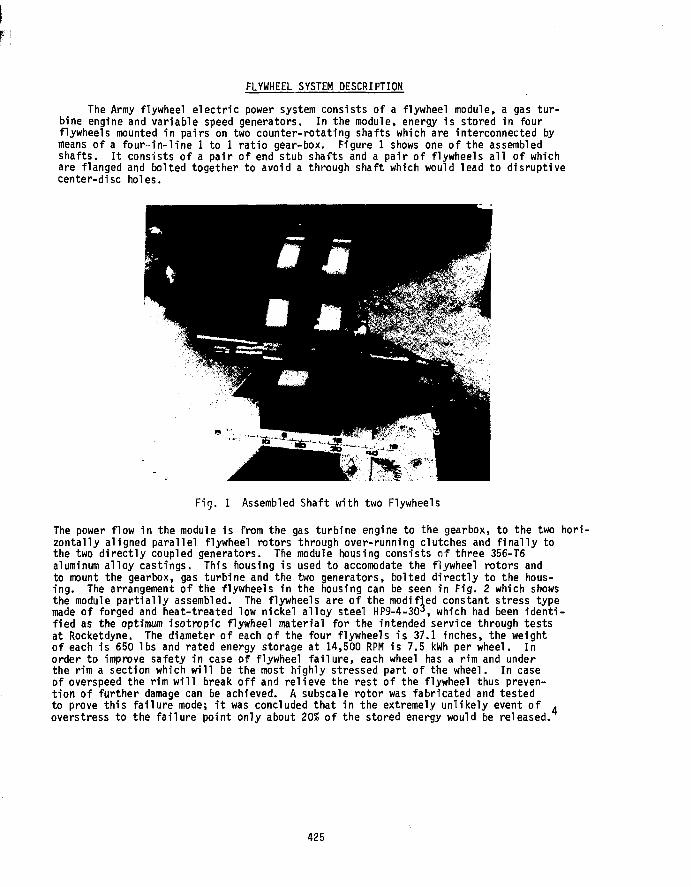
FLYWHEEL SYSTEM DESCRIPTION
The Army flywheel e lect r ic power system consists of a flywheel module, a gas tu r -bine engine and variable speed generators. In the module, energy is stored in fourflywheels mounted in pairs on two counter-rotating shafts which are interconnected bymeans of a four - in - l ine 1 to 1 ra t io gear-box. Figure 1 shows one of the assembledshafts. I t consists of a pair of end stub shafts and a pair of flywheels a l l of whichare flanged and bolted together to avoid a through shaft which would lead to disruptivecenter-disc holes.
Fig. 1 Assembled Shaft with two Flywheels
The power flow in the module is from the gas turbine engine to the gearbox, to the two hori-zontally aligned paral lel flywheel rotors through over-running clutches and f i n a l l y tothe two d i rec t ly coupled generators. The module housing consists o f three 356-T6aluminum al loy castings. This housing is used to accomodate the flywheel rotors andto mount the gearbox, gas turbine and the two generators, bolted d i rec t ly to the hous-ing. The arrangement of the flywheels in the housing can be seen in Fig. 2 which showsthe module par t ia l l y assembled. The flywheels are of the modified constant stress typemade of forged and heat-treated low nickel a l loy steel HP9-4-3CH, which had been iden t i -f ied as the optimum isotropic flywheel material for the intended service through testsat Rocketdyne. The diameter of each of the four flywheels is 37.1 inches, the weightof each is 650 lbs and rated energy storage at 14,500 RPH is 7.5 kWh per wheel. Inorder to improve safety in case of flywheel f a i l u re , each wheel has a rim and underthe rim a section which w i l l be the most highly stressed part of the wheel. In caseof overspeed the rim w i l l break o f f and rel ieve the rest of the flywheel thus preven-t ion of further damage can be achieved. A subscale rotor was fabricated and testedto prove th is fa i lure mode; i t was concluded that in the extremely unl ikely event o f .overstress to the fa i lu re point only about 20% of the stored energy would be released.
425

Fig. 2 Partially Assembled Hcusinq
In the module all four wheels will be surrounded by a barrier ring, the clearancebetween this ring and the flywheel rim will be used as a measure for the stress levelin the wheel. It was concluded in the subscale test that observing the reductionof barrier ring clearance is an effective indicator of rotor growth beyond the elasticlimit whether due to overspeed or overheating. If a flywheel does contact a ring, thering will begin to rotate causing immediate loss of energy and deceleration of the rotor.Size and weight of the assembled module not including the turbine engine and the twogenerators are shown' in Table 1.
TABLE 1. Dimensions and Weight of Module
Dimensions (inches)WidthHeightLength
weight (lbs)GearboxHousingShafts & ClutchesBarrier RingsRotor AssembliesMisc.
77.49.62.
527202175
11422990602
584
Total 7357
426

rCharacteristics of the flywheel module based on final calculation are shown in
Table 2.
TABLE 2. Flywheel Module Characteristics
Energy storage at 14,500 RPMOperating speed range
Material yield speedCrit ical speedsEnergy storage per 1b of rotorweight at 14,5000 RPM
min.max.
6,000 and
3010,50016,00017,60021,000
kWhRPMRPMRPMRPM
10 Wh/lb
This energy storage module is intended by the Army to be a high-performance unitwith a moderate cycle l i f e . One could view this same hardware as having a "ower energystorage rating but a long cycle l i f e and large safety factor. From this lat ter perspec-t i ve , the planned tests and subsequent Army use represent evaluation of the safety marginsand accelerated l i f e testing. Fig. 3 shows the fu l ly assembled module at the Rocket-dyne's plant.
Fig. 3 Fully Assembled Module
427

TEST PLAN DESCRIPTION
The objective of these tests is to perform a systematic characterizationuation of the 30 kWh energy storage module. It is the complete module incli.necessary auxilliary equipment which is the subject of the tests now in prom- :..this phase of the work is mainly concerned with the mechanical energy storage, thegenerators have been replaced by air turbines for the test. The air turbines can beused either as brakes or as drivers during the tests. The testing is divided into fourtests, I-IV. The plans for each of these tests will be described in turn. Fig. 4 showsthe schedule for the test.
tiieSince
Apr 12
Mar 29 iJun 22
I Aug 10
2 Wks FacilityPreparation
10 Wks
Sen 21 Oct 5
I I
System Installa-tion & Checkout
7 Wks
1
Testing
6 Wks
2 Wks I
Shin
Fig. 4 Test Schedule
TEST I.
This test is a preliminary check out of the ancillary equipment and the data system.The air turbines will be used to operate the flywheels below their first critical speed.This test will verify the operation of vacuum pumps, seals, lubrication system, etc.
TEST II.
This test will evaluate the performance of the system as it passes through thefirst shaft critical speed, which is below the normal operating speed range. Both rotorswill be driven through the resonance using the gas turbine engine. The performance ofthe bearings and supports will 6e noted and any adjustments indicated will be made beforeproceeding to other tests. It is expected that the module will not be harmed by slowpasses through this resonance zone.
428

TEST III.
This test will evaluate the effects of temperature and pressure on the module.When successful operation through the first critical speed has been demonstratedmeasurements of friction and windage losses will be made at moderate speed. Theselosses will be characterized over a range of lubricating oil temperatures and over arange of housing pressures up to about 100 torr. Temperature of the rotor, barrierring and housing will be monitored. The parasitic loss will also be similarly evalu-ated at higher speed but with the variations in temperature and pressure more restric-ted in order to avoid damaging the equipment. Within the constraint of not damagingthe module an attempt will be made to characterize an elevated pressure shut down.
TEST IV.
This test will evaluate the performance of the module in its intended operatingrange. The strain of the rotors will be monitored as a function of speed and tempera-ture. The energy storage module will be cycled using the gas turbine engine to chargeand the air turbines to brake. This test will include a brief excursion to the over-speed limit where the rotor strain will nearly close the gap between the rotors andthe barrier rings.
REFERENCES
1. Satchwell, D. L., "High Energy Density Flywheel," Proceedings of the 1978 Mechanicaland Magnetic Energy Storage Contractors' Review Meeting, October 1978.
2. Satchwell, D. L., "Rim Type Rotor," Proceedings of the 1979 Mechanical and MagneticEnergy Storage Contractors' Review Meeting, August 1979.
3. Anon., "Properties of Productive Product of HP 9-4-30 (Cr, Mo)," Republic SteelResearch Center, December 8, 1965.
4. Davis, Hodson, Heise, "Rocketdyne's High Energy Storage Flywheel Module for theU.S. Army," Proceedings of the 1977 Flywheel Technology Symposium, October, 1977.
429

Project Title:
Principal Investigator:
Organization:
Project Goals:
Project Status:
Contract Number:
Contract Period:
Funding Level:
Funding Source:
PROJECT SUMMARY
Application of Inertia Welding Technology to Steel Disc-TypeFlywheel s
Douglas L. Kerr
General Electric CompanyCorporate Research and DevelopmentSchenectady, New York 12301
Investigate the feasibility of applying inertia welding tothe fabrication of steel flywheel assemblies for trans-portation application.
The project has been completed. It consisted of threephases.
In Phase I, the inertia welding characteristics of threesteel alloys (Hy-Tuf, 4340, and D6AC) were investigatedby welding both solid bars and tubular specimens.
In Phase II, the feasibility of various "flash trap"designs was explored. The objective of these designswas to contain or shape the weld flash in such amanner as to make it unnecessary to machine the weldflash after welding. Tubular specimens were again used.
In Phase III, two simulated flywheel discs approximately6 inches in diameter were joined by inertia welding,then evaluated.
Major conclusions are as follows: a) Inertia welding ofboth Hy-Tuf and 4340 steel alloys is readily accomplishedin configurations desired for flywheel applications,b) Hy-Tuf is somewhat preferable to 4340. c) Crack-freeinertia welding of D6AC appears to be difficult to achieve,d) A flash trap has been developed which prevents the radialV-notch in the weld flash, but it has an axial notch areawhich might cause fatigue problems.
It is recommended that work be performed in evaluatingfatigue characteristics of inertia weld configurations,including further development of configurations whichmight enhance fatigue properties.
W-7405-ENG-48, Subcontract 2867209
25 September 1978 through 29 June 1979
$53,835
U.S. Department of tnergy through Lawrence LivermoreLaboratories
431

APPLICATION OF INERTIA MELDING TECHNOLOGYTO STEEL DISC-TYPE FLYWHEELS
Douglas L. KerrGeneral Electric Company
Corporate Research and DevelopmentBuilding 37-3801 River Road
Schenectady, New York 12301
ABSTRACT
This paper summarizes a program which investigated the feasibility of applying inertiawelding to the fabrication of multiple disc, steel flywheel assemblies for transportationapplication. The program was divided into three phases: Phase I - Establish InertiaWeldability; Phase II - Joint Geometry Considerations; and Phase III - Simulated FlywheelDisc Assembly.
It is concluded that inertia welding of certain steel alloys (Hy-Tuf and 4340, forexample) is readily accomplished in configurations desired for flywheel applications.Welds are sound and have good short term tensile properties. Future effort should beapplied to evaluating fatigue characteristics, including further study of configurationswhich might enhance fatigue properties.
INTRODUCTION
Work on flywheel energy storage was initiated by the Department of Energy (DOE) aspart of the energy conservation program. Initial emphasis has been on the applicationof flywheels to electric vehicles. In this connection, the General Electric Companyhas performed a series of flywheel design studies associated with the application of aninductor motor/flywheel energy storage package for transit bus applications. Thesestudies have been primarily aimed at determining a preferred steel flywheel configura-tion and evaluating various manufacturing techniques.
It has been concluded' ' that the flywheel configuration that best matches the in-ductor motor flywheel package concept is a multidisc design in which the individual fly-wheel discs are attached to each other and to the motor shaft by welding, by bolting, orby a shrink fit. In the case of a shrink fit, impracticably high shrink fits are re- •quired to achieve the energy density desired. In the case of the bolted construction,stress concentration factors in the vicinity of the bolt holes must be taken into account.In the welded configuration, the stress concentration factors are assumed to be negli-gible, but consideration must be given to the possible effects of reduced material proper-ties in the vicinity of the weld.
If a suitable means of welding flywheel discs together can be found, this form ofconstruction is expected to provide much better rotor performance (including lower weight)for a given value of ultimate tensile strength than the bolted construction. The inertiawelding concept may be applicable to a modular steel flywheel assembly. It accomplishesthe weld by friction and pressure — the parts are literally spun together. GeneralElectric's Aircraft Engine Group has developed and applied the inertia welding concept inother applications.
In accordance with the foregoing, this program was established to investigate thefeasibility of applying inertia welding to the fabrication of steel flywheel assemblies
432

for transportation application. All of the experimental work was performed by personnel ofthe Aircraft Engine Group of the General Electric Company. Program direction was providedby personnel of the General Electric Company's Research and Development Center. Reference2 is the final report for the program.
BACKGROUND ON INERTIA WELDING '
In this process, rotational mechanical energy is dissipated between work pieces underaxial pressure, resulting in weld without melting. For this reason inertia welding is re-garded as a solid-state joining process. One piece that rotates at a high speed is pressedagainst a second piece which is fixed rigidly and is stationary. This rotational frictionremoves the metal interfaces away from the weld, producing a clean, defect-free product.This process is rapid and does not require an inert atmosphere even for welding activemetals such as titanium.
The metal that is extruded away from the interface during welding results in a weldflash appearing at the free surface(s). This weld flash forms a typical pattern as shownschematically in Figure 1, which indicates the flash that would form in an annular weld.This flash looks somewhat like a double breaking wave, with a radial V-notch forming be-tween the two halves. The depth and sharpness of this V-notch is a function of thematerials and also of the weld parameters utilized.
In general, it is undesirable to have notches in parts, especially when subjected tocyclic stresses. Consequently, this weld flash and the V-notch are normally machined offafter the weld is completed to form smooth, notch-free surfaces.
In the configuration of Fig. 1, however, it is not possible to machine off the V-notchon the inside radius. Since this type of configuration is desirable in multidisc flywheelapplications (See Fig. 2), one of the purposes of the program was to explore the feasibil-ity of various methods of containing or shaping the weld flash on the inside radius insuch a manner as to eliminate the V-notch and reduce the possibility of fatigue failuresdue to such a notch. Of course, it is also possible that with proper design, such a notchcould be tolerated safely. However, determination of whether this is a real possibilityrequires experimental evaluation for specific designs which was not part of this program.
PROGRAM DESCRIPTION
The program was divided into the following three phases:
PHASE I — ESTABLISH INERTIA WELDABILITY
The inertia welding characteristics of three steel alloys (Hy-Tuf, 4340, and D6AC),were determined by welding both solid bars (1-inch outside diameter) and tubular speci-mens (2-inch outside diameter by O.l-inch-thick wall). In addition, characteristics ofthe weld and the weld flash (that material extruded from the weld mating surfaces duringthe welding process) were evaluated.
In Phase I, a total of 13 solid bar welds were made, approximately four for each ofthe three alloy steels. Eighteen tubular welds were made, six for each of the alloysteels. All welds were austenitized, plus oil-quenched, tempered, then welded and post-weld tempered. Estimated ultimate tensile strengths of the materials just prior to weld-ing, based upon the heat treatment used, w.re 230,000 psi, 190,000 psi, and 220,000 psirespectively for Hy-Tuf, 4340, and D6AC.
All welds were cross sectioned and examined for weld defects, heat-affected zonepattern, and notch sensitivity.
433

PHASE II - JOINT GEOMETRY CONSIDERATIONS
The purpose of this phase was to explore the feasibility of various "flash trap" de-signs, whose objective is to contain or shape the weld flash in such a manner as to makeit unnecessary to machine the weld flash after welding. Tubular specimens (2-inch out-side diameter by 0.1-inch-thick wall) were again used.
A total of 38 welds and over a dozen flash trap designs were utilized in Phase II.(See Fig's. 3 and 4 for some of the designs.) All of the welds were appropriately heattreated before and after welding, and a minimum of two cross sections from each weld werecut and metallographically examined up to a magnification of 400X. Special polishingprocedures were utilized to reveal the presence of cracks (if any) and/or voids.
PHASE III - SIMULATED FLYWHEEL DISC ASSEMBLY
In this phase, two simulated flywheel discs approximately 6 inches in diameter werejoined by inertia welding, (see Fig. 5) then evaluated by sectioning and metallographyto determine the weld characteristics. Tensile tests were also performed on welded por-tions of the disc assembly. This assembly has shaft extensions. It was also sectioned,and a 75° segment was polished, photomicrographed* and delivered to Lawrence LivermoreLaboratories.
RESULTS
Phase I work demonstrated the good welding characteristics of Hy-Tuf and of 4340 andindicated that D6AC was questionable as a candidate material because of cracking. Nocracks were observed in any of the Hy-Tuf or 4340 specimens except one 4340 solid bar whichwas water quenched immediately after welding to see how severe a treatment it could take.All three solid bar D6AC specimens showed cracks, and two out of six tubular D6AC specimensshowed cracks.
In Phase II, the D6AC alloy showed poor welds in the first few samples and was droppedfrom further consideration on this program. Hy-Tuf exhibited somewhat more blunt V-notchcharacteristics than 4340, and so the remaining portion of the program concentrated onHy-Tuf material. However, it is believed that 4340 would make acceptable welds if otherreasons, such as cost or availability, made it desirable to use this material.
The first flash trap samples (butt weld, angle weld, and J-groove welds of Fig. 3)revealed cracks in nearly all of the welds. These are believed to be due to excessiverestraint on the inward flow of weld flash and/or the asymmetry of these configurationsfrom a heat flow and thermal stress standpoint.
Two modifications were then made to the J-groove design. These eliminated the crack-ing, but had numerous notch-sensitive areas. The plain slot configuration of Fig. 4 wasthen tried as a means of allowing some inward flow of weld flash but also to mechanicallyconstrain it in a manner as to eliminate the V-notch at the weld centerline. It is alsoa more symmetrical configuration. Results were promising, but not completely satisfactory.Welds did not exhibit cracks, and the radial V-notch was eliminated. One side of thewelds was smooth, but the other side exhibited an axial notch (or cold shut area) alongthe inner diameter of the tube. (See the schematic of Fig. 6.) Several modifications ofthis slot configuration were then tried, including one configuration which used stainlesssteel as an interface between the two pieces being welded. Results were of mixed success.The stainless steel samples produced results no better than those obtained without use ofstainless steel, and this approach was dropped.
The most promising flash trap configuration resulting from the Phase II work is the0.025 slot configuration of Fig. 4. It has somewhat more symmetry than the plain slot
434

configuration, yields welds without cracks, and eliminates the radial V-notch, but stillhas the axial notch shown schematically in Fig. 6.
Program constraints made it necessary to do no more work on flash trap configurationson this program.
The Phase III simulated flywheel disc assembly was then made without use of flashtraps according to the configuration of Fig. 5. Successful welds were made on the firsttry by scaling parameters from Phase I and Phase II.
Weld evaluation, including microexamination up to 400X, revealed no defects of anykind. An attempt was made to run short-term tensile tests of specimens cut from the an-nular weld area C of Fig. 5, but the annular geometry made this impracticable. Therefore,two tensile test specimens were cut from the axial welds A and B of Fig. 5, and short-term room temperature tensile tests were performed on these specimens. Results indicatedshort term ultimate tensile strength of these welds to be about 85% or more of the ultimatetensile strength of the parent material.
Figure 7 is a photograph of the 75° segment that was cut from this simulated flywheeldisc assembly.
CONCLUSIONS AND RECOMMENDATIONS
This program has demonstrated that inertia welding of certain steel alloys is readilyaccomplished in configurations desired for flywheel applications. Welds are sound andhave good short term tensile properties. It is not known, however, whether these weldshave adequate fatigue characteristics. In this respect, application of flywheels to tran-sit bus and other transportation applications requires fatigue cycle life on the order of10 cycles(l). This is considerably higher than used heretofore in flywheel applicationsand imposes a considerable constraint upon the design.
Because of these stringent fatigue requirements, it is recommended that additionalwork be performed in evaluating fatigue characteristics, including developing better, i.e.more fatigue resistant, flash trap or other types of configurations.
ACKNOWLEDGEMENT
Special recognition should be given to R. Dreisig of the Aircraft Engine BusinessGroup of the General Electric Company, who carried out all of the experimental work onthis program.
REFERENCES
1. "A Study of Flywheel Energy Storage for Urban Transit Vehicles," Phase 1 - FinalReport, Contract D0T-UT-60096T, General Electric Company, (16 September 1977).
2. "Application of Inertia Welding Technology to Steel Disc-Type Flywheels," FinalReport, Lawrence Livermore Laboratories Subcontract No. 2867209, General ElectricCompany (29 June 1979).
435
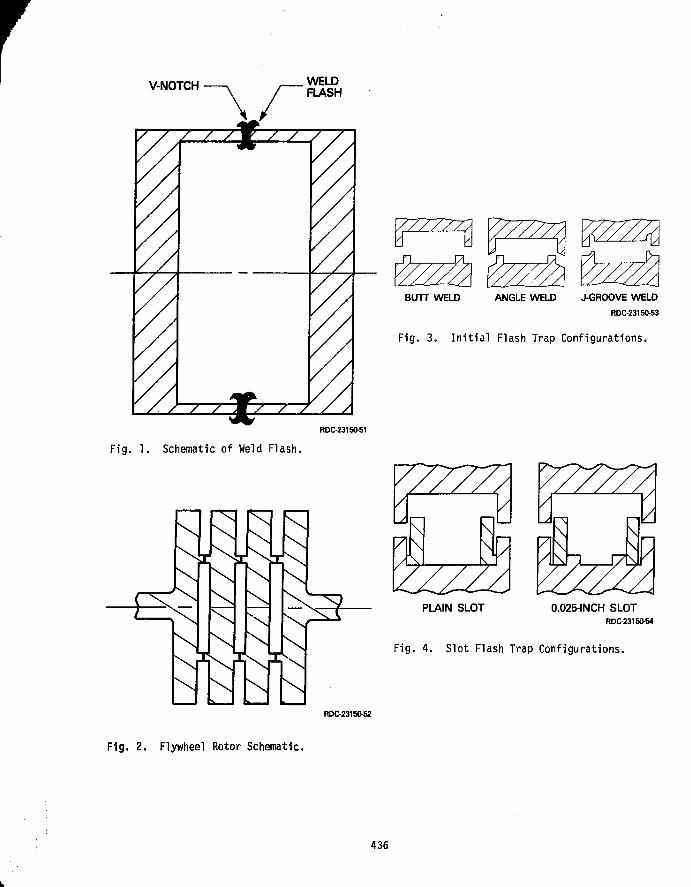
V-NOTCH WELDFLASH
/ / 7
/ / / m / / / / /
BUTT WELD ANGLE WELD J-GROOVE WELD
RDC-23150-53
Fig. 3. Initial Flash Trap Configurations.
RDC-23150-51
Fig. 1. Schematic of Weld Flash.
1
i
77771
I
I
I
I
/////
V77Z7A
PLAIN SLOT 0.025-INCH SLOTRDC-23150-54
Fig. 4. Slot Flash Trap Configurations.
RDC-23150-52
Fig. 2. Flywheel Rotor Schematic.
436

INERTIAWELD C
INERTIAWELD A
-0 .5
NOTE : ALL DIMENSIONS IN INCHESRDC-23150-55
BACK-UP PLUG
AXIAL NOTCH
WELD
RDC-23150-66
Fig. 6. Axial Notch with Slot TypeFlash Trap.
Fig. 5. Phase III Assembly.
RDC-23150-57
Fig. 7. Section of Simulated FlywheelDisc Assembly (Direct View).
437

rPROJECT SUMMARY
Project Title: "Flywheel-Engine Powerplant Research and Development Studies"
Principal Investigators: Norman H. Beachley and Andrew A. Frank
Organization:
Project Goals:
Project Status:
Contract Number:
Contract Period:
Funding Level:
Funding Source:
College of EngineeringUniversity of Wisconsin-Madison1513 University AvenueMadison, WI 53706
The basic objective is to provide a design analysis of a flywheel-engine power unit for a passenger automobile. The detailed tasks are:1) evaluate the potential of alternative powerplants for use with fly-wheel, 2) determine the lower level of friction that may be practicallyachieved 1n driveline components, 3) determine the most promising con-tinuously variable transmission (CVT) concept for a 2nd generation fly-wheel vehicle, 4) design safety features for the flywheel system, 5)prepare a preliminary layout drawing of the complete flywheel power-plant system suitable for installation in a production automobilechassis.
A preliminary study of alternative heat engine powerplants (Stirling,gas turbine, diesel piston, and gasoline piston engines) has been per-formed to determine their relative fuel mileage potentials. Otherpractical aspects still need to be investigated, such as the effect onengine efficiency and life of an on-off mode of operation.
Three continuously-variable transmission concepts have been identifiedas having efficiency, size, and weight characteristics satisfactoryfor a second generation experimental flywheel car. Preliminary designconfigurations have been developed based on these three principles,and design work is being continued with the goal of further simplifi-cation and reduction of friction losses.
Basic packaging configurations have been determined that will permitthe flywheel powerplant systems (for each of the three chosen CVT con-cepts) to fit in the engine compartment of a conventional front wheeldrive automobile. There is still much work to be done, however, on thedetails of mounting and interconnecting the various powerplantcomponents.
Considerable information on the friction characteristics of bearingsand gears has been collected that will aid In system efficiency calcu-lations, and also in the determination of what fuel economy improvementmight be obtained by attention to and optimization of these componentsin the driveline.
SUBCONTRACT 4492309
Feb. 5, 1979-Dec. 31,1979
$93,286.00
Lawrence Livermore Laboratory
439

MECHANICAL CONTINUOUSLY-VARIABLE TRANSMISSIONDESIGNS FOR FLYWHEEL ENERGY-STORAGE AUTOMOBILES
Norman H. Beach!ey and Andrew A. FrankUniversity of Wisconsin-Madison
1513 University AvenueMadison, Wisconsin 53706
ABSTRACT
In order to further investigate the concept of an energy storage flywheel powerplant system,a second-generation experimental automobile is planned. The purpose of the vehicle will be todemonstrate the commercial potential of the concept, its performance and fuel-saying characteris-tics, and to serve as a test bed for further research and development of the basic concept.Three continuously-variable transmission concepts are being evaluated and compared to determinethe best design to use in the experimental automobile. They are: 1) multi-speed gearbox withslipping clutch system; 2) hydrostatic power-split system; and 3) van Doorne steel V-belt system.The major transmission requirements are: 1) minimum energy losses under urban driving conditions;2) low weight and a size envelope that allows compact packaging; and 3) the capability of havingtorque control, and automatic control of all other required functions. The three concepts beingconsidered all appear attractive, and will be carried through to an assembly drawing stage withconcurrent analysis before a final choice is made for the construction of the experimental model.
INTRODUCTION
The concept of flywheel energy storage appears very attractive for significantly improvingthe fuel economy of passenger car vehicles under urban driving conditions. Studies have shownthat a 100% gain over current vehicles is clearly possible, and an experimental car based pri-marily on off-the-shelf components has experimentally demonstrated savings of about 50%.O»2)
The basic configuration that we have been investigating is shown schematically in Fig. 1.Although some of the power from the engine will pass directly to the drive axle, one can bestdescribe the concept by saying thit the car is driven by the flywheel, and that the engine isrun (at wide open throttle) to ,'echarge the flywheel only when its speed drops below some prede-termined value. The improvement 1n fuel economy comes from two factors: 1) the engine is runonly under most efficient conditions or not at all, and 2) the system allows efficient regenera-tive braking.
Engine calibratedfor low emissions &low bsfc ctfull-throttleoperation^uiiun-i
r\ r\ in nEngineclutch
rCVT clutch( i f req'd.)
Continuously-voriable
transmission
Standard rearaxle assembly
Flywheelpackage
Fig. 1. Schematic diagram of a flywheel hybrid automobile.
440

In order to match the speed of the flywheel and that of the car under all conditions, a con-tinuously-variable transmission (CVT) is required. Theoretical and experimental stud1esO>2)have shown that, with current technology, the CVT 1s the most critical component of the system;i.e., the component most likely to have the highest energy loss over a typical driving cycle.Table 1 shows the approximate breakdown of the energy produced by the engine 1n the University ofWisconsin experimental flywheel Pinto when driven over the EPA-CVS Federal Urban Driving Cycle.The average CVT efficiency in this case has been calculated to be about 76%.
TABLE 1. Approximate Energy Breakdownfor the University of Wisconsin First-Generation Flywheel Hybrid Automobile(EPA-CVS cycle, 2750 1b Test Weight).
Energy required from engine 10,126 hp-secEnergy recovered in regenerative braking 1,278 hp-secRoad load energy 3,392 hp-secEnergy lost 1n non-regenerative braking 209 hp-secEnergy lost in CVT 3,159 hp-secEnergy lost In 4-speed gearbox 516 hp-secEnergy lost in rear axle 516 hp-secEnergy lost in clutches 1,280 hp-secFlywheel spin loss energy 686 hp-secEnergy lost in flywheel gears 181 hp-secEnergy lost to engine inertia 185 hp-sec
Corrected fuel consumption = 32 mpg.
Even though a CVT may have high efficiency at conditions close to its design point, itsaverage efficiency will be much lower when operated over a typical driving cycle. Consider thata typical 3,000 lb car may need a CVT capable of transmitting about 100 hp to provide what mostdrivers would consider to be satisfactory performance. Over the EPA-CVS driving cycle, however,the average road load (average power required at the drive wheels of s. car with regenerativebraking)is about 2 3/4 hp with streamlining, tire characteristics, etc., that are typical of to-day's cars. The problem then is to develop a CVT that is capable of, say, 100 hp, but has verylow losses in the 0 to 5 hp range. The efficiency at or near full power Is much less significantsince it can be used for only a few seconds at a time except 1n hilly terrain.
In analyzing and evaluating CVT's, we have found it advantageous to work with loss valuesrather than efficiencies. This Is advantageous for several reasons. First of all, cars are of-ten driven at or near a condition of zero torque (I.e., coasting), and the concept of efficiencyis meaningless at zero power output. All transmissions have zero efficiency at zero power output,even though they may be dissipating widely differing amounts of friction power. The frictionpower, of course,decreases the fuel economy, and the required analysis is handled in this case byloss data. Friction data plotted on the basis of loss rather than efficiency also permit moreaccurate interpolation and extrapolation near values of low torque and/or low speed.
In order to further investigate the flywheel powerplant concept, a second-generation experi-mental vehicle 1s planned. In order to approach a true prototype vehicle, and thereby learn asmuch as possible about the concept that would apply to a production vehicle, the design specifi-cations will be quite strict. First of all, the vehicle will have front wheel drive, since thisreduces the chance of vehicle Instability from regenerative braking and also maximizes the amountof regenerative braking that can be used. The total powerplant-drive train system should fit un-der the hood of a conventionally-proportioned automobile with no Intrusion into the passengervolume. Control must be essentially automatic, so that driving the car 1s no different thandriving a conventional automatic transmission car. The additional powerplant system componentsmust add no more than 100 1b to the weight of the car. The efficiency of all system componentsmust be high enough to demonstrate a high fuel efficiency under city driving conditions, with 45mpg on gasoline over the EPA-CVS cycle being the approximate goal for a 3,000 1b Inertia weightvehicle whose present city mileage 1s about 22 mpg.
Since there is no off-the-shelf CVT available that would allow the above requirements to besatisfied, 1t is necessary to design and build a CVT specifically for this project. Within theconstraints of size, weight, efficiency, and the avoidance of major developmental problems in
441

the basic CVT itself, the following three concepts appear attractive:1. A multi-speed gearbox (e.g., 12 speeds) with a slipping clutch to match the flywheel and
vehicle speeds in between the discrete ratios. At higher speeds (above about 45 tnph), theflywheel would be declutched, and the car driven by the engine through the gearbox alone.
2. A hydrostatic power-split transmission in series with a 4 or 5-speed gearbox. This is thesystem concept used in the present experimental flywheel vehicle.
3. A van Doorne steel V-belt system in combination with a two-speed gear change unit.
All of the above three concepts appear as if they would meet the CVT requirements, and it isdifficult at this stage of the program to determine which is the most promising. We, therefore,plan to carry all three concepts along at least to the stage of a final assembly drawing. It ispossible that prototype models suitable for testing the efficiency and control characteristicswill be constructed for two, or even all three, based on an evaluation of the final designs andthe cost of construction. More details of the three concepts and their current stage of analysisand design are given below.
SLIPPING CLUTCH DESIGNS
Figure 2 shows schematically the basic idea of the slipping clutch concept. In this figurea 5-speed gearbox is placed in series with a two-speed box with clutches to give 10 discretegear ratios optimally spaced. One of the two clutches will be engaged at all times (unless thecar is coasting or at rest) with the loading pressure set by the driver tr give a particularclutch slippage torque which results 1n the desired vehicle drive torque.
Input5-SpeedGearbox
1
sii41 1
[A
2-Speed boxwith Clutches
Fig. 2. Schematic diagram of a ten-speed gearbox with slipping clutch CVT.
At first glance, the slipping clutch concept may appear to be an undesirable type of CVT,since the clutch slippage is a pure loss. Its attractiveness lies in the fact that all of therequired components other than the slipping clutch surfaces themselves should have very high ef-ficiency (or, more specifically, low friction losses) under all operating conditions. If theclutch slip Is kept to 15% maximum, then the basic clutch efficiency would be at least 85% andaverage about 92% over a driving cycle, regardless of the amount of torque being transmitted. Ifthe other losses (gears, bearings, etc.) are minimal, the result 1s excellent CVT efficiency. Incomparing this concept to the other CVT candidates, 1t should be remembered that in contrast toa slipping clutch, the friction losses inherent 1n the other CVT principles (e.g., tractiondrives and hydrostatic systems) are not proportional to the torque transmitted and constitute ahigher percentage of the power transmitted at lower power levels.
One important consideration for slipping clutch designs is the frequency of shifting. Anextreme condition would be hard acceleration, say from zero to fifty mph 1n 10 seconds through10 speeds. This operation would require a gear shift every second on the average. A satisfac-tory system would need to automatically shift gears when required in a very short time increment,estimated to be about 1/10 of a second to give the Impression of smooth, continuous accelerationwith no apparent jerldness. It appears that this requirement can be met with proper mechanicaldesign. Another consideration 1s that, for a given combination of vehicle and flywheel speeds,a gear shift would be necessary to change from positive driving power to regenerative braking,since a slipping clutch can transmit torque only in the direction of slip. This should increasethe shifting frequency only slightly, however, since the controls would be designed to provideregenerative braking only when the brake pedal was actually pushed. When the driver's foot wassimply raised from the accelerator pedal, the car would be allowed to coast, i.e., the clutchwould be disengaged.
In developing detailed designs, other important requirements are: 1) a clutch that is
442

"disengaged" must have no significant drag, 2) the drive train must have no friction loss whenthe car is at rest (e.g., stopped for a traffic signal), 3) gear and bearing friction must beminimized.
Although the slipping clutch system of Fig. 2 could be implemented satisfactorily, there areother designs that appear to be more attractive. Figure 3 illustrates one of the designs that iscurrently being pursued, a twelve speed version in this case. Although Fig. 3 is a scale drawing,it is at an early stage of development, with all mechanical details not yet resolved. The twoside shafts appear in the side view as if they were 180° apart for clarity of detail. In actual-ity they are to be positioned as shown in the end view to provide a more compact package.
Fig. 3 A twelve-speed slipping clutch CVT with hydraulic clutch actuation and a binary digitalpiston shifting mechanism.
The center group of six gears has a clutch friction element between each two adjacent gears,and at the outer surfaces of the two end gears. The clutches are loaded by a hydraulic pis-ton at the right. The gears are free to rotate on the center shaft except as restricted by theclutches. The two side shafts each have six gears that are in constant mesh with the gears ofthe center shaft. The side shafts are moved by sets of digital hydraulic pistons. The shortsplined section on each of these will thereby lock one gear at a time to its shaft, setting atransmission speed ratio. One or more of the clutch elements will slip to properly match thetransmission input and output speeds (i.e., the flywheel and vehicle speeds). When gears are be-ing shifted, the loading of the clutch elements is reduced to zero, and then quickly reset at therequired control value as soon as the shift is completed.
Figure 3 as drawn shows the transmission in first (low) gear with the gear on the top leftengaged by the splined shaft. Second gear would find the second gear from the left engaged, andso on, up through the first six speeds. For seventh gear the top spline would be moved to theright beyond its stack of gears, and the bottom spline moved to engage the first gear on the left.Note that the two side shafts are both geared to the output shaft.
The first advantage of this particular concept is that it doesn't matter which or how manyclutch elements slip; therefore, there can be no detrimental clutch drag. Shifting can be donequickly by a small shaft movement. When shifting occurs, the speed difference between the exter-nal and internal splines will be only about 15% so that no further "synchromesh" system is re-quired. One disadvantage of the design 1s that there are 12 gear pairs in constant mesh, withresulting losses, but it 1s felt that these should be minimal.
Figure 4 is a variation of the above design. Here, the shifts alternate between the twoside shafts, so that the upcoming gear can be "preselected". The two clutches are engaged (andslipped at the desired torque level) alternately. There should be virtually no dead time duringa gear change with this design since the engagement and disengagement of the two clutches willoccur simultaneously.
Other variations of the above design concepts are under investigation.
443

F1g. 4. Schematic diagram of a twelve-speed slipping clutch CVT with a gear preselection feature.
HYDROSTATIC POWER-SPLIT DESIGNS
The basic principle of the hydrostatic power-split CVT is illustrated in Fig. 5. Only partof the power passes through the hydrostatic transmission Itself (the hydrostatic pump and motor,one or both with variable displacement), the rest passing through a more efficient direct mechan-ical path. The two components of power are then added by the gear differential. The overall CVThas higher efficiency but less ratio range than a straight hydrostatic CVT. Figure 5 also showsa gearbox in series with the power-split CVT. This extends the ratio range of the overall system,permitting even smaller hydrostatic units to be used, decreasing size and weight requirements andimproving overall efficiency.
Voriable b rjDisplocementl
Pump I
FixedDisplacement
Motor
IIII
Input
4-SpeedGearbox
Output
GearDifferential
Fig. 5. Schematic diagram of a hydrostatic power-split transmission.
The hydrostatic power-split transmission.designed and built for the first generation experi-mental flywheel carl3) has shown the practicality of this concept, even though Its efficiency 1smuch too poor to demonstrate truly significant fuel savings. The main problem with that particu-lar transmission was that it had to be built primarily from off-the-shelf components, which lim-ited the efficiency possible, restricted the use of design optimization, and also resulted in alarge and heavy unit. The design did demonstrate the ruggedness, smooth operation, and ease ofcontrol possible with hydrostatics, however.
Figure 6 shows the basic hydrostatic power-split design currently under investigation. Theradial ball piston concept 1s used for the pump and motor, both having variable displacement formaximum versatility. The gear differential is the planetary unit at the right of the figure. A4- or 5-speed gearbox with optimized ratios is to be put in series with the unit. The designis very similar to that developed by General Electric Corporat1on(4,5) for use in trucks andtracked vehicles.
The main advantages of the design (F1g. 6) are small size and light weight. Another poten-tial advantage is that radial ball piston hydrostatic units apparently have low spin losses underzero or low power conditions even though their full load efficiency may be no greater thanother designs. Unfortunately, we have so far been unable to obtain actual experimental data to
444

Fig. 6. Sketch of a hydrostatic power-split CVT with radial ball piston pump and motor and aplanetary gear differential.
confirm these characteristics. Simulations based on reasonable assumptions have shown that thisdesign should provide satisfactory efficiency for a flywheel car 1f used in series with a 4- or5-speed gearbox whose ratios have been optimized.
Experience with the first generation flywheel vehicle has shown the control of this type oftransmission to be quite straightforward. To obtain direct control of the output torque (andtherefore, the acceleration or deceleration of the vehicle), it is necessary only to control thehydrostatic pressure.* This can be accomplished by a pressure control valve with feedback inwhich pressure is directly proportional to the position of a control lever.(3) This lever can beconnected by a direct mechanical linkage to the accelerator and brake pedals.
In order to more fully Investigate the potential of this design, and to carry out parameteroptimization studies, it will be necessary to obtain experimental loss data over the full rangeof operation for the radial ball piston units. If the packaging details look attractive afterthe design work is completed, such experimental studies may be done. Since the balls and outerring of a ball piston unit could be taken from a standard ball bearing, construction of a modelfor experimental studies would be a reasonable task.
BELT DRIVE SYSTEMS
Variable V-belt drives have been demonstrated to have power transmission capabilities thatare adequate for small cars. Snowmobiles, for example, use this type of CVT, with racing ver-sions often transmitting well over 100 hp. The life of the rubber belts is not great under suchcontinued high power conditions, however, The DAF automobile, built 1n the Netherlands (with thecompany recently purchased by Volvo) has for many years used a rubber V-belt CVT for its trans-mission, for engines with power ratings up to about 45 hp (higher in racing versions).
A new development is a steel segmented V-belt system with variable sheaves (the "TRANSMATIC")that has been developed by van Doorne's Transmissie B.V. of the Netherlands.(6,7) Figure 7, fromBorg-Warner literature, shows the basic design features. The efficiency characteristics of thisunit are quite good, and the allowable ratio range 1s 4:1 or slightly higher. In order to proper-ly handle the range requirements of a flywheel car, a two-speed gearbox in series with the steelV-belt system (or something equivalent) Is required.
The basic unit (sheaves and belt) 1s quite compact. It is currently being developed for use1n otherwise conventional cars by Volvo, Fiat and Borg-Warner. They expect to begin making carswith the van Doorne CVT within a couple of years. The controls required for a conventional carare quite different from those needed for a flywheel car, however.
*This is strictly true only 1f the displacement of the hydraulic motor is fixed,is proportional to the product of pressure and motor displacement.
If not, torque
445

METAL BELT DRIVE'-• BANDS -(Lairjinated-WlndtvHJuol layers)!
Crowned —... / u.Surface tor I ^ * PBonds - J.X!fV'
• Ths face Contacts Pulley
{Note blocks ore gutdndby bonds but areNOT attached to bonds? Adjustable
Conical Pllllnys
Fig. 7. Details of the van Doorne metal V-belt CVT.
Designs based on this steel V-belt are currently being developed by us for the flywheel carapplication. Since the basic belt and sheave system is apparently well developed, our work liesprimarily In designing the two-speed gearing system, the overall packaging, and the controlsystem.
There are two control aspects to be taken care of: 1) the loading ("squeeze") on the beltfrom the sheaves must be proportional to the torque being transmitted and Inversely proportionalto the effective sheave diameter in order to keep spin losses low under conditions of zero or lowpower transmission; 2) the rate-of-change of the sheave diameters must be controllable since itIs the parameter that sets the vehicle driving torque. Present design concepts are based on hy-draulic loading of both sheaves, and logic systems will be necessary to set the absolute loadingof each sheave for all possible operating conditions. It has been tentatively decided to run theengine continuously and bypass the flywheel under conditions of high speed cruise, but with thepower still passing through the van Doorne steel V-belt so that the engine operating conditionscan be optimized for this relatively steady-state condition of higher power.
A van Doorne V-belt and sheave system is being procured to allow testing of efficiencies andto provide a "breadboard" model for development of the control system. Many of the control sys-tem parameters will need to be determined by a combination of theoretical and experimental work.
OTHER CVT POSSIBILITIES
There are many other continuously-variable transmission concepts that look attractive, es-pecially those 1n the rolling-contact traction drive category. Unfortunately, there are virtual-ly no such transmissions available as prototype units that could be readily used in the second-generation experimental vehicle. Experimental units could be built for us by a number of compa-nies that are developing such units. However, the cost would in general be quite high and therewould be a high likelihood of significant developmental problems In the traction drive unit it-self that would impede progress on the overall second-generation flywheel car. We feel that roli-1ng contact traction drive development should be handled separately from this project, eventhough such CVT's could ultimately prove to be best for flywheel cars.
SUMMARY AND CONCLUSIONS
Three basic CVT concepts have been identified as potentially satisfying the stringent re-quirements of an i.e. engine-flywheel energy storage automobile. Designs are currently being de-veloped for all three. Ultimately, a choice will need to be made as to which design will be bestto use in a second generation experimental flywheel car. In addition to a comparison of themechanical configurations developed, some experimental studies to determine loss characteristicswill be performed, and simulations made to determine net energy losses of the different designsover standard driving cycles.
Since all three concepts appear attractive, and since there are many factors to consider in
446
the final selection, it is difficult at this time to predict which CVT will be used. There is astrong possibility that engineering models of two and possibly all three will be built andtested to help in the evaluation, depending upon how much this would cost. An attempt will bemade to design the overall system packaging so that more than one CVT design could be used inthe vehicle with a minimum of other system changes. Ideally, in terms of the overall developmentprogram, the CVT packages should be completely Interchangeable.
ACKNOWLEDGMENTS
Figure 3 was developed by Michael Nohr, and Fig. 6 by Hans Noeldner, both Research Assist-ants assigned to this project.
REFERENCES
1. N.H. Beachley and A.A. Frank, "Flywheel Energy Management Systems for Improving the FuelEconomy of Motor Vehicles", Report No. DOT/RSPA/DPB-50/79/1, prepared for U.S. Dept. ofTransportation, December, 1978.
2. A.A. Frank and N.H. Beachley, "Evaluation of the Flywheel Drive Concept for PassengerVehicles", SAE Paper 790049, 1979.
3. N.H. Beachley and A.A. Frank, "Final Report-Increased Fuel Economy in Transportation Systemsby Use of Energy Management-Third Year's Program," Report DOT-TST-77-21, prepared for U.S.Dept. of Transportation, Dec. 1976.
4. D.M. Latson, et al., "A Hydromechanical Transmission Development", SAE Paper 670932, 1967.
5. D.M. Latson, et al., "Hydromechanical Transmission Fares Well in Truck Tests", SAE Journal,Vol. 76, No. 6, June 1968, pp. 64-66.
6. Olaf Fersen, "Transmatic", Autocar, 17 February, 1979, pp. 42-43.
7. S.C. van der Veen, "Stufenloser Drehmoment/Drehzahlwandler Transmatic", Ant-Antriebstechnik-16 (1977) Nr. 4, pp. 217-222.
447

Project Title:
Principal Investigator:
Organization:
Project Goals:
Project Status:
Contract Number:
Contract Period:
'Funding Level:
Funding Source:
PROJECT SUMMARY
"Vehicular Appl icat ions of Mechanical Energy Storage--FY79"
Wil l iam T. Crothers
Lawrence Livermore LaboratoryMail Stop L-209P.O. Box 808Livermore, CA 94550(415) 422-8200
The goals of t h i s pro ject are to develop and evaluate mechanical-energy storage technology f o r appl icat ion to e l e c t r i c , hybr id , andheat-engine vehicles and to maximize the commercial po tent ia l of thetechnology.
Four studies were completed in FY79. Performance improvement re latedto mechanical-energy storage was the subject of two repor ts . Con-t inuous ly var iable transmission design was discussed in a t h i r d .Elastomeric braking was evaluated in a f o u r t h . Two f l ywhee l /e lec t r i csystems were fabr icated and p a r t i a l l y tes ted. An elastomer-brakingsystem design was i n i t i a t e d . C r i t e r i a f o r a vehicle powered by af lywheel/heat engine were formulated.
W-7405-ENG-48
FY1979
$845,000 EHV Prog. (FY1979); $475,000 Ener. Stor. Prog. (FY1980 6/0)
U.S. Department of Energy
449

VEHICULAR APPLICATIONS OF MECHANICAL ENERGY STORAGE—FY79
William T. CrothersLawrence Livermore Laboratory
P.O. Box 808, L-209Livermore, CA 94550
ABSTRACT
The Department of Energy, Division of Energy Storage Systems, has designated the LawrenceLivermore Laboratory (LLL) as the technical manager arm for conducting research in the area ofmechanical energy storage. This paper describes developments regarding vehicular applicationsof that management effort. A five-year project plan, with supporting rationale, is presented.
INTRODUCTION
This paper describes the technical management of vehicular-related, mechanical-energystorage projects at the Lawrence Livermore Laboratory. This year's technical progress will bedetailed in other papers at this 1979 MES Review meeting. Additional information can be ob-tained from the reports listed in the bibliography. Because the management task includesplanning, emphasis is placed' on future work as it relates to completed and ongoing investiga-tions. Therefore, an overview on how the program goals are to be attained is included.
BACKGROUND
Two sources of funds have supported this work for FY79 (1). The early funding originatedunder the Electric and Hybrid Vehicle Act. A second more recent source, is through the Divi-sion of Energy Storage Systems. This funding has increased the scope of the projects con-sidered with the result that studies of storage applications to vehicles now include heat-engine propulsion as well as electric-driven types.
HIGHLIGHTS OF FY1979
A list of the subcontracts
Project
Analysis of Flywheel EnergyStorage for Automotive Use
Energy Storage AssessmentRelated to E&HV
Continuously VariableTransmissions
Elastomeric RegenerativeBraking Study
Elastomeric Braking,Design and Hardware
Energy Storage Systemfor EV's
Energy Storage Unitfor EV's
Heat Engine/FlywheelVehicle Analysis
Inertia Weld Developmentfor Flywheels
which have been active this year are:
Subcontractor Status (Ref. No.)
R.
LaM.
N.
F. McAlevy III
•rence LivermoreW. Schwartz
Beach ley and A.
Eaton
Eaton
& Associates
Laboratory
Frank
Report published.UCRL-13980
Report published,UCRL-52773 (2 volumes)
Report published,UCRL-15037
Report published,UCRL-15044-1
Subcontract initiated6/28/79
(2)
(3)
(4)
(5)
General Electric
Garrett AiResearch
University of Wisconsin
General Electric
Nearing completion
Hardware in test
Design phaseone-half complete
Report published,UCRL-15045 (6)
450
RESULTS TO DATE
The primary accomplishments of the projects.are as follows:
• Energy-storage devices are technically feasible for urban driving conditions.
• Electric vehicles with present and forecast battery capabilities cannot in this centurymeet the performance standards now needed for city and freeway driving patterns.Energy-storage systems can overcome this disadvantage.
• Flywheel storage with electric drive is at the prototype stage of development—250W«h capacity, 30 kW power attainable in an 80 1b (36 kg) unit.
• Heat engine/flywheel systems are technically feasible. The transmission needed tocouple engine, flywheel, and drive train into a functioning unit is the key to asuccessful demonstration.
• Elastomers have low specific energy storage capabilities. Relatively simple hardwaredesigns are possible, however, which may make the elastomer an attractive candidate forvehicular use.
ELECTRIC VEHICLE DEVELOPMENTS
Electric vehicles now on the market, and those now being proposed as near-term substi-tutes for petroleum-fueled vehicles, cannot accelerate adequately in c i ty and freeway t ra f f i cto meet the present performance capabilities of vehicles powered by the internal-combustionengine. The implications of this fact to future electric vehicle sales has been and is thesubject of much debate. A more tangible and explorable factor is the possible increasedpetroleum consumption as a result of heavy t ra f f i c conditions where vehicles of varied per-formance capabilities are mixed. Results obtained by using a computer code by Collins andEpps (7), which closely simulates t ra f f i c flow on multi-lane freeways, show vehicle-flowinterruptions that were directly caused by slow-accelerating vehicles such as t ractor- t ra i lerr igs. The increased fuel consumption was obvious and calculable. Three solutions could avoidthis problem:
a. Segregate vehicles of greatly differing performance capabilities by street and free-way restr ict ions.
b. Reduce the high performance of internal combustion engine (ICE) l ight vehicles (pas-senger cars). This is a strong possibi l i ty as economy can be improved and emissionslowered.
c. Improve the performance of the slow vehicles.
I f more uniform performance in the vehicle f leet conserves fue l , mechanical-energy stor-age systems could prove the equalizer. Our project goal is to demonstrate the usefulness ofmechanical energy storage (MES) for this purpose as well as to demonstrate the range extensiongained from regenerative braking and load leveling. During the next few years, developmentwi l l concentrate on the flywheel and electric-input/output energy transfer.
Units now under t*st appear to offer storage capacities of about 3 to 5 W»h/lb, whichis a lower specific energy than today's batteries. The power rating at 30 kW (375-W/lb),however, makes them interesting possibi l i t ies. A second generation unit may need to beini t iated (Fig. 1). Control systems for such devices are now under development and must beperfected to offer a small, lightweight, economical mate to the energy storage unit (ESU). I tis anticipated that these two tasks w i l l allow i n i t i a l vehicle modifications to begin early inFY81. This vehicle should be in operation in 18 months (mid FY82), and a second-generationfollow-on would repeat the process with an updated design during FY82-84.
I f funds are available, research wi l l also be directed toward electric-input/outputmachines with higher efficiencies. Results in this area can be ut i l ized in the proposedvehicles and in a next generation of the Urban Mass Transit Authority (UMTA) bus program nowsponsored by the Department of Transportation.
451

HEAT-ENGINE VEHICLE DEVELOPMENTS
Fuel economy in'automobiles has been improving over the past few years. Mandated CAFE(Corporate Average Fuel Economy) standards are to advance from 19 mpg in 1979 to 27.5 mpg in1985. Volkswagen has already demonstrated a 60 mpg, composite, driving-cycle average with amodified Rabbit. How far these economy feats can be carried with new technology is notclear. Most improvements increase the vehicle cost, a fact which becomes more palatable withrapidly increasing fuel prices. Again mechanical-energy storage can play an important ro le.Providing the performance of these future automobiles is not degraded, the anticipated minimumimprovement of 5O5K (urban EPA cycle) in mpg because of a flywheel storage system should applyproportionally even to the higher CAFE figures and future anticipated improvements.
Figure 2 shows the intended array of tasks planned to have the f i r s t ICE/MES prototypeoperating by FY82. These tasks define the design and construction of the transmission,flywheel package, engine, and chassis. These components are ident i f ied separately andresponsibi l i ty for their construction w i l l rest with those industr ial firms experienced inthese f i e lds . The staff of the University of Wisconsin w i l l continue to share theresponsibi l i t ies with LLL throughout the project.
The key to th is project 's success l ies in the ab i l i t y to build a transmission. Possibledesigns and sources have been investigated, research under government and private sponsorshipis underway, and cautious optimism has been expressed by those involved. Past attempts atproducing a continuously variable design have, at best, been only par t ia l l y successful. Themajor difference today is the need. Flywheels must have the f l e x i b i l i t y . Prior vehicledesign using the internal combustion engine viewed such broad transmission requirements as anicety. Major emphasis w i l l be placed on the transmission development, and the FY81 vehicleconstruction rel ies on a f i rst-generat ion transmission being bu i l t and tested successfullyduring FY80-81.
A possible addition to the heat engine work is a thorough investigation of gas turbines.Gas turbines for automobiles remain elusive because of high-temperature-material problems.Gas turbines also tend to have above normal brake-specific fuel consumption at low loads.Load-leveling energy-storage flywheels, also operating at high speeds, may be very compatiblewith the turbine machinery. The pre^nt design group w i l l review a l l types of heat engines.A favorable decision on turbines could involve much more time and funding to reach a demon-strat ion stage than would be the case with a piston engine design. In the event the turbineis a desirable alternate, work w i l l continue with the less exotic engines. Then, depending onfund ava i l ab i l i t y , a second- or third-generation demonstration vehicle would feature theturbine design.
REGENERATIVE BRAKING
Regenerative systems using elastomers are discussed separately as the hardware can beapplied to electric or heat engine vehicles driven in urban environments. Results of thef i r s t study indicate the energy can be stored ef f ic ient ly by twisting a cyl indrical ly shapedelastomer. This characteristic implies simple design hardware to transfer energy to and fromthe rotating drive line of the vehicle. Testing of a f u l l vehicle-sized elastomer w i l l occurin the next few months. Reduced-size versions have elastomeric efficiencies (energy in andout or round t r ip) of 90%. Similarly encouraging results of the fu l l -s ize model can lead toseveral new designs. Vehicle prototypes can be expected in FY81. Figure 3 shows the indi-vidual project tasks that must be addressed and the anticipated schedule.
REFERENCES
1. T. M. Barlow, W. T. Crothers, S. V. Kulkarni, and J . A. Rinde, "Mechanical Energy StorageTechnology Project: Annual Report 1978," Lawrence Livermore Laboratory, Livermore,Ca l i f . , UCRL-50056-78 (1979).
2. Robert F. McAlevy, I I I , "A Logical Basis for Evaluating the Impact of Flywheel-Transmissions on Automotive Vehicle Performance," Lawrence Livermore Laboratory, Liver-more, Ca l i f . , UCRL-52758 (1979).
452

3. Martin W. Schwartz, "Assessment of the Applicability of Mechanical Energy Storage Devicesto Electric and Hybrid Vehicles:" Vols. 1 and 2, Lawrence Livermore Laboratory, Livermore,Calif., UCRL-52773 (1979).
4. Norman H. Beachley and Andrew A. Frank, "Continuously-Variable Transmissions, Theory andPractice," Lawrence Livermore Laboratory, Livermore, Calif., UCRL-15O37 (1979).
5. L. 0. Hoppie, F. S. Chao, I. Kalns, F. G. Mossey-Shaw, D. Speranza, and D. M. Trela, "TheFeasibility of an Elastomeric Regenerative Braking System for Automotive Applications,"Phase I Final Report, Eaton, Lawrence Livermore Laboratory, Livermore, Calif.,UCRL-15044-1 (1979).
6. E. Lustenadar and D. Kerr, "Application of Inertia Welding Technology to Steel Disc-TypeFlywheels," General Electric, Lawrence Livermore Laboratory, Livermore, Calif., UCRL-15045(1979).
7. Private Communication with Richard Epps, Lawrence Livermore Laboratory, July 16, 1979.
This work was performed under the auspices of the U.S. Department of Energy by LawrenceLivermore Laboratory under contract No. W-74O5-Eng-48. Reference to a company or product nanedoes not imply approval or recommendation of the product by the University of California orthe U.S. Department of Energy to the exclusion of others that may be suitable.
453
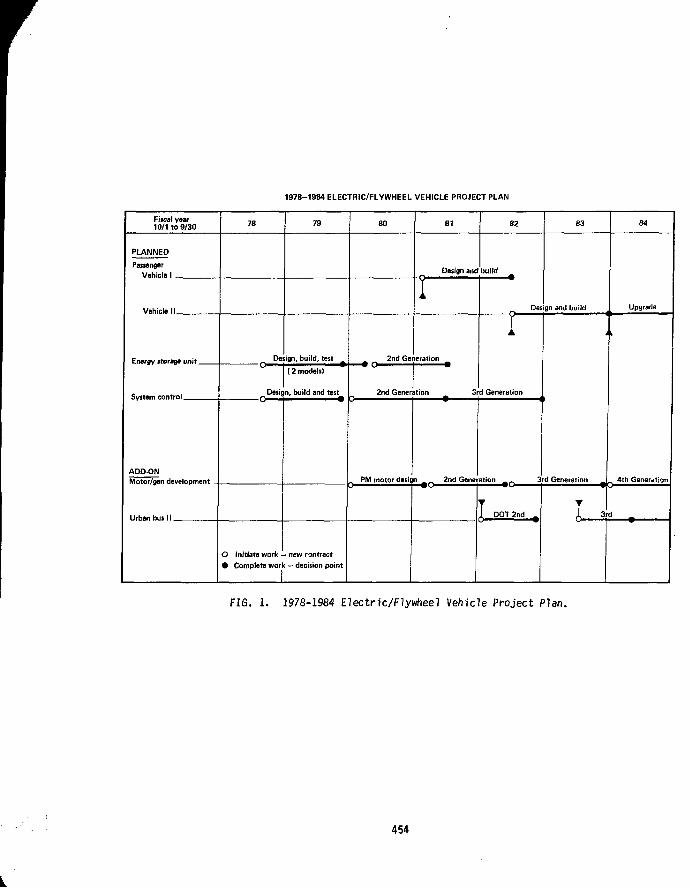
1978-1984 ELECTRIC/FLYWHEEL VEHICLE PROJECT PLAN
Fiscal yew10/1 to 9/30
PLANNED
Passenger
Vnhinle 1
Vehicle II
Energy storage unit ,
ADDONMotor/gen development
Urhanbusll
78
De
^Desii
O Initiate work -• Complete wor
79
ign, build, test _
(2 models)
n, build and test_
- new rontractc — decision point
80
^ _ 2nd Ge
2nd Gener
PM motor desii
1
leration
ition
n an
81
Design and
3
build
82
1
d Generation
2nd Generation
1 DOT 2nd
Des
B3
ign and build
3rd Generation _
84
Upgrade
_ 4th Generation
FIG. 1. 1978-1984 Electric/Flywheel Vehicle Project Plan.
454

1978-1984 HEAT ENGINE/FLYWHEEL VEHICLE PROJECT PLAN
Fiscal year10/1 to 9/30
PLANNED
Flyuihftnl pkq
Transmission
ADDON
Vohir.lR I I I
ALTERNATE
Vpfiirln l\/
Electric motor/drive
78
Ava
O Initiate work —I
> Complete work -
79 80
Specifications
Specification
Specification
Specification
lability study Spe
tew contract
- decision point
Design and bu
Design and bull
81
Design and build
ild 2nd Generator
d 2nd
Design and build
cs Design an
Feasibility
d build 2r
Design
Design
Design
Feasibility
Design
Design
82
Upgrade
3rd
2nd
d Generation
_[ BuBuild
Build
Build and test
Build and test
83
i ,
3rd
3rd Generat
84
h
4th
ion
Id Field test
Laboratory last Upgrade
Test
Design and build
2nd
2nd
Upgrade
2nd Generation
3rd
3nd
FIG. 2. 1978-1984 Heat Engine/Flywheel Vehicle Project Plan.
455
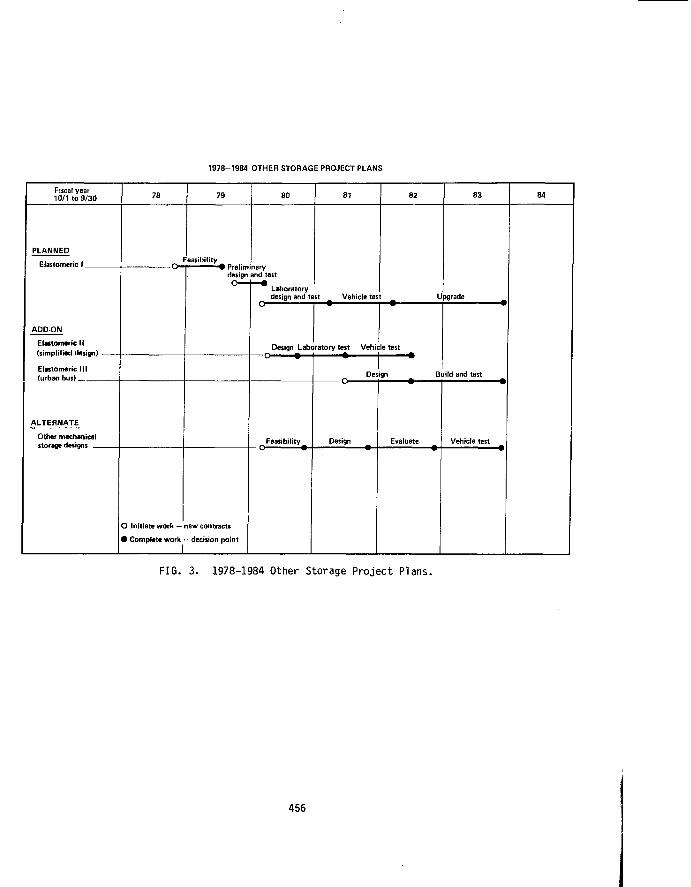
1978-1984 OTHER STORAGE PROJECT PLANS
Fiscal year10/1 to 9 /30 83
PLANNED
ElMtomericll
(simplified design) .
Elastomericlll(urban bus)
ALTERNATE
Other mechanicalstorage designs
Feasibility- O | • Preliminary
design and test
O Initiate work — new contracts
0 Complete work — decision point
I
Laboratorydesign and test _ Vehicle tes Upgrade
Design Laboratory test Vehicle test
^Feasibility^
Design Build and test
Design
FIG. 3. 1978-1984 Other Storage Project Plans.
456

Project Title:
Principal Investigator:
Organization:
Project Goals:
Project Status:
Contract Number:
Contract Period:
Funding Level:
Funding Source:
PROJECT SUMMARY
Regenerative Braking Through Elastomeric Energy Storage
Lyle 0. Hoppie
Eaton CorporationEngineering & Research CenterP.O. Box 76626201 Northwestern HighwaySouthfield, Michigan 48037
Determine the technical and economical feasibility of an elastomericregenerative braking system (ERBS) for automotive applications.
During Phase I (Sept. '78 - March '79) theoretical and experimentalefforts were focused on:
• determining which commercially available elastomer is bestsuited to this application.
• determining which method of stressing an elastomer is bestsuited to this application.
• conceiving and comparing several methods of controlling torque.
• predicting the range improvement which would result if a systembased on a preliminary design were constructed.
• determining the maximum initial cost such a system could have,yet still be cost effective.
The Phase I results were felt encouraging enough by both EatonCorporation and Lawrence Livermore Laboratory to proceed withPhase IIA, during which full-scale elastomeric subassemblies willbe designed, constructed, tested and evaluated. If the resultsof this effort continue to be encouraging, Phase IIB will beinitiated without interruption; in Phase IIB, a complete full-scale ERBS will be laboratory tested and evaluated.
University of California Purchase Order 2617509
July '79 - Feb. '80 for Phase IIA
$172,000 for Phase IIA
Lawrence Livermore Laboratory
457

REGENERATIVE BRAKING THROUGH ELASTOHERIC ENERGY STORAGE
L. 0. HoppieEaton Corporation
Engineering & Research CenterI>. 0. Box 766
26201 Northwestern HighwaySouthfield, Michigan 48037
ABSTRACT
A theoretical and experimental investigation into the use of elastomers as the energystorage element of a regenerative braking system for urban vehicles was carried out. This workculminated in the preliminary design of a complete full-scale system, the prediction of itsperformance and efficiency, the specification of its control system with the required actuatorsand sensors, and an analysis of its possible failure modes. The results of this work indicatetVrt such a system could be constructed from materials and components; requiring neither newtechnology nor major development, but significant engineering problems need to be carefullyaddressed. Incorporation of the system would result in a savings of prime energy required at
the drive line of at least 18 percent for the EPA Urban Driving Cycle, and would be costeffective if it can be manufactured and sold at less than about 12 percent Of the sellingprice of tlie vehicle for which it is intended.
INTRODUCTION
The dramatic increase in petroleum based fuel prices over the past few years has givenrise to various research and development efforts in the area of energy conservation. Anexample of such efforts is that aimed at regenerative braking systems for land vehicles. Withsuch a system, vehicular kinetic energy would be converted to another form and stored as thevehicle stops; the stored energy would subsequently be converted back into vehicular kineticenergy when the vehicle next accelerates. Since some of the energy normally dissipated as heatin the vehicle's brakes would thus be used to help accelerate the vehicle, the amount of primeenergy required to propel the vehicle would have been reduced.
The prime energy so conserved when such a system is used clearly depends on the drivingcycle and the efficiency of the system. For example, an over-the-highway truck, whichtypically travels on the order of one hundred miles between stops, would show little or noenergy savings even if the regenerative braking system had an efficiency of unity. On theother hand, urban driving typically includes one or more stops per mile and the energy savingscould be quite significant. Figure 1 shows two portions of the EPA Urban Driving Cycle, and anaccounting of the energy required at the driveline to propel a typical automobile over thesetwo cycles is shown in Fig. 2. Notice that when the freeway portion is included, 34.3 percentof the energy supplied to the driveline is ultimately dissipated in the brakes, whereas 42.5percent is dissipated in the brakes when the freeway portion is excluded. Thus, if an idealregenerative braking system were available, the range per unit of prime energy as measured atthe driveline could theoretically be increased by 1.52 and 1.74, respective, over thecorresponding value of the standard vehicle for these two driving cycles. Obviously, if adriving cycle is such that there are more stops per mile, even higher improvements would bepossible. Consequently, applications such as city buses, delivery vans, subways, etc. areparticularly attractive applications of regenerative braking systems.
There are two essential features which a regenerative braking system must have in orderthat the prime energy saved (over a specified lifetime) does offset the initial cost, size andweight penalties of the system:
. The energy storage unit itself must be compact and capable of handling high power levelsefficiently.
. Any auxiliary equipment required to convert vehicular kinetic ensrgy into a formsuitable for storage and vice-versa must be efficient, compact, and of reasonable cost.
As discussed in what follows, a regenerative braking system based on elastomerxc energystorage promises to be capable of demonstrating both of these features.
458

3O
a.
0)
Fig. 1.
60
50
40
30
£ 20
10
Freeway Portion included
Freeway Portion Excluded •
A
f\
0 1 2 3 4 5 6 7 8 9 10 11 12 13 14
Time - Hundreds of Seconds
Portions of the EPA Urban Driving Cycle
a) FreewayPortionIncluded
b) FreewayPortionExcluded
2.95 To
5.54Required I
Road Load
2.59 ToKinetic Energy
- Accelerate and Cruise -
1.51 To
3.41Required I
Road Load
1.90 To
! . *>
0.69 Tof Road Load
V 1.90 ToBrakes
- Decelerate -
Kinetic Energy
0.45 ToRoad Load
1.45 To
To Road Load
1.90 To
Brakes
To Road Load
; -15 ToBrakes Brakes
Fig. 2. Accounting of Energy (M Joules) Required to Propel a Vehicle Over the Two Cycles ofFig. 1.Vehicle Mass: 1400 kgDrag Coefficients: Cj « .12 N/kg
C2 • .001 N'sec/kg'mC3 « .53 N'Sec2/m2
459

ELASTOMERIC REGENERATIVE BRAKING SYSTEMS
Perhaps the single most important aspect of an elastomeric energy storage system forvehicular applications is its inherent simplicity. The elastomer and vehicle form a"spring-mass" combination which will naturally oscillate; consequently, they can exchangeenergy quite efficiently with absolutely no control. Thus, to decelerate a vehicle andsimultaneously convert its kinetic energy into stored potential energy, one need only connectthe axle or driveline of the vehicle to an elastomer such that the vehicle motion stresses theelastomer: this can be done with a simple clutch. Other energy storage systems for vehicularapplications require more complex energy transfer equipment. In particular, if the energystorage methods mentioned below are to have system efficiencies high enough to make themattractive, the systems must include the following energy conversion and/or energy transferequipment:
. flywheel system - continuously variable transmission with a wide speed range
. battery system - electrical machine and electrical power conversion equipment
. compressed gas system - hydraulic pump/motor
. pumped liquid system - hydraulic pump/motor
. magnetic system - electrical machine
Furthermore, the deceleration and acceleration characteristics of a basic elastomericsystem (consisting of an elastomer and nothing more complicated than a clutch) are quitesimilar to actual stop-start driving characteristics. The basic system would thus be nearlyideal for vehicles which exhibit a repetitious stop-start velocity profile, such as subways,people-movers, certain city buses and delivery vans, etc.
Unfortunately, the basic system would need to be modified for use on an automobile to beoperated in an urban environment since in this application, there is considerable variation insuccessive stop-start cycles, primarily due to traffic congestion. The challenge, then, is tomodify the basic system as little as possible in order to provide variation in theacceleration-velocity characteristics while simultaneously keeping the system efficiency high.The description ana a comparison of the various torque control schemes which have beenconsidered for this application are presented elsewhere.(*)
COMPARISON OF ELASTOMERS
As shown in Table 1, the synthetics polybutadiene, polyester, and polyurethane wereevaluated for use as the energy storage media and rejected on the basis of low fatigue lifeand/or high hysteresis loss. Unfilled natural rubber and synthetic natural rubber(cis-polyisoprene) were found to be the most promising for this application.
TABLE 1. Properties of Various Elastomers
Material
Polybutadiene
Hytrel-Polyester
K-PrenePolyurethane
PolyisopreneSynthetic NaturalRubber
Filled Natural Rubber
Unfilled Natural Rubber
HysteresisLoss
50%
50%
50%
10-20%
5-10%
5-10%
Fatigue Life-Cvcle
3
3
4
>400Not testedto failure
500Unlubricated
>95,000
Comments
Poor TearResistance
High ModulusLow Fatigue Life
High ModulusLow Fatigue Life
AcceptableHysteresis andFatigue Life
Hardness(Durometer)
60A
65D
60D
45A
Acceptable Hysteresis 45ALow Fatigue Life
Acceptable Hysteresis 35ALubricated and Fatigue Life
460

Based on small-scale test data, it is projected that the kinetic energy of a 1400 kgvehicle traveling at 13.5 m/sec could be stored in about 32 kg of material with a round-tripenergy transfer efficiency of about 90 percent. Fatigue life is a function of initial andfinal strain limits, surface lubrication and environment, and a fatigue life in excess of50,000 cycles is being sought. The preparation of tests designed to determine the energydensity, hysteresis loss and fatigue life of full-scale elastomeric subassemblies iscurrently underway.
COMPARISON OF STRESSING SCHEMES
Various methods of stressing an elastomer were also investigated. As shown in Table 2,pure tension was found to have the highest energy per unit volume of elastomer, as expected.
TABLE 2. Comparison of Elastomeric Energy Storing Schemes
ENERGY STORING SCHEME STRAIN E/V.
a) TENSION
ElasE/V,
26 1 - - » K 1 1 , 1( R . / R ) 2 2 G R~ - 2 G E
1 O 1 Ol
Total
Lf-L.
L f - L i 1 G E 2
t 2
V ^ f i G « . [ 5 + i O £ | < i G
e) TOHSION
Radius R. Length L
0 GRADED B
TORSION L«nS'BAR
lr iT
— G(r)• i c e * =• F(n,p)
g) TORSIONALLY IINDUCEDTENSION R " " u » H
Linglli L
Unknown See Equation 5.
The scheme referred to as torsionally induced tension, however, promises to have thehighest energy per unit of total occupied volume and to be considerably easier to implement foran automotive application. In this scheme, one or more rods are arranged parallel to oneanother and then sufficient torque is applied to induce buckling. The resultant stressdistribution and torque-rotation characteristics have not lent themselves to mathematicalderivation, but it was empirically determined that the torque-rotation characteristics in theregion of interest shown in Fig. 3 could be specified in terms of the following quantities:
Ko
emin
Tmin
\ GR*/L
f "2 Koradians
emin
(1)
(2)
(3)
(A)
461
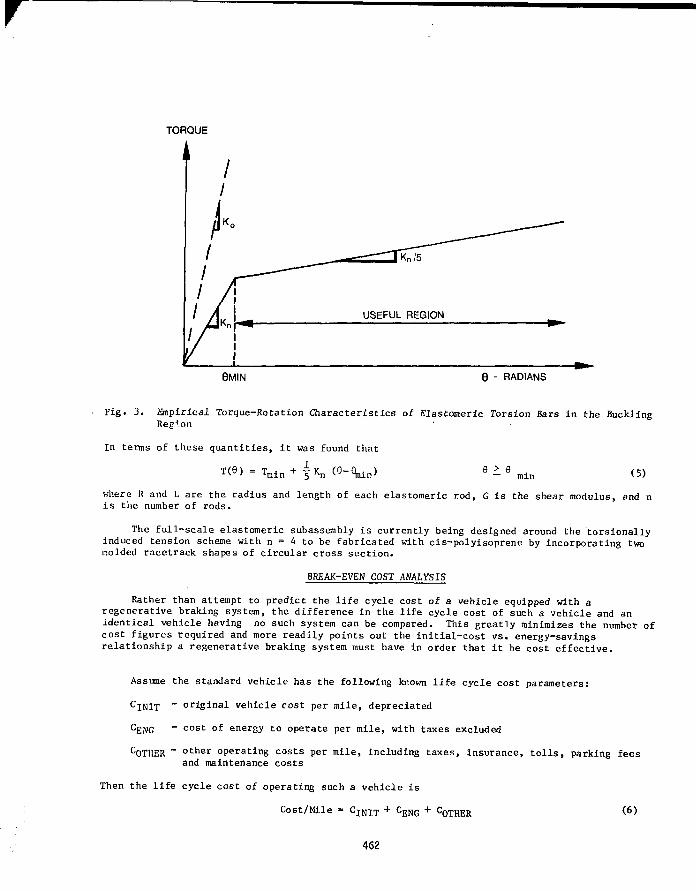
TORQUE
0MIN 0 - RADIANS
Fig. 3. Empirical Torque-Rotation Characteristics of Elastomeric Torsion Bars in the BucklingRegion
In terms of these quantities, i t was found that
T K,, (6 - (5)
where R and L are the radius and length of each elastomeric rod, G is the shear modulus, and nis the number of rods.
The full-scale elastomeric subassembly is currently being designed around the torsionallyinduced tension scheme with n = 4 to be fabricated with cis-polyisoprene by incorporating twomolded racetrack shapes of circular cross section.
BREAK-EVEN COST ANALYSIS
Rather than attempt to predict the life cycle cost of a vehicle equipped with aregenerative braking system, the difference in the life cycle cost of such a vehicle and anidentical vehicle having no such system can be compared. This greatly minimizes the number ofcost figures required and more readily points out the initial-cost vs. energy-savingsrelationship a regenerative braking system must have in order that it be cost effective.
Assume the standard vehicle has the following known life cycle cost parameters:
CINIT ~ original vehicle cost per mile, depreciated
CENG ~ cost of energy to operate per mile, with taxes excluded
COTHER ~ other operating costs per mile, including taxes, insurance, tolls, parking feesand maintenance costs
Then the life cycle cost of operating such a vehicle is
Cost/Mile + CEfjg + C 0 T H E R (6)
462
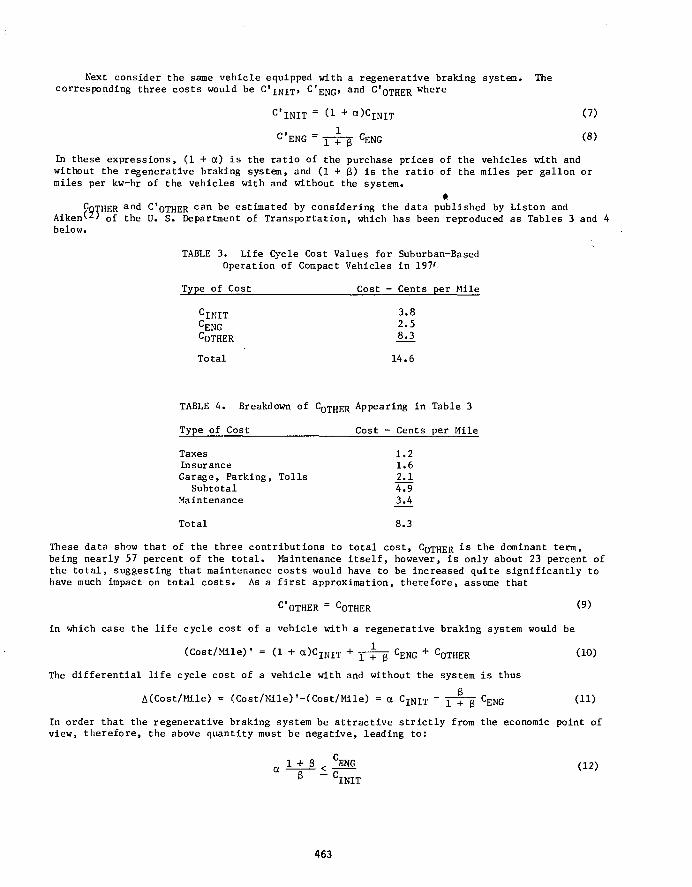
Next consider the same vehicle equipped with a regenerative braking system. Thecorresponding three costs would be C ' J N J ^ , C'gjjg, and C'QIJJJJJR where
'lNIT = d
' E N G = T 4 - g CENG (8)
In these expressions, (1 + a) is the ratio of the purchase prices of the vehicles with andwithout the regenerative braking system, and (1 + g) is the ratio of the miles per gallon ormiles per kw-hr of the vehicles with and without the system.
•CQTHER a n d c'oTHER c a n b e estimated by considering the data published by Liston and
Aiken^J of the U. S. Department of Transportation, which has been reproduced as Tables 3 and 4below.
TABLE 3. Life Cycle Cost Values for Suburban-BasedOperation of Compact Vehicles in 197C
Type of Cost Cost - Cents per Mile
CIKIT 3 > 8
CENC 2 - 5
COTHER JL1
Total 14.6
TABLE 4. Breakdown of C0THER Appearing in Table 3
Type of Cost Cost - Cents per Mile
Taxes 1.2Insurance 1.6Garage, Parking, Tolls 2.1
Subtotal 4.9Maintenance 3.4
Total 8.3
These data show that of the three contributions to total cost, C0XHER i s t h e dominant term,
being nearly 57 percent of the total. Maintenance itself, however, is only about 23 percent ofthe total, suggesting that maintenance costs would have to be increased quite significantly tohave much impact on total costs. As a first approximation, therefore, assume that
C'OTHER = COTHER <9>
in which case the life cycle cost of a vehicle with a regenerative braking system would be
(Cost/Mile) ' = (1 + oc)C1NIT + — ^ g C E N G + C 0 T H E R (10)
The differential life cycle cost of a vehicle with and without the system is thus
A(Cost/Mile) = (Cost/Mile)'-(Cost/Mile) = a C I N I T - x ^ g C E N G (11)
In order that the regenerative braking system be attractive strictly from the economic point ofview, therefore, the above quantity must be negative, leading to:
<CINIT
463

rThus, If Eq. 9 proves to be a valid assumption, substituting from Table 3 into Eq. 12 leads to
a i^-£ 1 0.658 (13)
as the relationship between initial cost and range improvement that a regenerative brakingsystem must have in order that it be attractive strictly from the cost point of view.
Results of the analysis on a preliminary design of a complete ERBS^1^ indicate a rangeimprovement ratio of 1.22, i.e., g = 0.22, equivalent to a fuel saving of 13 percent, forthe EPA Urban Driving Cycle,. Substituting this value into Eq. 13 leads to
a £ 0.12 (14)
Thus, if the ERBS can demonstrate a range improvement ratio of 1.22, it would be cost effectiveif it can be manufactured and sold at less than about 12 percent of the original cost of thevehicle for which it is intended.
REFERENCES
1. L. 0. Hoppie, et al., "The Feasibility of an Elastomeric Regenerative Braking System forAutomotive Applications," Phase I Final Report, Eaton Engineering & Research Center,Lawrence Livermore Laboratory, UCRL-15044-1 (1979).
2. L. L. Liston and C. A. Aiken, "Cost of Owning and Operating an Automobile - 1976," V. S.Department of Transportation, Federal Highway Administration, Washington, D.C., 1976.
464

Project Title:
Principal Investigator:
Organizat ion:
Project Goals:
Project Status:
Contract Number:
Contract Period:
Funding Level:
Funding Source:
PROJECT SUMMARY
Flywheel System Development for a USPS Delivery Vehicle
Arthur E. Raynard
AiResearch Manufacturing Company of CaliforniaA Division of the Garrett Corporation2525 West 190th StreetTorranee, California 90509
To develop an experimental flywheel system that will sub-stantially improve the performance of a battery-electricpostal delivery vehicle.
The flywheel propulsion system has been designed, fabricated,and developed. System development tests have been performedusing a dynamic simulator to operate the propulsion systemin a cyclic manner with a vehicle load. The vehicle hasbeen modified to incorporate the flywheel propulsion systemand vehicle checkout tests are in progress.
The development program has been delayed from the originalschedule as a result of changes to the design as requiredfrom the development tests. The principal effort wasdirected towards the development of a power transistorinverter for the electronically '.o'Tnutated motor. Additionalmajor development efforts were required to develop thecontrol logic for propulsion system command and controland to develop the flywheel power unit.
The use of a low voltage traction battery was required sothat a comparison can be made between the original electricpropulsion system vehicle performance and the modifiedvehicle using a flywheel system. However, this low voltagesystem has required a larger current capability for theelectric power inverter than originally expected. Thisresulted in major modifications in the inverter design withreplacement of the power transistor. The redesignedinverter is operating in a satisfactory manner.
The incorporation of a flywheel into a combined-functionassembly that includes the flywheel clutch, the electricmotor, and a gear reduction unit resulted in excessive oilchurning losses. A program to reduce these losses hasresulted in a satisfactory level of flywheel mechanical loss.
DE-AC04-77CS03748
11/22/76 to 8/31/79
3426K
U.S. Department of Energy, Division of Energy Storage Systemsand Electric Vehicle Systems; and the U.S. Postal Service
465
ELECTRIC/FLYWHEEL POWEREDPOSTAL VEHICLE DEVELOPMENT PROGRAM
Arthur E. RaynardAiResearch Manufacturing Company of California
A Division of the Garrett Corporation2525 West 190th Street
Torrance, California 90509
ABSTRACT
A review of the DOE/USPS/A(Research electric battery/flywheel powered DJ5E PostalVehicle development program is included in this paper. The program goals are stated. Thedesign and development of the flywheel energy storage unit including a description of thecomponents is reviewed. The program status, including development problems and solutions,is discussed. A DJ5E Postal Vehicle has been modified by removal of the D.C. electricmotor and controller, and a flywheel power unit replaces the original system. The newpropulsion system features a small steel flywheel, a brushless D.C. motor, and a mechanicalvari-belt transmission.
INTRODUCTION
There exists a recognized petroleum fuel shortage and air pollution problem. Sincethe USPS operates one of the nation's largest vehicle, fleets, it must make every effortpossible to reduce fuei consumption and air pollution. As a result, ths USPS has procured350 electric vehicles for use on selected park and loop delivery routes. However, theperformance of these 350 electric vehicles is limited in range and in number of starts andstops between battery charges. The purpose of this project is to develop a flywheel systemwhich will increase the performance capabilities of electric vehicles so that they canperform the postal delivery mission over a greater number of routes.
The DOE/USPS/AiResearch development program involves the design, fabrication, andinstallation of a flywheel system in a 1/4-ton postal delivery vehicle. The AM GeneralDJ5E Electric Vehicle has been modified by removal of the electric motor and its controllerwhich ts replaced by a flywheel regenerative boosting system, along with associated controland charging systems. The purpose of installing the flywheel system is to demonstrate theperformance benefits that are possible when operating the vehicle in start-stop cyclicoperation. These benefits apply to both the acceleration rate and the number of start-stopcycles that can be achieved on a single battery charge.
PROGRAM GOALS
The primary program goal is to determine that the vehicle performance can be improvedby incorporation of the flywheel system into an existing electric vehicle. The performancecomparison is shown in Table 1.
466
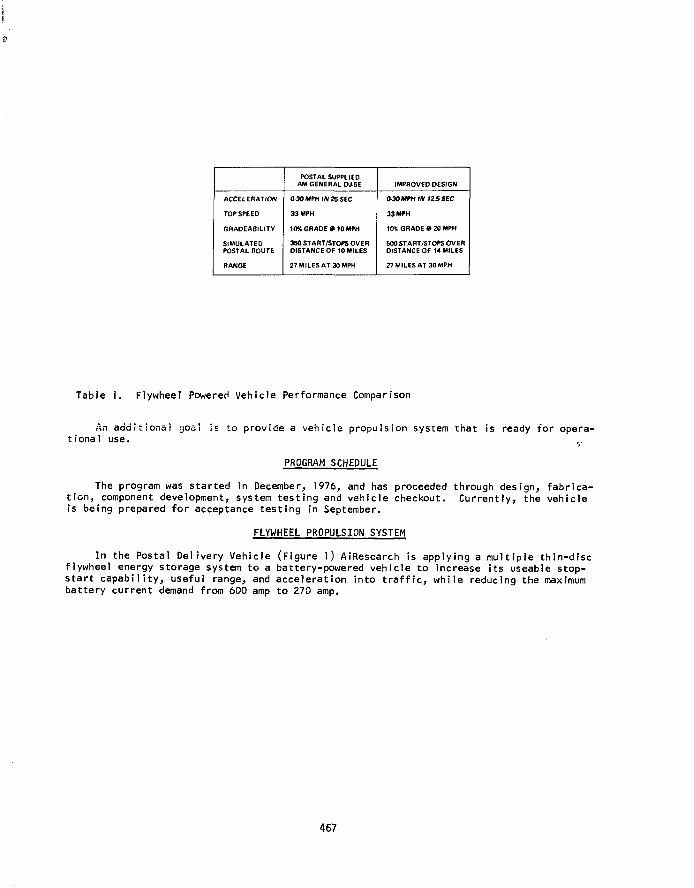
ACCELERATION
TOP SPEED
GHADEABILITV
SIMULATEDPOSTAL ROUTE
RANGE
POSTAL SUPPLIEDAM GENERAL DJSE
0 30 MPH IN 25 SEC
33 MPH
10* GRADE # 10 MPH
350 START/STOPS OVERDISTANCE OF 10 MILES
27 MILES AT 30 MPH
IMPROVED DESIGN
0-30 MPH IN 12.S SEC
33 MPH
10% GRADE 0 20 MPH
500 START/STOPS OVERDISTANCE OF 14 MILES
27 MILES AT 30 MPH
Table 1. Flywheel Powered Vehicle Performance Comparison
An additional goal is to provide a vehicle propulsion system that is ready for opera-tional use.
PROGRAM SCHEDULE
The program was started in December, 1976, and has proceeded through design, fabrica-tion, component development, system testing and vehicle checkout. Currently, the vehicleis being prepared for acceptance testing in September.
FLYWHEEL PROPULSION SYSTEM
In the Postal Delivery Vehicle (Figure 1) AiResearch is applying a multiple thin-discflywheel energy storage system to a battery-powered vehicle to increase its useable stop-start capability, useful range, and acceleration into traffic, while reducing the maximumbattery current demand from 600 amp to 270 amp.
467

FLVWHSEL CHARACTERISTICS
• ENERGY STORED 0.134 KWH• SPEED 2S.000 TO 36,000 RPM• NO. OF DISCS 6• SIZE 7.5 IN. OD. 0.44 IN. THICK• WEIGHT 33.2 LB• MATERIAL - 4340 STEEL
x VARIABLE V BELT DRiVE
GEARBOX
\ MOTOR
FLYWHEEL
Fig. 1. DOE/USPS Delivery Vehicle with Multiple Thin-Disc Flywheel ESU
The flywheel power unit replaces the original electric motor, and the flywheel assiststhe electric motor in propelling the vehicle, reducing the power required from the batteryduring peak-demand.transient operating periods. The flywheel is also used to regeneratethe braking energy. The electric motor drives the vehicle to 7 mph, reaching its full36,000-rpm speed. At that point the flywheel fluid coupling is engaged and the flywheelis used to drive the vehicle to its 33-mph cruise speed through the variable-ratio V-beltdrive. The process is reversed during braking; the traction wheels supply energy to theflywheel while slowing to 7 mph. Below 7 mph and during emergency stops, the servicebrakes halt the vehicle. During idle, the fluid coupling is disengaged and the flywheelis the only component that is rotating. A propulsion system block diagram is shown inFigure 2. The original battery is used with a revised controller and power train.
468

BATTERY 54V
POWER TRAIN
FLYWHEEL, COUPLING.MOTOR. GEARBOX, AND IVARIABLE VBELT | /
WHEELS
I CHARGER |
ANCILLARY EQUIPMENTLUBE/VAC SYSTEMRATIO CONTROLLER
DRIVERSCONTROLS
Fig. 2. Propulsion System Block Diagram
ELECTRICAL POWER INVERTER
The inverter provides a means to switch the D.C. battery power by electronicallycommutating at a frequency synchronous with the motor speed. The motor contains threeposition pickups that provide the co-nmutat ing signal for the application of current tothe 3 phase motor stator. In this manner, the inverter frequency varies as the motorchanges speed and is always "locked in" in a synchronous manner.
The inverter driver circuit also pulse-width modulates the transistors to controlthe motor torque and to limit the maximum allowable transistor current. Appropriatesnubbing devices and free-wheeling diodes dissipate the electrical energy remaining inthe motor winding when each transistor is switched off. The inverter is shown in Figure3, which is a photograph of the inverter and flywheel power unit installed in the vehiclechass is.
469

Fig. 3. Inverter and Power Unit Installation
Each of the six inverter legs is constructed by paralleling 16 transistors to achievethe required current carrying capacity to supply motor power. The transistor installationis shown in Figure 4.
Fig. 4. Inverter Transistor Installation
470

CONTROLLER
The controller installation is shown in Figure 5.
Fig. 5. Controller and Inverter Installation
The controller contains 13 circuit cards that include both the inverter logic and thevarious driver to power unit commands and control logic. Driver inputs are the foot pedalposition of the accelerator pedal and the brake pedal. Additional inputs are the forwardand reverse switch and the ignition and start switches.
The controller also senses the ;cle and flywheel speeds, flywheel engagement, andthe mechanicai transmission V-belt to que and ratio limit.
Commands are given to control the transmission ratio, to engage and disengage theflywheel, to modulate the inverter-to-motor power level, and to maintain the flywheel speedat a programmed value. The motor power is reversed to drive the vehicle in reverse.
SENSORS
The control system includes a number of sensors, which provide the required inputsignals. Some of these are continuously monitoring (such as flywheel speed), some indicatea specific condition (such as V-belt pulley limit), and others are operator controlled(such as the accelerator). The function of each of these sensors is described below.
Motor Rotor Position
There are three pickups which sense rotor position to provide information to theinverter logic so as to properly phase the stator field with respect to the rotor magneticpoles.
471
Motor Speed
A signal is taken from one of the rotor position sensors, which generate pulses whosefrequency is proportional to speed, to perform these functions:
1. A signal for motor-flywheel speed match for fluid coupling engagement.
2. A signal to indicate motor overspeed, which initiates these actions:
a. De-energize the fluid coupling solenoid to disconnect the fluid coupling.This prevents flywheel overspeed.
b. Shut off power to the motor.
c. Put the V-belt pulleys into min-min condition. This prevents motor overspeedby regeneration from the vehicle.
3. To provide an indication of low motor speed at "full" accelerator when underV-belt control. This is one condition required to initiate a V-belt ratio changeto a lower ratio (lower gear) to prevent motor sta]1 when climbing hills.
Flywheel Speed
A speed sensor is located at the outboard end of the flywheel shaft to provide thesefunctions:
1. Information for flywheel energy management.
2. Prevent flywheel overspeed:
a. De-energize the fluid coupling.
b. Shut off power to the motor.
c. Put the V-belt pulleys into min-min condition.
3. Indicate motor-flywheel speed match for fluid coupling engagement.
4. Provide signal for "at speed" condition which de-energizes the start switchholding relay.
FLYWHEEL POWER UNIT
The flywheel power unit block diagram is shown in Figure 6 and the interior view isshown in Figure 7.
472

FLYWHEEL
FLUIDCOUPLING
VARIABLE V-BELT^M«:1 TO 0.378:1
Fig. 6. DOE/USPS Delivery Vehicle Power Train
Fig. 7. Flywheel Power Unit
473

FLYWHEEL ASSEMBLY AND GEARBOX
Rotor - the rotor is constructed of 6 disks of 4340 steel that are attached to theshaft by a thermal interference fit.
Rotor Characteristics -
Kinetic Energy, 357,000 Ft-lb, at 36,000 RPM
Ip
O.D.
Length
Weight
, .0502 Ft-lb-secz
, 7.5 in.
, 2.64 in.
, 35 pounds
Housing - the flywheel housing forms the mounting and containment structn-e for all ofthe rotating components. The housing is shown in Figure 8 with the motor rotor and shaftalso shown.
Gearbox - the gearbox reduces the motor and flywheel speed through a two step gearratio of 11.74 to 1. The gears are helical, ground and hardened to minimize noise and reducewear. All bearings are rolling element type to reduce losses.
Lube/Vacuum - the lube and vacuum pump is a single internal gear pump that provides bothpumping functions. Oil and air are pumped from the flywheel cavity and pumped into anexternal tank. Atmospheric pressure in the tank provides the head to supply the lubricationand cooling circuits for the flywheel, motor and fluid coupling.
Fig. 8. Flywheel Housing
474

Fluid Coupling - the fluid coupling acts'as a clutch to engage the flywheel and motorwhen the propulsion system is accelerated to flywheel speed. The fluid coupling minimizesshock engagement and wear. Operation of the clutch occurs when lube oil fluid is intro-duced through an axial port in the rotating shaft into the coupling. A continuous bleedthrough the clutch prevents overheating the fluid.
The coupling consists of three separate details (l) a driving half, (2) a driven half,(3) a shroud that is fastened to, and rotates with the driving half, but encloses the cuterperiphery of the driven half.
MOTOR
The brushless D.C. motor consists of two principal eleme.ntsj a 3 phase stator winding,and a 4-pole permanent magnet rotor. In addition, 3 proximity probes are attached to themotor housing to supply position signals to the inverter.
The rotor uses samarium-cobalt magnets encased in a high strength inconel jacket.These magnets provide the field excitation required to generate the electro-magneticrotating field for electrical torque between rotor and stator. This torque is constant forany given value of stator current. Motor torque is increased or decreased by changing thestator current. The motor rotor and stator are shown in Figure 9 which also shows themechanically commutated D.C. motor used in the original electrical propulsion systeminstallation.
Fig. 9. Original and Replacement Electric Motors
475

MECHANICAL TRANSMISSION
The mechanical transmission provides an overall ratio change of 7 to 1 to transmitpower from-and-to the flywheel and the vehicle wheels.
The variable belt transmission consists of two pulleys, connected by a V-section belt,both of the pulleys being adjustable to vary the operating pitch diameter. >hotoqraphof the transmission is shown in Figure 10.
Fig. 10. Vari-belt Mechanical Transmission
The transmission ratio is controlled by reducing the axial spacing of the driver pulley,when accelerating. Torque transmission is proportional to the force applied against thepulley. The actuation system is shown in Figure 11.
ACCELERATOR PEDAL
Fig. 11. V-Belt Actuation System
476
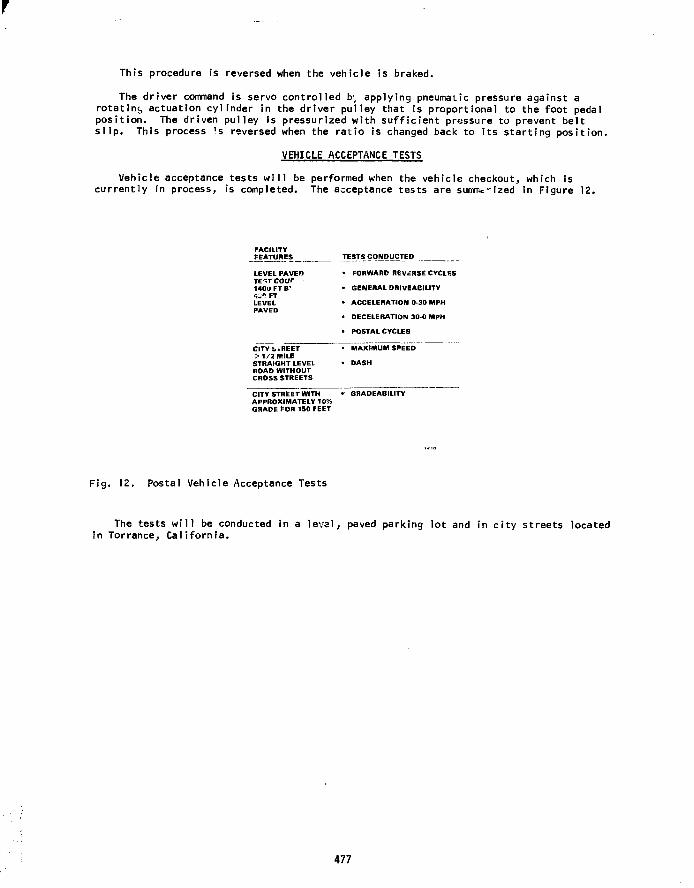
This procedure is reversed when the vehicle is braked.
The driver command is servo controlled b1, applying pneumatic pressure against arotating actuation cylinder in the driver pulley that is proportional to the foot pedalposition. The driven pulley is pressurized with sufficient pressure to prevent beltslip. This process is reversed when the ratio is changed back to its starting position.
VEHICLE ACCEPTANCE TESTS
Vehicle acceptance tests will be performed when the vehicle checkout, which iscurrently in process, is completed. The acceptance tests are summc-ized in Figure 12.
FACILITYFEATURES
LEVEL PAVEDTETTCOUr140U FT B'
LEVELPAVED
CITYiiREET> 1/2 MILESTRAIGHT LEVELROAD WITHOUTCROSS STREETS
CITY STREET WITHAPPROXIMATELY 10%GRADE FOR 150 FEET
TESTS CONDUCTED
• FORWARD REVERSE CYCLES
• GENERAL DRIVEABILITY
• ACCELERATION 030 MPH
• DECELERATION 300 MPH
• POSTAL CYCLES
• MAXIMUM SPEED
• DASH
• GRADEABILITY
Fig. 12. Postal Vehicle Acceptance Tests
The tests will be conducted in a level, paved parking lot and in city streets locatedin Torrance, California.
477

Project Title:
Principal Investigators:
Organization:
Project Goals:
Project Status:
Sub-contract Number:
Contract Period:
Funding Level:
Funding Source:
PROJECT SUMMARY
Regenerative Flywheel Energy Storage System
E.L. Lustenader, I.H. Edelfelt, D.W. Jones,A.B. Plunkett, E. Richter and F.G. Turnbull
General Electric CompanyCorporate Research and DevelopmentSchenectady, New York 12301
To laboratory test a flywheel energy recovery system sizedfor a 3000 pound class battery/flywheel electric vehicle.To perform propulsion system tests simulating an electricvehicle operating under various SAE driving cycles (sched-ules A,B,C,&D). Establish the range improvements attributedto the flywheel. Conduct a life cycle cost comparison ofthree vehicles: ICE, Battery & Battery/Flywheel.
All hardware for the flywheel energy propulsion system hasbeen designed, fabricated and installed in the laboratory.Components include:• An energy storage package comprised of a 20,000 rpm,
six pole, solid rotor inductor type flywheel drive motorcoupled to a steel flywheel. This energy storage pack-age is designed to recover 105 watt hrs. of braking en-ergy.
• An 8 SCR load commutated inverter, a hybrid reverserand an inverter control for powering the energy storageunit.
• A separately excited DC propulsion motor, a flywheel tosimulate vehicle inertia, an electrical load machine toprovide road loss, and a torque transducer to measurethe propulsion motor torque.
• A 108 volt lead acid battery bank to provide the pro-pulsion energy.
System control and data acquisition will be done using twocomputers operating in real time. The computer softwarehas been written and is now being debugged. The systemhas been operated in the following modes:t Acceleration of the flywheel from the battery.• Transfer of energy from the flywheel to traction motor.• Operation of traction motor from battery source.t Regeneration from traction motor to flywheel unit.
Operation of the total system on the SAE J227? D cycle hasnot yet been accomplished. The life cycle cost comparisonhas been completed.
8990503
FY 78, 79
$538,878
U.S. Department of Energy, Lawrence Livermore Labs.
479
REGENERATIVE FLYWHEEL ENERGY STORAGE SYSTEM
E.L. Lustenader, I.H. Edelfelt, D.W. Jones,A.B. Plunkett, E. Richter and F.G. Turnbull
General Electric CompanyCorporate Research and Development
1 River RoadSchenectady, New York 12301
ABSTRACT
This paper describes the current status of a program to develop and evaluate a regener-ative flywheel energy storage system. The system has been designed for a battery/flywheelelectric vehicle in the 3000 pound class. Planned laboratory tests will simulate this elec-tric vehicle operating over the SAE J227a Schedule D driving cycle. The range improvementattributed to the use of the flywheel will be established. The flywheel energy storage sys-tem will consist of a solid rotor, synchronous inductor-type flywheel drive machine electri-cally coupled to a DC battery electric propulsion system through a load commutated inverter.The motor/alternator unit is coupled mechanically to a small steel flywheel which provides aportion of the vehicle's accelerating energy and regenerates the vehicle's braking energy.The laboratory simulation of the electric vehicle propulsion system will include a 108 voltlead-acid battery bank, a separately excited DC propulsion motor coupled to a flywheel whichsimulates the vehicle's inertia, and the flywheel energy storage system comprised of themotor/flywheel unit, the load commutated inverter and its control.
INTRODUCTION AND BACKGROUND
A flywheel energy storage system was initially conceived by General Electric and pro-posed for demonstration to the Department of Energy, Division of Energy Storage Systems.The overall objective of the program was to demonstrate new technology associated with a fly-wheel energy storage system comprised of a composite flywheel coupled directly to an AC syn-chronous motor/alternator. The motor/alternator/flywheel unit would be hermetically sealedwith the rotating assembly operating in a low pressure helium atmosphere. The motor/alterna-tor would receive power from a solid state inverter/rectifier unit designed to provide thenecessary frequency control from a constant DC voltage power supply.
A follow-on to Contract EY-76-C-02-4010, which is che subject of this paper, was initi-ated in March 1978. The specific objective of this new program is to laboratory tsst an im-proved flywheel energy recovery system sized for a battery/flywheel electric vehicle weigh-ing about 3500 pounds. Laboratory tests will be made to simulate the electric vehicle oper-ating under the SAE J227a Schedule D driving cycle. The objective is to determine the rangeimprovement that can be attributed to the use of a small flywheel in combination with thebattery bank.
SCOPE OF CURRENT PROGRAM
To achieve the program objective, an improved flywheel energy recovery propulsion sys-tem was designed, fabricated, and installed in the laboratory. The scope of the overall pro-gram was as follows:• Establish specificalions for the regenerative flywheel energy storage system and prepare
a test plan. These specifications were based on tradeoff studies among system weight,component efficiency, and performance.
t Design a new, improved, inductor motor/flywheel energy storage package for a 3000 poundclass electric vehicle. Test results from the first phase of the DOE program wereutilized in arriving at this design.
480

• Design a new inverter. The fourteen SCR inverter/rectifier which was demonstrated onthe first contract was replaced by a new eight SCR unit and a hybrid reverser. Theuse of a hybrid reverser, composed of diodes and a power contactor, obviates the needfor the six additional SCR's originally proposed for braking.
• Test the regenerative flywheel energy storage propulsion system in the laboratory. Inorder to simulate an actual driving cycle, a load flywheel was designed to simulatethe inertia of the 3000 pound vehicle. This was coupled directly to a new separatelyexcited DC propulsion motor.
The simulated propulsion system consists of a 108 Volt lead-acid battery bank, the DCpropulsion motor with load flywheel, and the regenerative flywheel energy storage system.Tests will be conducted on the equipment to simulate the vehicle in operation. The equipmentwill be operated to establish the performance of the regenerative flywheel energy storagesystem as if it were performing in an electric vehicle. It will be operated over the simu-lated driving cycle, and measurements will be made to determine the energy required per cycle.Data will be reduced and the results analyzed and compared to the predicted performance.Results will provide an estimated range and power consumption for a 3000 pound class electricvehicle with this type of flywheel/battery propulsion package.
OVERALL VEHICLE SYSTEM STUDIES
In analyzing the performance of a flywheel/battery powered.vehicle operating on a dutycycle such as the SAE J227a Schedule D, a number of operating modes were evaluated.
The final mode selected is shown in Figure 1. The shaded area represents energy sup-plied by the flywheel.
Energy stored in the flywheel is used to supply the drive motor armature power duringthe initial stage of acceleration. This results in power not being required from the batteryby the motor armature until the back EMF of the traction motor exceeds battery voltage. Atthis point, flywheel energy is used uniformly over the remainder of the accelerating periodwith the additional required armature power being supplied by the battery. Cruise power issupplied totally by the battery. Braking energy is recovered and stored in the flywheel.System losses are supplied to the flywheel from the battery during the idle period.
The projected range of the vehicle in this mode of operation is shown in Figure'2.
FLYWHEEL ENERGY STORAGE PACKAGE
ELECTRICAL DESIGN
The electrical machine finally selected from tradeoff studies was a 6-pole machine oper-ating with a maximum speed of 20,000 rpm, with a rotor radius of 3.6 inches and a rotorlength of 3.41 inches. A cross section of the machine is shown in Figure 3.
MECHANICAL DESIGN
The inductor machine portion of the rotating assembly, including the six poles and thecentral shaft, is machined from a magnetic steel billet (AISI 4340). Steel shafts of non-magnetic, austenitic steel are welded to both ends of the pole bearing section in order tominimize flux leakage, which tends to saturate the magnetic iron and magnetize the ball bear-ings, making them traps for magnetic wear particles. The stub shafts are hollow to reduceweight.
DESIGN STRESSES
The energy stored in the inductor motor rotor is approximately 15 watt-hours over thespeed range of 10,000 to 20,000 rpm. An additional 90 watt hours is stored in the flywheel.
481

The flywheel operates at a relatively modest stress level in order to produce a factor ofsafety of 2.0 relative to the 10' cycle curve for alternating stress.
POWER CONDITIONER & CONTRO!
POWER CONDITIONER
The power conditioner is a load commutated inverter similar to the system provided byGeneral Electric under the previous contract (EY-76-C-02-4010). The new unit, however, islighter and smaller than the original load commutated inverter (LCI), since it requires onlysix power thyristors instead of twelve. Reversal of power flow is provided by a hybrid re-verser (two diodes and two contactors) rather than a second set of six thyristors. Figure 4shows the new eight SCR inverter. A block diagram of the entire laboratory system is shownin Figure 5. The four major components for the electrical portion of the drive system (bat-tery, propulsion motor, hybrid reverser, and load commutated inverter/rectifier) are showntogether with the electromagnetic contactors that connect the various components in theseveral configurations in which the system operates.
Figure 6 shows the power and auxiliary thyristors of the load commutated inverter/recti-fier- In this system, power flow is accomplished by reversing the direction of the DC volt-age while maintaining the current flow from the thyristors in the same direction. The twoauxiliary thyristors and the single commutating capacitor connected to the synchronous motorneutral terminal for starting are similar to those provided in the previous contract.
This configuration of the power circuit was chosen to permit recharging of the flywheelfrom the battery during conditions of either vehicle stopped or cruise speed operation.
The electrical requirements of the load commutated inverter (relating to its DC side)when operating over a simulated SAE J227a Schedule D driving cycle are given in Figure 7.Negative current indicates power flow either from the propulsion motor, which acts as a gen-erator during braking, to the flywheel or from the battery to the flywheel. During the con-dition in which the battery is supplying power to the propulsion motor or to the flywheelmotor, the voltage will be in the range of 75 to 108 volts depending on the state of bat-tery charge.
SYSTEM CONTROL
The control system is required to regulate the operation of both the energy storageflywheel system and the vehicle traction motor. The control system uses two computers oper-ating in real time. The first is a Digital Equipment Corporation PDP 11/34 used primarilyin an overall supervisary role controlling driving cycle modes, acquiring the data from thesensors, outputing lower speed analog and digital signals to the second computer and print-ing out the summary data. The second computer is an Electronic Associates Inc. EAI 681hybrid controller used for the high speed real-time analog control loops for the load com-mutated inverter together with high speed calculations of analog parameters. The digitalportion of this computer is used for the initial starting and accelerating of the flywheeltogether with the determination of several of the driving cycle mode transitions. Figure 8shows the interrelationship between the two computers and the experimental set-up togetherwith the interface between hard-wired control cards and sensors and software control accom-plished on the computers.
Figure 9 shows the location of the electrical and mechanical signals used by the con-trol system for data acquisition and control of the entire flywheel energy storage and sim-ulated vehicle systems. In order to scale the electrical signals and provide electricalisolation, commercially available transformer isolated gain modules were provided.
The primary control loop for the load commutated inverter consists of an outer currentregulator together with an inner angle loop to maintain synchronism between the synchronous
482
motor and the load commutated inverter. This control system does not require a mechanicalshaft position sensor.
In addition to the primary control system, two field current controls are required.One is for the flywheel motor, which will simply vary the flywheel motor field current as afixed function of inverter DC link current, flywheel speed, and DC link voltage. The secondcontrol is for the traction motor field which will remain fixed at low vehicle speeds butmust be varied at high speeds to regulate the armature current during those periods when thebattery supplies all the power to the propulsion motor. The two field currents are also con-trolled as a function of the mode of operation of the system. For example, during mode 3(steady-speed operation), the flywheel is inactive and its field current is programmed to afixed low value. This will reduce the machines losses when integrated over the duty cycle,thereby improving its energy efficiency. Sufficient field excitation must be provided inorder that the inverter control can always be synchronized with the machines back EMF.Similar reductions in the traction motors' field current occur during mode 6 when thevehicle is stopped and there is no need for field excitation.
(n a similar manner, the armature current from the traction motor (IA) and the DC cur-rent from the flywheel energy storage system (IDC) are also controlled and regulated as afunction of the vehicle operating mode. This system is more complex than the field currentregulators because during mode 2 (acceleration above the motoring corner point) both currentregulators must be active in order to share the total current supplied to the traction motor.A more detailed block diagram of the DC current regulating loops that are active in each modeof vehicle operation is shown in Figure 10.
SYSTEM TEST
An existing laboratory test facility has been modified for use on this contract. Thefacility includes a new separately excited DC propulsion motor, a flywheel simulating vehicleinertia, an electrical load machine to provide road loss, and a torque transducer to measurethe propulsion motor torque. Figure 11 shows this assembly installed in the laboratory.This equipment together with a 108 volt battery bank, the inverter/rectifier, the inductormotor/alternator/flywheel package, and the hybrid controller has been assembled in the labo-ratory for component and system testing.
Figure 12, from left to right, shows the computer programmable DC po..er supplies used toprovide field current to the three rotating machines, the breadboard load commutated inverter,the DC contactor panel and on the right, the hard wired inverter logic and gating controlcards. At the far right is an eight channel recorder used for data presentation and systemdebugging.
The two digital computers used for system control, data acquisition, and repetitivedriving cycle control were existing laboratory equipment programmed for this specific project.Each computer has associated with it a set of peripheral equipment for input/output and com-munication with the operator. Examples are graphics terminals with hard copy capability,disks for program and data storage and line printers. Figure 13 shows the system programmersoperating the PDP 11/34 terminal and in the background, the EAI 681 analog panel.
Major computer sub-routines are programmed on the digital portion of the EAI hybridcomputer. Since the system operates in a real-time mode, the entire program is interruptdriven from a fixed time increment clock. A start sub-routine is used to control the initialstart up of the flywheel energy storage system. This separate operation is not repeatedduring the driving cycle tests as it is not one of the normal repetitive modes of operation.
In a similar manner, the PDP 11/34 computer sub-routine operates in real-time interruptmode. The repeat time internal is 100 milliseconds. This rapid and repetitive acquisitionof the data provides for accurate integration and summation of the rapidly changing measuredquantities. The data is written to a file for later data analysis and graphing after theseries of driving cycles has been completed.
483

STATUS
At the time of preparation of this paper, the system has operated in each of its con-trol modes. The flywheel has been charged from the battery, this energy transferred to thetraction motor, traction motor operated at full speed and regenerated to the flywheel. Thecontrol is being debugged and a complete D cycle with measurements is anticipated shortly.
ACKNOWLEDGEMENT
This work is sponsored by the U.S. Department of Energy under a subcontract (No.8990503) from the University of California Lawrence Livermore Laboratory. Mr. Thomas Barlowof LLL has been the Technical Monitor for the program.
Accel Hhi Cruise
Battery
Coast-'
1
• |«—Idle—H
^ Brake
4—Battery
K88888I
Fig. 1.
110
100
90
80
70
60
so
-Time
FlywheelRDC-23149£1
Power Time Profile for DrivingCycles.
Zero Weight Flywheel PropulsionPackage Differential
3700 Ib Total (vehicle andpassengers)
^200 Ib Flywheel PropulsionPackage Differential
3900 Ib Total (vehicleand passengers)
Mode 4 - 7.307 Gear RatioOptimum Battery Current During Idle
-Basic 3700 Ib Vehicle w/o Flywheel Packageox Battery Regeneration
Fig. 2.
60 80 100
In/Out Flywheel Efficiency (%)RDC-229W4
Flywheel Augmented Vehicle Range.
RDC-23143-53
Fig. 3. Detailed Layout of Flywheel EnergyRecovery Unit.
484

RDC-22783-5
Fig. 4. Load Commutated Inverter.
RDC-22960
Fig. 5. Schematic Diagram of SimulatedPropulsion System.
RDC-22996-2
Fig. 6. Load Commutated Inverter/RectifierPower and Commutating Circuit.
E 101)
10 sec
125 A
10 20 30 40 50 60 70 80 90 100 110 121
-200
230 A
-300 -
RDC-22994-1S
Fig. 7. Inverter DC Current vs. Time.
RDC-23149-58
Fig. 8. Control System Block Diagram.
ReidCurrent
andVoltage
Traclion VoltigeMotor
b) Vehicle Instrumentation
LoadFlywneel
Toroueand
Speed
f \ r i Simulated
\ J ¥ LossesGenerator | \
ROC-22994-21
Fig. 9. Electrical and Mechanical Signalsfor Control and Data Acquisition.
485

DATA FROMPREVIOUS
RUN (EXCEPT FOP.MODE 3 SPEEDS/
ACCELTIME <
SPEED-us MPH;
MEASURED - |SPEED
MODE 4(COAST, "
BRAKETIME
MINIMUMFLYWHEEL
SPEED
MAXIMUMFLYWHEEL
SPFED
MODE I & 2CURRENT
'DC i 9 *TO ISWITCH'
MODE 3
TRACTION» f /O lOP
MODE 4CURRENT d
MODE 'jCURRENT ri
MODE 18?TM CURRENT °Dt i r
/ITCHjl
MODtSWIT'
f L <WHf U- MOTOR
MODE ATM CURRENT
o-s -4
•15 . J I
MODITM CUR&ENI
RECHAR&fCURREW7
RDC-23149-60
Fig. 10. DC Armature Current Control Modes. Fiq. 11.
RDC 22783 13
Propulsion Motor, Torque Transducer,Flyv/heel and Road Loss Generator.
Fig. 12. Breadboard Power Conditionerand Control.
Fig. 13. Computer System in Operation.
486

Project Title:
Principal Investigator:
Organization:
Project Goals:
Project Status:
Contract Number:
Contract Period:
Funding Level:
Funding Source:
PROJECT SUMMARY
LLL/AiResearch Advanced Energy Storage Unit Development Program
Leo V. Norrup
AiResearch Manufacturing Company of CaliforniaA Division of the Garrett Corporation2525 West 190th StreetTorrance, California 90509
To design and build an advanced state-of-the-art flywheel energystorage unit (ESU) that represents a step increase in technologyand provides a baseline standard of performance.
The ESU has been designed and the hardware fabricated. A summaryof the testing is as follows:
Testing Status - the maximum lube-coolant pump power was determinedto be 35 W. The variable frequency, variable voltage electricalpower drive is in place and operational. The electronic con-troller, which is used to automatically control the ESU, has beenchecked-out in the system.
Problems Encountered - the major effort has been expended tryingto trim balance (at speed) the ESU rotating grouH. During thebalancing process.it was determined that the molecular pump wasnot performing to specification, i.e., the minimum flywheelcavity chamber pressure attained was 40-microns at 40,000 rpm.The successful balancing of the unit was nearly completed whenthe motor rotor failed during test. A failure investigationdetermined that 2 to 3 bars of the cast copper rotor had faileddue to casting porosity.
Corrective Action - the molecular pump stator geometry was changedfrom 4 lands and grooves to 3. Prior to the motor failure, i ....sdetermined that the ESU had a moment unbalance. An additionalprobe will be attached at the lower end of the rotating groupaid in trim balancing during test. A high strength back-up rotor,fabricated using extruded zirconium-copper, is available. Thisresults in a porosity free rotor.
9676603
May 1, 1978 to November 30, 1979
$593K
University of California, Lawrence Livermore Laboratory
487
LLL/AIRESEARCH ADVANCED ENERGYSTORAGE UNIT DEVELOPMENT PROGRAM
Leo V. NorrupAiResearch Manufacturing Company of California
A Division of the Garrett CorporationTorrance, California
ABSTRACT
This paper includes a review of the LLL/AiResearch advanced flywheel energy storageunit (ESU) development program. The program scope and goals are stated. A description ofeach of the major hardware subassemblies is included. The development test program tasksare defined and a summary of the testing in terms of status, development problems, andcorrective actions is discussed.
The energy storage unit is a self-contained, hermetically sealed, package thatfeatures a light-weight composite material flywheel and a high-power density electricalinput/output machine. The-ESU was designed for a vehicular application.
INTRODUCTION
The need to reduce dependence on petroleum sources for energy generation hascreated a substantial interest in the investigation and development of energy storagedevices. The flywheel energy storage unit can provide substantial benefits to trans-portation propulsion systems. The flywheel can supply high power demands and therebyprovide a method for load leveling the primary energy supply. This energy supply canbe an electrochemical battery or a liquid-fueled heat engine power converter. Inadditirn, the flywheel can accept vehicle kinetic energy during braking (regeneration)at a rate limited only by the transmission power capability. This method of vehicleenergy storage can also be applied to third rail, electrically-powered vehicles, orstation-charged electrically-powered vehicles.
The LLL/AiResearch flywheel energy storage unit (ESU) technology developmentprogram was initiated to demonstrate the advanced state-of-the-art in flywheel ESUtechnology and to provide actual hardware that is suitable for integration into avehicular propulsion system. The availability of the hardware will allow the benefitsof flywheel mechanical energy storage (HES) to be assessed in an operational environ-ment.
PROGRAM GOALS
The program was established with two goals in mi.id:
• To design and build an advanced state-of-the-art flywheel ESU that representsa step increase in technology and provides a baseline standard of performance,and
• To configure the ESU such that it may serve as a test bed for demonstrationand evaluation of other flywheel concepts.
488

The current state-of-the-art ESU technology for a unit with a total energy storagecapacity of 250 Whr is 1.1 Whr/lb (Fig. 1). The specific energy goal for this program'sunit is 3.0 Whr/lb. It is evident that as the amount of stored energy increases for afixed power output, the specific energy of the ESU will increase (Fig. 1).
IMPROVED COMPONENTS
GOAL = 3.0 WH/LB
STATE-OF-THE-ART = 1.1 WH/LB
TECHNOLOGY GUIDELINELARGE UNITSFOR BUSES.ALL FLYWHEEL
6
2 r
EN
ER
GY
/PO
WE
R R
AT
(NO
RM
ALI
ZED
)
I < 1 ;
SIMVELO/
t
M.LUHICLEkD-LE
-
NITSUSE
VELIft
f
FORING, ETC.
> 1
y
-USE. ETC. - |
/
/
/
/
/
sTOTAL ESU SPECIFIC ENERGY. W-HR/LB
Fig. 1. Program Goal and Technology Guideline
ESU DESIGN APPLICATION
The maximum benefits that may be gained by the incorporation of mechanical energystorage (MES) into vehicular propulsion systems are obtained by combining the conceptsof load-leveling the prime source(s) and recovering vehicle kinetic energy by regeneration.These benefits are inutitively achievable and large, and have been indirectly demonstratedin past programs. There has been extensive analytical work done to configure and evaluatevehicles with hybrid heat-engine propulsion arrangements. These evaluations have covereda spectrum of vehicles from a 40-ft bus to a 4-passenger commuter car.
A flywheel MES/heat-engine hybrid propulsion system was designed for a 1985 familysedan that incorporates the LLL/AiResearch ESU, (Fig. 2). The sedan has a curb weightof 3000 lbs and is equipped with a transverse-mounted 1.5-liter spark-ignition heatengine. The flywheel/heat engine hybrid propulsion system shown in this figure providesthe sedan with transient performance that is normally associated with vehicles equippedwith large V-8 engines. The fuel economy of the sedan over the Federal urban drivingcycle (FUDC) is predicted to be 40 mpg.
489

ESU DESIGN APPLICATION
SALIENT FEATURES • 1985 FAMILY SEDAN
• 3600 LB. TEST WEIGHT
• 1.5LICE (GASOLINE)
o 0.250 KWHR FLYWHEEL
• 40 MPG (FUDC)
•0-60MPH 13 SECONDS
Fig. 2. ESU Design Application (Vehicular Use)
A summary of the ESU program scope is shown in Fig. 3. The four major tasks areidentif ied and their relative time phasing depicted. The 19-month program was in i t iatedMay 1, 1978 and is scheduled to be complete November 30, 1979. The purpose of Task 1,Design Tradeoffs, was to determine the best flywheel/electrical input-output machine/bearings/lubrication/and vacuum system combination such that the resulting ESU assemblymeets the program goals and design cr i ter ia that was established for the vehicularapplication. Task 4, Testing and Evaluation, is currently in progress and is scheduledto be complete within the identif ied 9-month period.
PROGRAM SCOPE
MAY J . 1 9 7 8 -
TASK1DESIGN TRADEOFFSSTUDY REPORT
TASK 2
HARDWARE DESIGN
TASK 3HARDWARE FAB
TASK 4TESTING AND EVALTEST REPORT
MONTHS AFTER START OF PROGRAM1978
M J J A S 0 N!D1979
J F M A
(i%
M J J A S 0 N
Fig. 3. Program Scope
490

TRADEOFF RESULTS
The major tradeoffs were performed for the flywheel and the electrical machine.
FLYWHEEL TRADEOFFS
The flywheel tradeoffs considered weight, speed, material, and containment. Twomaterials were included, Kevlar and S-glass. The rim velocity limits were 2500 fps and2200 fps, respectively.
The weight shown on Fig. 4 includes rotor, containment! molecular pump, and flywheelhousing. This weight is plotted against flywheel diameter and reaches a minimum at 42,000rpm for the S-glass 12 inch diameter configuration. However, Kevlar was chosen as the rimmaterial because of the experience derived by development work on composite flywheelrotors for the Department of Energy Near Term Electric Vehicle program. The weightdifference between the two materials is minor and the program risk was minimized.
FLYWHEEL TRADEOFFRESULTS
SELECTED GEOMETRY42.000 RPM AND MATERIAL
12 14 IS 18 30FLYWHEEL RIM DIAMETER. INCHES
Fig. 4. Flywheel Tradeoffs
ELECTRICAL INPUT/OUTPUT MACHINE TRADEOFFS
Five types of machines were parametrically designed in terras of weight, speed range,and part power efficiencies. They are identified in Fig. 5. Each machine's best weight,which corresponds to its weight at the indicated speed, is listed along with its charac-teristic efficiency. The upper limit on speed was established based on mechanicalconstraints (vibratory and strength) in terms of rotor length/diameter ratio and tip speed.
The induction machine was determined to be the most compatible with the compositeflywheel technology in the energy level of interest. The composite flywheel/inductionmachine combination results in a minimum weight ESU. The induction machine is also theleast costly of the candidates to produce in quantity.
491
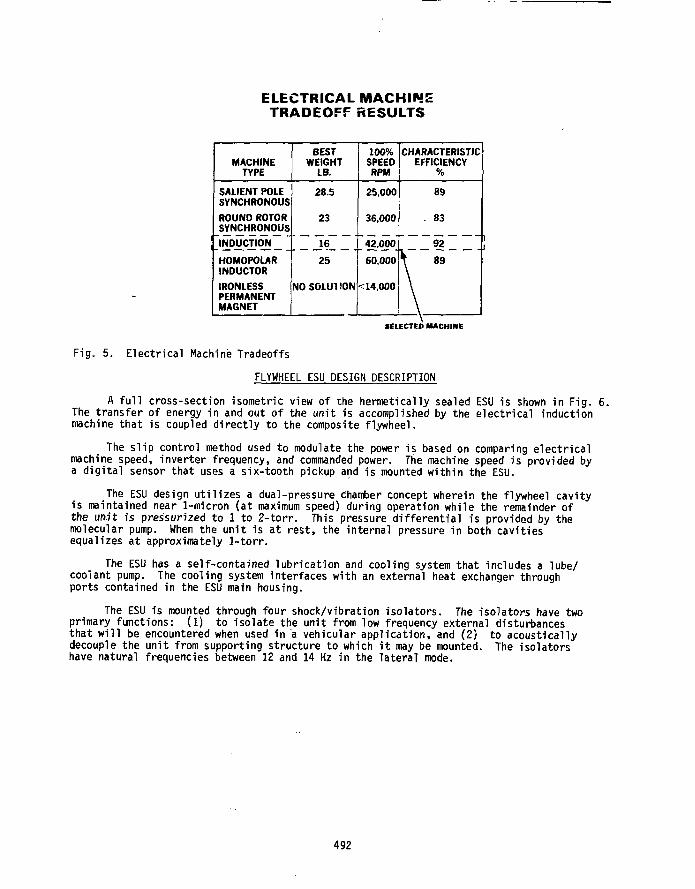
ELECTRICAL MACHINETRADEOFF RESULTS
MACHINETYPE
SALIENT POLESYNCHRONOUS
ROUND ROTORSYNCHRONOUS
INDUCTION
HOMOPOLARINDUCTOR
IRONLESSPERMANENTMAGNET
BESTWEIGHT
LB.
28.5
23
16
25
NO SGLU1 ION
100%SPEEDRPM
25,000
36,000
42.0001
60.000
<14,000
CHARACTERISTICEFFICIENCY
%
89
. 83
^ 92
VSELECTED MACHINE
Fig. 5. Electrical Machine Tradeoffs
FLYWHEEL ESU DESIGN DESCRIPTION
A full cross-section isometric view of the hermetically sealed ESU is shown in Fig. 6.The transfer of energy in and out of the unit is accomplished by the electrical inductionmachine that is coupled directly to the composite flywheel.
The slip control method used to modulate the power is based on comparing electricalmachine speed, inverter frequency, and commanded power. The machine speed is provided bya digital sensor that uses a six-tooth pickup and is mounted within the ESU.
The ESU design utilizes a dual-pressure chamber concept wherein the flywheel cavityis maintained near 1-micron (at maximum speed) during operation while the remainder ofthe unit is pressurized to 1 to 2-torr. This pressure differential is provided by themolecular pump. When the unit is at rest, the internal pressure in both cavitiesequalizes at approximately 1-torr.
The ESU has a self-contained lubrication and cooling system that includes a lube/coolant pump. The cooling system interfaces with an external heat exchanger throughports contained in the ESU main housing.
The ESU is mounted through four shock/vibration isolators. The isolators have twoprimary functions: (1) to isolate the unit from low frequency external disturbancesthat will be encountered when used in a vehicular application, and (2) to acousticallydecouple the unit from supporting structure to which it may be mounted. The isolatorshave natural frequencies between 12 and 14 Hz in the lateral mode.
492

FLYWHEELESU
FLYWHEEL
MOLECULARPUMP
LUBE/COOLANTPUMP
Fig. 6. Flywheel ESI (Isometric View)
FLYWHEEL ENERGY STORAGE UNIT
A photograph of the hermetically sealed flywheel ESU assembly is shown in Fig. 7.The unit is 19.3 in. high and has a maximum diameter of 15.1 in. The upper cover/con-tainment vessel is made of steel, and the main housing and lower cover/sump are made ofaluminum. The three electrical power connectors are visible in the photograph, as wellas the multi-pin connector that is used for instrumentation.
The electrical input/output machine maximum power transfer is 45 kW which isavailable at all operating speeds between 21,000 and 42,000 rpm.
The total weight of the ESU is 79 lb. This weight corresponds to a total ESUspecific energy of 3.16 W-hr/lb and a specific power of 569 W/lb. The ESU specificenergy exceeds the LLL/AiResearch program advanced state-of-the-art goal of 3.00 W-hr/lb.It is estimated that the unit will have a maximum quiescent loss 205 W.
FLYWHEELENERGYSTORAGEUNIT
SALIENT FEATURES• HERMETICALLY SEALED• ELECTRICAL INPUT/OUTPUT• PEAK POWER TRANSFER - 45 KW• TOTAL WEIGHT - 79.04 LB• SPECIFIC ENERGY - 3.16 WHR/LB• SPECIFIC POWER - 569 W/LB• MAX. QUIESCENT LOSSES (EST.) - 205 WATTS
Fig. 7. Advanced State-of-the-Art Flywheel ESU
493

rFLYWHEEL ASSEMBLY
A photograph of the ESU flywheel assembly is shown in Fig. 8. The six-bolt attach-ment method, the hub geometry, and the nine individual composite rings are visible in thefigure. The hub geometry is machined to approximate a constant stress configuration.
The flywheel rotor attaches to the upper end of the main shaft assembly by meansof six high-strength bolts. The four-spoked hub is machined from 7075-T7351 aluminumalloy plate. The flywheel rim is composed of nine concentric annular rings of circum-ferential^ wrapped composite material consisting of fiber and epoxy.
The flywheel rotor weighs 14.5 lbs and stores 250 Whr of energy at a peripheralspeed of 2500 fps. The flywheel rotor has an energy density of 17.25 Whr/lb, and a designcycle life of greater than 100,000 deep discharge cycles.
FLYWHEELASSEMBLY
SALIENT • STORED ENERGY- 0.250 KWHR
FEATURES • TOTAL WEIGHT - 14.5 LB
• ENERGY DENSITY- 17 25 WHR LB
• TIP SPEED - 2500 FPS
" " " ' • CYCLE LIFE - 100,000 (FULL CYCLES)
Fig. 8. Flywheel Assembly
FLYWHEEL CONSTRUCTION FEATURES
The flywheel construction features are shown in Fig. 9. The assembly has an overalldiameter of 13.70 in., and a hub diameter of 11.44 in., with a radius ratio of 0.835. Thecomposite rim is made up of nine concentric rings with a total thickness of l.lj in. anda width of 2.70 in. The innermost ring is made of S-2 glass/epoxy. The use of nineseparate rings reduces the bending stresses in the rings caused by flexing during rota-tional speed changes and prevents ring delamination.
The method of attaching the rim to the hub provides a positive load path under alloperating conditions. Attaching the two components is accomplished by distorting thecircular rim into a semi-rectangular shape and slipping it onto the hub. The rim is heldupon the hub by the residual forces in the rim as it tries to become circular again. Theseresidual forces are controlled by the relationship between the hub spokes outside diameterand the rim inside diameter. The hub OD is always greater than the rim ID. The woundconcentric ring design utilizes the composite fibers in nearly uniaxal tension.
494

A continuous operating temperature limit of 175 F is established for the flywheel bythe strength-temperature characteristic of the epoxy matrix material.
In this design, the hub stores 20 percent of the energy, which is a relatively largepercentage. The remaining 80 percent is stored in the composite rim.
FLYWHEELCONSTRUCTION
2.70
RIM DESCRIPTION
• TOTAL NUMBER OF RINGS - 9
• RING MATERIAL
• 1 S-2 GLASS/EPOXY
• 2 THRU 4 KEVLAR 29/EPOXY
• 5 THRU 9 KEVLAR 49/EPOXY
OPERATING TEMPERATURELIMIT
• 175 F CONTINUOUS
ENERGY CAPACITY
• HUB - 0.05 KWHR
• RIM - 0.20 KWHRCENTERLINE
i J
Fig. 9. Flywheel Construction Features
ESU ELECTRICAL MACHINE
A photograph of the ESU electrical machine components (rotor and stator) is shown inFig. 10. The machine is a 3-phase, 2-pole, induction device that is 4.80 in. long and4.51 in. in diameter. It has a maximum operational tip speed of 423 fps, a peak efficiencyof 93 percent, and a total weight of 19.84 lb. The machine is designed for continuousoperation over a duty cycle based on the SAE J227 (A) schedule D driving cycle. It isoptimized to operate between 21,000 and 42,000 rpm with corresponding line-to-neutralvoltages varying between approximately 44 and 58 v. These voltage levels are compatiblewith a 180-vdc battery pack.
ESUELECTRICAL
SALIENT FEATURES , . V V MACHINE
• 1 :>' %3 PHASE. 2 POLE INDUCTION
Zl CU FABRICATED ROTOR
M19 STEEL LAMINATIONS
TIP SPEED 423 1ps
PEAK EFFICIENCY 93 '
WEIGHT• ROTOR 6 70 LB• STATOR 13 14 I.B
' POWER RATING• CONTINUOUS 30 KW• PEAK 45 KW
Fig. 10. Electrical Machine's Components and Features
495

VMOLECULAR PUMP
A photograph of the molecular pump components (rotor and stator) is shown in Fig. 11.The pump is used to provide a very high vacuum level in the flywheel cavity during ESUoperation to minimize the aerodynamic losses. When the flywheel is at rest, the ESUinternal ambient pressure is approximately 1-torr. As the flywheel speed is increased,the molecular pump begins to evacuate the flywheel cavity. At one-half flywheel speedthe pressure ratio across the pump is approximately 20:1, which translates to a cavitypressure of 50-microns. A maximum pressure ratio of approximately 700:1 is reached at100 percent flywheel speed (42,000 rpm), which results in a cavity pressure of 1.4-microns.
The total weight of the molecular pump (rotor and stator) is 3.7 lb.
MOLECULARPUMP
STATOR
ROTOR
ESU SHAFT
SALIENT FEATURES
• ESU AMBIENT PRESSURE -lOOOfl
• STATOR/ROTOR CLEARANCE - .012 INCHES
• FLYWHEEL CAVITY PRESSURE• 42.000 RPM F/W SPEED - 1.4M• 21.000 RPM F/W SPEED - 5OH
• WEIGHT- 3.69 LB.
Fig. 11. Molecular Pump Components and Features
LUBE/COOLANT PUMP
A photograph of the unit's lube/coolant pump assembly is shown in Fig. 12. The pumpassembly is mounted to the bulkhead, which also contains the lower bearing support. Thus,the pump can be installed and mechanically checked (gear alignment, backlash, etc.) priorto installation of the oil pump cover. The pump is driven by a pinion gear that ismachined directly on the end of the ESU main shaft.
The gear ratio is 7 to 1, which provides a design speed range of 3000 to 6000 rpmfor the pump. The pump is an unshrouded centrifugal type that provides a minimum flow of1 gpm at a speed of 3000 rpm. The pump operates with an inlet head of 1-in. of oil.The lube/coolant fluid is a phosphate ester, tradenamed Fyrquel 150, that was selectedbecause of its low vapor pressure, good lubricity, low viscosity, and chemical stability.The fluid operating temperature will be held between 180° and 200°F. The maximum powerconsumption of the lube/coolant pump assembly is 35 watts. It weighs 1.40 1b.
496

PUMP DISCHARGE
LUBE/COOLANTPUMP
PUMP INLET
SALIENT FEATURES• CENTRIFUGAL PUMP• LUBE/COOLANT FLUID - FYRGUEL 1S0• FLUID TEMPERATURE (NOM.) - 200°F• DISCHARGE PRESSURE - 10 PSI• FLOW (MIN.) - 1.0 GPM• INLET HEAD - 1 IN. OF OIL• POWER CONSUMPTION • 35 WATTS• WEIGHT - 1.40 LB • - S - -• OPERATING SPEED - 3000 TO 6000 RPM . - ^ <
Fig. 12. Lubrication/Coolant Pump Assembly
TESTING AND EVALUATION TASKS
The total ESU test effort is divided into three main subdivisions: (1) performancetests, (2) proof of design, and (3) environmental (Fig. 13). The definition and purposefor each test task are discussed in the following paragraphs.
The purpose of the performance tests is to determine the spin-down losses of the ESU.The procedure for determining the losses is a step-by-step series of tests to assess theloss contribution of each component. When the electrical input-output machine is in thestandby mode, the remaining losses are defined as the spindown losses. These lossesinclude flywheel windage, bearing friction, molecular vacuum pump, and the lubrication pumplosses. These losses are primarily caused by viscous drag forces of the related gas orliquid in contact with the rotating surfaces. The drag forces are a function of theviscosity or the quantity of the fluid or gas molecules at the surface of the affected part.For this reason, the flywheel chamber will be maintained at a substantially reducedpressure, and the oil temperature will be regulated to obtain low drag torque.
The proof-of-design tests are performed to demonstrate the general operationalfeasibility of the unit and to assess its basic characteristics (such as vacuum level,internal vibration, noise and heat generation, and input/output efficiency). Thisinformation also will serve as a norm for evaluation of changes in performance underexternally imposed vibration and maneuvering loads, or elevated temperature.
The environmental tests will provide information on the sensitivity of the ESU tovarious externally imposed conditions, including external vibration, maneuvering, andtemperature. During all testing, the vacuum stability will be monitored and evaluated.The approach used during environmental testing will be to continue to increase the testconditions without destroying the unit or exceeding the maximum established values.
497

rTESTING TASKS
TASK 1 -PERFORMANCE TESTS• SPINOOWN LOSSES
TASK 2 — PROOF OF DESIGN
• INPUT/OUTPUT EFFICIENCY• INTERNAL VIBRATION• INTERNAL NOISE• BEARING INTEGRITY• VACUUM PERFORMANCE• LUBE SYSTEM PERFORMANCE• THERMAL MAPPING
TASK 3-ENVIRONMENTAL
• VIBRATION SENSITIVITY• MANEUVER TOLERANCES• THERMAL UNITS• VACUUM STABILITY
Fig. 13. Testing and Evaluation Tasks
PERFORMANCE TESTS LABORATORY SETUP
A photograph of the laboratory setup for the ESU performance tests is shown in Fig.The test specimen is shown mounted on the dc motor drive test rig. The torque head isalso visible. The test console is shown to the left of the test unit. The performancetests are currently in process.
14.
PERFORMANCE TESTSLABORATORY SETUP
Fig. 14. Laboratory Setup (Performance Tests)
498

TESTING AND EVALUATION SUMMARY
The development testing status, problems encountered, and planned corrective actionsare discussed in the following paragraphs.
TESTING STATUS
The maximum lube/coolant pump power was determined to be 35 W. This is the first ofthe performance tests.
The variable frequency, variable voltage electrical power drive is in place andoperational.
The electronic controller, which is used to automatically control the ESU, has beenchecked-out in the system.
PROBLEMS ENCOUNTERED
Several problems have been encountered during the five months of development testingthat have been completed. The major effort has been expended trying to trim balance (atspeed) the ESU rotating group. During the balancing process it was determined that themolecular pump was not performing to specification, i.e., the minimum flywheel cavitychanter pressure attained was 40-microns at 40,000 rpm.
The successful balancing of the unit was nearly completed when the motor rotor failedduring test.
A failure investigation determined that 2 to 3 bars of the cast copper rotor hadfailed due to casting porosity. The machine's rotor and stator shorted and were destroyed.
CORRECTIVE ACTION
The molecular pump stator geometry was changed from 4-lands and grooves to 3. Thiswas done to reduce the leakage between grooves by increasing the land width. Proof of designtests will be performed on the new stator to verify the design.
Prior to motor failure, it was determined that the ESU had a moment unbalance. Thistype of unbalance is difficult to isolate with displacement probes only at the upper endof the rotating group. An additional probe will be attached at the lower end of the rotatinggroup to aid in trim balancing during test.
A backup electrical machine rotor and stator were manufactured and are available.The rotor was fabricated, instead of cast, using extruded zirconium-copper material. Thisresults in a higher strength rotor that is free of porosity. The rotor will be hot-spintested in a pit to verify its mechanical integrity prior to being assembled into the ESU.
499

rProject Title:
Principal Investigators:
Organization:
Project Goals:
Project Status:
Contract Number:
Contracting Period:
Funding Level:
Funding Source:
PROJECT SUMMARY
"Flywheel-Engine Powerplant Research and Development Studies"
Norman H. Beachley and Andrew A. Frank
College of EngineeringUniversity of Wisconsin-Madison1513 University AvenueMadison, WI 53706
The basic objective is to provide a design analysis of a flywheel-engine power unit for a passenger automobile. The detailed tasksare (1) evaluate the potential of alternative powerplants for usewith flywheel, (2) determine the lower level of friction that maybe practically achieved in driveline components, (3) determinethe most promising continuously variable transmission (CVT) con-cept for a 2nd generation flywheel vehicle, (4) design safetyfeatures for the flywheel system, (5) prepare a preliminarylayout drawing of the complete flywheel powerplant system suitablefor installation in a production automobile chassis.
A preliminary study of alternative heat engine powerplants(Stirling, gas turbine, diesel piston, and gasoline piston engines)has been performed to determine their relative fuel mileage po-tentials. Other practical aspects still need to be investigated,such as the effect on engine efficiency and life of an on-offmode of operation.
Three continuously-variable transmission concepts have beenidentified as having efficiency, size, and weight characteristicssatisfactory for a second generation experimental flywheel car.Preliminary design configurations have been developed based onthese three principles, and design work is being continued withthe goal of further simplification and reduction of frictionlosses.
Basic packaging configurations have been determined that willpermit the flywheel powerplant systems (for each of the threechosen CVT concepts) to fit in the engine compartment of aconventional front wheel drive automobile. There is still muchwork to be done, however, on the details of mounting and inter-connecting the various powerplant components.
Considerable information on the friction characteristics of bearingsand gears has been collected that will aid in system efficiencycalculations, and also in the determination of what fuel economyimprovements might be obtained by attention to and optimization ofthese components in the driveline.
SUBCONTRACT 4492309
Feb. 5, 1979-Dec. 31, 1979
$93,286.00
Lawrence Livermore Laboratory
501

COMPARISON OF ALTERNATIVE HEAT ENGINESFOR FLYWHEEL MECHANICAL TRANSMISSION AUTOMOBILES
Andrew A. Frank and Norman H. BeachleyUniversity of Wisconsin-Madison
ABSTRACT
The feasibility of various heat engines to be used with a flywheel-transmission areinvestigated. Four possibilities are considered: (1) gas turbine; (2) Stirling engine;(3) gasoline piston engine; and (4) diesel piston engine. These four heat engines arestudied to assess their fuel economy capability with one specific flywheel-transmissioncombination. Their relative fuel economies are compared for engines unmodified from presentdesign.
Design changes possible with each engine are further explored. These changes wouldimprove efficiency, save weight, simplify and reduce the cost of the engine.
The preliminary simulations for the EPA-CVS Federal Urban Driving Cycle (FUDC) with a3,000 1b. vehicle show the following mpg values (gasoline equivalent) based on engine mapsavailable in the literature: 1) Turbine - 47.9 mpg; 2) Stirling - 51.3 mpg; 3) Gasoline -41.2 mps; and 4) Diesel - 41.2 mpg. Project improvements are discussed.
INTRODUCTION
The objective of this effort is to investigate via simulation' ' how the flywheel-transmission system can be adapted to existing and future prime movers and to explore primemover modification to take full advantage of the flywheel transmission concept. The studytakes into account a flywheel transmission vehicle with parameters assumed to be (1) vehicleweight 3000 lbs., (2) flywheel size from .3 to .5 hp hrs., (3) flywheel transmissionrequiring 8640 hp-sec to drive the EPA FUDC^'. This amount of energy implies an averagecontinually variable transmission efficiency of 77% over the FUDC, and (4) an engine assumedto operate at its best efficie- y while producing 60 hp. Thus some prime movers will have amaximum hp of as much as 170 hp while other prime movers will have a maximum hp of 60 hp.The maximum hp available from a prime mover is dependent upon where the best efficiencyoccurs with respect to maximum power.
The implication of these assumptions are that there will be four charges for the EPA-FUOC when using the University of Wisconsin "on off" principle. The prime mover will be "on"3C-R0 sec depending upon its characteristics. With "on-off" operation there are varioussimplifications to the prime mover that can be made. Each prime mover type has its owncharacteristic which can be taken advantage of due to this narrow operating range requirement.Figure 1 •Illustrates the engine operation characteristics for a "high performance" standardtransmission conventional gasoline vehicle over the EPA-FUDC. Figure 2 shows the influenceof lower performance. It should be noted that the lower performance vehicle has more of theefficient islands of the prime mover covered by the driving cycle. Thus the lower the per-formance the better the fuel economy in a standard transmission vehicle. The flywheeltransmission on the other hand allows the engine to operate at its best efficiency or not atall and over a narrow speed range. This is shown in Fig. 3. Since the flywheel supplies thepower for high acceleration the vehicle performance is less sensitive to engine size. Thus aflywheel transmission vehicle with either a 30 hp or 60 hp engine will have identical 0 to60 MPH acceleration times. The difference of course is how long it takes to charge the fly-wheel when it runs down and how fast the vehicle can climb a given constant grade lasting morethan a mile or so. Further, the power available from a flywheel transmission is restrictedonly by the size of the transmission components, thus a 30 hp prime mover can have the per-formance of 250 or more hp due to the flywheel.
502

Various prime mover types are examined, they are the Brayton cycle or "gas turbine",the Stirling engine, the gasoline piston engine and the diesel engine. Comparing theirrelative efficiencies at part load, we find that the turbine is poor, the Stirling is betterbut still not toe good (there are improvements in Stirlings which are projected to givebetter, values [3]), the gasoline engine is better, and finally the diesel engine is best,i.e., has the broadest efficient operating characteristics (See Fig. 4). The flywheeltransmission system, however, does not require the prime mover to have good efficiencyexcept at maximum torque and over a 2 to 1 speed range. Normal speed range for a primemover in a standard transmission vehicle is at least 5 to 1, while the torque must be modu-lated from maximum through 0. Therefore in a flywheel transmission vehicle a prime mover canbe greatly simplified.
SOME IMPLICATIONS OF FLYWHEEL DRIVE TRANSMISSION SYSTEMS
"On-off" engine operation implies that special care must be taken in engine design.Heat control is necessary since if during the few minutes of "off" it is allowed to cool,energy is lost and therefore must be resupplied to the system by fuel in order to bringthe engine back up to proper operating temperature. Start-stop bearing wear is anotherpotential problem with on-off operation which must be taken into account. Loss of the fluidfilm in hydrodynamic bearings might result in high wear in on-off operation. The coolingsystem should be redesigned for the narrow operating range, etc.
Since the engine operates only at maximum torque, one of the advantages of the "on-off" system is that it does not require an operating control system. Most standard primemovers require a great amount of design effort in making the engine controllable at partload. Since there is no part load requirement, a turbine can operate only at the maximumtorque condition; a Stirling can operate with fixed geometry and fixed gas pressure-, thegasoline engine can have a fuel carburetion or injection system which does not have to bemodulated for power (because this particular engine does not have to idle, and becauseitems such as valve train design, cylinder head shape, etc., can be designed for optimumconditions). Diesel engine controls can be greatly simplified since the fuel injectionsystem no longer has to have a variable stroke. The engine can be tuned for optimum fuelefficiency and will not have to be adjusted for varying loads since the load is fixed.
Idle fuel flow rates in present prime movers relative to each other form the fol-lowing order: the turbine is the highest, the Stirling next, the gasoline engine nextwith the best or lowest being the diesel engine. However, the turbine and Stirline engineshave the most to gain from flywheel transmissions without idle requirements because theseengines have high fuel consumptions in idle. With all accessories driven off the flywheel,engine idle has no useful purpose. Note also that accessories are being driven with the bestfuel efficiency that can be produced by the particular engine.
ENGINE DESIGN OBJECTIVES
In line with the above discussion the engine for a flywheel transmissiu,. ,ystem shouldbe designed with the following factors in mind: (1) minimum flexibility and only maximumtorque operation, (2) minimized internal friction at wide open throttle only, (3; minimizedheat loss during the "off" condition, (4) optimized induction system, (5) optimized com-bustion, (6) exhaust system tuned for fixed conditions, (7) optimum exhaust gas recircu-lation for emission controls (if required) set for this single operating condition.
It should be pointed out that best efficiency for an engine occurs somewhere between1/4 to full power. Where the best efficiency for a particular prime mover occurs is dependentupon many factors. In a gas turbine, for example, best efficiency may occur at maximum power.On the other hand for a gasoline piston engine best efficiency normally occurs somewherebetween 1/4 and 1/3 of maximum power. For example a conventionally rated gasoline pistonengine of 87 hp has its best efficiency of approximately .455 lbs. of gasoline per hp-hrat approximately 28 to 30 hp. Therefore if a flywheel drive system requires a 30 hpgasoline engine, it must be obtained from an engine with the displacement equivalent to aconventional engine currently producing 87 hp.
503
rSPECIFIC ENGINE STUDIES
TURBINE
A gas turbine-flywheel transmission system was studied using a standard two shaftturbine by General Motors, model GT-404-3. This turbine was scaled and compared with aVolkswagen diesel and a Honda CVCC gasoline engine. All engines were scaled for maximumefficiency at 60 hp. Note, because of the characteristics of these individual engines, thepeak hp in the piston engines are much higher than the turbine. Thus the scaled Honda CVCChas a peak hp of 178 hp, the Volkswagen diesel a peak of 97 hp while the turbine has a peakof 60 hp. It is assumed that these engines can be scaled without affecting brake specificfuel consumption. This may not be accurate for a turbine since it is size sensitive.Further, the numbers that we are using are for an advanced turbine, that is, a paper turbine(not currently existing). On the other hand since this particular turbine with the flywheelmust operate over an extremely narrow range and does not have to be designed for flexibility,it may be possible to design it in such a way that the peak efficiency is easily obtained.Using the turbine characteristics published in (4) the turbine operates between 54 and 60hp. This range compares with the piston engine characteristic which allow operation between30 and 60 hp. The piston engine characteristics are from (5,6).
Comparing the turbine average brake specific fuel consumption we find that the turbineon the average is creating energy at .411 lbs. of fuel per hp/hr vs. .463 for a gasolinepiston and .425 for a diesel. The simulated EPA-FUDC fuel economy during city driving ina turbine flywheel vehicle is 46.5 MPG on JP4 or 47.9 MPG on "gasoline equivalent", for thediesel it is 45.25 for No. 2 diesel or 41.1 MPG on gasoline equivalent, and for the gasolinevehicle it is 41.1 MPG. The "gasoline equivalent" for the turbine and deisel were made basedupon the heating values of the different fuels.
Design considerations for a turbine to be coupled with a flywheel transmission imply anumber of factors. One of the first factors to be considered is whether or not a multishaftturbine is required. Since the flywheel is a high speed rotating device it is possibleto have a single shaft high temperature turbine with a maximum power around 75 to 80 hp. Inorder to maintain high efficiency for this low power rating tight aerodynamic tolerances mustbe maintained and a trade off between air bearings or ball bearings for tolerance maintenanceneeds to be considered. Air bearings may be used for a high speed turbine-flywheel system,while ball bearings could be used if the turbine-flywheel system operated at a lower speed.Higher speed turbines may operate at speeds around 80,000 RPM while the low speed turbine mayoperate at speeds around 30,000 RPM. Because of the small size of these turbines, ceramicmaterials could be used to accommodate much higher operating temperatures.
According to Fig. 5 it may be advantageous to use a multistage power turbine because ofthe constant load operation, thereby maximizing the kinetic energy extraction for the bestpossible efficiency. Notice in this figure that a series of system cut-off valves is shownto create a partial vacuum to minimize spin losses when the engine is "off". Further thispartial vacuum would help retain the heat within the operating parts of the system. Insulationis still necessary on the outside portions of the turbine in such places as the combustors, etc.Insulated or heat dissipating mechanisms on the main shaft would allow the use of low tempera-ture bearings and lubrication. An optimized design should produce a minimum brake specificfuel consumption around .38 for a mileage of approximately 51.8 MPG gasoline equivalent.
STIRLING
A Ford/Phillips 95 hp and a United St i r l ing A,B 170 hp engine were studied (5,7). TheFord/Phillips engine was studied in a standard 4-speed manual transmission vehicle with 3,000lb. inertia weight. This achieved a fuel economy of 29.99 with an average efficiency of19.68% over the EPA-FUDC ci ty cycle. A United St i r l ing engine installed in the same vehiclewould achieve 31.9. These figures compare with a production of 90 hp vehicle mileage of 24.A flywheel St i r l ing system would have an engine operating range dependent upon the particularengine characteristics. For example the Ford/Stirling engine would operate between 1350 and
504

2700 ana between 20 and 60 hp, whereas a United Stirling engine would operate between 570and 1140 and between 31 and 60 hp. The average brake specific fuel consumption for the Fordengine would be .396 and the United Stirling engine .372. The associated Flywheel-Stir!ingcity fuel economy would be 48.1 MPG for the Ford and 51.3 with the United Stirling. TheUnited Stirling highway mileage at a constant 60 would be approximately 42.8. It should benoted that the United Stirling engine obtains better fuel economy in the city than in thehighway. It has been claimed by United Stirling that a variable stroke version of theirengine can obtain 42 on a combined cycle at a 3500 lb. inertia weight (3). This would trans-late to an even higher city mileage at 3000 lb. inertia weight. This variable stroke mechanismprovides characteristics similar to a continuously variable transmission (CVT) except thatit is incorporated within the engine itself.
The advantages of a flywheel drive Stirling system over the variable stroke Stirlingare (1) higher mileage is possible in the city due to generative braking; (2) the Stirlingengine internal design is simplified by the requirement of a constant load, no idle, and alimited speed operating range; (3) the flywheel-transmission replaces the torque convertertransmission which is still required with a variable stroke Stirling; and (4) there is acontrol system simplification due to a torque controlled continuously variable transmissionrather than a controlled engine stroke. This controlled engine stroke requires hydraulicenergy and is a rather sensitive mechanism.
Due to the limited range of operation of the Stirling-flywheel system optimum burners,heat exchangers, regenerators, etc. can be choosen. Finally, it is felt that lower brakespecific fuel consumption can be obtained because of the possibility of optimum sizing of allcomponents, fewer engine peripheral equipment controls, and the possibility of loweringinternal engine friction because of the simpler mechanism and geometry. A Stirling enginedesigned specifically for use with a flywheel should produce a minimum brake s;ie.ific fuelconsumption of around .35, giving a fuel economy of around 54.5 for the FUDC.
GASOLINE PISTON ENGINE
A gasoline piston engine in a 3,000 lb. present day vehicle apparently can obtain acity fuel economy of about 24 and about 35 at a constant highway cruise speed of 60. If theengine is unmodified and installed into a flywheel vehicle, the expected city fuel economyis between 41 and 48 depending upon the particular transmission used. We will now examinethe potential of a flywheel-transmission vehicle with the piston engine designed from theground up. First the requirement for the engine speed range is approximately 2 to 1. Itcould be between 1000 and 2000 RPM. The torque range would only be the maximum torque, theoperating time would be from 30 seconds "on" and 2 minutes to 5 minutes "off" to continuousoperation. Conservation of heat in the "off" condition is an important feature.
With these requirements, designs for a piston gasoline engine should concentrate onreducing parasitic or internal friction losses. This could be accomplished by reducingthe size of the water cooling system, minimizing camshaft friction by using either pressureoperated poppets or a resonant valve system, optimum bearings, minimized piston scrubbing,lower oil churning, etc.
The fuel and combustion systems can also be greatly simplified since only maximum fueldelivery is required; therefore, no manifold vacuum need contend with such problems as mani-fold wetting, etc. For example, it may be possible to use a constant flow fuel injectionsystem at the intake ports. Better combustion characteristics due to factors such as highswirl at fixed load, higher compression for a given octane number, etc. could also beachieved.
A change from a four cycle system to a two cycle could further reduce the effect ofengine friction by a large factor. Current two cycle engines were designed for power densityand not efficiency. With a flywheel t nsmission system it is possible to design a two cycleengine for efficiency rather than power density and achieve BSFC values better than a fourcycle engine.
505

It is estimated that a two stroke brake specific fuel consumption around .35 lbs. perhp-hr on gasoline is feasible, producing a mileage of about 54.3 MPG in the city and about45.5 MPG in highway cruise at 60 MPH.
DIESEL ENGINE
The "ground up" design of a diesei flywheel system would require the same features asthe gasoline engine discussed above. A simplified injector system could be used since onlymaximum delivery is required. Better combustion characteristics could occur since theinjector angle, prechamber design, etc. could be optimized. Better combustion could alsobe achieved by using an optimum compression ratio on the diesel, because starting and lowpower "knock" would no longer be a problem. The flywheel could provide the starting powerrequired to turn the engine over. It is further possible to use a two cycle instead of afour cycle diesel because a two cycle diesel has less effective internal friction.
The optimized design could provide a brake specific fuel consumption on the order of0.32 lbs. per hp-hr of diesel fuel providing a city mileage of 59.6 MPG for this 3,000 1b.vehicle and a highway mileage of 49.8 MPG at a constant 60 MPH.
CONCLUSIONS
For the first time since the flywheel energy storage program has started, we havelooked in some detail at the prime mover design. What we have concluded is that the primemover can be improved in efficiency considerably over designs currently being proposed forconventional transmission vehicles. The resulting projected improvement in fuel efficiencycan provide city gas mileages up to 60 MPG with highway mileages close to 50 MPG with theflywheel-transmission concept. Of course all of these mileage projections are based uponthe 3,000 lb. vehicle with the road load obtained from the standard vehicle of today. Withaerodynamic improvements the highway mileage can be increased substantially. Further, withlower rolling resistance tires and attention to bearing friction within the drive line fromthe transmission onwards it is possible to increase the city gas mileage somewhat. Theexisting vehicle on which all these simulations were based requires 23 hp at 60 MPH. It isclear that many researchers have achieved rolling resistances much less than the 23 hp at60 MPH. However, this standard was used so that a valid comparison can be made. Even withthis relatively poor road load characteristic it has been demonstrated that it is possible toachieve a very high fuel efficiency.
While the suggestions are easy to make on paper, each one made above would require agreat deal of research. The possible gain from this research is the capability of improvingthe fuel efficiency from approximately 42 MPG in the city to about 60 MPG in the city for a3,000 1b. flywheel transmission vehicle. This is approximately a 3058 improvement due toredesign of the prime mover itself. Thus a combined cycle 50 MPG ahicle is possible. Thelong range potential fuel efficiency is great enough to warrant the investment in such anextensive program. This improvement when compared with conventional vehicles of this weightclass is better than 100%.
506

REFERENCES
1. Le, Sanh, "A Speed-Torque Matrix Method For Analyzing Flywheel Hybrid Vehicle Performance,"Master of Science Thesis, University of Wisconsin - Madison, 1978.
2. Harter, Richard, "Optimization Study of A Power Split Hydrostatic Transmission," Masterof Science Thesis, University of Wisconsin - Madison, 1977.
3. Fourteenth Intersociety Energy Conversion Engineering Conference, Vol. 1.
4. Fourth International Symposium on Automotive Propulsion Systems, Fig. 14. "Design andLayout of Energy Efficient and Low Polluting Diesel Engines."
5. Fourth International Symposium Automotive Propulsion Systems. April 18-22, 1977, pp.131-132, Vol. 1.
6. Honda Fuel Map (private correspondence with Honda Corporation).
7. Hallare, B., "The Development of 40-150 KW Stirling Engines in Sweden and Their Applicationin Mining Equipment, Total Energy Systems and Road Vehicles," pp. 248-268, AutomotivePropulsion, Feb. 1978.
507

HIM BSFC ISLAND
KIN1HUM ISFC
STO CM FEATURES
1 . HIUH PEftFOMMCE (O-IO NPN) 10-12 SECS.1 . LW MIIEME H CITT. (17-M I K )
SID CM FEATURES
1 . LOU PERFOIMAKCE (O-iO KH4) 14-20 SECS.I. HUNCH MLEASE IK CITT. [20-11 I K )
Fig. 1. Standard Transmission High Performance Fig. 2.Vehicle Engine Requirements.
Standard Transmission Low PerformanceVehicle Engine Requirements.
ENGINE SPEED
FEATURES: SPEED RANGE 2:1TORQUE RANGE MAX OMLT ONWWER 1/3 TO 1/2 MAX"ON-OFF" OPERATIONDECLUTCHED UHEN "OFF*(40-50 W G )
Fig. 3. Flywheel Transmission Engine Operating Requirements.
508

TURBINE OPT
50* DPT
STIRLING
' 50X Of T
SPEED SPEED
SASOLINE
50* OPT
DIESEL
orr
^50* OPT
SPEED
Fig. 4. Comparison of Characteristics of Various Primemovers.
M S PLACER HEATER
CLUTCH
Mtrrs 1.1, 3 FOR lannt PRESSURE I» "OFF*R I S I T i n TO AVOID SPIN LOSSES A»D HEAT LOSSES.
ADMHTAtES OVER STANDARD TMIINE
SIMPLE SINGLE SPOOL TUWtlE.COHIHED »RWE MOVER-FLtlfflEEL STSTEH ( L I « T HEI6HT)."O«-OFF" CWBUSTIOfl STSTEH.LOM "OFF" LOSS.FLTOHEEL MECHANICAL CLUTCH STSTCK.POSSIBLE CATALYTIC REGEKEIATOR.
PLTNHEEL - T M K S K I S S I M STIRLINC EUSIIIE FEATUKS:
1 . M TMKOmiNG REQUIRED: NQ HIGH PRESSURE PUMPING•R VMtlWLE STROKE REQUIRED.
1 . OPERATION ONLT AT OPTIMUM PRESSURES M D STRIKES.3 . SIWLEB CEOMETRT.4 . MLTIPUEL U P M I L I T T .
Fig. 5. Proposed Turbine Flywheel System. Fig. 6. A Possible Stirling Flywheel System.
509

APPENDICES
511
1979 MECHANICAL AND MAGNETIC ENERGY STORAGECONTRACTORS' REVIEW
Capital Hilton HotelWashington, D.C.
August 19-22, 1979
SPEAKERS AND SESSION CHAIRMEN
Mr. B. AllemanPacific Northwest LaboratoryP.O. Box 999Richland, Washington 99352
Dr. L. AmstutzU.S. Army Mobility EquipmentResearch and DevelopmentCommand, Lab 3000Ft. Belvoir, Virginia 22060
Mr. Thomas M. Barlow, Program ManagerEnergy and Resource ProgramLawrence Livermore LaboratoryP.O. Box 808Mail Stop L-209Livermore, California 94550
Dr. Norman H. BeachleyUniversity of Wisconsin1513 University AvenueMadison, Wisconsin 53706
Dr. Charles W. BertUniversity of OklahomaSchool of AMNENormon, Oklahoma 73019
Dr. James D. BlacicLASLMail Stop 978Los Alamos, New Mexico 87545
Mr. C. A. BlomquistArgonne National Laboratory9700 South Cass AvenueArgonne, Illinois 60439
Mr. B. C. CaskeySandia LaboratoryP.O. Box 5800 - Division 5716Albuquerque, New Mexico 87115
Dr. George C. ChangDivision of Energy Storage SystemsU.S. Department of Energy600 E Street, N.W.Room 416Washington, D.C. 20585
Mr. Alan F. ClarkNational Bureau of StandardsBoulder, Colorado 80302
Mr. W. T. Crothers,University of CaliforniaLawrence Livermore LaboratoryP.O. Box 808, L-209Livermore, California 94550
Mr. John DegnanMgr. Mechanical DevelopmentAll is ChalmersBox 712York, Pennsylvania 17405
Mr. Roger DerbyDivision of Energy Storage SystemsU.S. Department of Energy600 E Street, N.W.Washington, D.C. 20585
Mr. Henry H. DoddSandia LaboratoryP.O. Box 5800Division 5743,Alburquerque, New Mexico 87115
Mr. T. DohertyPacific Northwest LaboratoryP.O. Box 999Richland, Washington 99352
Mr. Fred R. FickettPhysicistNational Bureau of StandardsBoulder, Colorado 80302
Dr. Arlo F. FossumRE/SPEC Inc.P.O. Box 725Rapid City, South Dakota 57701
Dr. Andrew A. FrankDepartment of Electrical &
Computer EngineeringUniversity of WisconsinEngineering Research Building1800 Johnson Drive, Room 909Madison, Wisconsin 53706
513

Mr. J. R. FrileyPacific Northwest LaboratoryP.O. Box 999Richland, Washington 99352
Mr. Alexander GokhmanEDS Nuclear Corporation, Inc.220 Montgomery StreetSan Francisco, California 94104
Mr. A. J. GiramontiUnited Technologies Research CenterEast Hartford, Connecticut 06108
Dr. P. F. GnirkRE/SPEC Inc.P.O. Box 725Rapid City, South Dakota 57701
Dr. Lyle HoppiePrincipal EngineerEaton CorporationEngineering and Research Center26201 Northwestern HighwayP.O. Box 766Southfield, Michigan 48037
Mr. D. KerrGeneral Electric CompanyP.O. Box 43Schenectady, New York 12301
Mr. Satish KulkarniLarence Livermore LaboratoryP.O. Box 808, L-502Livermore, California 94550
Dr. Walter V. LoscutoffPacific Northwest LaboratoryP.O. Box 999Richland, Washington 99352
Mr. Ed L. LustenaderGeneral Electric CompanyResearch & Development CenterI River RoadBuilding 37, Room 311P.O. Box 43Schenectady, New York 12301
Mr. Arthur J. MansureBDM Corporation2600 Yale Boulevard, S.E.Albuquerque, New Mexico 87106
Mr. Osmond K. MawardiSchool of EngineeringCase Western Reserve UniversityCleveland, Ohio 44106
Mr. L. B. McEwen, Jr.Jalar Associates2104 Windsor RoadAlexandria, Virginia 22307
Mr. A. Keith MillerSandia LaboratoryP.O. Box 5800Albuquerque, New Mexico 87115
Mr. Alan MillnerMassachusetts Institute of Technology
Lincoln LaboratoriesRoom 1-302P.O. Box 73Lexington, Massachusetts 02173
Mr. Ron NimmerGeneral Electric CompanyP.O. Box 43Schenectady, New York 12301
Mr. Arlo NordSandia LaboratoryP.O. Box 5800Albuquerque, New Mexico 87115
Mr. Leo NorrupGarrett AiResearch Corporation2525 West 190th StreetTorrance, California 90509
Mr. Terrence CRourkeSpecial Counsel to Alfred KahnOffice of the Advisor to
the President on InflationOld Executive Office BuildingRoom 200Washington, D.C. 20500
Mr. Theodore W. PlaceGarrett AiResearch Corporation2525 West 190th StreetTorrance, California 90509
Mr. John PurcellGeneral AtomicsP.O. Box 81608San Diego, California 92138
514
Mr. D. W. RabenhorstApplied Physics LaboratoryJohns Hopkins UniversityJohns Hopkins RoadLaurel, Maryland 20810
Mr. Art E. RaynardGarrett AiResearch Corporation2525 W. 190th StreetTorronce, California 90509
Mr. James A RindeLawrence Livermore LaboratoryP.O. Box 808, L-338Livermore, California 94550
Dr. John D. Rogers, Jr.Los Alamos Scientific LaboratoryOrg. CTR-9, Mail 464Los Alamos, New Mexico 87545
Mr. Carl RosnerIntermagnetics General CorporationCharles Industrial ParkNew Karner RoadGuiderland, New York 12084
Mr. David L. SatchwellGarrett AiResearch Corporation2525 W. 190th StreetTorrance, California 90509
Mr. Robert SchermenLos Alamos Scientific LaboratoryLos Alamos, New Mexico 87545
Mr. Harold SchildknechtSandia LaboratoriesDivision 2324Albuquerque, New Mexico 87185
Mr. S. C. SchulteResearch EngineerBattelle Pacific Northwest LaboratoriesBattelle BlvdRichland, Washington 99352
Mr. James J. SkilesUniversity of Wisconsin531 Engineering Research BuildingMadison, Wisconsin 53706
Rob SteeleOak Ridge Y-12 PlantOak Ridge, Tennesee 37830
Mr. J. A. StottlemyrePacific Northwest LaboratoyP.O. Box 999Richland, Washington 99352
Dr. James H. SwisherDivision of Energy Storage SystemU.S. Department of Energy600 E Street, N.W.Room 416Washington, D.C. 20585
Mr. S. W. TamArgonne National Laboratory9700 South Cass AvenueArgonne, Illinois 60439
Dr. Robert L. ThornsGeomechanics GroupLouisana State UniversityInstitute for Environmental StudiesRm. 42 Atkinson HallBaton Rouge, Lousiana 70803
Professor S. van Sciver531 Engineering Research Building15000 Johnson DriveUniversity of WisconsinMadison, Wisconsin 53706
Dr. Jack VanderrynDirector Office of Technical
Cooperation - Office of Intn'lAffairs
U.S. DOE&G-090M.S. 7F-O3IForestal Bldg.1000 Ind. AvenueWashington, D.C.
Mr. L. WilesPacific Northwest LaboratoryP.O. Box 999Richland, Washington 99352
Ms. Bette WinerArthur D. Little, Inc.Acorn ParkCambridge, Massachusetts 02140
Mr. Ed WuLawrence Livermore LaboratoryP.O. Box 808Livermore, California 94550
Mr. Robert 0. WoodsSandia LaboratoriesP.O. Box 5800Albuquerque, New Mexico 87115
515

Mr. Francis C. YoungerWilliam M. Brobeck & Associates1235 Tenth StreetBerkeley, California 947S0
516

1979 MECHANICAL AND MAGNETIC ENERGY STORAGECONTRACTORS1 REVIEW
Capital Hilton HotelWashington, D. C.
August 19-22, 1979
LIST OF ATTENDEES
ACKERMAN, Sam L.Director, Advanced Magnet SystemsGeneral Dynamics, Convair Division10170 County View RoadLa Mesa, California 92041
ADOLFSON, William F.Project EngineerBooz, Allen & Hamilton4330 East West HighwayBethesda, Maryland 20014
ALLEN,BobResearch Scientist/EngineerPacific Northwest LaboratoryBattelle BoulevardRichland, Washington 993S2
BAHADUR, SherSenior EngineerAcres American Incorporated329 Clark BuildingColumbia, Maryland 21044
BERVIG, Dr. DaleManaging Project EngineerBlack and Veatch10235 Oakmont CircleLenexa, Kansas 66215
BEULINGMANN, Dr. R. F.Program Director, Energy SystemsGeneral Dynamics, Convair Division82l5Prestwick DriveLa Jolla, California 92037
BOGART, S. LockeStaff ScientistScience Application, Incorporated8400 Westpark DriveMcLean, Virginia 22102
BORTZ, Susan E.Management AnalystOAO Corporation2101 L Street, N. W., Suite 800Washington, D. C. 20037
BRANDSHAUG, TerjeStaff EngineerRE/SPEC IncorporatedP. O. Box 725Rapid City, South Dakota 57709
BYERLY, R. T.Advisory EngineerWestinghouse Electric Corporation2040 Ardmore BoulevardPittsburgh, Pennsylvania 15221
CALLAHAN, Gary D.Vice PresidentRE/SPEC IncorporatedP. O. Box 725Rapid City, South Dakota 57709
CAMPBELL, JimProgram ManagerDepartment of Transportation400 7th Street, S. W.Washington, D. C. 20590
CAPOZZI, Danelle M.ConsultantOAO Corporation2101 L Street, N. W., Suite 800Washington, D. C. 20037
517

KAPNER, MarkSenior EngineerHittman Associates, Inc.9190 Red Branch RoadColumbia, Maryland 21045
KATZ, Donald L.ProfessorUniversity of MichiganCollege of Engineering - Ann ArborAnn Arbor, Michigan 48109
KAY, John F.Advanced EngineerOwens Corning FiberglassTechnical CenterGranville, Ohio 43023
KING, DennisTechnical ManagerLawrence Livermore LaboratoryP. O. Box 808Livermore, California 94550
KUBO, LarryMember of Technical StaffAerospace Corporation2350 East El SegundoEl Segundo, California 90245
LANGILL, RichardConsultant20150 Wynnfield DriveGermantown, Maryland 20767
LAVERICK, C.49C LaBowe ^'ie DriveEast Patchogue, New York 11772
LEHMAN, Leo J., Jr.Project EngineerAcres American, IncorporatedClark Building, Suite 329Columbia, Maryland 21044
LEMMENS, Joseph R.ConsultantKinergy Research & Development(Marshall Oil Company, Incorporated)P.O.Box 1128Wake Forest, North Carolina 27587
LORENZEN, HarroVice PresidentPB-KBB, Incorporated800 West Commerce RoadHarahan, Louisiana 70123
LUCAS, Edward J.PresidentMagnetic Corporation of America179 Bear Hill RoadWaltham, Massachusetts 02154
MC ALEVY, R. F., IllSenior AssociateR. F. McAlevy III & AssociatesP. 0. Box 300Hampton Bays, New York 11946
MC DONALD, Alan T.ProfessorPurdue UniversitySchool of Mechanical EngineeringWest Lafayette, Indiana 47907
MC LAUGHLIN, Dr. Philip V., Jr.Associate Professor of
Mechanical EngineeringVillanova UniversityDepartment of Mechanical EngineeringVillanova, Pennsylvania 19081
MC PHERSON, AnnaRegistration Staff MemberOAOCO/GREYHOUND1625 K Street, N. W.Washington, D. C. 20037
MARSHALL, H. K.PresidentKinergy Research & Development(Marshall Oil Company, Inc.)Wake Forest, North Carolina 27587
MARTI, Dr. JoaquinSenior EngineerDames and Moore123 Mortlake High StreetLondon SW 4 85NUnited Kingdom
518

MOORE, John E.StaffLos Alamos Scientific Laboratory3458-B Urban StreetLos Alamos, New Mexico 87544
MORAN, BillPhysicistLawrence Livermore LaboratoryP. O. Box 808Livermore, California 94550
NOLAN, Barbara K.Conference CoordinatorOAO Corporation2101 L Street, N. W., Suite 800 'Washington, D. C. 20037
MUELLER, Barbara JoProgram ManagerU. S. Department of Energy9800 South Cass AvenueArgonne, Illinois 60439
PAGE, DonnaRegistration Staff MemberOAOCO/GREYHOUND1625 K Street, N. W.Washington, D. C. 20037
OMeil, W. K.Chief EngineerEaton CorporationNorthwestern HighwaySouthfield, Michigan 48076
PARADIS, L. R.Principal EngineerRaytheon CompanyHartwell RoadBedford, Massachusetts 01730
PARDOEN, Dr. Gerard .Chief EngineerU. S. Flywheels, Incorporated1882 McGaw AvenueIrvine, California 92714
PATRICK, JanManagerEnergy Business DevelopmentAVCO
PEDERSEN, Lester T.Associate Manager, ProjectsBattelle-Pocific Northwest LaboratoriesBattelle BoulevardRichland, Washington 99352
PEZDIRTZ, Dr. George F.DirectorDivision of Energy Storage SystemsU. S. Department of Energy600 E Street, N. W.Washington, D. C. 20585
PHILLIPS, Jerry J.Projects ManagerTennessee Valley Authority350 Commerce Union Bank BuildingChattanooga, Tennessee 37401
PIERSON, William R.Research Scientist3attelle Columbus Laboratory505 King AvenueColumbus, Ohio 43201
PITKIN, H.Contracts AdministratorLawrence Livermore LaboratoryP. O. Box 808Livermore, California 94550
PODDER, AmitavaManager, Energy GroupHittman Associates, Incorporated9190 Red Branch RoadColumbia, Maryland 21045
POST, Stephen F.EngineerWilliam M. Brobeck & Associates!235 Tenth StreetBerkeley, California 94710
PoubeauEuropean Aerospace
519

REED, ArnoldSenior EngineerBradford National Corporation2 Research PlaceRockville, Maryland 20850
REIMERS, EberhardMERADCOM8807 Strause CourtSpringfield, Virginia 22153
ROHDE, Dr. SteveSenior Research ScientistGeneral Motors Research Laboratory
Mechanical ResearchWarren, Michigan 48090
SCHRAMM, HenryManagementOAO Corporation2101 L Street, N. W., Suite 800Washington, D. C. 20037
SUPOWITH, AlanSection Chief, MaterialsAVCO Systems Division201 LoweU StreetWilmington, Massachusetts 01887
SCHWARTZ, Dr. Martin W.Mechanical EngineerLawrence Livermore LaboratoryP. O. Box 808Livermore, California 94550
SCRIBNER, DeanPhysicistU. S. Coast GuardCommandant (G-DSA-3/TP 54)Washington, D. C. 20590
SKARDA, CarolManagement AnalystOAO Corpoation2101 L Street, N. W., Suite 800Washington, D. C. 20037
SMITH, J. C.Section ChiefLM&STOR APPSU. S. Department of Energy20 Massachusetts Avenue, N. W.Washington, D. C. 20845
SOLIMAN, Dr. Frank YManagerEwald Associates, Incorporated18301 Weaver RoadDetroit, Michigan 48228
STEFONEK, David M.General EngineerBonneville Power Administration - DOE12th & Pennsylvania Avenue, N. W.Washington, D. C. 20161
STEKLY, Z. J. J.Chairman/Technical DirectorMagnetic Corporation of America30 Hampshire RoadWaltham, Massachusetts 02154
STEVENS, William A.Project ManagerThermal & Mechanical Energy Storage, EPRI3412 Hillview AvenuePalo Alto, California 94303
STONE, Richard G.Engineer ConsultantLawrence Livermore LaboratoryP. 0. Box 808Livermore, California 94550
STUART, JudiAdministrative AssistantOAO Corporation2101 L Street, N. W., Suite 800Washington, D. C. 20037
SWARTOUT, Bruce E.PresidentU. S. Flywheels, Incorporated1882 McGaw AvenueIrvine, California 927 14
THOMPSON, PhilProgram ManagementU. S. Department of Energy600 E Street, N. W.Washington, D. C. 20585
ULLMAN, David G.Assistant ProfessorDepartment of Mechanical EngineeringUnion CollegeSchenectady, New York 12309
520
VAN ORDEN, Stuart D.OAO Corporation50/50 Powdermill RoodBeltsville, Maryland
WILLETT, D. C.Vice PresidentAcres American, Incorporated900 Liberty Bank BuildingBuffalo, New York 14202
WOODBRIDGE, Dr. David D.Group ManagerHittman Associates9190 Red Branch RoodColumbia, Maryland 21045
YOUNG, J. L.Manager Magnet ProgramsWestinghouse Electric1310 Beulah RoadPittsburgh, Pennsylvania 15235
ZUCKERBERG, HarryMechanical EngineerTransportation Systems Center55 BroadwayCambridge, Massachusetts 02142
ZWEBEN, Dr. CarlStaff EngineerGeneral Electric CompanySpace Division - M40I8P. O. Box 8555Philadelphia, Pennsylvania 19101
521
•o.i. aavmmiXT mmiM omct ; 1979 0-620-309/11,68