probability - cemc - university of waterloo
TRANSCRIPT

red
blueyellow
Invitations to MathematicsInvestigations in Probability
“Counting on Probability”
An activity ofThe CENTRE for EDUCATIONin MATHEMATICS and COMPUTINGFaculty of Mathematics, University of WaterlooWaterloo, Ontario, Canada N2L 3G1
Suggested for s
tudents
at th
e
Grade 4 lev
el
3rd Edition
© 2010 The Centre for Education in Mathematics and Computing

Copyright © 1999, 2010The Centre for Education in Mathematics and ComputingFaculty of MathematicsUniversity of WaterlooWaterloo, Ontario Canada N2L 3G1
Limited reproduction permission:
1. The Centre for Education in Mathematics and Computing grants permission to indi-vidual teachers to reproduce the Black Line Masters as needed for use with their own students.
2. The Centre for Education in Mathematics and Computing grants permission to an educator providing a professional development workshop to make up to 35 copies of the Black Line Masters for any individual activity for use once with one group.
Reproduction of text pages for an entire school or school district or for commercial use is prohibited.

i
Investigations in Probability Grade 4: Counting on Probability
Preface
The Centre for Education in Mathematics and Computing at the University of Waterloo is dedicated to the development of materials and workshops that promote effective learning and teaching of mathematics. This unit is part of a project designed to assist teachers of Grades 4, 5, and 6 in stimulating interest, competence, and pleasure in mathematics, among their students. While the activities are appropriate for either individual or group work, the latter is a particular focus of this effort. Students will be engaged in collaborative activities which will allow them to construct their own meanings and understanding. This emphasis, plus the extensions and related activities included with individual activities/projects, provide ample scope for all students’ interests and ability levels. Related “Family Activities” can be used to involve the students’ parents/care givers.
Each unit consists of a sequence of activities intended to occupy about one week of daily classes; however, teachers may choose to take extra time to explore the activities and extensions in more depth. The units have been designed for specific grades, but need not be so restricted. Activities are related to the Ontario Curriculum but are easily adaptable to other locales.
“Investigations in Probability” is comprised of activities which introduce students to basic concepts of probability, techniques used to determine probability, and applications of probability. Everyday encounters with probability in weather forecasting, interpretation of polls, and commercials for various products and lotteries make it imperative that students acquire some basic knowledge of probability if they are to be able to interpret and evaluate such statements, and hence make well-informed decisions.
Preface

ii
Grade 4: Counting on Probability Investigations in Probability
Acknowledgements
Contributing Teachers Nancy Dykstra (Waterloo County Board of Education) Kelly Lantink (Waterloo County Board of Education) Ron Sauer (Waterloo County Board of Education - retired) Mary Thompson (University of Waterloo)
Authors/Co-editors Bev Marshman (University of Waterloo) Lorna Morrow (Mathematics Consultant)
We wish to acknowledge the support of the Centre for Education in Mathematics and Computing, and in particular the efforts of Ron Scoins, Gord Nichols, and Carolyn Jackson. A special thank you goes to Bonnie Findlay for prompt, accurate type-setting and creative diagrams.
Acknowledgements

iii
Investigations in Probability Grade 4: Counting on Probability
Contents
Preface .................................................................................................................................................................. i
Acknowledgements ............................................................................................................................................. ii
Table of Contents ............................................................................................................................................ iii
Overview ............................................................................................................................................................... 1 Common Beliefs ............................................................................................................................................... 1 importanCe of proBaBility ............................................................................................................................. 1
instruCtional Considerations ..................................................................................................................... 1 essential Content .......................................................................................................................................... 1
CurriCulum expeCtations ................................................................................................................................2 assessment .......................................................................................................................................................2 prerequisites ...................................................................................................................................................3 logos .................................................................................................................................................................3 materials .........................................................................................................................................................4 letter to parents ............................................................................................................................................5
Activity 1: Fair Spinners ...................................................................................................................................6Activity 2: Tree Diagrams .............................................................................................................................. 10Activity 3: Frequencies ................................................................................................................................... 14Activity 4: Probability Experiments ............................................................................................................ 17Activity 5: Probability in Games ................................................................................................................... 20
BLM 1: Fair Spinners ....................................................................................................................................... 25BLM 2: Spinner Templates ............................................................................................................................. 26BLM 3: Data Collections ................................................................................................................................. 27BLM 4: A Fair Game? ....................................................................................................................................... 28BLM 5: How Many Teddies? .......................................................................................................................... 29BLM 6: Extensions and Family Activities ................................................................................................... 30BLM 7: Frequencies ..........................................................................................................................................31BLM 8: Addition Chart .................................................................................................................................... 32BLM 9: Experiment 1: Coin Flipping ............................................................................................................ 33BLM 10: Experiment 2: It’s In The Bag .................................................................................................... 34BLM 11: Experiment 3: Cup Tossing .......................................................................................................... 35BLM 12: Experiment 4: Number Cards...................................................................................................... 36BLM 13: Number Cards and Colour Discs (Marbles) ............................................................................... 37BLM 14: Number Games 1-3 .......................................................................................................................... 38BLM 15: Number Cards and Probability ..................................................................................................... 39BLM 16: Greater or Less................................................................................................................................ 40BLM 17: Constructing Spinners .....................................................................................................................41BLM 18: Tree Diagrams .................................................................................................................................. 42Solutions & Notes .......................................................................................................................................... 43
Suggested Assessment Strategies ........................................................................................................... 48
Other Resources ............................................................................................................................................. 55
Table of Contents


Overview Page 1
Investigations in Probability Grade 4: Counting on Probability
Overview
�����
Common BeliefsThe activities in this booklet have been developed within the context of certain values and beliefs about mathematics generally, and about probability specifically. Some of these are described below.
Importance of ProbabilityEven a cursory glance at newspapers shows the extent to which the language of probability has become important. Individuals need a knowledge of probability to function in our society; consumer reports, cost of living indices, surveys, and samples are a part of everyday life. Nearly all endeavours in the working world require making decisions in uncertain conditions. The goal is to help students develop the critical thinking skills needed to reach sound conclusions based on appropriate data samples.
Instructional Considerations“Classroom experiences should build on students’ natural abilities to solve problems in everyday situations of uncertainty”
NCTM
For example, students learn to play games, and quickly develop a notion of “fairness” which is related to equally likely events. These and other activities develop essential skills for understanding probability — methods of organized counting, comparing results of experiments to theoretical probabilities, using the language of probability correctly — in the context of activities such as dice and spinner games which may be fair or unfair, decoding messages, designing a lottery, and sampling to determine population size.
Essential ContentThe activities in this unit introduce basic probability concepts and language, specifically, the meanings of more/less/equally likely, and predicting probabilities from the frequencies of outcomes in simple experiments. In addition, there are Extensions in Mathematics, Cross-Curricular Activities and Family Activities. These may be used prior to or during the activity as well as following the activity. They are intended to suggest topics for extending the activity, assisting integration with other subjects, and involving the family in the learning process.During this unit the student will:• construct tree diagrams to determine all outcomes of an event;• identify all possible combinations of two or more events;• identify spinners as fair or unfair;• use data collected from simple experiments to calculate frequencies and
predict probabilities;• apply probability principles to simple arithmetic games;• use the language of probability correctly;• justify opinions with coherent arguments;• collaborate with other members of a group.

Page 2 Overview
Grade 4: Counting on Probability Investigations in Probability
Overview�����
Curriculum ExpectationsThe material in this unit is directly related to Ontario curriculum expectations for Mathematics outlined below. By the end of Grade 4, students will:• demonstrate an understanding of probability, and use language appropriate to
situations involving probability experiments;• compare experimental results with predicted results;• conduct simple probability experiments and use the results to make decisions;• use tree diagrams to organize data according to several criteria;• use a knowledge of probability to pose and solve simple problems (e.g.,
compare the probabilities of two events using the expressions more/less/equally probable)
AssessmentAssessment may be described as the process of gathering evidence about a student’s knowledge, skills, and values, and of making inferences based on that evidence for a variety of purposes. These purposes include making instructional decisions, monitoring student progress, evaluating student achievement in terms of defined criteria, and evaluating programs.
To meet these aims, it is necessary to use a variety of assessment techniques in order to:• assess what students know and how they think and feel about mathematics;• focus on a broad range of mathematical tasks and taking a holistic view of
mathematics;• assess student performance in a variety of ways, including written and oral,
and demonstrations;• assess the process as well as the product.
Tests are one way of determining what students have learned, but mathematical competence involves such characteristics as communicative ability, problem-solving ability, higher-order thinking ability, creativity, persistence, and curiosity. Because of the nature of the activities it is suggested that a variety of assessment strategies be used. Suggestions include:
• observing students as they work to see if they are applying various concepts; to see if they are working cooperatively; to observe their committment to the tasks;
• assessing the completed project to see if instructions have been followed; to see if concepts have been applied correctly; to see if the language of mathematics has been used correctly;
• assessing the students’ descriptions of their completed work to see if mathematical language is used correctly; to see if students understand the concepts used;
On the inside of the back cover of this booklet, you will find a chart connecting each activity to Ontario’s curriculum expectations.

Overview Page 3
Investigations in Probability Grade 4: Counting on Probability
Overview
�����
• providing opportunities for student self-assessment (Have students write explanations of their understanding, opinion, or feelings about an activity. One technique is to have them write under the headings What I Did, What I Learned, and How I Felt About It. Students could be asked to write a review of one day’s activities or of the whole unit’s work.);
• selecting an exemplary piece of work to be included in a portfolio for assessment purposes or for sharing with parents.
PrerequisitesStudents need very little previous knowledge to deal with these activities, but the use of a tally when counting outcomes will be helpful, as will an understanding of division (in particular, what is meant by ‘remainder’).
LogosThe following logos, which are located in the margins, identify segments related to, respectively:
Problem Solving Communication Assessment

Page 4 Overview
Grade 4: Counting on Probability Investigations in Probability
Overview�����
ACTIVITY
Activity 1Fair Spinners
Activity 2Tree Diagrams
Activity 3Frequencies
Activity 4Probability
Activity 5Probability in
Games
MATERIALS
• Copies of BLM 1 for all students• Copies of BLM 2 for all students• Acetate copies of BLMs 1 and 2 (optional)• Copies of BLM 17 (optional)• Acetate spinners for use on the overhead projector• Four acetate copies of BLM 3 (optional)• Copies of BLM 4 for all students (optional)
• Copies of BLM 5 for all students• Copies of BLM 4 if not used in Activity 1 (optional)• Copies of BLM 6 (optional)• Copies of BLM 18 (optional)
• Copies of BLM 7• Pages from a telephone book• Large chart for class data• Acetate copy of BLM 8 for overhead projector
• Copies of BLM 9, 10, 11, 12• Copies of BLM 13 (optional)• Paper cups with flat bottoms• Marbles/beads/buttons or discs as on BLM 13• Number cards as on BLM 13
• Copies of BLMs 14, 15• Copies of BLMs 2, 16 (optional)• Standard dice or number cubes in two colours• Number cards as on BLM 13
Materials

Overview Page 5
Investigations in Probability Grade 4: Counting on Probability
Overview
�����
letter to Parents
SCHOOL LETTERHEAD
DATE
Dear Parent(s)/Guardian(s):
For the next week or so students in our classroom will be participating in a unit titled “Counting on Probability”. The classroom activities will focus on organized counting, calculating simple probabilities using dice and spinners, and identifying games as fair or unfair.
You can assist your child in understanding the relevant concepts by working together to perform simple experiments, and play games, and helping to locate everyday ways probabilities are used.
Various family activities have been planned for use throughout this unit. Helping your child with the completion of these will enhance his/her understanding of the concepts involved.
If you work with probability in your daily work or hobbies, please encourage your child to learn about this so that he/she can describe these activities to his/her classmates. If you would be willing to visit our classroom and share your experience with the class, please contact me.
Sincerely,
Teacher’s Signature
A Note to the Teacher:If you make use of the suggested Family Activities, it is important to schedule class time for sharing and discussion of results.

Page 6 Activity 1
Grade 4: Counting on Probability Investigations in Probability
Activity 1: Fair Spinners
�����
Focus of Activity: • identifyingspinnersandgamesasfairorunfair
What to Assess: • whetherornotpredictions,andjustificationsgiven,arereasonable • abilitytoidentifysimplespinnersandgamesasfairorunfair • collaborationwithothers
Preparation: • Seethetableonpage4formaterials • constructspinnersA,B,C,DassuggestedonBLM17orcollectmaterials
andprovidecopiesofBLM17forstudentstomakethem;templatesforspinnersaregivenonBLM2
• constructanacetatespinnerforusewiththeoverheadprojector • makecopiesofBLM1forstudentsandacopyfortheoverhead • make4acetatecopiesofBLM3(optional) • makecopiesofBLM4(optional)
UsingadisplayspinnerofspinnerAonBLM1,askstudentswhereitislikelytostopifitisspunmanytimes.Willitstoponeachcolourthesamenumberoftimes?
Spin10timesandhavestudentsrecordtheresults.Compareresultswiththepredictions.Askwhattheythinkwouldhappeniftheycountedmorespins?
Distributethespinnersorthematerialstomakethem.
Havestudentsworkinpairsorsmallgroups.Eachgroupshouldrecordtheresultsof10spins,usingspinnerA.
Excerpt from BLM 1
Red Yellow
Blue Green
Spinner A
Activity:
For more on line plots such as the one shown, see “Investigations in Data Management: Grade 4: Our Classroom Community”. See ordering information at the end of this unit.
In our discussions of probabilities in these activities, we are assuming perfectly balanced dice, coins, and spinners. In actuality, most dice, coins, and spinners are not perfectly balanced.
Results of ____ spins using spinner ____
RED
YELLOW
BLUE
GREEN
Colours
��
�
��
��
� �
��
��
��
�
���

Activity 1 Page 7
Investigations in Probability Grade 4: Counting on Probability
Activity 1: Fair Spinners
�����
Collectgroupresultsinachartsuchastheoneshownonacetate,blackboard,orchartpaper.
Ifyoumake4copiesofsuchachartonacetateforusewithanoverheadprojector,youcanrecordresultsforall4spinners.(AmastercopyofachartisgivenonBLM3.)
Tocollectthedatayoumaywishtohaveeachgrouprecordtheirownresultsonthegroupchartastheycompletetheworkwitheachspinner.
Askstudentsiftheclassresultsaresimilartoordifferentfromeachindividualgroup’sresults.Askwhy.
Studentsshouldseethatthemoreoftentheyspinthespinner,themorelikelyitisthateachcolourwilloccuronequarterofthetime.
Because these are student-made spinners it is unlikely that each colour will occur for exactly one quarter of the spins.
ExaminespinnersB,C,andDwiththestudents.Askstudentswhattheythinktheresultswillbe.Haveeachgrouprecordtheresultsof10spinsforeachspinner.
Alternative:AssignspinnerBtothreeorfourpairs/groups,spinnerCtothreeorfourpairs/groups,andspinnerDtothreeorfourpairs/groups.Haveeachgrouprecordtheresultsof30spins.
Recordtheresultsofallspinsforeachspinneronblackboard,overheadorchartpaper.
Askstudentstocomparetheirpredictions(eitherorallyorinwriting)withtheactualresults.Usequestionssuchasthefollowingtoguidethediscussion/writing:
“Didyourpredictionmatchtheresults?Whyorwhynot?” “Whydodifferentspinnersgivedifferentresults?”
Indiscussingtheseissues,studentsshouldbeabletosaythat,forexample,theywouldexpecttospinredtwiceasoftenasblueoryellowforspinnerC.
Communication
Assessment
Excerpt from BLM 3
Results of ____ spins using spinner ____
Red YellowColour
GroupBlue Green
1
2
3
4
5
Total
� � � �
� � � �

Page 8 Activity 1
Grade 4: Counting on Probability Investigations in Probability
Activity 1: Fair Spinners
�����
Askstudents:“SupposeyouwereusingspinnerAforagameinwhichyouwonifyouspunred,butotherwiseyoulost.Isthisafairgame?”
Studentsmayhavedifferentinterpretationsoftheword“fair”.Whatismeantinthiscaseis:Isyourchanceofwinningthesameasyourchanceoflosing?
Askstudents:“Whichspinner(s)wouldgiveyouanequalchanceofwinningorlosing?”
Describeothergames:“Supposeyouwinifyouspinblue.Otherwiseyouropponentwins.Wouldanyofthespinnersgiveyoubothanequalchanceofwinning?Explain.”
Students should be quick to see that using Spinner D would give both players an equal chance.
Giveachallenge:“Supposeyouwin,andadd1pointtoyourscore,ifyouspinblue.Ifyouropponentspinsred,he/sheadds2pointstohis/herscore.Willanyofthespinnersmakethisafairgame?Explain.”
Studentswillneedtimetoconsiderthis.Havethemdiscussthisinpairs/groupsandhaveeachpair/groupwriteanexplanationtoreadtotheclass.
Once again, Spinner D will make this a fair game. Since blue is twice as likely as red, then the ‘blue’ player will win 1 point twice (2 points) for every time the red player wins and gains 2 points.
Extensions in Mathematics:1. The activity described on BLM 4 can be used to lead into Activity 2, so you
may wish to assign it at this point. Alternatively, it could be used as the introduction to Activity 2. It could also be used as a Family Activity.
DistributecopiesofBLM4andgoovertheruleswiththestudents.Allowthemtimetomakepredictionsandtoplaythegame.Discusstheirconclusions.Collectdatafromtheentireclassandcomparetheaggregatedatawithindividualgroupdata.Askstudentswhyitisagoodideatotestagameagreatnumberoftimes.
Problem Solving
Problem Solving
Assessment

Activity 1 Page 9
Investigations in Probability Grade 4: Counting on Probability
Activity 1: Fair Spinners
�����
Students may or may not be surprised to discover that the game is fair. Each spinner has two even numbers and two odd numbers. To get an odd-numbered total, you need to spin one odd and one even number. Students may need to record all possible sums to see that 8 totals are even and 8 totals are odd. Activity 2 deals with an organized counting technique known as a tree diagram. You may wish to postpone analyzing the game on BLM 4 until after this technique has been introduced.
Family Activities:1. Askstudentstoworkwithfamilymemberstoinventandtestafairgamethat
usesspinnerCfromBLM1.2. Askstudentstoexaminethegamestheyhaveathometoseeiftheyarefairor
unfair.Startalistonchartpaper,blackboardorbulletinboardoffairgames.Whentimepermits,astudentcoulddescribeagametotheclassandtellwhyitisthoughttobefair.
Other Resources:Foradditionalideas,seeannotatedOtherResourceslistonpage54,numberedasbelow.
3. “LinkingAssessmentandInstructioninMathematics:JuniorYears”,OAME8. “MakingSenseofData:AddendaSeries,GradesK-6”,MaryLindquistetal.11.“MeasuringUp:PrototypesforMathematicsAssessment”,MSEB&NCTM20.“CatandMouse”,BrianLannen
Problem Solving

Activity 2 Page 10
Investigations in Probability Grade 4: Counting on Probability
Activity 2: Tree Diagrams�����
Focus of Activity: • organizedcountingusingtreediagrams
What to Assess: • identificationofpossibleoutcomesforgivensituations • constructionandinterpretationoftreediagrams • collaborationwithothers
Preparation: • makecopiesofBLM5 • makecopiesofBLM6(optional) • makecopiesofBLM4(ifnotusedforActivity1) • makecopiesofBLM18ifyouwishstudentstohavenotesontreediagrams
RefertoExtension1ofActivity1.(SeealsoBLM4.)
Ifstudentshavealreadytriedthis,startbyaskinghowtheydecidedifthegamewasfairornot.Leadintotheideathat,topredictfairness,oneshouldlistallpossibleoutcomes(i.e.,allpossibletotalsofnumbersonthetwospinners).
Ifstudentshavenottriedthegame,youmaysimplywishtofocusontheideaoflistingalloutcomes,ratherthandiscussingthefairnessorunfairnessofthegame.
Askstudentshowtheycouldmakesuchalistandbesurethattheyhavelistedallpossiblesums.Allowtimeforthemtotrysomeofthesuggestedtechniquesanddiscussthem.Ifnoonesuggestsanyversionofa‘treediagram’,introduceitasausefultechniquewhendealingwithtwoorthreevariables.
Forexample:
First,listthepossibleoutcomesforthefirstspin(1,2,3,and4).
Decidehowmanyoutcomesarepossibleforthesecondspin,anddrawthatnumberof‘branches’fromeachfirst-spinoutcome.Sincetherearefouroutcomesforeachspin,weneedfourbranchesfromeachfirst-spinoutcome.SeeFigure1.
Listthefourpossibleoutcomesforthesecondspin,foreachoutcomeofthefirstspin,asshowninFigure2.
CalculatethesumofeachbranchasshowninFigure3.
Activity
Spin #1
1
2
3
4
Fig. 1

Page 11 Activity 2
Grade 4: Counting on Probability Investigations in Probability
Activity 2: Tree Diagrams
�����
Thesumscannowbeseparatedintoevenandoddnumbers,showinganequalnumberofeach.Thuswecansaythatthegameisfair.
Havestudentscopythetreediagramforpractice.Moststudentsneedpracticeinspacingtheoutcomes,particularlyinthefirstcolumn.Theyoftenwritethesesoclosetogetherthattheycannotextendthebranchesinalegiblemanner.Thisisevenmoreofaproblemwhentherearethreesetsofoutcomestodealwith,asinExtension1below.Apartialtreediagramisshown.Youmaywishtodiscusswithstudentstheimportanceofplanningaheadwhendrawingatreediagraminordertoensurethatthebranchesarenotcrowded.
PartialTreeDiagram TreediagramsmayalsobedrawnasshownforExtension1 below
Spin #1
1
1234
Spin #2
2
1234
3
1234
4
1234
Studentsshouldusewhicheverformatiseasierforthem.
BLM18suggestssomeexperimentsthatcanbeusedtopracticedrawingtreediagrams.
Spin #1
1
1234
Spin #2
2
1234
3
1234
4
1234
Sums2345345645675678
evenodd
evenoddodd
evenodd
eveneven
oddeven
oddodd
evenodd
even
Assessment
Fig. 2 Fig. 3
Spin #1
1
1234
Spin #2
2
1234
3
123
4
Sums345
456
1
6
7
etc.
Spin #31
1 2 3 4
1 2 3 4
1 2 3 4 1 2 3 4 1 2 3 4
2
etc.
1 2

Activity 2 Page 12
Investigations in Probability Grade 4: Counting on Probability
Activity 2: Tree Diagrams�����
DistributecopiesofBLM5.Makesurestudentsunderstandtheproblem,andthattheymusttrytojustifytheiranswers.Allowtimeforstudentstoworkontheproblem.Theyshouldhavemarkersorcrayonsavailabletocolourtheteddiesasnecessary.
Studentsmayormaynotchoosetouseatreediagramatthispoint.Whethertheydoornot,theuseofatreediagramshouldbebroughtoutinthediscussionoftheproblemafterstudentshavetriedtosolveit.
Onetreediagramwillhavethreechoicesforthefirstitem(numbersofbuttons),butonlytwochoicesforthesecond(colourofvest).However,thecolourofvestandthenumbersofbuttonscouldbedealtwithintheoppositeorder.Twopossibletreediagramsaregivenbelow.
Studentsshouldseethateithertreediagramgivesthesamesixresults.Theyshouldalsobeabletosaywithconfidencethataddingtheredorbluestripessinplyturnseachofthesixresultsintotwo—onewithredstripesandonewithblue,andthereforetherewillbetwelvepossibleoutcomes.
Youmaywanttoleadstudentstotheunderstandingthatmultiplyingthenumberofchoicesateachstagewillgivethetotalnumberofpossibilities.
Forexample, thenumberofvestcoloursis2; thenumberofchoicesforbuttonsis3; thenumberofcoloursforstripesis2.Thus,thereare12possiblebears. 2 x 2 x 3 = 12
Problem Solving
Assessment
The general rubric in “Suggested Assessment Strategies” (following Solutions and Notes) has been adapted for this particular problem, as a sample to assist you in assessing your students.�
�
�
����������
�������
������� ����
����
� ��
����
� ��
����
� ��
�����
� � �
������
� � �
������������
���������������

Page 13 Activity 2
Grade 4: Counting on Probability Investigations in Probability
Activity 2: Tree Diagrams
�����
Youmay,however,wishtouseanotherexampleortwo(asgivenbelow)beforebringingthisout,thusgivingstudentsachanceto‘discover’thisforthemselves.
“Sandyiswrappingpartyfavours.Eachfavouristobewrappedusingdifferentcoloursofpaperandribbon.Shehaspink,gold,andgreenpaper.Shehasblue,red,silver,andgoldribbon.Howmanydifferentlywrappedpartyfavourscanshemake?”
Ifyouwishtopresentstudentswithachallengeturntheproblemaround:“Sandyiswrappingpartyfavours.Eachfavouristobewrappedusingdifferentcoloursofpaperandribbon.Shehaspink,gold,andgreenpaper.Howmanydifferentcoloursofribbonmustshebuyifsheneeds12differentlywrappedpartyfavours?”
The Extensions and Family Activities below provide further activities to give students practice in the use of tree diagrams. Some of these have been printed on BLM 6 so that copies can be given to the students. Students will find these problems easier if they use the technique of multiplying the numbers of choices, as shown on the previous page for the teddy bears.You might wish to give students a choice as to which problem they wish to work on.
Extensions in Mathematics:1. AgamesimilartotheoneonBLM4usesthreeofthesamespinners,ratherthan
two.Theotherrulesarethesame.Askstudentsiftheythinkthisgameisfair,andwhy.Allowtimeforthemtoplaythegametotesttheirpredictions.Atsomepoint,helpthemtoconstructtreediagramstolistallpossibleoutcomes,inordertoseethathalftheoutcomesareoddnumbersandhalftheoutcomesareevennumbers.Thereforethegameisfair.
For the next three activities, you might wish to add a question, asking if a tree diagram would be useful in solving this problem, and, if so, how it could be used.
2. See“Terry’sT-shirts”,BLM6.
Family Activities:1. See“Pete’sPizzaParlour”,BLM6.2. See“LicensePlates”,BLM6.
Other Resources:Foradditionalideas,seeannotatedOtherResourceslistonpage54,numberedasbelow.
13.“TruthorCoincidence”,DanielJ.Brohier20.“CatandMouse”,BrianLannen22.“CalendarMathematics”,LornaJ.Morrow
Problem Solving

Page 14 Activity 3
Grade 4: Counting on Probability Investigations in Probability
Activity 3: Frequencies
�����
Focus of Activity:• useoftalliestorecordfrequencies• relatingfrequenciestoprobabilities
What to Assess:• accuracyandefficiencyoftallies• useoflanguageofprobability(e.g.,‘frequency’,‘morelikely’)• collaborationwithothers
Preparation: • makecopiesofBLM7• providetelephonebookpages
• preparealargechartoranacetatecopyofBLM7forclassdata • makeacopyofBLM8fortheoverhead,andcopiesforstudents(optional)
Thisactivityisdesignedtogivestudentsexperienceincollectingdataandrelatingthefrequenciesofcertainbitsofdatatotheprobabilityoftheiroccurrence.
Giveeachstudentpair/groupacopyofBLM7andacopyofapagefromatelephonebook.Havestudentsselectonecolumnonthepageandrecordthelastdigitsofthesenumbers.Ifstudentshavenotusedatallybefore,youwillneedtoshowthemhowthisisdone.
Youmightwanttosuggestthatonestudentreadseachfinaldigit,whileanothercompletesthe‘Tally’column.Thefinalcolumn,‘Frequency’,simplymeansthenumberoftimesadigitoccurs.
ExcerptfromBLM7:
Stopstudentswhentheyhavecompletedthefirstchart.Askseveralpairsfortheirfindings.Makealargechartontheblackboard/overhead/chartpaperandrecordthefindingsfromthewholeclass.
Activity:
Lastdigitin TallyFrequencytelephonenumber
0 12
1 9
2

Activity 3 Page 15
Investigations in Probability Grade 4: Counting on Probability
Activity 3: Frequencies
�����
+ 0 1 62 3 4 5 7 8 90123456789
lastdigit
ExcerptfromBLM8:
second
last
digit
Frequenciesfrompairs/groups frequency
LastdigitGroup1 Group2Group3
0 9 13 10 1 13 14 7
2 25 8 6
3 4 12 19
Askstudentstocomparetheirindividualresultswiththewholeclassresults.Theyshouldseethatthefrequencyofeachdigitisclosetothefrequencyofanyotherdigitwhenenoughdatahasbeencollected.
Alternatively, we could say that the “relative frequency” of one digit is close to the relative frequency of each other digit.
Suppose in a total sample of 800 phone numbers, there were 78 ones. The relative frequency of “1” would be 78 out of 800.
Beforestudentsbeginwith#3onBLM7,askforsomepredictions.Discussthisbriefly,havingstudentsgivereasonsfortheirpredictions.Thiswillhelpthemintryingtoputtheirreasonsintowordsfor#3(b)and(c).Allowthemtimetocompleteallpartsof#3.
Studentsmayassumethat,sincethefrequenciesofindividualdigitsarereasonablyeven,thesamewillhappenwithsums,andtheymaybequiteconfusedwhenthisdoesnothappen.Iftheyarehavingrealdifficultytryingtoexplainwhythishappens,usethechartonBLM8.
Completethechartwiththestudentstoshowallpossiblecombinationsofthelasttwodigits.
Studentsshouldquicklyseethatsomesumsoccurmoreoftenthanothers.
Forexample,thereisonlyonecombinationthatgivesasumof‘2’,butthereareseveralthatgiveasumof,say,‘9’.
...
...
...
...
...
Problem Solving
Assessment
Communication
ExcerptfromBLM7:Overall

Page 16 Activity 3
Grade 4: Counting on Probability Investigations in Probability
Activity 3: Frequencies
�����
Communication
Therefore,thefrequenciesofthesumsshouldnotbeequal.Studentsshouldincorporatethisideaintheirreasoningwhenrespondingto#3(c).
Askstudentsiftheywouldexpectsimilarresultsiftheyusedthefirsttwodigitsofseven-digittelephonenumbers.Theyshouldseethatthereisfarlessvarietyinthefirsttwodigits.Ifthetelephonebookpageisfromasmalltown,allnumbersmayhavethesamefirsttwodigits.
Askstudentswhyachartisbetterthanatreediagramfordeterminingthefrequenciesofallthesums.Theyshouldseethat,althoughitispossibletouseatreediagramtodeterminenotonlyallthepossiblesumsbutalsotheirfrequencies,itwouldbeawkwardbecauseofthenumberofbranchesneeded.
Family Activities:1. Studentscouldaskfamilymembersforpredictionsaboutthefrequenciesofboth
finaldigitsandsumsoflasttwodigitsoftelephonenumbers,andreportthesepredictionsthenextday.Encouragethemtousetheopportunityto“teach”theirfamiliessomeideasaboutorganizedcountingandprobability.
Other ResourcesForadditionalideas,seeannotatedOtherResourceslistonpage54,numberedasbelow.
12.“WhatAreMyChances?”,CreativePublications18.“MathematicsTeachingintheMiddleSchool,FocusIssueonDataandChance”,
NCTM21.“OrganizingDataandDealingwithUncertainty”,NCTM22.“CalendarMath”,LornaJ.Morrow

Page 17 Activity 4
Grade 4: Counting on Probability Investigations in Probability
Activity 4: Probability Experiments�����
Focus of Activity:• predictinganddeterminingprobabilitiesfromobservedfrequencies
What to Assess:• accuratecollectionofdata• useofdatatopredictfrequencies• useoflanguageofprobability• collaborationwithothers
Preparation: • makecopiesofBLMs9,10,11and12• makecopiesofBLM13(optional)• haveavailablepapercups:usetheonesthatareflatonthebottom• haveavailablemarblesorothermaterialsincoloursasneededfor
Experiment2onBLM10.UsecolourdiscsonBLM13ifothermaterialsarenotavailable.
• provideNumberCardsasgivenonBLM13forusewithExperiment4onBLM12
RefertoActivity3asan“experiment”inwhichstudentsmadepredictionsabouttelephonenumbersandtestedthembycollectingdata.Furtherexperimentsareoutlinedbelow.
Itisnotessentialthateverystudenttryeveryexperiment.However,thenumberofstudentstryinganexperimentshouldbesufficienttoprovideenoughdatatodrawreasonableconclusions.
DistributecopiesofBLMs9,10,11,and12,alongwithmaterialsneeded,topairsofstudents.Ifyoudonotwishallstudentstodoallexperimentsdistributedifferentexperimentstodifferentgroups.MakesurethereareatleastfourgroupsorpairsperformingeachexperimentsothatstudentscancollectdatafromeachotherasdirectedineachExperiment.Alternatively,youmaywishtoextendthisactivityovertwoormoredays.OneormoreoftheexperimentscouldalsobeusedasFamilyActivities.
BLM13providescolourdiscsandNumberTilesforExperiments2and4respectively.Studentscancutandpastetheseoncardboardanddrawthemfrombagsorenvelopestocarryouttheexperiments.
Studentsshouldneedverylittleexplanationoftheactivities,butshouldberemindedtobeaccurateintheirdatacollection.TheirwrittenanswerscouldbedoneontheBLMsorinmathjournalsornotebooks,butstudentsshouldbeexpectedtowritesomething.
Activity:
Communication

Activity 4 Page 18
Investigations in Probability Grade 4: Counting on Probability
Activity 4: Probability Experiments�����
Oncestudentshavecollectedsufficientdatafromtwoorthreeexperiments,usethistodiscusstheprobabilityofeachoftheoutcomes.Forexample,sincetherearetwooutcomesforcoinflipping(headsandtails),andtheyareequallylikely,thentheprobabilityofflippingaheadis‘1outof2’.Similarly,theprobabilityofflippingatailis‘1outof2’.Althoughthisissometimeswrittenas‘’,speakingofprobabilityas‘xoutofy’hasmoremeaningforstudents.
ForExperiment2(BLM10),thereare12possibleoutcomes,althoughsomeareidentical.Sincethereare12beadsandthreeofthemarered,thetheoreticalprobabilityofdrawingaredis‘3outof12’.Thetheoreticalprobabilityofdrawingablueis2outof12,andsoon.Therefore,ifalargeenoughsampleofdataiscollected,wewouldexpecttoseethatredisdrawnmorefrequentlythanblue,andthatblueandgreenaredrawnaboutthesamenumberoftimes.Studentsshouldcomparethetheoreticalprobabilitieswiththeirexperimentalresults.
Some students may say that Experiment 2 has only 4 outcomes: drawing red, drawing blue, drawing green, or drawing yellow. They should understand that since there are 3 red beads, a red bead can be drawn in three different ways, each of which is a separate outcome. To clarify this, you may wish to label the red beads as ‘Red 1’, ‘Red 2’ and ‘Red 3’ or ‘R1’, ‘R2’ and ‘R3’. Other colours can be similarly labelled. See Extension 1 for a similar activity.
Experiment3(BLM11)isacasewhereexperimentaldataisneededtopredictaprobabilityofthecuplandinginoneofthreeways.Studentsoftenpredictthatthecupwillfrequentlylandupsidedown.
InExperiment4(BLM12)thetheoreticalprobabilityofdrawinganydigitis1outof10sincethereare10NumberCardsandeachoneisequallylikelytobedrawn.Sincethereare10outcomesforthisExperiment,itisnecessarytocollectdatafromseveralgroupsbeforetheexperimentalprobabilityisclosetothetheoreticalprobability.
YoumightwishtoexpandExperiment4and,atthesametime,reviewsometerminology.Askstudentsfortheprobabilityofdrawing,forexample,anevennumber,amultipleof3,asquarenumber,aprimenumber.
SinceActivity5willdealwithNumberCards,keepthecardsforusenextday.
Extensions in Mathematics:1. Abagofjellybeanscontains5black,3red,3yellow,and1orange.Ifyoudraw
outonejellybean,whatcolourisitmostlikelytobe?Why?
Sincethereare12jellybeans,thereare12outcomes.Listthem,startingwith“black,black,...”.
Problem Solving
Assessment

Page 19 Activity 4
Grade 4: Counting on Probability Investigations in Probability
Activity 4: Probability Experiments�����
Whatistheprobabilityofdrawingared?anorange?
Designaspinnerthatwillgivethesameprobabilitiesforeachcolourthatthebagofjellybeansdoes.
Cross-curricular Activities:1. Brieflydiscussfactorsaffectingreadability-forexample,wordlength,sentence
length.Havestudentsselectanewspaperormagazinearticle.Thenhavethemlist,inorder,the3word-lengthstheyexpectwillbemostcommon,andhavethemtellwhytheythinkso.Then,havethestudentscountthenumberof1-letterwords,2-letterwords,3-letterwords,...,10-letterwords,andwordsofmorethan10letters.
An efficient way to count word-lengths is to have one student call out the number of letters in each word in sequence and another student record this in a tally such as the one shown.
Havethemcomparetheactualcountswiththeirexpectations.Youmaywishtocontinuethisexercisebycomparingjournalisticarticleswithfictionbooksortextbooks.Askstudentsiftheywouldexpectthesamemostcommonword-lengthsinaGrade1storybookandwhy.Havethemtesttheirpredictions.
Family Activities:1. Havestudentsandfamilymembersexploremagazines,newspapers,and
televisiontofindinstancesoftheuseoftheideasofprobabilityorchance. e.g.,“There’sa40%chanceofraintomorrow”. “Winsixways!Tenoutofeveryhundredlotteryticketsarewinners!”
Other Resources:Foradditionalideas,seeannotatedOtherResourceslistonpage54,numberedasbelow.
3. “LinkingAssessmentandInstructioninMathematics:JuniorYears”,OAME12.“WhatAreMyChances?”,CreativePublications15.“ChoiceandChanceinLife:TheGameof‘Skunk’”,DanBrutlag21.“OrganizingDataandDealingwithUncertainty”,NCTM
Problem Solving
Communication
Number of Letters
Number of Words
3
10
More than 10

Activity 5 Page 20
Investigations in Probability Grade 4: Counting on Probability
Activity 5: Probability in Games
�����
Focus of Activity:• identifyingprobabilitiesinnumbergames• usingprobabilities
What to Assess:• abilitytolistpossibleoutcomes• abilitytoidentifyfavourableoutcomes• useofthelanguageofprobability• collaborationwithothers
Preparation: • makecopiesofBLMs14and15• makecopiesofBLM2(optional)• makecopiesofBLM16(optional)• providestandarddiceornumbercubesintwocolours• makecopiesofBLM13orprovidesetsofnumbercardsmadeearlierfor
Activity4
InthisActivitystudentswillbeplayingsomesimplenumbergamesandapplyingsomeconceptsofprobabilityfromActivities1to4.Studentswillbeaskedquestionsaboutfavourableoutcomes,likelihoodsofspecificoutcomes,andwinningstrategies.
Ifdicearenotavailable,constructspinnersusingthetemplateonBLM2thathas6equalsections,andlabelthesectionsofthespinner1,2,3,4,5,6.Insteadofusingdiceoftwocolours,havethestudentsdistinguishbetweenthefirstandsecondspinofthespinner.
AnalternativetodiceandspinnersisthesetofNumberCardsfromBLM13.Studentscanpastethenumbersoncardorbristolboardandplacethemfacedown.Twoaredrawnforeachturn,indicatingtensfirst,thenones.Thecardsfor0,7,8,and9canbeignoredorcanbeusedtoexpandthepossibilitiesofthegames.ThesecardswillbeneededforgamesonBLM15.
PlayGames1and2withthewholeclasssincethegamesarequitesimple.Studentsshouldthenbeabletoconsiderbothgamesandwriteanswerstoquestion#1.TheyshouldseethatGame2providesmoreflexibilityandthattheprobabilityofgettingahigherscoreisgreaterthaninGame1.
Activity:
Assessment

Page 21 Activity 5
Grade 4: Counting on Probability Investigations in Probability
Activity 5: Probability in Games
�����
OutcomesforGame1couldbelistedusingachartoratreediagram,andstudentsaskedtoidentifythefavourableoutcomes.Justwhichoutcomesare‘favourable’willdependonthestudents.Forexample,theymightconsideranyscoreinwhichthetensdigitisgreaterthantheonesdigittobefavourable.Alternatively,onlythosewithatensdigitof5or6mightbeconsideredfavourable.
HavethestudentsplayGame3afewtimesbeforetryingtoanswerthequestions.Moststudentsarenotawareofcertainpropertiesofdivisionandremaindersthatwouldhelpthemdecidewhichoutcomes(rollsofthethirddie)arefavourable.Forexample,manythinkthat‘1’isagoodroll,untiltheyrealizethattheremainder(andthereforetheirscore)willalwaysbezerowhenthedivisoris‘1’.Theyshouldcometorealizethatthenumberofpossibleremaindersisonelessthanthedivisoritself.Thatis,whendividingby5,remainderscanbe1,2,3,or4(fourpossibilities).If‘zero’isconsideredasaremainder,thendividingbyfivecanhavefivepossibleremainders.
StudentscoulduseatreediagramoracharttolistallpossibleoutcomesfromthemultiplicationstepinGame3:
Oncetheproductsarelisted,studentscanexploretheresultsofdividingbythenumberonthethirddie.Asalreadynoted,divisionbyoneisnotfavourable.Sincemorethanhalftheproductsareevennumbers,divisionby2isalsonotfavourable,sinceitwillusuallygivearemainderofzero,andotherwisearemainderofonly‘1’.
Itisnotnecessarytolistallpossibleremaindersforallpossibledivisors,butstudentsshouldhavegoodreasonsforsuggestingthatcertainrollsofthedicearemorefavourablethanothers.
Somestudentsmaybeconfusedbytheideaofdividing,say,a‘3’by‘5’,buttheyshouldunderstandthat“Therearezerofivesinthree,withthreeremaining.”
3÷5=0R3
1
1 2 3 4 5 6
First Die
Second Die
2
1 2 3 4 5 6
3
1 2 3 4 5 6
4
1 2 3 4 5 6
5
1 2 3 4 5 6
6
1 2 3 4 5 6
Products 1 2 3 2 4 6 4 8 20 25 30 30 36
Communication
Problem Solving
PartialTreeDiagramFor a chart see Activity 3, BLM 8. Change the chart to a multiplication chart. Use only the digits 1, 2, 3, 4, 5, and 6.

Activity 5 Page 22
Investigations in Probability Grade 4: Counting on Probability
Activity 5: Probability in Games
�����
DistributeBLM15.Readtherules,andthenplaythegameusingGameBoard1atleastoncewiththewholeclass.HaveeachstudentsketchtheGameBoardonscrappaper.Drawanumbercard.Instructthestudentstowritethatnumberinoneofthesixboxes.Continueuntilsixnumbershavebeendrawn.Donotreturnthecardstothefacedowncollection.Instructthestudentstocalculatethetotalofthethreetwo-digitnumbers.Thewinneristheplayerwiththegreatesttotal.Therewillprobablybemorethanonestudentwiththistotal.
Afterplayingthegameonceortwice,stopafterthe4thdrawandaskstudents: “Whathighnumbershavebeendrawn?” “Howmanylownumbershavebeendrawn?”
“High” and “low” are somewhat arbitrary but most students interpret ‘high’ as 7,8,9 and ‘low’ as 0,1,2,3.
“Doyouthinkthenextnumberdrawnwillbeahighnumberoralownumber?Why?”
Drawafifthnumbercard.Askstudents: “Whichismorelikelyforthelastnumber—thatitwillbehighorthatitwillbelow?Why?”
Drawthenumberandhavestudentscalculatetheirscores.
YoumaywishtocontinuewithBLM15asawholeclassactivitysincethegamesareeasytoplayandyoucanphrasequestionstousethelanguageofprobabilitysuchasaskingifa‘high’or‘low’numberismorelikely,orevensuchquestionsas“Whatistheprobabilitythatthenextnumberwillbeanine?”
Studentsshouldhavetimetothinkaboutsomeofthequestions,however,andquestion2onBLM15isagoodoneforamathjournal.
Youmaywishtoaltertherulesforanyofthegamesbystatingthatthewinnerwillbetheonewiththelowestsumordifferenceorproduct.GameBoard4couldhaveasthewinnertheonewhohasthegreatest/leastquotientorthegreatest/leastremainder.Watchforstudentswhoareabletoapplysomeoftheirconclusionsfromearliergames.
The use of calculators for BLM 15 will allow students to concentrate on the game strategies rather than the computation.
Problem Solving
Communication
Assessment

Page 23 Activity 5
Grade 4: Counting on Probability Investigations in Probability
Activity 5: Probability in Games
�����
IfthisActivitycannotbecompletedinthetimeallotted,thegamesaregoodonestotakehomeandplaywithfamilymembers.Studentscanreportontheexperiencethefollowingday.
Extensions in Mathematics:1. BLM16providesanothergameinwhichstudentscanidentifyfavourableand
unfavourableoutcomes.Sincethegamedependsagreatdealonluck,awinningstrategyismoredifficulttodefine.However,knowingthatsomerollsofthedice(e.g.,lessthan80,morethan30)providemorechoices,studentsmayusethistoidentifygoodplacementsfortheirchips/counters.
Thegamecanbeplayedintwoways:(i)donotallowmorethanonechiponanynumber,or(ii)doallowmorethanonechiponanynumber.Studentscouldbeaskedhowtheirwinningstrategieswillchangefrom(i)to(ii).
IfstudentscorrectlyinterprettheconditionsinQuestion#4onBLM16,theywillrealizethatthischangegivesthempermissiontocoveranynumberontheboardtheywant,andthereforethegamebecomesakindofglorifiedtic-tac-toe.
Family Activities:1. Havestudentstakeoneormoreofthegameshomeandtrytodeviseawinning
strategywithotherfamilymembers.
Other Resources:Foradditionalideas,seeannotatedOtherResourceslistonpage54,numberedasbelow.
9. “RolltheDice-anIntroductiontoProbability”,AndrewFreda17.“RacingtoUnderstandProbability”,LauraR.VanZoestandRebeccaK.Walker21.“OrganizingDataandDealingwithUncertainty”,NCTM
Problem Solving


Black Line Masters Page 25
Investigations in Probability Grade 4: Counting on Probability
BLM 1: Fair Spinners
Spin each spinner 10 times and record the results in one of the boxes below.
Make spinners as shown.
Results of ____ spins using spinner ____
Red Yellow Blue GreenColours
Results of ____ spins using spinner ____
Red Yellow Blue GreenColours
Results of ____ spins using spinner ____
Red Yellow Blue GreenColours
Results of ____ spins using spinner ____
Red Yellow Blue GreenColours
Red Yellow
Blue Green
Spinner A
Red
Yellow
Green
Spinner B
Yellow
Green Red
Red Yellow
Blue
Spinner C
Red
Yellow
Blue
Spinner D
Red

Page 26 Black Line Masters
Grade 4: Counting on Probability Investigations in Probability
BLM 2: Spinner Templates

Black Line Masters Page 27
Investigations in Probability Grade 4: Counting on Probability
BLM 3: Data Collections
Results of ____ spins using spinner ____
Red YellowColour
GroupBlue Green
Total

Page 28 Black Line Masters
Grade 4: Counting on Probability Investigations in Probability
This is an activity for two people or two teams. One is Odd and one is Even. Decide who will be ‘Even’ and who will be ‘Odd’ before reading further.
Use the spinner shown. Make a pointer for the spinner the way you did for BLM 1.
In each turn, spin the spinner twice and add the two numbers. It doesn’t matter who spins the spinner.
One player or team wins if the sum is even; the other player or team wins if the sum is odd.
1. Before you start the game tell whether or not you think this is a fair game. Why or why not?
Take ten turns and record your result in the chart below.
Turns Sample 1 2 3 4 5 6 7 8 9 10
Sum of the two spins 6
Player Odd: LWin or Lose?
Player Even: WWin or Lose?
2. Was your prediction accurate? Is this a fair game? Explain.
BLM 4: A Fair Game?
1
2
3
4

Black Line Masters Page 29
Investigations in Probability Grade 4: Counting on Probability
BLM 5: How Many Teddies?Each teddy should have 1 or 2 or 3 buttons on his vest.His vest is either white or yellow.1. How many different teddies are possible? How do you know?
2. Suppose the teddies could have either red or blue stripes on their vests. How many teddies could there be now?
3. How can you be sure you have counted all the possibilities?

Page 30 Black Line Masters
Grade 4: Counting on Probability Investigations in Probability
Terry’s T-shirtsThe manager of Terry’s T-shirts wanted to order more stock. One factory could supply Terry with t-shirts in different colours and different sizes, and with different neck styles.
1. Make up a problem based on this information.
2. Write the problem on one side of a sheet of paper.
3. Write a full solution on the other side of the paper.
4. Trade problems with another group and try to solve their problem.
5. Compare your solution with theirs.
Pete’s Pizza ParlourAt Pete’s Pizza Parlour, a basic pizza is $8.75. Each topping is an extra 50¢. Possible toppings are mushrooms, pepperoni, bacon, pineapple, and extra cheese.
1. How many different pizzas are possible with (i) 1 extra topping? (ii) 2 extra toppings? (iii) 3 extra toppings?
2. A Challenge: One of Chris’ friends is allergic to pepperoni, so Chris decides not to include pepperoni on any pizza. How many choices does Chris have if he never orders more than two toppings?
License Plates
1. A standard Ontario car license plate has 3 letters and 3 digits. If all 10 digits (0,1,2,3,4,5,6,7,8,9) can appear in any one of the 3 spots,
how many different digit combinations are possible?
2. If all possible letter combinations are allowed, how many combinations of 3 letters are there?
3. How many different licenses are possible under these conditions? [Hint: How many digit combinations are possible for each letter combination? How many letter
combinations are there?]
4. Would this be enough license plates for everyone in Ontario? How do you know?
BLM 6: Extensions and Family Activities
���������
Black Line Masters Page 31
Investigations in Probability Grade 4: Counting on Probability
Sum of last Tally Frequency two digits
0
1
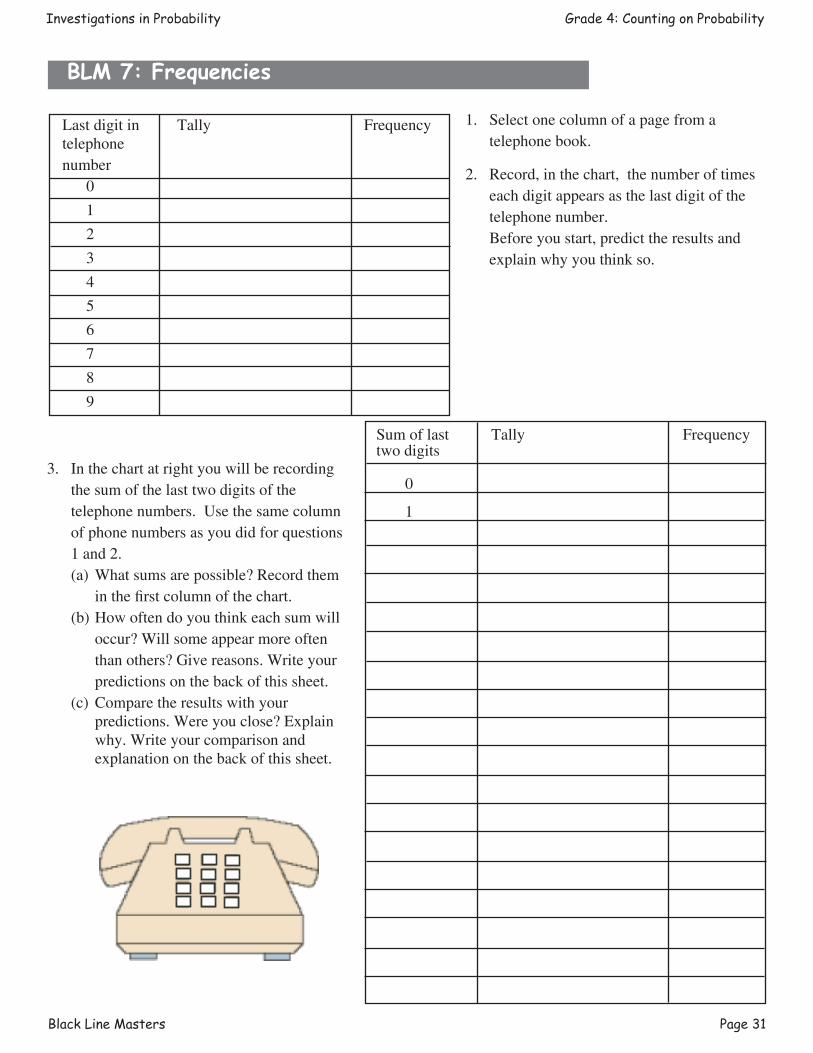
BLM 7: Frequencies
1. Select one column of a page from a telephone book.
2. Record, in the chart, the number of times each digit appears as the last digit of the telephone number.
Before you start, predict the results and explain why you think so.
Last digit in Tally Frequencytelephone number 0
1
2
3
4
5
6
7
8
9
3. In the chart at right you will be recording the sum of the last two digits of the telephone numbers. Use the same column of phone numbers as you did for questions 1 and 2.
(a) What sums are possible? Record them in the first column of the chart.
(b) How often do you think each sum will occur? Will some appear more often than others? Give reasons. Write your predictions on the back of this sheet.
(c) Compare the results with your predictions. Were you close? Explain why. Write your comparison and explanation on the back of this sheet.

Page 32 Black Line Masters
Grade 4: Counting on Probability Investigations in Probability
+ 0 1 2 3 4 5 6 7 8 9
0
1
2
3
4
5
6
7
8
9
BLM 8: Addition Chart
Last Digit
Second
Last
Digit

Black Line Masters Page 33
Investigations in Probability Grade 4: Counting on Probability
1. Flip a coin 10 times for the First Trial and record the number of heads or tails you got in the first row of the
table.
Number of flips Number of Heads Number of Tails
First Trial 10
Second Trial 10
Third Trial 10
Fourth Trial 10
Fifth Trial 10
TOTAL 50
2. Did the results surprise you? Why?
3. Flip the coin 10 more times for the Second Trial and record the results.
4. Share results with other groups. Write their results as the Third, Fourth, and Fifth Trials. Calculate the totals. Did you expect this result? Why?
5. What do you think would happen if you flipped the coin 100 times? 1000 times? Why?
BLM 9: Experiment 1: Coin Flipping

Page 34 Black Line Masters
Grade 4: Counting on Probability Investigations in Probability
Place 3 red, 2 blue, 2 green, and 5 yellow beads/cards/marbles in a bag or envelope. You will be drawing one at a time for this experiment and replacing the bead after each draw.
1. There are 12 beads in the bag. Do you have a better chance of drawing red or of drawing blue? Why? Which colour are you most likely to draw? Why?
2. Make 12 draws, remembering to return the bead to the bag after each draw. Record the results in the first row for First Trial.
Number of Number of Number of Number of Number of draws red drawn blue drawn yellow drawn green drawn
First Trial 12
Second Trial 12
Third Trial 12
Fourth Trial 12
Fifth Trial 12
TOTAL 60
3. Do your results match your predictions? Why or why not?
4. Make 12 more draws and record the results as the Second Trial. Do your combined results of the First and Second Trials match your predictions? Why or why not?
5. Share your results with other groups. Record their results as Third, Fourth and Fifth Trials. Calculate the totals. Did you expect this result? Why?
6. Compare the total results with your predictions. Are they alike or different? Why?
BLM 10: Experiment 2: It’s In The Bag

Black Line Masters Page 35
Investigations in Probability Grade 4: Counting on Probability
1. If you toss a paper cup 10 times, how many times do you think it will land
(i) right side up? (ii) upside down? (iii) on its side?
Why do you think so?
2. Toss a cup 10 times and record the number of times it falls each way in the chart below.
Number of Tosses
First Trial 10
Second Trial 10
Third Trial 10
Fourth Trial 10
Fifth Trial 10
TOTAL 50
3. Compare your results with your predictions. Do they differ? If so, how? Why do you think this happened?
4. Share results with other groups. Write their results as the Second, Third, Fourth, and Fifth Trials. Calculate the totals. Did you expect these results? Why?
5. Predict the result of 100 tosses; of 1000 tosses. Give reasons for your predictions.
BLM 11: Experiment 3: Cup Tossing

Page 36 Black Line Masters
Grade 4: Counting on Probability Investigations in Probability
1. Make a set of Number Cards from 0 to 9. Place a set in a bag or large envelope. You will be drawing one at a time and returning the Number card after each draw.
2. Make 10 draws, remembering to return the Number Card after each draw. Record your results as the First Trial in the chart below.
Number of Draws 0 1 2 3 4 5 6 7 8 9
First Trial 10
Second Trial 10
Third Trial 10
Fourth Trial 10
Fifth Trial 10
TOTAL 50
3. Compare your results with your predictions? Are they the same? different? Why?
4. Make 10 more draws and record the results as Second Trial. Are your First Trial and Second Trial results similar? Why?
5. Share your results with other groups. Record their results as your Third, Fourth, and Fifth Trials. Calculate the totals. Did you expect this result? Why?
6. Compare the total results with your predictions. Are they alike or different? Why?
BLM 12: Experiment 4: Number Cards
N u m b e r C a r d D r a w n

Black Line Masters Page 37
Investigations in Probability Grade 4: Counting on Probability
For use with Experiment 2 on BLM 10:
RED RED BLUE BLUE YELLOW
RED GREEN GREEN YELLOW
YELLOW YELLOW YELLOW
For use with Experiment 4 on BLM 12 and with Activity 5
0 1 2 3 4
5 6 7 8 9
BLM 13: Number Cards and Colour Discs

Page 38 Black Line Masters
Grade 4: Counting on Probability Investigations in Probability
Dice Game #1:
You need two dice of different colours. One die shows the number of tens, the other the number of ones.
For example, if you rolled a ‘2’ on the ‘tens’ die and a ‘3’ on the ‘ones’ die, your score would be ‘23’.
Take 5 turns each, recording your score each time.
Add your scores. A winner is anyone with a total greater than 200.
Dice Game #2:
Use two dice of any colours. One of the dice will be a ‘tens’ die and the other will be a ‘ones’ die as for Game 1, but you decide after each roll which will be which.
For example, if you roll ‘3’ and ‘4’, your score could be ‘34’ or ‘43’.
Take 5 turns each, recording your score each time.
Add your scores. A winner is anyone with a total greater than 200.
1. Which game gives you a better chance of winning — Game 1 or Game 2? Why?
Dice Game #3:
You need 3 dice, two of one colour and the third of another colour.
Roll the three dice. Multiply the numbers on the two dice of the same colour, and divide by the number on the other die.
Your score is the remainder from the division.
Take five turns each, recording your score each time.
The winner is the one with the greatest total score.
2. What remainders are possible in Game 3?
3. In how many ways is each remainder possible?
4. What is the best number to roll on the third die? Why?
BLM 14: Number Games 1 – 3

Black Line Masters Page 39
Investigations in Probability Grade 4: Counting on Probability
To play these games you will need the Number Tiles from BLM 13.
Turn the cards face down in front of you. Take turns drawing one.After each draw all players write that number in one of the six boxes in Game Board 1. Do not return that number card to the face-down collection. After six numbers have been drawn, add the three numbers on Game Board 1 together. The player with the greatest total wins.
Play the game two or three times, than answer the following questions.
1. Suppose that the first three numbers drawn are 5, 2, and 4. (a) Where would you write these to have a good chance of winning? (b) Is it more likely that the next number will be a high number or a
low number? Why?
2. Imagine you are teaching the game to someone else and you want to describe a winning strategy. What would you say?
3. How would your strategy change if the winner was the one with the least total?
4. Choose one of the Game Boards below. Play the game.
Game Board 2 Game Board 3 Game Board 4
The winner is the one with the The winner is the one with The winner is the one with greatest difference. greatest product. the greatest remainder. 5. Answer this question about the game you chose in #4. Suppose you drew 9, 0, and 2 for the first three
numbers. Where would you place them to have a good chance of winning? Explain.
BLM 15: Number Cards and ProbabilityGame Board 1
+
x

Page 40 Black Line Masters
Grade 4: Counting on Probability Investigations in Probability
You will need chips/counters for each player and two dice (or two spinners with six sections each).Mark the sides of one die (or the sectors of one spinner) with the numbers 20, 30, 40, 50, 70, 80.Mark the other die/spinner “less than” on three faces/sectors and “more than” on the other three faces/sectors.When it is your turn, roll the two dice (or spin the spinners).If you roll, for example, “less than” and “30”, find a number on the board that is less than 30 and put one of your chips on it.Once you place a chip, you may not move it.The first person to get 4 chips in a row is the winner.
Write answers on the back of this sheet. 1. (a) How many choices does each of these rolls give you? (i) less than 70? (ii) more than 50? (iii) more than 30? (iv) less than 20? (v) more than 80?2. What is one of the most favourable rolls? Why?3. What is one of the least favourable rolls? Why?4. Suppose you could cover a number either greater than or less than the number of the first die. How would
this change the way you play the game?
BLM 16: Greater or Less
59 17 34 92 42 81
73 22 64 53 75 89
33 47 98 43 86 72
38 97 11 24 51 62
15 26 31 68 29 41
66 53 76 14 84 90

Black Line Masters Page 41
Investigations in Probability Grade 4: Counting on Probability
BLM 17: Constructing SpinnersTo construct spinners, use the templates at the bottom of the pages. Paste the spinners on to bristol/cardboard.
Method 1:For the spinner, straighten a paper clip as shown below.
Hold the spinner in place with a pen or pencil at the centre of the circle.
Flick the point of the paper clip with a finger.
This is the simplest way to construct an acetate spinner for use with an overhead projector.
Method 2:Cut arrows from bristol board or cardboard and punch a hole in one end.
Punch a hole in the centre of each spinner.Use a paper fastener to fasten the two pieces together.
The connection should be tight enough so the arrow doesn’t wobble, but loose enough so that it spins freely.
126
54
3
126
54
3

Page 42 Black Line Masters
Grade 4: Counting on Probability Investigations in Probability
A tree diagram is a way of counting all possible outcomes for a simple experiment. For example, suppose we want to identify all possible outcomes for flipping three coins.
Step 1: List the possible outcomes for the first of the three coins.
Step 2: Draw ‘branches’ from each of these outcomes. The number of branches will be the number of possible outcomes for the second coin — that is, two.
Step 3: Draw branches for each of the possible outcomes of flipping the third coin.
Step 4: Read down the chart from the top to identify 8 different combinations — that is, the eight possible outcomes when three coins are flipped.
Tree diagrams are not useful if there are too many outcomes — for example, rolling three dice (216 outcomes) or even rolling two dice (36 outcomes).
Tree diagrams are useful, however, for determing the outcomes of experiments like the following:(a) flipping a coin and rolling a die;(b) the number of outfits possible with rust, green,
black, and cream t-shirts and brown, green, and orange shorts;
(c) spinning two or three spinners like the ones on BLM 1.
BLM 18: Tree Diagrams
The number of possibilities for the first coin is 2.
For each of these, the number of possibilities for the second coin is 2.
For each of these, the number of possibilities for the third coin is 2.
Thus, there are 8 possible outcomes:
Tree diagrams can also be drawn horizontally:
First Coin:
Third Coin:
H
H T
H T
HHH HHT
H T
HTH HTT
Second Coin:
Possible Outcomes:
T
H T
H T
THH THT
H T
TTH TTT
H
H
T
HHHHHT
HTHHTT
HT
HT
First Coin:
Second Coin:
Third Coin:
Outcomes:
T
H
T
THHTHT
TTHTTT
HT
HT

Solutions/Notes Page 43
Investigations in Probability Grade 4: Counting on Probability
Solutions & Notes
Activity 1: Fair Spinners
BLM 1
Students should find that Spinners A and B give each colour about the same number of times. Even the number of spins recorded from the whole class may not give exactly the same number of spins for each colour. That is, “experimental probability” (the number of spins for each colour) may not match the “theoretical probability” (equal numbers of spins for all colours).
Spinner C should give red about twice as often as yellow or blue. Of course, the number of ‘green spins’ will be zero. You may wish to introduce the idea that something that cannot happen is considered to have a probability of zero.
Spinner D gives about twice as many ‘blue spins’ as red or yellow. Again, the probability of a ‘green spin’ is zero.
Activity 2: Tree Diagrams
BLM 5
A completed tree diagram is given below. It clearly shows the 12 possible teddy bear outfits.
If the use of 1, 2, and 3 as numbers of buttons gets confused in the students’ minds with the 3 choices for numbers of buttons, alter this to 3 types of buttons: round, square, and triangular.
Sandy can make 12 party favours. The following tree diagram shows how.
Notice that the tree diagram lists ribbon colour first. Listing the items for which there is the greater choice first sometimes allows students to find sufficient space for the rest of the tree diagram.
1
white yellow
Number of Buttons
Vest Colours
2
white
3
Stripe Colours
yellow white yellow
red blue red blue red blue red blue red blue red blue
Blue
pink green
Colours of Ribbons
Colours of Paper
Red Silver
gold pink greengold pink greengold
Gold
pink greengold

Page 44 Solutions/Notes
Grade 4: Counting on Probability Investigations in Probability
Solutions & Notes
The variation on this problem could be approached as follows:Sandy has 3 colours of paper. She needs 12 party favours.She needs to make 4 party favours with each colour of paper.She needs 4 colours of ribbon.
An alternate technique would be to start a tree diagram with the colours of paper and add branches, making sure each colour paper has the same number of branches, until there are 12 altogether.
Extension 1
Using 3 spinners, the tree diagram might look like this
Since half the outcomes are even and half are odd, this is a fair game.
1
1 2 3 4
12 34 12 34 12 34 12 34
1st Spinner
2nd Spinner
3rd Spinner
2
1 2 3 4
12 34 12 34 12 34 12 34
3
1 2 3 4
12 34 12 34 12 34 12 34
4
1 2 3 4
12 34 12 34 12 34 12 34
sums
odd
even
3 4 5 6 4 5 6 7 5 6 7 8 6 7 8 9 4 5 6 7 5 6 7 8 6 7 8 9 7 8 9 10 5 6 7 8 6 7 8 9 8 9 10 11 6 7 8 9 7 8 9 107 8 9 10 8 9 10 11 9 10 11 12
0 0 0 0 0 0 0 0 0 0 0 0 0 0 0 0 0 0 0 0 0 0 0 0 0 0 0 0 0 0 0 0
E E E E E E E E E E E E E E E E E E E E E E E E E E E E E E E E
pink
pink
Step 1: List colours of paper
Step 2: Add one branch to each
pink
Step 3: Add a second branch to each
Add a third branch and count. There are 9 branches. We need 12.
pink
Add 3 more. We need 4 colours of ribbon
gold
gold
gold
gold
green
green
green
green

Solutions/Notes Page 45
Investigations in Probability Grade 4: Counting on Probability
Solutions & Notes
Another tree diagram, less crowded, could start with the outcomes listed earlier for the totals of two spinners.
Note: ‘Even’ and ‘Odd’ can be listed as the only outcomes of the 1st two spins because they are equally likely. Similarly, since the numbers on the 3rd spinner are 1, 2, 3, and 4, half even and half odd, and equally
likely, the outcomes for the third spinner can be given simply as ‘Even’ and ‘Odd’.
Terry’s T-shirts (Extension 2)If students have difficulty getting started, suggest that they make lists of possible colours, sizes, and neck styles. The number of each should be small enough to use a tree diagram. For example, up to 6 colours, 3 sizes (small, medium, large) and 2 neck styles (round and vee).
Pete’s Pizza Parlour (Family Activities 1)1. (i) Since there are 5 possible toppings, there are 5 possible pizzas with one extra topping each. (ii) To determine the number of pizzas with 2 extra toppings, draw a tree diagram, or reason as follows: For every pizza with 1 extra topping, we have 4 possible second toppings (unless we want the same
topping again). This gives 20 possible choices. (iii) Similarly, there will be 3 choices left for the third extra topping, so there will be 20 x 3 or 60 possible
pizzas.
2. If pepperoni is not permitted, then Chris has a choice of 1 pizza with no extra toppings, or 4 pizzas with one extra topping each, or 16 pizzas with two extra toppings each. He has a choice of 21 different pizzas.
License Plates (Family Activities 2)1. The first digit can be any one of 10 digits. For each of these, the second digit can be any one of 10 digits, making 100 combinations. For each of these, the third digit can be any one of 10 digits, making 1000 combinations.
2. To calculate the total number of combinations, compute 26 x 26 x 26, which gives 17 576.
3. For each letter combination, there are 1000 digit combinations, giving 17 576 000 possible license plates.
4. Students will need to know the population of Ontario to answer this. They should be encouraged to check various sources.
Re: License PlatesSince publication, Ontario license plates have gone to 4 letters. You may wish to discuss how this will change the answers, and why the change was necessary.
Outcomes of the sums of 2 spinners:
Sums of 3 spinners: Half the results are even and half are odd.
Even
Even Odd
Odd
Even Odd
Even Odd EvenOdd
Outcomes of the third spinner:

Page 46 Solutions/Notes
Grade 4: Counting on Probability Investigations in Probability
Solutions & Notes
Activity 3: Frequencies
BLM 7
2. There should be enough telephone numbers on one page to give the expected result - that each digit should appear about as often as any other digit.
3. Students should be able to list all possible totals from 0 to 18 but they may not realize that some occur more frequently than others. Completion of the chart as suggested in the notes for Activity 3 lets them see that some totals are far more likely than others.
The frequencies in the chart on BLM 8 should show that the low and high sums (e.g., 0, 1, 2, 3 and 16, 17, 18) occur rarely compared with the middle sums (e.g. 7, 8, 9, 10, 11).
Activity 4: Probability Experiments
BLM 9: Experiment 1: Coin Flipping
Students should come to two conclusions(i) The number of heads and the number of tails should be close to equal.(ii) The more data they collect, the closer the experimental probability will come to the theoretical probability.
BLM 10: Experiment 2: It’s In The Bag
1. Students should see that there is a better chance of drawing the red since there are more red in the bag than blue.
2. The final results should be distributed in a way that reflects the beads in the bag. Theoretical probability suggests that: 3 out of 12 or 15 out of 60 will be red
2 out of 12 or 10 out of 60 will be blue 2 out of 12 or 10 out of 60 will be green. Ideally, the students’ results will be close to this. If students results should differ to any great degree, you
might wish to collect data from all groups and examine the frequency for each colour.
BLM 11: Experiment 3: Cup Tossing
The results cannot be predicted at all accurately, but the cup is expected to land on its side most of the time. Results of 60 tosses by the authors gave 50 on the side, 6 upside down, and 4 right side up.

Solutions/Notes Page 47
Investigations in Probability Grade 4: Counting on Probability
Solutions & Notes
BLM 12: Experiment 4: Number Cards
Under ideal conditions, each number has an equal chance of being drawn. As with other experiments, students should find that the totals of several trials will be closer to the expected probability than the results of only one trial.
Extension 1
The 12 outcomes are black, black, black, black, black, red, red, red, yellow, yellow, yellow, and orange.The probability of drawing a red is 3 out of 12 (or 1 out of 4).The probability of drawing an orange is 1 out of 12.The simplest spinner would be one divided into 12 sections, of which 5 are coloured black, 3 are red, 3 are yellow and 1 is orange.
Activity 5: Probability in Games
BLM 15: Experiment 4: Number Cards
Answers will vary.
BLM 16:
1. (a) (i) ‘less than 70’ gives 24 choices (ii) ‘more than 50’ gives 20 choices (iii) ‘more than 30’ gives 28 choices (iv) ‘less than 20’ gives 4 choices (v) ‘more than 80’ gives 8 choices
2. and 3. If students interpret these to mean what rolls from #1 are most or least favourable they should indicate that
‘more than 30’ is one of the most favourable, and ‘less than 20’ is one of the least favourable. However, the best roll of all is ‘greater than 20’ which gives 32 choices.
4. Since this choice allows any number to be covered, it reduces the game to tic-tac-toe.

Page 48 Assessment
Grade 4: Counting on Probability Investigations in Probability
InvestigationsInvestigations involve explorations of mathematical questions that may be related to other subject areas. Investigations deal with problem posing as well as problem solving. Investigations give information about a student’s ability to:
• identify and define a problem;• make a plan;• create and interpret strategies;• collect and record needed information;• organize information and look for patterns;• persist, looking for more information if needed;• discuss, review, revise, and explain results.
JournalsA journal is a personal, written expression of thoughts. Students express ideas and feelings, ask questions, draw diagrams and graphs, explain processes used in solving problems, report on investigations, and respond to open-ended questions. When students record their ideas in math journals, they often:
• formulate, organize, internalize, and evaluate concepts about mathematics;• clarify their thinking about mathematical concepts, processes, or questions;• identify their own strengths, weaknesses, and interests in mathematics;• reflect on new learning about mathematics;• use the language of mathematics to describe their learning.
ObservationsResearch has consistently shown that the most reliable method of evaluation is the ongoing, in-class observation of students by teachers. Students should be observed as they work individually and in groups. Systematic, ongoing observation gives information about students’:
• attitudes towards mathematics;• feelings about themselves as learners of mathematics;• specific areas of strength and weakness;• preferred learning styles;• areas of interest;• work habits — individual and collaborative;• social development;• development of mathematics language and concepts.
In order to ensure that the observations are focused and systematic, a teacher may use checklists, a set of questions, and/or a journal as a guide. Teachers should develop a realistic plan for observing students. Such a plan might include opportunities to:
• observe a small number of students each day;• focus on one or two aspects of development at a time.
Suggested Assessment Strategies

Assessment Page 49
Investigations in Probability Grade 4: Counting on Probability
Student Self-AssessmentStudent self-assessment promotes the development of metacognitive ability (the ability to reflect critically on one’s own reasoning). It also assists students to take ownership of their learning, and become independent thinkers. Self-assessment can be done following a co-operative activity or project using a questionnaire which asks how well the group worked together. Students can evaluate comments about their work samples or daily journal writing. Teachers can use student self-assessments to determine whether:
• there is change and growth in the student’s attitudes, mathematics understanding, and achievement;• a student’s beliefs about his or her performance correspond to his/her actual performance;• the student and the teacher have similar expectations and criteria for evaluation.
Resources for Assessment“For additional ideas, see annotated Other Resources list on page 54, numbered as below.”
1. The Ontario Curriculum, Grades 1-8: Mathematics.
2. Assessment Standards for School Mathematics, NCTM, 1995.
3. Linking Assessment and Instruction in Mathematics: Junior Years, Ontario Association of Mathematics Educators/OMCA/OAJE, Moore et al., 1996.
4. Mathematics Assessment: Myths, Models, Good Questions, and Practical Suggestions, by Jean Kerr Stenmark (Ed.), NCTM, 1991.
5. “Assessment”, Arithmetic Teacher Focus Issue, February 1992, NCTM. 6. How to Evaluate Progress in Problem Solving, by Randall Charles et al., NCTM, 1987.
7. Assessment in the Mathematics Classroom, Yearbook, NCTM, 1993.
Suggested Assessment Strategies

Page 50 Assessment
Grade 4: Counting on Probability Investigations in Probability
Suggested Assessment Strategies
A GENERAL PROBLEM SOLVING RUBRIC
This problem solving rubric uses ideas taken from several sources. The relevant documents are listed at the end of this section.
“US and the 3 R’s”There are five criteria by which each response is judged:Understanding of the problem,Strategies chosen and used,Reasoning during the process of solving the problem,Reflection or looking back at both the solution and the solving, andRelevance whereby the student shows how the problem may be applied to other problems, whether in math-ematics, other subjects, or outside school.
Although these criteria can be described as if they were isolated from each other, in fact there are many overlaps. Just as communication skills of one sort or another occur during every step of problem solving, so also reflection does not occur only after the problem is solved, but at several points during the solution. Similarly, reasoning occurs from the selection and application of strategies through to the analysis of the final solution. We have tried to construct the chart to indicate some overlap of the various criteria (shaded areas), but, in fact, a great deal more overlap occurs than can be shown. The circular diagram that follows (from OAJE/OAME/OMCA “Linking Assessment and Instruction in Mathematics”, page 4) should be kept in mind at all times.
There are four levels of response considered: Level 1: Limited identifies students who are in need of much assistance; Level 2: Acceptable identifies students who are beginning to understand what is meant by ‘problem
solving’, and who are learning to think about their own thinking but frequently need reminders or hints during the process.
Level 3: Capable students may occasionally need assistance, but show more confidence and can work well alone or in a group.
Level 4: Proficient students exhibit or exceed all the positive attributes of the Capable student; these are the students who work independently and may pose other problems similar to the one given, and solve or attempt to solve these others.
Communication
Understand the Problem
LookBack
Make a Plan
Carry out the Plan
Comm
unication
Communication
Com
mun
icatio
n

Assessment Page 51
Investigations in Probability Grade 4: Counting on Probability
Suggested Assessment Strategies
Level 1:Limited
Level 3:Capable
• requires teacher assistance to interpret the problem
• fails to recognize all essential elements of the task
• needs assistance to choose an appropriate strategy
• applies strategies randomly or incorrectly
• does not show clear understanding of a strategy1
• shows no evidence of attempting other strategies
• makes major mathematical errors
• uses faulty reasoning and draws incorrect conclusions
• may not complete a solution
• describes4 reasoning in a disorganized fashion, even with assistance
• has difficulty justifying5 reasoning even with assisstance
• shows no evidence of reflection or checking of work
• can judge the reasonableness of a solution only with assistance
• unable to identify similar6 problems
• unlikely to identify extensions7 or applications of the mathematical ideas in the given problem, even with assistance
• shows partial understanding of the problem but may need assistance in clarifying
• identifies an appropriate strategy
• attempts an appropriate strategy, but may not complete it correctly2
• tries alternate strateges with prompting
• may present a solution that is partially incorrect
• partially describes4 a solution and/or reasoning or explains fully with assistance
• justification5 of solution may be inaccurate, incomplete or incorrect
• shows little evidence of reflection or checking of work
• is able to decide whether or not a result is reasonable when prompted to do so
• unable to identify similar6 problems
• recognizes extensions7 or applications with prompting
• shows a complete understanding of the problem
• identifies an appropriate strategy
• uses strategies effectively
• may attempt an inappropriate strategy, but eventually discards it and tries another without prompting
• produces a correct and complete solution, possibly with minor errors
• is able to describe4 clearly the steps in reasoning; may need assistance with mathematical language
• can justify5 reasoning i f asked; may need assistance with language
• shows some evidence of reflection and checking of work
• indicates whether the result is reasonable, but not necessarily why
• identifies similar6 problems with prompting
• can suggest at least one extension7, variation, or application of the given problem if asked
Level 2:Acceptable
Level 4:Proficient
• shows a complete understanding of the problem
• identifies more than one appropriate strategy
• chooses and uses strategies effectively3
• recognizes an inappropriate strategy quickly and attempts others without prompting
• produces a correct and complete solution, and may offer alternative methods of solution
• explains reasoning in clear and coherent mathematical language
• justifies5 reasoning using appropriate mathematical language
• shows ample evidence of reflection and thorough checking of work
• tells whether or not a result is reasonable, and why
• identifies similar6 problems, and may even do so before solving the problem
• suggests extensions7, variation, or applications of the given problem independently
LEVEL OF RESPONSE
CRITERIA
FOR
ASSESSMENT
U N D E R S T A N D I N G
S T R A T E G I E SR E A S O N I N GR E F L E C T I O NR E L E V A N C E

Page 52 Assessment
Grade 4: Counting on Probability Investigations in Probability
Suggested Assessment Strategies
Notes on the Rubric
1. For example, diagrams, if used, tend to be inaccurate and/or incorrectly used.
2. For example, diagrams or tables may be produced but not used in the solution.
3. For example, diagrams, if used, will be accurate models of the problem.
4. To describe a solution is to tell what was done.
5. To justify a solution is to tell why certain things were done.
6. Similar problems are those that have similar structures, mathematically, and hence could be solved using the same techniques.
For example, of the three problems shown below right, the better problem solver will recognize the similarity in structure between Problems 1 and 3. One way to illustrate this is to show how both of these could be modelled with the same diagram:
Each dot represents one of 12 people and each dotted line represents either a handshake between two people (Problem 1, second question) or a diagonal (Problem 3).
The weaker problem solver is likely to suggest that Problems 1 and 2 are similar since both discuss parties and mention 8 people. In fact, these problems are alike only in the most superficial sense.
7. One type of extension or variation is a “what if...?” problem, such as “What if the question were reversed?”, “What if we had other data?”, “What if we were to show the data on a different type of graph?”.
Problem 1: There were 8 people at a party. If each person shook hands once with each other person, how many handshakes would there be? How many handshakes would there be with 12 people? With 50?
Problem 2: Luis invited 8 people to his party. He wanted to have 3 cookies for each person present. How many cookies did he need?
Problem 3: How many diagonals does a 12-sided polygon have?

Assessment Page 53
Investigations in Probability Grade 4: Counting on Probability
Suggested Assessment Strategies
SuggeSted AdApted RubRic foR Activity 2
The rubric below has been adapted for the problem on BLM 5 of Activity 2: How Many Teddies? The rubric examines understanding of the problem, the application of chosen strategies, and generalization of the strategies and their solutions.
Level 1:Limited
Level 3:Capable
Level 2:Acceptable
Level 4:Proficient
• does not understand that teddies are to have both buttons and vest colours to start, and may begin by colouring some of the vests and drawing buttons on others
• shows no organization in the solution; buttons and colours are added haphazardly
• addition of stripes is done haphazardly
• may have duplicates and may or may not recognize these
• misses 2 or 3 combinations
• is not sure of finding all solutions or cannot give a sensible reason why he/she is sure that all combinations are given
• is unable to connect a list of possibilities with a tree diagram or cannot draw the tree diagram without help
• may not understand the problem initially, but can respond to direct questions by referring to the appropriate part of the problem
• shows evidence of thinking about vest combinations of buttons and colours before marking up the bears
• shows evidence of trying to relate the ad-dition of stripes to the combinations already found
• may have duplicates but can identify these without help
• misses at most one
combination
• reason given for con-fidence in having all solutions is “I really tried, but I can’t think of any more.”
• can draw a tree diagram if one is suggested; may need a hint to get
started
• understands the problem and can answer questions about the nature of the problem
• shows some organization in the colouring and drawing buttons
• initially, is not sure of the effects of adding stripes, but eventually concludes that this doubles the number of combinations
• finds all combinations; list may not be organized
• shows some
organization in listing the combinations in order to ‘prove’ that he/she has all solutions
• can construct a tree diagram if one is
suggested
• fully understands the problem and can express it in his/her own words
• may not need to draw buttons or colour the vests to be certain all possibilities are given
• understands that adding stripes simply doubles the number of combinations
• can list all combinations in an organized manner
• uses an organized list or a tree diagram to ‘prove’ that he/she has all solutions

Page 54 Other Resources
Grade 4: Counting on Probability Investigations in Probability
Other Resources
1. The Ontario Curriculum, Grades 1-8: Mathematics.
2. Assessment Standards for School Mathematics, NCTM, 1995. This comprehensive document examines the purposes of assessment and the nature of various types
of assessment. Actual experiences in the classroom are used to clarify and augment suggestions made.
3. Linking Assessment and Instruction in Mathematics: Junior Years, Ontario Association of Mathematics Educators/OMCA/OAJE, Moore et al., 1996.
The document provides a selection of open-ended problems (including Fair Games activities) tested at the Junior Years (grades 4 to 6) level. Performance Rubrics are used to assess student responses (which are included) at four different levels.
4. Mathematics Assessment: Myths, Models, Good Questions, and Practical Suggestions, by Jean Kerr Stenmark (Ed.), NCTM, 1991.
Included are notes on observation techniques, interviews, conferences, portfolios. Sample student work is included with assessment to show how to apply the suggestions in the book. Includes an annotated bibliography.
5. “Assessment”, Arithmetic Teacher Focus Issue, February 1992, NCTM. This issue contains articles on linking assessment with instruction, alternative forms of assessment,
self-evaluation, using manipulatives on tests, and suggestions for assessing cooperative problem solving.
6. How to Evaluate Progress in Problem Solving, by Randall Charles et al., NCTM, 1987. Chapter headings include “What are you trying to evaluate?”, “What are some evaluation
techniques?” and “How do you organize and manage an evaluation program?” Sample ‘test’ items are included that show how to assess students’ understanding; holistic scoring scales and student opinion surveys suggest ways of assessing progress and affective domain.
7. Assessment in the Mathematics Classroom, Yearbook, NCTM, 1993. The chapters in this book deal with a wide range of forms of assessment, techniques for
implementing different forms, and examples from the classroom showing how observation, interview, journal writing, and tests, among others, can be used to make a meaningful assessment of a student and his/her work.
8. Making Sense of Data: Addenda Series, Grades K-6, Mary Lindquist et al., NCTM, 1992 Students explore different spinners in Grade 3 and determine which outcomes are more likely
than others. Older students could design spinners to give specified outcomes. A grade 5 activity uses a “Random walk” to explore the nature of random numbers:: Logo is used to explore this idea further with a computer.

Other Resources Page 55
Investigations in Probability Grade 4: Counting on Probability
Other Resources
9. “Roll the Dice — an introduction to Probability”, Andrew Freda, in Mathematics Teaching in the Middle School, NCTM, October, 1998, pp. 85-89.
This describes how the introduction of an unfair game that appears, at first, to be fair, is used to intersect students in exploring how probabilities depend on relative frequencies of outcomes. Computer simulation leads to the conclusion that, the greater the sample, the closer the experimental probability is to theoretical probability. Suitable for Grades 5 or 6.
10. Dealing with Data and Chance: Addenda Series, Grades 5-8, Judith S. Zawojewski et al, NCTM, 1991. One activity deals with determining the fairness or “unfairness” of games, another with determining
how many purchases you must make to collect all the enclosed cards necessary to “win” a prize. The game of “Montana Red Dog” (p. 41) involves students in predicting probabilities.
11. Measuring Up: Prototypes for Mathematics Assessment, Mathematical Sciences Education Board and National Research Council, Washington, DC.
Performance assessment activities are given that deal with a number of mathematics topics. The “Hog” Game uses dice to encourage students to determine winning strategies while dealing with simple probability.
12. What Are My Chances?, Book A, and What Are My Chances?, Book B, Creative Publications, 1977. These books provide a number of activities (black line masters) suitable for a wide range of
activities. Students flip coins or two-colour chips, roll number cubes, draw marbles from closed containers (with and without replacement) and explore simple probability activities dealing with the weather and ice-cream flavour combinations. Book B also explores dependence and independence of events.
13. “Truth or Coincidence?”, Daniel J. Brohier, Teaching Children Mathematics, December 1996, pp. 180-183, NCTM.
This activity for grades 3 to 6 involves children using heads and tails of coins to write “answer keys” for True-False tests. For example, if the test has 6 questions, how many possible combinations of True and False are possible? Applications to sports, social studies, and science are suggested.
14. “Exploring Random Numbers”, William R. Speer, Teaching Children Mathematics, January 1997, pp. 242-245, NCTM.
Students are introduced to the idea of randomness by trying to write random numbers. Other simple activities reinforce the idea that randomness is not easily achieved.
15. “Choice and Chance in Life: The Game of ‘Skunk’”, Dan Brutlag, Mathematics Teaching in the Middle School, April, 1994, pp. 28-33, NCTM.
The game of “Skunk” uses “good” and “bad” rolls of the dice to create or eliminate a player’s score. Analysis of the rules leads to a discussion of ways that “chance” enters our lives.

Page 56 Other Resources
Grade 4: Counting on Probability Investigations in Probability
Other Resources
16. “Looking at Random Events with Logo Software”, Thor Charischak and Robert Berkman, Mathematics Teaching in the Middle School, January-March 1995, pp. 318-322, NCTM.
Students learn how to use Logo to simulate the rolling of up to 3 dice, and discuss the probabilities of different outcomes.
17. “Racing to Understand Probability”, Laura R. Van Zoest and Rebecca K. Walker, Mathematics Teaching in the Middle School, October 1997, pp. 162-170, NCTM.
Students play a game of racing sailboats that appears to be fair, but turns out to be skewed in favour of certain boats. Students make a chart of possible outcomes for 2 dice to try to explain why the game is unfair.
18. Mathematics Teaching in the Middle School, March 99, Focus Issue on “Data & Chance”, NCTM. The entire journal is devoted to articles dealing with Data Management & Probability. One article
explores probability through an even-odd game with dice of different shapes. Another uses animal crackers to simulate wild-life tagging and releasing to count animals in the wild.
19. “Mode Code”, David Spangler, Mathematics Teaching in the Middle School, April, 1999, pp. 464-466, NCTM.
Students explore the frequencies of letters of the alphabet in English. They apply this to decoding a message based on these frequencies, which are given as percents.
20. “Cat and Mouse”, Brian Lannen. Mathematics Teaching in the Middle School, April 1999, pp. 456-459, NCTM.
Students play a cooperative game to see whether or not the mouse finds the cheese. Aspects of probability include fairness or unfairness and tree diagrams to list outcomes. This activity is suitable for many different grades.
21. Organizing Data & Dealing with Uncertainty, NCTM, 1979 The first section of the book deals with collecting and interpreting data. The second part explores
probability through dice, license plates, paper cups, tacks, and beads. Black line masters are provided.
22. “Calendar Mathematics”, Lorna J. Morrow, Arithmetic Teacher, March 1993, pp. 390-391. Problems with dice, or t-shirt and shorts combinations involve organized counting. Children must
determine the number of outcomes and show how they are certain that they have all outcomes.
23. DIME Probability Packs A and B, available from Spectrum Educational Publishing, Aurora, ON 1988 Each pack contains materials and activity cards for four different experiments. There are sufficient
materials for 6 groups or pairs of students to work on the same experiment. The focus is on analyzing games as fair or unfair, and involves determining the probabilities of the outcomes in order to do so.

Curriculum Connections: Probability
Investigations in Probability Grade 4: Counting on Probability
CURRICULUM EXPECTATIONS
• compareexperimentalresultswithpredictedresults
• conductsimleprobabilityexperimentsandusetheresultstomakedecisions
• usetreediagramstoorganizedataaccordingtoseveralcriteria
• demonstrateanunderstandingofprobabilityanduselanguageappropriatetosituationsinvolvingprobabilityexperiments
• compareexperimentalresultswithpredictedresults
• conductsimleprobabilityexperimentsandusetheresultstomakedecisions
• usetreediagramstoorganizedataaccordingtoseveralcriteria
• useaknowledgeofprobabilityto...solvesimpleproblems
ACTIVITY
Activity 1
Fair Spinners
Activity 2
Tree Diagrams
Activity 3
Frequencies
Activity 4
Probability Experiments
Activity 5
Probability in Games
Curriculum Connections: Probability
DESCRIPTION OF THE ACTIVITY
- identifyingfair/unfairspinnersbycollectingexperimentaldata
- distinguishingbetweenfairandunfairgamesusingprobabilitiesofvariousoutcomes
- identifyingpossibleoutcomesfromavarietyofspinners
- identifyingallposibleoutcomesusingtreediagrams
- identifyingallthevariablesneededforconstructingatreediagram
- usingtalliestorecordoutcomes
- countingrelativefrequenciesofvariousoutcomes
- predictingprobabilitiesforavarietyofsimpleexperiments
- conductingprobabilityexperimentstodetermineexperimentalresults
- comparingexperimentalandtheoreticalprobabilities
- listingallpossibleoutcomesusing
treediagramsorothermethod
- identifyingfavourableoutcomes