probabilistic methods for assessing dietary exposure to ... · probabilistic methods for assessing...
TRANSCRIPT
Probabilistic Methods for AssessingDietary Exposure to Pesticides
Andy Hart (Fera, UK)
Technical Meeting with Stakeholders on Cumulative Risk AssessmentEFSA, 11 February 2014

Outline of presentationp
• EFSA Guidance on probabilistic assessment• EFSA Guidance on probabilistic assessment
• Deterministic and probabilisticp
• Variability and uncertainty
• Needs and challenges in probabilistic assessment
• How these are addressed by the EFSA Guidance
• Communicating results with Risk Managers
2

EFSA Guidance
Main sections of Guidance:Main sections of Guidance:• Introduction• Tiered approachpp• Problem definition• Acute exposurep• Chronic exposure• Cumulative exposure• Outputs• Evaluating uncertainties• Key issues for reporting & peer review• Interpretation of results & options for risk managers• Validation• Software quality requirements
C l i• Conclusions• Appendix: Case studies 3

Deterministic vs. Probabilistic
R l i bl d t i• Real exposures are variable and uncertain
• Deterministic exposure assessment– Uses point estimates for inputs (consumption, p p ( p
concentration, processing effects, etc.)– Generates point estimate of exposure (a single value)– Intended to be ‘conservative’
• Probabilistic exposure assessment– Uses distributions to take account of variability and
t i t f i tuncertainty of inputs– Generates a distribution of exposures
I t d d t t th l di t ib ti– Intended to represent the real distribution
4

Variability and uncertaintyy y
100
tion
80
opul
at Variabilityof actualexposures
60
% o
f po exposures
40
tive
%
20
mul
at
00 20 40 60 80 100
Cum
5
0 20 40 60 80 100Exposure mg/kg bw/day

Variability and uncertaintyy y
100
tion
80
opul
at variabilityof actual exposures
60
% o
f po exposures
40
tive
%
Uncertainty in our knowledge of exposure
20
mul
at
00 20 40 60 80 100
Cum
6
0 20 40 60 80 100Exposure mg/kg bw/day

Variability and uncertaintyy y
100
tion
actual 80
opul
at exposures are unknown
60
% o
f po
40
tive
%
uncertainty in our knowledge of exposure
20
mul
at
00 20 40 60 80 100
Cum
7
0 20 40 60 80 100Exposure mg/kg bw/day

Variability and uncertaintyy y
100
tion ?
80
opul
at
60
% o
f po
40
tive
%
uncertainty in our knowledge of exposure
20
mul
at
Deterministic point estimate
00 20 40 60 80 100
Cum Deterministic point estimate
Based on conservative assumptions
8
0 20 40 60 80 100Exposure mg/kg bw/day

A common view of probabilistic assessmentassessment
• Option for refinement when deterministic estimate raises concernraises concern
• More realistic estimates of exposureMore realistic estimates of exposure
• Avoids over-conservative first tier assumptionsAvoids over conservative first tier assumptions
• Load my data into available software & press ‘go’Load my data into available software & press go
• Compare 95th percentile exposure to reference p p pdose
9

100
tion 5% of EU population = 25 million
80
opul
at Pesticides: ‘shall not have any harmful effects on human health’ Reg. 1107/2009
60
% o
f po
40
tive
% Need to characterise the frequency & magnitude of upper tail exposures
20
mul
at
95th percentile exposure
g
?0
0 20 40 60 80 100
Cum compare to reference dose ?
10
0 20 40 60 80 100Exposure mg/kg bw/day

100
tion
80
opul
at Pesticides: ‘shall not have any harmful effects on human health’ Reg. 1107/2009
60
% o
f po
40
tive
% A high level of certainty is implied...need to show how much certainty there is
20
mul
at
Need confidence intervals for the distribution of exposures
00 20 40 60 80 100
Cum distribution of exposures
11
0 20 40 60 80 100Exposure mg/kg bw/day

100
tion
80
opul
at
Many uncertainties are difficult to quantify b bili ti ll f ti id
60
% o
f po probabilistically, e.g. for pesticides:
• limited samples of data• distribution shapes uncertain (esp tails)
40
tive
% • distribution shapes uncertain (esp. tails)• many non-detects• dependencies between parameters
20
mul
at
Use alternative assumptions to explore the impact of difficult uncertainties
00 20 40 60 80 100
Cum the impact of difficult uncertainties
12
0 20 40 60 80 100Exposure mg/kg bw/day
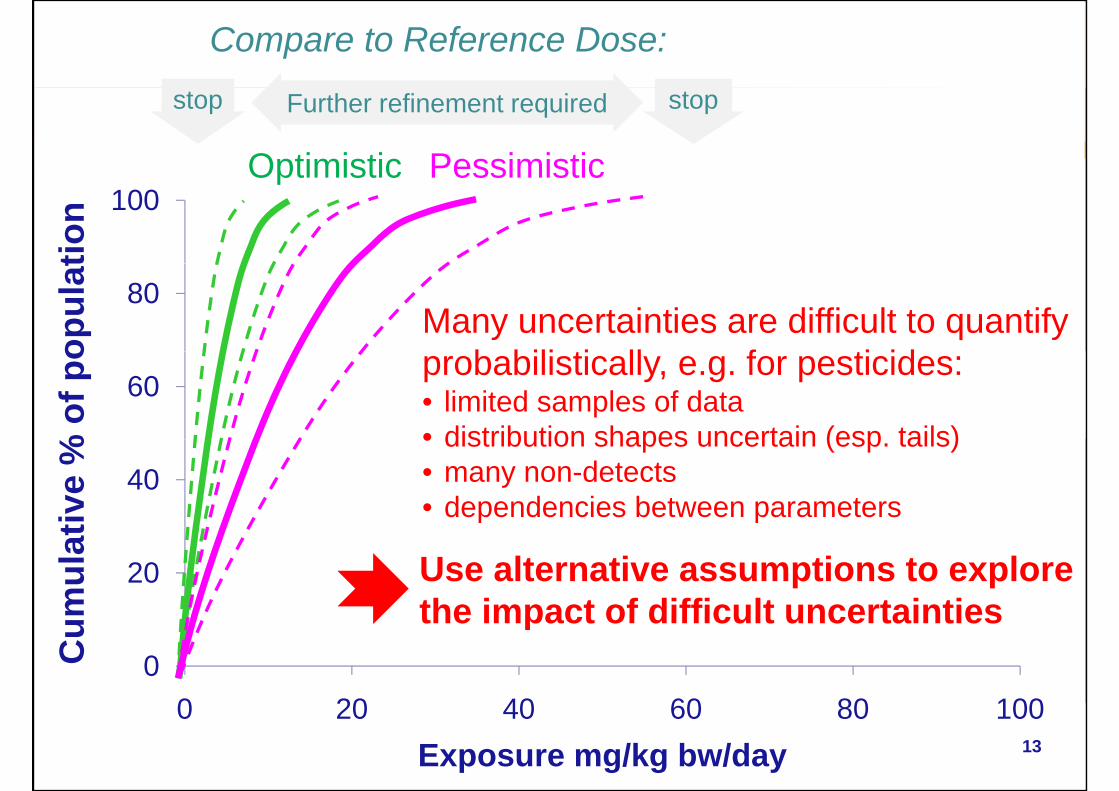
Compare to Reference Dose:
Optimistic Pessimistic
Further refinement required stopstop
100
tion
Optimistic Pessimistic
80
opul
at
Many uncertainties are difficult to quantify b bili ti ll f ti id
60
% o
f po probabilistically, e.g. for pesticides:
• limited samples of data• distribution shapes uncertain (esp tails)
40
tive
% • distribution shapes uncertain (esp. tails)• many non-detects• dependencies between parameters
20
mul
at
Use alternative assumptions to explore the impact of difficult uncertainties
00 20 40 60 80 100
Cum the impact of difficult uncertainties
13
0 20 40 60 80 100Exposure mg/kg bw/day

Optimistic Pessimistic100
tion
Optimistic Pessimistic
80
opul
at ? ?
60
% o
f po
But... it is never possible to quantify all uncertainties
40
tive
%
Need to identify and evaluate20
mul
at
yunquantified uncertainties
00 20 40 60 80 100
Cum
14
0 20 40 60 80 100Exposure mg/kg bw/day
Optimistic Pessimistic100
tion
Optimistic Pessimistic
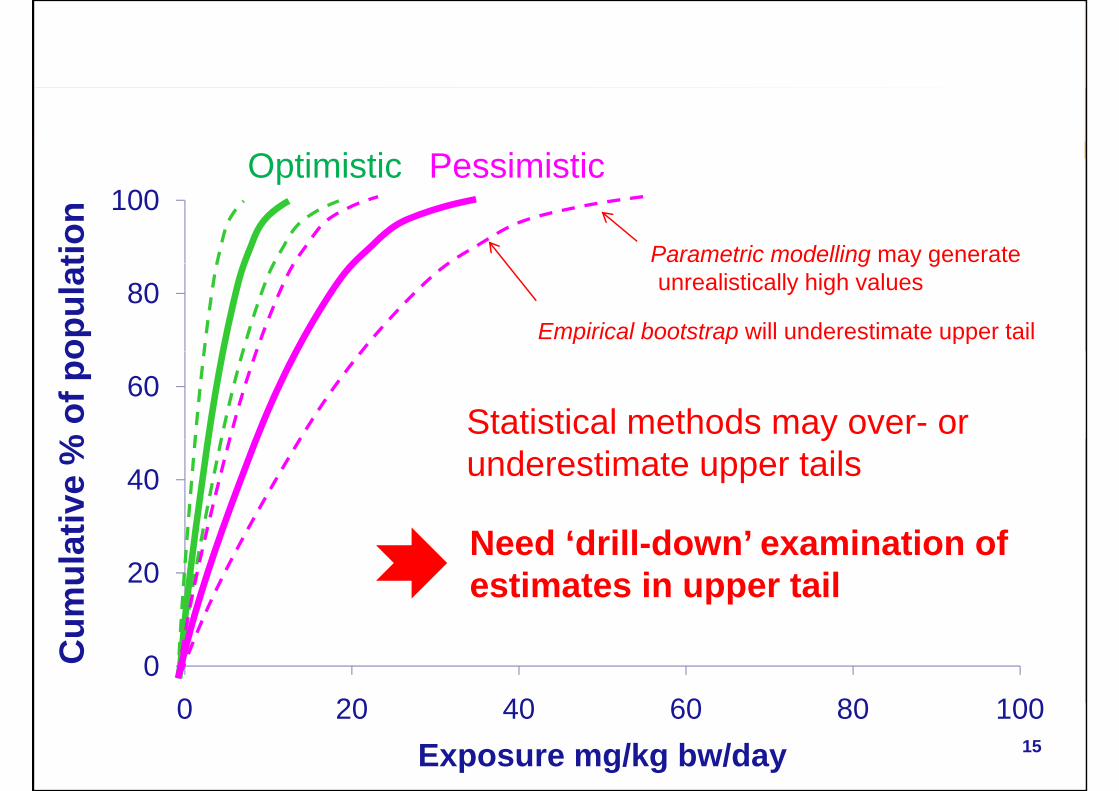
Parametric modelling may generate
80
opul
at
Empirical bootstrap will underestimate upper tail
g y gunrealistically high values
60
% o
f po
Statistical methods may over- or 40
tive
%
yunderestimate upper tails
20
mul
at Need ‘drill-down’ examination of estimates in upper tail
00 20 40 60 80 100
Cum
15
0 20 40 60 80 100Exposure mg/kg bw/day

Key needs in probabilistic assessmentassessment
• Focus on characterising upper tail exposures, not on an arbitrary percentile of the distributiony p
• Give confidence intervals for quantifieduncertainties
• Use alternative assumptions to assess• Use alternative assumptions to assess uncertainties that are difficult to quantify
b bili ti llprobabilistically
• Evaluate the impact of unquantified uncertainties• Evaluate the impact of unquantified uncertainties
• ‘Drill-down’ to check for over- and underestimation in upper tail
16

PPR Panel Guidance
• How does it address the needs identified above?
17

PPR Panel Guidance
• Use alternative assumptions to assess uncertainties that are difficult to quantify probabilistically
• Start with a Basic Assessment using Optimistic and
that are difficult to quantify probabilistically
g pPessimistic assumptions for:– Residue distribution (bootstrap vs. lognormal)
S li t i t (b t t t i )– Sampling uncertainty (bootstrap vs. parametric)– Unit-to-unit variability (none vs. conservative est.)
Non detects (zero vs Limit of Reporting)– Non-detects (zero vs. Limit of Reporting)– Processing effects (zero vs. deterministic estimate)– % crop treated (approx. estimate vs. 100%)% crop treated (approx. estimate vs. 100%)– Residues in water (zero, legal limit)– etc...
• If important, quantify further in Refined Assessment18

PPR Panel Guidance
• Focus on characterising upper tail, not an arbitrary percentile• Give confidence intervals for quantified uncertaintiesq
ExposureFrequency of exceedanceExposure
levels expressed
as % of
per million
Optimistic & P i i tireference
dose and/or Margin of Exposure
Pessimistic assumptions
ExposureEstimated
frequencies & confidence
intervalsintervals
‘<‘ = below resolution of
19
resolution of model
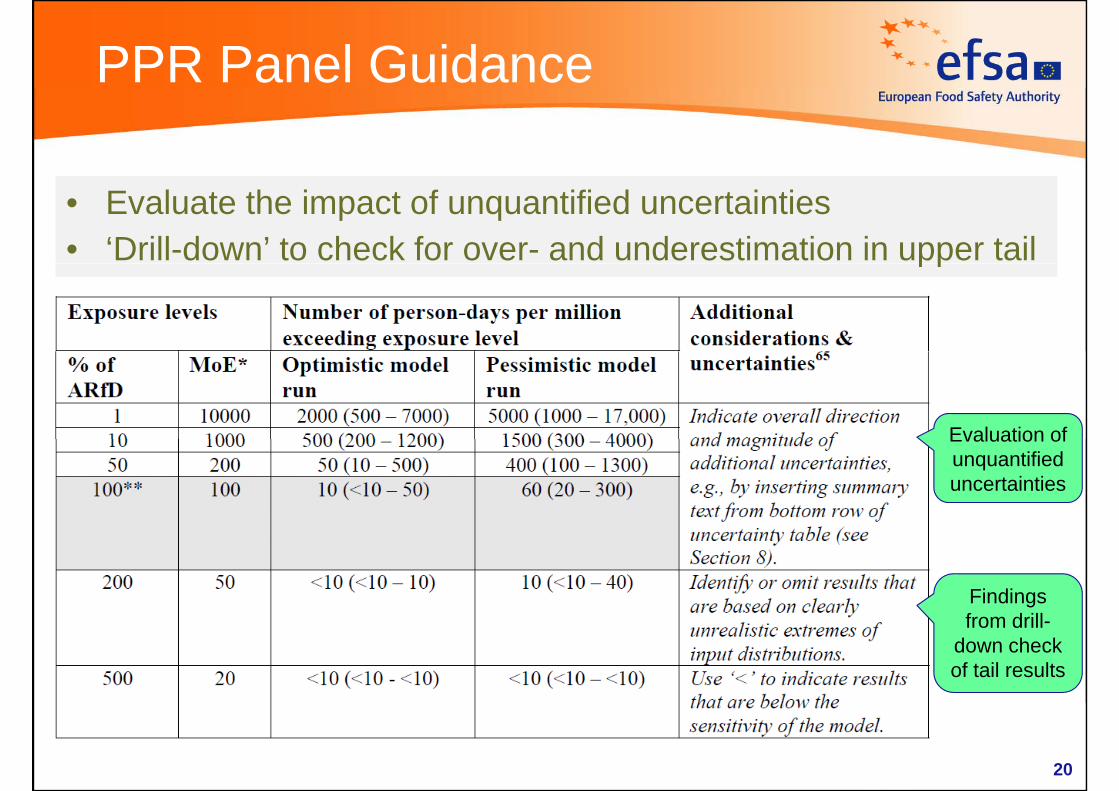
PPR Panel Guidance
• Evaluate the impact of unquantified uncertainties• ‘Drill-down’ to check for over- and underestimation in upper tailpp
Evaluation ofEvaluation of unquantifieduncertainties
Findings f d illfrom drill-
down check of tail results
2020
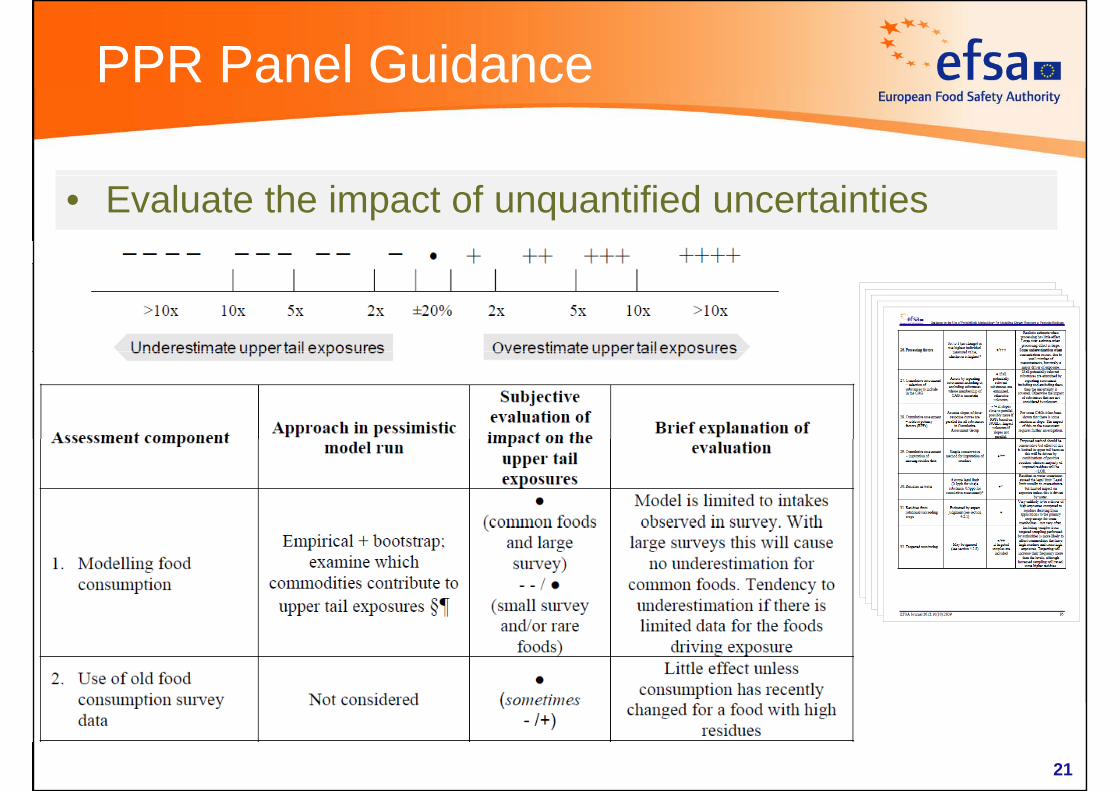
PPR Panel Guidance
• Evaluate the impact of unquantified uncertainties
21

Cumulative exposurep
• Everything so far applies equally to both single substance and cumulative assessmentssubstance and cumulative assessments
• In addition, for cumulative assessments:– Use Relative Potency Factors to combine exposureUse Relative Potency Factors to combine exposure
contributions of different substances in CAG– For acute exposure take account of correlations– For acute exposure, take account of correlations
between concentrations of different substances in same food typesame food type
• Use statistical models to fill gaps in residue database
22Section 6 of Guidance
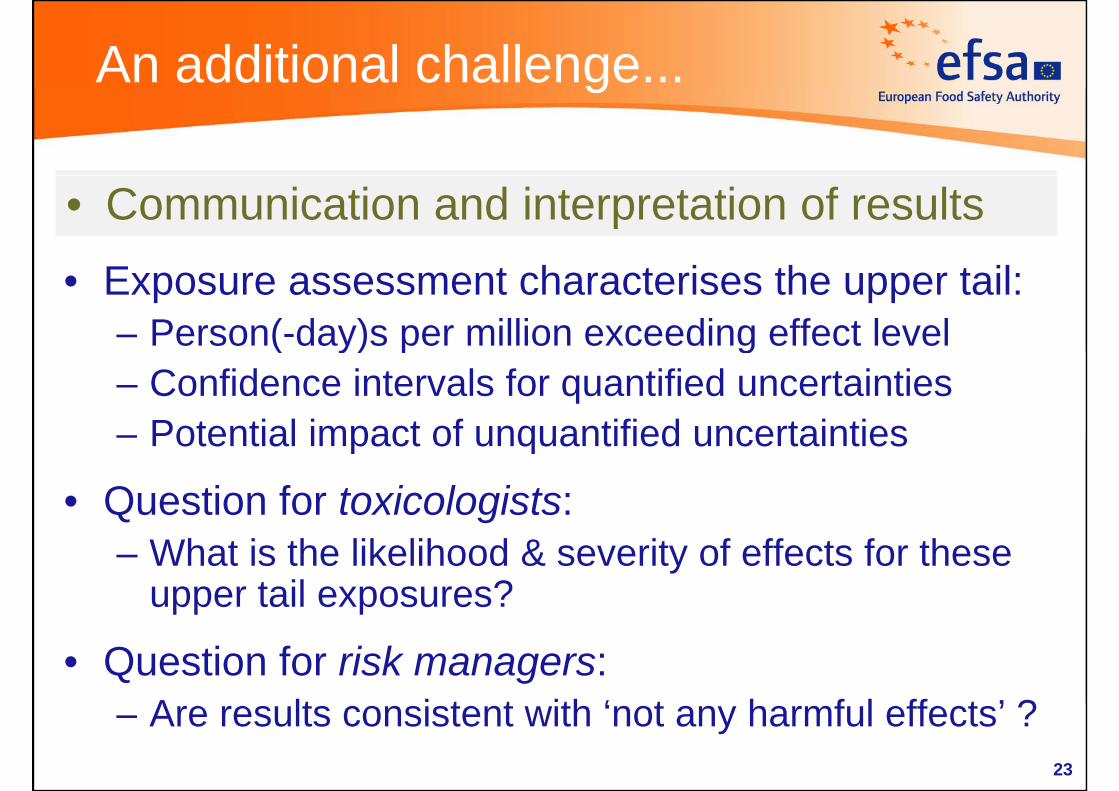
An additional challenge...g
• Communication and interpretation of results• Exposure assessment characterises the upper tail:
– Person(-day)s per million exceeding effect level( y) p g– Confidence intervals for quantified uncertainties– Potential impact of unquantified uncertaintiesPotential impact of unquantified uncertainties
• Question for toxicologists:– What is the likelihood & severity of effects for these
upper tail exposures?
• Question for risk managers:A lt i t t ith ‘ t h f l ff t ’ ?– Are results consistent with ‘not any harmful effects’ ?
23

Summaryy
F h t i i t il t• Focus on characterising upper tail exposures, not on an arbitrary percentile of the distributiony
• Give confidence intervals for quantified uncertainties
• Use alternative assumptions to assess uncertainties that are difficult to quantify probabilistically
E l t th i t f tifi d t i ti• Evaluate the impact of unquantified uncertainties
• ‘Drill down’ to check for over & underestimation in tail• Drill-down to check for over- & underestimation in tail
• Communicate and interpret resultsCommunicate and interpret results
24