probabilistic cost estimate for remediation of ... · francisco ship repair (bae), which continues...
TRANSCRIPT

Probabilistic Cost Estimate for Remediation of Environmental Impacts
Pier 70 San Francisco, California
Port of San Francisco San Francisco, California
REVISION 1 6 August 2009
Project No.4554.02
TABLE OF CONTENTS
1.0 BACKGROUND AND PURPOSE OF ESTIMATE .......................................................................... 1
2.0 STRUCTURE OF COST MODEL............................................................................................... 1
3.0 DEVELOPMENT OF REMEDIATION SCENARIOS FOR THE COST MODEL .................................... 3 3.1 CRANE COVE PARK AND SLIPWAY PARK .................................................................... 4
3.1.1 Site History, Potential Impacts, and Future Use ............................................... 4 3.1.2 Remediation of Site Soils ............................................................................... 6 3.1.3 Remediation of Slipway Fill Materials .............................................................. 6 3.1.4 Stabilization or Remediation of Near-Shore Sediments ..................................... 6
3.2 PARCELS 1 AND 3 .................................................................................................... 7 3.2.1 Site History, Potential Impacts, and Future Use ............................................... 7 3.2.2 Remediation of Site Soils ............................................................................... 7 3.2.3 Vapor Intrusion Mitigation ............................................................................. 8
3.3 PARCELS 2 AND 4 .................................................................................................... 8 3.3.1 Site History, Potential Impacts, and Future Use ............................................... 8 3.3.2 Remediation of Site Soils ............................................................................... 8 3.3.3 Vapor Intrusion Mitigation ............................................................................. 9 3.3.4 Steam and Fuel Line Mitigation ...................................................................... 9
3.4 PARCELS 5, 6, 7 AND 8........................................................................................... 10 3.4.1 Site History, Potential Impacts, and Future Use ............................................. 10 3.4.2 Remediation of Site Soils ............................................................................. 10 3.4.3 Vapor Intrusion Mitigation ........................................................................... 10
3.5 SITEWIDE IMPACTS TO GROUNDWATER ................................................................. 11 3.6 SITEWIDE AND PROGRAMMATIC COSTS.................................................................. 12
4.0 ESTIMATED REMEDIATION COSTS...................................................................................... 12
5.0 COST MODEL AND OUTPUTS .............................................................................................. 13
6.0 SUMMARY AND CONCLUSIONS ........................................................................................... 15
7.0 REFERENCES ..................................................................................................................... 15
TABLES
FIGURES
APPENDIX A: DRAFT MASTER PLAN MAP
APPENDIX B: DETAILED COST ESTIMATES
PROBABALISTIC COST ESTIMATE FOR REMEDIATION OF ENVIRONMENTAL IMPACTS
Pier 70 San Francisco, California
1.0 BACKGROUND AND PURPOSE OF ESTIMATE
The purpose of the probabilistic cost estimate presented here is to provide a reasonable range for the
probable cost of remediating the known, suspected, and potential undetermined impacts to subsurface
soils, soil gas and groundwater at Pier 70 (Site) due to historic and recent industrial activities at the Site.
The intent of the estimate is to support the redevelopment of Pier 70 in accordance with the Port of San
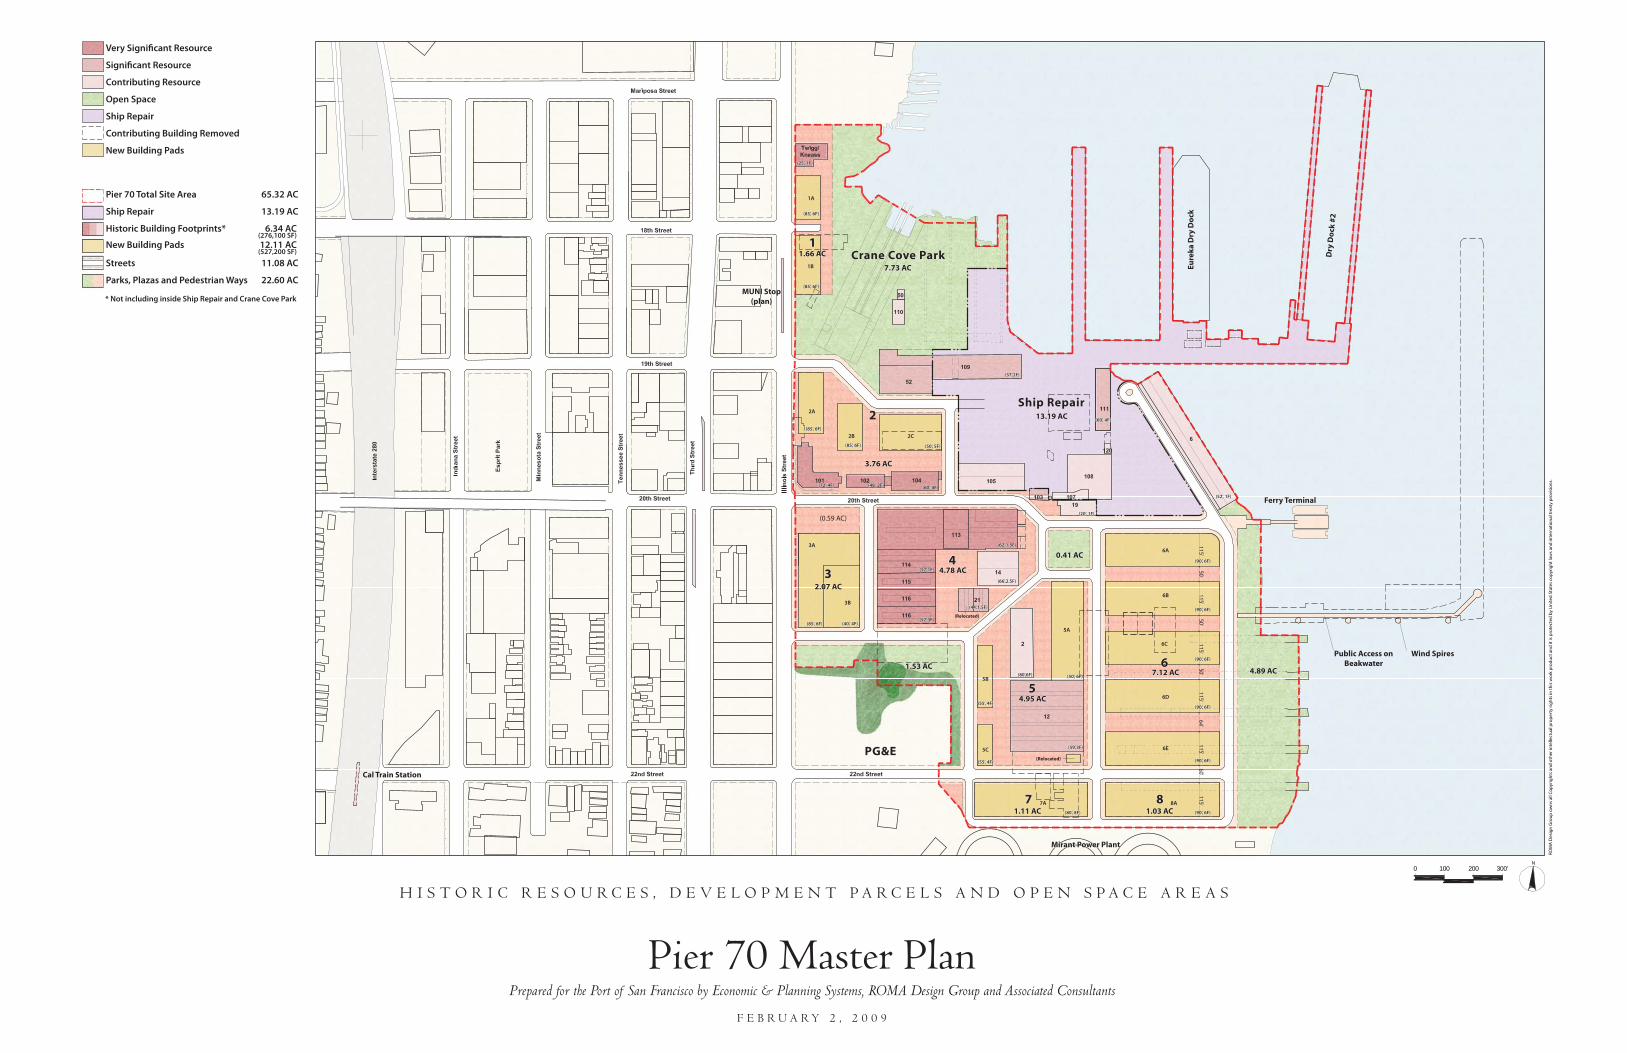
Francisco’s (Port’s) Pier 70 Draft Preferred Master Plan (17 July 2009). The Master Plan envisions a
largely commercial and industrial redevelopment, with continuing ship repair activities in the northeastern
quadrant of the site and possible residential land uses in two locations along Illinois Street. The map
from the Draft Master Plan showing the various site uses is included in the Appendix A to this report.
The Site consists of approximately 64 acres that were formerly occupied by the Bethlehem Steel San
Francisco Yard. Since that time, the Site has had various tenants, including an auto storage yard, a
recyclable metals collection yard, and a ship repair facility, among others. The Site area in its broadest
context is bounded by 22nd Street to the south, Illinois Street to the west, and San Francisco Bay to the
north and east. Current Site occupants include various tenants, most importantly BAE Systems’ San
Francisco Ship Repair (BAE), which continues to operate a dry dock and ship repair facility in the
northwest portion of the Site. For the purpose of this cost estimate, the BAE facility is referred to as
Parcel 9.
2.0 STRUCTURE OF COST MODEL
For the purposes of the cost model, portions of Pier 70 have been grouped into the following areas (see
Figure 1):
• Crane Cove Park and Slipway Park – Crane Cove Park is a 7.73-acre portion of land that is
currently vacant, with an exposed concrete slipway that is still occupied by a wood support
structure formerly used in ship repair and four older slipways, three of which have been filled
with uncontrolled fill, i.e., soil and debris that were likely not compacted at the time that they
2 6 August 2009
were placed in the slipways. Slipway Park is a 4.89-acre portion of land that is currently occupied
by automobile storage and trucking tenants; this area includes portions of four historic slipways
that have been entirely filled in.
• Parcels 1 and 3 – These two parcels have a combined area of 3.73 acres and are located along
Illinois Street; they will be largely occupied by new structures after redevelopment. These are
the only two parcels that are under consideration for potential residential land use in the future.
• Parcels 2 and 4 – These parcels comprise the historic “core” area of Pier 70 and contain the
majority of the historic structures that are envisioned to be preserved as part of the
redevelopment. They have a combined area of 8.54 acres. Due to historic shipyard activities,
this portion of Pier 70 is likely to have the most notable environmental impacts to soil, soil gas,
and groundwater.
• Parcels 5, 6, 7 and 8 – These parcels comprise the “tech campus” area envisioned in the Master
Plan with a total area of 14.21 acres. Due to historic shipyard activities, this portion of Pier 70 is
also likely to have notable environmental impacts to soil, soil gas, and groundwater. It is also
anticipated that the subsurface in the southern portion of this area may be impacted by a
contaminated groundwater plume emanating from the adjacent property located to the south.
• Sitewide Groundwater – There are a number of areas where underground storage tanks (USTs)
are known to have been located, and all known USTs have been removed. However, there may
be residuals impacts in the subsurface, mainly in groundwater and soil gas, that require further
remedial action. In addition, there are some known areas of metals or other impacts to
groundwater as well as potential, yet-to-be-discovered impacts to groundwater due to historic
operations.
Excluded from this cost model are the following items:
• Parcel 9 – This parcel is currently in active use by BAE, a lessee operating a ship repair and dry
docking facility.
• Irish Hill – This area, located to the south of Parcels 3 and 4, will be preserved as open space. It
is not anticipated that any remediation efforts will be required in this area.
• Lead-based paint (LBP) and asbestos containing material (ACM) within existing historic buildings.
Estimated costs for LBM and ACM are included in the summary in Table 2, but are not included in

3 6 August 2009
the cost model, so that the results would not be skewed by these relatively large dollar amounts,
which are significantly higher than the costs for the other environmental remediation
components.
• Offsite groundwater impacts – There is information indicating that groundwater within Parcel 8
and possibly also Parcels 6 and/or 7 is impacted, due to an offsite source located south of Parcels
7 and 8. The cost of onsite institutional controls1 and engineering controls2 needed to address
these impacts so long as they continue to be present are included in the cost model (see Table
2). The cost model does include a limited amount of funds to impose a measure of hydraulic
control or other limited, temporary measures to contain further onsite impacts (e.g., groundwater
extraction wells at property boundary). However, the cost of comprehensive remediation of
groundwater impact from offsite sources is not included. The incremental cost to develop and/or
manage the property due to onsite contamination emanating from an offsite source, including
those institutional and engineering controls included in this cost model, may be recoverable from
the responsible parties.
3.0 DEVELOPMENT OF REMEDIATION SCENARIOS FOR THE COST MODEL
In order to estimate probable remediation costs, the nature and extent of potential environmental
impacts for each of the four areas described above were assessed based on available information
provided by the Port and our professional judgment and experience on similar sites within San Francisco
and the greater Bay Area.3 Some portions of Pier 70, such as the Crane Cove Park area, have been
reasonably well-characterized in the past, while other portions of the Site have little or no sampling data.
For example, five groundwater monitoring wells are located within the 7.73-acre Crane Cove Park area,
whereas another five groundwater monitoring wells are located in the remaining 56 acres of the Pier 70
Site. In addition, there is no documentation available regarding the type of materials that were used for
fill in the various slipways at the site, and little or no environmental characterization has been performed
in Parcels 5 and 6. Figure 1 shows all the locations at which sampling activities have been performed to
date
1 Institutional controls are legal and administrative mechanisms used to limit the exposure of future landowner(s) or
user(s) of the property to hazardous substances present on the property, and to ensure the integrity of the remedial action. Institutional controls must be maintained until the concentrations of hazardous substances in soil, soil gas, and groundwater are at such levels to allow for unrestricted use and exposure. A “Covenant to Restrict Use of Property” is an example of an institutional control.
2 Engineering controls are designed features that serve to mitigate potential exposure by site users to hazardous substances present on the property. Vapor mitigation systems, which mitigate the migration of subsurface vapors into indoor air, are an example of an engineering control.
3 Similar sites include Hunters Point Shipyard, the Mission Bay Redevelopment Area, the Presidio of San Francisco, and the Port of Redwood City’s former Liquid Bulk Terminal site, among others.
4 6 August 2009
Based on the sampling efforts performed to date, the constituents that are contributing to the impacts at
the Site include volatile organic compounds (VOCs), semi-volatile organic compounds (SVOCs), polycyclic
aromatic compounds (PAHs), total petroleum hydrocarbons (TPH), polychlorinated biphenyls (PCBs), and
metals. Environmental impacts to each of the four areas described above were grouped into the
following categories; not all categories apply to every area.
• Impacted soils (metals, SVOCs, PAHs)
• Impacted fill in slipways
• Impacted near-shore sediments (PCBs, metals)
• Potential vapor intrusion conditions for new and/or existing buildings (due to methane or VOCs)
• Impacted steam and fuel lines (TPH)
• Residual impacts to soil, soil gas, and groundwater from previously-closed USTs (methane, VOCs,
SVOCs, TPH, PCBs)
• Impacted groundwater (TPH, metals, SVOCs)
For each of these categories of impacts, a “low”, “likely” and “high” impact/cost scenario was envisioned,
with the “likely” scenario representing the impacts that we believe are most likely to be present, based on
the available data and our experience at similar sites. The “low” impact scenario represents a slightly
optimistic view of potential environmental impacts, and the “high” impact scenario represents the
possibility that environmental impacts are more extensive than currently known or anticipated to exist.
These scenarios are presented in the Table 1, “Synopsis of Remediation Scenarios”. The process of
developing the remediation scenarios based on a review of available Site information and laboratory
analytical data is described in more detail below. The reports or other references that contained the
analytical data reviewed are listed in the reference section at the end of this report.
As noted previously, the costs for abatement of LBP and ACM within existing historic buildings are
included with the detailed estimates attached to this report as well as in Table 2, however they are not
included in the probabilistic cost model, which is limited in scope to remediation efforts targeting impacts
to soil, soil gas, and groundwater.
3.1 CRANE COVE PARK AND SLIPWAY PARK
3.1.1 Site History, Potential Impacts, and Future Use
The dominant feature of Crane Cove Park is the large, exposed concrete slipway that runs diagonally
across the proposed park area. Adjacent to the east are three smaller historic slipways that were
5 6 August 2009
partially or fully in-filled during the 1960s and 1970s. In addition, there is a small building that is a
former substation (Building 50), which previously contained a number of transformers, as well as a
former laundry building (Building 110). The dominant features of Slipway Park are the four historic
slipways that lie perpendicular to the shoreline, which were constructed as part of the shipyard expansion
during World War II. The slipways have been fully in-filled and paved over. There are no structures in
this area. Currently this area is mostly vacant, with portions leased for vehicle and equipment staging.
Historic activities in both of these areas included those typical of a dry dock and shipyard, including
welding and plating. Impacts to the subsurface in these areas are estimated to be moderate. Dry dock
activities such as welding and plating may have resulted in localized releases of metals. Arsenic has been
encountered in numerous soil samples at concentrations exceeding Environmental Screening Levels
(ESLs) (RWQCB, 2008). PAHs exceed applicable screening levels throughout the Crane Cove Park area.
The ground surface in the Crane Cove Park area is covered with loose sand, gravel, cobbles, and other
material, which may not be a significant environmental concern but may present challenges to
redevelopment. The material used to fill in the various historic slipways in both areas has not been
thoroughly characterized; however some environmental impacts (metals) have been documented. In
recent years the substation (Building 50) was vandalized, after which a PCB cleanup was performed.
PCB-contaminated soil was removed, and remaining concentrations were found to be below the remedial
action objective (AEW Engineering, 2008), therefore it is assumed that no residual PCB impacts remain in
the area. Near-shore sediments were investigated in both areas and found to contain elevated levels of
metals and PCBs. Groundwater impacts in Crane Cove Park are believed to be limited, although
groundwater grab sampling indicated elevated metals concentrations in two out of three locations
sampled in the vicinity of the southern end of the large, exposed slipway. Groundwater impacts in
Slipway Park are discussed as part of the site-wide groundwater discussion below.
Because the Crane Cove Park and Slipway Park areas are planned to be open space, this cost model
assumes that most of the impacts to site soils can be mitigated by capping with a combination of soil and
pavement. However, to support reuse, some removal of impacted soils, debris, and/or fill material may
be necessary. The impacted near-shore sediments will likely require some type of cap or other
development design such as elevated piers and walkways to mitigate against dermal contact by shoreline
users.
6 6 August 2009
3.1.2 Remediation of Site Soils
The “low” cost scenario is based on the assumption that the risks posed by impacted soils can be fully
mitigated by capping4 without requiring excavation and disposal. Existing buildings that will remain as
part of the redevelopment are considered to provide a suitable “cap”. The “likely” cost scenario assumes
that in addition to capping, some hot-spot excavation and disposal will also be necessary. Metals and
PAH concentrations that exceeded ESLs for commercial land use by one order of magnitude (i.e., ten
times the ESL or higher) were assumed to define the areas possibly requiring excavation, and the depth
of excavation was assumed to be 5 feet on average. The “high” cost scenario is based on the
excavations being on average 8 feet in depth and laterally more extensive than anticipated based on
available site data.
3.1.3 Remediation of Slipway Fill Materials
It is not anticipated that the materials used to in-fill the slipways constitute a potential threat to human
health and the environment; therefore no substantial excavation effort is anticipated. The “low” cost
scenario is based on the excavation and removal of the upper one foot of material from a portion of the
in-filled slipways due to environmental impacts (e.g., near-surface metals impacts) and/or to clear out
debris that presents a potential hazard to future users of the proposed open space. The “likely” cost
scenario envisions that a greater volume of material (2-foot depth) will need to be removed to support
site resuse as open space, and the “high” cost scenario assumes a greater lateral extent of excavation.
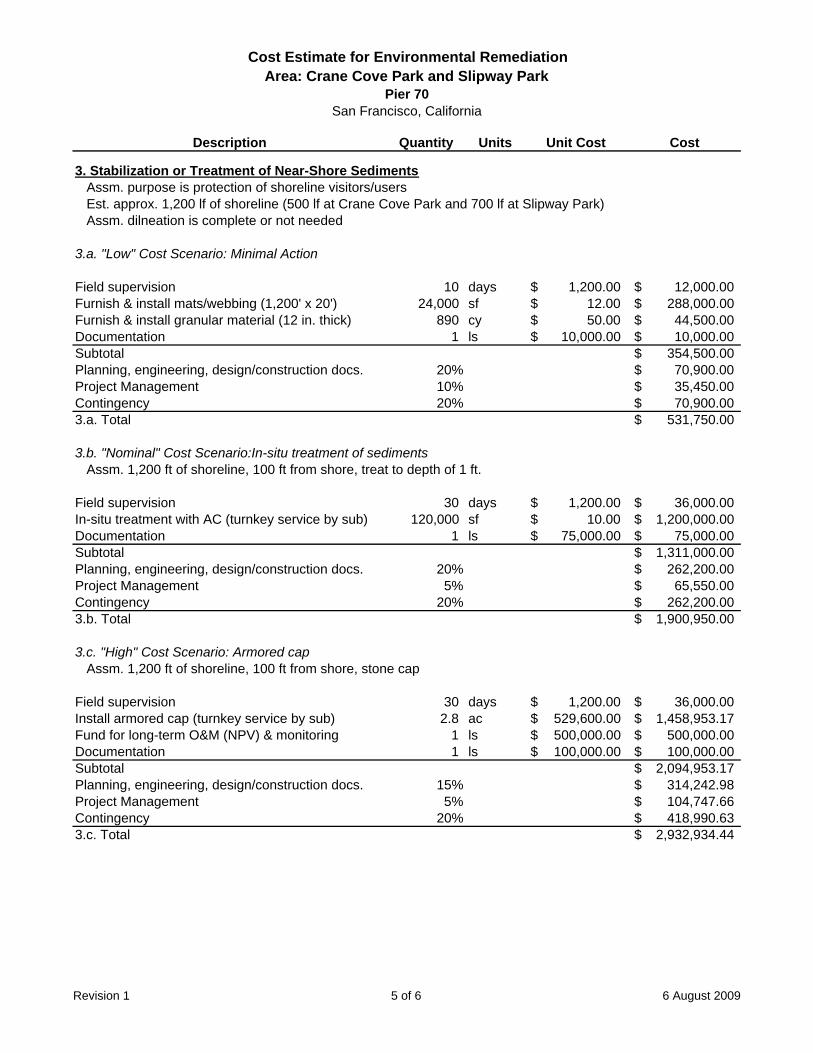
3.1.4 Stabilization or Remediation of Near-Shore Sediments
Considerable uncertainty remains regarding the source or sources of near-shore5 sediment contamination
in the vicinity of Pier 70 and hence what type of remedial approach may be required. It is assumed that,
at a minimum, some measures may be undertaken to enhance the safety and “user experience” of
shoreline visitors to both of these open space areas. Thus, the “low” cost scenario envisions a “low tech”
approach to covering the near-shore sediments with some type of matting and/or geotextile that can be
suitably anchored into the sediments. The “likely” cost scenario envisions treatment of these sediments
by in-situ application of granular activated carbon, assuming that some sort of treatment is deemed to be
desirable or necessary. The “high” cost scenario envisions capping the sediments with an armored cap to
4 “Capping” consists of covering the site with a durable cover that meets regulatory acceptance; examples of durable
covers may include two feet of clean soil, a building floor slab, or pavement in good condition. Within a historic building, the existing concrete floor may suffice as a cap, although improvements may be necessary if there is a potential vapor intrusion condition.
7 6 August 2009
prevent human or ecological receptor contact and/or to prevent their migration. The costs for the latter
two scenarios are based on information provided in the Feasibility Study prepared for the Navy for the
off-shore portion of Hunters Point Shipyard (Barajas & Associates, 2008).
3.2 PARCELS 1 AND 3
3.2.1 Site History, Potential Impacts, and Future Use
Parcel 1 was historically used for boat building and warehousing. Parcel 3 appears to have been initially
used for residential lodging and office uses. However more recent uses have included parking and
storage, possibly including storage of various wastes. Parcel 1 contains one historic building that is slated
for reuse and another building that is slated to be demolished; Parcel 3 is a paved area currently
occupied by a storage business. After redevelopment, both parcels will be largely occupied by new
buildings, with the historic Twigg/Kneass Building remaining on Parcel 1. Parcels 1 and 3 both face
Illinois Street, and both areas could potentially have residential use after redevelopment; therefore they
have been grouped together for the purposes of this cost model.
Parcel 1 soils contain elevated levels of PAHs in a limited area, whereas Parcel 3 soils contain elevated
levels of metals, primarily nickel. There is also information regarding the potential presence of a former
underground storage tank (UST) on Parcel 1.
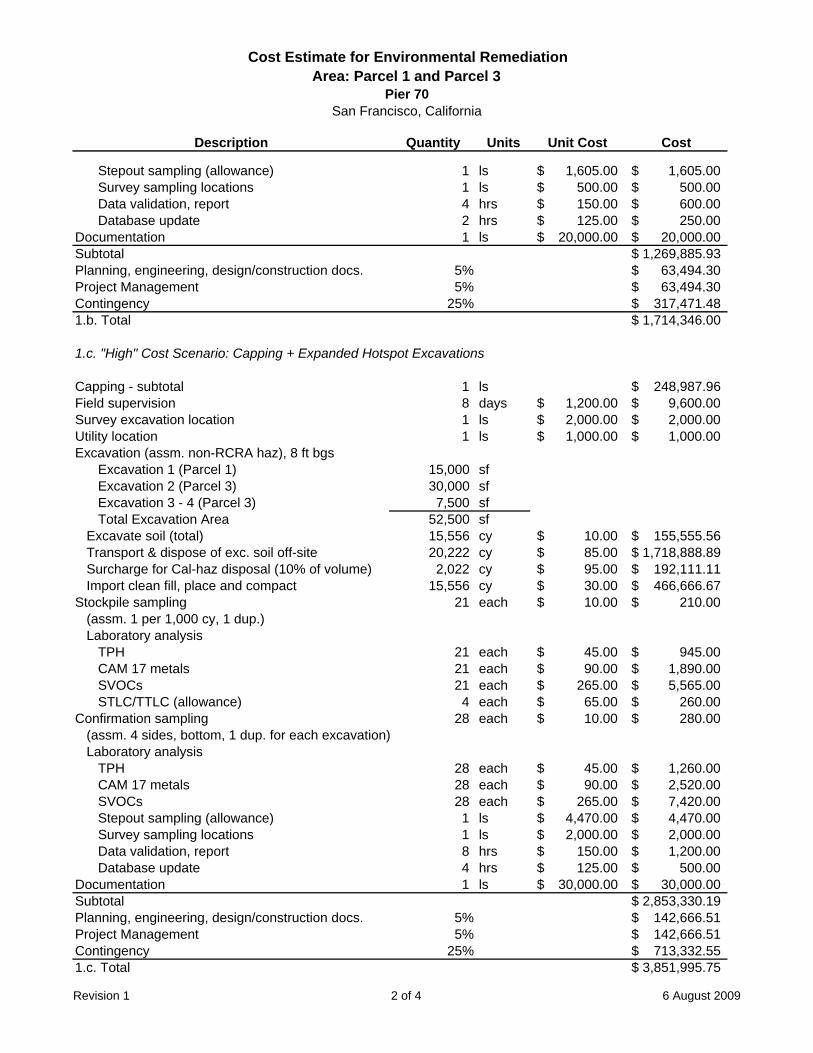
3.2.2 Remediation of Site Soils
The “low” cost scenario is based on the assumption that the risks posed by impacted site soils can be
fully mitigated by capping without significant excavation and disposal. Existing buildings that will
remain as part of the redevelopment are considered to provide a suitable “cap”. The “likely” cost
scenario assumes that in addition to capping, some hot-spot excavation and disposal will also be
necessary. Metals and PAH concentrations that exceeded ESLs for residential land use by one order of
magnitude were assumed to define the areas possibly requiring excavation, and the depth of excavation
was assumed to be 5 feet on average. The “high” cost scenario is based on the excavations being on
average 8 feet in depth and laterally more extensive than anticipated based on available site data.
5 “Near-shore” is defined as within 100 feet of the shoreline for the purposes of this cost model. Environmental
impacts to off-shore sediments have not been fully characterized at this time. However, it is assumed that extensive remediation of these sediments, if required, would not be a part of this Pier 70 scope of work.

8 6 August 2009
3.2.3 Vapor Intrusion Mitigation
This cost item addresses the potential presence of methane, benzene, and/or other volatile constituents
in soil gas due to residuals from the former UST on Parcel 1 and undetermined waste spills on Parcel 3
that may present a potential risk of vapor intrusion (VI) into indoor air of retained historic or new
buildings. The “low” cost scenario assumes that either no impacts to soil gas are found to exist or
impacts are below actionable levels that would require VI mitigation. The “likely” cost scenario assumes
that a VI condition exists on Parcel 1 that requires a vapor mitigation system (VMS) to be incorporated
into the design of Building 1B in the Pier 70 Master Plan (Attachment), and the “high” cost scenario
assumes that a VI condition is also found to exist on Parcel 3, but a VMS is required only for one building
rather than throughout the entire parcel.
3.3 PARCELS 2 AND 4
3.3.1 Site History, Potential Impacts, and Future Use
Parcels 2 and 4 contain the majority of the historic structures that remain on the Site and are anticipated
to be restored and reused as part of the redevelopment. These parcels constitute the core of historic
operations and therefore likely have the greatest extent of subsurface impacts. Historic uses on Parcel 2
included office space, lumber storage, and shipyard-related activities. Historic uses on Parcel 4 dating
back to 1900 included a machine shop and foundry.
A UST was formerly located behind Building 101, thus UST-related residual petroleum contamination may
be present in this area. The powerhouse (Building 102) and adjacent Building 104 may have associated
residual PCB impacts. Welding activities may have occurred on Parcel 2, with potential metals impacts to
soils. A large machine shop (Building 113) is located on Parcel 4 and had a boiler associated with it
(Building 14) and multiple USTs. There are also foundry and warehouse buildings on Parcel 4. Thus
Parcel 4 is expected to have been potentially impacted by metals, PAHs, and other constituents.
However, very limited characterization activities have occurred on Parcel 4. In recent years, Parcels 2
and 4 have been largely unused. When redeveloped, Parcels 2, and 4 will be mostly occupied by
refurbished historic structures.
3.3.2 Remediation of Site Soils
The “low” cost scenario is based on the assumption that the risks posed by impacted soils can be fully
mitigated by capping without significant excavation and disposal. Existing buildings that will remain as
part of the redevelopment are considered to provide a suitable cap. The “likely” cost scenario assumes

9 6 August 2009
that in addition to capping, some hot-spot excavation and disposal will also be necessary. On Parcel 2,
metals and PAH concentrations that exceeded ESLs for commercial land use by one order of magnitude
were assumed to define the areas possibly requiring excavation, and the depth of excavation was
assumed to be 5 feet on average. There is very limited environmental data for Parcel 4, and it was
assumed that impacts to Parcel 4 are similar to those found on Parcel 2. The “high” cost scenario is
based on the excavations being on average 8 feet in depth and laterally more extensive than anticipated
based on available site data. Alternatively, the “high” cost scenario could include limited excavation of
soils from within buildings during construction.6
3.3.3 Vapor Intrusion Mitigation
This cost item addresses the potential presence of methane, benzene, and/or other volatile constituents
in soil gas due to residuals from the former UST on Parcel 2 (behind Building 101) and Parcel 4 (east of
Building 113) and undetermined waste spills on either parcel that may present a potential risk of vapor
intrusion into indoor air. The “low” cost scenario assumes that only the eastern portion (approximately
one quarter) of Building 113 will require retrofitting to mitigate a potential VI condition. The “likely” cost
scenario assumes that, in addition to a portion of Building 113, Building 14 will also require retrofitting to
mitigate a potential VI condition. The “high” cost scenario assumes that Building 103 will also require
retrofitting to mitigate a potential VI condition. Although Building 103 is located on Parcel 9 (the BAE
leased property) its lies within approximately 50 feet of the location of the former USTs east of Building
113, thus it is possible that soil gas vapors associated with UST residuals may be impacting Building 103.
3.3.4 Steam and Fuel Line Mitigation
This cost item addresses the potential presence of TPH residuals in the fuel lines and possibly a portion of
the steam lines. The length of these lines was estimated based on historic utility drawings for the former
Bethlehem shipyard. The extent of TPH impacts to the steam lines is anticipated to be very low, however
there is a substantial amount of uncertainty regarding this item. Therefore the “low” impact scenario
includes mitigation of 100 lineal feet (lf) of fuel line and 72 feet of steam line for TPH impacts, and the
“likely” and “high” scenarios include half again as many and twice as many lineal feet of lines,
respectively. It should be noted that the removal of asbestos wrapping from the exterior of all the steam
lines Site-wide is not included in the cost model.
6 Soil excavation efforts within buildings, if necessary, are anticipated to be relatively limited in extent, as shallow
bedrock underlies most of the historic structures, particularly Building 113. Such excavation could be necessary for construction of foundation elements related to structural/seismic strengthening of the historic buildings.
10 6 August 2009
3.4 PARCELS 5, 6, 7 AND 8
3.4.1 Site History, Potential Impacts, and Future Use
Parcels 5, 6, 7 and 8 have a variety of historic uses. Uses on Parcel 5 have included machine shops,
warehousing, and automobile storage. Parcel 6 initially (circa 1900) included a foundry and in later years
also a machine shop, transformer house, and plating shop. Parcel 7 had structures that supported the
plating shop (Building 12) located on Parcel 5, and Parcel 8 was used as a laydown area and welding
platform. Parcels 6 and 8 are underlain by a total of four historic slipways, which have been completely
filled in and paved over. Parcel 5 is anticipated to be occupied in the future by two historic structures,
which were associated with shipyard activities. Parcels 6 and 7 each contain one or more structures,
which will be demolished and removed. There is essentially no site characterization data for Parcels 5
and 7. Very limited data exists for Parcel 6 and 8, though soil sampling data does indicate the presence
of elevated levels of arsenic in shallow soils throughout Parcels 6 and 8, including the slipway area,
similar to much of the Pier 70 redevelopment area. Future site use is anticipated to be a “tech campus”,
consisting largely of new, multi-story buildings.
3.4.2 Remediation of Site Soils
Because there is very limited data for Parcels 6 and 8 and virtually no data for Parcels 5 and 7, it was
assumed that impacts to all four of these parcels are similar to those found on Parcel 2, as the overall site
history is similar across these areas. The “low” cost scenario is based on the assumption that the risks
posed by impacted site soils (primarily arsenic but also potentially PAHs) can be fully mitigated by
capping. The “likely” cost scenario assumes that in addition to capping, some hot-spot excavation will
also be necessary, and the depth of excavation was assumed to be 5 feet on average. The “high” cost
scenario is based on the excavations being on average 8 feet in depth and laterally more extensive than
anticipated under the “likely” scenario.
3.4.3 Vapor Intrusion Mitigation
This cost item addresses the potential presence of semi-volatile and/or volatile constituents in soil gas
that may pose a potential risk of vapor intrusion to indoor air; the impacts are assumed to occur due to
the onsite migration of a known plume located offsite, immediately south of Parcels 7 and 8. The cost
scenarios assume that the following new buildings (each with a footprint of approximately 47,600 square
feet) will require a VMS to mitigate against the potential VI condition:
• “low” cost scenario: Building 8A
11 6 August 2009
• “likely” cost scenario: Buildings 8A and 6E
• “high” cost scenario: Buildings 8A, 6E, 6D, and 7A.
3.5 SITEWIDE IMPACTS TO GROUNDWATER
General site histories for the various parcels have been described above. This section focuses on
potential impacts to groundwater, which were not addressed above. There is a high probability that
some residual impacts to groundwater remain related to the various UST removals that have been
performed at the Site. Elevated levels of TPH have been found in groundwater samples collected from
behind Building 101 on Parcel 2 and near the eastern end of Building 113 on Parcel 4. The “low” cost
scenarios for management of UST residuals in the various parcel groups assume that the residual impacts
require limited additional characterization, focused short-term monitoring, and little or no remediation;
the “likely” cost scenarios include limited in-situ remediation and focused short-term monitoring in some
former UST areas; and the “high” cost scenarios include slightly more in-situ remediation and short-term
monitoring than the “likely” scenarios. None of these efforts are anticipated to represent significant
costs.
In addition to the UST residuals, there are potential or known impacts to groundwater due to metals,
SVOCs, and other constituents. For example, two of the three groundwater grab samples that were
collected within Parcel 2 (near the southern end of the dry dock) had elevated metals concentrations.
However, monitoring wells located in the more northern portion of Crane Cove Park did not detect
impacts to groundwater exceeding ESLs. Elevated levels of VOCs, SVOCs and PAHs were detected in
offsite and onsite groundwater monitoring wells in the vicinity of Parcels 7 and 8. The “low” cost scenario
envisions some effort (e.g., limited groundwater pumping for hydraulic control) to contain onsite impacts
on Parcels 7 and 8 from the offsite plume as well as delineation and monitoring of three (3) small plumes
in various other, currently undetermined, areas of the Pier 70 Site. The “likely” cost scenario envisions all
of the “low” cost items as well as the delineation, remediation, and monitoring of one additional small
plume somewhere onsite. The “high” cost scenario includes some additional remediation efforts,
particularly to further contain or mitigate the impacts of the southern offsite plume. It should be noted,
however, that comprehensive remediation of the onsite (Parcels 7 and 8) impacts due to the offsite
plume is not included in this cost model. It is also assumed that, due to their relatively small size and
limited mobility, any metals plumes that are found within the Pier 70 site will likely be remediated by
means of “hot spot” soil excavation (discussed in previous sections) and require only long-term
monitoring under the groundwater program.

12 6 August 2009
3.6 SITEWIDE AND PROGRAMMATIC COSTS
It is anticipated that this Site will require the creation and implementation of a Risk Management Plan
(RMP) similar in concept to that in use at the Mission Bay redevelopment area within San Francisco. It is
also standard practice for the State and Federal regulatory agencies that may be involved in a
remediation project to require reimbursement for their oversight costs. In addition, the implementation
and enforcement of any Institutional Controls (ICs) that are part of the final remedial action for this Site –
such as prohibitions on drilling groundwater pumping wells or growing of produce in Site soils – would
involve expenditures by the Port and/or the City of San Francisco. “Low”, “nominal” and “high” costs for
these items are shown in Table 2.
4.0 ESTIMATED REMEDIATION COSTS
For each of the categories of potential impacts (impacted soils, impacted groundwater, etc.) in each of
the four areas, detailed cost estimates were prepared for “low”, “likely”, and “high” remediation cost
scenarios. These detailed cost estimates are attached, as is Table 2, “Summary of Scenarios and Costs”.
The costs and associated probabilities shown in Table 2 were inserted into the probabilistic cost model.
Information regarding the types of remedial actions that may be appropriate for the known or suspected
site impacts as well as the unit costs in the detailed cost estimates included in Appendix B of this report
were obtained from our experience on similar projects (e.g., historic shipyards, sites adjacent to San
Francisco Bay); cost estimates prepared by others for similarly impacted sites (e.g., Feasibility Study for
remediation of Bay sediments at Hunters Point Shipyard); measures in place to manage impacts at similar
sites within San Francisco (e.g., Risk Management Plan for Mission Bay redevelopment area); and our
professional judgment.
The probabilities assigned to the “low”, “likely” and “high” remediation cost scenarios are based on our
professional judgment regarding their relatively likelihood of occurrence. For example, for the
remediation of impacted site soils the “likely” cost was assigned a probability of 50 percent, the “low”
cost scenario a probability of 35%, and the “high” cost scenario a probability of 15%. This slight skewing
of the probability distribution toward the capping-only scenario is based on our opinion that low-level
exceedances of only one or two metals that are likely to be found Site-wide could reasonably be
mitigated by a capping-only approach. As another example, for the remediation of groundwater site-
wide, the “likely” cost was assigned a probability of 50 percent, the “low” cost scenario a probability of
15%, and the “high” cost scenario a probability of 35%. This slight skewing of the probability distribution

13 6 August 2009
toward the high-end scenario is based on our judgment that the actual cost is more likely to be toward
the upper end, rather than the lower end, of the range of estimated costs.
It should be noted that a thorough site characterization effort has not been performed but is pending.
Once the site investigation has been completed, a Remedial Action Plan (RAP) will likely be written,
outlining the remediation efforts that are planned based on the data collected. Once the RAP has been
approved by the regulatory agencies, Remedial Design (RD) will begin. The RD process typically includes
engineering design efforts that result in construction contract documents, including plans and
specifications as needed, for the various remedy components. The remedial actions that are actually
performed, based on a future RAP and RD, may therefore vary from the remediation scenarios that
underlie the detailed cost estimates attached to this report. For example, more soil excavation may be
required than currently estimated, but fewer buildings may require vapor mitigation systems. As another
example, input from the regulatory agencies may result in capping/stabilization of near-shore sediments
being replaced with strengthening of the shoreline (e.g., construction of a revetment wall).
Nevertheless, the total remediation costs for the Pier 70 redevelopment site are anticipated to fall within
the estimated probable range shown in Figure 3.
5.0 COST MODEL AND OUTPUTS
The probabilistic cost model was created using decision analysis software, which is capable of not only
calculating the expected, or most likely, total cost of remediation, but also of providing the probability
distribution for the total cost of remediation, performing a sensitivity analysis, and calculating the value of
controlling each of the variables in the model.
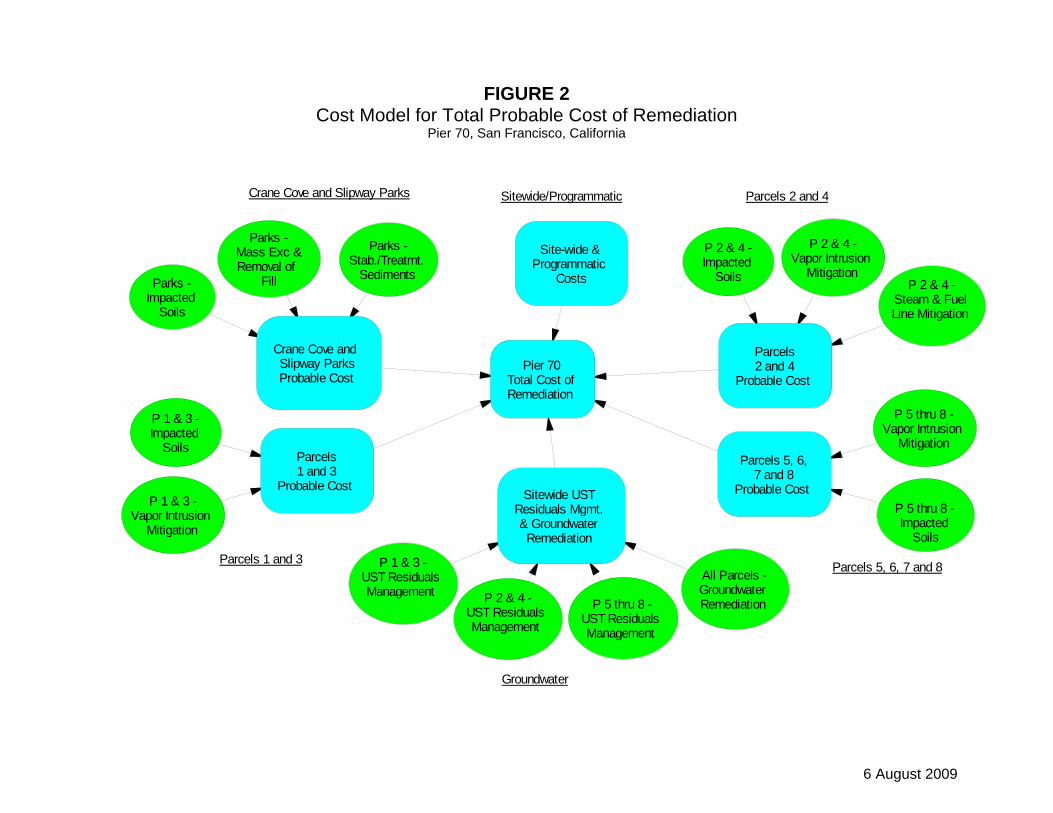
Figure 2 shows a graphical representation of the cost model, indicating the interrelationships between
various cost estimate components. “Chance” variables are represented as ovals; these are cost
components that have a range of potential values, namely the “low”, “likely”, and “high” cost scenarios
provided in the attached detailed cost estimates and summarized in Table 2. The probabilities for each of
the three scenarios for each cost component are also shown in Table 2, and these values are also
incorporated into the cost model.
Also included are the following outputs from the probabilistic cost model:
• Probability Distribution for Total Remediation Cost (Figure 3) – This is a cumulative probability
distribution, which indicates the likely range of total project cost and also the likelihood that the
14 6 August 2009
total project cost is above or below a certain dollar amount. For example, it estimated that there
is only a 10% likelihood that total Site remediation cost will be below $20 million.
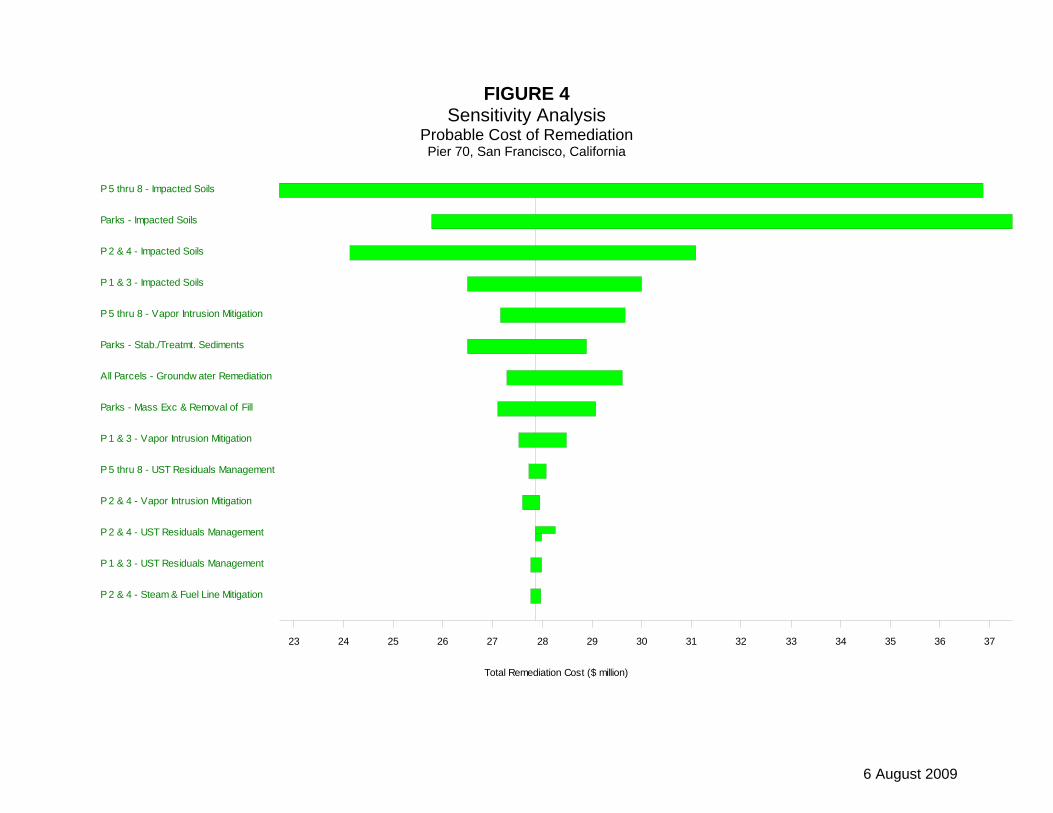
• Sensitivity Analysis (Figure 4) – This graph indicates the effect that the uncertainties in the costs
of the various cost estimate components have on the uncertainty in the total project cost. For
example, the uncertainty in the cost to remediate soils in all areas of the Site, particularly Parcels
5 through 8 and the two parks, contribute the most to the uncertainty in the overall estimate of
total project cost shown in Figure 3.
• Value of Control (Figure 5) – This graph in essence indicates the dollar amount that could
potentially be saved by the project if the uncertainty in cost of a given component could be
eliminated. Due to the high uncertainty in the soil remediation costs, particularly Parcels 5
through 8 and the two parks, the ability to control (i.e., minimize) the cost of these items would
provide the greatest benefit to controlling overall project cost.
As indicated both by the sensitivity analysis (Figure 4) and the value of control analysis (Figure 5), the
greatest contributors to the uncertainty in this cost estimate are the volumes of soil likely to require
excavation and offsite disposal. This uncertainty is driven by the lack of Site characterization data in
certain large parcels comprising the Pier 70 redevelopment area, as well as by the unknown extent to
which sitewide impacts by certain constituents, particularly arsenic, could be managed by a capping-only
remediation alternative.
For those portions of the cost estimate and model in which multiple parcels are grouped together (e.g.,
Parcels 1 and 3), the subtotals for those groups presented in Table 2 may be apportioned to the
individual parcels proportionately based on area, specifically the area of each parcel that is not occupied
by existing or planned buildings. The respective square footages for each parcel or area may be found at
the top of the first page of the cost estimate spreadsheet for each parcel group.7 For the groundwater
remediation portion of the cost estimate, sitewide costs may be apportioned to the individual parcels
based on overall parcel area.
7 The square footages at the top of the first page of each of the cost estimate spreadsheet for each parcel group
exclude building footprints because the soil remediation (new capping and possibly excavation and disposal) is generally not anticipated to extend beneath buildings. Other portions of the estimate (e.g., groundwater remediation, soil vapor intrusion mitigation) address the likely impacts extending beneath buildings due to migration of contaminants via soil gas or groundwater.

15 6 August 2009
6.0 SUMMARY AND CONCLUSIONS
Excluding the LBP and ACM remediation dollar amounts, the estimated total probable cost of remediation
for Pier 70 is $27.5 million. As indicated by the probability distribution for total project cost, the costs are
unlikely to be below $15 million or above $50 million.
7.0 REFERENCES
AEW Engineering, Inc., 2008. Final Closure Report, PCB Removal Action, Building 50, Pier 70, Port of San
Francisco. May
Barajas & Associates, Inc., 2008. Feasibility Study Report for Parcel F, Hunters Point Shipyard, California.
April.
California Regional Water Quality Control Board (RWQCB), 2008. Screening for Environmental Concerns
at Sites with Contaminated Soil and Groundwater (Interim Final, Revised). May.
Ecology and Environment, Inc. (E&E) 2000. Pier 70 Mixed Use Opportunity Area San Francisco,
California Phase II Brownfields Targeted Site Assessment Report. November.
Ecology and Environment, Inc. (E&E) 2004. Pier 70 Mixed Use Opportunity Area, Expanded
Phase II Targeted Brownfields Assessment Report, San Francisco, California. January.
ERRG, Inc., 2005. Soil Boring Well Installation – Building 50 PCB Remedial Investigation.
November
ERM-West, Inc., 1990. Hazardous Materials Investigation of the Mariposa Facilities Project Area,
July.
Geomatrix. 2004. Source Investigation Report, Volume I of II. March.
Geo/Resources Consultants, Inc. 1989. Data Compilation Report & Appendices A through D Data Logs
Volume 1 of 3 Subchapter 15 Compliance Pier 70 Solid Waste Disposal Site San Francisco, California.
December.
M. Lee Corporation, 2008. Port of San Francisco, Pier 70 Condition Assessment: Conceptual Estimate of
Probable Construction Cost Based on Assessment of Building Conditions (Condition Survey Evaluation).
July.
Tetra Tech, Inc. 1997. Subsurface Investigation for Port of San Francisco, Pier 70 San Francisco,
California. December.
16 6 August 2009
Tetra Tech, Inc. 1999. Phase I Environmental Site Assessment for Pier 70 Mixed Use Opportunity Area,
Corner of Illinois Street and 20th Street, San Francisco, California, March.
The Mark Group. 1990. Report of Waste Discharge Pier 70 Solid Waste Disposal Site Port of
San Francisco, California. 20 August.
Treadwell & Rollo. 2008. Site Investigation, Pier 70 Northeastern Shoreline, San Francisco,
California. January.
TablesSynopsis of Remediation Scenarios
Cost Summary

TABLE 1 Synopsis of Remediation Scenarios Cost Estimate for Environmental Remediation Pier 70 San Francisco, California
1 of 2 6 August 2009
Description of Impacts Remediation Approach “Low” Impact/Cost Scenario
“Likely” Impact/Cost Scenario
“High” Impact/Cost Scenario
Crane Cove Park and Slipway Park Impacted soils (metals, PAHs)
Capping, with or without excavation
Capping only Capping and hotspot excavation
Capping and expanded hotspot excavation
Impacted fill in slipways Excavation to remove surface debris
Limited excavation of upper 1 foot of material
Limited excavation of upper 2 ft of material
Expanded excavation of upper 2 ft of material
Impacted sediments, approx. 1,200 ft of shoreline, total
Capping or in-situ treatment to minimize exposure and/or bio-availability to humans and/or eco. receptors
“Low tech” cap, extends 20 ft from shore
In-situ treatment with activated carbon, extends 100 ft from shore; treat upper 12 inches of sediments
Armored cap, extends 100 ft from shore
LBP and asbestos Bldgs. 6, 50, 110, and 52 Per M. Lee est. Parcels 1 and 3 Impacted soils (metals, PAH, SVOCs)
Capping, with or without excavation
Capping only Capping and hotspot excavation
Capping and expanded hotspot excavation
Vapor intrusion mitigation from residual TPH (methane and/or VOCs)
Membrane & venting system (new bldgs.)
None required 1 building @ Parcel 1 1 bldg. @ Parcel 1 and 1 bldg. @ Parcel 3
LBP and asbestos Twigg/Kneass Building Per M. Lee est. Parcels 2 and 4 Impacted soils (metals, PAHs)
Capping, with or without excavation
Capping only Capping and hotspot excavation
Capping and expanded hotspot excavation
Vapor intrusion mitigation from residual TPH (methane and/or VOCs)
Membrane & venting system (new bldgs.); venting-only retrofit for existing buildings
Bldg. 113 – retrofit (partial footprint only)
Bldg. 113 – retrofit Bldg. 14 – retrofit Bldg. 103 – retrofit
Bldg. 113 – retrofit Bldg. 14 – retrofit Bldg. 103 – retrofit
Steam and Fuel Line Mitigation
Excavate and remove impacted lines/soil; close in-place unimpacted lines
Assume extent of impacts is similar to HPS; location of lines per historical (Bethlehem) plans
Low + 50% More lines than shown on drawings
Low + 100% More lines than shown on drawings and/or ACM found
LBP and ACM Bldgs. 101, 102, 104, 113, 114, 115, and 116
Per M. Lee est.

TABLE 1 Synopsis of Remediation Scenarios Cost Estimate for Environmental Remediation Pier 70 San Francisco, California
2 of 2 6 August 2009
Description of Impacts Remediation Approach “Low”-impact/cost Scenario
“Nominal”-impact/cost Scenario
“High”-impact/cost Scenario
Parcels 5, 6, 7 and 8 Impacted soils (metals, PAH, SVOCs)
Capping, with or without excavation
Capping only Capping and hotspot excavation
Capping and expanded hotspot excavation
Vapor intrusion mitigation (methane and/or VOCs)
Membrane & venting system (new bldgs.)
Bldg. 8A - new Bldg. 8A – new Bldg. 6E – new
Bldg. 8A – new Bldg. 7A – new Bldg. 6D – new Bldg. 6E – new Bldg. 12 (partial) – retrofit
LBP and asbestos Bldgs. 2 and 12 Per M. Lee est. Groundwater Remediation Parcels 1 & 3 - UST Residuals
Short-term monitoring, with or without in-situ remediation
Install and monitor 1 to 2 wells (short-term) in one location
Install and monitor 1 to 2 wells (short-term) and in-situ remediation in one location
Install and monitor 1 to 2 wells (short-term) and in-situ remediation in two locations
Parcels 2 & 4 - UST Residuals
Short-term monitoring, with or without in-situ remediation
Install and monitor 1 to 2 wells (short-term) in two locations and in-situ remediation in one location
Install and monitor 1 to 2 wells (short-term) and in-situ remediation in two or three locations
Install and monitor 3 to 4 wells (short-term) and in-situ remediation in two locations
Parcels 5, 6, 7, and 8 - UST Residuals
Short-term monitoring, with or without in-situ remediation
Install and monitor 1 to 2 wells (short-term) in one location
Install and monitor 1 to 2 wells (short-term) in two locations and in-situ remediation in one location
Install and monitor 1 to 2 wells (short-term) and in-situ remediation in two or three locations
All Parcels - Groundwater Remediation (metals, VOCs, etc.)
Short-term monitoring, with or without remediation
Contain onsite impacts on Parcels 7 and 8 from offsite plume; delineate and monitor three (3) small plumes in other areas
Contain onsite impacts on Parcels 7 and 8 from offsite plume; delineate and monitor four (4) small plumes in other areas
More aggressively contain onsite impacts on Parcels 7 and 8 from offsite plume; delineate and monitor four (4) small plumes in other areas
TPH – Total Petroleum Hydrocarbons PAH – Polyaromatic Hydrocarbon VOC – Volatile Organic Compound LBP – Lead-based paint ACM – Asbestos-containing materials UST – Underground Storage Tank
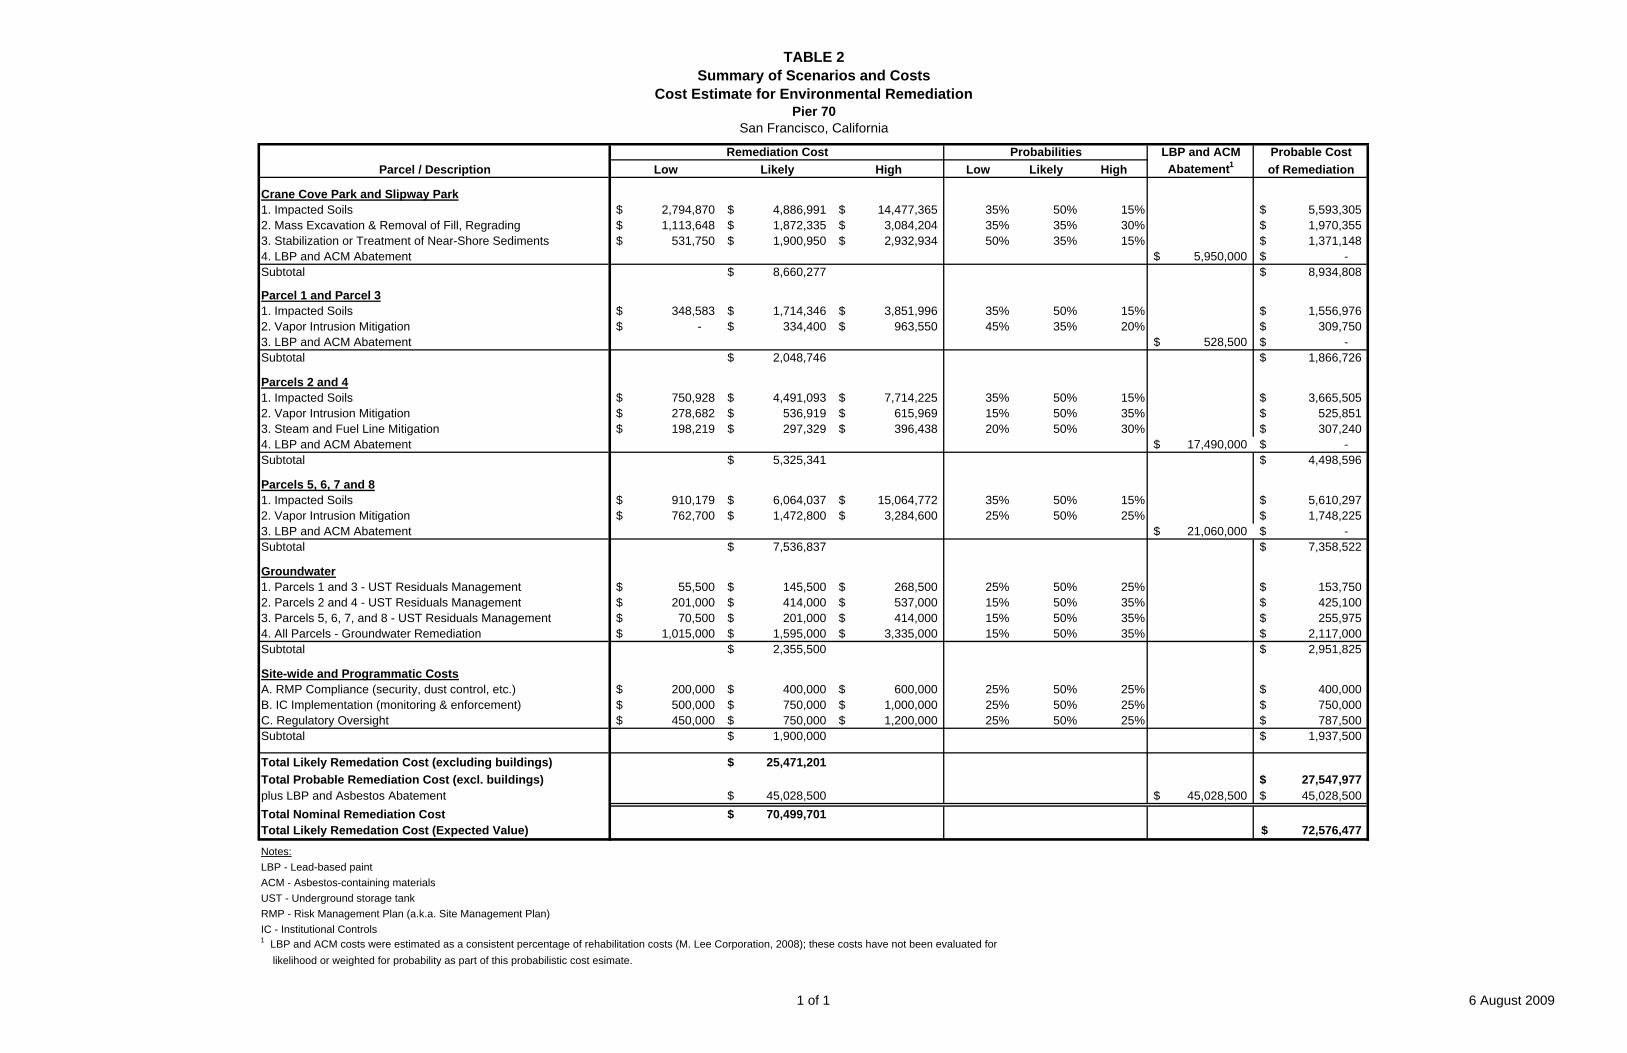
TABLE 2Summary of Scenarios and Costs
Cost Estimate for Environmental RemediationPier 70
San Francisco, California
LBP and ACM Probable CostParcel / Description Low Likely High Low Likely High Abatement1 of Remediation
Crane Cove Park and Slipway Park1. Impacted Soils 2,794,870$ 4,886,991$ 14,477,365$ 35% 50% 15% 5,593,305$ 2. Mass Excavation & Removal of Fill, Regrading 1,113,648$ 1,872,335$ 3,084,204$ 35% 35% 30% 1,970,355$ 3. Stabilization or Treatment of Near-Shore Sediments 531,750$ 1,900,950$ 2,932,934$ 50% 35% 15% 1,371,148$ 4. LBP and ACM Abatement 5,950,000$ -$ Subtotal 8,660,277$ 8,934,808$
Parcel 1 and Parcel 31. Impacted Soils 348,583$ 1,714,346$ 3,851,996$ 35% 50% 15% 1,556,976$ 2. Vapor Intrusion Mitigation -$ 334,400$ 963,550$ 45% 35% 20% 309,750$ 3. LBP and ACM Abatement 528,500$ -$ Subtotal 2,048,746$ 1,866,726$
Parcels 2 and 41. Impacted Soils 750,928$ 4,491,093$ 7,714,225$ 35% 50% 15% 3,665,505$ 2. Vapor Intrusion Mitigation 278,682$ 536,919$ 615,969$ 15% 50% 35% 525,851$ 3. Steam and Fuel Line Mitigation 198,219$ 297,329$ 396,438$ 20% 50% 30% 307,240$ 4. LBP and ACM Abatement 17,490,000$ -$ Subtotal 5,325,341$ 4,498,596$
Parcels 5, 6, 7 and 81. Impacted Soils 910,179$ 6,064,037$ 15,064,772$ 35% 50% 15% 5,610,297$ 2. Vapor Intrusion Mitigation 762,700$ 1,472,800$ 3,284,600$ 25% 50% 25% 1,748,225$ 3. LBP and ACM Abatement 21,060,000$ -$ Subtotal 7,536,837$ 7,358,522$
Groundwater1. Parcels 1 and 3 - UST Residuals Management 55,500$ 145,500$ 268,500$ 25% 50% 25% 153,750$ 2. Parcels 2 and 4 - UST Residuals Management 201,000$ 414,000$ 537,000$ 15% 50% 35% 425,100$ 3. Parcels 5, 6, 7, and 8 - UST Residuals Management 70,500$ 201,000$ 414,000$ 15% 50% 35% 255,975$ 4. All Parcels - Groundwater Remediation 1,015,000$ 1,595,000$ 3,335,000$ 15% 50% 35% 2,117,000$ Subtotal 2,355,500$ 2,951,825$
Site-wide and Programmatic CostsA. RMP Compliance (security, dust control, etc.) 200,000$ 400,000$ 600,000$ 25% 50% 25% 400,000$ B. IC Implementation (monitoring & enforcement) 500,000$ 750,000$ 1,000,000$ 25% 50% 25% 750,000$ C. Regulatory Oversight 450,000$ 750,000$ 1,200,000$ 25% 50% 25% 787,500$ Subtotal 1,900,000$ 1,937,500$
Total Likely Remedation Cost (excluding buildings) 25,471,201$ Total Probable Remediation Cost (excl. buildings) 27,547,977$ plus LBP and Asbestos Abatement 45,028,500$ 45,028,500$ 45,028,500$ Total Nominal Remediation Cost 70,499,701$ Total Likely Remedation Cost (Expected Value) 72,576,477$
Notes:LBP - Lead-based paintACM - Asbestos-containing materialsUST - Underground storage tankRMP - Risk Management Plan (a.k.a. Site Management Plan)IC - Institutional Controls1 LBP and ACM costs were estimated as a consistent percentage of rehabilitation costs (M. Lee Corporation, 2008); these costs have not been evaluated for likelihood or weighted for probability as part of this probabilistic cost esimate.
Remediation Cost Probabilities
1 of 1 6 August 2009

FiguresSampling Location Map
Cost ModelProbability Distribution
Sensitivity AnalysisValue of Control

IllinoisS
treet
3rdS
treet
TennesseeS
treet
20th Street
teertSdn22
teertSht91
18th Street
Parcel 913.19 Acres
Parcel 67.12 AcresParcel 5
4.95 Acres
Parcel 44.78 Acres
Parcel 23.76 Acres
CraneCovePark
7.73 Acres
Parcel 32.07 Acres
Parcel 81.03 AcresParcel 7
1.11 Acres
SlipwayPark
4.89 Acres
Parcel1
1.66Acres
0.41Acres
6
12
113
2
109
11760
38
14
15
116
105108
36
11
114
115
21
101 104102
111
19
40
110
107103
120119
50
PIER 70 AREASan Francisco, California
SAMPLING LOCATION MAPWITH AERIAL PHOTO
Date 08/06/09 Project 4554.02 Figure 1
0 300 600150
Feet
Legend
Parcel BoundaryPier 70 Site Area
Sample Location and MatrixFree ProductSedimentSoilSoil and GroundwaterSoil and Leachate from SoilGroundwaterLeachate from SoilSurface WaterBuilding
Trea
dwel
l&R
ollo
,C: \G
IS\4
554
-Pi e
r70 \
arcm
ap_d
oc\ 2
009\
4 554
-02-
030.
mxd
Notes:
1. Digital orthophotos from California Spatial Information Library(CASIL) UC Davis, ca. 2005, http://archive.casil.ucdavis.edu/casil/
2. Site boundary, parcels, and acreages from ROMA Design Group,Pier 70 Master Plan, 2 Feb 2009
3. Map displayed in California State Plane Coordinate System, ZoneIII, North American Datum of 1983 (NAD83), US Survey Feet
References:
1. Geo/Resource Consultants Inc, Data Compilation Report, Dec1989
2. ERM, Hazardous Materials Investigation of the Mariposa FacilitiesInvestigation Area, Jan 1990
3. The Mark Group, Amended Report of Waste Discharge, Aug 19904. Tetra Tech, Subsurface Investigation, Dec 19975. Tetra Tech, Subsurface Investigation at Illinois and 20th Streets,
Apr 19996. Ecology and Environment Inc, Phase II Brownfields Targeted Site
Assessment Report, Nov 20007. Ecology and Environment Inc, Pier 70 Mixed Use Opportunity,
Area Expanded Phase II, Targeted Brownfields AssessmentReport, Jan 2004
8. Geomatrix Consultants, Source Investigation Report, Volume I ofII, Mar 2004
9. ERRG Inc, Soil Boring Well Installation - Building 50 PCB RI, Nov2005
10. Treadwell & Rollo Inc, Site Investigation - Pier 70 NortheasternShoreline, Jan 2008
6 August 2009
FIGURE 2 Cost Model for Total Probable Cost of Remediation
Pier 70, San Francisco, California
Crane Cove andSlipway ParksProbable Cost
Parcels1 and 3
Probable Cost
Pier 70Total Cost ofRemediation
Parcels2 and 4
Probable Cost
Parcels 5, 6,7 and 8
Probable CostSitewide USTResiduals Mgmt.& GroundwaterRemediation
Site-wide &Programmatic
CostsParks -Impacted
Soils
Parks -Mass Exc &Removal of
Fill
Parks -Stab./Treatmt.
Sediments
P 1 & 3 -Impacted
Soils
P 1 & 3 -Vapor Intrusion
Mitigation
P 1 & 3 -UST ResidualsManagement
P 2 & 4 -Impacted
Soils
P 2 & 4 -UST ResidualsManagement
P 2 & 4 -Vapor Intrusion
Mitigation
P 5 thru 8 -Impacted
Soils
P 5 thru 8 -UST ResidualsManagement
P 5 thru 8 -Vapor Intrusion
Mitigation
P 2 & 4 -Steam & FuelLine Mitigation
All Parcels -GroundwaterRemediation
Crane Cove and Slipway Parks
Parcels 1 and 3
Parcels 2 and 4
Parcels 5, 6, 7 and 8
Groundwater
Sitewide/Programmatic
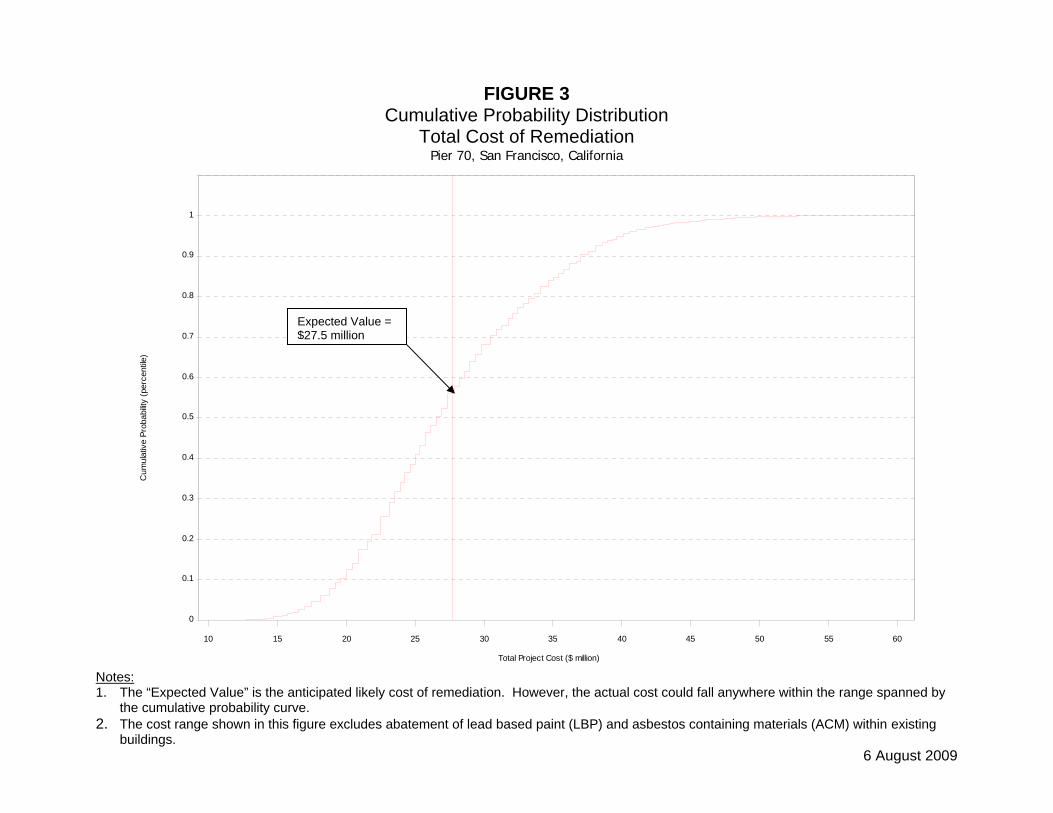
Notes: 1. The “Expected Value” is the anticipated likely cost of remediation. However, the actual cost could fall anywhere within the range spanned by
the cumulative probability curve. 2. The cost range shown in this figure excludes abatement of lead based paint (LBP) and asbestos containing materials (ACM) within existing
buildings. 6 August 2009
FIGURE 3 Cumulative Probability Distribution
Total Cost of Remediation Pier 70, San Francisco, California
Total Project Cost ($ million)
Cum
ulat
ive
Prob
abilit
y (p
erce
ntile
)
0
0.1
0.2
0.3
0.4
0.5
0.6
0.7
0.8
0.9
1
10 15 20 25 30 35 40 45 50 55 60
Expected Value = $27.5 million
6 August 2009
FIGURE 4 Sensitivity Analysis
Probable Cost of Remediation Pier 70, San Francisco, California
P 5 thru 8 - Impacted Soils
Parks - Impacted Soils
P 2 & 4 - Impacted Soils
P 1 & 3 - Impacted Soils
P 5 thru 8 - Vapor Intrusion Mitigation
Parks - Stab./Treatmt. Sediments
All Parcels - Groundw ater Remediation
Parks - Mass Exc & Removal of Fill
P 1 & 3 - Vapor Intrusion Mitigation
P 5 thru 8 - UST Residuals Management
P 2 & 4 - Vapor Intrusion Mitigation
P 2 & 4 - UST Residuals Management
P 1 & 3 - UST Residuals Management
P 2 & 4 - Steam & Fuel Line Mitigation
23 24 25 26 27 28 29 30 31 32 33 34 35 36 37
Total Remediation Cost ($ million)

6 August 2009
FIGURE 5 Value of Control
Probable Cost of Remediation Pier 70, San Francisco, California
Tota
l Pro
ject
Cos
t ($
milli
on)
P 5
thru
8 -
Impa
cted
Soi
ls
Park
s - I
mpa
cted
Soi
ls
P 2
& 4
- Im
pact
ed S
oils
P 1
& 3
- Im
pact
ed S
oils
Park
s - S
tab.
/Tre
atm
t. Se
dim
ents
P 5
thru
8 -
Vapo
r Int
rusi
on M
itigat
ion
All P
arce
ls -
Gro
undw
ater
Rem
edia
tion
Park
s - M
ass
Exc
& R
emov
al o
f Fill
P 1
& 3
- Vap
or In
trusi
on M
itigat
ion
P 2
& 4
- UST
Res
idua
ls M
anag
emen
t
P 5
thru
8 -
UST
Res
idua
ls M
anag
emen
P 1
& 3
- UST
Res
idua
ls M
anag
emen
t
P 2
& 4
- Vap
or In
trusi
on M
itigat
ion
P 2
& 4
- Ste
am &
Fue
l Lin
e M
itigat
ion
0
1
2
3
4
5
6
7
8
9

Appendix APier 70 Master Plan
(Map)
3.76 AC
1.66 AC
7.73 AC
13.19 AC
2.07 AC
1.53 AC
0.41 AC
4.89 AC
4.78 AC
4.95 AC
7.12 AC
1.03 AC1.11 AC
1
2
34
5
6
Ship Repair
PG&E
Crane Cove Park
(90’, 6F)
(90’, 6F)
(90’, 6F)
(90’, 6F)
(90’, 6F)
(90’, 6F)
(85’, 6F)
(85’, 6F)
(85’, 6F)
(85’, 6F)
(25’, 1F)
(40’, 4F)
(55’, 4F)
(55’, 4F)
(85’, 6F)
(50’, 6F)
(72’, 4F) (48’, 2F)(60’, 4F)
(62’,1.5F)
(66’,2.5F)
(44’,1.5F)
(59’,3F)
(57’,3F)
(57’,1F)
(37’,2F)
(80’,6F)
(50’, 5F)
87
MUNI Stop(plan)
Ferry TerminalFerry Terminal
(80’, 8F)
Cal Train Station
Wind Spires
Mirant Power Plant
(52’, 1F)
(60’, 4F)
(20’, 1F)
3.76 AC
1.66 AC
7.73 AC
13.19 AC
2.07 AC
1.53 AC
(0.59 AC)
0.41 AC
4.89 AC
4.78 AC
4.95 AC
7.12 AC
1.03 AC1.11 AC
Cal Train Station
MUNI Stop(plan)
Ferry Terminal
Wind SpiresPublic Access onBeakwater
Mirant Power Plant
(Relocated)
(Relocated)
Eure
ka D
ry D
ock
Dry
Do
ck #
2
1
2
87
34
5
6
Ship Repair
PG&E
Crane Cove Park
(90’, 6F)
(90’, 6F)
(90’, 6F)
(90’, 6F)
(90’, 6F)
(90’, 6F)(80’, 8F)
(85’, 6F)
(85’, 6F)
(85’, 6F)
(85’, 6F)
(25’, 1F)
(40’, 4F)
(55’, 4F)
(55’, 4F)
(85’, 6F)
(50’, 6F)
(72’, 4F) (48’, 2F)(60’, 4F)
(62’,1.5F)
(66’,2.5F)
(44’,1.5F)
(59’,3F)
(57’,3F)
(57’,1F)
(37’,2F)
(52’, 1F)
(80’,6F)
(50’, 5F)
(60’, 4F)
(20’, 1F)
1A
1B
5B
5C
5A
6A
6B
6C
6D
6E
7A 8A
2A
3A
2B
3B
2C
Pier 70 Total Site Area 65.32 AC
Ship Repair 13.19 AC
Historic Building Footprints* 6.34 AC (276,100 SF)
New Building Pads 12.11 AC (527,200 SF)
Streets 11.08 AC
Parks, Plazas and Pedestrian Ways 22.60 AC
* Not including inside Ship Repair and Crane Cove Park
Very Significant Resource
Significant Resource
Contributing Resource
Open Space
Ship Repair
Contributing Building Removed
New Building Pads
Pier 70 Master PlanPrepared for the Port of San Francisco by Economic & Planning Systems, ROMA Design Group and Associated Consultants
F E B R U A R Y 2 , 2 0 0 9
H I S T O R I C R E S O U R C E S , D E V E L O P M E N T P A R C E L S A N D O P E N S P A C E A R E A S
ROM
A D
esig
n G
rou
p o
wn
s al
l Co
pyr
igh
ts a
nd
oth
er in
telle
ctu
al p
rop
erty
rig
hts
in t
his
wo
rk p
rod
uct
an
d it
is p
rote
cted
by
Un
ited
Sta
tes
cop
yrig
ht
law
s an
d in
tern
atio
nal
tre
aty
pro
visi
on
s.
1000 200 300’N

Appendix BDetailed Cost Estimates

Detailed Cost EstimateCrane Cove and Slipway Parks
Cost Estimate for Environmental RemediationArea: Crane Cove Park and Slipway Park
Pier 70San Francisco, California
Description Quantity Units Unit Cost Cost
1. Impacted Soils
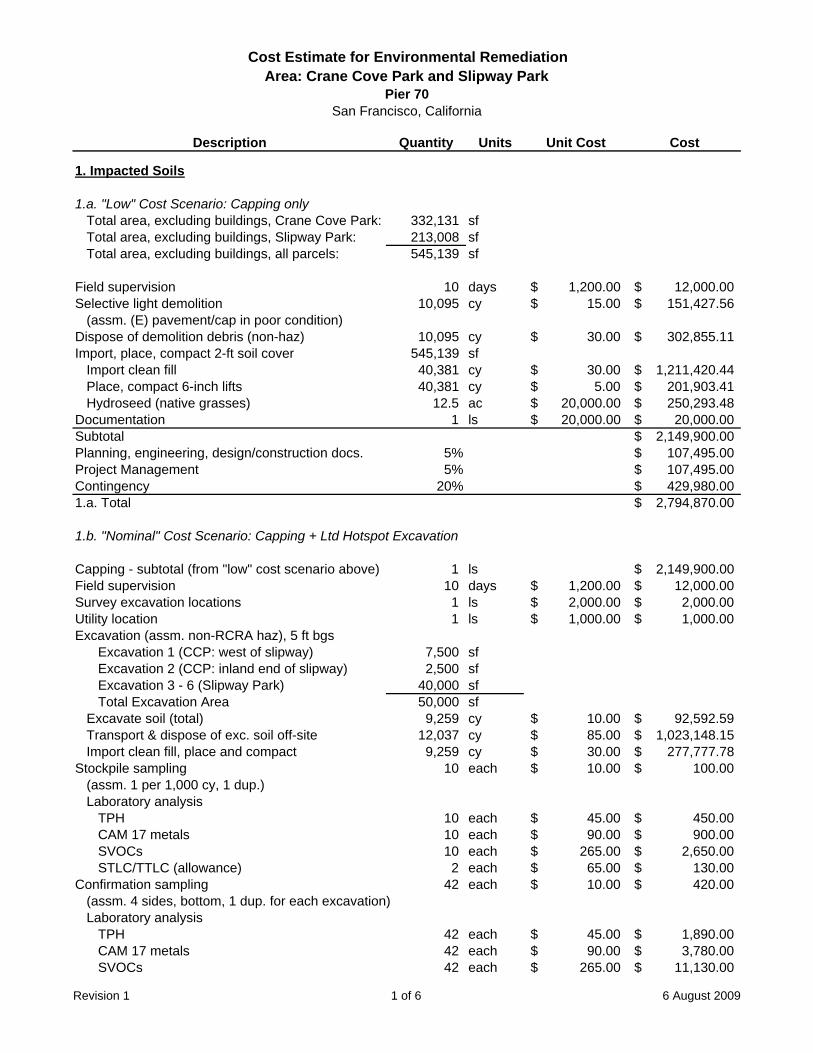
1.a. "Low" Cost Scenario: Capping onlyTotal area, excluding buildings, Crane Cove Park: 332,131 sfTotal area, excluding buildings, Slipway Park: 213,008 sfTotal area, excluding buildings, all parcels: 545,139 sf
Field supervision 10 days 1,200.00$ 12,000.00$ Selective light demolition 10,095 cy 15.00$ 151,427.56$
(assm. (E) pavement/cap in poor condition)Dispose of demolition debris (non-haz) 10,095 cy 30.00$ 302,855.11$ Import, place, compact 2-ft soil cover 545,139 sf
Import clean fill 40,381 cy 30.00$ 1,211,420.44$ Place, compact 6-inch lifts 40,381 cy 5.00$ 201,903.41$ Hydroseed (native grasses) 12.5 ac 20,000.00$ 250,293.48$
Documentation 1 ls 20,000.00$ 20,000.00$ Subtotal 2,149,900.00$ Planning, engineering, design/construction docs. 5% 107,495.00$ Project Management 5% 107,495.00$ Contingency 20% 429,980.00$ 1.a. Total 2,794,870.00$
1.b. "Nominal" Cost Scenario: Capping + Ltd Hotspot Excavation
Capping - subtotal (from "low" cost scenario above) 1 ls 2,149,900.00$ Field supervision 10 days 1,200.00$ 12,000.00$ Survey excavation locations 1 ls 2,000.00$ 2,000.00$ Utility location 1 ls 1,000.00$ 1,000.00$ Excavation (assm. non-RCRA haz), 5 ft bgs
Excavation 1 (CCP: west of slipway) 7,500 sfExcavation 2 (CCP: inland end of slipway) 2,500 sfExcavation 3 - 6 (Slipway Park) 40,000 sfTotal Excavation Area 50,000 sf
Excavate soil (total) 9,259 cy 10.00$ 92,592.59$ Transport & dispose of exc. soil off-site 12,037 cy 85.00$ 1,023,148.15$ Import clean fill, place and compact 9,259 cy 30.00$ 277,777.78$
Stockpile sampling 10 each 10.00$ 100.00$ (assm. 1 per 1,000 cy, 1 dup.)Laboratory analysis
TPH 10 each 45.00$ 450.00$ CAM 17 metals 10 each 90.00$ 900.00$ SVOCs 10 each 265.00$ 2,650.00$ STLC/TTLC (allowance) 2 each 65.00$ 130.00$
Confirmation sampling 42 each 10.00$ 420.00$ (assm. 4 sides, bottom, 1 dup. for each excavation)Laboratory analysis
TPH 42 each 45.00$ 1,890.00$ CAM 17 metals 42 each 90.00$ 3,780.00$ SVOCs 42 each 265.00$ 11,130.00$
Revision 1 1 of 6 6 August 2009
Cost Estimate for Environmental RemediationArea: Crane Cove Park and Slipway Park
Pier 70San Francisco, California
Description Quantity Units Unit Cost Cost
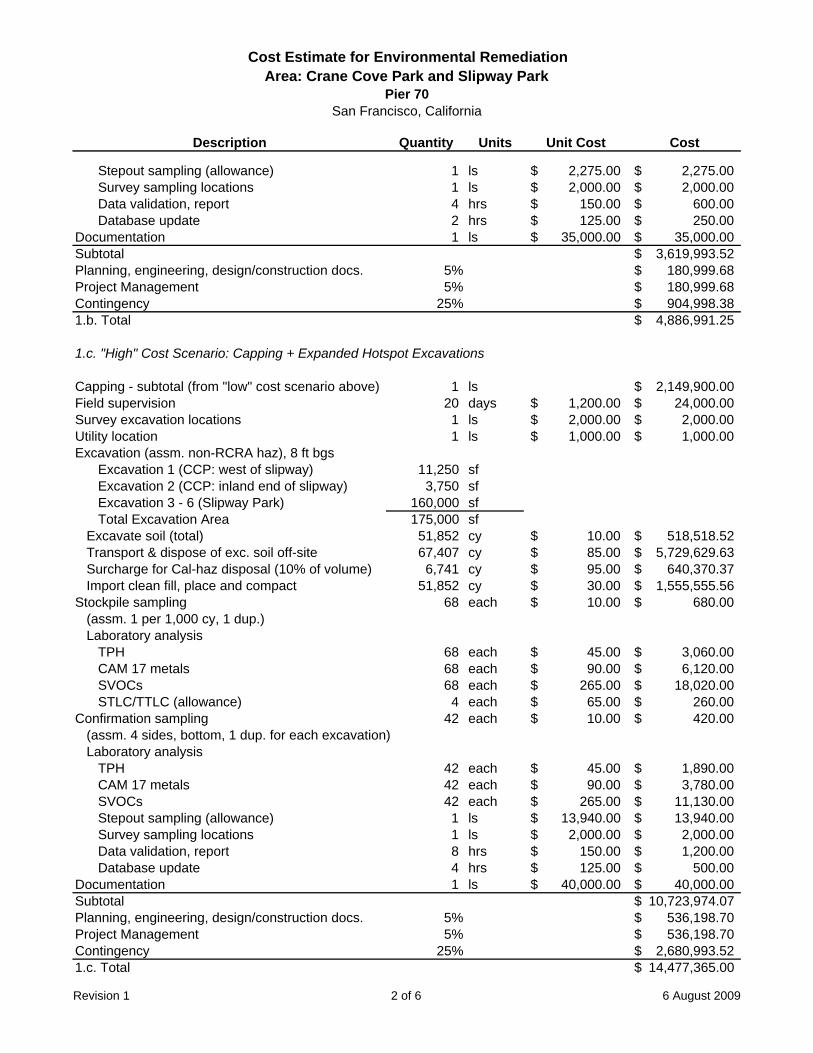
Stepout sampling (allowance) 1 ls 2,275.00$ 2,275.00$ Survey sampling locations 1 ls 2,000.00$ 2,000.00$ Data validation, report 4 hrs 150.00$ 600.00$ Database update 2 hrs 125.00$ 250.00$
Documentation 1 ls 35,000.00$ 35,000.00$ Subtotal 3,619,993.52$ Planning, engineering, design/construction docs. 5% 180,999.68$ Project Management 5% 180,999.68$ Contingency 25% 904,998.38$ 1.b. Total 4,886,991.25$
1.c. "High" Cost Scenario: Capping + Expanded Hotspot Excavations
Capping - subtotal (from "low" cost scenario above) 1 ls 2,149,900.00$ Field supervision 20 days 1,200.00$ 24,000.00$ Survey excavation locations 1 ls 2,000.00$ 2,000.00$ Utility location 1 ls 1,000.00$ 1,000.00$ Excavation (assm. non-RCRA haz), 8 ft bgs
Excavation 1 (CCP: west of slipway) 11,250 sfExcavation 2 (CCP: inland end of slipway) 3,750 sfExcavation 3 - 6 (Slipway Park) 160,000 sfTotal Excavation Area 175,000 sf
Excavate soil (total) 51,852 cy 10.00$ 518,518.52$ Transport & dispose of exc. soil off-site 67,407 cy 85.00$ 5,729,629.63$ Surcharge for Cal-haz disposal (10% of volume) 6,741 cy 95.00$ 640,370.37$ Import clean fill, place and compact 51,852 cy 30.00$ 1,555,555.56$
Stockpile sampling 68 each 10.00$ 680.00$ (assm. 1 per 1,000 cy, 1 dup.)Laboratory analysis
TPH 68 each 45.00$ 3,060.00$ CAM 17 metals 68 each 90.00$ 6,120.00$ SVOCs 68 each 265.00$ 18,020.00$ STLC/TTLC (allowance) 4 each 65.00$ 260.00$
Confirmation sampling 42 each 10.00$ 420.00$ (assm. 4 sides, bottom, 1 dup. for each excavation)Laboratory analysis
TPH 42 each 45.00$ 1,890.00$ CAM 17 metals 42 each 90.00$ 3,780.00$ SVOCs 42 each 265.00$ 11,130.00$ Stepout sampling (allowance) 1 ls 13,940.00$ 13,940.00$ Survey sampling locations 1 ls 2,000.00$ 2,000.00$ Data validation, report 8 hrs 150.00$ 1,200.00$ Database update 4 hrs 125.00$ 500.00$
Documentation 1 ls 40,000.00$ 40,000.00$ Subtotal 10,723,974.07$ Planning, engineering, design/construction docs. 5% 536,198.70$ Project Management 5% 536,198.70$ Contingency 25% 2,680,993.52$ 1.c. Total 14,477,365.00$
Revision 1 2 of 6 6 August 2009

Cost Estimate for Environmental RemediationArea: Crane Cove Park and Slipway Park
Pier 70San Francisco, California
Description Quantity Units Unit Cost Cost
2. Mass Excavation & Removal of Fill, RegradingAssm. removal of upper 2 ft of soil in limited areasAssm. import & placement of clean fill via capping (above)
2.a. "Low" Cost Scenario: Limited exc.
Field supervision 10 days 1,200.00$ 12,000.00$ Utility location 1 ls 2,000.00$ 2,000.00$ Excavation - debris, metal slag, soil
(assm. non-RCRA haz. disposal)Excavate soil, 25% of total area, 1 ft depth avg. 5,048 cy 10.00$ 50,475.85$ Transport & dispose of exc. soil off-site 6,562 cy 85.00$ 557,758.16$
Stockpile sampling 8 each 10.00$ 80.00$ (assm. 1 per 1,000 cy, 1 dup.)Laboratory analysis
TPH 8 each 45.00$ 360.00$ CAM 17 metals 8 each 90.00$ 720.00$ SVOCs 8 each 265.00$ 2,120.00$ STLC/TTLC (allowance) 2 each 65.00$ 130.00$
Survey excavation 1 ls 2,000.00$ 2,000.00$ Regrading 15,143 sy 5.00$ 75,713.78$ Database update 1 hrs 125.00$ 125.00$ Documentation 1 ls 15,000.00$ 15,000.00$ Subtotal 718,482.79$ Planning, engineering, design/construction docs. 15% 107,772.42$ Project Management 10% 71,848.28$ Contingency 30% 215,544.84$ 2.a. Total 1,113,648.33$
2.b. "Nominal" Cost Scenario: Limited exc.
Field supervision 15 days 1,200.00$ 18,000.00$ Utility location 1 ls 2,000.00$ 2,000.00$ Excavation - debris, metal slag, soil
(assm. non-RCRA haz. disposal)Excavate soil, 25% of total area, 2 ft depth avg. 10,095 cy 10.00$ 100,951.70$ Transport & dispose of exc. soil off-site 13,124 cy 85.00$ 1,115,516.33$
Stockpile sampling 11 each 10.00$ 110.00$ (assm. 1 per 1,000 cy, 1 dup.)Laboratory analysis
TPH 11 each 45.00$ 495.00$ CAM 17 metals 11 each 90.00$ 990.00$ SVOCs 11 each 265.00$ 2,915.00$ STLC/TTLC (allowance) 4 each 65.00$ 260.00$
Survey excavation 1 ls 2,000.00$ 2,000.00$ Regrading 5,556 sy 5.00$ 27,777.78$ Database update 2 hrs 125.00$ 250.00$ Documentation 1 ls 20,000.00$ 20,000.00$
Revision 1 3 of 6 6 August 2009
Cost Estimate for Environmental RemediationArea: Crane Cove Park and Slipway Park
Pier 70San Francisco, California
Description Quantity Units Unit Cost Cost
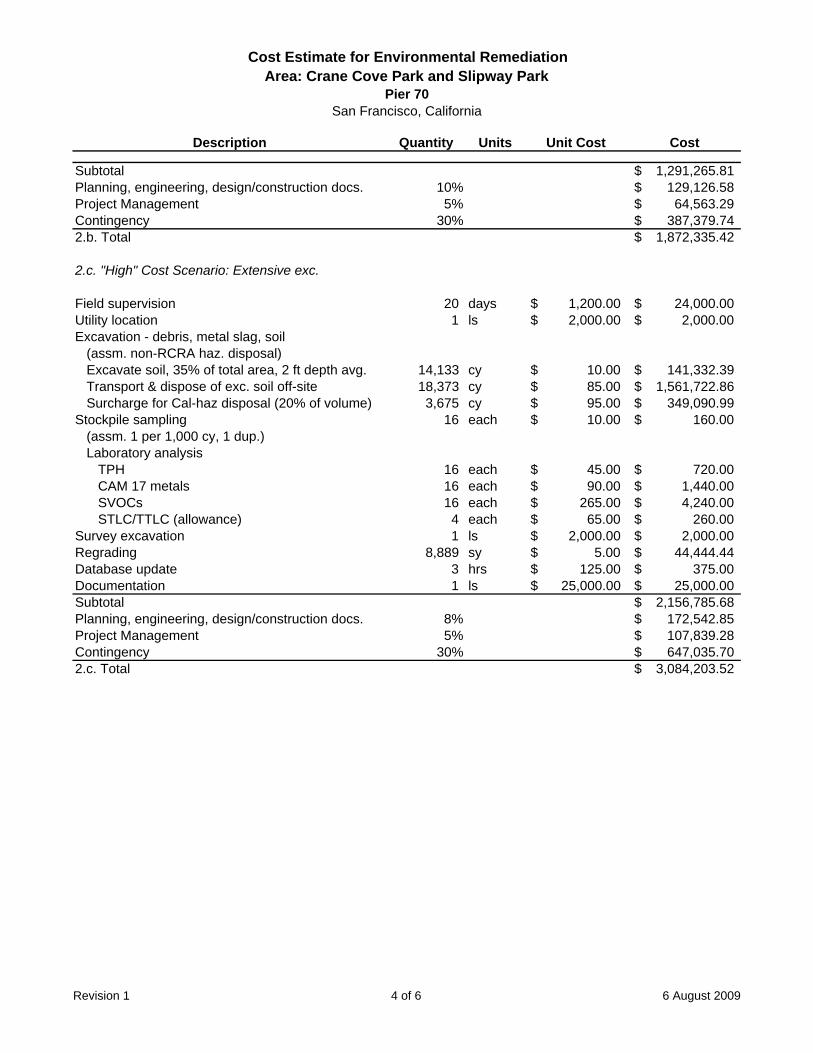
Subtotal 1,291,265.81$ Planning, engineering, design/construction docs. 10% 129,126.58$ Project Management 5% 64,563.29$ Contingency 30% 387,379.74$ 2.b. Total 1,872,335.42$
2.c. "High" Cost Scenario: Extensive exc.
Field supervision 20 days 1,200.00$ 24,000.00$ Utility location 1 ls 2,000.00$ 2,000.00$ Excavation - debris, metal slag, soil
(assm. non-RCRA haz. disposal)Excavate soil, 35% of total area, 2 ft depth avg. 14,133 cy 10.00$ 141,332.39$ Transport & dispose of exc. soil off-site 18,373 cy 85.00$ 1,561,722.86$ Surcharge for Cal-haz disposal (20% of volume) 3,675 cy 95.00$ 349,090.99$
Stockpile sampling 16 each 10.00$ 160.00$ (assm. 1 per 1,000 cy, 1 dup.)Laboratory analysis
TPH 16 each 45.00$ 720.00$ CAM 17 metals 16 each 90.00$ 1,440.00$ SVOCs 16 each 265.00$ 4,240.00$ STLC/TTLC (allowance) 4 each 65.00$ 260.00$
Survey excavation 1 ls 2,000.00$ 2,000.00$ Regrading 8,889 sy 5.00$ 44,444.44$ Database update 3 hrs 125.00$ 375.00$ Documentation 1 ls 25,000.00$ 25,000.00$ Subtotal 2,156,785.68$ Planning, engineering, design/construction docs. 8% 172,542.85$ Project Management 5% 107,839.28$ Contingency 30% 647,035.70$ 2.c. Total 3,084,203.52$
Revision 1 4 of 6 6 August 2009
Cost Estimate for Environmental RemediationArea: Crane Cove Park and Slipway Park
Pier 70San Francisco, California
Description Quantity Units Unit Cost Cost
3. Stabilization or Treatment of Near-Shore SedimentsAssm. purpose is protection of shoreline visitors/usersEst. approx. 1,200 lf of shoreline (500 lf at Crane Cove Park and 700 lf at Slipway Park)Assm. dilneation is complete or not needed
3.a. "Low" Cost Scenario: Minimal Action
Field supervision 10 days 1,200.00$ 12,000.00$ Furnish & install mats/webbing (1,200' x 20') 24,000 sf 12.00$ 288,000.00$ Furnish & install granular material (12 in. thick) 890 cy 50.00$ 44,500.00$ Documentation 1 ls 10,000.00$ 10,000.00$ Subtotal 354,500.00$ Planning, engineering, design/construction docs. 20% 70,900.00$ Project Management 10% 35,450.00$ Contingency 20% 70,900.00$ 3.a. Total 531,750.00$
3.b. "Nominal" Cost Scenario:In-situ treatment of sedimentsAssm. 1,200 ft of shoreline, 100 ft from shore, treat to depth of 1 ft.
Field supervision 30 days 1,200.00$ 36,000.00$ In-situ treatment with AC (turnkey service by sub) 120,000 sf 10.00$ 1,200,000.00$ Documentation 1 ls 75,000.00$ 75,000.00$ Subtotal 1,311,000.00$ Planning, engineering, design/construction docs. 20% 262,200.00$ Project Management 5% 65,550.00$ Contingency 20% 262,200.00$ 3.b. Total 1,900,950.00$
3.c. "High" Cost Scenario: Armored capAssm. 1,200 ft of shoreline, 100 ft from shore, stone cap
Field supervision 30 days 1,200.00$ 36,000.00$ Install armored cap (turnkey service by sub) 2.8 ac 529,600.00$ 1,458,953.17$ Fund for long-term O&M (NPV) & monitoring 1 ls 500,000.00$ 500,000.00$ Documentation 1 ls 100,000.00$ 100,000.00$ Subtotal 2,094,953.17$ Planning, engineering, design/construction docs. 15% 314,242.98$ Project Management 5% 104,747.66$ Contingency 20% 418,990.63$ 3.c. Total 2,932,934.44$
Revision 1 5 of 6 6 August 2009

Cost Estimate for Environmental RemediationArea: Crane Cove Park and Slipway Park
Pier 70San Francisco, California
Description Quantity Units Unit Cost Cost
4. LBP and ACM AbatementBasis: M.Lee cost estimate for haz-mat abatement (July 2008)If no estimate by M.Lee, then assm. $50-$75/sf of building footprint area
Building 6: Light Warehouse #6 1 ls 2,910,000.00$ 2,910,000.00$ Building 50: (Pier 68 (Slip #4) Substation #2 1 ls 80,000.00$ 80,000.00$ Building 52: within BAE lease 20,000 sf 50.00$ 1,000,000.00$ Building 110: Yard Washroom & Locker Room 1 ls 260,000.00$ 260,000.00$ Subtotal 4,250,000.00$ Planning, engineering, design/construction docs. 10% 425,000.00$ Project Management 10% 425,000.00$ Contingency 20% 850,000.00$ 4. Total 5,950,000.00$
Note:1. LBP and ACM abatement costs are included in Table 2, but are not included in the probabilistic cost model (Figures 2 and 3).
Revision 1 6 of 6 6 August 2009

Detailed Cost EstimateParcels 1 and 3

Cost Estimate for Environmental RemediationArea: Parcel 1 and Parcel 3
Pier 70San Francisco, California
Description Quantity Units Unit Cost Cost
1. Impacted Soils
1.a. "Low" Cost Scenario: Capping onlyTotal area, excluding buildings, Parcel 1: 35,010 sfTotal area, excluding buildings, Parcel 3: 25,700 sfTotal area, excluding buildings: 60,710 sf
Field supervision 5 days 1,200.00$ 6,000.00$ Selective light demolition 1,124 cy 15.00$ 16,863.89$
(assm. (E) pavement/cap in poor condition)Dispose of demolition debris (non-haz) 1,124 cy 30.00$ 33,727.78$ Import, place, compact 2-ft soil cover 60,710 sf
Import clean fill 4,497 cy 30.00$ 134,911.11$ Place, compact 6-inch lifts 4,497 cy 5.00$ 22,485.19$ Hydroseed (native grasses) 1.0 ac 20,000.00$ 20,000.00$
Documentation 1 ls 15,000.00$ 15,000.00$ Subtotal 248,987.96$ Planning, engineering, design/construction docs. 10% 24,898.80$ Project Management 10% 24,898.80$ Contingency 20% 49,797.59$ 1.a. Total 348,583.15$
1.b. "Nominal" Cost Scenario: Capping + Ltd Hotspot Excavation
Capping - subtotal (from "low" cost scenario above) 1 ls 248,987.96$ Field supervision 5 days 1,200.00$ 6,000.00$ Survey excavation location 1 ls 1,000.00$ 1,000.00$ Utility location 1 ls 1,000.00$ 1,000.00$ Excavation (assm. non-RCRA haz), 5 ft bgs
Excavation 1 (Parcel 1) 10,000 sfExcavation 2 (Parcel 3) 20,000 sfExcavation 3 - 4 (Parcel 3) 5,000 sfTotal Excavation Area 35,000 sf
Excavate soil (total) 6,481 cy 10.00$ 64,814.81$ Transport & dispose of exc. soil off-site 8,426 cy 85.00$ 716,203.70$ Import clean fill, place and compact 6,481 cy 30.00$ 194,444.44$
Stockpile sampling 7 each 10.00$ 70.00$ (assm. 1 per 1,000 cy, 1 dup.)Laboratory analysis
TPH 7 each 45.00$ 315.00$ CAM 17 metals 7 each 90.00$ 630.00$ SVOCs 7 each 265.00$ 1,855.00$ STLC/TTLC (allowance) 2 each 65.00$ 130.00$
Confirmation sampling 28 each 10.00$ 280.00$ (assm. 4 sides, bottom, 1 dup. for each excavation)Laboratory analysis
TPH 28 each 45.00$ 1,260.00$ CAM 17 metals 28 each 90.00$ 2,520.00$ SVOCs 28 each 265.00$ 7,420.00$
Revision 1 1 of 4 6 August 2009
Cost Estimate for Environmental RemediationArea: Parcel 1 and Parcel 3
Pier 70San Francisco, California
Description Quantity Units Unit Cost Cost
Stepout sampling (allowance) 1 ls 1,605.00$ 1,605.00$ Survey sampling locations 1 ls 500.00$ 500.00$ Data validation, report 4 hrs 150.00$ 600.00$ Database update 2 hrs 125.00$ 250.00$
Documentation 1 ls 20,000.00$ 20,000.00$ Subtotal 1,269,885.93$ Planning, engineering, design/construction docs. 5% 63,494.30$ Project Management 5% 63,494.30$ Contingency 25% 317,471.48$ 1.b. Total 1,714,346.00$
1.c. "High" Cost Scenario: Capping + Expanded Hotspot Excavations
Capping - subtotal 1 ls 248,987.96$ Field supervision 8 days 1,200.00$ 9,600.00$ Survey excavation location 1 ls 2,000.00$ 2,000.00$ Utility location 1 ls 1,000.00$ 1,000.00$ Excavation (assm. non-RCRA haz), 8 ft bgs
Excavation 1 (Parcel 1) 15,000 sfExcavation 2 (Parcel 3) 30,000 sfExcavation 3 - 4 (Parcel 3) 7,500 sfTotal Excavation Area 52,500 sf
Excavate soil (total) 15,556 cy 10.00$ 155,555.56$ Transport & dispose of exc. soil off-site 20,222 cy 85.00$ 1,718,888.89$ Surcharge for Cal-haz disposal (10% of volume) 2,022 cy 95.00$ 192,111.11$ Import clean fill, place and compact 15,556 cy 30.00$ 466,666.67$
Stockpile sampling 21 each 10.00$ 210.00$ (assm. 1 per 1,000 cy, 1 dup.)Laboratory analysis
TPH 21 each 45.00$ 945.00$ CAM 17 metals 21 each 90.00$ 1,890.00$ SVOCs 21 each 265.00$ 5,565.00$ STLC/TTLC (allowance) 4 each 65.00$ 260.00$
Confirmation sampling 28 each 10.00$ 280.00$ (assm. 4 sides, bottom, 1 dup. for each excavation)Laboratory analysis
TPH 28 each 45.00$ 1,260.00$ CAM 17 metals 28 each 90.00$ 2,520.00$ SVOCs 28 each 265.00$ 7,420.00$ Stepout sampling (allowance) 1 ls 4,470.00$ 4,470.00$ Survey sampling locations 1 ls 2,000.00$ 2,000.00$ Data validation, report 8 hrs 150.00$ 1,200.00$ Database update 4 hrs 125.00$ 500.00$
Documentation 1 ls 30,000.00$ 30,000.00$ Subtotal 2,853,330.19$ Planning, engineering, design/construction docs. 5% 142,666.51$ Project Management 5% 142,666.51$ Contingency 25% 713,332.55$ 1.c. Total 3,851,995.75$
Revision 1 2 of 4 6 August 2009
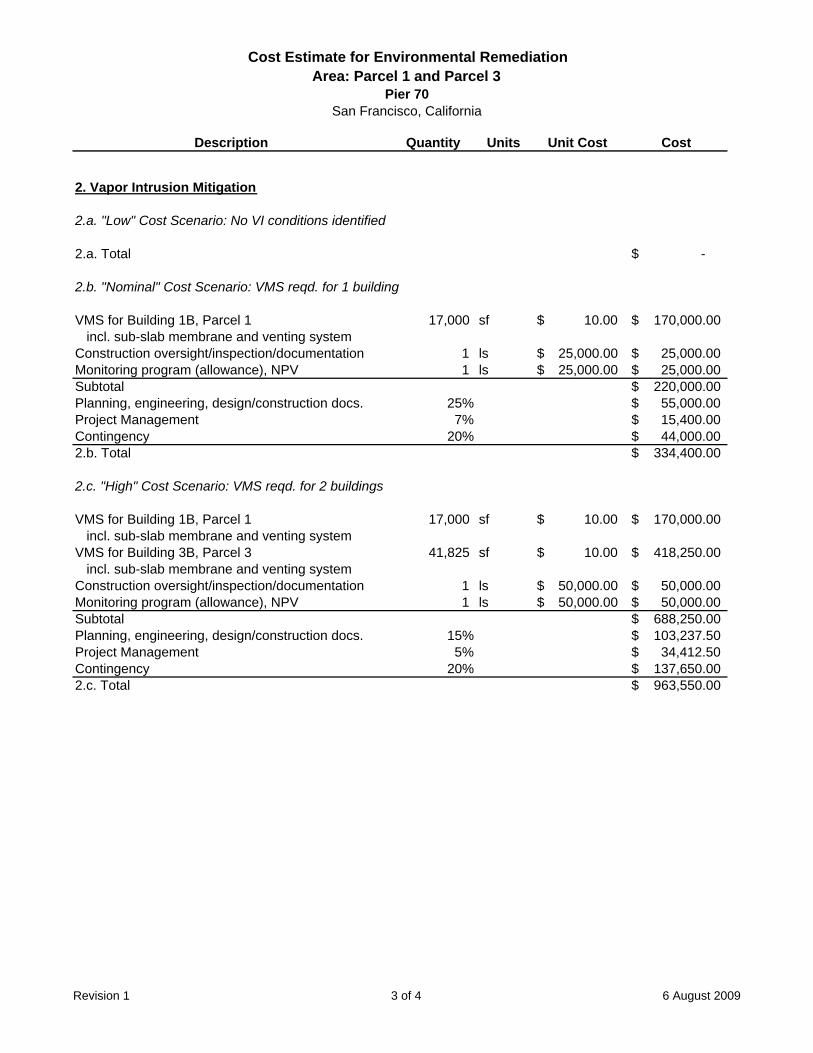
Cost Estimate for Environmental RemediationArea: Parcel 1 and Parcel 3
Pier 70San Francisco, California
Description Quantity Units Unit Cost Cost
2. Vapor Intrusion Mitigation
2.a. "Low" Cost Scenario: No VI conditions identified
2.a. Total -$
2.b. "Nominal" Cost Scenario: VMS reqd. for 1 building
VMS for Building 1B, Parcel 1 17,000 sf 10.00$ 170,000.00$ incl. sub-slab membrane and venting system
Construction oversight/inspection/documentation 1 ls 25,000.00$ 25,000.00$ Monitoring program (allowance), NPV 1 ls 25,000.00$ 25,000.00$ Subtotal 220,000.00$ Planning, engineering, design/construction docs. 25% 55,000.00$ Project Management 7% 15,400.00$ Contingency 20% 44,000.00$ 2.b. Total 334,400.00$
2.c. "High" Cost Scenario: VMS reqd. for 2 buildings
VMS for Building 1B, Parcel 1 17,000 sf 10.00$ 170,000.00$ incl. sub-slab membrane and venting system
VMS for Building 3B, Parcel 3 41,825 sf 10.00$ 418,250.00$ incl. sub-slab membrane and venting system
Construction oversight/inspection/documentation 1 ls 50,000.00$ 50,000.00$ Monitoring program (allowance), NPV 1 ls 50,000.00$ 50,000.00$ Subtotal 688,250.00$ Planning, engineering, design/construction docs. 15% 103,237.50$ Project Management 5% 34,412.50$ Contingency 20% 137,650.00$ 2.c. Total 963,550.00$
Revision 1 3 of 4 6 August 2009

Cost Estimate for Environmental RemediationArea: Parcel 1 and Parcel 3
Pier 70San Francisco, California
Description Quantity Units Unit Cost Cost
3. LBP and ACM AbatementBasis: M.Lee cost estimate for haz-mat abatement (July 2008)If no estimate by M.Lee, then assm. $50-$75/sf of building footprint area
Twigg/Kneass Building 7,550 sf 50.00$ 377,500.00$ Subtotal 377,500.00$ Planning, engineering, design/construction docs. 10% 37,750.00$ Project Management 10% 37,750.00$ Contingency 20% 75,500.00$ 3. Total 528,500.00$
Note:1. LBP and ACM abatement costs are included in Table 2, but are not included in the probabilistic cost model (Figures 2 and 3).
Revision 1 4 of 4 6 August 2009
Detailed Cost EstimateParcels 2 and 4

Cost Estimate for Environmental RemediationArea: Parcels 2 and 4
Pier 70San Francisco, California
Description Quantity Units Unit Cost Cost
1. Impacted Soils
1.a. "Low" Cost Scenario: Capping onlyTotal area, excluding buildings, Parcel 2: 80,367 sfTotal area, excluding buildings, Parcel 4: 43,945 sfTotal area, excluding buildings, all parcels: 124,311 sf
Field supervision 10 days 1,200.00$ 12,000.00$ Selective light demolition 2,302 cy 15.00$ 34,530.94$
(assm. (E) pavement/cap in poor condition)Dispose of demolition debris (non-haz) 2,302 cy 30.00$ 69,061.89$ Import, place, compact 2-ft soil cover 124,311 sf
Import clean fill 9,208 cy 30.00$ 276,247.56$ Place, compact 6-inch lifts 9,208 cy 5.00$ 46,041.26$ Hydroseed (native grasses) 3.0 ac 20,000.00$ 60,000.00$
Documentation 1 ls 20,000.00$ 20,000.00$ Subtotal 517,881.65$ Planning, engineering, design/construction docs. 15% 77,682.25$ Project Management 10% 51,788.16$ Contingency 20% 103,576.33$ 1.a. Total 750,928.39$
1.b. "Nominal" Cost Scenario: Capping + Ltd Hotspot Excavation
Capping - subtotal (from "low" cost scenario above) 1 ls 517,881.65$ Field supervision 10 days 1,200.00$ 12,000.00$ Survey excavation location 1 ls 1,000.00$ 1,000.00$ Utility location 1 ls 1,000.00$ 1,000.00$ Excavation (assm. non-RCRA haz), 5 ft bgs
Excavation 1 - 3 (Parcel 2, PAHs) 42,500 sfExcavation 4 - 5 (Parcel 2, metals) 20,625 sfExcavation 6 - 10 (assm. Parcel 3 similar to 2) 34,517 sfTotal Excavation Area 97,642 sf
Excavate soil (total) 18,082 cy 10.00$ 180,818.55$ Transport & dispose of exc. soil off-site 23,506 cy 85.00$ 1,998,045.03$ Import clean fill, place and compact 18,082 cy 30.00$ 542,455.66$
Stockpile sampling 19 each 10.00$ 190.00$ (assm. 1 per 1,000 cy, 1 dup.)Laboratory analysis
TPH 19 each 45.00$ 855.00$ CAM 17 metals 19 each 90.00$ 1,710.00$ SVOCs 19 each 265.00$ 5,035.00$ STLC/TTLC (allowance) 2 each 65.00$ 130.00$
Confirmation sampling 70 each 10.00$ 700.00$ (assm. 4 sides, bottom, 1 dup. for each excavation)Laboratory analysis
TPH 70 each 45.00$ 3,150.00$ CAM 17 metals 70 each 90.00$ 6,300.00$ SVOCs 70 each 265.00$ 18,550.00$
Revision 1 1 of 5 6 August 2009
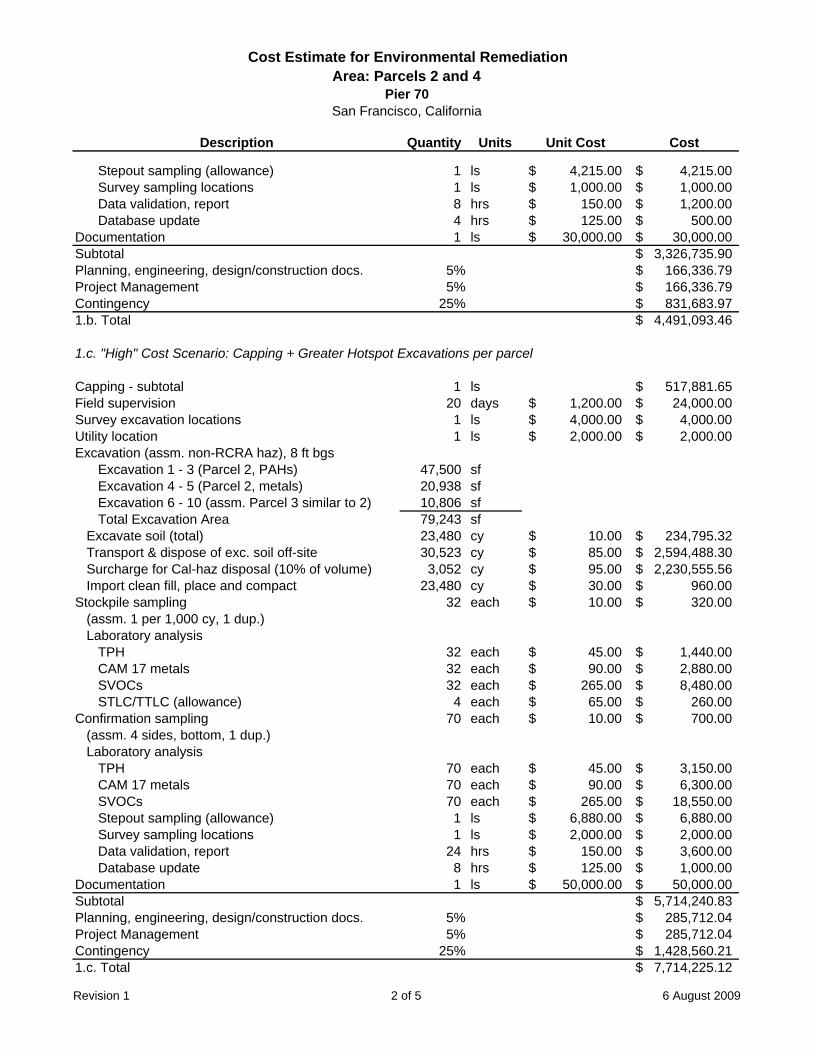
Cost Estimate for Environmental RemediationArea: Parcels 2 and 4
Pier 70San Francisco, California
Description Quantity Units Unit Cost Cost
Stepout sampling (allowance) 1 ls 4,215.00$ 4,215.00$ Survey sampling locations 1 ls 1,000.00$ 1,000.00$ Data validation, report 8 hrs 150.00$ 1,200.00$ Database update 4 hrs 125.00$ 500.00$
Documentation 1 ls 30,000.00$ 30,000.00$ Subtotal 3,326,735.90$ Planning, engineering, design/construction docs. 5% 166,336.79$ Project Management 5% 166,336.79$ Contingency 25% 831,683.97$ 1.b. Total 4,491,093.46$
1.c. "High" Cost Scenario: Capping + Greater Hotspot Excavations per parcel
Capping - subtotal 1 ls 517,881.65$ Field supervision 20 days 1,200.00$ 24,000.00$ Survey excavation locations 1 ls 4,000.00$ 4,000.00$ Utility location 1 ls 2,000.00$ 2,000.00$ Excavation (assm. non-RCRA haz), 8 ft bgs
Excavation 1 - 3 (Parcel 2, PAHs) 47,500 sfExcavation 4 - 5 (Parcel 2, metals) 20,938 sfExcavation 6 - 10 (assm. Parcel 3 similar to 2) 10,806 sfTotal Excavation Area 79,243 sf
Excavate soil (total) 23,480 cy 10.00$ 234,795.32$ Transport & dispose of exc. soil off-site 30,523 cy 85.00$ 2,594,488.30$ Surcharge for Cal-haz disposal (10% of volume) 3,052 cy 95.00$ 2,230,555.56$ Import clean fill, place and compact 23,480 cy 30.00$ 960.00$
Stockpile sampling 32 each 10.00$ 320.00$ (assm. 1 per 1,000 cy, 1 dup.)Laboratory analysis
TPH 32 each 45.00$ 1,440.00$ CAM 17 metals 32 each 90.00$ 2,880.00$ SVOCs 32 each 265.00$ 8,480.00$ STLC/TTLC (allowance) 4 each 65.00$ 260.00$
Confirmation sampling 70 each 10.00$ 700.00$ (assm. 4 sides, bottom, 1 dup.)Laboratory analysis
TPH 70 each 45.00$ 3,150.00$ CAM 17 metals 70 each 90.00$ 6,300.00$ SVOCs 70 each 265.00$ 18,550.00$ Stepout sampling (allowance) 1 ls 6,880.00$ 6,880.00$ Survey sampling locations 1 ls 2,000.00$ 2,000.00$ Data validation, report 24 hrs 150.00$ 3,600.00$ Database update 8 hrs 125.00$ 1,000.00$
Documentation 1 ls 50,000.00$ 50,000.00$ Subtotal 5,714,240.83$ Planning, engineering, design/construction docs. 5% 285,712.04$ Project Management 5% 285,712.04$ Contingency 25% 1,428,560.21$ 1.c. Total 7,714,225.12$
Revision 1 2 of 5 6 August 2009

Cost Estimate for Environmental RemediationArea: Parcels 2 and 4
Pier 70San Francisco, California
Description Quantity Units Unit Cost Cost
2. Vapor Intrusion Mitigation
2.a. "Low" Cost ScenarioAssm. Needed due to low-level UST residuals @ Bldg. 113
Retrofit VMS for Building 113 (25%), Parcel 4 21,028 sf 7.00$ 147,194.25$ incl. sub-slab venting system, no membraneConstruction oversight/inspection/documentation 1 ls 20,000.00$ 20,000.00$
Monitoring program (allowance), NPV 1 ls 25,000.00$ 25,000.00$ Subtotal 192,194.25$ Planning, engineering, design/construction docs. 15% 28,829.14$ Project Management 10% 19,219.43$ Contingency 20% 38,438.85$ 2.a. Total 278,681.66$
2.b. "Nominal" Cost ScenarioAssm. needed due to elevated UST residuals @ Bldg. 113
Retrofit VMS for Building 113 (25%), Parcel 4 21,028 sf 7.00$ 147,194.25$ incl. sub-slab venting system, no membraneConstruction oversight/inspection/documentation 1 ls 20,000.00$ 20,000.00$
Retrofit VMS for Building 14, Parcel 4 16,315 sf 7.00$ 114,205.00$ incl. sub-slab venting system, no membraneConstruction oversight/inspection/documentation 1 ls 15,000.00$ 15,000.00$
Monitoring program (allowance), NPV 1 ls 50,000.00$ 50,000.00$ Subtotal 346,399.25$ Planning, engineering, design/construction docs. 25% 86,599.81$ Project Management 10% 34,639.93$ Contingency 20% 69,279.85$ 2.b. Total 536,918.84$
2.c. "High" Cost ScenarioAssm. needed due to elevated UST residuals @ Bldg. 113
Retrofit VMS for Building 113 (25%), Parcel 4 21,028 sf 7.00$ 147,194.25$ incl. sub-slab venting system, no membraneConstruction oversight/inspection/documentation 1 ls 15,000.00$ 15,000.00$
Retrofit VMS for Building 14, Parcel 4 16,315 sf 7.00$ 114,205.00$ incl. sub-slab venting system, no membraneConstruction oversight/inspection/documentation 1 ls 15,000.00$ 15,000.00$
Retrofit VMS for Building 103, Parcel 9 3,000 sf 7.00$ 21,000.00$ incl. sub-slab venting system, no membraneConstruction oversight/inspection/documentation 1 ls 10,000.00$ 10,000.00$
Monitoring program (allowance), NPV 1 ls 75,000.00$ 75,000.00$ Subtotal 397,399.25$ Planning, engineering, design/construction docs. 25% 99,349.81$ Project Management 10% 39,739.93$ Contingency 20% 79,479.85$ 2.c. Total 615,968.84$
Revision 1 3 of 5 6 August 2009
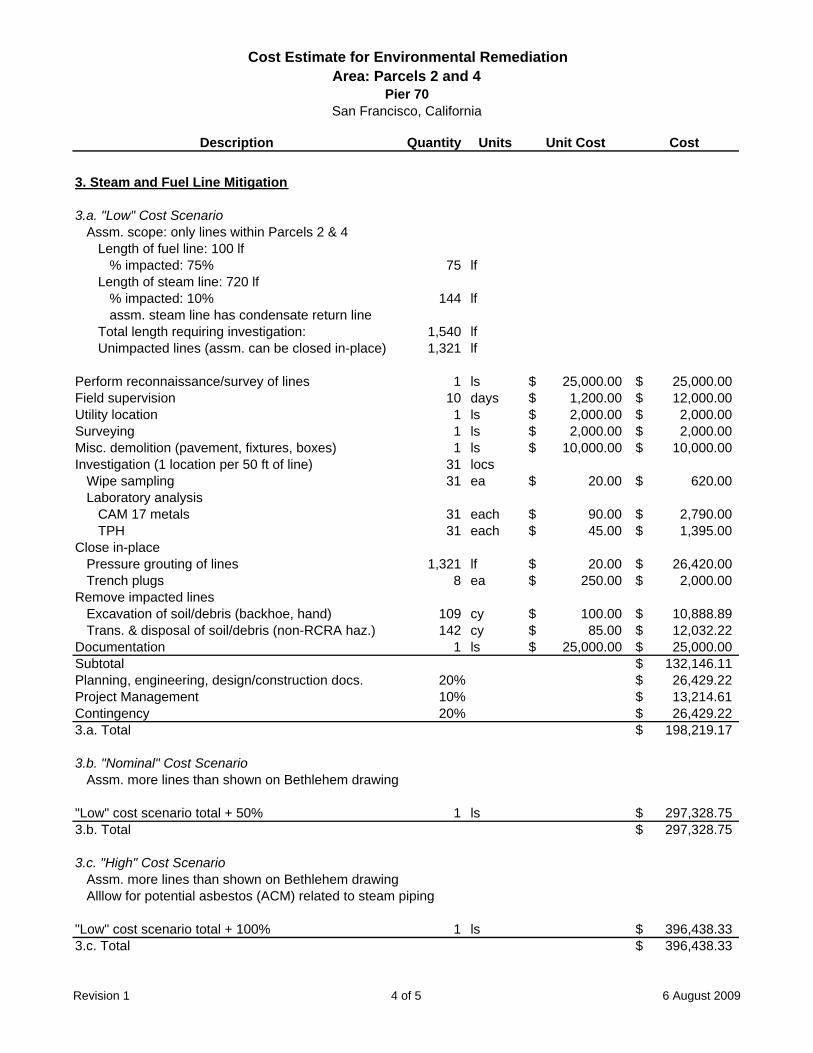
Cost Estimate for Environmental RemediationArea: Parcels 2 and 4
Pier 70San Francisco, California
Description Quantity Units Unit Cost Cost
3. Steam and Fuel Line Mitigation
3.a. "Low" Cost ScenarioAssm. scope: only lines within Parcels 2 & 4
Length of fuel line: 100 lf% impacted: 75% 75 lf
Length of steam line: 720 lf% impacted: 10% 144 lfassm. steam line has condensate return line
Total length requiring investigation: 1,540 lfUnimpacted lines (assm. can be closed in-place) 1,321 lf
Perform reconnaissance/survey of lines 1 ls 25,000.00$ 25,000.00$ Field supervision 10 days 1,200.00$ 12,000.00$ Utility location 1 ls 2,000.00$ 2,000.00$ Surveying 1 ls 2,000.00$ 2,000.00$ Misc. demolition (pavement, fixtures, boxes) 1 ls 10,000.00$ 10,000.00$ Investigation (1 location per 50 ft of line) 31 locs
Wipe sampling 31 ea 20.00$ 620.00$ Laboratory analysis
CAM 17 metals 31 each 90.00$ 2,790.00$ TPH 31 each 45.00$ 1,395.00$
Close in-placePressure grouting of lines 1,321 lf 20.00$ 26,420.00$ Trench plugs 8 ea 250.00$ 2,000.00$
Remove impacted linesExcavation of soil/debris (backhoe, hand) 109 cy 100.00$ 10,888.89$ Trans. & disposal of soil/debris (non-RCRA haz.) 142 cy 85.00$ 12,032.22$
Documentation 1 ls 25,000.00$ 25,000.00$ Subtotal 132,146.11$ Planning, engineering, design/construction docs. 20% 26,429.22$ Project Management 10% 13,214.61$ Contingency 20% 26,429.22$ 3.a. Total 198,219.17$
3.b. "Nominal" Cost ScenarioAssm. more lines than shown on Bethlehem drawing
"Low" cost scenario total + 50% 1 ls 297,328.75$ 3.b. Total 297,328.75$
3.c. "High" Cost ScenarioAssm. more lines than shown on Bethlehem drawingAlllow for potential asbestos (ACM) related to steam piping
"Low" cost scenario total + 100% 1 ls 396,438.33$ 3.c. Total 396,438.33$
Revision 1 4 of 5 6 August 2009

Cost Estimate for Environmental RemediationArea: Parcels 2 and 4
Pier 70San Francisco, California
Description Quantity Units Unit Cost Cost
4. LBP and ACM AbatementBasis: M.Lee cost estimate for haz-mat abatement (July 2008)If no estimate by M.Lee, then assm. $50-$75/sf of building footprint area
Parcel 2:Building 101 (UIW Main Office/Admin. Building) 1 ls 3,640,000.00$ 2,590,000.00$ Building 102 (Powerhouse #1) 1 ls 650,000.00$ 650,000.00$ Building 104 (UIW Office/Indust. Relations Bldg.) 1 ls 2,590,000.00$ 2,590,000.00$
Parcel 4:Building 113-114 (Union Iron Work Machine Shop) 1 ls 7,160,000.00$ 7,160,000.00$ Building 115-116 (Foundry and Warehouse) 1 ls 4,500,000.00$ 4,500,000.00$
Subtotal 17,490,000.00$ Planning, engineering, design/construction docs. 5% 874,500.00$ Project Management 5% 874,500.00$ Contingency 20% 3,498,000.00$ 4. Total 17,490,000.00$
Note:1. LBP and ACM abatement costs are included in Table 2, but are not included in the probabilistic cost model (Figures 2 and 3).
Revision 1 5 of 5 6 August 2009

Detailed Cost EstimateParcels 5, 6, 7 and 8
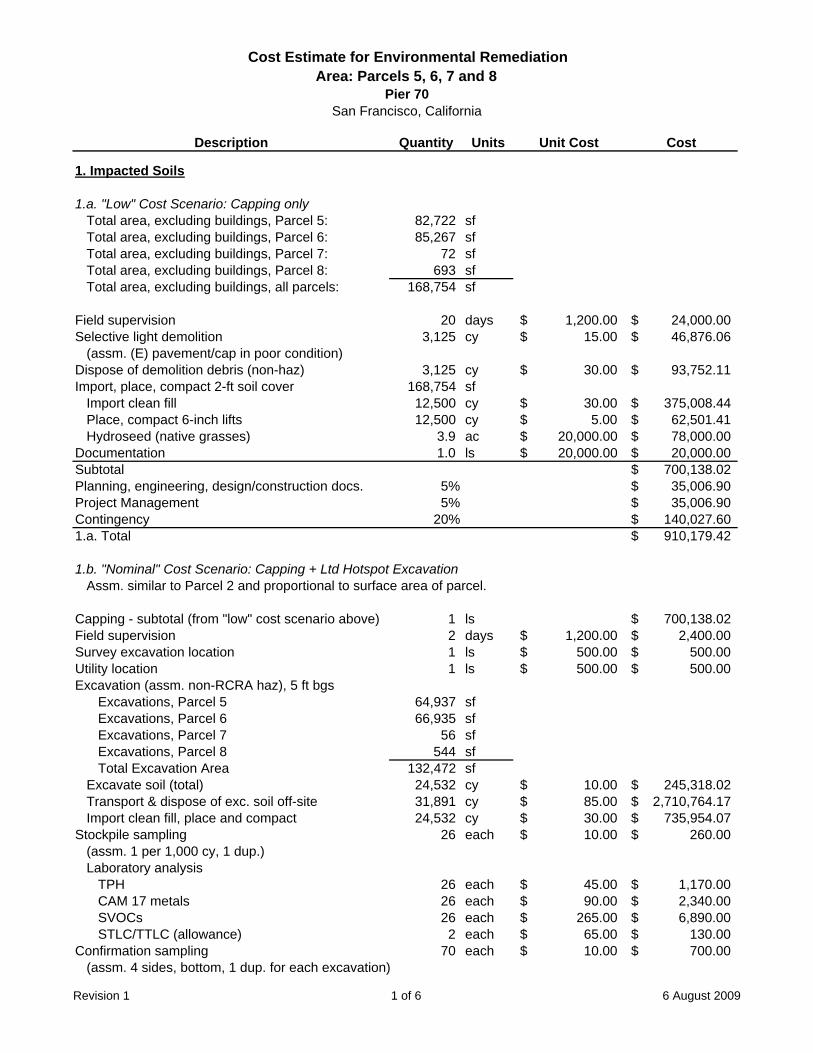
Cost Estimate for Environmental RemediationArea: Parcels 5, 6, 7 and 8
Pier 70San Francisco, California
Description Quantity Units Unit Cost Cost
1. Impacted Soils
1.a. "Low" Cost Scenario: Capping onlyTotal area, excluding buildings, Parcel 5: 82,722 sfTotal area, excluding buildings, Parcel 6: 85,267 sfTotal area, excluding buildings, Parcel 7: 72 sfTotal area, excluding buildings, Parcel 8: 693 sfTotal area, excluding buildings, all parcels: 168,754 sf
Field supervision 20 days 1,200.00$ 24,000.00$ Selective light demolition 3,125 cy 15.00$ 46,876.06$
(assm. (E) pavement/cap in poor condition)Dispose of demolition debris (non-haz) 3,125 cy 30.00$ 93,752.11$ Import, place, compact 2-ft soil cover 168,754 sf
Import clean fill 12,500 cy 30.00$ 375,008.44$ Place, compact 6-inch lifts 12,500 cy 5.00$ 62,501.41$ Hydroseed (native grasses) 3.9 ac 20,000.00$ 78,000.00$
Documentation 1.0 ls 20,000.00$ 20,000.00$ Subtotal 700,138.02$ Planning, engineering, design/construction docs. 5% 35,006.90$ Project Management 5% 35,006.90$ Contingency 20% 140,027.60$ 1.a. Total 910,179.42$
1.b. "Nominal" Cost Scenario: Capping + Ltd Hotspot ExcavationAssm. similar to Parcel 2 and proportional to surface area of parcel.
Capping - subtotal (from "low" cost scenario above) 1 ls 700,138.02$ Field supervision 2 days 1,200.00$ 2,400.00$ Survey excavation location 1 ls 500.00$ 500.00$ Utility location 1 ls 500.00$ 500.00$ Excavation (assm. non-RCRA haz), 5 ft bgs
Excavations, Parcel 5 64,937 sfExcavations, Parcel 6 66,935 sfExcavations, Parcel 7 56 sfExcavations, Parcel 8 544 sfTotal Excavation Area 132,472 sf
Excavate soil (total) 24,532 cy 10.00$ 245,318.02$ Transport & dispose of exc. soil off-site 31,891 cy 85.00$ 2,710,764.17$ Import clean fill, place and compact 24,532 cy 30.00$ 735,954.07$
Stockpile sampling 26 each 10.00$ 260.00$ (assm. 1 per 1,000 cy, 1 dup.)Laboratory analysis
TPH 26 each 45.00$ 1,170.00$ CAM 17 metals 26 each 90.00$ 2,340.00$ SVOCs 26 each 265.00$ 6,890.00$ STLC/TTLC (allowance) 2 each 65.00$ 130.00$
Confirmation sampling 70 each 10.00$ 700.00$ (assm. 4 sides, bottom, 1 dup. for each excavation)
Revision 1 1 of 6 6 August 2009

Cost Estimate for Environmental RemediationArea: Parcels 5, 6, 7 and 8
Pier 70San Francisco, California
Description Quantity Units Unit Cost Cost
Laboratory analysisTPH 70 each 45.00$ 3,150.00$ CAM 17 metals 70 each 90.00$ 6,300.00$ SVOCs 70 each 265.00$ 18,550.00$ Stepout sampling (allowance) 1 ls 5,615.00$ 5,615.00$ Survey sampling locations 1 ls 500.00$ 500.00$ Data validation, report 3 hrs 150.00$ 450.00$ Database update 2 hrs 125.00$ 250.00$
Documentation 1.0 ls 50,000.00$ 50,000.00$ Subtotal 4,491,879.28$ Planning, engineering, design/construction docs. 5% 224,593.96$ Project Management 5% 224,593.96$ Contingency 25% 1,122,969.82$ 1.b. Total 6,064,037.03$
1.c. "High" Cost Scenario: Capping + Expanded Hotspot Excavations
Capping - subtotal 1 ls 700,138.02$ Field supervision 20 days 1,200.00$ 24,000.00$ Survey excavation location 1 ls 2,000.00$ 2,000.00$ Utility location 1 ls 1,000.00$ 1,000.00$ Excavation (assm. non-RCRA haz), 8 ft bgs
Excavations, Parcel 5 97,405 sfExcavations, Parcel 6 100,402 sfExcavations, Parcel 7 84 sfExcavations, Parcel 8 816 sfTotal Excavation Area 198,708 sf
Excavate soil (total) 58,876 cy 10.00$ 588,763.26$ Transport & dispose of exc. soil off-site 76,539 cy 85.00$ 6,505,834.00$ Surcharge for Cal-haz disposal (20% of volume) 15,308 cy 95.00$ 1,454,245.25$ Import clean fill, place and compact 58,876 cy 30.00$ 1,766,289.77$
Stockpile sampling 78 each 10.00$ 780.00$ (assm. 1 per 1,000 cy, 1 dup.)Laboratory analysis
TPH 78 each 45.00$ 3,510.00$ CAM 17 metals 78 each 90.00$ 7,020.00$ SVOCs 78 each 265.00$ 20,670.00$ STLC/TTLC (allowance) 4 each 65.00$ 260.00$
Confirmation sampling 70 each 10.00$ 700.00$ (assm. 4 sides, bottom, 1 dup.)Laboratory analysis
TPH 70 each 45.00$ 3,150.00$ CAM 17 metals 70 each 90.00$ 6,300.00$ SVOCs 70 each 265.00$ 18,550.00$ Stepout sampling (allowance) 1 ls 16,080.00$ 16,080.00$ Survey sampling locations 1 ls 2,000.00$ 2,000.00$ Data validation, report 12 hrs 150.00$ 1,800.00$ Database update 8 hrs 125.00$ 1,000.00$
Documentation 1.0 ls 35,000.00$ 35,000.00$
Revision 1 2 of 6 6 August 2009
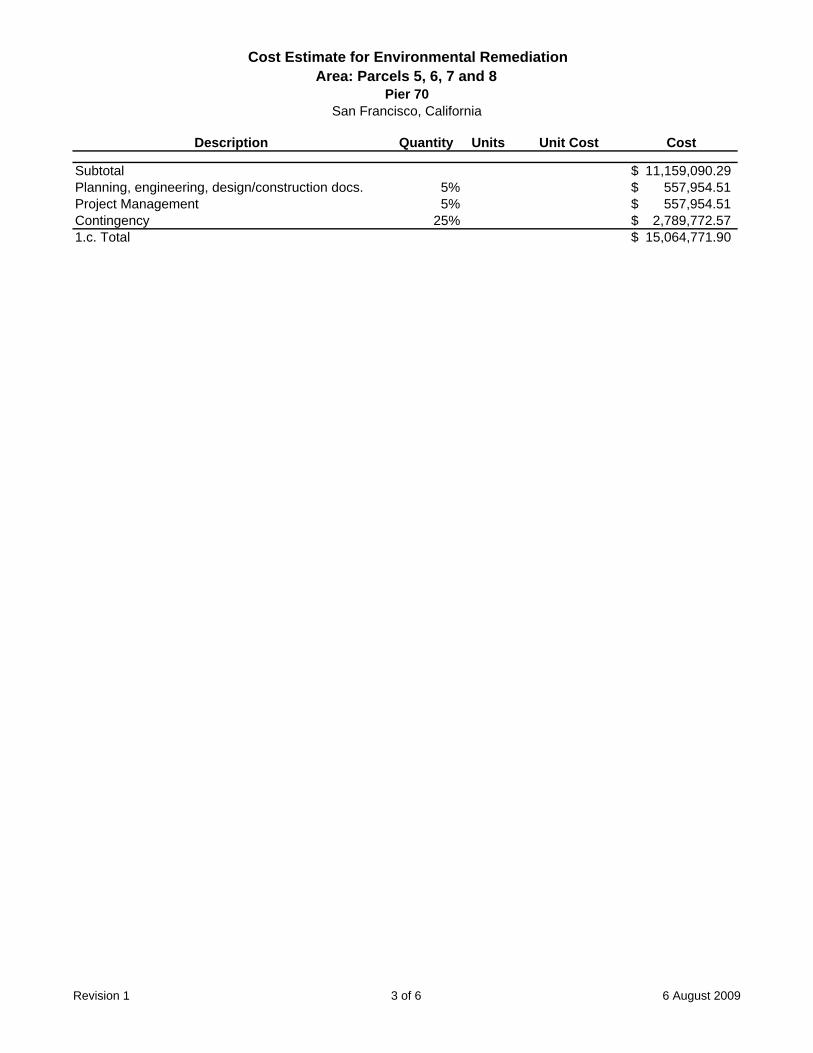
Cost Estimate for Environmental RemediationArea: Parcels 5, 6, 7 and 8
Pier 70San Francisco, California
Description Quantity Units Unit Cost Cost
Subtotal 11,159,090.29$ Planning, engineering, design/construction docs. 5% 557,954.51$ Project Management 5% 557,954.51$ Contingency 25% 2,789,772.57$ 1.c. Total 15,064,771.90$
Revision 1 3 of 6 6 August 2009
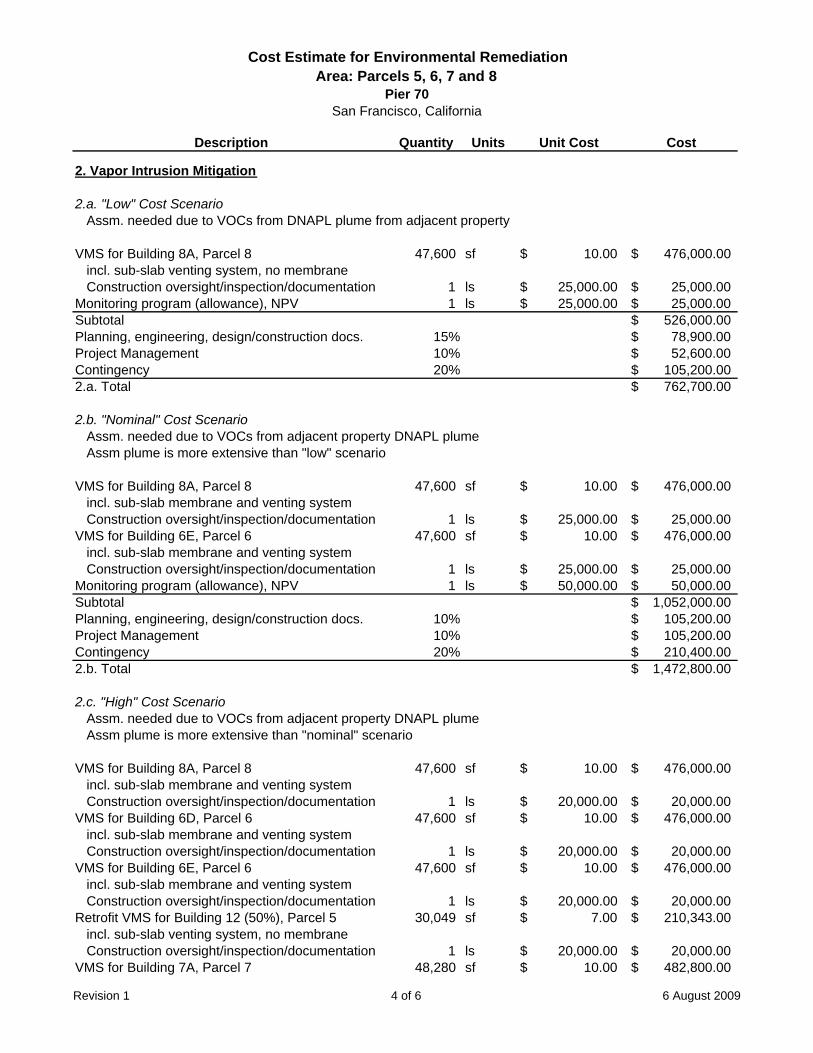
Cost Estimate for Environmental RemediationArea: Parcels 5, 6, 7 and 8
Pier 70San Francisco, California
Description Quantity Units Unit Cost Cost
2. Vapor Intrusion Mitigation
2.a. "Low" Cost ScenarioAssm. needed due to VOCs from DNAPL plume from adjacent property
VMS for Building 8A, Parcel 8 47,600 sf 10.00$ 476,000.00$ incl. sub-slab venting system, no membraneConstruction oversight/inspection/documentation 1 ls 25,000.00$ 25,000.00$
Monitoring program (allowance), NPV 1 ls 25,000.00$ 25,000.00$ Subtotal 526,000.00$ Planning, engineering, design/construction docs. 15% 78,900.00$ Project Management 10% 52,600.00$ Contingency 20% 105,200.00$ 2.a. Total 762,700.00$
2.b. "Nominal" Cost ScenarioAssm. needed due to VOCs from adjacent property DNAPL plumeAssm plume is more extensive than "low" scenario
VMS for Building 8A, Parcel 8 47,600 sf 10.00$ 476,000.00$ incl. sub-slab membrane and venting systemConstruction oversight/inspection/documentation 1 ls 25,000.00$ 25,000.00$
VMS for Building 6E, Parcel 6 47,600 sf 10.00$ 476,000.00$ incl. sub-slab membrane and venting systemConstruction oversight/inspection/documentation 1 ls 25,000.00$ 25,000.00$
Monitoring program (allowance), NPV 1 ls 50,000.00$ 50,000.00$ Subtotal 1,052,000.00$ Planning, engineering, design/construction docs. 10% 105,200.00$ Project Management 10% 105,200.00$ Contingency 20% 210,400.00$ 2.b. Total 1,472,800.00$
2.c. "High" Cost ScenarioAssm. needed due to VOCs from adjacent property DNAPL plumeAssm plume is more extensive than "nominal" scenario
VMS for Building 8A, Parcel 8 47,600 sf 10.00$ 476,000.00$ incl. sub-slab membrane and venting systemConstruction oversight/inspection/documentation 1 ls 20,000.00$ 20,000.00$
VMS for Building 6D, Parcel 6 47,600 sf 10.00$ 476,000.00$ incl. sub-slab membrane and venting systemConstruction oversight/inspection/documentation 1 ls 20,000.00$ 20,000.00$
VMS for Building 6E, Parcel 6 47,600 sf 10.00$ 476,000.00$ incl. sub-slab membrane and venting systemConstruction oversight/inspection/documentation 1 ls 20,000.00$ 20,000.00$
Retrofit VMS for Building 12 (50%), Parcel 5 30,049 sf 7.00$ 210,343.00$ incl. sub-slab venting system, no membraneConstruction oversight/inspection/documentation 1 ls 20,000.00$ 20,000.00$
VMS for Building 7A, Parcel 7 48,280 sf 10.00$ 482,800.00$
Revision 1 4 of 6 6 August 2009

Cost Estimate for Environmental RemediationArea: Parcels 5, 6, 7 and 8
Pier 70San Francisco, California
Description Quantity Units Unit Cost Cost
incl. sub-slab membrane and venting systemConstruction oversight/inspection/documentation 1 ls 20,000.00$ 20,000.00$
Monitoring program (allowance), NPV 1 ls 125,000.00$ 125,000.00$ Subtotal 2,346,143.00$ Planning, engineering, design/construction docs. 10% 234,614.30$ Project Management 10% 234,614.30$ Contingency 20% 469,228.60$ 2.c. Total 3,284,600.20$
Revision 1 5 of 6 6 August 2009
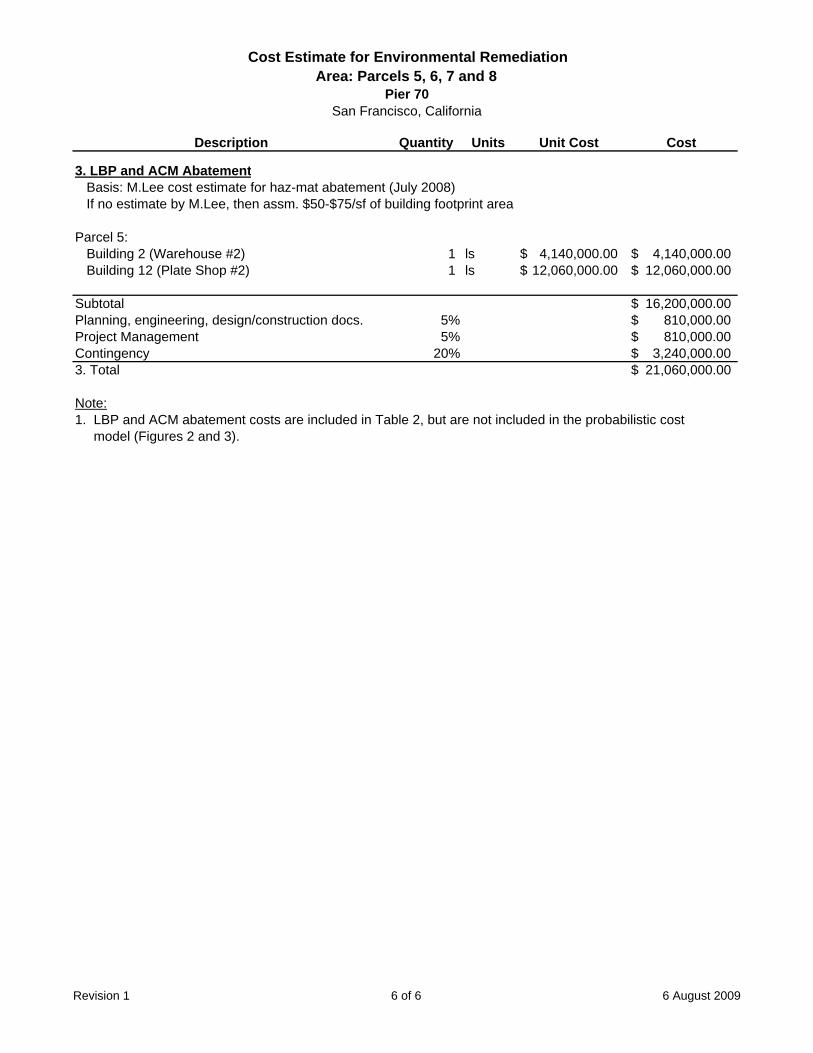
Cost Estimate for Environmental RemediationArea: Parcels 5, 6, 7 and 8
Pier 70San Francisco, California
Description Quantity Units Unit Cost Cost
3. LBP and ACM AbatementBasis: M.Lee cost estimate for haz-mat abatement (July 2008)If no estimate by M.Lee, then assm. $50-$75/sf of building footprint area
Parcel 5:Building 2 (Warehouse #2) 1 ls 4,140,000.00$ 4,140,000.00$ Building 12 (Plate Shop #2) 1 ls 12,060,000.00$ 12,060,000.00$
Subtotal 16,200,000.00$ Planning, engineering, design/construction docs. 5% 810,000.00$ Project Management 5% 810,000.00$ Contingency 20% 3,240,000.00$ 3. Total 21,060,000.00$
Note:1. LBP and ACM abatement costs are included in Table 2, but are not included in the probabilistic cost model (Figures 2 and 3).
Revision 1 6 of 6 6 August 2009

Detailed Cost EstimateGroundwater

Cost Estimate for Environmental RemediationSitewide UST Residuals and Groundwater Remediation
Pier 70San Francisco, California
Description Quantity Units Unit Cost Cost
1. Parcels 1 and 3 - UST Residuals ManagementAssm. minimal residuals from previous UST removal on Parcel 1Nominal and high cost scenarios reflect "allowance" for potential additional work
1.a. "Low" Cost Scenario: Short-term monitoring to confirm OK
Install & develop 1-2 new g.w. monitoring wells 1 ls 8,000.00$ 8,000.00$ Sampling & analysies at new well(s) 1 ls 10,000.00$ 10,000.00$ Decomissioning of well(s) 1 ls 4,000.00$ 4,000.00$ Documentation 1 ls 15,000.00$ 15,000.00$ Subtotal 37,000.00$ Planning, engineering, design/construction docs. 20% 7,400.00$ Project Management 10% 3,700.00$ Contingency 20% 7,400.00$ 1.a. Total 55,500.00$
1.b. "Nominal" Cost Scenario: Limited in-situ treatment
Install & develop 1-2 new g.w. monitoring wells 1 ls 8,000.00$ 8,000.00$ Sampling & analysies at new well(s) 1 ls 20,000.00$ 20,000.00$ Decomissioning of well(s) 1 ls 4,000.00$ 4,000.00$ In-situ treatment w/ORC (turnkey by sub) 1 ls 40,000.00$ 40,000.00$ Documentation 1 ls 25,000.00$ 25,000.00$ Subtotal 97,000.00$ Planning, engineering, design/construction docs. 20% 19,400.00$ Project Management 10% 9,700.00$ Contingency 20% 19,400.00$ 1.b. Total 145,500.00$
1.c. "High" Cost Scenario: In-situ treatment
Install & develop 3-4 new g.w. monitoring wells 1 ls 16,000.00$ 16,000.00$ Sampling & analysies at new well(s) 1 ls 40,000.00$ 40,000.00$ Decomissioning of well(s) 1 ls 8,000.00$ 8,000.00$ In-situ treatment w/ORC (turnkey by sub) 1 ls 75,000.00$ 75,000.00$ Documentation 1 ls 40,000.00$ 40,000.00$ Subtotal 179,000.00$ Planning, engineering, design/construction docs. 20% 35,800.00$ Project Management 10% 17,900.00$ Contingency 20% 35,800.00$ 1.c. Total 268,500.00$
Revision 1 1 of 7 6 August 2009
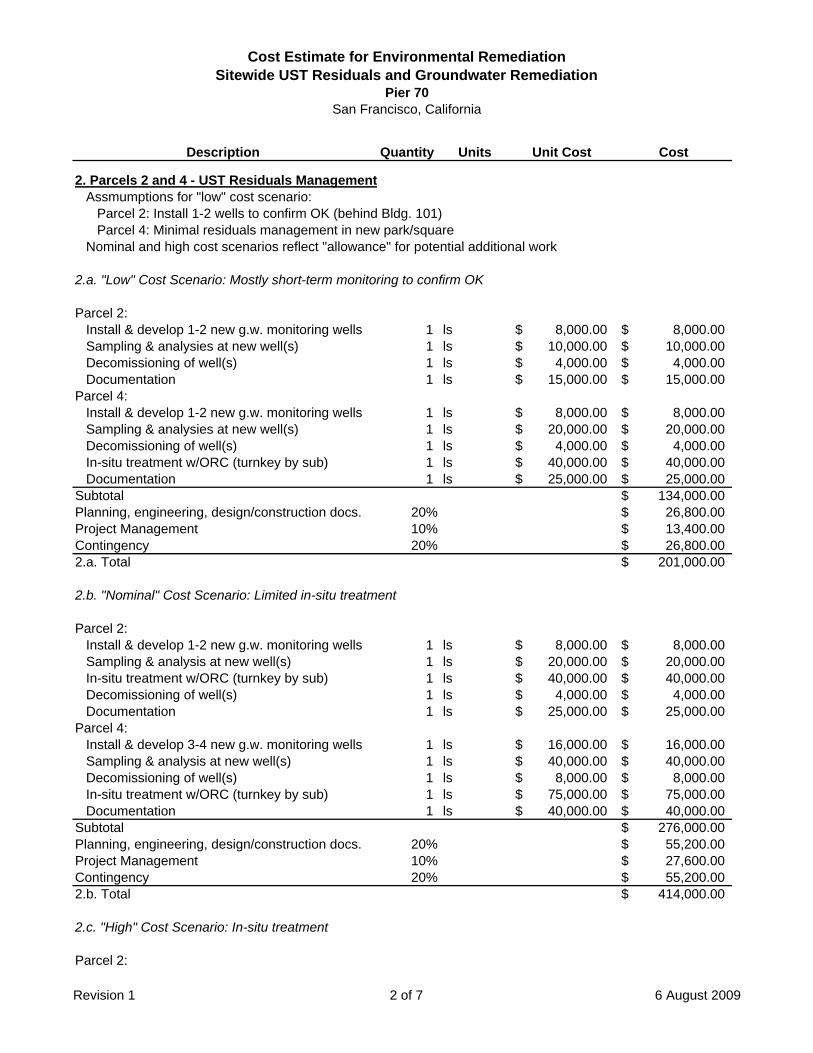
Cost Estimate for Environmental RemediationSitewide UST Residuals and Groundwater Remediation
Pier 70San Francisco, California
Description Quantity Units Unit Cost Cost
2. Parcels 2 and 4 - UST Residuals ManagementAssmumptions for "low" cost scenario:
Parcel 2: Install 1-2 wells to confirm OK (behind Bldg. 101)Parcel 4: Minimal residuals management in new park/square
Nominal and high cost scenarios reflect "allowance" for potential additional work
2.a. "Low" Cost Scenario: Mostly short-term monitoring to confirm OK
Parcel 2:Install & develop 1-2 new g.w. monitoring wells 1 ls 8,000.00$ 8,000.00$ Sampling & analysies at new well(s) 1 ls 10,000.00$ 10,000.00$ Decomissioning of well(s) 1 ls 4,000.00$ 4,000.00$ Documentation 1 ls 15,000.00$ 15,000.00$
Parcel 4:Install & develop 1-2 new g.w. monitoring wells 1 ls 8,000.00$ 8,000.00$ Sampling & analysies at new well(s) 1 ls 20,000.00$ 20,000.00$ Decomissioning of well(s) 1 ls 4,000.00$ 4,000.00$ In-situ treatment w/ORC (turnkey by sub) 1 ls 40,000.00$ 40,000.00$ Documentation 1 ls 25,000.00$ 25,000.00$
Subtotal 134,000.00$ Planning, engineering, design/construction docs. 20% 26,800.00$ Project Management 10% 13,400.00$ Contingency 20% 26,800.00$ 2.a. Total 201,000.00$
2.b. "Nominal" Cost Scenario: Limited in-situ treatment
Parcel 2:Install & develop 1-2 new g.w. monitoring wells 1 ls 8,000.00$ 8,000.00$ Sampling & analysis at new well(s) 1 ls 20,000.00$ 20,000.00$ In-situ treatment w/ORC (turnkey by sub) 1 ls 40,000.00$ 40,000.00$ Decomissioning of well(s) 1 ls 4,000.00$ 4,000.00$ Documentation 1 ls 25,000.00$ 25,000.00$
Parcel 4:Install & develop 3-4 new g.w. monitoring wells 1 ls 16,000.00$ 16,000.00$ Sampling & analysis at new well(s) 1 ls 40,000.00$ 40,000.00$ Decomissioning of well(s) 1 ls 8,000.00$ 8,000.00$ In-situ treatment w/ORC (turnkey by sub) 1 ls 75,000.00$ 75,000.00$ Documentation 1 ls 40,000.00$ 40,000.00$
Subtotal 276,000.00$ Planning, engineering, design/construction docs. 20% 55,200.00$ Project Management 10% 27,600.00$ Contingency 20% 55,200.00$ 2.b. Total 414,000.00$
2.c. "High" Cost Scenario: In-situ treatment
Parcel 2:
Revision 1 2 of 7 6 August 2009
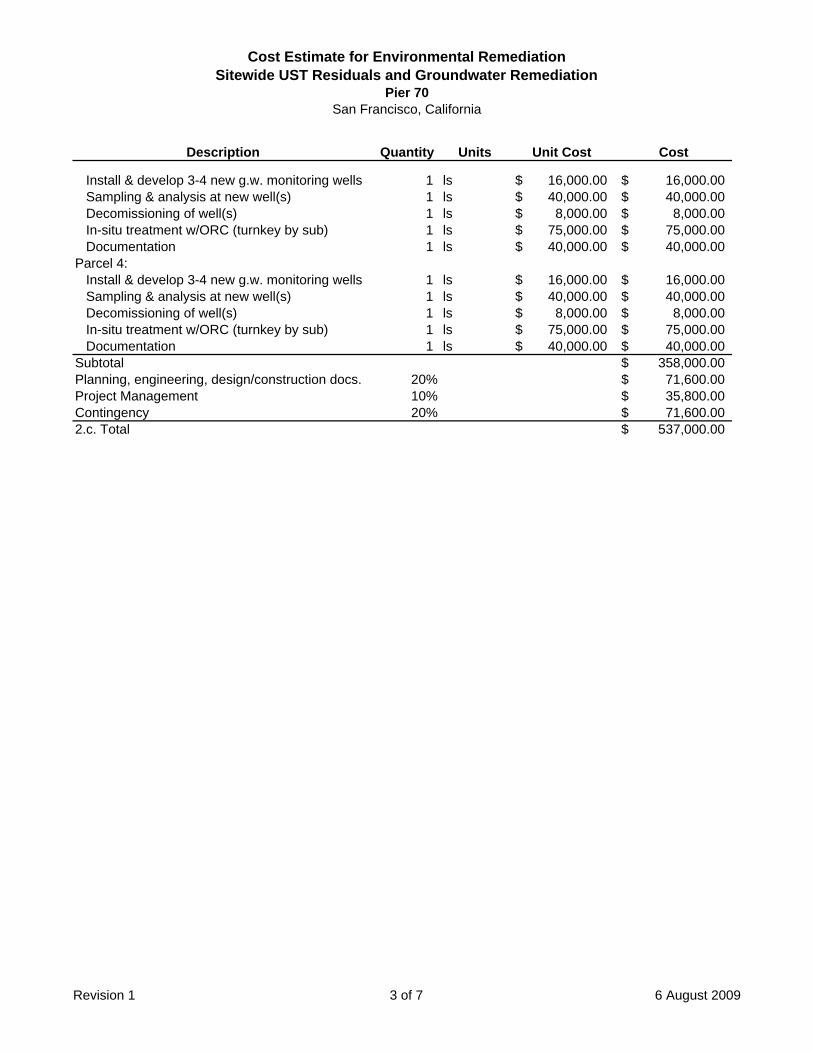
Cost Estimate for Environmental RemediationSitewide UST Residuals and Groundwater Remediation
Pier 70San Francisco, California
Description Quantity Units Unit Cost Cost
Install & develop 3-4 new g.w. monitoring wells 1 ls 16,000.00$ 16,000.00$ Sampling & analysis at new well(s) 1 ls 40,000.00$ 40,000.00$ Decomissioning of well(s) 1 ls 8,000.00$ 8,000.00$ In-situ treatment w/ORC (turnkey by sub) 1 ls 75,000.00$ 75,000.00$ Documentation 1 ls 40,000.00$ 40,000.00$
Parcel 4:Install & develop 3-4 new g.w. monitoring wells 1 ls 16,000.00$ 16,000.00$ Sampling & analysis at new well(s) 1 ls 40,000.00$ 40,000.00$ Decomissioning of well(s) 1 ls 8,000.00$ 8,000.00$ In-situ treatment w/ORC (turnkey by sub) 1 ls 75,000.00$ 75,000.00$ Documentation 1 ls 40,000.00$ 40,000.00$
Subtotal 358,000.00$ Planning, engineering, design/construction docs. 20% 71,600.00$ Project Management 10% 35,800.00$ Contingency 20% 71,600.00$ 2.c. Total 537,000.00$
Revision 1 3 of 7 6 August 2009

Cost Estimate for Environmental RemediationSitewide UST Residuals and Groundwater Remediation
Pier 70San Francisco, California
Description Quantity Units Unit Cost Cost
3. Parcels 5, 6, 7, and 8 - UST Residuals ManagementAssmumptions for "low" cost scenario:
Parcel 5: No actionParcel 7: Install 1-2 wells to confirm OK (from adjacent powerplant)
Nominal and high cost scenarios reflect "allowance" for potential additional workHigh cost scenario reflects impacts from adjacent powerplant requiring mitigation
3.a. "Low" Cost Scenario: Mostly short-term monitoring to confirm OK
Parcel 5:No action 1 ls -$ -$
Parcel 7:Install & develop 1-2 new g.w. monitoring wells 1 ls 8,000.00$ 8,000.00$ Sampling & analysies at new well(s) 1 ls 20,000.00$ 20,000.00$ Decomissioning of well(s) 1 ls 4,000.00$ 4,000.00$ Documentation 1 ls 15,000.00$ 15,000.00$
Subtotal 47,000.00$ Planning, engineering, design/construction docs. 20% 9,400.00$ Project Management 10% 4,700.00$ Contingency 20% 9,400.00$ 3.a. Total 70,500.00$
3.b. "Nominal" Cost Scenario: Limited in-situ treatment
Parcel 5:Install & develop 1-2 new g.w. monitoring wells 1 ls 8,000.00$ 8,000.00$ Sampling & analysis at new well(s) 1 ls 10,000.00$ 10,000.00$ Decomissioning of well(s) 1 ls 4,000.00$ 4,000.00$ Documentation 1 ls 15,000.00$ 15,000.00$
Parcel 7:Install & develop 1-2 new g.w. monitoring wells 1 ls 8,000.00$ 8,000.00$ Sampling & analysis at new well(s) 1 ls 20,000.00$ 20,000.00$ In-situ treatment w/ORC (turnkey by sub) 1 ls 40,000.00$ 40,000.00$ Decomissioning of well(s) 1 ls 4,000.00$ 4,000.00$ Documentation 1 ls 25,000.00$ 25,000.00$
Subtotal 134,000.00$ Planning, engineering, design/construction docs. 20% 26,800.00$ Project Management 10% 13,400.00$ Contingency 20% 26,800.00$ 3.b. Total 201,000.00$
3.c. "High" Cost Scenario: In-situ treatment
Parcel 5:Install & develop 1-2 new g.w. monitoring wells 1 ls 8,000.00$ 8,000.00$ Sampling & analysis at new well(s) 1 ls 20,000.00$ 20,000.00$ In-situ treatment w/ORC (turnkey by sub) 1 ls 40,000.00$ 40,000.00$ Decomissioning of well(s) 1 ls 4,000.00$ 4,000.00$
Revision 1 4 of 7 6 August 2009
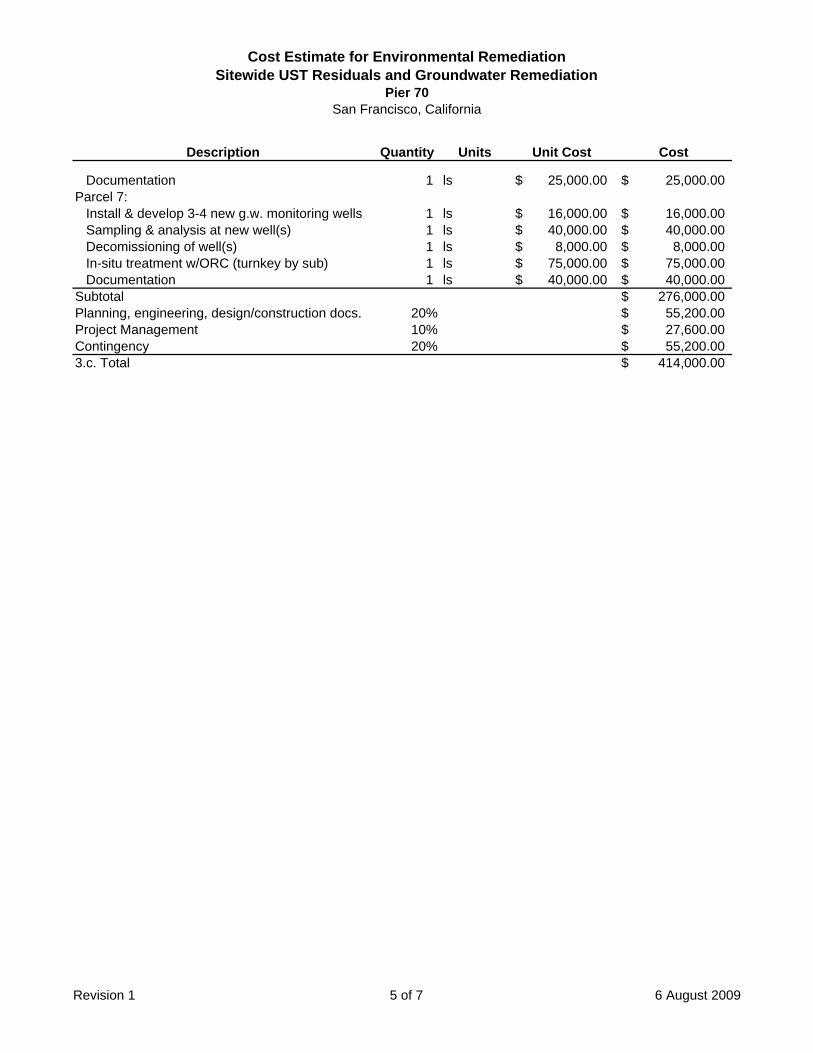
Cost Estimate for Environmental RemediationSitewide UST Residuals and Groundwater Remediation
Pier 70San Francisco, California
Description Quantity Units Unit Cost Cost
Documentation 1 ls 25,000.00$ 25,000.00$ Parcel 7:
Install & develop 3-4 new g.w. monitoring wells 1 ls 16,000.00$ 16,000.00$ Sampling & analysis at new well(s) 1 ls 40,000.00$ 40,000.00$ Decomissioning of well(s) 1 ls 8,000.00$ 8,000.00$ In-situ treatment w/ORC (turnkey by sub) 1 ls 75,000.00$ 75,000.00$ Documentation 1 ls 40,000.00$ 40,000.00$
Subtotal 276,000.00$ Planning, engineering, design/construction docs. 20% 55,200.00$ Project Management 10% 27,600.00$ Contingency 20% 55,200.00$ 3.c. Total 414,000.00$
Revision 1 5 of 7 6 August 2009

Cost Estimate for Environmental RemediationSitewide UST Residuals and Groundwater Remediation
Pier 70San Francisco, California
Description Quantity Units Unit Cost Cost
4. All Parcels - Groundwater Remediation"Low" cost scenario reflects relatively low impacts across site"Nominal" cost scenario reflects moderate impacts across site"High" cost scenario reflects unexpectedly extensive impacts across site
4.a. "Low" Cost Scenario
Parcel 1:No impacts 1 ls -$ -$
Parcel 2:Delineate, monitor 1 metals plume 1 ls 150,000.00$ 150,000.00$
Parcel 3:Delineate, monitor 1 pest./VOC/SVOC plume 1 ls 150,000.00$ 150,000.00$
Parcel 4:No impacts 1 ls -$ -$
Parcel 5:Delineate, monitor 1 pest./VOC/SVOC plume 1 ls 150,000.00$ 150,000.00$
Parcel 6:No impacts 1 ls -$ -$
Parcels 7/8:Delineate, remediate, monitor DNAPL plume 1 ls 250,000.00$ 250,000.00$
Subtotal 700,000.00$ Planning, engineering, design/construction docs. 15% 105,000.00$ Project Management 10% 70,000.00$ Contingency 20% 140,000.00$ 4.a. Total 1,015,000.00$
4.b. "Nominal" Cost Scenario
Parcel 1:No impacts 1 ls -$ -$
Parcel 2:Delineate, monitor 1 metals plume 1 ls 150,000.00$ 150,000.00$
Parcel 3:Delineate, monitor 1 pest./VOC/SVOC plume 1 ls 150,000.00$ 150,000.00$
Parcel 4:No impacts 1 ls -$ -$
Parcel 5:Delineate, monitor 1 pest./VOC/SVOC plume 1 ls 150,000.00$ 150,000.00$
Parcel 6:Delineate, remediate, monitor 1 small plume 1 ls 250,000.00$ 250,000.00$
Parcels 7/8:Delineate, remediate, monitor 1 small plume 1 ls 250,000.00$ 250,000.00$ Delineate, monitor DNAPL plume 1 ls 150,000.00$ 150,000.00$
Subtotal 1,100,000.00$ Planning, engineering, design/construction docs. 15% 165,000.00$ Project Management 10% 110,000.00$ Contingency 20% 220,000.00$
Revision 1 6 of 7 6 August 2009

Cost Estimate for Environmental RemediationSitewide UST Residuals and Groundwater Remediation
Pier 70San Francisco, California
Description Quantity Units Unit Cost Cost
4.b. Total 1,595,000.00$
4.c. "High" Cost Scenario: Remediation
Parcel 1:Delineate, monitor 1 metals plume 1 ls 150,000.00$ 150,000.00$
Parcel 2:Delineate, remediate, monitor 1 metals plume 1 ls 350,000.00$ 350,000.00$
Parcel 3:Delineate, monitor 1 pest./VOC/SVOC plume 1 ls 150,000.00$ 150,000.00$
Parcel 4:Delineate, monitor 1 pest./VOC/SVOC plume 1 ls 150,000.00$ 150,000.00$
Parcel 5:Delineate, monitor 1 pest./VOC/SVOC plume 1 ls 150,000.00$ 150,000.00$
Parcel 6:Delineate, remediate, monitor 1 small plume 1 ls 250,000.00$ 250,000.00$
Parcels 7/8:Delineate, remediate, monitor 1 small plume 1 ls 250,000.00$ 250,000.00$ Install hydraulic control measures 1 ls 500,000.00$ 500,000.00$ Delineate, remediate, monitor DNAPL plume 1 ls 350,000.00$ 350,000.00$
Subtotal 2,300,000.00$ Planning, engineering, design/construction docs. 15% 345,000.00$ Project Management 10% 230,000.00$ Contingency 20% 460,000.00$ 4.c. Total 3,335,000.00$
Revision 1 7 of 7 6 August 2009