private infrastructure debt strategic outlook
TRANSCRIPT

Alternatives Research Infrastructure
April 2021
The brand DWS represents DWS Group GmbH & Co. KGaA and any of its subsidiaries, such as DWS Distributors, Inc., which offers investment products, or DWS Investment Management Americas, Inc. and RREEF America L.L.C., which offer advisory services. There may be references in this document which do not yet reflect the DWS Brand.
Please note certain information in this presentation constitutes forward-looking statements. Due to various risks, uncertainties and assumptions made in our analysis, actual events or results or the actual performance of the markets covered by this presentation report may differ materially from those described. The information herein reflects our current views only, is subject to change, and is not intended to be promissory or relied upon by the reader. There can be no certainty that events will turn out as we have opined herein.
For Professional Clients (MiFID Directive 2014/65/EU Annex II) only. For Qualified Investors (Art. 10 Para. 3 of the Swiss Federal Collective Investment Schemes Act (CISA)). For Qualified Clients (Israeli Regulation of Investment Advice, Investment Marketing and Portfolio Management Law 5755-1995). Outside the U.S. for Institutional investors only. In the United States and Canada, for institutional client and registered representative use only. Not for retail distribution. Further distribution of this material is strictly prohibited. In Australia and New Zealand: For Wholesale Investors only. For Asia For institutional investors only. *For investors in Bermuda: This is not an offering of securities or interests in any product. Such securities may be offered or sold in Bermuda only in compliance with the provisions of the Investment Business Act of 2003 of Bermuda which regulates the sale of securities in Bermuda.
/ 1
Marketing Material
PRIVATE INFRASTRUCTURE DEBT STRATEGIC OUTLOOK Risks & opportunities in an era of economic uncertainty and sustainability
IN A
NU
TSH
ELL _ Investors increasingly complement IG private infrastructure debt portfolios with high yield strategies, where
returns and risks are higher, requiring more thorough credit analysis, particularly at a time of macroeconomic uncertainty.
_ Infrastructure debt defaults and credit spreads are resilient, but have historically been connected to economic cycles, and we observe a similar pattern today.
_ The effects of Covid-19, decarbonisation and ESG integration are key strategic factors, and may increasingly influence the credit profile of infrastructure debt.

/ 2
Table of Contents
Executive summary .......................................................................................................3
Strategic themes ............................................................................................................4
1 / Market environment ..................................................................................................5
2 / Macroeconomic outlook and private infrastructure debt ......................................... 11
3 / Infrastructure debt credit outlook ............................................................................ 18
4 / ESG and infrastructure credit risk ........................................................................... 21
Research & strategy—alternatives .............................................................................. 25
The opinions and forecasts expressed are those of Private Infrastructure Debt Strategic Outlook and not necessarily those of DWS. All opinions and claims are based upon data at the time of publication of this article (April 2021) and may not come to pass. This information is subject to change at any time, based upon economic, market and other conditions and should not be construed as a recommendation.

Alternatives Research | APRIL 2021
Past performance is not a reliable indicator of future returns. Forecasts are based on assumptions, estimates, views and hypothetical models or analyses, which might prove inaccurate or incorrect.
/ 3
Executive summary
Market environment Private infrastructure debt has experienced strong growth in recent years, providing a source of duration, diversification and return premium in a lower yielding investment environment. With demand from long-term, buy-and-hold investors increasingly chasing credit risk assets, we have recently observed healthy, albeit tighter illiquidity premia for investment grade (IG) private infrastructure debt. Investors increasingly focus on complementing IG strategies with sub-investment-grade (HY) private infrastructure debt. HY private infrastructure debt spreads are higher than in IG, but HY exposes investors to higher levels of credit risk over IG, particularly at a time of increased macroeconomic uncertainty. Stronger entry returns, a shorter duration, and supportive equity cushions in the infrastructure market despite Covid-19, appear to be mitigating factors, supporting HY portfolio allocations from a risk-adjusted perspective.
Macroeconomic environment In this report, we analyse how private infrastructure debt default rates and credit spreads have historically behaved across macroeconomic cycles, to derive some strategic guidance on the future evolution of returns across different scenarios. In 2020, Covid-19 has caused a deep economic downturn, with central banks boosting their expansionary monetary policy via interest rates reductions and quantitative easing, driving bond yields lower. Global debt has exceeded a record USD 200 trillion in 2020, over 265% of GDP, an unchartered territory, but the recovery should contribute to easing debt levels in 2021.1 Despite our expectations of interest rates remaining lower for longer, the timing of the recovery remains unclear, and may pose upside pressure on yields, via monetary policy or higher inflation, and to infrastructure credits via increased country risk, leverage and debt servicing costs.
Credit outlook We provide an indication of the short-term and long-term credit outlook by infrastructure sector. The credit profile of infrastructure debt has been resilient so far, despite Covid-19. In 2020, we have observed a widening in credit spreads, particularly for assets affected by the pandemic, such as passenger transportation. Liquidity conditions have remained supportive, but we cannot exclude that lenders may increasingly reflect the higher perceived level of credit risk in spreads and ratings for sectors affected by the pandemic. From a business fundamental perspective, the full credit effects of Covid-19 on private infrastructure may take time to fully emerge.
Supercycle Several megatrends, such as decarbonisation, energy transition and digitalisation may support the investment pipeline over the coming years. These long-term trends may represent an opportunity for growth, but also a source of credit risk. In this regard, we note that despite stronger historical resilience, long-duration IG debt may be more exposed to long-term uncertainty related to these megatrends, particularly today, as a relatively flat yield curve may not fully compensate for some long-term uncertainty. HY private infrastructure debt may be more favourably positioned to de-risk the credit effects of megatrends, due to the lower duration of loans, particularly for amortizing debt structures.
Incorporating ESG We observe increased interest from investors in incorporating ESG factors in private infrastructure debt underwriting and reporting, a process increasingly supported by regulation. In this report, we provide an update on the policy and regulatory evolution contributing to the incorporation of ESG in infrastructure debt investment. We provide a summary overview of key ESG risks and how these may impact credits from a financial risk materiality perspective. ESG risks, and particularly climate risks, may represent potential threats to the credit profile of long duration infrastructure debt, translating into lower margins and equity cushions, higher default rates and credit losses, particularly for assets exposed to the risk of becoming stranded. A structured ESG approach may help mitigating risks, support credit selection, and provide an opportunity for superior risk-adjusted returns. In the future, as methodologies mature, we expect infrastructure debt strategies to increasingly focus on ESG from a double materiality perspective, linking lending to ESG impact, such as net zero emissions targets.
1 S&P Global, “Global Debt Leverage: Near Term Crisis Unlikely, Even As More Defaults Loom”, 10 March 2021.

Alternatives Research | APRIL 2021
Past performance is not a reliable indicator of future returns. Forecasts are based on assumptions, estimates, views and hypothetical models or analyses, which might prove inaccurate or incorrect.
/ 4
Strategic themes
STRATEGIC THEMES FOR PRIVATE INFRASTRUCTURE DEBT INVESTMENT
Mar
ket E
nviro
nmen
t
1
Market dynamic: We see continued growth in private infrastructure debt fundraising, despite Covid-19. Transaction volumes reduced in 2020, but we expect 2021 to provide a robust set of opportunities diversified by sector, credit risk and geography. In the medium term, we expect a strong policy stimulus focused on energy transition and digitalisation to contribute to a growing pipeline of transaction opportunities.
2
Risk profile: We observe a rapid growth of private infrastructure debt allocations. IG infrastructure debt represents a building block of institutional investors’ portfolios. However, we expect investors to increasingly complement strategies based on IG infrastructure debt with HY debt, and to move lower in the capital structure to junior infrastructure debt, seeking higher entry yields and risk-adjusted returns.
3
Return and risk: In 2020, monetary policy has compressed entry yields in the debt markets. Covid-19 has initially resulted in a widening of credit spreads for private infrastructure debt, particularly for HY, but this effect appears to be normalising. Wider credit spreads may represent an opportunity for stronger entry returns, but investors need to consider potential for higher credit risk, and look at opportunities from a risk-adjusted perspective, particularly at a time of economic volatility.
Sho
rt-te
rm O
utlo
ok
1
Credit cycle: Covid-19 has determined a deep recession in 2020. We expect that the economic effects of the pandemic may continue to weigh on credit quality for assets exposed to volume and price volatility over the coming months. Investors may need to factor this in pricing and risk-adjusted return expectations. Investors may also consider the risk of higher inflation and yields weighing on equity valuations, recovery rates and refinancing risk, particularly in stress cases.
2
Country risk: Covid-19 has triggered an unprecedented monetary and fiscal stimulus, leading to a considerable increase in public debt. In time, this may translate into increased policy and regulatory divergence, particularly for markets with comparatively higher country risk, and may lead to FX and interest rate volatility. For the bulk of their portfolio, investors may focus on mature markets such as North America and Europe, supported by relatively predictable institutional frameworks. In 2020, regulation has proven supportive, particularly for utilities, and we have observed governments across several mature infrastructure markets providing extraordinary support to infrastructure assets, supporting credit profiles.
3
Business risk: In 2020, infrastructure has proven resilient, particularly if supported by regulation or contracted revenues. For sectors impacted by the pandemic, such as passenger transportation, we have observed supportive liquidity conditions, with lenders providing temporary waivers to loan agreements, as they expect asset performance to gradually converge to original business plans in the medium-term. Nevertheless, the full credit effects of the pandemic on business risk may take time to emerge, and defaults may increase over the next 6 to 18 months, as observed during previous credit cycles.
Long
-term
Out
look
1
Supercycle: Energy transition, decarbonisation and digitalisation are driving structural changes across infrastructure sectors, and may translate into a divergence of business fundamentals from historical profitability and risk profiles in the long term, both positively and negatively. Investors may consider the effects of megatrends on base cases and stress cases, particularly for longer duration assets, or in the case of assets exposed to refinancing risks.
2
Incorporating ESG: We see growing interest for infrastructure debt strategies factoring in ESG risks, also supported by an evolving regulation. Investors may increasingly incorporate a structured approach to ESG risks in their private infrastructure debt underwriting and credit analysis processes. Adopting an ESG methodology to evaluate the materiality of industry and sector-specific ESG factors in a transparent way, may represent an opportunity to mitigate the impact of ESG related risks on credit ratios, default and recovery rates, supporting risk-adjusted returns, particularly for longer duration assets. While we observe a stronger focus on assessing the financial materiality of ESG risks, we acknowledge that the industry is also increasingly focusing on double materiality, reporting on ESG issues also from a non-financial perspective.
3
Portfolio allocations: We observe a growing infrastructure investment gap, and expect private infrastructure debt to continue growing in prominence, with long-term investors playing a pivotal role in providing the capital required to support sustainable growth. In the context of interest rates expected to remain lower for longer, private infrastructure debt is expected to play an important role in the portfolio allocation strategies of long-term investors focusing on secure income generation and in search of superior risk-adjusted returns.

Alternatives Research | APRIL 2021
Past performance is not a reliable indicator of future returns. Forecasts are based on assumptions, estimates, views and hypothetical models or analyses, which might prove inaccurate or incorrect.
/ 5
1 / Market environment
1.1 Fundraising update
With infrastructure funding needs rising, and most governments focusing on policies to support the economic recovery after Covid-19, the private sector appears to be playing a critical role in closing the funding gap, and infrastructure debt represents an important part of this needed capital. Infrastructure debt was traditionally a space occupied by banks, but in recent years, it has gained popularity among institutional investors, with the private loan market becoming more prominent, and being increasingly targeted for secured income strategies.
From an investor’s perspective, globally, demand for infrastructure debt continues to grow, as historically low interest rates are causing investors to look for alternatives that may offer attractive risk-adjusted returns, without diverging significantly from the risk profile of corporate IG and sovereign bonds. As a result, we have observed continued growth for private infrastructure debt fundraising, with total capital raised exceeding USD 33 billion in 2019 and 2020 combined, just considering asset managers’ funds and excluding direct investors. This is significantly above the total capital raised of USD 13 billion over the period 2017 and 2018 combined.2 From a regional perspective, North American and European strategies represent the largest markets for private infrastructure debt. That said, we continue to observe a slow, albeit steady growth for strategies in the APAC region, focusing particularly on renewables. In Europe, we note a substantial increase in fundraising activity over the last years, driven by the recognition of the portfolio benefits that private infrastructure may offer, but also by the changing regulatory environment for insurance companies, with capital charges reduced for investment in qualifying infrastructure debt under Solvency II regulation.3
In Europe, historically, we have seen investment strategies focusing predominantly on investment grade (IG) infrastructure debt. More recently, we observe growing market interest for allocating to strategies that focus also on high yield (HY) infrastructure debt, or that move up the risk-return spectrum, such as with junior debt allocations, supported by a growing pipeline of market opportunities. North America, on the other hand, has historically provided private infrastructure debt investors with a larger HY infrastructure debt market. In the future, we expect continued growth for infrastructure debt IG fundraising strategies, but anticipate an acceleration of HY private infrastructure debt.
PRIVATE INFRASTRUCTURE DEBT FUNDRAISING BY REGION (Global, % of total fundraising)
Source: Preqin database, as at March 2021. Past performance is not indicative of future results.
2 Based on Preqin database, as at February 2021. 3 Investment and Pension Europe, “Commission calls for Solvency II rule change to boost infra spending”, 8 June 2017.
0%10%20%30%40%50%60%70%80%90%
100%
2014 2015 2016 2017 2018 2019 2020
Sha
re o
f tot
al fu
ndra
isin
g vo
lum
e (%
)
North America Europe Other Geographies
Alternatives Research | APRIL 2021
Past performance is not a reliable indicator of future returns. Forecasts are based on assumptions, estimates, views and hypothetical models or analyses, which might prove inaccurate or incorrect.
/ 6
1.2 The growing role of private infrastructure debt in portfolios
1.2.1 Historical portfolio allocation overview
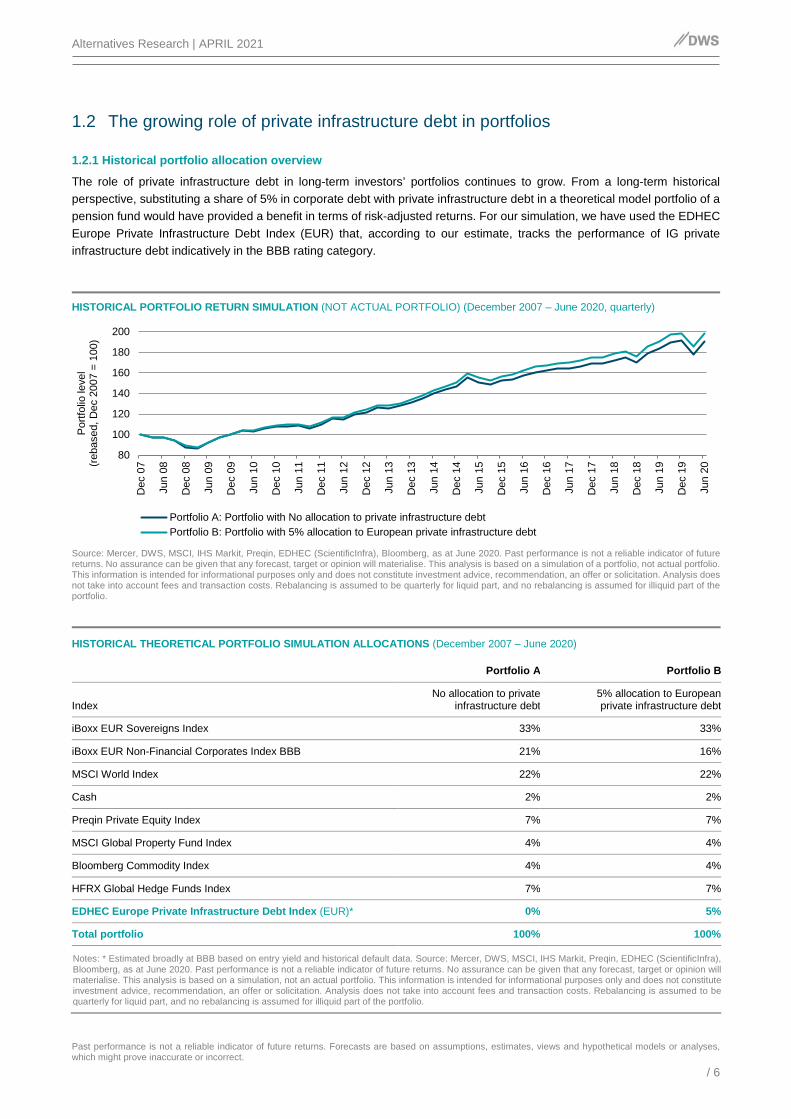
The role of private infrastructure debt in long-term investors’ portfolios continues to grow. From a long-term historical perspective, substituting a share of 5% in corporate debt with private infrastructure debt in a theoretical model portfolio of a pension fund would have provided a benefit in terms of risk-adjusted returns. For our simulation, we have used the EDHEC Europe Private Infrastructure Debt Index (EUR) that, according to our estimate, tracks the performance of IG private infrastructure debt indicatively in the BBB rating category.
HISTORICAL PORTFOLIO RETURN SIMULATION (NOT ACTUAL PORTFOLIO) (December 2007 – June 2020, quarterly)
Source: Mercer, DWS, MSCI, IHS Markit, Preqin, EDHEC (ScientificInfra), Bloomberg, as at June 2020. Past performance is not a reliable indicator of future returns. No assurance can be given that any forecast, target or opinion will materialise. This analysis is based on a simulation of a portfolio, not actual portfolio. This information is intended for informational purposes only and does not constitute investment advice, recommendation, an offer or solicitation. Analysis does not take into account fees and transaction costs. Rebalancing is assumed to be quarterly for liquid part, and no rebalancing is assumed for illiquid part of the portfolio.
HISTORICAL THEORETICAL PORTFOLIO SIMULATION ALLOCATIONS (December 2007 – June 2020)
Portfolio A Portfolio B
Index No allocation to private
infrastructure debt 5% allocation to European private infrastructure debt
iBoxx EUR Sovereigns Index 33% 33%
iBoxx EUR Non-Financial Corporates Index BBB 21% 16%
MSCI World Index 22% 22%
Cash 2% 2%
Preqin Private Equity Index 7% 7%
MSCI Global Property Fund Index 4% 4%
Bloomberg Commodity Index 4% 4%
HFRX Global Hedge Funds Index 7% 7%
EDHEC Europe Private Infrastructure Debt Index (EUR)* 0% 5%
Total portfolio 100% 100%
Notes: * Estimated broadly at BBB based on entry yield and historical default data. Source: Mercer, DWS, MSCI, IHS Markit, Preqin, EDHEC (ScientificInfra), Bloomberg, as at June 2020. Past performance is not a reliable indicator of future returns. No assurance can be given that any forecast, target or opinion will materialise. This analysis is based on a simulation, not an actual portfolio. This information is intended for informational purposes only and does not constitute investment advice, recommendation, an offer or solicitation. Analysis does not take into account fees and transaction costs. Rebalancing is assumed to be quarterly for liquid part, and no rebalancing is assumed for illiquid part of the portfolio.
80
100
120
140
160
180
200
Dec
07
Jun
08
Dec
08
Jun
09
Dec
09
Jun
10
Dec
10
Jun
11
Dec
11
Jun
12
Dec
12
Jun
13
Dec
13
Jun
14
Dec
14
Jun
15
Dec
15
Jun
16
Dec
16
Jun
17
Dec
17
Jun
18
Dec
18
Jun
19
Dec
19
Jun
20
Por
tfolio
leve
l (re
base
d, D
ec 2
007
= 10
0)
Portfolio A: Portfolio with No allocation to private infrastructure debtPortfolio B: Portfolio with 5% allocation to European private infrastructure debt

Alternatives Research | APRIL 2021
Past performance is not a reliable indicator of future returns. Forecasts are based on assumptions, estimates, views and hypothetical models or analyses, which might prove inaccurate or incorrect.
/ 7
During the period December 2007 – June 2020, substituting 5% of BBB-rated listed corporate debt with BBB-estimated private infrastructure debt would have produced an annual return upside of ca. 30 bps. and a similar reduction in volatility, improving the portfolio’s Sharpe ratio to 1.03 from 0.91.4 Focusing on volatility, while traditionally indices tracking the performance of private asset classes are based on fair value appraisals, EDHEC indices incorporate short-term factors in the calculation of returns, making volatility of private infrastructure debt more comparable to listed asset classes. For example, over the period of the analysis, the volatility of the EDHEC Europe Private Infrastructure Debt Index (EUR) was 5.4%, compared to 4.9% for iBoxx EUR Non-Financial Corporates Index BBB benchmarking bonds.
1.2.2 Risk-adjusted return expectations
Volatility may be relevant for portfolio allocation, but private infrastructure debt investors generally follow buy-and-hold strategies. For this reason, we have also performed a prospective analysis looking at entry returns achievable today in the market and at risk from a loss given default perspective. Our analysis compares listed, BBB-rated non-financial corporate debt with BBB - estimated5 private infrastructure debt. In the BBB-rating category, entry returns are at 1.3% for EUR denominated private infrastructure debt compared with 0.5% for listed non-financial corporate debt. From a risk-adjusted perspective, the premium estimate for private infrastructure debt widens from ca. 80 bps. to 90 bps.6 This is mainly driven by lower expected loss given defaults observed historically for private infrastructure debt, compared to the non-financial corporate debt.
4 Past performance is not a reliable indicator of future returns. This analysis is based on a simulation of a portfolio, not actual portfolio. This information is
intended for informational purposes only and does not constitute investment advice, recommendation, an offer or solicitation. Analysis does not take into account fees and transaction costs. Rebalancing is assumed to be quarterly for liquid part, and no rebalancing is assumed for illiquid part.
5 Rating category distribution broadly estimated on the basis of yield to maturity and default probability levels provided by EDHEC. 6 DWS estimate as at March 2021.
HISTORICAL PORTFOLIO SIMULATION CHARACTERISTICS (December 2007 – June 2020, quarterly)
Annualised return
Annualised volatility
Sharpe ratio (Rf=0%)
Portfolio A No allocation to private infra debt 5.3% 5.8% 0.91
Portfolio B 5% allocation to European private infra debt 5.6% 5.5% 1.03
Source: Mercer, DWS, MSCI, IHS Markit, Preqin, EDHEC (ScientificInfra), Bloomberg, as at June 2020. Past performance is not a reliable indicator of future returns. No assurance can be given that any forecast, target or opinion will materialise. This analysis is based on a simulation of a portfolio, not actual portfolio. This information is intended for informational purposes only and does not constitute investment advice, recommendation, an offer or solicitation. Analysis does not take into account fees and transaction costs. Rebalancing is assumed to be quarterly for liquid part, and no rebalancing is assumed for illiquid part of the portfolio.
RISK-ADJUSTED RETURN EXPECTATIONS OF BUY-AND-HOLD STRATEGIES (As at December 2020, estimate)
Median estimated
rating****
Expected return, Yield to
maturity (%)
Average expected annual credit loss
(bps.) Risk-adj. expected
return (%)
EUR Non-Financial Corporates Debt IG BBB 0.50% 16 0.34%
Europe Private Infrastructure Debt IG* A 1.21% 4 1.17%
Europe Private Infrastructure Debt IG** BBB 1.32% 12 1.20%
Europe Private Infrastructure Debt IG/HY*** 90% BBB & 10% BB 1.60% 14 1.46%
Source: DWS, IHS Markit, Moody’s, EDHEC (ScientificInfra), as at December 2020. Past performance is not a reliable indicator of future returns. No assurance can be given that any forecast, target or opinion will materialise. This information is intended for informational purposes only and does not constitute investment advice, recommendation, an offer or solicitation. Notes: *Includes regulated infrastructure assets, **Includes assets in the broad infrastructure sector, ***Includes contracted infrastructure assets, **** Rating category distribution broadly estimated on the basis of entry yield and default probability levels.
Alternatives Research | APRIL 2021
Past performance is not a reliable indicator of future returns. Forecasts are based on assumptions, estimates, views and hypothetical models or analyses, which might prove inaccurate or incorrect.
/ 8
Our analysis also suggests that by adding an indicative share of 10% of HY, private infrastructure debt with a median rating estimated in the BB rating category, to an initial 90% IG private infrastructure debt allocation, investors may be able to improve entry returns to 1.6%, without materially increasing the default risk of the infrastructure debt portfolio. This example highlights the important role that a partial allocation to HY private infrastructure debt may play for investors focusing on IG infrastructure debt for the bulk of their portfolios.7
1.3 Historical transactions and returns by market
1.3.1 European market
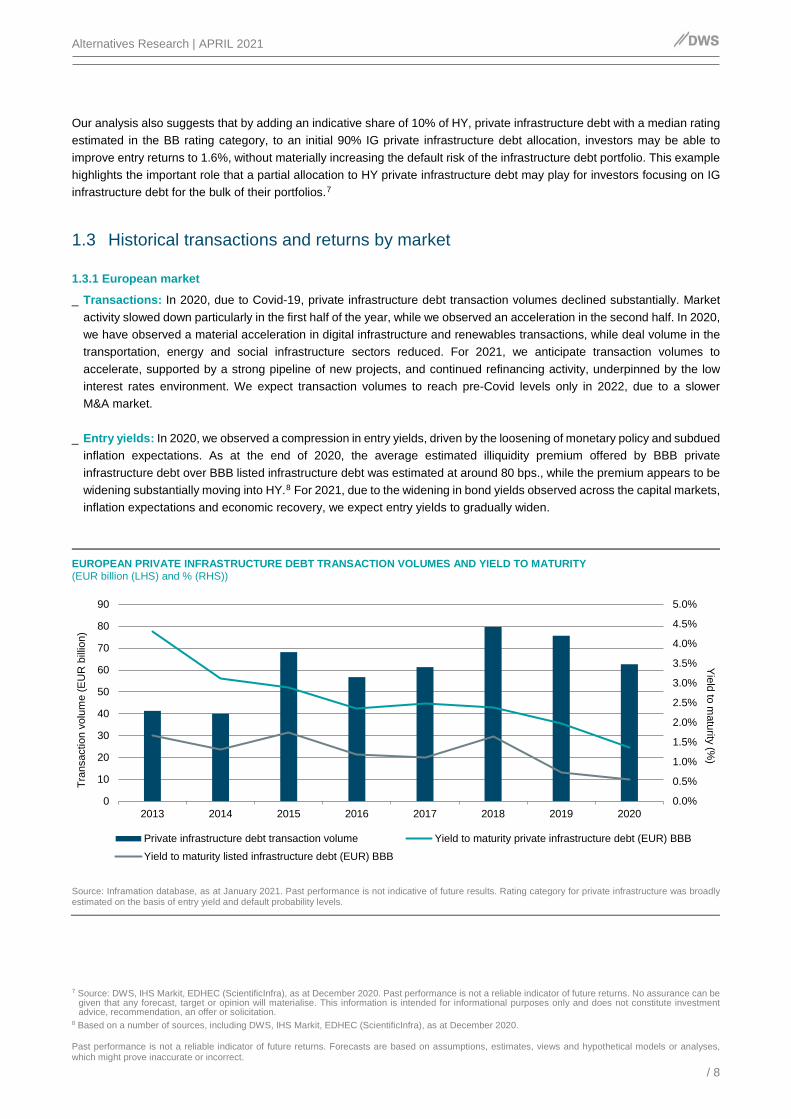
_ Transactions: In 2020, due to Covid-19, private infrastructure debt transaction volumes declined substantially. Market activity slowed down particularly in the first half of the year, while we observed an acceleration in the second half. In 2020, we have observed a material acceleration in digital infrastructure and renewables transactions, while deal volume in the transportation, energy and social infrastructure sectors reduced. For 2021, we anticipate transaction volumes to accelerate, supported by a strong pipeline of new projects, and continued refinancing activity, underpinned by the low interest rates environment. We expect transaction volumes to reach pre-Covid levels only in 2022, due to a slower M&A market.
_ Entry yields: In 2020, we observed a compression in entry yields, driven by the loosening of monetary policy and subdued inflation expectations. As at the end of 2020, the average estimated illiquidity premium offered by BBB private infrastructure debt over BBB listed infrastructure debt was estimated at around 80 bps., while the premium appears to be widening substantially moving into HY.8 For 2021, due to the widening in bond yields observed across the capital markets, inflation expectations and economic recovery, we expect entry yields to gradually widen.
EUROPEAN PRIVATE INFRASTRUCTURE DEBT TRANSACTION VOLUMES AND YIELD TO MATURITY (EUR billion (LHS) and % (RHS))
Source: Inframation database, as at January 2021. Past performance is not indicative of future results. Rating category for private infrastructure was broadly estimated on the basis of entry yield and default probability levels.
7 Source: DWS, IHS Markit, EDHEC (ScientificInfra), as at December 2020. Past performance is not a reliable indicator of future returns. No assurance can be
given that any forecast, target or opinion will materialise. This information is intended for informational purposes only and does not constitute investment advice, recommendation, an offer or solicitation.
8 Based on a number of sources, including DWS, IHS Markit, EDHEC (ScientificInfra), as at December 2020.
0.0%
0.5%
1.0%
1.5%
2.0%
2.5%
3.0%
3.5%
4.0%
4.5%
5.0%
0
10
20
30
40
50
60
70
80
90
2013 2014 2015 2016 2017 2018 2019 2020
Yield to m
aturity (%)
Tran
sact
ion
volu
me
(EU
R b
illio
n)
Private infrastructure debt transaction volume Yield to maturity private infrastructure debt (EUR) BBB
Yield to maturity listed infrastructure debt (EUR) BBB

Alternatives Research | APRIL 2021
Past performance is not a reliable indicator of future returns. Forecasts are based on assumptions, estimates, views and hypothetical models or analyses, which might prove inaccurate or incorrect.
/ 9
EUROPEAN PRIVATE INFRASTRUCTURE DEBT TRANSACTIONS BY SECTOR AND CREDIT SPREADS* (% (LHS) and basis points (RHS))
Source: Inframation database, as at January 2021. Past performance is not indicative of future results. Notes: * Credit spread measured over the 3 months interest rate.
_ Credit spreads: Despite an initial increase in credit spreads for transportation debt in the first quarter of the year driven
by Covid-19, by the end of the year, European private infrastructure debt spreads appeared to have largely normalised at ca. 155 bps., in line with 2019 levels. At the same time, utilities spreads continued to decline, reaching 126 bps. in 2020, compared with 140 bps. in 2019, also supported by the resilient performance of the sector during the pandemic.9
1.3.2 North American market
_ Transactions: In 2020, in North America we observed a reduction in transaction volumes in the first half of the year, particularly in the midstream energy sector. However, already by the beginning of the third quarter of 2020 we saw an acceleration in transactions, particularly for refinancing. Transaction activity appears now to have largely resumed. In 2021, we anticipate a further acceleration of transaction volumes, with the North American market expected to be mostly active in the digital infrastructure and renewables sectors. While the refinancing market continued to be particularly active, we also observed an acceleration in greenfield projects, particularly for renewable energy, while M&A transaction volumes appear to be still below pre-Covid-19 levels.
_ Entry yields: In North America, looser monetary policy translated into a material fall in entry yields in the fixed income markets, in the first half of 2020. In 2021, we saw an overall stability for entry yields. Nevertheless, during 2021, we may observe a renewed widening of entry yields, in case of a material increases in inflation or major monetary policy changes. We expect this trend to continue in 2021, and to represent a key factor to watch for private infrastructure debt investors focusing on generating illiquidity premia.
_ Credit spreads: Following the outbreak of Covid-19, data indicate an initial widening in private infrastructure credit
spreads in North America. As at the end of 2020, credit spreads were still somewhat higher compared with 2019. Nevertheless, in 2021, we may see a further normalisation, particularly in conjunction with a gradual increase in entry yields, supported by inflationary expectations or tighter monetary policy.
9 Based on EDHEC (ScientificInfra), as at December 2020. Past performance is not a reliable indicator of future returns.
0
50
100
150
200
250
300
0%
20%
40%
60%
80%
100%
2013 2014 2015 2016 2017 2018 2019 2020
Credit spread (bps.)
Tran
sact
ions
by
sect
or (%
)
Energy EnvironmentOther PowerRenewables SocialDigital infrastructure TransportTransport credit spreads (Europe, EUR) Network utilities (Europe, EUR)

Alternatives Research | APRIL 2021
Past performance is not a reliable indicator of future returns. Forecasts are based on assumptions, estimates, views and hypothetical models or analyses, which might prove inaccurate or incorrect.
/ 10
NORTH AMERICAN PRIVATE INFRASTRUCTURE DEBT TRANSACTIONS AND YIELD TO MATURITY (%) (USD billion)
Source: Inframation database, EDHEC, as at January 2021. Past performance is not indicative of future results. Notes: * estimate based on entry yields and default probability.
NORTH AMERICAN PRIVATE INFRASTRUCTURE DEBT TRANSACTIONS BY SECTOR AND CREDIT SPREADS* (% (LHS) and basis points (RHS))
Source: Inframation database, EDHEC, as at January 2021. Past performance is not indicative of future results. Notes: * Credit spread measured over the 3 months interest rate.
0%
1%
2%
3%
4%
5%
6%
7%
8%
9%
0
10
20
30
40
50
60
2013 2014 2015 2016 2017 2018 2019 2020
Yield to m
aturity (%)
Tran
sact
ion
volu
me
(US
D b
illio
n)
Private infra debt transaction volume
Yield to maturity private infra debt (USD, Americas, BBB*)
Yield to maturity listed infra debt (USD, IG, BBB)
0
50
100
150
200
250
300
0%
20%
40%
60%
80%
100%
2013 2014 2015 2016 2017 2018 2019 2020
Credit spreads (bps.)
Tran
sact
ions
by
Sec
tor (
%)
Energy EnvironmentOther PowerRenewables SocialDigital infrastructure TransportInfrastructure debt credit spread (Americas, USD)

Alternatives Research | APRIL 2021
Past performance is not a reliable indicator of future returns. Forecasts are based on assumptions, estimates, views and hypothetical models or analyses, which might prove inaccurate or incorrect.
/ 11
2 / Macroeconomic outlook and private infrastructure debt
2.1 Summary macroeconomic outlook
In 2020, Covid-19 pushed the global economy into a deep recession. In the first quarter of 2021, a second pandemic wave is delaying the economic recovery. The vaccine rollout may boost growth from the second half of 2021 and mitigate the risk of a new economic contraction. We expect the U.S. recovery to outperform the Eurozone in 2021, with real GDP growth expected at 7%, compared with 4.2%.10 Nevertheless, the economic effects of the pandemic on medium-term growth are yet to be fully comprehended.
CENTRAL BANK POLICY RATES AND 5 YEAR SWAP RATES (%)
Source: Oxford Economics, as at March 2021. Past performance is not indicative of future results.
2.2 Country risk and extraordinary government support evolution
During the pandemic, we saw an unprecedented policy stimulus in support of the economy. Public borrowing increased materially in 2020 and is expected to stay high to spur economic recovery in 2021. From 2022, we anticipate a deleveraging, also supported by economic growth. However, higher public debt levels may represent a driver of policy divergence and heightened country risk, particularly across emerging markets. For this reason, long-term investors may focus on mature OECD markets for the bulk of their private infrastructure debt portfolio allocations.
Across several mature OECD mature economies, governments have represented an essential source of support for infrastructure assets impacted by the pandemic. Support has materialised in the form of ordinary, contractual support, for example for assets in the public transportation sector, that have benefitted from revenues related to availability-based contracts with local authorities, despite the substantial fall in passenger volumes.
10 Oxford Economics, as at March 2021.
-1%
0%
1%
2%
3%
4%
5%
6%
Q1
2008
Q3
2008
Q1
2009
Q3
2009
Q1
2010
Q3
2010
Q1
2011
Q3
2011
Q1
2012
Q3
2012
Q1
2013
Q3
2013
Q1
2014
Q3
2014
Q1
2015
Q3
2015
Q1
2016
Q3
2016
Q1
2017
Q3
2017
Q1
2018
Q3
2018
Q1
2019
Q3
2019
Q1
2020
Q3
2020
Q1
2021
(%)
Eurozone, Central Bank policy rate U.K., Central Bank policy rateUSA, Central Bank policy rate Eurozone, interest rates swap, 5-yearU.K., interest rates swap, 5-year USA, interest rates swap, 5-year

Alternatives Research | APRIL 2021
Past performance is not a reliable indicator of future returns. Forecasts are based on assumptions, estimates, views and hypothetical models or analyses, which might prove inaccurate or incorrect.
/ 12
Equally, governments have represented a source of extraordinary financial support, often beyond what originally expected by lenders, such as for U.K. rail, where temporary agreements suspended the normal financial mechanisms of franchises, transferring revenue and cost risk to the government, with operators continuing to run day-to-day services for a pre-determined management fee.11
We expect that governments across mature OECD markets may in some cases continue to provide timely, extraordinary support to strategic infrastructure assets if necessary, either via direct funding, or indirectly via less stringent fiscal and regulatory conditions, in an attempt to preserve the operation of strategic assets.
2.3 Private infrastructure debt and the macroeconomic environment
The effect of a volatile economy may continue to influence credit risks. Institutional investors are increasingly interested in understanding how private infrastructure debt may perform through the macroeconomic cycle. We analysed the historical relationship of private infrastructure debt ratings and credit spreads with the macroeconomic cycle. While we identified a weak, delayed linkage between macroeconomic variables and credit ratings evolution, we found a more solid statistical relationship between macroeconomic variables and private infrastructure debt spreads that we used to forecast spreads across three different macroeconomic scenarios.
2.3.1 Infrastructure ratings in the macroeconomic cycle
Given the 'through-the-cycle’ nature of credit ratings, we did not identify a meaningful statistical relationship between infrastructure credit rating distributions and macroeconomic indicators, as also indicated by other studies. 12 Rating downgrades appear to be smoothed and delayed following the impact of an economic stress event, as rating agencies typically take a ‘through-the-cycle’ approach. Nevertheless, we identified a high level relationship between infrastructure ratings, defaults and the macroeconomic, country and regulatory factors.
11 U.K. Department of Transport, “Rail emergency measures during the COVID-19 pandemic”, 23 March 2020. 12 IMF, “Rating Through-the-Cycle: What does the Concept Imply for Rating Stability and Accuracy?”
GOVERNMENT DEBT/GDP AND 10 YEAR BOND YIELDS (%)
Source: Oxford Economics, as at March 2021. Past performance is not indicative of future results.
-2%
-1%
0%
1%
2%
3%
4%
5%
0%
50%
100%
150%
200%
250%
300%N
orw
ay
Irela
nd
Den
mar
k
Ger
man
y
Finl
and
Net
herla
nds
U.K
.
Can
ada
Spai
n
Aust
ria
Fran
ce
U.S
.
Portu
gal
Italy
10Y governm
ent bond yield (%)
Gov
ernm
ent D
ebt-t
o-G
DP
(%)
Government debt-to-GDP 2019 Government debt-to-GDP 2020 Government debt-to-GDP 2021E10Y government bond yield 2019 10Y government bond yield 2020 10Y government bond yield 2021E
Alternatives Research | APRIL 2021
Past performance is not a reliable indicator of future returns. Forecasts are based on assumptions, estimates, views and hypothetical models or analyses, which might prove inaccurate or incorrect.
/ 13
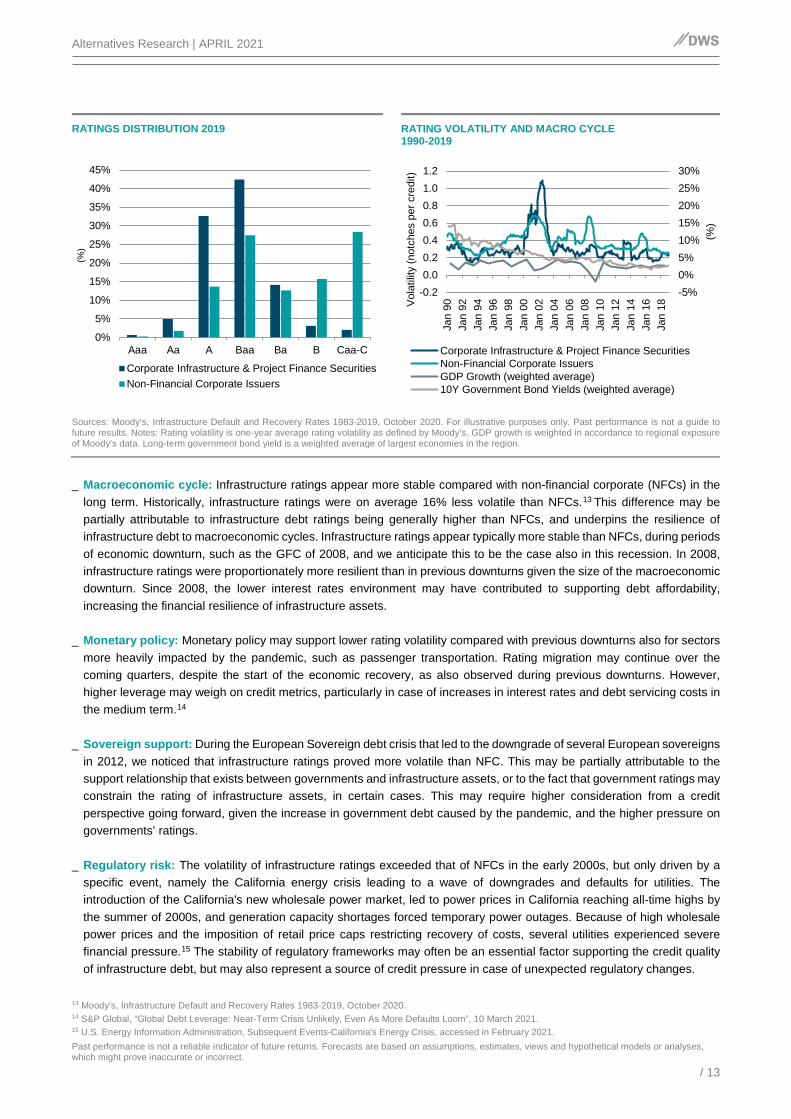
RATINGS DISTRIBUTION 2019 RATING VOLATILITY AND MACRO CYCLE 1990-2019
Sources: Moody’s, Infrastructure Default and Recovery Rates 1983-2019, October 2020. For illustrative purposes only. Past performance is not a guide to future results. Notes: Rating volatility is one-year average rating volatility as defined by Moody’s. GDP growth is weighted in accordance to regional exposure of Moody’s data. Long-term government bond yield is a weighted average of largest economies in the region.
_ Macroeconomic cycle: Infrastructure ratings appear more stable compared with non-financial corporate (NFCs) in the
long term. Historically, infrastructure ratings were on average 16% less volatile than NFCs.13 This difference may be partially attributable to infrastructure debt ratings being generally higher than NFCs, and underpins the resilience of infrastructure debt to macroeconomic cycles. Infrastructure ratings appear typically more stable than NFCs, during periods of economic downturn, such as the GFC of 2008, and we anticipate this to be the case also in this recession. In 2008, infrastructure ratings were proportionately more resilient than in previous downturns given the size of the macroeconomic downturn. Since 2008, the lower interest rates environment may have contributed to supporting debt affordability, increasing the financial resilience of infrastructure assets.
_ Monetary policy: Monetary policy may support lower rating volatility compared with previous downturns also for sectors
more heavily impacted by the pandemic, such as passenger transportation. Rating migration may continue over the coming quarters, despite the start of the economic recovery, as also observed during previous downturns. However, higher leverage may weigh on credit metrics, particularly in case of increases in interest rates and debt servicing costs in the medium term.14
_ Sovereign support: During the European Sovereign debt crisis that led to the downgrade of several European sovereigns in 2012, we noticed that infrastructure ratings proved more volatile than NFC. This may be partially attributable to the support relationship that exists between governments and infrastructure assets, or to the fact that government ratings may constrain the rating of infrastructure assets, in certain cases. This may require higher consideration from a credit perspective going forward, given the increase in government debt caused by the pandemic, and the higher pressure on governments’ ratings.
_ Regulatory risk: The volatility of infrastructure ratings exceeded that of NFCs in the early 2000s, but only driven by a
specific event, namely the California energy crisis leading to a wave of downgrades and defaults for utilities. The introduction of the California's new wholesale power market, led to power prices in California reaching all-time highs by the summer of 2000s, and generation capacity shortages forced temporary power outages. Because of high wholesale power prices and the imposition of retail price caps restricting recovery of costs, several utilities experienced severe financial pressure.15 The stability of regulatory frameworks may often be an essential factor supporting the credit quality of infrastructure debt, but may also represent a source of credit pressure in case of unexpected regulatory changes.
13 Moody’s, Infrastructure Default and Recovery Rates 1983-2019, October 2020. 14 S&P Global, “Global Debt Leverage: Near-Term Crisis Unlikely, Even As More Defaults Loom”, 10 March 2021. 15 U.S. Energy Information Administration, Subsequent Events-California's Energy Crisis, accessed in February 2021.
-5%0%5%10%15%20%25%30%
-0.20.00.20.40.60.81.01.2
Jan
90Ja
n 92
Jan
94Ja
n 96
Jan
98Ja
n 00
Jan
02Ja
n 04
Jan
06Ja
n 08
Jan
10Ja
n 12
Jan
14Ja
n 16
Jan
18
(%)
Vol
atili
ty (n
otch
es p
er c
redi
t)
Corporate Infrastructure & Project Finance SecuritiesNon-Financial Corporate IssuersGDP Growth (weighted average)10Y Government Bond Yields (weighted average)
0%
5%
10%
15%
20%
25%
30%
35%
40%
45%
Aaa Aa A Baa Ba B Caa-C
(%)
Corporate Infrastructure & Project Finance SecuritiesNon-Financial Corporate Issuers

Alternatives Research | APRIL 2021
Past performance is not a reliable indicator of future returns. Forecasts are based on assumptions, estimates, views and hypothetical models or analyses, which might prove inaccurate or incorrect.
/ 14
2.3.2 Infrastructure defaults and recovery rates in the macroeconomic cycle
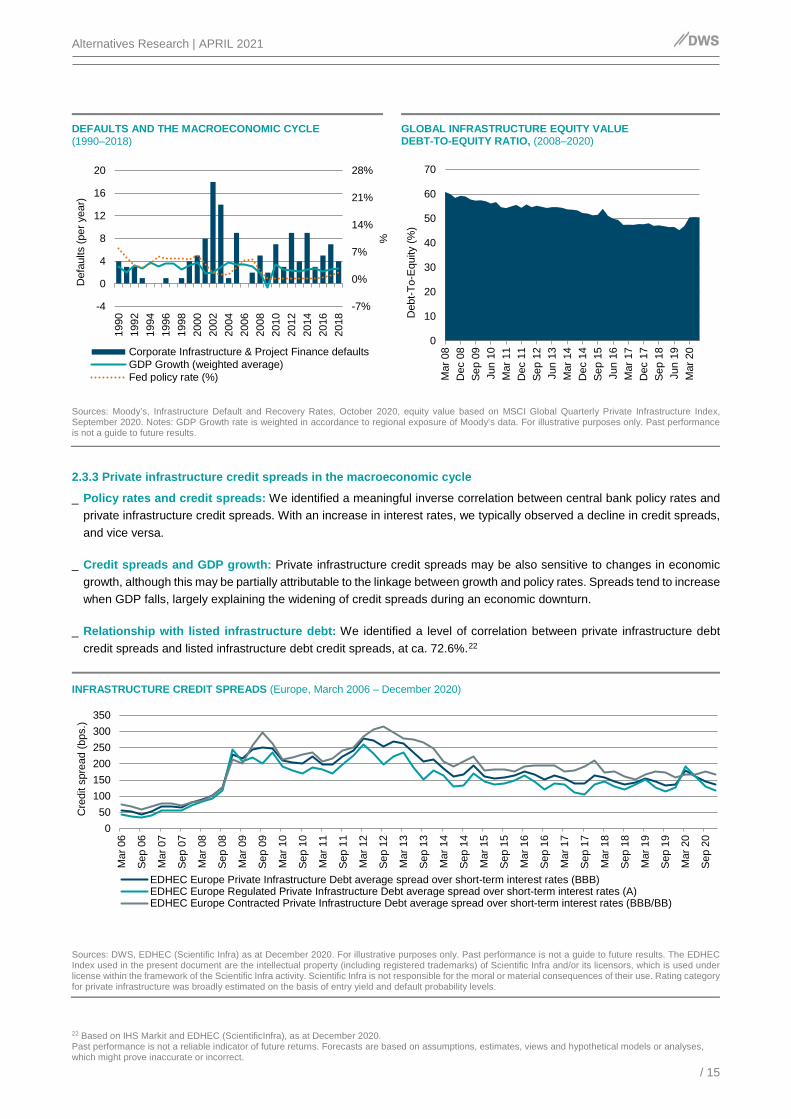
_ Default rates: Data indicate that infrastructure debt has historically generated default rates lower than equally rated NFCs. The ten-year average cumulative default rate for IG BBB-rated corporate and project finance infrastructure debt is at 2.8%, compared with 3.0% for equally rated corporate debt. This default rate benefit progressively amplifies moving further down the rating scale from IG to HY: for HY BB-rated corporate and project finance infrastructure debt, the average cumulative default rate is at 5.9%, compared with the NFCs default rate at 10.2% after 6 years, a period consistent with the average maturity of HY infrastructure debt. For HY B-rated corporate and project finance infrastructure debt, the six-year average cumulative default rate is at 18.2%, also significantly below the default rate of equally rated NFCs at 25.6%.16
_ Defaults and downturns: Historically, infrastructure defaults increased noticeably in two periods: in the early 2000s and after the Great Financial Crisis in 2008-2009. These two periods correspond with declines in economic growth. Data show that historically, 75% of infrastructure defaults were in the HY rating category one year before default, compared with 98% of NFC defaulted entities. An increase in defaults appears to be broadly identifiable between 6 and 18 months after an initial macroeconomic stress event, such as a substantial decline in economic growth, or a sudden change in policy.
_ Why does infrastructure default: The peak of defaults for infrastructure debt took place in 2002, in conjunction with a
specific regulatory event in California.17 Beyond regulatory risk, technological risk, counterparty risk, and volume/ price risk linked to merchant exposure appear to be representing the other key factors that have historically led to defaults for infrastructure debt.18 From a sector perspective, we note that historically, the highest number of defaults was recorded in the unregulated Utilities & Power sector frequently exposed to merchant power price risk, with defaults representing 34% of the total in 1983-2019, although data are specifically influenced by the 2002 California energy regulation crisis.
_ Covid-19 and default risk: Based on historical evidence, we expect default levels to increase across the wider debt space over the coming 6-18 months, including for infrastructure debt. However, we expect infrastructure debt to continue to prove resilient from a default perspective compared with NFCs, with default levels remaining comparable to previous cycles. Expectations may differ by sector and rating category. The expected low interest rate environment may mitigate credit risk, supporting debt service capacity. However, default risk may increase if cash flows and earnings do not return to pre-pandemic trends before governments withdraw their fiscal or monetary stimulus.19
_ Recovery rates: Infrastructure debt has historically demonstrated higher recovery rates compared with non-financial
corporates, for both senior secured and unsecured debt. More in detail, senior secured infrastructure debt demonstrated a recovery rate of 72%, compared with 55% for equivalent non-financial corporates debt. Recovery rates for senior unsecured infrastructure debt are also consistently higher (56%) compared with senior unsecured NFCs (38%).20
_ Equity valuations and recovery rates: Equity valuations and leverage may differ significantly by infrastructure sector,
but may support recovery rates for infrastructure debt. Over the past decade, we have generally observed a continued improvement in the equity valuations of infrastructure assets, with Debt-to-Equity ratios decreasing from ca. 60% in 2008 closer to 45% in 2019, when looking at the market with the data provided by the MSCI Global Quarterly Private Infrastructure Index. Covid-19 has led to a contraction in equity valuations, with Debt-To-Equity ratios closer to 50% in September 2020. We already observed a broad recovery in infrastructure valuations in 2021, and expect a similar pattern this year for sectors affected by the pandemic. In the medium term, a material increase in interest rates may contribute to cap equity valuations, something that investors may reflect in their stress case credit scenarios.21
16 Moody’s, Infrastructure Default and Recovery Rates 1983-2019, October 2020. 17 Moody’s, Infrastructure Default and Recovery Rates 1983-2019, October 2020. 18 S&P, Lessons Learned From 20 Years Of Rating Global Project Finance Debt, October 2014. 19 S&P Global, “Global Debt Leverage: Near-Term Crisis Unlikely, Even As More Defaults Loom”, 10 March 2021. 20 Moody’s, Infrastructure Default and Recovery Rates 1983-2019, October 2020. 21 Based on MSCI Global Quarterly Private Infrastructure Index, as at September 2020.
Alternatives Research | APRIL 2021
Past performance is not a reliable indicator of future returns. Forecasts are based on assumptions, estimates, views and hypothetical models or analyses, which might prove inaccurate or incorrect.
/ 15
DEFAULTS AND THE MACROECONOMIC CYCLE (1990–2018)
GLOBAL INFRASTRUCTURE EQUITY VALUE DEBT-TO-EQUITY RATIO, (2008–2020)
Sources: Moody’s, Infrastructure Default and Recovery Rates, October 2020, equity value based on MSCI Global Quarterly Private Infrastructure Index, September 2020. Notes: GDP Growth rate is weighted in accordance to regional exposure of Moody’s data. For illustrative purposes only. Past performance is not a guide to future results.
2.3.3 Private infrastructure credit spreads in the macroeconomic cycle
_ Policy rates and credit spreads: We identified a meaningful inverse correlation between central bank policy rates and private infrastructure credit spreads. With an increase in interest rates, we typically observed a decline in credit spreads, and vice versa.
_ Credit spreads and GDP growth: Private infrastructure credit spreads may be also sensitive to changes in economic
growth, although this may be partially attributable to the linkage between growth and policy rates. Spreads tend to increase when GDP falls, largely explaining the widening of credit spreads during an economic downturn.
_ Relationship with listed infrastructure debt: We identified a level of correlation between private infrastructure debt
credit spreads and listed infrastructure debt credit spreads, at ca. 72.6%.22
INFRASTRUCTURE CREDIT SPREADS (Europe, March 2006 – December 2020)
Sources: DWS, EDHEC (Scientific Infra) as at December 2020. For illustrative purposes only. Past performance is not a guide to future results. The EDHEC Index used in the present document are the intellectual property (including registered trademarks) of Scientific Infra and/or its licensors, which is used under license within the framework of the Scientific Infra activity. Scientific Infra is not responsible for the moral or material consequences of their use. Rating category for private infrastructure was broadly estimated on the basis of entry yield and default probability levels.
22 Based on IHS Markit and EDHEC (ScientificInfra), as at December 2020.
050
100150200250300350
Mar
06
Sep
06
Mar
07
Sep
07
Mar
08
Sep
08
Mar
09
Sep
09
Mar
10
Sep
10
Mar
11
Sep
11
Mar
12
Sep
12
Mar
13
Sep
13
Mar
14
Sep
14
Mar
15
Sep
15
Mar
16
Sep
16
Mar
17
Sep
17
Mar
18
Sep
18
Mar
19
Sep
19
Mar
20
Sep
20
Cre
dit s
prea
d (b
ps.)
EDHEC Europe Private Infrastructure Debt average spread over short-term interest rates (BBB)EDHEC Europe Regulated Private Infrastructure Debt average spread over short-term interest rates (A)EDHEC Europe Contracted Private Infrastructure Debt average spread over short-term interest rates (BBB/BB)
-7%
0%
7%
14%
21%
28%
-4
0
4
8
12
16
20
1990
1992
1994
1996
1998
2000
2002
2004
2006
2008
2010
2012
2014
2016
2018
%
Def
aults
(per
yea
r)
Corporate Infrastructure & Project Finance defaultsGDP Growth (weighted average)Fed policy rate (%)
0
10
20
30
40
50
60
70
Mar
08
Dec
08
Sep
09Ju
n 10
Mar
11
Dec
11
Sep
12Ju
n 13
Mar
14
Dec
14
Sep
15Ju
n 16
Mar
17
Dec
17
Sep
18Ju
n 19
Mar
20
Deb
t-To-
Equ
ity (%
)
Alternatives Research | APRIL 2021
Past performance is not a reliable indicator of future returns. Forecasts are based on assumptions, estimates, views and hypothetical models or analyses, which might prove inaccurate or incorrect.
/ 16
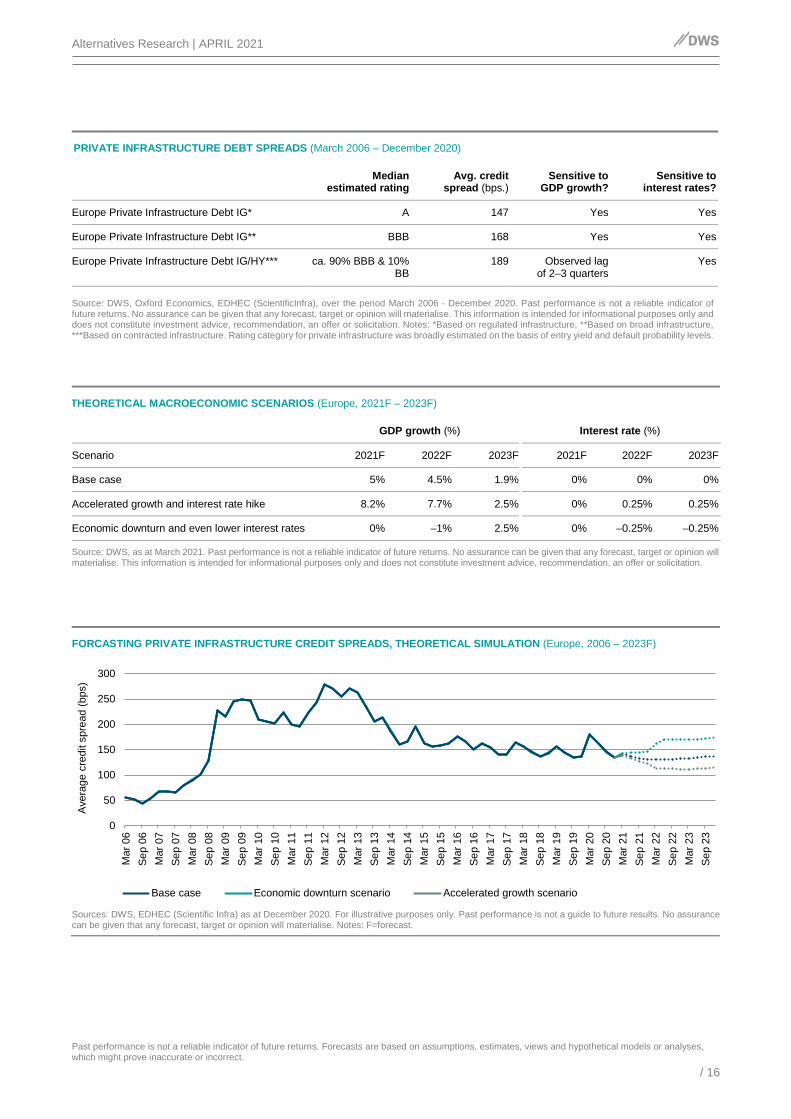
FORCASTING PRIVATE INFRASTRUCTURE CREDIT SPREADS, THEORETICAL SIMULATION (Europe, 2006 – 2023F)
Sources: DWS, EDHEC (Scientific Infra) as at December 2020. For illustrative purposes only. Past performance is not a guide to future results. No assurance can be given that any forecast, target or opinion will materialise. Notes: F=forecast.
PRIVATE INFRASTRUCTURE DEBT SPREADS (March 2006 – December 2020)
Median estimated rating
Avg. credit spread (bps.)
Sensitive to GDP growth?
Sensitive to interest rates?
Europe Private Infrastructure Debt IG* A 147 Yes Yes
Europe Private Infrastructure Debt IG** BBB 168 Yes Yes
Europe Private Infrastructure Debt IG/HY*** ca. 90% BBB & 10% BB
189 Observed lag of 2–3 quarters
Yes
Source: DWS, Oxford Economics, EDHEC (ScientificInfra), over the period March 2006 - December 2020. Past performance is not a reliable indicator of future returns. No assurance can be given that any forecast, target or opinion will materialise. This information is intended for informational purposes only and does not constitute investment advice, recommendation, an offer or solicitation. Notes: *Based on regulated infrastructure, **Based on broad infrastructure, ***Based on contracted infrastructure. Rating category for private infrastructure was broadly estimated on the basis of entry yield and default probability levels.
THEORETICAL MACROECONOMIC SCENARIOS (Europe, 2021F – 2023F)
GDP growth (%) Interest rate (%)
Scenario 2021F 2022F 2023F 2021F 2022F 2023F
Base case 5% 4.5% 1.9% 0% 0% 0%
Accelerated growth and interest rate hike 8.2% 7.7% 2.5% 0% 0.25% 0.25%
Economic downturn and even lower interest rates 0% –1% 2.5% 0% –0.25% –0.25%
Source: DWS, as at March 2021. Past performance is not a reliable indicator of future returns. No assurance can be given that any forecast, target or opinion will materialise. This information is intended for informational purposes only and does not constitute investment advice, recommendation, an offer or solicitation.
0
50
100
150
200
250
300
Mar
06
Sep
06M
ar 0
7Se
p 07
Mar
08
Sep
08M
ar 0
9Se
p 09
Mar
10
Sep
10M
ar 1
1Se
p 11
Mar
12
Sep
12M
ar 1
3Se
p 13
Mar
14
Sep
14M
ar 1
5Se
p 15
Mar
16
Sep
16M
ar 1
7Se
p 17
Mar
18
Sep
18M
ar 1
9Se
p 19
Mar
20
Sep
20M
ar 2
1Se
p 21
Mar
22
Sep
22M
ar 2
3Se
p 23
Ave
rage
cre
dit s
prea
d (b
ps)
Base case Economic downturn scenario Accelerated growth scenario

Alternatives Research | APRIL 2021
Past performance is not a reliable indicator of future returns. Forecasts are based on assumptions, estimates, views and hypothetical models or analyses, which might prove inaccurate or incorrect.
/ 17
2.3.4 Forecasting private infrastructure debt spreads across macroeconomic scenarios
_ Forecasting credit spreads: Based on statistical regressions and historical data, we provide a high level indication of the potential evolution of private infrastructure credit spreads across different macroeconomic scenarios. The analysis includes a base case and two theoretical scenarios for the period 2021–2023 in Europe.
_ Scenario analysis: In our base case, GDP growth may rebound in 2021, but medium-term growth may remain sluggish,
and central bank interest rates remain at 0%. In this scenario, credit spreads are expected to remain relatively stable throughout 2023. In the ‘accelerated growth case’ we look at a scenario in which GDP rebounds more strongly in 2021, and central bank rates increase by 25 bps. in 2022. In this scenario, we would envisage credit spreads to reduce from 140 bps. to about 115 bps. In this scenario, higher inflation and central bank rates may nevertheless drive an increase in entry yields, more than compensating for this reduction. In the downturn scenario we look at the pandemic influencing economic growth until 2022, driving central bank interest rates into negative territory by 25 bps. In this scenario, we would envisage a widening in credit spreads to about 175 bps, with entry yields capped by lower central bank rates and possibly lower inflation expectations.23
23 Source: DWS, as at March 2021. Past performance is not a reliable indicator of future returns. No assurance can be given that any forecast, target or opinion
will materialise. This information is intended for informational purposes only and does not constitute investment advice, recommendation, an offer or solicitation.

Alternatives Research | APRIL 2021
Past performance is not a reliable indicator of future returns. Forecasts are based on assumptions, estimates, views and hypothetical models or analyses, which might prove inaccurate or incorrect.
/ 18
3 / Infrastructure debt credit outlook
Below we provide a short-term credit outlook by sector. We also look at long-term credit trends, and how energy transition and digitalisation may impact the business fundamentals of different infrastructure sectors, representing opportunities or threats for their credit profiles.
3.1 Summary credit outlook by sector
INFRASTRUCTURE CREDIT PERFORMANCE OUTLOOK (Estimate by sector)
Credit outlook Industry credit trends
Sector Short-Term (12–18 months) Long-Term (5–10 Years)
Transportation
Airports Negative Stable/Positive
Toll Roads Stable/Negative Stable/Negative
Ports Stable Stable
Rail (Passenger and Freight) Stable/Negative Stable/Positive
Public Transportation Stable/Negative Stable
Logistics Stable/Positive Stable/Positive
Energy & utilities
Electricity Generation Coal Negative Negative
Electricity Generation Gas Stable Stable/Negative
Electricity Generation Renewables Stable Stable
Regulated Networks Stable/Negative Stable
Integrated Utilities Stable Stable/Negative
Oil & Gas Midstream Energy Stable/Negative Stable/Negative
Circular economy
Waste Management (EfW & Recycling) Stable Stable
Digital infrastructure
Data Centres Positive Positive
Fibre Networks Stable/Positive Positive
Telecom Towers Stable Stable
Social infrastructure and PPPs
Social Housing Stable Stable
Higher Education Accommodation Negative Stable/Negative
Healthcare Stable Stable
Source: DWS, as at March 2021. Past performance is not a reliable indicator of future returns. No assurance can be given that any forecast, target or opinion will materialise. This information is intended for informational purposes only and does not constitute investment advice, recommendation, an offer or solicitation.
Alternatives Research | APRIL 2021
Past performance is not a reliable indicator of future returns. Forecasts are based on assumptions, estimates, views and hypothetical models or analyses, which might prove inaccurate or incorrect.
/ 19
3.2 Transportation
_ Credit outlook: In 2020, Covid-19 caused an unprecedented disruption to passenger travel, particularly aviation and public transport. Given the volume neutral, contracted nature of public transportation revenues, generally the sector has shown resilient credit performance despite Covid-19. Toll roads, despite having observed an initial contraction in passenger volumes, have proven relatively resilient from a credit perspective. In the airport sector, with revenues declining sharply in 2020, lenders have so far adopted a wait-and-see approach, providing temporary waivers to covenants, as they expect a gradual improvement in passenger volumes during 2021, and continue to see the sector as IG in the long term. We expect passenger mobility levels to remain sluggish in the first half of 2021, and anticipate the recovery to vary by sector, but generally to protract into the medium term. Global supply chains proved relatively resilient, and freight volumes are almost back to pre-Covid levels, supporting ports’ credit profiles. The logistics sector experienced continued expansion during the crisis, but weaker demand driven by high unemployment may cap growth in 2021.
_ Industry trends: Covid-19 may have structural consequences on passenger volumes in the aviation and public
transportation sectors, something that investors may want to factor in lending conditions, particularly when looking at potential credit resilience to stress cases. We expect these sectors, alongside logistics to expand in the long term on the back of solid demographic trends and supportive policy. Liberalisations are ongoing across rail and public transportation, and we continue to anticipate a gradual shift from road to rail for freight. Transportation is exposed to structural changes that may shape credit fundamentals over the coming decade. Decarbonisation represents a growing topic for transportation. Technology may continue to drive changes across freight logistics and passenger transportation via urban micro mobility and car sharing platforms.
3.3 Energy, utilities and circular economy
_ Energy generation: Covid-19 has initially resulted in a sharp contraction in global energy demand and a decline of CO2 emissions. However, as at the beginning of 2021, both demand and power prices appear to have rebounded to pre-Covid levels, with the credit performance of the sector proving more resilient than initially expected. European CO2 prices exceeded EUR 40/tonne as at March 2021. With the European Union and the U.S having committed to achieving net zero by 2050, regulation is expected to increasingly support low-carbon technologies, pushing coal generation out of the merit order. We anticipate the credit profile of more efficient gas generators to remain supportive. However, the long-term risk of stranded, thermal assets is generally increasing, particularly for less efficient technologies, amid tighter emission frameworks, and lenders’ more stringent sustainable financing criteria.
_ Renewables: We expect renewables to accelerate in the coming years, as they continue to reach grid parity, and we
expect increased power prices volatility as a result. The Power Purchase Agreements (PPA) market appears increasingly liquid and supports long-term price stabilisation and financing. We expect projects to contemplate the installation of battery storage as a solution to optimise project cash flows and hedge from power price volatility. Renewable energy projects continue to experience favourable credit conditions, but projects with long-term refinancing risk may be subject to scrutiny given uncertainty on power price evolution.
_ Utilities: We expect utilities to be at the centre of a new energy system, driving investment in distributed renewables
plants, alongside the provision of new services, such as behind-the-metre and energy efficiency services, and we may see the gradual introduction of demand response services and the emergence of smarter electricity grids. Generally the marginality of new services may be below that of energy generation and transmission. As a result, we expect the credit profile of integrated utilities to be under potential pressure in the long term, particularly in case of companies with comparatively high levels of leverage, or that do not rely on regulated networks to stabilise their credit profiles.
_ Oil & gas midstream: In the first half of 2020, Covid-19 and a sharp drop in crude oil prices have impacted the Oil & Gas
sector, but midstream assets have proven resilient, particularly if supported by an IG credit profile, underpinned by customer diversification and take or pay contracts providing stability to revenues. In the second half of 2020, we have seen a gradual improvement in business conditions, with a rebound in demand and prices, and reductions in capex plans

Alternatives Research | APRIL 2021
Past performance is not a reliable indicator of future returns. Forecasts are based on assumptions, estimates, views and hypothetical models or analyses, which might prove inaccurate or incorrect.
/ 20
for upstream players contributing to stabilising credit metrics.24 The improving economic outlook may contribute to a further stabilisation in 2021. Nevertheless, in our view, counterparty risk may continue to weigh on the midstream sector in the medium term. While we continue to have a constructive credit view on the midstream energy sector, supporting medium-term lending conditions, the sector may be exposed to long-term structural changes, with highly levered assets with refinancing risk potentially exposed to credit pressure. Therefore, we see the sector more favourably positioned for strategies focusing on short- or medium-term duration lending, rather than for long-term lending strategies. Transport electrification may also represent a threat for the sector in the long-term. Recently, rating agencies took a number of negative rating actions on major oil and gas companies to factor in greater industry risks, as these companies bear the burden of sustaining credit quality in the face of decarbonisation.25
_ Circular economy: Waste volumes proved resilient during Covid-19, with domestic waste compensating for the reduction in industrial and commercial waste. In 2021, we expect waste volumes to continue rebounding compared with 2020, but anticipate that economic uncertainty may cap the speed of recovery.The credit profile of the waste management sector and Energy-from-Waste (EfW) is stable, in our view, and we expect the long-term industry credit profile to continue to be supported by regulation and broadly stable gate fees across mature European markets. However, we anticipate that an increased focus on sustainable packaging and recycling may cap domestic waste volumes in the long term, supported by gradually more stringent regulatory requirements.
3.4 Digital infrastructure
_ Credit outlook: Our credit outlook for digital infrastructure is positive, particularly for data centres and fibre. Covid-19 has accelerated the transition towards digitalisation. We expect cost of debt to compress over time, as the sector matures, and investors get more comfortable with its credit fundamentals. Moreover, we anticipate cost of equity to continue falling over the coming years, supporting equity cushions. Nevertheless, investors may approach asset growth prudently, when underwriting loan transactions, particularly for assets exposed to development risk and comparatively higher leverage.
_ Industry trends: We expect continued sector growth, supported by evolving technology increasing data demand.
Investors may consider the effects of technological risks on the credit profile of borrowers, particularly when lending for the long-term.
3.5 Social infrastructure and PPPs
_ Credit outlook: Despite Covid-19, our credit outlook for social infrastructure is stable, supported by the IG credit profile of the sector. During Covid-19, PPP projects continued to be supported by their contracted or regulated revenue profile, stabilising earnings and credit metrics, but some PPP projects in the transportation sector may have experienced temporary volume declines impacting credit metrics. Our credit view remains supportive for healthcare and social housing, with regulation supporting cash flow resilience. Our credit outlook is negative for the higher education accommodation project sector, as Covid-19 may have substantially impacted demand in 2021, and only a limited number of assets may rely on university minimum occupancy guarantees.
_ Industry trends: We envisage the long-term credit profile of social infrastructure projects to remain stable, generally
supported by IG ratings and high cash flow resilience. Country and regulatory risk may increasingly be a credit factor to consider, particularly for projects with exposure to governments with budgetary pressure, as this may translate into a weakening of their credit profile. Looking at the higher education projects accommodation sector, we see an increased risk that Covid-19 may lead to an acceleration in sector innovation, with digital education partially replacing physical accommodation demand in the long term, and projects exposed to tighter credit conditions.
24 Fitch Ratings, “NA Midstream Energy Sector Outlook Improving in 2021 but Upstream Uncertainty Remains”, 4 December 2020. 25 S&P Global, “S&P Global Ratings Takes Multiple Rating Actions On Major Oil And Gas Companies To Factor In Greater Industry Risks”, 25 January 2021.

Alternatives Research | APRIL 2021
Past performance is not a reliable indicator of future returns. Forecasts are based on assumptions, estimates, views and hypothetical models or analyses, which might prove inaccurate or incorrect.
/ 21
4 / ESG and infrastructure credit risk
4.1 Policy and regulatory update
_ ESG policy initiatives: The centrality of ESG for infrastructure investment has been increasing steadily. The Principles for Responsible Investment were launched in 2006, as a United Nations-supported international network of investors working to incorporate environmental, social and corporate governance issues into investment practices across asset classes, including infrastructure. These principles, now recognised as a standard, aim to incorporate ESG factors into the investment analysis, ownership policies, and reporting.
An additional key acceleration to the integration of ESG by the infrastructure investment community was provided by the sustainable development goals (“SDGs”) set out by the United Nations (“UN”). SDGs, a call for action of 17 global sustainability goals, were set in 2015. Infrastructure investment plays a fundamental, direct role for the achievement of several of the SDG objectives by 2030, such as with SDG 6, focusing on the provision of clean water and sanitation, SDG 11, looking at the development of sustainable cities and communities, or SDG 13, focusing on climate change. Recently, infrastructure companies such as utilities have started to issue bonds linked to SDGs’ sustainability targets.26
_ Regulatory evolution: Particularly in Europe, policymakers are taking a range of actions to steer capital towards the achievement of ESG objectives. As a signatory to the Paris Agreement and the UN SDGs, the European Union is committed to implementing sustainability and climate change into the economy, and has been actively incorporating ESG in investment regulation. From March 2021, the EU Sustainable Finance Disclosure Regulation (SFDR)27 and the related Taxonomy for sustainable activities28 provide a classification tool to establish the degree to which an investment may be considered environmentally sustainable. To qualify as sustainable, the investment may substantially contribute to at least one of the six environmental objectives (Article 3), including climate change, protection of water resources, transition to circular economy, pollution prevention and protection of biodiversity, complying with minimum safeguards. Regulation initially focuses on environmental aspects, but may expand to social and governance factors over time.29 Regulation may also lead to an acceleration of infrastructure investment debt strategies that promote social and environmental investment objectives (Article 8) or that have sustainable investment as their objective (Article 9).
EU regulation30 provides also guidance under SFDR on the integration of sustainability risks in the investment decision process and related disclosures (Article 3 and 6) for sustainability related strategies. Under SFDR, a sustainability risk is defined as an environmental, social or governance event or condition that, if it occurs, could cause an actual or a potential material negative impact on the value of an investment. In our view, regulation may contribute to accelerating the integration of ESG risks in assessment of infrastructure debt transactions. While Europe is leading the way, we anticipate regulation in other regions, such as North America and APAC to follow the European example over the coming years.
26 Enel Group, “Sustainability Linked Bond – Investor Presentation”, October 2020. 27 Regulation (EU) 2020/852 of the European Parliament and of the Council of 18 June 2020 on the establishment of a framework to facilitate sustainable
investment, and amending Regulation (EU) 2019/2088, 18 June 2020. 28 European Commission, “Sustainable finance taxonomy – Regulation (EU), 2020/852. 29 Factset, “The EU Taxonomy Regulation: An Overview”, 13 July 2020. 30 Regulation (EU) 2020/852 of the European Parliament and of the Council of 18 June 2020 on the establishment of a framework to facilitate sustainable
investment, and amending Regulation (EU) 2019/2088, 18 June 2020.

Alternatives Research | APRIL 2021
Past performance is not a reliable indicator of future returns. Forecasts are based on assumptions, estimates, views and hypothetical models or analyses, which might prove inaccurate or incorrect.
/ 22
4.2 Incorporating ESG risks in infrastructure credit analysis
4.2.1 ESG risk integration
_ An evolving framework: More infrastructure investors aim to integrate ESG risks in their investment practices. This poses some challenges: the classification of ESG is imprecise and dynamic, i.e. it may evolve over time, there are data gaps and there are yet no universally accepted definitions and metrics: the term ESG may refer to a broad range of qualitative and quantitative considerations. We have observed a proliferation of standards and approaches over time. These may differ in the objective of ESG risk integration, in the definition of infrastructure, in the weights adopted for the various factors, and in the type of indicators adopted.31 We expect regulation to increasingly support transparency and robustness of criteria. We observe that private infrastructure debt providers may increasingly consider Second Party Opinions to ensure the alignment of their methodologies such as the Green Loans principles.32
In 2009, the industry-driven organization GRESB started to provide assessments and benchmarking on material issues in the sustainability performance of real asset investments, and represents today a benchmarking standard. GRESB methodologies provide assessments on funds and assets, and are aligned with international reporting frameworks, such as GRI, PRI, SASB, DJSI, TCFD recommendations, the Paris Climate Agreement, UN SDGs, region and country specific disclosure guidelines and regulations. We expect that GRESB to gradually expand to infrastructure debt providers in the same way it does infrastructure equity providers.
_ The double materiality challenge: We observe a progressively stronger focus of private infrastructure debt investors on
assessing the financial materiality of ESG risks, as this may have more direct repercussions on the financial performance of an infrastructure assets, and consequently on its credit quality. The industry may also gradually focus more on double materiality, particularly for strategies having impact investing as their objective, setting conditions for lending that are linked to ESG real world outcomes and then measuring and reporting on these ESG factors from a non-financial perspective. In particular, net zero CO2 emissions goals appear to be increasingly adopted by mainstream investors. However, we generally understand that today the potential lack of consensus on ESG indicators and reliable data, may still somewhat represent a challenge, and even potentially translate into a risk for investors, including asset mispricing. We anticipate limitations to be gradually overcome as consensus around standard and data emerges.
_ ESG financial risk materiality: The exposure to ESG risks may vary materially across infrastructure assets. Adopting an
ESG methodology to evaluate the financial materiality of industry and sector-specific ESG factors, may represent an opportunity to mitigate the impact of ESG risks on credit ratios, default and recovery rates, supporting risk-adjusted returns, particularly for longer duration assets. With this approach, the focus may be on the impact of ESG risks on the asset’s future cash flows in relation to its ability to service its financial obligations and obtain liquidity for refinancing purposes. If ESG risks do represent a material credit risk, this information is used to adjust the credit rating. If ESG risks not appear to pose a material cash-flow risk, for financial obligations, ESG risks may not have a direct impact on credit quality.
_ Upside potential: Generally, ESG factors may have greater downside risk than upside potential on credit quality and cost
of borrowing. However, ESG factors may also provide an indication of upside potential to the credit performance of an infrastructure asset. For example, corporate governance arrangements may support long-term decision making, financial performance and credit quality. Identifying positive ESG credit factors may inform transaction pricing, but also act as potential early indicator for future rating upgrades.
_ Time horizon: There appears to be no ideal time horizon for assessing ESG risks for private infrastructure debt, as these
depend on the nature of the factors considered. Near-term risks appear to have more direct impact on credit quality, given the higher level of probability and materiality. Longer-term ESG risks may be more difficult to incorporate in the analysis, and their impact on financial performance may also be less certain, given the lower ability to assess probability and take mitigating actions. ESG-related event risks, such as natural disasters, may be difficult to assess in terms of probability, may take place both in the short-term and long-term, and have a material impact on credit performance. Given the long duration of infrastructure loans, investors may focus on ESG risks from a medium-to-long-term perspective, in line with the maturity profile of the underlying financial obligation. Infrastructure debt loans in the HY space may have shorter
31 EDHEC Infrastructure Institute, “Towards a Scientific Approach to ESG for Infrastructure Investors”, March 2021. 32 Loan Market Association, Green Loan Principles, 2018.

Alternatives Research | APRIL 2021
Past performance is not a reliable indicator of future returns. Forecasts are based on assumptions, estimates, views and hypothetical models or analyses, which might prove inaccurate or incorrect.
/ 23
durations, but an ESG approach focusing on the medium-to-long-term perspective may be equally relevant given the fact that loans may face refinancing risk, and new lenders may consider the impact ESG risks on credit quality at the time of refinancing.
4.2.2 ESG infrastructure debt risk summary overview
Below, we provide a generic, high level description of the main ESG risks by macro category (Environment, Social and Governance) that may be considered for the credit analysis of private infrastructure debt transactions. We do not provide a detailed overview of key indicators that may be adopted to measure the exposure to these risks, as scope and weights of these factors may change by sector and across methodologies.
_ Environmental risks: Environmental risks are generally seen as the most relevant risk category from a credit perspective. Environmental risks may arise from climate change related exposure, such as with physical climate risks and carbon transition, but may also relate to other environmental aspects, such as water risk, pollution, natural capital and biodiversity. Environmental hazards may impact the credit quality and financial performance of an infrastructure assets via the manifestation of adverse effects, such as with natural disasters. These effects and their impact on credit quality may differ in terms of impact and timing and may be difficult to calibrate correctly into credit risk considerations. In particular, the effects of climate change on temperature increases and more frequent extreme weather events may be severe, difficult to predict and have a material credit impact.
Given the increase in physical climate risks, we acknowledge the recent effort made by the infrastructure investment community in supporting decarbonisation. The Task Force on Climate-related financial disclosures (TCFD) was established in December of 2015 with the goal of developing a set of voluntary climate-related financial risk disclosures on climate change.33 More recently, the Coalition for Climate Resilient Investment (CCRI),34 started incorporating the systematic integration of physical climate risks in infrastructure valuations, investment appraisals and capital allocation.
Environmental risks may also impact the credit quality of an infrastructure asset through regulation. For example legislation may disincentive coal electricity generation, leading to plants becoming stranded assets with no residual economic value. In case of infrastructure assets exposed to predictable regulatory frameworks, something more common across OECD markets, regulatory changes are normally relatively transparent and quantifiable from a credit perspective, and normally phased in over time. However in case of less mature regulatory frameworks, infrastructure debt investors may face material risks. Predictable regulation can also act as a de-risking factor for environmental risks, as it may support infrastructure assets in incorporating mitigating measures, for example by limiting pollution levels via the imposition of strict energy efficiency levels.
33 TCFD, “Recommendations of the Task Force on Climate-related Financial Disclosures”, 2017. 34 Coalition for Climate Resilient Investment, https://resilientinvestment.org/.
ESG RISKS CATEGORIES (Summary overview)
Environmental risks Social risks Governance risks
Carbon transition Customer relations Financial strategy & risk management
Physical climate risks Human capital Management credibility & track record
Water management Demographic & societal trends Organisational structure
Waste and pollution Health & safety Compliance & reporting
Natural capital Responsible production Board structure, policies & procedures
Source: DWS, Moody’s Investor Service, as at March 2021. This information is intended for informational purposes only and does not constitute investment advice, recommendation, an offer or solicitation.

Alternatives Research | APRIL 2021
Past performance is not a reliable indicator of future returns. Forecasts are based on assumptions, estimates, views and hypothetical models or analyses, which might prove inaccurate or incorrect.
/ 24
_ Social risks: For infrastructure assets, social risks play a crucial role given the essential service provided to society. The credit impact of social risks can be material, both from a reputational perspective, and from a financial perspective. Investors increasingly look at factors such as stakeholders’ relations, human capital, demographic and societal trends, health and safety, and responsible production. Infrastructure assets generally tend to be exposed to strict legislative and regulatory requirements that contribute to increasing transparency and mitigating social risks, particularly in the case of Public-Private-Partnership (PPP) projects or regulated sectors. For example, in the case of electricity networks, regulation may link returns via incentives and penalties to the consultation of local communities on new projects, or impose high performance standards when it comes to power intermittency and efficiency levels.35 As infrastructure assets tend to expose the workforce to complex business operations, such as for power plants, infrastructure assets in mature markets are generally also characterised by high occupational health and safety regulatory requirements and standards.36
_ Governance risks: Corporate governance risks relate to the framework and processes that support strategic, operational
and financial decision making. The scope and impact of governance risks may be broad. From an ESG rating perspective, the focus is normally on those aspect that may influence the credit profile. Governance related risks broadly include financial strategy and risk management, management credibility and track record, organisational structure, compliance and reporting, board structure, policies and procedures.37
These risks are typically asset specific, and less related to external factors, such as regulation. For example, a weak board oversight may translate into a negative financial performance over time, or into legal costs and reputational issues in case of major breaches and misconduct. Generally, given their public-service nature, infrastructure assets tend to be exposed to transparent governance processes, particularly across countries with mature institutional frameworks, and governments representing a key stakeholder. In case of PPPs, concession agreements or regulated assets, there may be transparent policies in place, particularly with regard to ownership, management compensation, capital allocation and risk management functions. The strength and reach of these mechanisms can materially mitigate governance-related risk for infrastructure assets.38
35 S&P, ESG Industry Report Cards, 13 March 2019. 36 Moody’s Investor Service, “General Principles for Assessing Environmental, Social and Governance Risks: Proposed Methodology Update”,
23 September 2020. 37 Moody’s Investor Service, “General Principles for Assessing Environmental, Social and Governance Risks: Proposed Methodology Update”,
23 September 2020. 38 S&P, ESG Industry Report Cards, 13 March 2019.

Alternatives Research | APRIL 2021
This information is subject to change at any time, based upon economic, market and other considerations and should not be construed as a recommendation. Past performance is not indicative of future returns. Forecasts are not a reliable indicator of future performance. Forecasts are based on assumptions, estimates, opinions and hypothetical models that may prove to be incorrect. Investments come with risk. The value of an investment can fall as well as rise and your capital may be at risk. You might not get back the amount originally invested at any point in time. Source: DWS Investment GmbH
/ 25
Research & strategy—alternatives
OFFICE LOCATIONS: TEAM:
Chicago 222 South Riverside Plaza 34th Floor Chicago IL 60606-1901 United States Tel: +1 312 537 7000 Frankfurt Mainzer Landstrasse 11-17 60329 Frankfurt am Main Germany Tel: +49 69 71909 0 London Winchester House 1 Great Winchester Street London EC2N 2DB United Kingdom Tel: +44 20 754 58000 New York 875 Third Avenue 26th Floor New York NY 10022-6225 United States Tel: +1 212 454 3414 San Francisco 101 California Street 24th Floor San Francisco CA 94111 United States Tel: +1 415 781 3300 Singapore One Raffles Quay South Tower 20th Floor Singapore 048583 Tel: +65 6538 7011 Tokyo Sanno Park Tower 2-11-1 Nagata-cho Chiyoda-Ku 18th Floor Tokyo Japan Tel: +81 3 5156 6000
Global
Kevin White, CFA Co-Head of Real Estate Research & Strategy [email protected]
Simon Wallace Co-Head of Real Estate Research & Strategy [email protected]
Gianluca Minella Head of Infrastructure Research [email protected]
Americas
Brooks Wells Head of Research, Americas [email protected] Ross Adams Industrial Research [email protected] Ana Leon Retail Research [email protected]
Liliana Diaconu, CFA Office Research [email protected] Ryan DeFeo Property Market Research [email protected] Joseph Pecora, CFA Apartment Research [email protected]
Europe
Tom Francis Property Market Research [email protected] Rosie Hunt Property Market Research [email protected] Florian van-Kann Property Market Research [email protected]
Siena Golan Property Market Research [email protected] Martin Lippmann Property Market Research [email protected] Aizhan Meldebek Infrastructure Research [email protected]
Asia Pacific
Koichiro Obu Head of Research & Strategy, Asia Pacific [email protected] Seng-Hong Teng Property Market Research [email protected]
Natasha Lee Property Market Research [email protected] Hyunwoo Kim Property Market Research [email protected]

Alternatives Research | APRIL 2021
This information is subject to change at any time, based upon economic, market and other considerations and should not be construed as a recommendation. Past performance is not indicative of future returns. Forecasts are not a reliable indicator of future performance. Forecasts are based on assumptions, estimates, opinions and hypothetical models that may prove to be incorrect. Investments come with risk. The value of an investment can fall as well as rise and your capital may be at risk. You might not get back the amount originally invested at any point in time. Source: DWS Investment GmbH
/ 26
The authors
Gianluca Minella Head of Infrastructure Research
Aizhan Meldebek Infrastructure Research

Alternatives Research | APRIL 2021
This information is subject to change at any time, based upon economic, market and other considerations and should not be construed as a recommendation. Past performance is not indicative of future returns. Forecasts are not a reliable indicator of future performance. Forecasts are based on assumptions, estimates, opinions and hypothetical models that may prove to be incorrect. Investments come with risk. The value of an investment can fall as well as rise and your capital may be at risk. You might not get back the amount originally invested at any point in time. Source: DWS Investment GmbH
/ 27
IMPORTANT INFORMATION – APAC, EMEA, LATAM & NORTH AMERICA
The brand DWS represents DWS Group GmbH & Co. KGaA and any of its subsidiaries such as DWS Distributors, Inc., which offers investment products, or DWS Investment Management Americas, Inc. and RREEF America L.L.C., which offer advisory services. This material was prepared without regard to the specific objectives, financial situation or needs of any particular person who may receive it. It is intended for informational purposes only. It does not constitute investment advice, a recommendation, an offer, solicitation, the basis for any contract to purchase or sell any security or other instrument, or for DWS or its affiliates to enter into or arrange any type of transaction as a consequence of any information contained herein. Neither DWS nor any of its affiliates gives any warranty as to the accuracy, reliability or completeness of information which is contained in this document. Except insofar as liability under any statute cannot be excluded, no member of the DWS, the Issuer or any office, employee or associate of them accepts any liability (whether arising in contract, in tort or negligence or otherwise) for any error or omission in this document or for any resulting loss or damage whether direct, indirect, consequential or otherwise suffered by the recipient of this document or any other person.
The views expressed in this document constitute DWS Group’s judgment at the time of issue and are subject to change. This document is only for professional investors. This document was prepared without regard to the specific objectives, financial situation or needs of any particular person who may receive it. No further distribution is allowed without prior written consent of the Issuer.
Investments are subject to risk, including market fluctuations, regulatory change, possible delays in repayment and loss of income and principal invested. The value of investments can fall as well as rise and you might not get back the amount originally invested at any point in time.
An investment in infrastructure involves a high degree of risk, including possible loss of principal amount invested, and is suitable only for sophisticated investors who can bear such losses. The value of shares/ units and their derived income may fall or rise.
War, terrorism, economic uncertainty, trade disputes, public health crises (including the recent pandemic spread of the novel coronavirus) and related geopolitical events could lead to increased market volatility, disruption to US and world economies and markets and may have significant adverse effects on the global real estate markets.
This marketing communication is intended for professional clients only.
DWS is the brand name of DWS Group GmbH & Co. KGaA and its subsidiaries under which they operate their business activities. The respective legal entities offering products or services under the DWS brand are specified in the respective contracts, sales materials and other product information documents. DWS, through DWS Group GmbH & Co. KGaA, its affiliated companies and its officers and employees (collectively “DWS”) are communicating this document in good faith and on the following basis.
This document has been prepared without consideration of the investment needs, objectives or financial circumstances of any investor. Before making an investment decision, investors need to consider, with or without the assistance of an investment adviser, whether the investments and strategies described or provided by DWS Group, are appropriate, in light of their particular investment needs, objectives and financial circumstances. Furthermore, this document is for information/discussion purposes only and does not constitute an offer, recommendation or solicitation to conclude a transaction and should not be treated as giving investment advice.
The document was not produced, reviewed or edited by any research department within DWS and is not investment research. Therefore, laws and regulations relating to investment research do not apply to it. Any opinions expressed herein may differ from the opinions expressed by other legal entities of DWS or their departments including research departments.
The information contained in this document does not constitute a financial analysis but qualifies as marketing communication. This marketing communication is neither subject to all legal provisions ensuring the impartiality of financial analysis nor to any prohibition on trading prior to the publication of financial analyses.
This document contains forward looking statements. Forward looking statements include, but are not limited to assumptions, estimates, projections, opinions, models and hypothetical performance analysis. The forward looking statements expressed constitute the author‘s judgment as of the date of this document. Forward looking statements involve significant elements of subjective judgments and analyses and changes thereto and/ or consideration of different or additional factors could have a material impact on the results indicated. Therefore, actual results may vary, perhaps materially, from the results contained herein. No representation or warranty is made by DWS as to the reasonableness or completeness of such forward looking statements or to any other financial information contained in this document. Past performance is not guarantee of future results.
We have gathered the information contained in this document from sources we believe to be reliable; but we do not guarantee the accuracy, completeness or fairness of such information. All third party data are copyrighted by and proprietary to the provider. DWS has no obligation to update, modify or amend this document or to otherwise notify the recipient in the event that any matter stated herein, or any opinion, projection, forecast or estimate set forth herein, changes or subsequently becomes inaccurate.
Investments are subject to various risks, including market fluctuations, regulatory change, possible delays in repayment and loss of income and principal invested. The value of investments can fall as well as rise and you might not get back the amount originally invested at any point in time. Furthermore, substantial fluctuations of the value of any investment are possible even over short periods of time. The terms of any investment will be exclusively subject to the detailed provisions, including risk considerations, contained in the offering documents. When making an investment decision, you should rely on the final documentation relating to any transaction.
No liability for any error or omission is accepted by DWS. Opinions and estimates may be changed without notice and involve a number of assumptions which may not prove valid. DWS or persons associated with it may (i) maintain a long or short position in securities referred to herein, or in related futures or options, and (ii) purchase or sell, make a market in, or engage in any other transaction involving such securities, and earn brokerage or other compensation.
DWS does not give taxation or legal advice. Prospective investors should seek advice from their own taxation agents and lawyers regarding the tax consequences on the purchase, ownership, disposal, redemption or transfer of the investments and strategies suggested by DWS. The relevant tax laws or regulations of the tax authorities may change at any time. DWS is not responsible for and has no obligation with respect to any tax implications on the investment suggested.
This document may not be reproduced or circulated without DWS written authority. The manner of circulation and distribution of this document may be restricted by law or regulation in certain countries, including the United States.
This document is not directed to, or intended for distribution to or use by, any person or entity who is a citizen or resident of or located in any locality, state, country or other jurisdiction, including the United States, where such distribution, publication, availability or use would be contrary to law or regulation or which would subject DWS to any registration or licensing requirement within such jurisdiction not currently met within such jurisdiction. Persons into whose possession this document may come are required to inform themselves of, and to observe, such restrictions.
© 2021 DWS International GmbH
Issued in the UK by DWS Investments UK Limited which is authorised and regulated by the Financial Conduct Authority (Reference number 429806).
© 2021 DWS Investments UK Limited
In Hong Kong, this document is issued by DWS Investments Hong Kong Limited and the content of this document has not been reviewed by the Securities and Futures Commission.
© 2021 DWS Investments Hong Kong Limited

Alternatives Research | APRIL 2021
This information is subject to change at any time, based upon economic, market and other considerations and should not be construed as a recommendation. Past performance is not indicative of future returns. Forecasts are not a reliable indicator of future performance. Forecasts are based on assumptions, estimates, opinions and hypothetical models that may prove to be incorrect. Investments come with risk. The value of an investment can fall as well as rise and your capital may be at risk. You might not get back the amount originally invested at any point in time. Source: DWS Investment GmbH
/ 28
In Singapore, this document is issued by DWS Investments Singapore Limited and the content of this document has not been reviewed by the Monetary Authority of Singapore.
© 2021 DWS Investments Singapore Limited
In Australia, this document is issued by DWS Investments Australia Limited (ABN: 52 074 599 401) (AFSL 499640) and the content of this document has not been reviewed by the Australian Securities Investment Commission.
© 2021 DWS Investments Australia Limited
For investors in Bermuda: This is not an offering of securities or interests in any product. Such securities may be offered or sold in Bermuda only in compliance with the provisions of the Investment Business Act of 2003 of Bermuda which regulates the sale of securities in Bermuda. Additionally, non-Bermudian persons (including companies) may not carry on or engage in any trade or business in Bermuda unless such persons are permitted to do so under applicable Bermuda legislation.
© 2021 DWS Group GmbH & Co. KGaA. All rights reserved. (4/21) I-082396_1