private benefits: ownership vs. control - efma annual meetings... · private benefits: ownership...
TRANSCRIPT

Private Benefits: Ownership vs. Control
Bill Hu∗1
University of Memphis
Joon Ho Hwang*2
Korea University
Abstract
We empirically decompose private benefits into two components: benefits accruing from
ownership and benefits accruing from control. We document that private benefits, as
measured by the block premium, increase slowly with respect to the level of ownership,
as measured by the percentage of shares acquired in the block trade. On the other hand,
private benefits increase rapidly with respect to the blockholder’s likelihood of exercising
control in the company. This decomposition of private benefits allows us to quantify non-
pecuniary private benefits by examining the block premium when the blockholder’s
likelihood of exercising control in the company is very close to zero.
EFM classification : 150
JEL classification : G34
∗1 Fogelman College of Business and Economics, University of Memphis, Memphis, TN 38152; Tel: 901-678-5930; Email: [email protected]∗2 Corresponding author : Business School, Korea University, Anam-dong, Seongbuk-Gu, Seoul 136-701, KOREA; Tel: +82-2-3290-2830; Fax: +82-2-922-7220; Email: [email protected]

Private Benefits:
Ownership vs. Control
Abstract
We empirically decompose private benefits into two components: benefits accruing from
ownership and benefits accruing from control. We document that private benefits, as
measured by the block premium, increase slowly with respect to the level of ownership,
as measured by the percentage of shares acquired in the block trade. On the other hand,
private benefits increase rapidly with respect to the blockholder’s likelihood of exercising
control in the company. This decomposition of private benefits allows us to quantify non-
pecuniary private benefits by examining the block premium when the blockholder’s
likelihood of exercising control in the company is very close to zero.
1

I. Introduction
The literature defines private benefits as “benefits that accrue to managers or controlling
shareholders, but not to minority shareholders.” Given the importance of private benefits – in the
sense that many issues in corporate governance arise from agency problems, and private benefits
are at the heart of agency problems – numerous studies have examined private benefits. The
seminal articles of Jensen and Meckling (1976) and Demsetz and Lehn (1985) discuss private
benefits and cite both pecuniary and non-pecuniary private benefits. Later, Barclay and
Holderness (1989) find a way to quantify the size of private benefits by using block trade
premium and reiterate that private benefits can be pecuniary or non-pecuniary.1 However, thus far,
no study has come up with a means of estimating non-pecuniary private benefits. This paper fills
the gap by introducing a way of estimating non-pecuniary private benefits by decomposing
private benefits into an ownership component and a control component.
As a controlling party will use corporate resources to his or her benefit only when it is
difficult or impossible to prove these actions in court, private benefits are inherently difficult to
measure. Despite these difficulties, Barclay and Holderness (1989) find a means of estimating
private benefits using block premium, which is measured by the difference between the price per
share paid for the block of common stock and the market price of the stock following the block
transaction. The rationale for this measure is as follows. If all shareholders receive benefits in
proportion to their fractional ownership, blocks should trade at the exchange price. However, if
blockholders can enjoy benefits that do not accrue to minority shareholders, then blocks will trade
1 Subsequent studies that use block premiums to examine various topics in private benefits include
Mikkelson and Regassa (1991), Nicodano and Sembenelli (2004), and Dyck and Zingales (2004). La Porta,
et al. (1997, 1998, 2000), Johnson, et al. (2000), Jiraporn and Gleason (2007), and many other studies too
numerous to mention, also examine issues related to private benefits.
2

at a premium to the post-announcement exchange price.2 Using a sample of 63 block trades
during 1978-82, Barclay and Holderness (1989) find that the block premium averages 16 percent
of the post-announcement exchange price.
As noted by Jensen and Meckling (1976), Demsetz and Lehn (1985), and Barclay and
Holderness (1989), private benefits can be either pecuniary or non-pecuniary. Pecuniary private
benefits are private benefits which can be stated in monetary terms, e.g., excessive salary or the
tunneling of the company’s resources. Non-pecuniary private benefits are private benefits which
cannot be stated in monetary terms, e.g., the pride of becoming a large owner, becoming part of
the business network, interacting with influential businessmen, politicians, and celebrities, and
enjoying the recognition, fame, and prestige that accompany one’s heightened social status.
However, due to their nature, non-pecuniary private benefits can evade easy measurement. In this
study, we find a way to measure non-pecuniary private benefits by noting that all pecuniary
private benefits must involve some control of the firm. For example, the tunneling of the
company’s resources involves the exercise of control in the company. Therefore, we estimate the
level of non-pecuniary private benefits by examining the size of private benefits when the
blockholder’s likelihood of exercising control in company is zero (or very close to zero). This can
be achieved if we can decompose the sources of private benefits into those that stem from the
exercise of control and those that stem from having just ownership of the company.
What are private benefits of ownership? Private benefits of ownership are benefits that
one gets by just owning a block of shares. These benefits are something other than benefits from a 2 Barclay and Holderness (1989) measure the premium by using the post-announcement price as a
benchmark because the price that follows the block trade announcement will incorporate the expected
change in the cash flow of the company. Therefore, the post-announcement exchange price will reflect the
shared benefits (represented by the cash flow rights) of the block trade, whereas the privately negotiated
block trade price will reflect both private and shared benefits. Thus, the difference between the block trade
price and the post-announcement exchange price will reflect only private benefits.
3

claim on future cash flows, since cash flows accrue to all shareholders and therefore are not
private benefits. The aforementioned examples of non-pecuniary private benefits (e.g., the pride
of becoming a large owner, becoming part of the business network, interacting with businessmen
and celebrities, and enjoying the recognition, fame, and prestige that accompany one’s heightened
social status) do not accrue to minority shareholders and the blockholder can enjoy these benefits
without the need to exert control in the company’s decision making process. Therefore, these
benefits represent private benefits of ownership.
To decompose private benefits into those arising from ownership and those arising from
control, we use data on block trades. Block trades are a good source of data for this research for
the following reasons. First, following Barclay and Holderness (1989), we can estimate private
benefits by calculating the block premium that is associated with a block trade. Second, we can
decompose private benefits into ownership and control, because people who acquire blocks of
shares are often powerful enough to exercise control in the company (Holderness and Sheehan
(1988)). Blockholders, in addition to owning different portions of a company’s shares, vary in
terms of how much control they exercise over the firm. For example, person A, who owns 10
percent of the shares of company X, may be very active in the firm’s decision making process,
while person B, who holds 20 percent of the shares of company Y, may be passive in exercising
control in the company.
Therefore, because every blockholder is unique with respect to his or her ownership level
and control level, we can decompose private benefits into ownership and control.3 First, with
regard to the ownership level, we use the percentage of shares acquired in the block trade. Then,
3 It is likely that greater ownership will accompany greater control of the company. However, as long as the
ownership level and control level are not perfectly correlated, it is possible to decompose private benefits
into ownership and control. The example concerning persons A and B in the paragraph above illustrates
this point.
4

we measure private benefits of ownership by the marginal effect of the percentage of shares
acquired on the block premium. Second, with regard to measuring the control level, we estimate
the likelihood of top executive turnover within one year following the block trade. This measure
is created by first examining whether there was a top executive turnover within one year of the
block transaction and then constructing an implied probability of top executive turnover at the
time of the block trade. The assumption here is that the most significant control activity that a
blockholder can exercise is to replace the top executive of the company; thus, control activities
are best reflected by change in the top executive.4 Then, we measure private benefits of control by
the marginal effect of the probability of top executive turnover on the block premium. The above
tasks are achieved by using a two-stage regression model, where both the block premium and the
top executive turnover are treated as endogenous variables.
We find that private benefits, as measured by the block premium, increase slowly with
respect to the level of ownership but increase rapidly with respect to the blockholder’s likelihood
of exercising control in the company. Interestingly, however, we find that even when there is very
small chance of exercising control in the company, investors are willing to pay a premium to
become blockholders. These non-pecuniary private benefits range from 0.61% to 5.92% of the
share price. The proportion of non-pecuniary private benefits to total private benefits ranges from
18% (for a 5% increase in ownership) to 29% (for a 50% increase in ownership). This shows that
non-pecuniary private benefits comprise a non-trivial portion of total private benefits.
We would like to note that our empirical method is not without limitations.5 First, the use
of the likelihood of executive turnover for measuring the blockholder’s expected level of control
may not be perfect since there may be other, less significant, ways of exercising control in the
4 Holderness and Sheehan (1988) find that many corporate majority shareholders place their representatives
in top management positions.
5 We would like to thank the referee for pointing out this limitation of the estimate.
5

company.6 If this is the case, our measure of ownership level will incorporate residual control
activities that are not captured by the likelihood of top executive turnover. Therefore, we may be
underestimating the control level, and overestimating the ownership level. Second, as Dyck and
Zingales (2004) noted, the block premium estimate used in Barclay and Holderness (1989) can
improperly estimate private benefits. There is no bias in the estimate only when the block trade
price reflects the buyer’s willingness to pay (i.e., the seller has all the bargaining power) or when
security values (i.e., the benefit from cash flow rights) are the same for the buyer and the seller. If
that is not the case, the bias becomes greater as the seller’s bargaining power becomes smaller.7
However, Dyck and Zingales (2004) find that in countries with lower levels of private benefits,
the seller has greater bargaining power, and that the US shows one of the lowest levels of private
benefits. Therefore, we think our sample of block trades from the US is minimally affected by the
bias of the block premium measure.
The rest of the paper is organized as follows. In Section II, we describe the data and
descriptive statistics. The decomposition of private benefits into ownership and control, and the
measurement of non-pecuniary private benefits are examined in Section III. We conclude this
study in Section IV.
6 In one of our robustness tests, we check for the likelihood of other possible control activities such as
board turnover, changes in capital expenditure, changes in leverage, etc. However, the possible criticism is
not fully eliminated because the above alternative specifications of control activities still do not represent
all types of control activities.
7 The exact size of the bias is α(1-λ)(Yb-Ys), where α∈[0,1] is the fractional size of the block, λ∈[0,1] is the
bargaining power of the shareholder who is selling the block, and Yb (Ys) is the security value of the buyer
(seller).
6
II. Data
A. Data Formation
We collect block trade data over 1987-2005 from the SDC Mergers and Acquisitions
database. Transactions must involve the transfer of a block of shares that comprises between 5%
(inclusive) and 50% (exclusive) of the shares outstanding and must be classified as “block
purchase” in the acquisition technique category of the SDC Mergers and Acquisitions database.
The lower cutoff point of 5% is used for our dataset because it is the point that triggers a
mandatory filing to the SEC with regard to the block transaction. The upper cutoff point is 50%
since we want to examine how block premium changes with regard to different levels of control
in the company, whereas if someone acquires 50% or more of a company’s share, she will then
have gained full control of the company. Therefore, because our sample consists of block trades
that involve partial control of the company, it allows us to observe cross-sectional variations in
the levels of ownership and control.8
From our initial sample size of 1,804, there must be information about the price paid per
share for the block transaction and the exchange price one day after the announcement of the
block trade. We exclude cases where the price paid per share may not be objectively valued, such
as transactions involving convertible bonds, options, and warrants,.
To rule out instances where the transaction price may not reflect private benefits, we
exclude cases where either the target or the acquirer is either a government agency or a subsidiary
of the other party. We further exclude transactions that are open market repurchases, tender
offers, spinoffs, recapitalizations, self-tenders, exchange offers, repurchases, and acquisition of
remaining interest. Also, to stay away from block trades that are driven by takeover motives, we
rule out block trades which happen within six months before a merger or acquisition that involves
8 This selection criterion also excludes cases where the final shareholding – after the block trade – of the
new blockholder becomes 50% or more, since these block trades will entail full control of the company.
7

the block-trading company, and block trades that are accompanied by an indication of either a
takeover or a tender offer for the remaining shares, as inferred from reading the SDC synopsis.
Although the parties of the block transaction can be either insiders or outsiders of the
company, Barclay and Holderness (1989) note that purchasers of the trade are typically outsiders
and not one of the firm's directors or officers. For the objective of our paper, we restrict our
sample to only those block transactions where both parties are not affiliated with the company
and where the block purchaser is not a current blockholder of the company. The reason behind
this selection criterion is that it is unclear how accurately the block premium will reflect private
benefits when insiders or current blockholders take part in the transaction. For example, insiders
or current blockholders who purchase a block of shares may already possess significant
controlling power within the company, in which case they will not pay extra for the block.
Similarly, in the case of insiders selling a block, they may still retain control of the firm even after
the trade and thus will not worry about losing their private benefits. By focusing on new outside
purchasers, we are able to conduct a cleaner measurement of private benefits.
We identify insider ownership and the percentage of outsiders among board members of
the company whose block is traded. We collect these data from the firm’s proxy statement with
the most recent record-date prior to the block transaction. We search the LexisNexis Company
Profiles to identify top executive turnovers within one year after the block transaction. A top
executive is defined as the CEO or, if a firm has no CEO, the president. As in previous studies
(e.g., Weisbach (1988) and Denis, et al. (1997)), we exclude from our sample those cases where
top executive turnovers occur either as part of the normal retirement process or due to death or
illness. The criterion for normal retirement is that the turnover takes place between the ages of 64
and 66 for the top executive. With these criteria, the size of our final sample is 738.
8

B. Summary Statistics
Table 1 reports descriptive statistics for the 738 block trades sample and for subsamples
of two categories of block trades: those followed by top executive turnover within one year of the
block transaction and those that are not followed by top executive turnover within one year of the
block trade.
[Table 1]
Following Barclay and Holderness (1989), the block premium is defined as follows.
100)()(
% ×⎥⎦
⎤⎢⎣
⎡ −≡
priceexchangeafterdayonepriceexchangeafterdayonepricetradeblocknegotiatedrivatelyP
remiumPBlock
….......(1)
The block premium averages 9.31% for the whole sample. This figure is smaller than the
average block premium of 16% reported by Barclay and Holderness (1989). The difference may
arise from the difference in the sample periods: 1978-1982 in the case of Barclay and Holderness
(1989) and 1987-2005 in this study. Also, by using the SDC database, we are able to construct a
sample of 738 block trades whereas Barclay and Holderness (1989) searched the Wall Street
Journal to identify 63 block trades. While the Wall Street Journal may report only newsworthy
events, our sample includes block trades that are less dramatic.
For block trades that are followed by top executive turnover within one year of the block
trade, the premium averages 17.80%. However, for trades that are not followed by top executive
turnover within one year, the premium averages only 6.92%. The difference is significant at the
1% level. This difference in the block premium indicates that there may be benefits to having
9

control over the firm, as indicated by the change in the top executive, over and above the benefits
of just owning a block of shares of the firm.
Also, more shares of the company (15.37% vs. 11.67%) are acquired for block trades that
result in subsequent top executive turnover. This implies that the acquirer is more likely to
exercise control in the firm as she holds more shares of the firm.
Table 1 also displays that on average, insiders control 7.83% of the firm’s shares in our
sample. Insider ownership includes shares owned by individuals related to a member of the top
management team, employee pension or stock option plans, trusts for which managers have some
voting authority, and any other blocks of shares over which a member of the top management
team has voting authority. By way of comparison, Morck, et al. (1988) report that the average
ownership of all officers and directors is 10.6% in a sample of 371 Fortune 500 firms and
Mikkelson and Partch (1989) report an average insider ownership of 19.6% in a random sample
of New York and American Stock Exchange firms. Our sample firms therefore have smaller
insider ownership. This is consistent with Bethel et al. (1998), who find that companies with high
insider ownership are less likely to experience block share purchases. The low insider ownership
of our sample implies that block trades of 5% or more shares of the company can confer
significant amount of controlling power to the new blockholder.
Consistent with previous studies (e.g., Mikkelson and Partch (1989) and Denis, et al.
(1997)), firms that experience top executive turnover have worse performance. However, with
respect to insider ownership, the fraction of firms with outsider-dominated boards, and the
fraction of firms where the top executive is a member of the founding family, we do not find
significant differences between firms with top executive turnover and firms without top executive
turnover within one year of the block trade.
10

III. Results on Private Benefits
A. Determinants of Block Premium
Table 2 shows the results of a cross-sectional regression of block premiums using the
following model.
∑∑ ⋅+⋅+⋅+
⋅+⋅+⋅+⋅+⋅+⋅+⋅+
⋅+=
ihiji
ii
iii
ii
ii
dummiesyeardummiesindustrydummyacquirerbank
dummyindustrysametheinisacquirerdummyacquirerindividualassetsofngibilitytaleveragesizefirm
performcefirmpriordummyturnoverexecutivetopacquiredsharesofpercentagepremiumBlock
)()()(
)()()()()log(
)()()(
9
87
654
32
1
βββ
βββββββ
βα
……….(2)
Possible factors that can affect the premium can be categorized into the ownership level
of the company, whether the block trade is actually associated with control activities within the
firm, and control variables which capture characteristics of the block-traded company and of the
acquirer.
[Table 2]
A larger fractional ownership gives the blockholder more power in terms of having
greater voting rights. Larger ownership also provides greater protection from a hostile takeover or
proxy contest. Beyond a certain point, however, few additional private benefits will result from
increased fractional ownership if the blockholder holds a sufficient amount of shares. There are
also costs to owning a large portion of shares, such as monitoring costs or the costs that ensue
from a possible lack of diversification in the owner’s portfolio. This means that blockholders may
not want to accumulate shares beyond a certain threshold. If the threshold varies by firm, there
may be no discernible relationship between fractional ownership and block premium. Barclay and
11

Holderness (1989) and Dyck and Zingales (2004) show a positive relationship between block
premium and the size of shares acquired. The results in Table 2 confirm that the block premium
tends to be greater as the fractional size of the block increases.9
To examine how the size of private benefits is related to an actual control activity as
manifested though top executive replacement, we examine cases of top executive turnover within
one year after the announcement of the block trade.10 In the regression, we include a dummy
variable for block trades that are followed by a top executive turnover within one year of the
announcement of the block trade. The results show that block premiums are indeed larger for
trades that are followed by change in the top executive. The expected block premium goes up by
7.86% for block trades that are followed by top executive turnover in the firm within one year of
the block trade. Assuming that block premiums for trades that are followed by top executive
turnover reflect private benefits of having control of the company in addition to private benefits
of ownership, the results suggest that there are private benefits from having control of the firm (as
reflected by the coefficient of the top executive turnover variable) over and above the benefits
from having just the ownership of the firm (as reflected by the coefficient of the percentage of
shares acquired variable).
We use the following control variables to capture the characteristics of the block- traded
company. First, the size of private benefits will be greater if the firm is performing well and
smaller if the firm is having financial difficulties (Barclay and Holderness (1989)). We measure
the prior year’s market-adjusted stock return using the percentage of common stock return for the
12 months ending two months before the block trade announcement minus the return on the 9 When we include the square term of the percentage of shares acquired, its coefficient is not significant at
the conventional level.
10 Holderness and Sheehan (1988) show that for trades of majority blocks of stock, 71% of block trades
involve turnovers among the three top managers within one year of the trade and conclude that many large
shareholders place their representatives in top management positions.
12

CRSP equal-weighted index.11 Second, firm size may affect the block premium. On one hand,
block premium may increase with firm size because larger firms offer potentially greater benefits,
both pecuniary and non-pecuniary (Barclay and Holderness (1989)). On the other hand, the costs
of being a blockholder may also increase with firm size, as larger firms are more likely to be
monitored closely by security analysts, government officials, and institutional investors. We
measure firm size as the natural logarithm of the firm’s book value of total assets.12 Third, the
size of debt may affect the block premium. However, a priori relationship between private
benefits and debt is not clear. Debt can have a negative effect on private benefits by constraining
access to free cash flow (Jensen (1986)). In contrast, debt can also increase one’s effective control
over corporate assets (Harris and Raviv (1988) and Stulz (1988)), thereby increasing the size of
private benefits. Fourth, private benefits may also be related to the tangibility of assets because
acquirers of the block can face more difficulty in diverting resources if assets are tied down and
easily observable. Finally, private benefits may also differ across industries. Demsetz and Lehn
(1985) suggest that owners of companies in the media, entertainment, and sports industries enjoy
greater private benefits. We capture industry differences by categorizing companies whose blocks
are traded into their major industry groups based on the two-digit SIC code. Manufacturing
(wherein the two digits of the SIC code lie in the range of 20-39) is the most common industry
group and is the excluded category in our regression.
We also use the following control variables, which capture the characteristics of the
acquirer. First, we include a dummy variable for acquisition by individuals because individuals,
compared to corporate blockholders, have the added benefit of consuming perquisites (Demsetz
and Lehn (1985)). Second, in the case where the acquirer is a corporation rather than an
11 We also use the CRSP value-weighted index as an alternative benchmark. The results are similar.
12 The results do not change if we measure firm size by the firm’s market value of equity plus book value of
debt.
13

individual, there may be more private benefits for the acquirer to enjoy if the acquiring company
is in the same industry as the target company. Thus, we include a dummy variable that takes a
value of one when the acquiring company is in the same industry group as the target company
based on the two-digit SIC code. Finally, if the acquirer is a financial company, it may acquire
shares mainly for financial reasons and not for the consumption of private benefits. Thus, we
include a dummy variable that takes the value of one when the acquirer is a financial company.
The results in Table 2 show that the block premium is marginally larger for firms that
have better prior performance. As for the tangibility of assets, whereas Dyck and Zingales (2004)
find an insignificant relationship between block premium and the tangibility of assets in their
international study, we find a negative and significant relationship (at the 10% level) between
block premium and the tangibility of assets. As for different industries of the block-traded
companies, only the retail trade industry group dummy turns out to be a significant factor of
block premium.13
B. Determinants of Top Executive Turnover
A possible shortcoming of the approach used in the previous section is the endogeneity of
top executive turnover. This is because whether or not the top executive will be replaced after the
block trade is not an event that is known with certainty at the time of the block trade. Hence, the
acquirer of the block cannot be certain whether the top executive will be replaced soon after the
block trade. Rather, the new blockholder can only guess the likelihood of top executive turnover.
This likelihood of top executive turnover will be different for each block trade because
circumstances surrounding the block trade will be unique for each block trade. These
13 When we instead assign a dummy variable for firms in the media, entertainment, and sports industries,
whose first two digits of the SIC code are 27, 48, 78, 79 or the first three digits is 731, the dummy variable
remains insignificant.
14

circumstances will be a function of various factors, such as prior firm performance, ownership
structure, and board characteristics, which have been shown in previous literature to affect the
likelihood of top executive turnover. Certain circumstances surrounding a block trade may
indicate greater likelihood of top executive turnover than for other block trades. Under those
situations where the current top executive position is at risk at the time of the block trade, the
acquirer may be willing to pay more for a block of shares in anticipation of exercising control in
the company.
Thus, in this section, we estimate the implied probability of the blockholder’s exercising
control of the firm, as manifested by the likelihood of top executive turnover, at the time of the
block trade. Later, in Section 3.C, we measure how the block premium changes with respect to
this implied probability of top executive turnover.
We estimate logit regressions relating the probability of top executive turnover to firm
performance, ownership characteristics, and board composition. Model 1 is the basic model
whereas Model 2 includes interaction terms between prior firm performance and ownership
structure/board composition variables that have been shown in previous literature to influence the
likelihood of management turnover.
ii
ii
ii
ii
ii
ii
ii
i
ii
ii
ii
dummyboardinateddomoutsiderperformcefirmpriorownershipinsiderfordummyperformcefirmprior
ownershipinsiderfordummyperformcefirmpriorsizefirmdummyfamilyfoundingisexectop
dummyboardinateddomoutsiderownershipinsiderfordummyownershipinsiderfordummyperformcefirmprior
acquiredsharesofpercentagedummyturnoverexecutiveTopMODEL
sizefirmdummyfamilyfoundingisexectopdummyboardinateddomoutsider
ownershipinsiderperformcefirmprioracquiredsharesofpercentagedummyturnoverexecutiveTopMODEL
)()(%)25)(()(
%)25)(%5()()log().(
)(%)25)((%)25)(%5()(
)(:2
)log().()(
)()()(:1
10
9
8
76
54
32
1
6
54
32
1
⋅⋅+>⋅⋅+
<<⋅⋅+⋅+⋅+⋅+>⋅+
<<⋅+⋅+⋅+=
⋅+
⋅+⋅+⋅+⋅+
⋅+=
βββ
ββββ
βββα
βββ
βββα
…......(3)
15
[Table 3]
The explanations for some of the independent variables are as follows. First, we include
the percentage of shares acquired in the block trade because a blockholder who owns a greater
proportion of a firm’s shares has more voting power in the company and has more incentive to
work towards value-increasing activities such as replacing incompetent CEOs. Second, we
include the insider ownership variable because more managerial shareholdings may better align
the interests of managers and shareholders, and provide managers with a greater incentive to
invest in value-increasing activities (Jensen and Meckling (1976), DeAngelo and DeAngelo
(1985)). However, greater inside shareholdings can also entrench management by making it more
difficult to transfer control and remove a manager (Stulz (1988), Mikkelson and Partch (1989),
Denis, et al. (1997)). Third, we include the outsider-dominated board dummy because studies
suggest that internal monitoring is improved by having a higher fraction of outside directors
(Weisbach (1988), Byrd and Hickman (1991), and Brickley et al. (1994)). Following the
classification used by Denis, et al. (1997) and Weisbach (1988), we categorize a board as
outsider-dominated if at least 60% of the company’s board members are outsiders.14 Finally, we
include the founding family dummy because according to Morck et al. (1988), the manager’s
status as the founder of the firm may be conducive to managerial entrenchment, and Denis, et al.
(1997) empirically show that the top executive is less likely to be replaced if he or she is a
member of the founding family.
The results of logit regressions are provided in Table 3. Numbers in the table refer to
marginal effects where derivatives are evaluated at mean values of the variables. The marginal
effects reported in Table 3 will change accordingly as the values of some independent variables
14 A director is an outside director when he or she is not an employee of the company, has no family
connection with the management of the company, and has no business dealings with the company.
16
change in our subsequent analyses. The results in Table 3 are mostly consistent with previous
empirical studies on top executive turnover. The likelihood of top executive turnover is positively
related to the block size15 and negatively related to prior firm performance, insider ownership,
and the company-founder dummy. We also find that an outsider-dominated board alone does not
affect the likelihood of top-management turnover, which is consistent with the results of
Weisbach (1988) and Denis, et al. (1997).
In Model 2 of Table 3, we consider the possible effects of insider ownership and the
existence of outsider-dominated boards on the sensitivity of top executive turnover to
performance. Following Ai and Norton (2003) and Powers (2005), the coefficients of interaction
terms and the tests for the statistical significance thereof are based on the cross-partial derivative
of the expected value of the dependent variable, after allowing for the nonlinearity of the model.
Denis, et al. (1997) find a weaker relationship between performance and turnover in firms with
high insider ownership. Also, the existence of an outsider-dominated board is found to have a
significant influence on the sensitivity of turnover to performance by Weisbach (1988), whereas it
is shown to be insignificant by Denis, et al. (1997). We follow Denis, et al. (1997) and Morck et
al. (1998) and classify firms into three categories of managerial ownership: at most 5%, between
5% and 25%, and greater than 25%.
The results of Model 2 in Table 3 show that firms with insider ownership that exceeds
25% have 55% less probability of top-management turnover. The results also show that insider
ownership has a significant impact on the sensitivity of turnover to performance. The probability
of turnover is negatively related to performance when insider ownership is less than 5%. 15 In our sample, 17% of block trades involve the largest blocks at these firms. If we include a dummy
variable for block trades that represent the largest blocks of the company, along with the block size
variable, the coefficient for the dummy variable is not statistically significant. If we include the dummy
variable but not the block size variable, the coefficient for the dummy variable is marginally significant at
the 10% level.
17

However, the positive coefficient (0.009) on the interaction of the prior performance variable
with the dummy variable denoting an insider ownership between 5% and 25% indicates that the
probability of turnover is significantly less sensitive to performance for firms in this ownership
structure category. In fact, for firms with insider ownership between 5% and 25%, the likelihood
of top executive turnover is almost unaffected by the past performance of the company (-0.011 +
0.009 = -0.002). This is consistent with the finding of Denis, et al. (1997).
Surprisingly, we find that firms with outsider-dominated boards manifest less sensitivity
of top-management turnover to performance. This result is contrary to that of Weisbach (1988),
who finds a stronger association between prior performance and the probability of top executive
turnover for companies with outsider-dominated boards. The difference may occur because our
sample firms are confined to companies whose blocks are traded. And during times of possible
control contest, an existing insider of the company may not continue to be aligned with the
incumbent managers. Insiders may push towards replacing the top executive when opportunities
arise (in this case, the entry of a new blockholder coupled with poor firm performance) for
gaining control of the company or being a part of the team that gains control. Thus, for block-
traded companies, it is possible to observe greater sensitivity of top-management turnover to
performance for companies with insider-dominated boards, which is equivalent to observing less
sensitivity of top-management turnover to performance for companies with outsider-dominated
boards.
C. Two-Stage Regression
After computing the likelihood of top executive turnover at the time of the block trade,
we now measure how the block premium changes with respect to this implied probability of top
executive turnover. We run a recursive equation model where the first equation has a
18
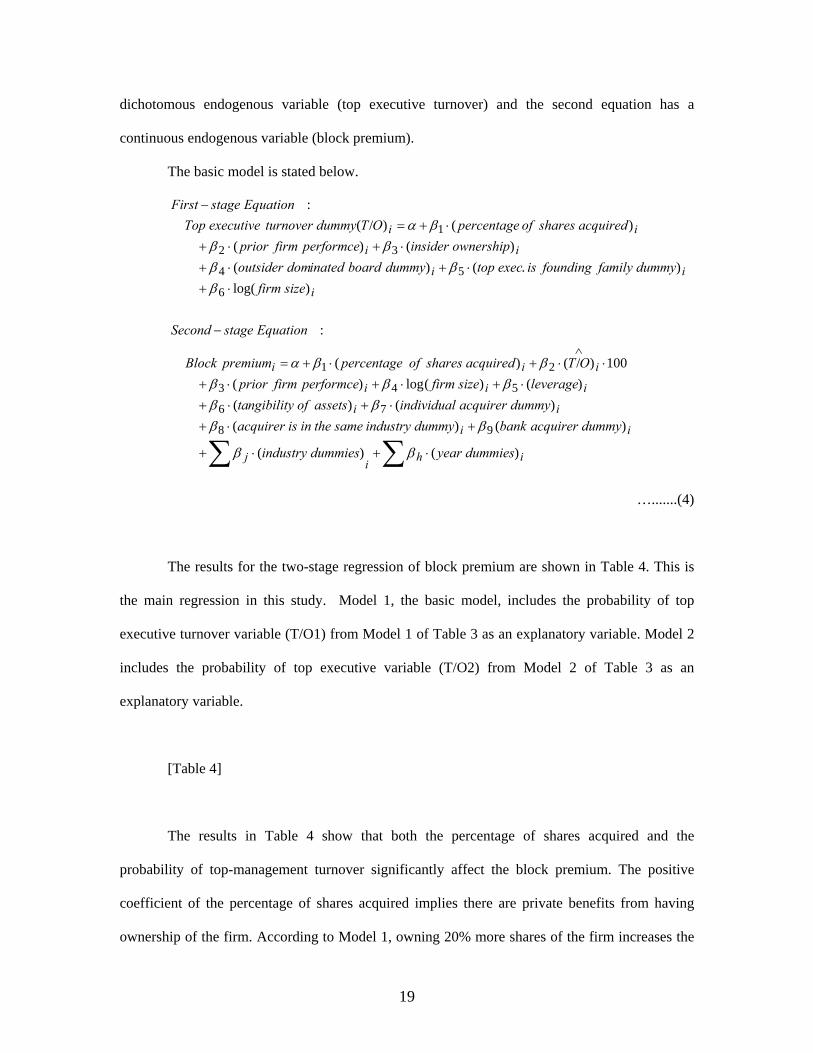
dichotomous endogenous variable (top executive turnover) and the second equation has a
continuous endogenous variable (block premium).
The basic model is stated below.
∑∑ ⋅+⋅+
+⋅+⋅+⋅+
⋅+⋅+⋅+⋅⋅+⋅+=
−
⋅+⋅+⋅+
⋅+⋅+⋅+=
−
∧
ihij
ii
ii
iii
iii
i
ii
ii
ii
dummiesyeardummiesindustry
dummyacquirerbankdummyindustrysametheinisacquirerdummyacquirerindividualassetsofngibilityta
leveragesizefirmperformcefirmpriorOTacquiredsharesofpercentagepremiumBlock
EquationstageSecond
sizefirmdummyfamilyfoundingisexectopdummyboardinateddomoutsider
ownershipinsiderperformcefirmprioracquiredsharesofpercentageOTdummyturnoverexecutiveTop
EquationstageFirst
)()(
)()()()(
)()(log)(100)/()(
:
)log().()(
)()()()/(
:
98
76
543
21
6
54
32
1
ββ
ββββ
βββββα
βββ
βββα
….......(4)
The results for the two-stage regression of block premium are shown in Table 4. This is
the main regression in this study. Model 1, the basic model, includes the probability of top
executive turnover variable (T/O1) from Model 1 of Table 3 as an explanatory variable. Model 2
includes the probability of top executive variable (T/O2) from Model 2 of Table 3 as an
explanatory variable.
[Table 4]
The results in Table 4 show that both the percentage of shares acquired and the
probability of top-management turnover significantly affect the block premium. The positive
coefficient of the percentage of shares acquired implies there are private benefits from having
ownership of the firm. According to Model 1, owning 20% more shares of the firm increases the
19

block premium by approximately 2.6%. The positive coefficient of the probability of top
executive turnover variable indicates there are private benefits from having control of the
company over and above private benefits that arise from just owning the company. In a
hypothetical case of going from having no likelihood of top executive turnover within a year of
the block trade to having 100% chance of top executive turnover within a year of the trade, the
block premium jumps by more than 9%.
The relationship between prior firm performance and block premium becomes
statistically insignificant in the two-stage regression model. In our model, prior firm performance
influences the block premium in two ways. The first is an indirect way through the likelihood of
top executive turnover variable. Better-performing firms are less likely to replace their top
executive as shown in the first-stage equation in (4), the results of which are shown in Table 3.
This lower likelihood of top executive turnover will result in a smaller block premium in the
second-stage equation in (4). Second, in a direct way, better-performing firms are associated with
larger block premiums because blockholders anticipate enjoying more private benefits from
better-performing firms after controlling for the likelihood of top executive turnover. Therefore,
we find that prior firm performance, after explaining the likelihood of top executive turnover in
the first-stage equation, has a statistically insignificant influence on block premium in the second-
stage equation.
The coefficient of the tangibility of assets variable is significantly negative, as in Table 2.
Therefore, blockholders seem to anticipate having more private benefits from companies that
have a higher proportion of intangible assets. The results for other control variables are mostly
similar to those in Table 2. The difference from Table 2 is the coefficient of the individual
acquirer dummy variable. In Table 2, we find that individual acquirers are associated with
smaller, albeit not statistically significant, block premiums. The result for the better-specified
model in Table 4 shows that the coefficient of the individual acquirer dummy is now positive and
significant at the 10% level. This is consistent with Holderness and Sheehan (1988), who find that
20

block premiums are larger for individuals than they are for corporations. This also supports the
argument of Demsetz and Lehn (1985) that individuals, compared to corporate blockholders, have
the added benefit of being able to consume perquisites.
In Models 3 and 4, we include the interaction term between the percentage of shares
acquired and the probability of top executive turnover. Model 3 uses the probability of top
executive turnover as defined by Model 1 of Table 3, and Model 4 uses the probability of top
executive turnover as defined by Model 2 of Table 3. The interaction term between the
percentage of shares acquired and the probability of top executive turnover is significant at the
10% level in Model 3 and significant at the 5% level in Model 4. This suggests that private
benefits from having ownership and control reinforce each other. The results for other variables
are similar to those in Models 1 and 2.
In Model 5, we include square terms for the probability of top executive turnover and the
percentage of shares acquired. The square term of the probability of top executive turnover is
statistically significant at the 5% level whereas the square term of the percentage of shares
acquired is not significant. Thus, the block premium increases at an increasing rate with respect to
the implied probability of top executive turnover. However, block premium does not increase at
an increasing rate with respect to the fraction of shares acquired. This suggests that private
benefits increase at an increasing rate as the new blockholder is more likely to exercise control
over the firm, but increase only at a constant rate as the blockholder’s ownership level rises.
Figure I captures the essence of this paper. It shows a three-dimensional plot depicting
the relationship among block premium, block size, and the probability of top executive turnover.
On the basis of Model 5 of Table 4, we calculate the expected values of the block premium for
different values of the block size and the probability of top executive turnover within a year of the
block transaction. Except for the block size variable, all right hand side variables in the first-stage
regressions of Equation (4) that explain the probability of executive turnover are chosen so that
they lie within the same standard deviation from their respective means. For all other variables in
21

the second-stage regression of Equation (4) for estimating the block premium given a certain
block size and probability of executive turnover, we use their mean values.
[Figure I]
As can be seen in the graph, private benefits, as measured by the block premium, increase
slowly with respect to the ownership level, as measured by the percentage of shares acquired, and
increase rapidly with respect to the likelihood of exercising control, as measured by the
probability of top executive turnover within a year of the block trade.
We show numerical examples in Table 5.16 For a ten-percent block trade, the expected
block premium is: 1.20% if there is a 0% likelihood of subsequent top executive turnover; 5.75%
if there is a 25% likelihood of subsequent top executive turnover; and 12.80% if there is a 55%
likelihood of subsequent top executive turnover. However, for a 25% block trade, the expected
block premium is: 2.38% if there is a 0% percent likelihood of subsequent top executive turnover;
9.68% if there is a 25% likelihood of subsequent top executive turnover; and 19.48% if there is a
55% likelihood of subsequent top executive turnover. Thus, the block premium increases at an
increasing rate with respect to the probability of top executive turnover, holding everything else
constant.
However, with respect to the percentage of shares acquired, the block premium increases
at a constant rate, holding everything else constant. For example, for block trades that have a 25%
16 The numbers in Table 5 are out-of-sample estimates of block premiums for a given block size and
probability of executive turnover. Even when the block size is less than 50% of the firm’s shares, other
variables can cause the probability of executive turnover to be 100%, as can be seen from the first-stage
regression of Equation (4) and Table 3.
22

probability of top executive turnover, the expected block premium is: 5.75% for a block trade
with a block size of 10%; 9.68% for a block size of 25%; and 13.61% for a block size of 30%.
[Table 5]
Table 5 also gives us a measure of non-pecuniary private benefits. For the blockholder to
enjoy pecuniary private benefits, they need to have some control over the firm’s activities. For
example, pecuniary benefits such as receiving excessive salary or tunneling through self-dealing
transactions all require exercising control in the company. On the other hand, blockholders can
enjoy non-pecuniary private benefits even without exercising any control in the company. For
example, the feeling of being a ‘proud owner’ of a company, becoming part of the business
network, interacting with influential and well-known businessmen, politicians, and celebrities,
achieving higher social status, and enjoying the recognition, fame, and prestige that accompany
the higher social status, can be achieved without exercising control. Therefore, the block premium
when the likelihood of top executive turnover is zero (or very close to zero) can be used to
estimate the non-pecuniary private benefits. The results in Table 5 show that even when there is
little chance of exercising control in the company, some investors are willing to pay a premium to
be a blockholder. It is at this extreme where the blockholder has very little chance of exercising
control in the company that we measure the non-pecuniary private benefits. In our sample, non-
pecuniary private benefits range from 0.61% (for a block trade of 5% of the firm’s shares) to
5.92% (for a block trade of 50% of the firm’s shares) of the share price. The fraction of non-
pecuniary benefits out of the total private benefits ranges from 18% (for a block trade of 5% of
the firm’s shares) to 29% (for a block trade of 50% of the firm’s shares) when total private
benefits are computed at the mean values of the variables. This shows us that although non-
23
pecuniary private benefits are smaller in size than pecuniary private benefits, non-pecuniary
private benefits constitute a non-trivial portion of the total private benefits.17
As one must be quite wealthy to purchase a block of shares, we think that becoming a
large owner of a company is another way of pursuing the ‘lifestyles of the rich and famous’ and
that considerable non-pecuniary benefits must be embedded in the premium these blockholders
pay to acquire blocks of shares. The reason blocks are traded at a premium even when there are
only private benefits of ownership or non-pecuniary benefits may have resemblance to why
people pay an extraordinary price to acquire a piece of art or a wine collection.18
D. Robustness Tests
D1. Subsample of Positive Block Premiums
Some blocks of shares are traded at a discount rather than at a premium. This is because
the ownership of a block of shares not only brings benefits, but also costs, such as monitoring
costs, inventory costs, and the costs of possibly carrying an undiversified portfolio. If these costs
outweigh the benefits, block trades will occur at a discount. Therefore, it should be noted that the
block premium is a net-benefit measure of private benefits. However, to avoid the possible
ambiguity of interpreting negative net private benefits, we examine if our results hold for the
subsample of block trades with positive block premiums. This subsample, as was shown in Table
1, consists of 514 block trades, or 69.65% of our entire sample.
We repeat the same test procedures for the subsample of block trades that occur at a
positive premium. The results reported in Panel A of Table 6 are similar to those in Table 5,
17 One may argue that the blockholder has both pecuniary and non-pecuniary private benefits, when she has
control of the company. In this case, our measure of non-pecuniary private benefits when the control level
is zero may represent a lower bound of the true size of non-pecuniary private benefits. This strengthens our
finding that non-pecuniary private benefits comprise a sizable amount relative to the total private benefits.
18 See Rachman (1999) for the evidence on the prices of wine.
24

which reports the results for the whole sample of block trades.19 Thus, our results are robust to
whether block trades occur at a premium or a discount.
[Table 6]
D2. Other Control Activities
Although replacing the top executive is the most significant manifestation of a control
activity, there can be other ways in which the blockholder can exert influence in the firm. Thus,
besides examining only the changes in the top executive position, we check how expected
changes in board members, investment policy (capital expenditure and R&D), and financial
policy (leverage and dividend payout) affect the size of private benefits.
Panel B of Table 6 shows the results of alternative specifications for the recursive
regression model of estimating the block premium. The effect of the likelihood of board turnover
on the block premium is examined in Model 1. Using a similar methodology that was used to
explain top executive turnover, the probability of board turnover is the implied probability of
board turnover at the time of the block trade and is created from the first-stage logit regression
where the explanatory variables are prior firm performance, percentage of shares acquired, log of
firm size, insider ownership, and outsider-dominated board dummy. The results show that the
expected likelihood of board turnover is not a statistically significant factor of the block premium.
The effects of the expected changes in capital expenditure and R&D on the block
premium are shown in Models 2 and 3, respectively. The change in capital expenditure variable is
the implied change in capital expenditure at the time of the block trade and is created from the
first-stage logit regression where the explanatory variables, following Bertrand and Schoar
(2003), are cash flow, Tobin’s Q, and the log of firm size. The change in R&D variable is
19 For brevity, in Table 6, we only report coefficients of interest. Full results are available upon request.
25

constructed in the same way. The results show that the expected change in capital expenditure
positively affects the size of the block premium, whereas the expected change in R&D is not a
significant determinant of the block premium. Under the situation where capital expenditure is
expected to increase by 100%, the block premium increases by 1.7%. This implies that increased
capital expenditure, such as investing in pet projects, may be one way through which private
benefits are realized.
The effects of the expected changes in leverage and dividend payout ratio are shown in
Models 4 and 5, respectively. The change in leverage is the implied change in leverage at the time
of the block trade and is created from the first-stage logit regression where the explanatory
variables, following Bertrand and Schoar (2003), are cash flow, ROA, and the log of firm size.
The change in the dividend payout ratio is constructed in the same way. The results show that
both measures of financial policy are not significant determinants of the block premium.
To summarize, when we measure private benefits that result from additional control
activities, the change in capital expenditure is the only variable that significantly affects the block
premium. This suggests that capital expenditure may be one channel where the block owner can
extract private benefits from the company. However, the likelihood of increasing capital
expenditure seems to have much smaller economic significance than the likelihood of top
executive turnover. A 50% increase in the expected capital expenditure increases the block
premium by only 0.85%, whereas a 50% increase in the likelihood of top executive turnover
increases the block premium by 4.6%.20
20 Another thing to note is that the goodness-of-fit of the model under alternative control activity is much
lower than the goodness-of-fit of the model using top executive turnover, which was shown in Table 4.
26

IV. Conclusion
Non-pecuniary private benefits noted in studies such as Jensen and Meckling (1976),
Demsetz and Lehn (1985), and Barclay and Holderness (1989) are inherently difficult to measure.
In this study, we provide an estimate of non-pecuniary private benefits by using the block
premium that is associated with block trades. We first decompose private benefits into benefits
that accrue from having ownership of the firm and benefits that accrue from having control of the
firm. This decomposition is possible because each block trade, which results in partial ownership
and partial control of the company, is different with respect to both the level of ownership and the
level of control that it brings to the new blockholder. The decomposition allows us to quantify the
amount of pecuniary and non-pecuniary private benefits. Although much of private benefits arise
from having control over the firm, private benefits that do not involve control over the firm, or
non-pecuniary private benefits, account for a non-trivial amount of total private benefits.
27

[References]
Ai, C. and E. Norton, 2003, Interaction terms in logit and probit models, Economics Letters 80, 123-129.
Barclay, M. and C. Holderness, 1989, Private benefits from control of public corporations, Journal of
Financial Economics 25, 371-395.
Bertrand, M. and A. Schoar, 2003, Managing with style: The effect of managers on firm policies, The
Quarterly Journal of Economics 118, 1169-1208.
Bethel, J., J. Liebeskind, and T. Opler, 1998, Block share purchase and corporate performance, The
Journal of Finance 53, 605-634.
Brickley, J., J. Coles, and R. Terry, 1994, Outside directors and the adoption of poison pills, Journal of
Financial Economics 35, 371-390.
Byrd, J. and K. Hickman, 1991, Do outside directors monitor managers? Evidence from tender offer bids,
Journal of Financial Economics 32, 195-221.
DeAngelo, H. and L. DeAngelo, 1985, Managerial ownership of voting rights, Journal of Financial
Economics 14, 33-71.
Demsetz, H. and K. Lehn, 1985, The structure of corporate ownership: causes and consequences, Journal
of Political Economy 93, 1155-1177.
Denis, D., D. Denis, and A. Sarin, 1997, Ownership structure and top executive turnover, Journal of
Financial Economics 45, 193-221.
Dyck, A. and L. Zingales, 2004, Private benefits: An international comparison, Journal of Finance 59,
537-600.
Holderness, C. and D. Sheehan, 1988, The role of majority shareholders in publicly held corporations,
Journal of Financial Economics 20, 317-346.
Jensen, M., 1986, Agency costs of free cash flow, corporate finance, and takeovers, American Economics
Review 76, 323-329.
Jensen, M. and W. Meckling, 1976, Theory of the firm: Managerial behavior, agency costs, and
ownership structure, Journal of Financial Economics 3, 305-360.
28
29
Jiraporn, P. and K. Gleason, 2007, Capital structure, shareholder rights, and corporate governance, The
Journal of Financial Research 30, 21-33.
Johnson, S., R. La Porta, F. Lopez-de-Salines, and A. Shleifer, 2000, Tunneling, American Economic
Review 90, 22–27.
La Porta, R., F. Lopez-de-Salines, and A. Shleifer, 2000, Investor protection and corporate governance,
Journal of Financial Economics 59, 3–27.
La Porta, R., F. Lopez-de-Salines, A. Shleifer, and R. Vishny, 1997, Legal determinants of external
finance, Journal of Finance 1, 1131–1150.
La Porta, R., F. Lopez-de-Salines, A. Shleifer, and R. Vishny, 1998, Law and finance, Journal of Political
Economy 6, 1113–1155.
Mikkelson, W. and M. Partch, 1989, Managers’ voting rights and corporate control, Journal of Financial
Economics 25, 263-290.
Mikkelson, W. and M. Partch, 1997, The decline of takeovers and disciplinary managerial turnover,
Journal of Financial Economics 44, 205-228.
Mikkelson, W. and H. Regassa, 1991, Premiums paid in block transactions, Managerial and Decision
Economics 12, 511-517.
Morck, R., A. Shleifer, and R. Vishny, 1988, Management ownership and market valuation: An empirical
analysis, Journal of Financial Economics 20, 293-316.
Nicodano, G. and A. Sembenelli, 2004, Private benefits, block transaction premiums and ownership
structure, International Review of Financial Analysis 13, 227-244.
Powers, E., 2005, Interpreting logit regressions with interaction terms: an application to the management
turnover literature, Journal of Corporate Finance 11, 504-522.
Rachman, G., 1999, The price puzzle, The Economist, 353, 95-97.
Stulz, R., 1988, Managerial control of voting rights: Financing policies and the market for corporate
control, Journal of Financial Economics 20, 25-54.
Weisbach, M., 1988, Outside directors and CEO turnover, Journal of Financial Economics 20, 431-460.

30
Table 1 Summary Statistics
This table gives means and medians of several variables for 756 firms whose blocks are traded between 1987 and 2005, identified through the SDC Mergers and Acquisition database. Firms belong to subsequent CEO Turnover group if there is a turnover in the top executive position of the firm within one year after the block trade. The incidence of top executive turnover is found through a search of the LexisNexis Company Profiles. Block premium (%) is defined as 100x{(price per share paid for the block) – (exchange price one day after the announcement of the transaction)} / (exchange price one day after the announcement of the transaction). Percent of shares acquired is the percentage of the firm’s equity that is acquired in the block transaction. Transaction value is the number of shares acquired in the block transaction multiplied by the trading price of the block. Prior firm performance is the percentage of common stock return for the 12 months ending two months before the block trade announcement minus the return on the CRSP equal-weighted index. Leverage is measured as the book value of long-term debt over the book value of assets. Insider holding variable is the percentage of shares owned by officers and directors and includes those shares owned by individuals related to a member of the top-management team, employee pension or stock option plans, trusts for which managers have some voting authority, and any other blocks of shares over which a member of the top management team has voting authority. Outsider-dominated board dummy is a dummy variable that takes the value of 1 when more than 60% of the board’s directors are outsiders of the company. Top exec is founding family dummy variable is a dummy variable that takes the value of 1 when the top executive is a member of the founding family. Individual acquirer dummy is a dummy variable that takes the value of 1 when the acquirer is an individual. Data on block premium, percentage of shares acquired, transaction value, individual purchaser dummy, total assets, and market value of equity are from the SDC Mergers and Acquisition database. Data on leverage are from Compustat for the year prior to the block transaction. Data on prior firm performance are from CRSP. Data on board composition and ownership structure are from the last proxy statements (according to the record date) prior to the block trade. Dollar values are in millions. Significant differences between the two groups are indicated at the 10%, 5%, and 1% levels by *, **, and ***, respectively, according to the t-test.
Whole sample Subsequent CEO Turnover
No subsequent CEO Turnover
mean median mean median mean median
Difference in mean
Block premium (%) 9.31 7.42 17.80 13.45 6.92 5.26 10.88*** Firms with positive premium (%)
69.65 - 75.44 - 68.02 - 3.52Percent of shares acquired (%) 12.48 9.33 15.37 13.78 11.67 8.40 3.70**Transaction value (mil) 51.40 12.79 57.46 15.83 49.70 11.07 7.76Prior firm performance (%) 7.72 5.87 -3.96 1.34 11.01 7.33 -14.97*Total asset (mil) 758.12 88.95 713.40 76.62 770.70 92.94 -57.30Leverage 0.42 0.39 0.51 0.43 0.39 0.38 0.12Insider holding (%) 7.83 2.84 6.13 2.03 8.31 3.01 -2.18Institutional ownership (%) 25.49 20.26 24.28 19.88 25.83 20.40 -1.56Outsider dominated board dummy
0.81 1 0.85 1 0.80 1 0.05
Board size 7.47 7 7.01 7 7.60 7 -0.59Top exec is founding family dummy
0.18 0 0.17 0 0.18 0 -0.01
Individual acquirer dummy 0.16 0 0.13 0 0.17 0 -0.04Sample size 738 162 576
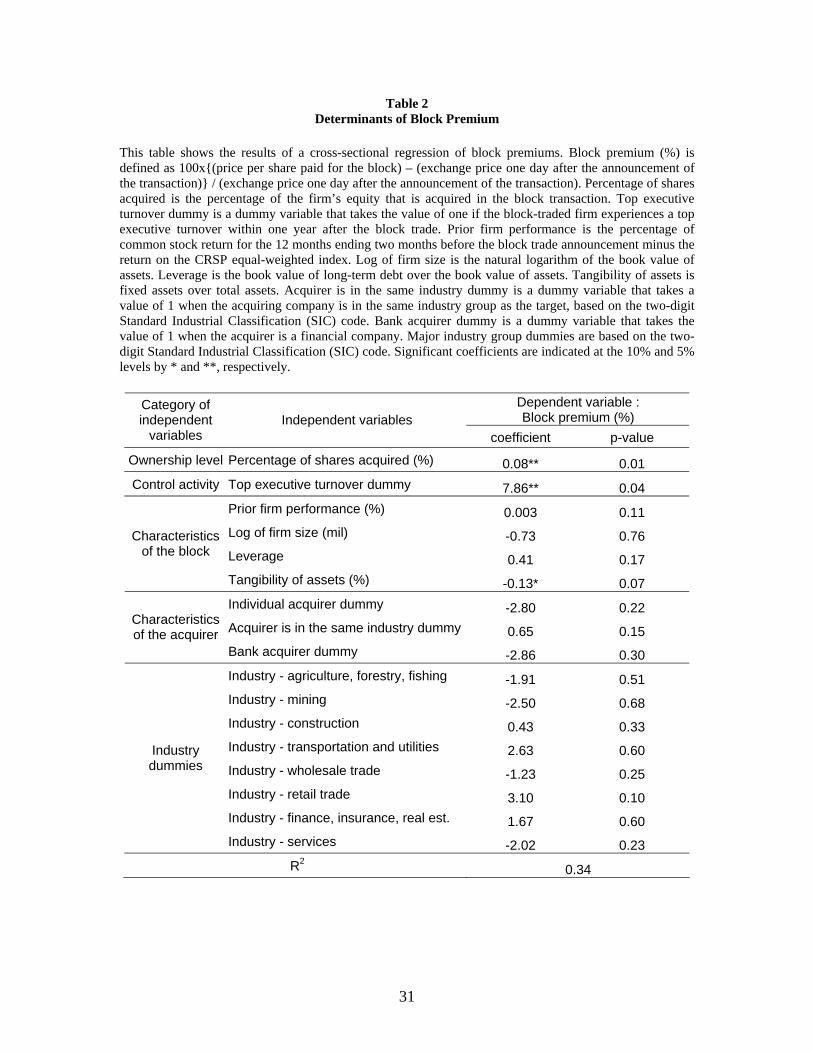
Table 2 Determinants of Block Premium
This table shows the results of a cross-sectional regression of block premiums. Block premium (%) is defined as 100x{(price per share paid for the block) – (exchange price one day after the announcement of the transaction)} / (exchange price one day after the announcement of the transaction). Percentage of shares acquired is the percentage of the firm’s equity that is acquired in the block transaction. Top executive turnover dummy is a dummy variable that takes the value of one if the block-traded firm experiences a top executive turnover within one year after the block trade. Prior firm performance is the percentage of common stock return for the 12 months ending two months before the block trade announcement minus the return on the CRSP equal-weighted index. Log of firm size is the natural logarithm of the book value of assets. Leverage is the book value of long-term debt over the book value of assets. Tangibility of assets is fixed assets over total assets. Acquirer is in the same industry dummy is a dummy variable that takes a value of 1 when the acquiring company is in the same industry group as the target, based on the two-digit Standard Industrial Classification (SIC) code. Bank acquirer dummy is a dummy variable that takes the value of 1 when the acquirer is a financial company. Major industry group dummies are based on the two-digit Standard Industrial Classification (SIC) code. Significant coefficients are indicated at the 10% and 5% levels by * and **, respectively.
Dependent variable : Block premium (%)
Category of independent
variables Independent variables
coefficient p-value
Ownership level Percentage of shares acquired (%) 0.08** 0.01 Control activity Top executive turnover dummy 7.86** 0.04
Prior firm performance (%) 0.003 0.11 Log of firm size (mil) -0.73 0.76 Leverage 0.41 0.17
Characteristics of the block
Tangibility of assets (%) -0.13* 0.07 Individual acquirer dummy -2.80 0.22 Acquirer is in the same industry dummy 0.65 0.15
Characteristics of the acquirer
Bank acquirer dummy -2.86 0.30 Industry - agriculture, forestry, fishing -1.91 0.51 Industry - mining -2.50 0.68 Industry - construction 0.43 0.33 Industry - transportation and utilities 2.63 0.60 Industry - wholesale trade -1.23 0.25 Industry - retail trade 3.10 0.10 Industry - finance, insurance, real est. 1.67 0.60
Industry dummies
Industry - services -2.02 0.23 R2
0.34
31
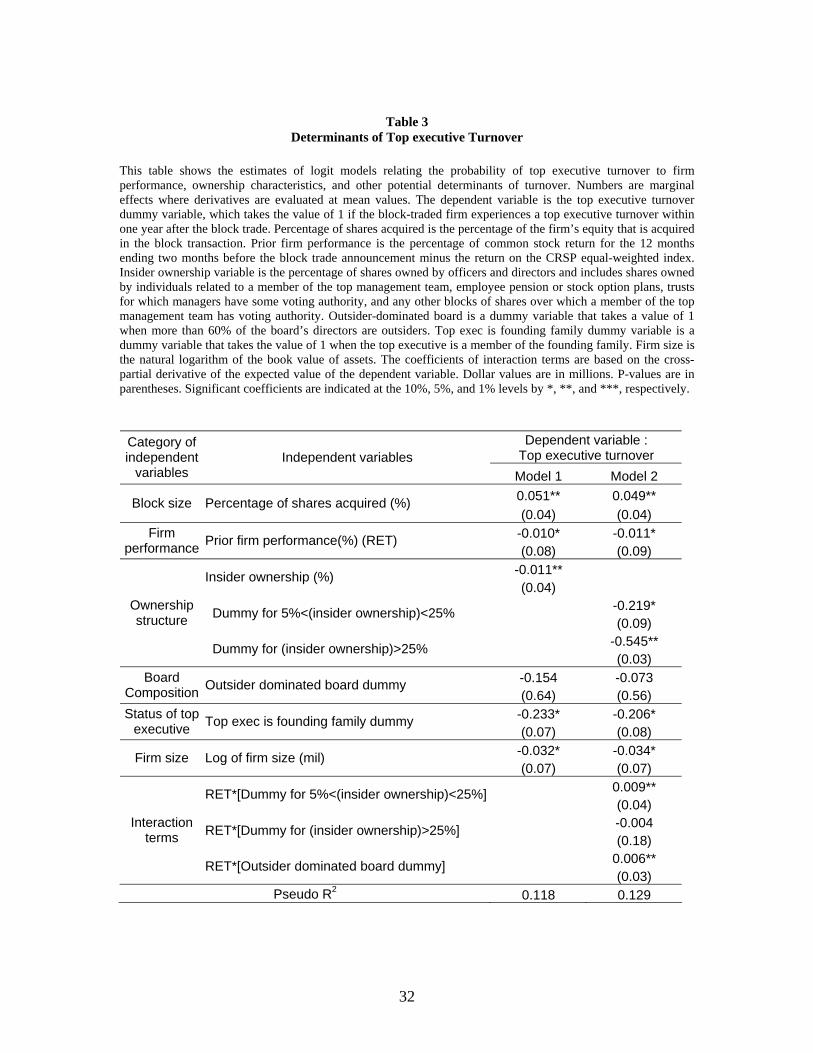
Table 3
Determinants of Top executive Turnover
This table shows the estimates of logit models relating the probability of top executive turnover to firm performance, ownership characteristics, and other potential determinants of turnover. Numbers are marginal effects where derivatives are evaluated at mean values. The dependent variable is the top executive turnover dummy variable, which takes the value of 1 if the block-traded firm experiences a top executive turnover within one year after the block trade. Percentage of shares acquired is the percentage of the firm’s equity that is acquired in the block transaction. Prior firm performance is the percentage of common stock return for the 12 months ending two months before the block trade announcement minus the return on the CRSP equal-weighted index. Insider ownership variable is the percentage of shares owned by officers and directors and includes shares owned by individuals related to a member of the top management team, employee pension or stock option plans, trusts for which managers have some voting authority, and any other blocks of shares over which a member of the top management team has voting authority. Outsider-dominated board is a dummy variable that takes a value of 1 when more than 60% of the board’s directors are outsiders. Top exec is founding family dummy variable is a dummy variable that takes the value of 1 when the top executive is a member of the founding family. Firm size is the natural logarithm of the book value of assets. The coefficients of interaction terms are based on the cross-partial derivative of the expected value of the dependent variable. Dollar values are in millions. P-values are in parentheses. Significant coefficients are indicated at the 10%, 5%, and 1% levels by *, **, and ***, respectively.
Dependent variable : Top executive turnover
Category of independent
variables Independent variables
Model 1 Model 2 0.051** 0.049** Block size Percentage of shares acquired (%) (0.04) (0.04)
-0.010* -0.011* Firm performance Prior firm performance(%) (RET)
(0.08) (0.09) -0.011** Insider ownership (%) (0.04)
-0.219* Dummy for 5%<(insider ownership)<25% (0.09) -0.545**
Ownership structure
Dummy for (insider ownership)>25% (0.03)
-0.154 -0.073 Board Composition Outsider dominated board dummy
(0.64) (0.56) -0.233* -0.206* Status of top
executive Top exec is founding family dummy (0.07) (0.08)
-0.032* -0.034* Firm size Log of firm size (mil) (0.07) (0.07)
0.009** RET*[Dummy for 5%<(insider ownership)<25%] (0.04) -0.004 RET*[Dummy for (insider ownership)>25%] (0.18) 0.006**
Interaction terms
RET*[Outsider dominated board dummy] (0.03)
Pseudo R2 0.118 0.129
32

Dependent variable: block premium (%) Category of independent
variables Independent variables
Model 1 Model 2 Model 3 Model 4 Model 50.129** 0.140** 0.096** 0.098** 0.118** Ownership level Percentage of shares acquired (%) (Block)(0.04) (0.04) (0.03) (0.04) (0.03)
0.092** 0.073** [Prob of top executive turnover_1](%)(T/O1)(0.01) (0.02)
0.095** 0.041** 0.022** Control level
[Prob of top executive turnover_2](%)(T/O2) (0.02) (0.02) (0.02) 0.001 0.002 0.001 0.003 0.002 Prior firm performance (%) (0.13) (0.14) (0.11) (0.12) (0.14) 0.019 -0.039 0.018 -0.015 -0.008 Log of firm size (mil) (0.66) (0.69) (0.78) (0.75) (0.67) 0.292 0.268 0.317* 0.325 0.319* Leverage (0.10) (0.11) (0.09) (0.10) (0.09)
-0.119* -0.103** -0.098** -0.113** -0.102**
Characteristics of the block
Tangibility of assets (%) (0.06) (0.04) (0.04) (0.03) (0.03) 2.325* 2.658* 1.881* 1.790 1.884* Individual acquirer dummy (0.09) (0.10) (0.09) (0.11) (0.09) 0.652 0.684 0.527 0.403 0.483 Acquirer is in the same industry dummy (0.13) (0.17) (0.11) (0.15) (0.11) -4.371 -4.964 -4.688 -4.580 -4.371
Characteristics of the acquirer
Bank acquirer dummy (0.29) (0.26) (0.27) (0.24) (0.26) 0.012* 0.011** Block * T/O1 (0.08) (0.04) 0.018** Block * T/O2 (0.03) 0.002** [Prob of top executive turnover_2]2 (0.04) 0.009
Square and interaction
terms
[Percentage of shares acquired]2 (0.46)
Adjusted R2 0.27 0.25 0.28 0.30 0.33
33
Table 4 Two-Stage Regression of the Block Premium
This table shows the results of a recursive regression model for estimating the block premium, wherein the probability of top executive turnover is treated as endogenous. The block premium (%) is defined as 100x{(price per share paid for the block) – (exchange price one day after the announcement of the transaction)} / (exchange price one day after the announcement of the transaction). Percentage of shares acquired is the percentage of the firm’s equity that is acquired in the block transaction. Probability of top executive turnover is the implied probability of top executive turnover at the time of the block trade and is created from a logit regression of Table 3. This probability is then multiplied by 100. Probability of executive turnover_1 is the implied probability of turnover from Model 1 in Table 3. Probability of executive turnover_2 is the implied probability of turnover from Model 2 in Table 3. Prior firm performance is the percentage of common stock return for the 12 months ending two months before the block trade announcement minus the return on the CRSP equal-weighted index. Log of firm size is the natural logarithm of the book value of assets. Leverage is the book value of long-term debt over the book value of assets. Tangibility of assets is fixed assets over total assets. Acquirer is in the same industry dummy is a dummy variable that takes a value of one when the acquiring company is in the same industry group as the target based on the two-digit SIC code. Bank acquirer dummy is a dummy variable that takes the value of 1 when the acquirer is a financial company. Major industry group dummies based on the two-digit SIC code and year dummies are included in the regression (not reported). Dollar values are in millions. P-values are in parentheses. Significant coefficients are indicated at the 10%, 5%, and 1% levels by *, **, and ***, respectively.

34
Table 5 Average Percentage Block Premiums for Different Block Sizes and Probabilities of Top executive Turnover
In this table, we calculate block premiums according to Model 5 of Table 4, given different values of the block size (percentage of shares acquired) and the implied probability of top executive turnover. Right hand side variables (except for the block size) in the first-stage regression of Eq. (4) for explaining the probability of executive turnover are chosen so that they lie within the same standard deviation from their respective means. For all other variables in the second-stage regression of Eq. (4) for estimating the block premium, given a certain block size and probability of executive turnover, we use the mean values.
Block size as a percentage of firm's equity Probability of
top executive turnover 5 10 15 20 25 30 500 0.61 1.20 1.79 2.38 2.97 3.56 5.92
10
1.58 2.72 3.86 5.00 6.14 7.28 11.8420 2.95 4.64 6.33 8.02 9.71 11.40 18.1625 3.79 5.75 7.72 9.68 11.65 13.61 21.4730 4.72 6.96 9.20 11.44 13.68 15.92 24.8840 6.89 9.68 12.47 15.26 18.05 20.84 32.0050 9.46 12.80 16.14 19.48 22.82 26.16 39.5275 17.64 22.35 27.07 31.78 36.50 41.21 60.07100 28.31 34.40 40.49 46.58 52.67 58.76 83.12
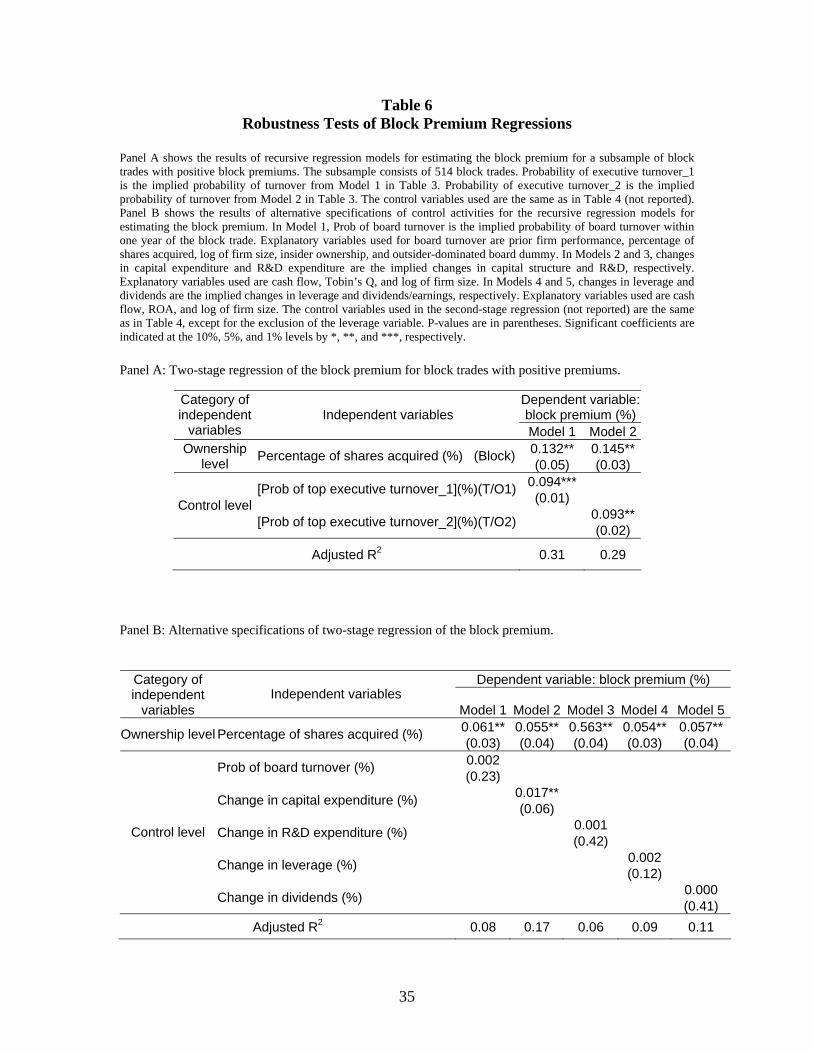
Table 6 Robustness Tests of Block Premium Regressions
Panel A shows the results of recursive regression models for estimating the block premium for a subsample of block trades with positive block premiums. The subsample consists of 514 block trades. Probability of executive turnover_1 is the implied probability of turnover from Model 1 in Table 3. Probability of executive turnover_2 is the implied probability of turnover from Model 2 in Table 3. The control variables used are the same as in Table 4 (not reported). Panel B shows the results of alternative specifications of control activities for the recursive regression models for estimating the block premium. In Model 1, Prob of board turnover is the implied probability of board turnover within one year of the block trade. Explanatory variables used for board turnover are prior firm performance, percentage of shares acquired, log of firm size, insider ownership, and outsider-dominated board dummy. In Models 2 and 3, changes in capital expenditure and R&D expenditure are the implied changes in capital structure and R&D, respectively. Explanatory variables used are cash flow, Tobin’s Q, and log of firm size. In Models 4 and 5, changes in leverage and dividends are the implied changes in leverage and dividends/earnings, respectively. Explanatory variables used are cash flow, ROA, and log of firm size. The control variables used in the second-stage regression (not reported) are the same as in Table 4, except for the exclusion of the leverage variable. P-values are in parentheses. Significant coefficients are indicated at the 10%, 5%, and 1% levels by *, **, and ***, respectively.
Panel A: Two-stage regression of the block premium for block trades with positive premiums.
Dependent variable: block premium (%)
Category of independent
variables Independent variables
Model 1 Model 2 0.132** 0.145** Ownership
level Percentage of shares acquired (%) (Block)(0.05) (0.03)
0.094*** [Prob of top executive turnover_1](%)(T/O1)(0.01)
0.093** Control level
[Prob of top executive turnover_2](%)(T/O2) (0.02)
Adjusted R2 0.31 0.29
Panel B: Alternative specifications of two-stage regression of the block premium.
Dependent variable: block premium (%) Category of independent
variables Independent variables
Model 1 Model 2 Model 3 Model 4 Model 50.061** 0.055** 0.563** 0.054** 0.057** Ownership level Percentage of shares acquired (%) (0.03) (0.04) (0.04) (0.03) (0.04) 0.002 Prob of board turnover (%) (0.23)
0.017** Change in capital expenditure (%) (0.06) 0.001 Change in R&D expenditure (%) (0.42) 0.002 Change in leverage (%) (0.12) 0.000
Control level
Change in dividends (%) (0.41) Adjusted R2 0.08 0.17 0.06 0.09 0.11
35

Figure I Relationship between Block Premium, Percentage of Shares Acquired,
and the Probability of Top executive Turnover Figure I shows a three-dimensional plot that depicts the relationship among the block premium, the percentage of shares acquired, and the probability of top executive turnover, according to Model 5 of Table 4.
0
20
40
60
80
100
120
140
160
0
20
40
60
80
100
020
4060
80100
Blo
ck p
rem
ium
(%)
Bloc
k size
(% o
f firm
's eq
uity)
Probability of CEO turnover (%)
36