ceo ownership, external governance, and...
TRANSCRIPT
1
CEO Ownership, External Governance, and Risk-taking
E. Han Kim and Yao Lu1
Abstract
This paper shows the relation between CEO ownership and firm valuation hinges critically on the
strength of external governance (EG). The relation is hump shaped when EG is weak, but is insignificant
when EG is strong. The results imply that CEO ownership and EG are substitutes in mitigating agency
problems when ownership is low. However, very high levels of ownership can reduce firm value by
entrenching the CEO and discouraging him from taking risk, unless mitigated by strong EG. We identify
channels through which CEO ownership affects firm value by examining R&D, which is discretionary and
risky. We find CEO ownership similarly exhibits a hump shaped relation with R&D when EG is weak, but
no relation when EG is strong. Our results are robust to endogeneity issues concerning CEO ownership
and EG.
Forthcoming in Journal of Financial Economics
February 10, 2011
JEL Classification: G34, G32, D86, L22.
Keywords: Managerial Share Ownership, R&D, Product Market Competition, Institutional Ownership
Concentration.
1 E. Han Kim, the corresponding author, is at Ross School of Business, University of Michigan, Ann Arbor, Michigan
48109. Email: [email protected]. Yao Lu is at School of Economics and Management, Tsinghua University, Beijing, China. Email: [email protected]. We have benefited from helpful comments and suggestions from an anonymous referee, Kenneth Ahern, Heitor Almeida, James Ang, Sugato Bhattacharyya, Sreedhar Bharath, Dennis
Capozza, Ing Cheng, Henrik Cronqvist, Amy Dittmar, Art Durnev, Mara Faccio, Xavier Giroud, Luo Jiang, Jin-Mo Kim,
John McConnell, Adair Morse, Darius Palia, Amiyatosh Purnanandam, Enrique Schroth, Jagadeesh Sivadasan, Joel Slemrod, Jeffery Smith, finance seminar participants at Chinese University of Hong Kong, George Mason University, Rutgers University, State University of New York at Buffalo, University of California at Irvine, University of Mannheim, and University of Michigan, and participants at 2009 University of Cambridge Symposium on Corporate Governance and Control and 2010 Florida State University Spring Beach Conference. We acknowledge financial support from Mitsui Life Financial Research Center at the University of Michigan.
2
1. Introduction
Understanding corporate governance requires studies not only of how an individual governance
mechanism works but also how different governance mechanisms interact to mitigate or, in some
circumstances, exacerbate agency problems. This paper investigates the interactive effects of two
extensively studied governance mechanisms: managerial ownership, an important internal mechanism;
and external governance (EG) mechanisms. We study their interactive effects on shareholder value. We
also examine R&D to identify the channels through which the join effects take place.
How managerial share ownership affects firm value is a contentious issue. Earlier studies by
Morck, Shleifer, and Vishny (1988) and McConnell and Servaes (1990) document hump shaped relations
between Tobin’s Q and insider share ownership.2 They argue that stock ownership improves the
alignment of managerial incentives with shareholder value at low levels of ownership, but beyond a
certain threshold, entrenchment effects dominate the alignment effect. This causal interpretation is
challenged by a number of authors, who argue that managerial ownership is endogenous and the hump
shaped relation is spurious.3 In a widely cited study, Himmelberg, Hubbard, and Palia (1999) show that
when firm fixed effects are controlled for, total insider share ownership of all directors and officers has
no identifiable impact on Q.
While Himmelberg et al. examine insider share ownership, we focus on CEO ownership. CEOs
tend to have the most influence on decision making. Thus, if insider ownership has any identifiable
effects, the impact should be most visible with CEO ownership. More important, within-firm variation in
total insider share ownership is affected by changes in the number, and in the composition, of insiders
2 See Holderness, Kroszner, and Sheehan (1999); Anderson and Reeb (2003); Adams and Santos (2006); McConnell,
Servaes, and Lins (2008); and Fahlenbrach and Stulz (2009) for subsequent studies also documenting significant relations between managerial ownership and firm performance. 3 See Demsetz and Lehn (1985); Kole (1996), Agrawal and Knoeber (1996); Loderer and Martin (1997); Cho (1998);
Himmelberg, et al. (1999); Demsetz and Villalonga (2001); and Coles, Lemmon, and Meschke (2007). Demsetz and Lehn are first to argue insider share ownership reflects optimal incentive contracts.
However, this efficient
contracting view is questioned by a number of authors who argue that incentive contracts are often captured by the CEO. See Bebchuk and Fried (2004) for a survey of the inefficient contracting view.
3
over time, which may have little to do with ownership per se. These confounding effects bias towards
finding no effect, because identification in regressions with firm fixed effects comes from within-firm
variation in ownership. CEO ownership contains no such confounding effect and is free of this bias.
The focus on CEO ownership makes an important difference to identifying the ownership effect.
When we replicate Himmelberg et al.’s Q regression with total insider share ownership on larger panel
data over a longer period, we indeed find no relation. However, when the insider ownership is replaced
by CEOs’ or top five executives’ combined stock ownership, the relation becomes highly significant and
hump shaped. Himmelberg et al.’s inability to identify a significant relation seems due to the changes
over time in the number and in the composition of insiders, rather than low within-firm variation in
ownership (Zhou, 2001).
Stock options are an important part of executive incentives during our sample period; therefore,
we broaden our CEO ownership measure to include stock options. The relation with this measure of
ownership is also hump shaped and significant. Our estimation reveals a marginal effect of CEO
ownership on Q (the slope in the hump shaped relation) of 1.56 at 1% ownership, 0.395 at 20%
ownership, and -0.83at 40% ownership. The inflection point is 26%.
The negative relation at high levels of ownership illustrates that large CEO ownership, which our
data shows is not an isolated case limited to few firms, can be harmful to shareholder value. The
harmful effects proffered in the literature include excessive private benefits, expropriation of minority
shareholder wealth, and empire building. However, these activities may not lead necessarily to a
negative slope in the relation between Q and CEO ownership, because as a CEO’s ownership increases,
so does his share of the costs of engaging in those activities.
We offer another explanation for the negative slope: Large stock ownership gives high wealth-
performance sensitivity and voting rights conducive for managerial entrenchment, and their
combination leads to overly conservative risk choices. Holmstrom (1979) shows that increasing
4
compensation sensitivity to performance induces greater effort but also induces a risk averse agent to
take less risk. Thus, high wealth-performance sensitivity may create a gap in the valuation of cash flows
between a CEO and other shareholders, which may lead to investment decisions with insufficient risk—
sub-optimal investments from the market valuation perspective. The end results may be low risk, value-
reducing investments and rejection of risky, positive NPV projects (Amihud and Lev, 1981; Smith and
Stulz, 1985; Hirshleifer and Suh, 1992; Low, 2009; Bhattacharyya and Cohn, 2010). Such value-reducing
risk choices are more likely when a CEO possesses sufficient voting rights to protect himself from
dismissal and/or challenges by external shareholders. Volpin (2002) and Atanassov and Kim (2009) find
top managers who are major shareholders are less likely to be dismissed for poor performance than top
managers with small or no equity stakes.
A CEO’s share of the value loss due to overly conservative risk choices also increases with
ownership. However, the incremental increase in value loss may not deter him from making more risk
averse decisions because those decisions are made to satisfy his personal risk tolerance, which is lower
than other shareholders because of his under-diversification.4 Thus, beyond a certain threshold, a
further increase in CEO stock ownership exacerbates the insufficient risk-taking problem by increasing
the CEO’s voting rights and wealth-performance sensitivity.
The risk- and value-reducing effect of large ownership is confined to stocks. Stock options do not
accord voting rights that help entrench CEOs; hence, ownership of options may not provide the
necessary control rights to make CEOs feel secure enough to make overly conservative risk choices.
Furthermore, convex instruments such as stock options may increase risk-taking.5 Thus, if an important
4 The relation between managerial risk preference and project risk choices is also documented by Faccio, Marchica,
and Mura (2010) who show that a controlling shareholder’s risk preference is related to the volatility of the firm’s earnings and stock price. 5 See, for example, Guay (1999), Coles, Daniel, and Naveen (2006), Low (2009), Dittmann and Yu (2010), Edmans
and Gabaix (2010), and Gormley, Matsa, and Milbourn (2010). However, the effect of stock options on risk-taking is subject to debate. Although the risk increasing argument based on the convexity of option payoffs is intuitively appealing, Carpenter (2000) and Ross (2004) argue that granting stock options makes a manager reduce the
5
portion of CEO ownership consists of options, we expect the negative effect on Q to be weaker when
the ownership measure includes options than when it excludes them. That is what we find.
To identify channels through which CEO ownership affects Q, we investigate the relation
between R&D and CEO ownership. Successful R&D generates growth opportunities reflected in Q. R&D
also tends to be discretionary and risky. Thus, the incentive effect on CEO effort may manifest as a
positive relation between R&D and CEO ownership at low levels, while the risk-reducing effect may
cause a negative relation at high levels of ownership. Our estimates show the relation for R&D is
significant and hump shaped. Also, as in Q regressions, the hump shape is less pronounced when
options are included in the CEO ownership measure, rendering further evidence that the negative slope
is due to excessive stock ownership dissuading CEOs from taking risk.
We expect the pervasiveness of the incentive and risk-reducing effects to depend on the
strength of external governance (EG). Strong EG leaves less room for agency problems that can be
mitigated by incentive effects. It may also preclude the CEOs from harming shareholder value by holding
them accountable for performance, weakening the risk-reducing effect. Consider a firm fighting for
survival because of a fiercely competitive product market, our primary proxy for EG. Such a firm may
have so little slack that when the CEO sees a high-risk but value-enhancing project, she may have no
choice but to take it.
To investigate the interactive effects of EG and CEO ownership, we divide observations into
strong and weak EG subsamples and re-estimate the relations for Q and R&D. Our primary proxy for EG
is a industry concentration ratio. Product market competition exerts external pressure to increase
volatility of assets under her control—through risk reducing investment decisions—because stock options increase the volatility of her personal portfolio. For example, Carpenter shows that when a manager has constant relative risk aversion, she targets a fixed volatility for her personal portfolio of options and outside wealth. Thus, granting more options will induce her to reduce the volatility of assets she controls in order to offset the increase in the volatility of her personal portfolio (assuming the manager cannot hedge the option position). However, Brisley (2006) goes a step further and demonstrates that the insufficient risk-taking problems can be mitigated by vesting schedules contingent on stock price appreciation.
6
efficiency and control agency problems. Recent evidence shows that such competition improves
governance (Guadalupe and Wulf, 2007) and serves as an effective EG mechanism (Giroud and Mueller,
2010). Our secondary proxy is institutional ownership concentration. Shleifer and Vishny (1986),
Bertrand and Mullainathan (2000), Hartzell and Starks (2003), Cremers and Nair (2005), Edmans (2009),
and Edmans and Manso (2011) demonstrate important roles blockholders and institutional investors
play in shaping corporate governance.6
The hump shaped relation between Q and CEO ownership is driven by observations under weak
EG; the relation is insignificant under strong EG. These relations reflect substitution effects in mitigating
agency problems. Weaker EG allows for greater agency problems that can be alleviated by CEO
ownership, which improves the alignment of CEO incentives with shareholder value. Stronger alignment
effects under weaker EG is also documented by Durnev and Kim (2005) in a cross-country context which
shows share ownership improves firm governance more in countries with weaker legal investor
protection, an EG mechanism at the country level.
The negative relation at high levels of ownership implies that when large stock ownership gives
a CEO high wealth-performance sensitivity and sufficient control rights, weak EG allows him to engage in
risk reducing activities harmful to shareholder value. Conversely, the insignificant relation for
observations subject to strong EG illustrates the preemptive effect strong EG has against the harmful
effect. The inflection point in the hump shaped relation for the weak EG subsample occurs at 22% or
27% of CEO ownership, depending on the measure of EG.
In addition, the hump shaped relation between R&D and CEO ownership is also driven by
observations under weak EG. The inflection points in the hump shaped relation occur at 20% or 27% of
CEO ownership, quite close to those in the Q relation. For observations under strong EG, the relation is
6 Another commonly used measure of governance is the anti-takeover index (Gompers, Ishii, and Metrick, 2003;
Bebchuk, Cohen, and Ferrell, 2009). It is not a suitable proxy for external governance because most anti-takeover provisions are firm choice variables, reflecting internal governance and other firm characteristics.
7
insignificant, also consistent with the Q results. These findings buttress our interpretation that the hump
shaped relation arises from the incentive and risk-reducing effects of CEO ownership.
We conduct a battery of robustness tests. First, we address endogeneity issues concerning CEO
ownership and our measures of EG. For CEO ownership, we use the sum of maximum state and federal
marginal personal income tax rates and CEO tenure as instrumental variables (IVs) and estimate two-
stage least squares regressions. We treat institutional ownership concentration (IOC) as endogenous
and employ the mean IOCs of peer firms as IVs. For the industry concentration ratio (ICR), we re-
estimate regressions restricting the sample to industries that do not switch between high and low ICR
classification throughout the sample period. We use lagged values of ICR and IOC to classify strong and
weak EG. Our final robustness checks involve re-estimation of key regressions using an alternative
model specification, sample constructions, and EG proxies. None alters our conclusions.
This paper contributes to the literature on several fronts. Focusing on CEO ownership helps
resolve the longstanding controversy over the relation between managerial ownership and firm
valuation. The interactive effects of EG and CEO ownership provide insights into their substitution
effects at low levels of ownership and demonstrate how strong EG curbs harmful effects of large stock
ownership. Moreover, our evidence on R&D identifies channels through which EG and CEO ownership
jointly affect firm performance. The R&D results render empirical support to the theory that high
wealth-performance sensitivity leads to insufficient risk-taking, which in turn provides the risk-based
explanation for the negative slope in the Q relation. Finally, our use of CEOs’ state and federal personal
income tax rates as an instrumental variable for CEO ownership may help future research on managerial
wealth and compensation in search of IVs not subject to firm choice.
The next section describes data and empirical design. Section 3 reexamines the relation
between managerial ownership and Q, and relates CEO ownership to Q and R&D with a modified
specification. Section 4 demonstrates the interactive effects of EG and CEO ownership. Section 5
8
addresses endogeneity issues concerning CEO ownership and EG, followed by other robustness tests.
Section 6 concludes.
2. Data and empirical design
We employ panel data from 1992 through 2006, constructed by merging the executive data in
ExecuComp with accounting data in Compustat and stock return data in CRSP. The merged data allow us
to track, through time, CEO ownership of stocks and options while controlling for relevant
characteristics. Sample size for individual regressions varies depending on the availability of data to
construct Q, the R&D variable, ownership measures, EG proxies, and control variables.
2.1. Valuation, R&D investment, and CEO ownership
Firm valuation is measured by Tobin’s Q, the sum of the market value of common stocks plus
the book value of total liabilities divided by the book value of total assets. R&D investment is measured
by R&D/K_Obs, R&D expenditures divided by property, plant, and equipment. This variable excludes
observations with missing values. A high frequency of missing R&D expenditures yields an R&D sample
size slightly more than half of the Q sample.
The explanatory variable of main interest is CEO ownership. We use two definitions throughout
the paper. The first, OWN_CEO_SO, includes stock options. It is the fraction of stock and option deltas
held by a CEO, equal to (the number of stocks and the delta of all stock options held by a CEO) / (the
number of all outstanding stocks + the delta of all outstanding stock options). We follow the Core and
Guay (2002) methodology to calculate delta of exercisable and un-exercisable stock options. 7 Since each
7 Specifically, OWN_CEO_SO = (Shrown + Total_OP_Delta_CEO) / (Shrsout * 1000 + Total_OP_Delta_Firm), where
Shrown is the number of shares held by a CEO in thousands; Shrsout is the number of common shares outstanding in millions; Total_OP_Delta_CEO is the delta of all stock options held by a CEO in thousands, estimated following
the procedure outlined in Appendix B in Edmans, Gabaix, and Landier (2009); and Total_OP_Delta_Firm is the
delta of all stock options outstanding by a firm in thousands. To calculate Total_OP_Delta_Firm, we take Optex and Optosey from Compustat, the number of stock
options exercisable as of the end of the year in thousands and the number of stock options granted to date in millions that have not been exercised or cancelled and are not exercisable at year-end, respectively. Because information on the exercise price and maturity for these options are unavailable from Compustat, we first estimate deltaun and deltaex for each executive covered by ExecuComp following Edmans et al., where deltaun and deltaex
9
stock has a delta of 1, OWN_CEO_SO is the percentage of the total delta of all outstanding stocks and
options belonging to a CEO. Our estimates of OWN_CEO_SO with firm ID and by year are available from
Journal of Financial Economics web page. The second measure, OWN_CEO, is the percentage stock
ownership held by a CEO. This ignores stock options and does not fully reflect CEO incentives. However,
previous studies examining the hump shaped relation between Q and managerial ownership rely on the
percentage stock ownership. OWN_CEO allows a direct comparison with the results reported in those
studies.
We use OWN_CEO_SO as the primary measure of CEO ownership because it captures incentives
from both stocks and options. However, OWN_CEO provides a more accurate measure of a CEO’s share
of voting rights because stock options do not accord voting rights. Voting rights are important because
even though CEOs are in control, their ability to make decisions harmful to shareholders, the level of
entrenchment, may depend on the percentage of voting rights they currently own. For example, a CEO
who owns 30% of voting rights may make suboptimal risk choices with much less fear of being ousted
than a CEO who owns 1% of voting rights.
Having discussed the issue of including options in the ownership measure, the next issue is how
to measure a CEO’s incentives. There are three potential measures: dollar change in wealth for a dollar
change in firm value (Jensen and Murphy, 1990), dollar change in wealth for a percentage change in firm
value (Hall and Liebman, 1998), and dollar change in wealth for a percentage change in firm value scaled
by compensation (Edmans et al., 2009). Both of our measures are the Jensen and Murphy type, which is
are delta per un-exercisable and exercisable stock options held by the executive, respectively. Then, we take the average across all executives (including the CEO) covered by ExecuComp to obtain deltaun_mean and deltaex_mean, the mean delta per un-exercisable and exercisable stock option for each firm, each year. These average delta per option are then used to obtain Total_OP_Delta_Firm = deltaex_mean * optex + deltaun_mean * optosey*1000.
Sometimes optex and optosey are missing, in which case we assign zero value. To guard against the possibility that they are positive but missing in Compustat, we also estimate Total_OP_Delta_Ex, the total delta of all stock options held by all executives reported in ExecuComp, again following Edmans et al. We then take max (Total_OP_Delta_Firm, Total_OP_Delta_Ex) as our final estimate of Total_OP_Delta_Firm.
10
negatively related to firm size (Hall and Liebman and Edmans et al.). 8 Since firm size may also be related
to Q, we control for firm size in all regressions.
2.2. Proxies for external governance
The primary measure of EG is the competitive pressure from product markets, as proxied by
industry concentration ratio (ICR). We follow the Economic Census approach to calculate ICR and define
it as the sum of the market share of the four biggest firms in sales among all firms in Compustat in the
same industry and same year. A lower ratio indicates greater competition and stronger EG. The
Economic Census reports four measures of ICR based on the largest 4, 8, 20, and 50 companies. We rely
on the 4 largest companies because ICRs based on the 8, 20, or 50 largest companies in Compustat have
a greater chance of omitting private companies, which lead to classification errors (Kadyrzhanova and
Rhodes-Kropf, 2007; Durnev and Mangen, 2009). Industries are defined by 48 Fama-French (1997)
industry groupings. To check robustness, we also use the Herfindahl-Hirschman Index (HHI) of all firms in
Compustat and the Economic Census HHI. Table I contains definitions of all variables.
Our measure of institutional ownership concentration (IOC) follows Hartzell and Starks (2003)
and uses the sum of the top five institutional investors’ share ownership. Institutional ownership data is
obtained from the CDA Spectrum database. IOC is positively correlated to ICR with a correlation
coefficient of 0.0984, indicating that they capture different aspects of EG mechanisms and IOC is a
useful secondary measure to check robustness.
2.3. Himmelberg et al. (1999) baseline model
We begin by estimating the following model:
Tobin’s Qit= ηt + θi + α0 + α1 OWNit + α2 Zit + μit (1)
8 Our measures also do not account for multiplicative effects of CEO actions on firm value and CEO utility (see
Core, Guay, and Larcker, 2003; Edmans et al., 2009). Edmans et al. develop a scaled wealth-performance sensitivity index, which incorporates both the size issue and the multiplicative effects. Although this index has the advantage of being independent of firm size, it cannot be used for our purpose because, like the Hall and Liebman measure, the Edmans et al. measure is by design highly sensitive to stock price. This makes both of them unsuitable as an explanatory variable for Q, because stock price is also the main driver of changes in Q.
11
Subscripts i and t indicate firm i and year t, and ηt and θi are year- and firm fixed effects. OWNit includes
ownership variables OWN and OWN2 as in McConnell and Servaes (1990). Zit is the same set of control
variables as in Himmelberg et al.’s (1999) baseline Q regression. They carefully choose variables that
may be related to both Q and insider share ownership to guard against the omitted variables problem.9
2.4. Modified specification
After re-estimating Himmelberg et al.’s regression with different measures of ownership, we
modify the specification in a number of ways. First, we cluster standard errors at the firm-CEO level
because the variable of main interest is CEO ownership and the autocorrelation among observations
over a CEO-tenure period is of concern. Second, we add six controls to Himmelberg et al.’s specification
to account for other characteristics that could affect CEO ownership and Q or R&D. For consistency, we
use as closely matched sets of controls for Q and R&D regressions; however, there are some controls
included in the Q regression that cannot be included in the R&D regression (e.g., R&D and SIGMA) and
vice versa.
The six new controls are: Firm age, FirmAge; return on asset, ROA; CEO age, CEO_Age; an
indicator for CEOs also chairing the board, Chair; the sum of cash and all securities readily transferable
9 Firm size, moral hazard, and risk aversion fit that category. Firm size is measured by log of sales, LNS. To control
for a possible non-linear size effect (Demsetz and Lehn, 1985), LNS2 also is included. Variables related to moral
hazard include K/S, the ratio of property, plant, and equipment (PPE) to sales, and its square, (K/S)2. Fixed assets
are easier to monitor and hence call for a lower level of managerial ownership. They may also be related to Q. Conversely, intangible assets and discretionary spending are harder to monitor and may lead to a higher level of ownership. They also may be related to growth opportunities and Q. R&D/K, the ratio of R&D expenditures to PPE, and A/K, the ratio of advertising expenditures to PPE are included as control variables. (Since both R&D and advertising expenditures are flow measures, we also normalize them by sales, also a flow measure, and re-estimate the regressions. The results are robust to this alternative scaling.) Because these variables are sometimes missing, RDUM and ADUM are used as indicator variables for data availability of R&D/K and A/K to maintain sample size. When the variables are missing, they are equal to zero and R&D/K or A/K is set to zero. The dummy variables allow the intercept term to capture the mean of the variables for missing values. In addition, I/K, capital expenditures divided by PPE, and Y/S, operating income normalized by sales are included as control variables. Himmelberg et al. use them to proxy for the link between high growth and discretionary investment opportunities and for free cash flow, respectively.
Firm idiosyncratic risk, SIGMA, is also included as a control variable because it also may be related to Q and managerial share ownership. Holding company stock reduces personal diversification; hence, the riskier the company stock, the less may be held by top executives. SIGMA is estimated by the standard error of the residuals from a CAPM model estimated using daily return for the period covered by the annual sample. As with R&D/K and A/K, missing values of SIGMA are set to zero, and SIGDUM is equal to one when SIGMA is not missing.
12
to cash divided by total assets, Cash/TA; and (Cash/TA)2. Firm age and ROA are used in previous studies
relating governance to Q (e.g., Bebchuk, Cremer, and Peyer, 2011). Newer firms may have more growth
opportunities, invest more in R&D, and their CEOs may have larger ownership. ROA may be also related
to Q, R&D, and CEO ownership. We include CEO age because it may be related to CEO ownership and
the attitude toward risk, which may affect R&D, growth opportunities, and Q. Chair is included because
the chair position may help a CEO more effectively impose his personal risk preference on R&D decisions
and Q, and the CEO’s ownership may differ from non-chair CEOs. Finally, Cash/TA may reflect financial
ability to take risk, affecting R&D. It may also be related to firm valuation (Dittmar and Mahrt-Smith,
2007). (Cash/TA)2 is included to control for a possible non-linear effect.
These six control variables enter both Q and R&D regressions. The Q regression also includes all
controls in the Himmelberg et al. specification. However, R&D, SIGMA, their dummies, and I/K do not
enter the R&D regression. Although sensible controls for the Q regression, SIGMA is the outcome of risk
taking, which R&D is supposed to capture, and I/K is the proxy for growth opportunities, which
successful R&D is supposed to generate. We include Leverage, long term debt divided by the book value
of total assets, as an additional control in the R&D regression because leverage may affect financial
flexibility to undertake R&D and may be related to ownership. However, leverage is not included in the
Q regression because Q is also the sum of the market value of equity divided by total asset and the book
value based leverage ratio. Finally, we exclude utility and financial firms for R&D regressions because
R&D is virtually non-existent in those industries. Less than 1% and 3% of observations in utility and
financial industries show non-missing R&D expenditures.
2.5. Summary statistics
Table II contains summary statistics of all variables used in this study. The statistics are based on
merged samples using various databases. The only common link is that they all contain information on
CEO stock ownership. As a result, CEO stock ownership, OWN_CEO, has the most observations; 22,353
13
firm-year observations associated with 2,805 firms. The sample for our primary ownership measure,
OWN_CEO_SO, is reduced by 16 observations due to data problems.10
The mean and median of OWN_CEO_SO is 3.2% and 0.8%, with average within-firm standard
deviations of 1.7%. The skewed distribution of managerial ownership is well documented (e.g., Morck et
al., 1988; Himmelberg et al., 1999; and Cho, 1998). Of 22,337 observations, 12,179 (54.52%) show CEO
ownership of no more than 1%. Nonetheless, 3,579 (16.02%) observations show ownership greater than
5%; 1,990 (8.91%) greater than 10%; and 791 (3.54%) greater than 20%. The maximum is 76.1%.
Table II also shows the maximum Q at 105.119. When Q is winsorized at the 1% and 99% level,
the minimum and the maximum becomes 0.752 and 9.003. The reported results are based on the non-
winsorized sample and are robust to using the winsorized sample.
3. Re-examination of the effects of managerial ownership
3.1. Himmelberg et al. (1999) Specification
We begin by re-estimating Himmelberg et al.’s regression model with firm fixed effects using
five different definitions of managerial ownership. The estimates are reported in Table III. OWN and
OWN2 correspond to the ownership variable at the head of each column. OWN_Inside in Column (1) is
the sum of fractions of shares held by all directors and officers. 11 The data is taken from Compact
Disclosure. The sample period begins in 1992 and ends in August 2005, the last month the ownership
data is available in Compact Disclosure. Column (1) is a replication of Himmelberg et al.’s baseline results
with larger and more recent data. Unsurprisingly, the estimation results are similar to those reported in
Himmelberg et al. They show no relation between total insider stock ownership and Q.
10
We set OWN_CEO = Shrown /(shrout *1000) in ExecuComp to minimize missing data. If the calculated value is one or greater, we replace it with Shrown-excl-opts-pct (the percentage of total shares owned_options excluded), a variable directly available from ExecuComp but has more missing values. Because we cannot use this variable in computing OWN_CEO_SO, OWN_CEO_SO has more estimated values equal to one or greater and/or missing values than OWN_CEO. 11
The sample size for this column is smaller than those in other columns because the data in Compact Disclosure ends in August 2005 and some firms in ExecuComp are not covered by Compact Disclosure. The results are robust to using the insider ownership data without matching Compact Disclosure to ExecuComp.

14
Insiders in OWN_Inside change over time in number and in composition. With firm fixed effects,
these time series variations bias the results toward finding no effect. Changes in the number of insiders
affect the within-firm variation of the ownership variable, weakening the power of the test because
identification comes from the within-firm variation. We randomly select a few firms from Compact
Disclosure and find they all show substantial variation over time in the number of insiders.12 Changes in
composition may also reduce the power of the test. If share ownership affects Q, ownership by insiders
with less influence should have smaller effects. Inclusion of many insiders with little influence, together
with changes in composition over time, may dilute the identifiable impact.
To avoid these identification problems, the remaining columns of Table III hold the number and
composition of executives constant over time. Column (2) keeps the number of insiders constant at five
by using OWN_Top5, the combined stock ownership of the top five executives including CEO. This
ownership variable also holds constant over time the composition of insiders. The ranking of non-CEO
executives is determined by the sum of salaries and bonuses.
The difference in estimation results is striking. The coefficients of OWN_Top5 and (OWN_Top5)2
are significantly positive and negative, both at the 1% level. The F-statistic also is highly significant. Q is
significantly related to the top executive ownership in a hump shaped fashion. However, OWN_Top5
may introduce a selection bias because it is calculated while restricting the sample to firm-years for
which ExecuComp reports at least top five executives.
Focusing on CEO share ownership avoids the selection problem because it allows inclusion of
firm years with less than five executives. It also hones in on the one executive who is likely to have the
most impact on firm value. Column (3) reports the regression estimates for CEO stock ownership. The
12
For example, the number of insiders at NSTAR, FAIRMOUNT CHEMICAL, and SBE Inc. ranges from 13 to 25, from 2 to 9, and from 4 to 12, respectively, over 1992 to August 2005. Their mean (median) number of insiders is 17.14(14), 4.38(4) and 8.78(9), with a within-firm standard deviation of 10.12, 2.36, and 2.41, respectively.
15
hump shaped relation continues to hold, with the coefficients on both OWN_CEO and (OWN_CEO)2
significant at the 1% level. The F-statistic also is highly significant.
Column (4) estimates the relation only for non-CEO executives by relating Q to OWN_Top4, top
four non-CEO executives’ combined stock ownership. The result is suggestive of a hump shaped relation,
but the statistical significance is weaker than for OWN_CEO. The hump shaped relation for OWN_Top5
seems mostly driven by CEO ownership. This makes sense because in most corporate organizations,
power is concentrated in CEOs, giving them the most influence on firm performance.
These estimates are based on ownership measures excluding stock options because the purpose
is to replicate Himmelberg et al.’s study. Options are relatively unimportant during their sample period;
however, during our sample period options are an important part of CEO incentives. Column (5) re-
estimates the regression with OWN_CEO_SO. The result shows a highly significant hump shaped relation.
3.2. Re-estimation
These results call for a closer examination of the relation between Q and CEO ownership. We
add the six control variables mentioned earlier: Firm age, ROA, CEO age, an indicator for CEOs who chair
the board, Cash/TA, and (Cash/TA)2. We also cluster standard errors at the firm-CEO level for all
regressions. The estimation result with OWN_CEO_SO is reported in Table IV, Panel A, Column (1). The
result continues to show a significant hump shaped relation, albeit with OWN2 of marginal significance.
The estimated coefficients indicate an inflection point at 26%, with a marginal effect of CEO ownership
on Q of 1.56 at 1% ownership, 0.395 at 20%, and -0.83 at 40%. Coefficients on the control variables are
mostly unaffected. The new control variables indicate that younger CEOs, CEOs chairing the board,
newer firms, and more profitable firms are associated with higher Q.
Our sample shows 463 firm-year observations with CEO ownership (OWN_CEO_SO) greater than
the inflection point, representing about 2.1% of the sample. Very large CEO ownership is not rare. There
are 202 unique firms showing CEO share ownership greater than 20%. These firms provide 1,752 firm-
16
year observations, with more than half (961) showing ownership less than 20%. About two-thirds of
observations exceeding 20% occur during the early parts of their firm sample periods, declining below
20% toward the end. It appears that very large CEO ownerships arise for exogenous reasons (e.g., young
firms with limited access to external equity) and over time the CEOs reduce their stakes for better
diversification (Fahlenbrach and Stulz, 2009).
Column (2) reports the estimation result based on OWN_CEO. Without stock options in the
ownership calculation, the estimation shows a much more significant negative effect of large ownership
than that based on OWN_CEO_SO: The coefficient on OWN2 is significant at 1% in the OWN_CEO
regression, whereas the significance level is only marginal in the OWN_CEO_SO regression.
Furthermore, the marginal effects with OWN_CEO beyond the inflection point (also 26% with
OWN_CEO) are also more negative; at 40% ownership, the slope is -1.68 (vs. -0.83 for OWN_CEO_SO.)
These differences support our hypothesis that the combination of large voting rights and high wealth
sensitivity, not high wealth sensitivity alone, leads to insufficient risk-taking and lower Q. As mentioned
before, options do not accord voting rights that entrench a CEO; hence, our hypothesis predicts weaker
negative effects of large ownership when the ownership includes stock options.
Moreover, theories on incentivizing risk-averse CEOs predict convex instruments such as stock
options increase risk-taking (e.g., Dittmann and Yu, 2010; Edmans and Gabaix, 2010), and evidence
supports the prediction (e.g., Guay, 1999; Coles et al., 2006; Low, 2009; and Gormley et al., 2010).
These theories and evidence suggest that if an important portion of ownership comes from options, the
risk-enticing effect of options lessens the risk-reducing effect of high wealth sensitivity, making the Q
and ownership relation more monotonic.
3.3. R&D investments and CEO ownership
Our attempt to identify channels through which CEO ownership affects Q relies on R&D.
Investment in R&D tends to be more discretionary with greater uncertain outcome than regular capital
17
investments. Value-creating R&D investments require CEOs’ efforts, which should increase with
ownership through the incentive effect. Thus, at low levels of ownership, we expect a positive relation
between ownership and R&D investments. However, when ownership increases so much that the risk-
reducing effect starts to dominate the incentive effect, a further increase in ownership may induce CEOs
to devote fewer resources to risky R&D activities.
Successful R&D activities generate growth opportunities, which should be reflected in Q. Thus,
we expect value-creating R&D to exhibit a relation with CEO ownership similar to Q. We test this
conjecture by relating R&D/K_Obs, R&D expenditures over PPE, to CEO ownership. We include all R&D
expenditures because we cannot tell which R&D project is value-creating and which is wasteful. Thus,
this test requires that, on average, R&D activities are positive NPV projects generating valuable growth
opportunities. Moreover, to the extent some R&Ds are wasteful (negative NPV projects) using all R&D
expenditures as the dependent variable weakens the power of the test at low levels of ownership.
Power is weakened because stronger incentives through ownership reduce wasteful R&D, decreasing
the dependent variable, which works against the predicted positive relation. That is, we measure the net
effect, the positive effect on value creating R&D and the negative effect on wasteful R&D.
Estimation results are reported in Table IV, Panel B. The relation between R&D expenditure and
CEO ownership is significant and hump shaped. As in Q regressions, the significance level for OWN2 is
again much weaker for the OWN_CEO_SO regression than for the OWN_CEO regression, consistent with
our prediction that the risk-reducing effect of large ownership is confined to stock ownership.
Interestingly, ownership coefficients in Panels A and B reveal remarkably similar inflection
points. With OWN_CEO_SO, the inflection points for Q and R&D are virtually the same at 26.4% and
24.9%; with OWN_CEO, they are 25.8% and 25.1%. These results suggest that R&D captures the
channels through which CEO ownership affects firm value: the incentive and risk-reducing effects.
18
Estimated coefficients on control variables suggest that firms that invest more in R&D have fewer
tangible assets, less operating profits, and younger CEOs.
4. Interactive effects of external governance and CEO ownership
The results based on the full sample may mask important heterogeneity. The relation between
CEO ownership and valuation should be stronger for firms under weaker EG, which allows more room
for agency problems. With more agency problems to mitigate, the incentive effect of ownership will be
greater, leading to a sharper positive relation. When ownership reaches a certain threshold, the risk-
reducing effect of large share ownership may start to dominate the incentive effect. The negative effect
will be stronger when EG is too weak to prevent CEOs from value-reducing project risk choices. By
contrast, strong EG allows less slack for agency problems that can be either mitigated or exacerbated by
CEO ownership, making the effects weaker and the relation less visible.
4.1. Tobin’s Q
To examine the interactive effects of EG and CEO ownership, we separate firm-year
observations into strong and weak EG subsamples. An observation is considered to be under strong
(weak) EG if it belongs to an industry with below (above) the sample median industry concentration
ratio (ICR) or if its institutional ownership concentration (IOC) is above (below) the sample median.13
Separate estimation for each subsample allows for coefficients of the control variables and fixed effects
to vary across strong and weak EG regimes.
Table V reports the subsample results. They reveal no relation when EG is strong (odd numbered
columns), but a significant hump shaped relation when EG is weak (even numbered columns). This is
13
We use a pooled sample median as the demarcation point rather than the yearly median, because time trends may bias the classification of strong and weak EG. For example, IOC has been increasing steadily over time: the mean IOC is 18% in 1992, 24% in 1999, and 30% in 2006. Thus, classifying 2006 firm observations into high and low IOC by the 2006 median may wrongly classify a firm-year into low IOC when it has a high IOC relative to the entire sample. For ICR, we use the median of all firm-year observations rather than the median industry to obtain more balanced subsamples between high and low ICR. Because there are more firms in low concentration industries, using the median industry would yield very unbalanced subsamples.
19
true regardless of whether EG is proxied by ICR or IOC and whether CEO ownership calculation includes
stock options.14 The estimates in Column (2), which includes options in the ownership variable and uses
ICR as the EG measure, show a marginal effect of CEO ownership on Tobin’s Q of 3.359 at 1% CEO share
ownership, 0.931 at 20% ownership, and -1.626 at 40% ownership. These positive and negative slopes
are sharper than those for the full sample. Control variables show coefficients generally consistent with
those in Table III and Panel A of Table IV.
The hump shaped relations in Columns (2) and (4) have inflection points at 27% and 22%,
respectively. There are 413 firm-year observations for which ICR data is available and CEO ownership is
greater than 27%. These observations are distributed evenly between high and low ICR subsamples, with
206 and 207 firm-year observations, respectively. Clearly, the hump shaped relation is not driven by
over-representation of large CEO ownership in the weak EG subsample (the high ICR group).
The subsample analysis stratifies at the median EG and ignores differences in the strength of EG
within subsamples. To check the sensitivity of our results to this issue, we relate Q to interaction terms
of an EG score with ownership variables using the full sample. We rank observations into quartiles by
their ICRs, assigning a score of 1 if observations belong to the bottom quartile in the strength of EG (the
top quartile ICR group), 2 to the second quartile (the second quartile ICR group), and so on. These scores
are interacted with OWN_CEO_SO or OWN_CEO. The coefficients on OWN and (OWN)2 show significant
positive and negative signs, indicating a hump shaped relation when EG is weakest. But the interaction
terms of the EG score with OWN and (OWN)2 show opposite signs on OWN (negative) and OWN2
(positive). These opposite signs mean that as EG becomes stronger, the hump shaped relation becomes
flatter, implying weaker relation for stronger EG. We obtain similar results using IOC. We do not report
14
The results are also robust to using market cap as the control variable for firm size. When we repeat the subsample analysis using the total insider share ownership of all directors and officers, we continue to find insignificant relation regardless of EG strength.
20
these results to save space. However, the same approach is used later in the robustness section for
instrumental variables regressions, which are reported in Table VII.
4.2. R&D investments
If R&D indeed captures the channels through which CEO ownership affects Q, EG and CEO
ownership should have similar interactive effects on R&D. We test this prediction by relating
R&D/K_Obs to CEO ownership separately for weak and strong EG subsamples. The results are reported
in Table VI. The relation between R&D investment and CEO ownership is significant and hump shaped
when EG is weak, but is insignificant when EG is strong. 15 This is true regardless of whether EG is
measured by ICR or IOC and whether CEO ownership includes stock options, although, as before, the
results are weaker with the OWN_CEO_SO regression. Column (2) shows an inflection point at 20%, not
far from the corresponding inflection point of 27% for Q in Table V. These results further buttress our
assertion that R&D captures the main channels through which CEO ownership affects firm value.16
5. Robustness Tests
Our initial tests treat CEO ownership and IOC as endogenous variables. We also address
potential endogeneity issues related to ICR. Our final tests involve re-estimation of regressions with
alternative model specification, sample constructions, and measures of EG.
5.1. CEO ownership and Institutional Ownership Concentration
Because firm fixed effects control only for time invariant characteristics, we are concerned with
endogeneity issues due to time variant omitted variables and reverse causality from firm value to CEO
ownership (Kole, 1996; Cho, 1998). We address these issues with an instrumental variable (IV) approach.
15
An alternative explanation for the lack of relation under strong EG is that when the product market is highly competitive, firms are unable to invest in R&D because they do not have sufficient free cash flow and must engage in short term “fire-fighting” rather than pursuing long-term growth. However, the mean R&D/K_Obs is 0.28 and 0.22 for the strong and weak competition subsample, respectively, implying firms under strong product market competition invest more in R&D. In addition, our R&D regressions include Cash/TA, ROA, and Y/S (EBITDA/Sales) to control for differences in financial slack. 16
The negative slope in R&D under weak EG is consistent with Atanassov (2010) who documents significant reductions in patents when firms are hit with external shocks allowing managerial entrenchment.
21
Finding good IVs for CEO ownership is difficult because firm variables related to the level of CEO
ownership may also affect firm value.17 Thus, our initial search is for an IV not subject to firm choice.
State and federal marginal personal income tax rates may serve the purpose. Personal income
taxes may affect a CEO’s stock and option ownership by impacting the composition of personal
portfolios and the timing of stock transactions and option exercises. CEOs located in a high income tax
state may prefer tax exempt securities to stocks more than CEOs in a low income tax state, leading to
lower share ownership, all else equal.18 Differences in tax brackets across time may also lead to an
inverse relation between tax rates and CEO share ownership.19
Tax timing in anticipation of tax rate changes may also play a role. CEOs are likely to hold on to
their company stocks when they anticipate a decrease in tax rates, but may accelerate tax payments by
selling shares and exercising options when they expect higher tax rates.20 A Wall Street Journal article
reports how investors exercised stock options and sold stocks in 2009 to lock in the current tax rates in
anticipation of higher future tax rates.21 Our tax data indicate that the tax rates are mean-reverting.22
Thus, the tax timing may also lead to a correlation between the tax rates and CEO ownership.
17
For example, Himmelberg et al. (1999) use firm size and stock price volatility as instruments for total insider ownership in two-stage least squares regressions. But numerous studies document that these variables are correlated with firm valuation. 18
See Miller (1977) and Kim (1982) for an illustration of the important role personal taxes play in investors’ choice between tax-exempt and taxable securities. 19
Many private benefits, such as shirking and excessive perks are non-taxable, whereas stock grants and non-qualified stock options are subject to personal income taxes. Hence, as a form of compensation, private benefits and perks may be more appealing to CEOs in high tax brackets than those in low tax brackets, also causing an inverse relation between tax rates and CEO ownership of stocks and options. 20
Tax timing applies only to vested stocks and options. Our estimation based on ExecuComp database over our sample period shows that, on average, 65.8% of all stocks held by CEOs are vested ((shrown_excl_opts - stock_unvest_num)/shrown_excl_opts). As for stock options, we calculate for each CEO the ratio of the vested stock options to the sum of unvested and vested stock options previously granted and the new stock options granted during the year. For this calculation, we follow the procedure outlined in Appendix B of Edmans et al. and compute max(0, (opt_unex_exer_num -max(0, numnewop - opt_unex_unexer_num)))/(numnewop + max (0, opt_unex_unexer_num - numewop) + max(0, (opt_unex_exer_num - max(0, numnewop - opt_unex_unexer_num))). We find, on average, 55.82% of stock options held by CEOs at fiscal yearend
are vested.
Although some of these vested options may be underwater, an important portion of stock options seem subject to discretionary exercise. 21
Laura Saunders reports, “Worries about rising tax rates are propelling investors to… pay taxes early to lock in current rates. …For many, the equivalent move is to exercise or sell stock options and restricted stocks awarded by
22
Personal income tax rates could be related to Q if changes in personal tax rates are
accompanied by concurrent changes in corporate tax rates. However, there are few, if any,
contemporaneous changes in both personal and corporate tax rates at either the federal or state levels
during our sample period 1992 through 2006.23 Yet another possibility is that personal income taxes may
impact firm valuation through corporate financial leverage. However, in a survey of 392 CFOs Graham
and Harvey (2001) “… find very little evidence that firms directly consider personal taxes when deciding
on debt policy… or equity policy...” (p. 211) Does this statement apply to our sample firms? We estimate
the relation between corporate leverage and personal income taxes, with the ratio of long term debt
over the book value of total assets as the dependent variable. Independent variables include the sum of
maximum marginal federal and state personal income tax rates and the same set of control variables
used in the baseline regression. The regression estimates (unreported) show that leverage is
significantly related to a number of control variables (LNS, (LNS)2, SIGMA, R&D/K, and I/K) but is
unrelated to personal income tax rates.
We use the sum of maximum marginal state and federal personal income tax rates as an IV.
Maximum rates are used because most firms covered by ExecuComp are relatively large and their CEOs’
their employers. The effect is to accelerate taxes to avoid higher future rates.” “4 Tax-Savvy Stock Moves for 2009,” Wall Street Journal, December 23, 2009, C3. 22
The maximum federal income tax rate for married couples filing joint returns was 31% at the start of our sample period (1992), increasing to 39.5% in 1993, and then decreasing over time, to 35% by the end of our sample period (2006). To test whether the tax rates are mean-reverting, we estimate the autocorrelation of the sum of maximum state and federal marginal personal tax rates within a firm by regressing the tax rates at time t on the tax rates at time t-1 with firm fixed effects. The coefficient is 0.632, significant at 1%. A unit root test rejects the null hypothesis of |β|=1 at the 1% significance level. 23
Federal corporate income tax rates changed only once in 1994, with no concurrent changes in federal individual income tax rates, which had four major changes in 1993, 2001, 2002, and 2003. As for state taxes, while individual income taxes are paid to the state of residence, corporate income taxes are paid to states of operation according to the apportionment formula based on sales, assets, and the number of employees. Because our sample firms are drawn from ExecuComp, they tend to operate in several different states, making the majority multi-state firms as far as state corporate income taxes are concerned. Furthermore, we find little evidence of concurrent changes in state corporate and personal income tax rates. For example, from 2000 to 2001, the highest marginal personal income tax rate changed from 6.4% to 5.95% in Delaware, but there was no change in the state corporate income tax rate. Over the same period, the Arizona state corporate income tax rate changed from 7.968% to 6.968%, but there were no changes in personal income tax rates.
See http://www.taxfoundation.org/taxdata/show/230.html
for state corporate income tax rates, 2000-2009.
23
marginal income tax rates are likely to be subject to the maximum rate most of the time.24 For state
personal income tax rates, we assume a CEO is taxed by the state of her company’s headquarters
location.25 Inclusion of state personal income tax rates makes the IV especially useful, because state tax
rates vary across states with changes occurring at different points in time. Our estimates of the sum of
maximum marginal state and federal personal income tax rates with firm ID and by year are available
from Journal of Financial Economics web page.
We use another instrumental variable for CEO ownership previously used by Palia (2001)—CEO
tenure. Gibbons and Murphy (1992) and Edmans, Gabaix, Sadzik and Sannikov (2010) show theoretically
that equity ownership should rise with tenure, and Gibbons and Murphy (1992) and Cremers and Palia
(2010) provide supporting evidence. However, it is not clear CEO tenure will be directly related to Q.
In estimating IV regressions we employ the full sample with interaction terms of ownership
variables and a score indicating the strength of EG, SEG. For ICR, SEG_ICR is given a score of 1 for
observations in the bottom quartile in the strength of EG (the highest ICR group), 2 to the second
quartile (the second highest ICR group), and so on. Similarly, SEG_IOC is 1 for the lowest quartile in IOC,
2 for the second lowest quartile, and so on. These scores are interacted with OWN_CEO_SO. We model
OWN_CEO_SO, OWN_CEO_SO2, OWN_CEO_SO*SEG_ICR, and OWN_CEO_SO2*SEG_ICR as endogenous
variables and estimate a two-stage least squares regression model. The IVs are Tax, CEO_Tenure,
Tax*SEG_ICR, and CEO_Tenure*SEG_ICR, where Tax is the sum of the maximum marginal federal and
state personal income tax rates.
24
We use the rates applicable to married couples filing joint returns. The Tax Foundation’s website (http://www.taxfoundation.org/publications/show/151.html) provides federal marginal individual income tax rates. For state taxes, website http://www.taxfoundation.org/taxdata/show/228.html provides maximum marginal state income tax rates for 2000-2006; for 1992-1999, we rely on the Book of the States. The state tax rates are not available for 1993, 1995, 1997, and 1999. For the missing years we use the nearest next available year (e.g., 1994 tax rates are used for 1993). We choose this method because if there is a change in tax rates, the next year’s tax rate has a greater impact on tax planning than the previous year’s tax rate 25
Some CEOs working for New York or Washington D.C. firms reside in New Jersey or Virginia, making their tax jurisdictions ambiguous. Our sample contains 222 firms with headquarters in New York and 9 firms in D.C. We repeat all regressions excluding these firms. The results (unreported) are robust.
24
While ICR is an industry measure, IOC is a firm-level variable, more susceptible to endogeneity.
We treat IOC as an endogenous variable. The IV for IOC is IOC_SIY(-i), the mean IOC of all firms in the
same state, same industry, and same year, excluding firm i’s own IOC. To the extent that some
institutional investors target specific locations and industries, IOC_SIY(-i) may be related to firm i’s IOC,
but peer firms’ IOC may have no direct impact on firm i’s valuation. This IV is used only for Q regressions.
When the dependent variable is R&D, the IV for IOC is IOC_SY(-i), constructed in the same way using
only state and year. Industry is excluded because the intensity of R&D is highly correlated with industry
classification--e.g., pharmaceutical industry vs. transportation industry. To reduce noise, IV regressions
involving IOC exclude observations with fewer than three peer firms. Endogenous variables are
OWN_CEO_SO, OWN_CEO_SO2, OWN_CEO_SO*SEG_IOC, OWN_CEO_SO2*SEG_IOC, and SEG_IOC. IVs
are Tax, CEO_Tenure, Tax*IOC_SIY(-i), CEO_Tenure*IOC_SIY(-i) and IOC_SIY(-i) for Q; for R&D, they are
the same, except that IOC_SIY(-i) is replaced by IOC_SY(-i).
In the first stage, each endogenous variable is regressed on IV and control variables. Tables A1
through A4 in the Appendix provide the results without reporting control variables. In the second stage,
the predicted values are used as key explanatory variables. Table VII, Panel A reports the second stage
regression results for Q. The results are robust regardless of whether the strength of EG (SEG) is
measured by ICR or IOC. The coefficients on OWN_CEO_SO and (OWN_CEO_SO)2 indicate a hump
shaped relation when external governance is very weak. However, their interaction terms with SEG
show negative and positive signs, opposite the signs on OWN_CEO_SO and (OWN_CEO_SO)2. These
opposite signs mean that as EG becomes stronger, the hump shaped relation becomes flatter, implying a
weaker relation for stronger EG. Panel B reports the second stage regression results for R&D. The
ownership variables and the interaction terms indicate hump shaped relations under weak EG that
flatten as EG gets stronger.
5.2. Industry Concentration Ratio
25
The competitiveness in product markets changes over time. Endogeneity is of concern if an
individual firm performance affects the industry competition so much that the industry as a whole
changes its status from being a concentrated industry to a competitive one or vice versa. Such events
would require a dramatic change in the firm’s performance and a systematic pattern in which the
affected market share is distributed between dominant and fringe firms. To illustrate, consider a firm
losing its market share and suffering a decline in valuation. How the loss of market share will affect ICR
depends on whether the lost market share accrues to dominant or fringe firms. If it accrues to dominant
firms, ICR will increase; if fringe firms benefit, ICR will decrease. As long as there is no systematic pattern
in which the lost market share is distributed between dominant and fringe firms, the firm’s performance
is not likely to cause the industry to switch between high and low concentration status. The same can be
said for a firm gaining market share.
Nevertheless, we check the robustness by restricting the sample to industries that do not switch
between high or low ICR status throughout the entire sample period. The idea is to repeat the test on
data least likely to be contaminated by endogenous factors. The estimation results for the restricted
samples (not reported) show significant hump shaped relations for firms under weak EG and no relation
under strong EG, for both Q and R&D. This is true whether or not CEO ownership includes stock options.
As yet another check, we re-estimate the baseline model using one-year lagged values of ICR and IOC to
separate firm years into strong and weak EG subsamples. The results (unreported) are again robust.
5.3. Alternative model specification and sample constructions
We also re-estimate regressions in Tables V and VI to check the robustness to alternative
specifications and definitions. The results for Q with alternative model specification and sample
constructions are reported in Table VIII without control variables. The first four columns are estimates
with OWN_CEO_SO; the last four, with OWN_CEO. The tables contain the following panels:
26
Panel A: As an alternative to the quadratic form of ownership variables, we estimate the piecewise
linear specification in Morck et al. (1988). Unlike the quadratic specification, this specification requires
arbitrary cutoff points at 5% and 25% ownership as follows: OWN_05 = OWN if OWN < 5%, and 5%
otherwise. OWN_0525 = 0 if OWN ≤ 5%, OWN – 5% if 5% < OWN < 25%, and 20% if OWN ≥ 25%.
OWN_25 = OWN – 25% if OWN > 25%, and zero otherwise. These piecewise-linear terms allow for
changes in the slope coefficient at 5% and 25% share ownership. The estimated coefficients are
suggestive of a hump shaped relation for observations under weak EG and show no relation under
strong EG. F-statistics are significant only for observations under weak EG proxied by ICR. The overall
weak statistical significance for the hump shaped relation is due to the fact that unlike the quadratic
specification, this specification forces the relation to be linear between arbitrary cutoff points. As in
Table V, the relations are weaker with OWN_CEO_SO than with OWN_CEO.
Panel B: Our sample includes founder-CEO firm-year observations. Several studies identify distinct
founder effects on firm valuation (Morck et al., 1988; Villalonga and Amit, 2006; Adams, Almeida, and
Ferreira, 2009; and Fahlenbrach, 2009). This founder effect is of concern because founder-CEOs are
over-represented in large ownership observations.26 Their average ownership (9.66%) is much greater
than that of non-founders (2.27%). About half (47.24%) of firm-year observations with CEO ownership
greater than 20% belongs to founder-CEOs. We exclude founder-CEO firm-year observations and re-
estimate the regressions. The results are robust when EG is measured by ICR. When IOC is used to proxy
EG, the relation under weak EG is only suggestive of hump shaped relation while lacking statistical
significance.
Panel C: Demsetz and Lehn (1985) argue that regulated utilities and financial institutions are subject to
different monitoring and incentives and, hence, have different ownership structures from those of other
26
To identify founder-CEOs, we follow Bebchuk, et al. (2011) and define a CEO as a founder if he was the CEO of the firm five years prior to going public, where the date of going public is assumed to be the first date the firm appears in the CRSP database.
27
industries. We re-estimate regressions while excluding utility and financial firms. Again, this alternative
sample construction does not change our conclusions.
We repeat the same set of regressions for R&D. The results (unreported) are robust. In sum,
none of the re-estimation results alters our conclusion that Q and R&D are unrelated to CEO ownership
when EG is strong and are significantly related in a hump shaped fashion when EG is weak. Underlying
this conclusion is the assumption that our proxies for the strength of EG are valid.
5.4. Alternative measures of external governance
To check the sensitivity of our results to alternative definitions of EG measures, we re-estimate
regressions in Tables V and VI with the following modifications.
Panel A: ICR is the sum of the market share of the four biggest firms in each industry for each year. We
rely on the four biggest firms to minimize the risk of excluding private firms. This panel re-estimates
regressions using HHI based on all firms in Compustat, which is the sum of squares of market share of all
firms in Compustat belonging to the same industry.
Panel B: We also use the Economic Census HHI, the sum of the squares of percentage market share of
the 50 largest firms in each industry, where industry is defined by the first four-digit NAICS code. The
Census HHI includes private firms, but is available only for manufacturing industries, reducing the
sample size by more than half. It is available only for 1997 and 2002.27 We use the 1997 Census HHI for
observations in the 1990s, and the 2002 Census HHI for observations in the 2000s.
Panel C: We sharpen the distinction between strong and weak EG subsamples by using observations
belonging to the top and bottom third in the strength of EG. This reduces the sample size by one-third.
Tables IX provides re-estimation results for Q without reporting control variables. The overall
results are robust. The results for R&D (not reported) also are robust.
5.5. Difference in statistical properties between firms under strong and weak EG
27
The Census HHI is available for 1992, but it is based on the Standard Industry Classification (SIC) code, not NAICS code, making the 1992 index not directly comparable with the indices in 1997 and 2002.
28
Finally, Zhou (2001) argues that the fixed effects methodology is biased toward finding no effect
because of low within-firm variation in share ownership, raising the possibility that the insignificant
relation for observations under strong EG is due to smaller within-firm variation in CEO ownership than
that under weak EG. However, the difference in the within-firm variation between the low and high ICR
group is trivial; the mean within-firm standard deviation (WFSD) is 0.0167 and 0.0173, respectively. The
difference between the high and low IOC sample is a bit more noticeable (WFSD of 0.0163 and 0.0182.)
We check whether the smaller variations hide effects of ownership for observations subject to
strong EG by re-estimating the regressions in Tables V and VI for strong EG subsamples that have WFSD
of CEO ownership comparable to those of the weak EG sample. Specifically, we include only low ICR
observations with a WFSD greater than 0.0173 and high IOC observations only with a WFSD greater than
0.0182. The estimation results (not reported) show neither Q nor R&D is significantly related to CEO
ownership for any of the reconstructed subsamples subject to strong EG.
6. Conclusion
This paper focuses on a specific internal governance mechanism: CEO ownership. We examine
how it interacts with external governance (EG) in affecting firm valuation and risk-taking. We also study
R&D to identify the channels through which CEO ownership and EG jointly affect firm valuation; the
incentive and risk-reducing effects.
Our results demonstrate how the relation between Tobin’s Q and managerial ownership, a long-
running controversy in the literature, depends on the strength of external pressure for good governance.
When EG is weak, the relation between Q and CEO ownership is hump shaped. Weak EG allows for
greater managerial slack, providing more room for CEO ownership to either mitigate agency problems
through the incentive effect or exacerbate the risk-reducing effect of large stock ownership. When EG is
strong, the relation is insignificant. Strong EG holds CEOs accountable for their performance, leaving less
slack for agency problems that can be mitigated or exacerbated by CEO ownership.
29
This study also helps identify channels through which EG and CEO ownership interactively affect
Tobin’s Q. We find a significant hump shaped relation between R&D investments and CEO ownership
when EG is weak, but find no relation when EG is strong. Because R&D investments tend to be
discretionary and risky, these results support the hypothesis that CEO ownership has identifiable effects
on CEO effort and risk-taking when EG is weak. The results also help articulate the nature of
entrenchment effects causing the negative slope in the Q relation.
30
References:
Adams, R. B., Almeida, H., Ferreira, D., 2009. Understanding the relationship between founder-CEOs and firm performance. Journal of Empirical Finance 16, 136-150.
Adams, R. B., Santos, J., 2006. Identifying the effect of managerial control on firm performance. Journal
of Accounting and Economics 41, 55-85. Agrawal, A., Knoeber, C. R., 1996. Firm performance and mechanisms to control agency problems
between managers and shareholders. Journal of Financial and Quantitative Analysis 31, 377-397. Amihud, Y., Lev, B., 1981. Risk reduction as a managerial motive for conglomerate mergers. Bell Journal
of Economics 12, 605-617 Anderson, R. C., Reeb, D. M., 2003. Founding-family ownership and firm performance: Evidence from
the S&P 500. Journal of Finance 58, 1301-1328. Atanassov, J., 2010. Do hostile takeovers stifle innovation? Evidence from antitakeover legislation and
corporate patenting. Working paper. University of Oregon. Atanassov, J., Kim, E. H., 2009. Labor and corporate governance: International evidence from restructuring
decisions. Journal of Finance 64, 341-374.
Bebchuk, L., Cohen A., Ferrell, A., 2009. What matters in corporate governance? Review of Financial Studies 22, 783-827.
Bebchuk, L., Cremers, M., Peyer U., 2011. CEO pay slice and firm performance. Journal of Financial
Economics, forthcoming.
Bebchuk, L., Fried, J., 2004. Pay without performance: The unfulfilled promise of executive
compensation. Harvard University Press.
Bertrand, M., Mullainathan, S., 2000. Agents with and without principals. American Economic Review 90, 203-208.
Bhattacharyya, S., Cohn, J., 2010. The temporal structure of equity compensation. Working paper.
University of Michigan.
Brisley, N., 2006. Executive stock options: Early exercise provisions and risk-taking incentives. Journal of Finance 61, 2487-2509.
Carpenter, J., 2000. Does option compensation increase managerial risk appetite? Journal of Finance 55, 2311-2331.
Cho, M., 1998. Ownership structure, investment, and the corporate value: An empirical analysis. Journal of Financial Economics 47, 103-121.
31
Coles, J. L., Daniel, N. D., Naveen, L., 2006. Managerial incentives and risk-taking. Journal of Financial Economics 79, 431-468.
Coles, J. L., Lemmon, M. L., Meschke, J. F., 2007. Structural models and endogeneity in corporate finance: The link between managerial ownership and corporate performance. Working paper. Arizona State University.
Core, J. E., Guay, W. R., 2002. Estimating the value of employee stock option portfolios and their sensitivities to price and volatility. Journal of Accounting Research 40, 613-630.
Core, J. E., Guay, W. R., Larcker, D. F., 2003. Executive equity compensation and incentives: A survey. FRBNY Policy Review April, 27-50.
Cremers, M., Palia, D., 2010. Tenure and CEO pay. Working paper. Yale.
Cremers, M., Nair, V. B., 2005. Governance mechanisms and equity prices. Journal of Finance 60, 2859-2894.
Demsetz, H., Lehn, K. 1985. The structure of corporate ownership: Causes and consequences. Journal of Political Economy 93, 1155-1177.
Demsetz, H., Villalonga, B., 2001. Ownership structure and corporate performance. Journal of Corporate Finance 7, 209-233.
Dittman, I., Yu, K., 2009. How important are risk-taking incentives in executive compensation? Working paper, Erasmus University, Rotterdam.
Dittmar, A., Mahrt-Smith, J., 2007, Corporate governance and the value of cash holdings. Journal of Financial Economics 83, 599-634.
Durnev, A., Kim, E. H., 2005. To steal or not to steal: Firm attributes, legal environment, and valuation.
Journal of Finance 60, 1461-1495. Durnev, A., Mangen C., 2009. Corporate investments: Learning from restatements. Journal of
Accounting Research 47, 679-720. Edmans, A., 2009. Blockholder trading, market efficiency, and managerial myopia. Journal of Finance 64,
2481-2514. Edmans, A., Gabaix, X., 2010. The effect of risk on the CEO market. Review of Financial Studies,
forthcoming.
Edmans, A., Gabaix, X., Landier, A. 2009. A multiplicative model of optimal CEO incentives in market
equilibrium. Review of Financial Studies 22, 4881-4917.
Edmans, A., Gabaix, X., Sadzik, T., Sannikov, Y., 2001. Dynamic incentive accounts. Working paper,
Wharton.
Edmans, A., Manso, G., 2011. Governance through trading and intervention: A theory of multiple
blockholders. Review of Financial Studies, forthcoming.
32
Faccio, M., Marchica, M., Mura, R., 2010. Large shareholder diversification and corporate risk-taking.
Working paper. Purdue University.
Fahlenbrach, R., 2009. Founder-CEOs, investment decisions, and stock market performance. Journal of
Financial and Quantitative Analysis 44, 439-466.
Fahlenbrach, R., Stulz, R., 2009. Managerial ownership dynamics and firm value. Journal of Financial
Economics 92, 342-361.
Fama, E., French, K., 1997. Industry costs of equity. Journal of Financial Economics 43, 153-193.
Gibbons, R., Murphy, K. J., 1992. Optimal incentive contracts in the presence of career concerns: Theory and evidence. Journal of Political Economy 100, 468-505.
Giroud, X., Mueller, H., 2010. Does corporate governance matter in competitive industries? Journal of Financial Economics 95, 312-331.
Gompers, P., Ishii, J., Metrick, A., 2003. Corporate governance and equity prices. Quarterly Journal of Economics 118, 107-155.
Gormley, T. A., Matsa, D. A., Milbourn, T., 2010. CEO compensation and corporate risk-taking: Evidence from a natural experiment. Working paper. Wharton.
Graham, J. and Harvey, C., 2001. The theory and practice of corporate finance: Evidence from the field. Journal of Financial Economics 60, 187-243.
Guadalupe, M., Wulf, J., 2007. The flattening firm and product market competition: The effect of trade liberalization. Unpublished working paper. Columbia University.
Guay, W. R., 1999. The sensitivity of wealth equity risk: An analysis of the magnitude and determinants. Journal of Financial Economics 53, 43-71.
Hall, B., Liebman, J., 1998. Are CEOs really paid like bureaucrats? Quarterly Journal of Economics 113, 653-691.
Hartzell, J., Starks, L., 2003. Institutional investors and executive compensation. Journal of Finance 58, 2351-2374.
Himmelberg, C., Hubbard, G., Palia, D., 1999. Understanding the determinants of managerial ownership and the link between ownership and performance. Journal of Financial Economics 53, 353-384.
Hirshleifer, D., Suh, Y., 1992. Risk, managerial effort, and project choice. Journal of Financial Intermediation 2, 308-345.
Holderness, C., Kroszner, R., Sheehan, D., 1999. Were the good old days that good? Changes in
managerial stock ownership since the Great Depression. Journal of Finance 54, 435-470.
Holmstrom, B., 1979. Moral hazard and observability. Bell Journal of Economics 10, 74-91.
33
Jensen, M., Murphy, K., 1990, Performance pay and top management incentives. Journal of Political
Economy 98, 225-264.
Kadyrzhanova, D., Rhodes-Kropf, M., 2007. Concentrating on governance. AFA Meetings Paper. Available
at SSRN: http://ssrn.com/abstract=891418.
Kim, E. H., 1982. Miller’s equilibrium, shareholder leverage clienteles, and optimal capital structure.
Journal of Finance 37, 301-319.
Kole, S. R., 1996. Managerial ownership and firm performance: Incentives or rewards? In: M. Hirschey and M. W. Marr (eds.) Advances in Financial Economics 2, 119-149.
Loderer, C., Martin, K., 1997. Executive stock ownership and performance: Tracking faint traces. Journal of Financial Economics 45, 223-255.
Low, A., 2009. Managerial risk-taking behavior and equity-based compensation. Journal of Financial
Economics 92, 470-490. McConnell, J., Servaes, H., 1990. Additional evidence on equity ownership and corporate value. Journal
of Financial Economics 27, 595-612. McConnell, J., Servaes, H., Lins, K., 2008. Changes in insider ownership and changes in the market value of
the firm. Journal of Corporate Finance 14, 92-106.
Miller, M., 1977. Debt and taxes. Journal of Finance 32, 261-275.
Morck, R., Shleifer, A., Vishny, R., 1988. Management ownership and market valuation: An empirical analysis. Journal of Financial Economics 20, 293-315.
Palia, D., 2001. The endogeneity of managerial compensation in firm valuation: A solution. Review of Financial Studies 14, 735-764.
Ross, S., 2004. Compensation, incentives, and the duality of risk aversion and riskiness. Journal of Finance 59, 207-227.
Shleifer, A., Vishny, R., 1986. Large shareholders and corporate control. Journal of Political Economy 94, 461-488.
Smith, C., Stulz, R., 1985. The determinants of firms’ hedging policies. Journal of Financial and Quantitative Analysis 20, 391-405.
Villalonga, B., Amit, R., 2006. How do family ownership, control and management affect firm value?
Journal of Financial Economics 80, 385-418.
Volpin, P., 2002. Governance with poor investor protection: Evidence from top executive turnover in Italy. Journal of Financial Economics 64, 61–90.
Zhou, X, 2001, Understanding the determinants of managerial ownership and the link between ownership
and performance: Comment, Journal of Financial Economics 62, 559-571.
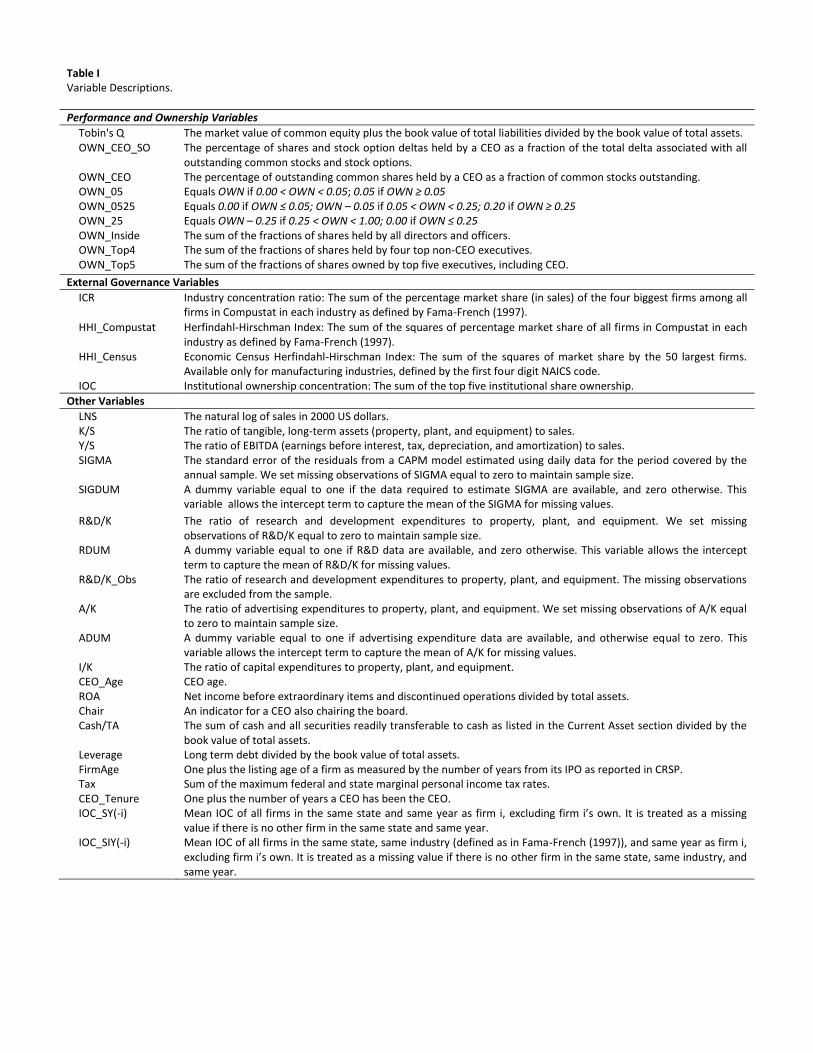
Table I Variable Descriptions.
Performance and Ownership Variables
Tobin's Q The market value of common equity plus the book value of total liabilities divided by the book value of total assets. OWN_CEO_SO The percentage of shares and stock option deltas held by a CEO as a fraction of the total delta associated with all
outstanding common stocks and stock options. OWN_CEO The percentage of outstanding common shares held by a CEO as a fraction of common stocks outstanding. OWN_05 Equals OWN if 0.00 < OWN < 0.05; 0.05 if OWN ≥ 0.05 OWN_0525 Equals 0.00 if OWN ≤ 0.05; OWN – 0.05 if 0.05 < OWN < 0.25; 0.20 if OWN ≥ 0.25 OWN_25 Equals OWN – 0.25 if 0.25 < OWN < 1.00; 0.00 if OWN ≤ 0.25 OWN_Inside The sum of the fractions of shares held by all directors and officers. OWN_Top4 The sum of the fractions of shares held by four top non-CEO executives. OWN_Top5 The sum of the fractions of shares owned by top five executives, including CEO.
External Governance Variables
ICR Industry concentration ratio: The sum of the percentage market share (in sales) of the four biggest firms among all firms in Compustat in each industry as defined by Fama-French (1997).
HHI_Compustat Herfindahl-Hirschman Index: The sum of the squares of percentage market share of all firms in Compustat in each industry as defined by Fama-French (1997).
HHI_Census Economic Census Herfindahl-Hirschman Index: The sum of the squares of market share by the 50 largest firms. Available only for manufacturing industries, defined by the first four digit NAICS code.
IOC Institutional ownership concentration: The sum of the top five institutional share ownership.
Other Variables
LNS The natural log of sales in 2000 US dollars. K/S The ratio of tangible, long-term assets (property, plant, and equipment) to sales. Y/S The ratio of EBITDA (earnings before interest, tax, depreciation, and amortization) to sales. SIGMA The standard error of the residuals from a CAPM model estimated using daily data for the period covered by the
annual sample. We set missing observations of SIGMA equal to zero to maintain sample size. SIGDUM A dummy variable equal to one if the data required to estimate SIGMA are available, and zero otherwise. This
variable allows the intercept term to capture the mean of the SIGMA for missing values.
R&D/K The ratio of research and development expenditures to property, plant, and equipment. We set missing observations of R&D/K equal to zero to maintain sample size.
RDUM A dummy variable equal to one if R&D data are available, and zero otherwise. This variable allows the intercept term to capture the mean of R&D/K for missing values.
R&D/K_Obs The ratio of research and development expenditures to property, plant, and equipment. The missing observations are excluded from the sample.
A/K The ratio of advertising expenditures to property, plant, and equipment. We set missing observations of A/K equal to zero to maintain sample size.
ADUM A dummy variable equal to one if advertising expenditure data are available, and otherwise equal to zero. This variable allows the intercept term to capture the mean of A/K for missing values.
I/K The ratio of capital expenditures to property, plant, and equipment. CEO_Age CEO age. ROA Net income before extraordinary items and discontinued operations divided by total assets. Chair An indicator for a CEO also chairing the board. Cash/TA The sum of cash and all securities readily transferable to cash as listed in the Current Asset section divided by the
book value of total assets. Leverage Long term debt divided by the book value of total assets. FirmAge One plus the listing age of a firm as measured by the number of years from its IPO as reported in CRSP. Tax Sum of the maximum federal and state marginal personal income tax rates. CEO_Tenure One plus the number of years a CEO has been the CEO. IOC_SY(-i) Mean IOC of all firms in the same state and same year as firm i, excluding firm i’s own. It is treated as a missing
value if there is no other firm in the same state and same year. IOC_SIY(-i) Mean IOC of all firms in the same state, same industry (defined as in Fama-French (1997)), and same year as firm i,
excluding firm i’s own. It is treated as a missing value if there is no other firm in the same state, same industry, and same year.
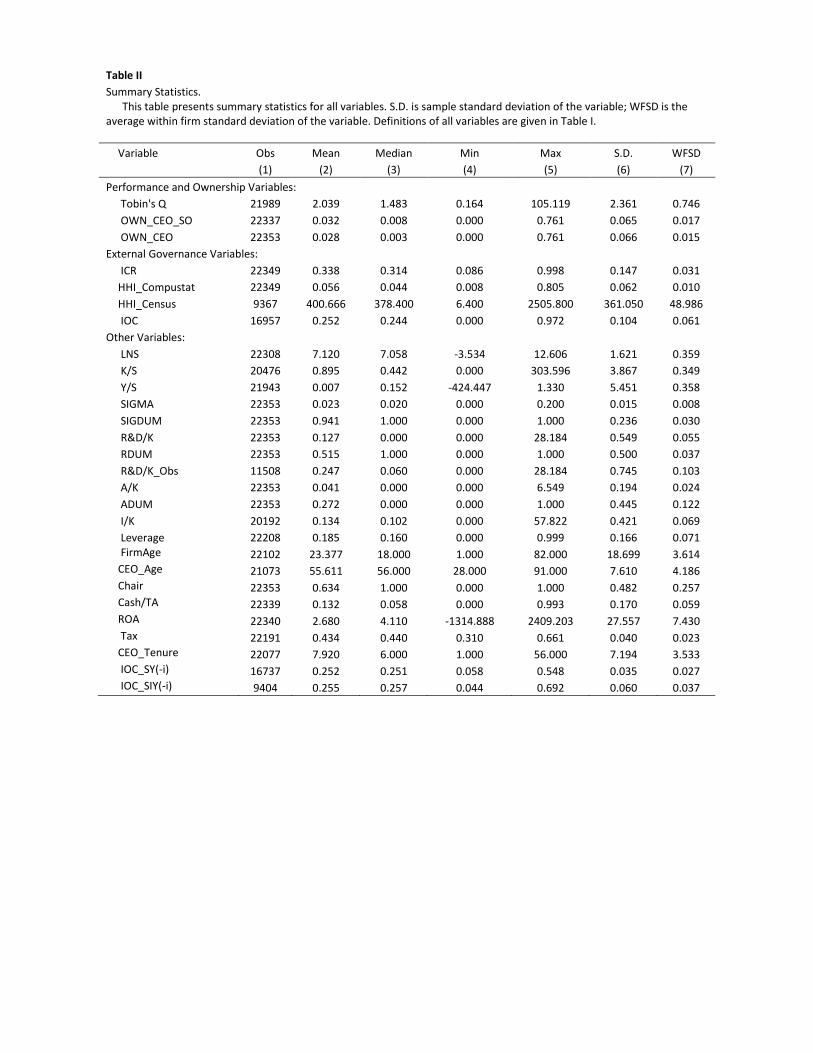
Table II
Summary Statistics. This table presents summary statistics for all variables. S.D. is sample standard deviation of the variable; WFSD is the average within firm standard deviation of the variable. Definitions of all variables are given in Table I.
Variable Obs Mean Median Min Max S.D. WFSD
(1) (2) (3) (4) (5) (6) (7)
Performance and Ownership Variables:
Tobin's Q 21989 2.039 1.483 0.164 105.119 2.361 0.746
OWN_CEO_SO 22337 0.032 0.008 0.000 0.761 0.065 0.017
OWN_CEO 22353 0.028 0.003 0.000 0.761 0.066 0.015
External Governance Variables:
ICR 22349 0.338 0.314 0.086 0.998 0.147 0.031
HHI_Compustat 22349 0.056 0.044 0.008 0.805 0.062 0.010
HHI_Census 9367 400.666 378.400 6.400 2505.800 361.050 48.986
IOC 16957 0.252 0.244 0.000 0.972 0.104 0.061
Other Variables:
LNS 22308 7.120 7.058 -3.534 12.606 1.621 0.359
K/S 20476 0.895 0.442 0.000 303.596 3.867 0.349
Y/S 21943 0.007 0.152 -424.447 1.330 5.451 0.358
SIGMA 22353 0.023 0.020 0.000 0.200 0.015 0.008
SIGDUM 22353 0.941 1.000 0.000 1.000 0.236 0.030
R&D/K 22353 0.127 0.000 0.000 28.184 0.549 0.055
RDUM 22353 0.515 1.000 0.000 1.000 0.500 0.037
R&D/K_Obs 11508 0.247 0.060 0.000 28.184 0.745 0.103
A/K 22353 0.041 0.000 0.000 6.549 0.194 0.024
ADUM 22353 0.272 0.000 0.000 1.000 0.445 0.122
I/K 20192 0.134 0.102 0.000 57.822 0.421 0.069
Leverage 22208 0.185 0.160 0.000 0.999 0.166 0.071 FirmAge 22102 23.377 18.000 1.000 82.000 18.699 3.614 CEO_Age 21073 55.611 56.000 28.000 91.000 7.610 4.186 Chair 22353 0.634 1.000 0.000 1.000 0.482 0.257 Cash/TA 22339 0.132 0.058 0.000 0.993 0.170 0.059 ROA 22340 2.680 4.110 -1314.888 2409.203 27.557 7.430 Tax 22191 0.434 0.440 0.310 0.661 0.040 0.023 CEO_Tenure 22077 7.920 6.000 1.000 56.000 7.194 3.533 IOC_SY(-i) 16737 0.252 0.251 0.058 0.548 0.035 0.027 IOC_SIY(-i) 9404 0.255 0.257 0.044 0.692 0.060 0.037
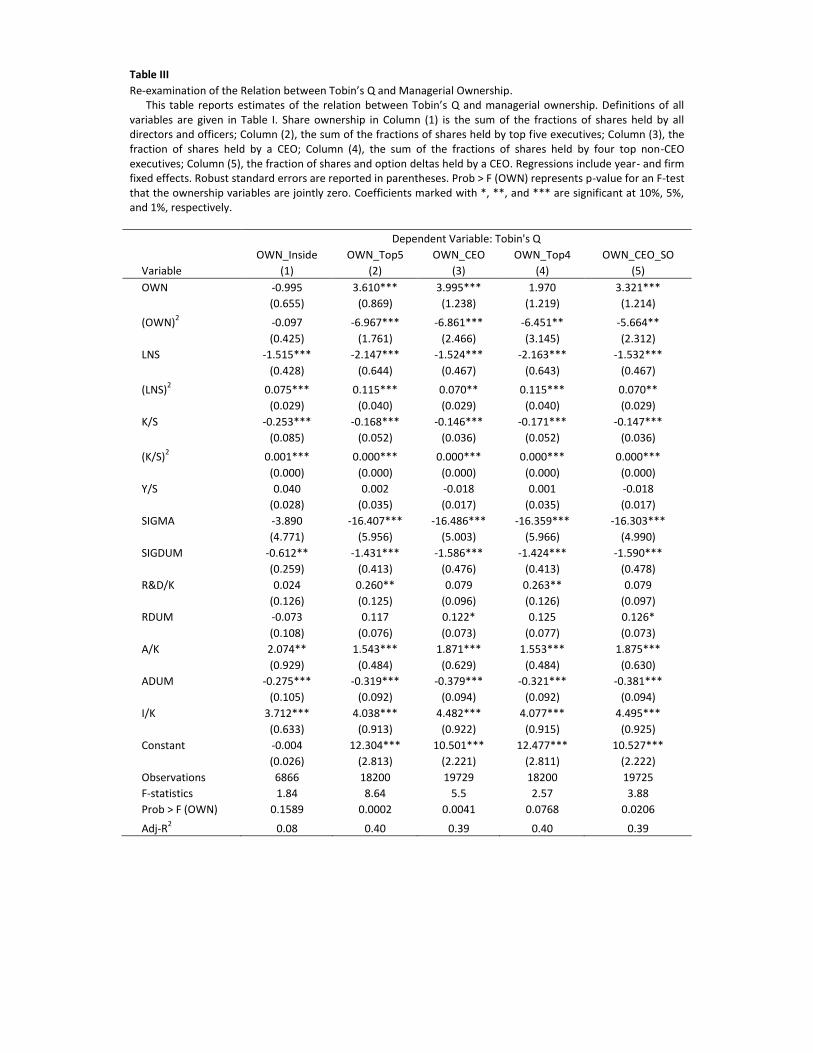
Table III
Re-examination of the Relation between Tobin’s Q and Managerial Ownership. This table reports estimates of the relation between Tobin’s Q and managerial ownership. Definitions of all variables are given in Table I. Share ownership in Column (1) is the sum of the fractions of shares held by all directors and officers; Column (2), the sum of the fractions of shares held by top five executives; Column (3), the fraction of shares held by a CEO; Column (4), the sum of the fractions of shares held by four top non-CEO executives; Column (5), the fraction of shares and option deltas held by a CEO. Regressions include year- and firm fixed effects. Robust standard errors are reported in parentheses. Prob > F (OWN) represents p-value for an F-test that the ownership variables are jointly zero. Coefficients marked with *, **, and *** are significant at 10%, 5%, and 1%, respectively.
Dependent Variable: Tobin's Q
OWN_Inside OWN_Top5 OWN_CEO OWN_Top4 OWN_CEO_SO
Variable (1) (2) (3) (4) (5)
OWN -0.995 3.610*** 3.995*** 1.970 3.321***
(0.655) (0.869) (1.238) (1.219) (1.214)
(OWN)2 -0.097 -6.967*** -6.861*** -6.451** -5.664**
(0.425) (1.761) (2.466) (3.145) (2.312)
LNS -1.515*** -2.147*** -1.524*** -2.163*** -1.532***
(0.428) (0.644) (0.467) (0.643) (0.467)
(LNS)2 0.075*** 0.115*** 0.070** 0.115*** 0.070**
(0.029) (0.040) (0.029) (0.040) (0.029)
K/S -0.253*** -0.168*** -0.146*** -0.171*** -0.147***
(0.085) (0.052) (0.036) (0.052) (0.036)
(K/S)2 0.001*** 0.000*** 0.000*** 0.000*** 0.000***
(0.000) (0.000) (0.000) (0.000) (0.000)
Y/S 0.040 0.002 -0.018 0.001 -0.018
(0.028) (0.035) (0.017) (0.035) (0.017)
SIGMA -3.890 -16.407*** -16.486*** -16.359*** -16.303***
(4.771) (5.956) (5.003) (5.966) (4.990)
SIGDUM -0.612** -1.431*** -1.586*** -1.424*** -1.590***
(0.259) (0.413) (0.476) (0.413) (0.478)
R&D/K 0.024 0.260** 0.079 0.263** 0.079
(0.126) (0.125) (0.096) (0.126) (0.097)
RDUM -0.073 0.117 0.122* 0.125 0.126*
(0.108) (0.076) (0.073) (0.077) (0.073)
A/K 2.074** 1.543*** 1.871*** 1.553*** 1.875***
(0.929) (0.484) (0.629) (0.484) (0.630)
ADUM -0.275*** -0.319*** -0.379*** -0.321*** -0.381***
(0.105) (0.092) (0.094) (0.092) (0.094)
I/K 3.712*** 4.038*** 4.482*** 4.077*** 4.495***
(0.633) (0.913) (0.922) (0.915) (0.925)
Constant -0.004 12.304*** 10.501*** 12.477*** 10.527***
(0.026) (2.813) (2.221) (2.811) (2.222)
Observations 6866 18200 19729 18200 19725
F-statistics 1.84 8.64 5.5 2.57 3.88
Prob > F (OWN) 0.1589 0.0002 0.0041 0.0768 0.0206
Adj-R2 0.08 0.40 0.39 0.40 0.39
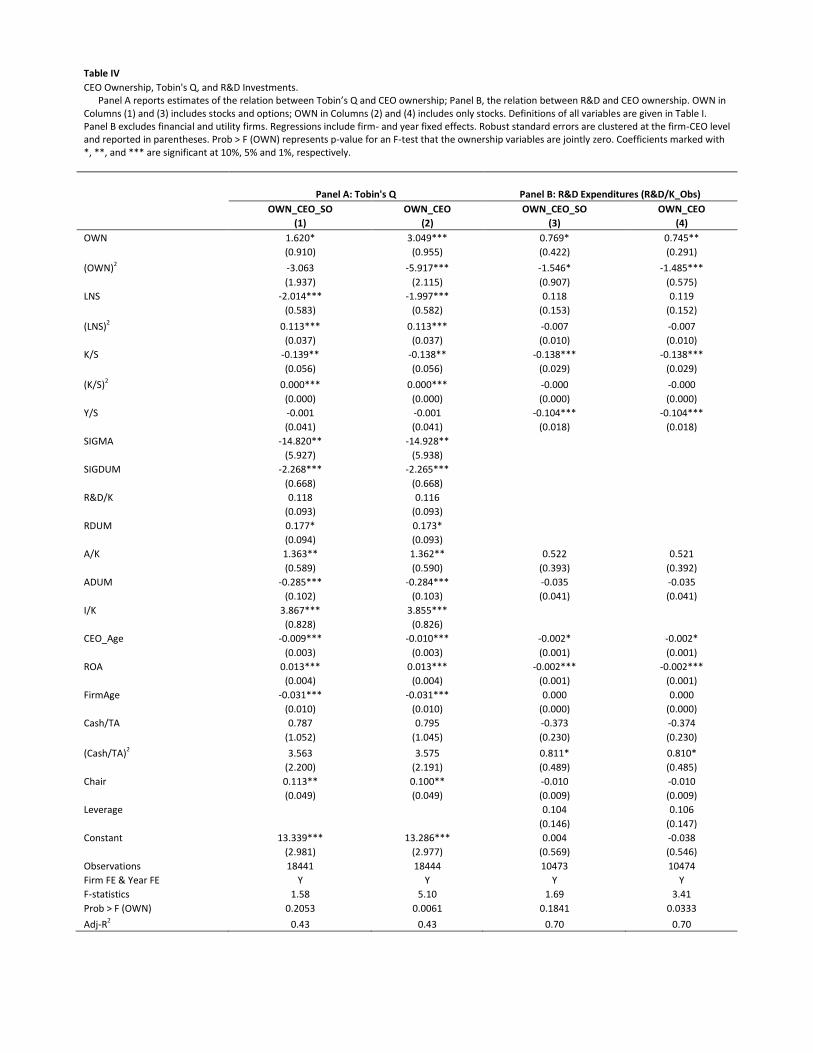
Table IV
CEO Ownership, Tobin's Q, and R&D Investments. Panel A reports estimates of the relation between Tobin’s Q and CEO ownership; Panel B, the relation between R&D and CEO ownership. OWN in Columns (1) and (3) includes stocks and options; OWN in Columns (2) and (4) includes only stocks. Definitions of all variables are given in Table I. Panel B excludes financial and utility firms. Regressions include firm- and year fixed effects. Robust standard errors are clustered at the firm-CEO level and reported in parentheses. Prob > F (OWN) represents p-value for an F-test that the ownership variables are jointly zero. Coefficients marked with *, **, and *** are significant at 10%, 5% and 1%, respectively.
Panel A: Tobin's Q Panel B: R&D Expenditures (R&D/K_Obs)
OWN_CEO_SO OWN_CEO OWN_CEO_SO OWN_CEO
(1) (2) (3) (4)
OWN 1.620* 3.049*** 0.769* 0.745**
(0.910) (0.955) (0.422) (0.291)
(OWN)2 -3.063 -5.917*** -1.546* -1.485***
(1.937) (2.115) (0.907) (0.575)
LNS -2.014*** -1.997*** 0.118 0.119
(0.583) (0.582) (0.153) (0.152)
(LNS)2 0.113*** 0.113*** -0.007 -0.007
(0.037) (0.037) (0.010) (0.010)
K/S -0.139** -0.138** -0.138*** -0.138***
(0.056) (0.056) (0.029) (0.029)
(K/S)2 0.000*** 0.000*** -0.000 -0.000
(0.000) (0.000) (0.000) (0.000)
Y/S -0.001 -0.001 -0.104*** -0.104***
(0.041) (0.041) (0.018) (0.018)
SIGMA -14.820** -14.928**
(5.927) (5.938)
SIGDUM -2.268*** -2.265***
(0.668) (0.668)
R&D/K 0.118 0.116
(0.093) (0.093)
RDUM 0.177* 0.173*
(0.094) (0.093)
A/K 1.363** 1.362** 0.522 0.521
(0.589) (0.590) (0.393) (0.392)
ADUM -0.285*** -0.284*** -0.035 -0.035
(0.102) (0.103) (0.041) (0.041)
I/K 3.867*** 3.855***
(0.828) (0.826)
CEO_Age -0.009*** -0.010*** -0.002* -0.002*
(0.003) (0.003) (0.001) (0.001)
ROA 0.013*** 0.013*** -0.002*** -0.002***
(0.004) (0.004) (0.001) (0.001)
FirmAge -0.031*** -0.031*** 0.000 0.000
(0.010) (0.010) (0.000) (0.000)
Cash/TA 0.787 0.795 -0.373 -0.374
(1.052) (1.045) (0.230) (0.230)
(Cash/TA)2 3.563 3.575 0.811* 0.810*
(2.200) (2.191) (0.489) (0.485)
Chair 0.113** 0.100** -0.010 -0.010
(0.049) (0.049) (0.009) (0.009)
Leverage 0.104 0.106
(0.146) (0.147)
Constant 13.339*** 13.286*** 0.004 -0.038
(2.981) (2.977) (0.569) (0.546)
Observations 18441 18444 10473 10474
Firm FE & Year FE Y Y Y Y
F-statistics 1.58 5.10 1.69 3.41
Prob > F (OWN) 0.2053 0.0061 0.1841 0.0333
Adj-R2 0.43 0.43 0.70 0.70
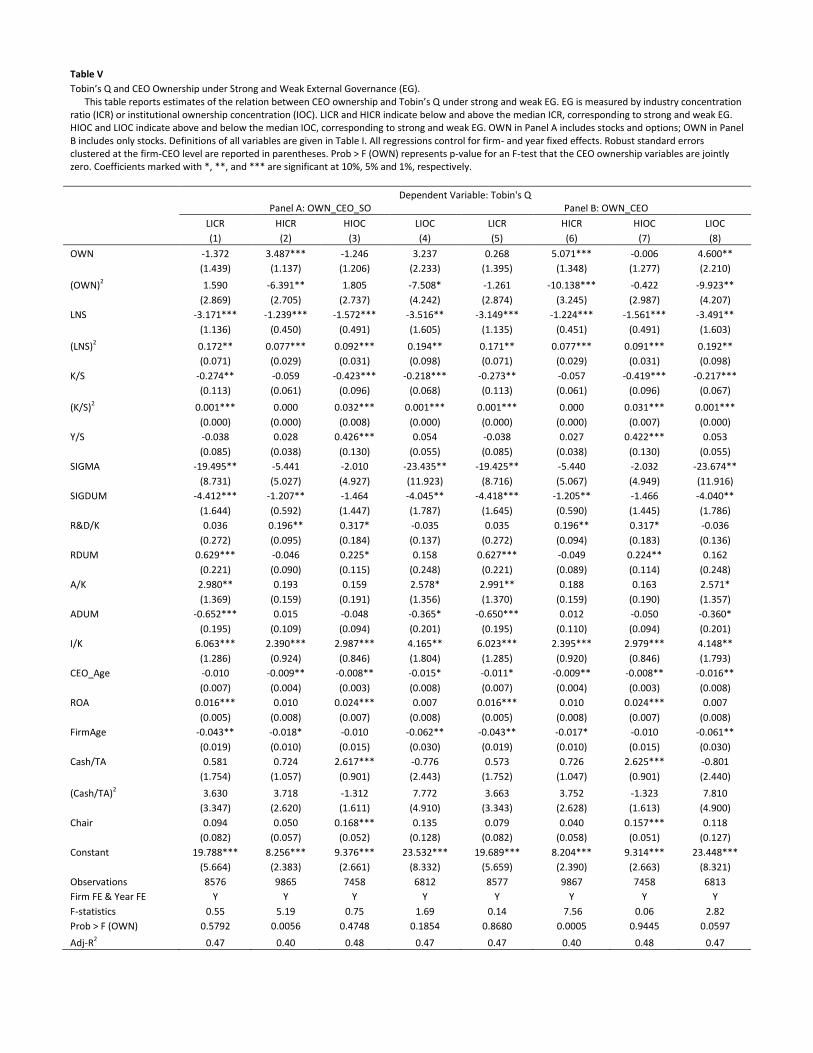
Table V
Tobin’s Q and CEO Ownership under Strong and Weak External Governance (EG). This table reports estimates of the relation between CEO ownership and Tobin’s Q under strong and weak EG. EG is measured by industry concentration ratio (ICR) or institutional ownership concentration (IOC). LICR and HICR indicate below and above the median ICR, corresponding to strong and weak EG. HIOC and LIOC indicate above and below the median IOC, corresponding to strong and weak EG. OWN in Panel A includes stocks and options; OWN in Panel B includes only stocks. Definitions of all variables are given in Table I. All regressions control for firm- and year fixed effects. Robust standard errors clustered at the firm-CEO level are reported in parentheses. Prob > F (OWN) represents p-value for an F-test that the CEO ownership variables are jointly zero. Coefficients marked with *, **, and *** are significant at 10%, 5% and 1%, respectively.
Dependent Variable: Tobin's Q
Panel A: OWN_CEO_SO Panel B: OWN_CEO
LICR HICR HIOC LIOC LICR HICR HIOC LIOC
(1) (2) (3) (4) (5) (6) (7) (8)
OWN -1.372 3.487*** -1.246 3.237 0.268 5.071*** -0.006 4.600**
(1.439) (1.137) (1.206) (2.233) (1.395) (1.348) (1.277) (2.210)
(OWN)2 1.590 -6.391** 1.805 -7.508* -1.261 -10.138*** -0.422 -9.923**
(2.869) (2.705) (2.737) (4.242) (2.874) (3.245) (2.987) (4.207)
LNS -3.171*** -1.239*** -1.572*** -3.516** -3.149*** -1.224*** -1.561*** -3.491**
(1.136) (0.450) (0.491) (1.605) (1.135) (0.451) (0.491) (1.603)
(LNS)2 0.172** 0.077*** 0.092*** 0.194** 0.171** 0.077*** 0.091*** 0.192**
(0.071) (0.029) (0.031) (0.098) (0.071) (0.029) (0.031) (0.098)
K/S -0.274** -0.059 -0.423*** -0.218*** -0.273** -0.057 -0.419*** -0.217***
(0.113) (0.061) (0.096) (0.068) (0.113) (0.061) (0.096) (0.067)
(K/S)2 0.001*** 0.000 0.032*** 0.001*** 0.001*** 0.000 0.031*** 0.001***
(0.000) (0.000) (0.008) (0.000) (0.000) (0.000) (0.007) (0.000)
Y/S -0.038 0.028 0.426*** 0.054 -0.038 0.027 0.422*** 0.053
(0.085) (0.038) (0.130) (0.055) (0.085) (0.038) (0.130) (0.055)
SIGMA -19.495** -5.441 -2.010 -23.435** -19.425** -5.440 -2.032 -23.674**
(8.731) (5.027) (4.927) (11.923) (8.716) (5.067) (4.949) (11.916)
SIGDUM -4.412*** -1.207** -1.464 -4.045** -4.418*** -1.205** -1.466 -4.040**
(1.644) (0.592) (1.447) (1.787) (1.645) (0.590) (1.445) (1.786)
R&D/K 0.036 0.196** 0.317* -0.035 0.035 0.196** 0.317* -0.036
(0.272) (0.095) (0.184) (0.137) (0.272) (0.094) (0.183) (0.136)
RDUM 0.629*** -0.046 0.225* 0.158 0.627*** -0.049 0.224** 0.162
(0.221) (0.090) (0.115) (0.248) (0.221) (0.089) (0.114) (0.248)
A/K 2.980** 0.193 0.159 2.578* 2.991** 0.188 0.163 2.571*
(1.369) (0.159) (0.191) (1.356) (1.370) (0.159) (0.190) (1.357)
ADUM -0.652*** 0.015 -0.048 -0.365* -0.650*** 0.012 -0.050 -0.360*
(0.195) (0.109) (0.094) (0.201) (0.195) (0.110) (0.094) (0.201)
I/K 6.063*** 2.390*** 2.987*** 4.165** 6.023*** 2.395*** 2.979*** 4.148**
(1.286) (0.924) (0.846) (1.804) (1.285) (0.920) (0.846) (1.793)
CEO_Age -0.010 -0.009** -0.008** -0.015* -0.011* -0.009** -0.008** -0.016**
(0.007) (0.004) (0.003) (0.008) (0.007) (0.004) (0.003) (0.008)
ROA 0.016*** 0.010 0.024*** 0.007 0.016*** 0.010 0.024*** 0.007
(0.005) (0.008) (0.007) (0.008) (0.005) (0.008) (0.007) (0.008)
FirmAge -0.043** -0.018* -0.010 -0.062** -0.043** -0.017* -0.010 -0.061**
(0.019) (0.010) (0.015) (0.030) (0.019) (0.010) (0.015) (0.030)
Cash/TA 0.581 0.724 2.617*** -0.776 0.573 0.726 2.625*** -0.801
(1.754) (1.057) (0.901) (2.443) (1.752) (1.047) (0.901) (2.440)
(Cash/TA)2 3.630 3.718 -1.312 7.772 3.663 3.752 -1.323 7.810
(3.347) (2.620) (1.611) (4.910) (3.343) (2.628) (1.613) (4.900)
Chair 0.094 0.050 0.168*** 0.135 0.079 0.040 0.157*** 0.118
(0.082) (0.057) (0.052) (0.128) (0.082) (0.058) (0.051) (0.127)
Constant 19.788*** 8.256*** 9.376*** 23.532*** 19.689*** 8.204*** 9.314*** 23.448***
(5.664) (2.383) (2.661) (8.332) (5.659) (2.390) (2.663) (8.321)
Observations 8576 9865 7458 6812 8577 9867 7458 6813
Firm FE & Year FE Y Y Y Y Y Y Y Y
F-statistics 0.55 5.19 0.75 1.69 0.14 7.56 0.06 2.82
Prob > F (OWN) 0.5792 0.0056 0.4748 0.1854 0.8680 0.0005 0.9445 0.0597
Adj-R2 0.47 0.40 0.48 0.47 0.47 0.40 0.48 0.47
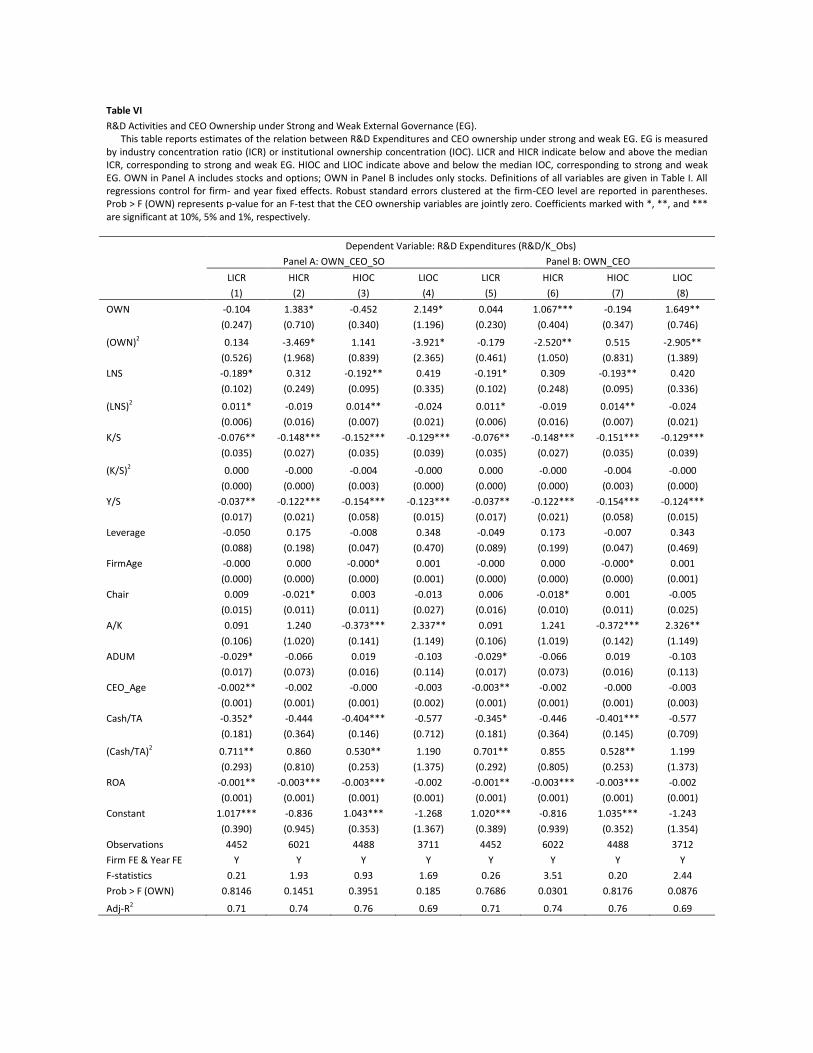
Table VI
R&D Activities and CEO Ownership under Strong and Weak External Governance (EG). This table reports estimates of the relation between R&D Expenditures and CEO ownership under strong and weak EG. EG is measured by industry concentration ratio (ICR) or institutional ownership concentration (IOC). LICR and HICR indicate below and above the median ICR, corresponding to strong and weak EG. HIOC and LIOC indicate above and below the median IOC, corresponding to strong and weak EG. OWN in Panel A includes stocks and options; OWN in Panel B includes only stocks. Definitions of all variables are given in Table I. All regressions control for firm- and year fixed effects. Robust standard errors clustered at the firm-CEO level are reported in parentheses. Prob > F (OWN) represents p-value for an F-test that the CEO ownership variables are jointly zero. Coefficients marked with *, **, and *** are significant at 10%, 5% and 1%, respectively.
Dependent Variable: R&D Expenditures (R&D/K_Obs)
Panel A: OWN_CEO_SO Panel B: OWN_CEO
LICR HICR HIOC LIOC LICR HICR HIOC LIOC
(1) (2) (3) (4) (5) (6) (7) (8)
OWN -0.104 1.383* -0.452 2.149* 0.044 1.067*** -0.194 1.649**
(0.247) (0.710) (0.340) (1.196) (0.230) (0.404) (0.347) (0.746)
(OWN)2 0.134 -3.469* 1.141 -3.921* -0.179 -2.520** 0.515 -2.905**
(0.526) (1.968) (0.839) (2.365) (0.461) (1.050) (0.831) (1.389)
LNS -0.189* 0.312 -0.192** 0.419 -0.191* 0.309 -0.193** 0.420
(0.102) (0.249) (0.095) (0.335) (0.102) (0.248) (0.095) (0.336)
(LNS)2 0.011* -0.019 0.014** -0.024 0.011* -0.019 0.014** -0.024
(0.006) (0.016) (0.007) (0.021) (0.006) (0.016) (0.007) (0.021)
K/S -0.076** -0.148*** -0.152*** -0.129*** -0.076** -0.148*** -0.151*** -0.129***
(0.035) (0.027) (0.035) (0.039) (0.035) (0.027) (0.035) (0.039)
(K/S)2 0.000 -0.000 -0.004 -0.000 0.000 -0.000 -0.004 -0.000
(0.000) (0.000) (0.003) (0.000) (0.000) (0.000) (0.003) (0.000)
Y/S -0.037** -0.122*** -0.154*** -0.123*** -0.037** -0.122*** -0.154*** -0.124***
(0.017) (0.021) (0.058) (0.015) (0.017) (0.021) (0.058) (0.015)
Leverage -0.050 0.175 -0.008 0.348 -0.049 0.173 -0.007 0.343
(0.088) (0.198) (0.047) (0.470) (0.089) (0.199) (0.047) (0.469)
FirmAge -0.000 0.000 -0.000* 0.001 -0.000 0.000 -0.000* 0.001
(0.000) (0.000) (0.000) (0.001) (0.000) (0.000) (0.000) (0.001)
Chair 0.009 -0.021* 0.003 -0.013 0.006 -0.018* 0.001 -0.005
(0.015) (0.011) (0.011) (0.027) (0.016) (0.010) (0.011) (0.025)
A/K 0.091 1.240 -0.373*** 2.337** 0.091 1.241 -0.372*** 2.326**
(0.106) (1.020) (0.141) (1.149) (0.106) (1.019) (0.142) (1.149)
ADUM -0.029* -0.066 0.019 -0.103 -0.029* -0.066 0.019 -0.103
(0.017) (0.073) (0.016) (0.114) (0.017) (0.073) (0.016) (0.113)
CEO_Age -0.002** -0.002 -0.000 -0.003 -0.003** -0.002 -0.000 -0.003
(0.001) (0.001) (0.001) (0.002) (0.001) (0.001) (0.001) (0.003)
Cash/TA -0.352* -0.444 -0.404*** -0.577 -0.345* -0.446 -0.401*** -0.577
(0.181) (0.364) (0.146) (0.712) (0.181) (0.364) (0.145) (0.709)
(Cash/TA)2 0.711** 0.860 0.530** 1.190 0.701** 0.855 0.528** 1.199
(0.293) (0.810) (0.253) (1.375) (0.292) (0.805) (0.253) (1.373)
ROA -0.001** -0.003*** -0.003*** -0.002 -0.001** -0.003*** -0.003*** -0.002
(0.001) (0.001) (0.001) (0.001) (0.001) (0.001) (0.001) (0.001)
Constant 1.017*** -0.836 1.043*** -1.268 1.020*** -0.816 1.035*** -1.243
(0.390) (0.945) (0.353) (1.367) (0.389) (0.939) (0.352) (1.354)
Observations 4452 6021 4488 3711 4452 6022 4488 3712
Firm FE & Year FE Y Y Y Y Y Y Y Y
F-statistics 0.21 1.93 0.93 1.69 0.26 3.51 0.20 2.44
Prob > F (OWN) 0.8146 0.1451 0.3951 0.185 0.7686 0.0301 0.8176 0.0876
Adj-R2 0.71 0.74 0.76 0.69 0.71 0.74 0.76 0.69
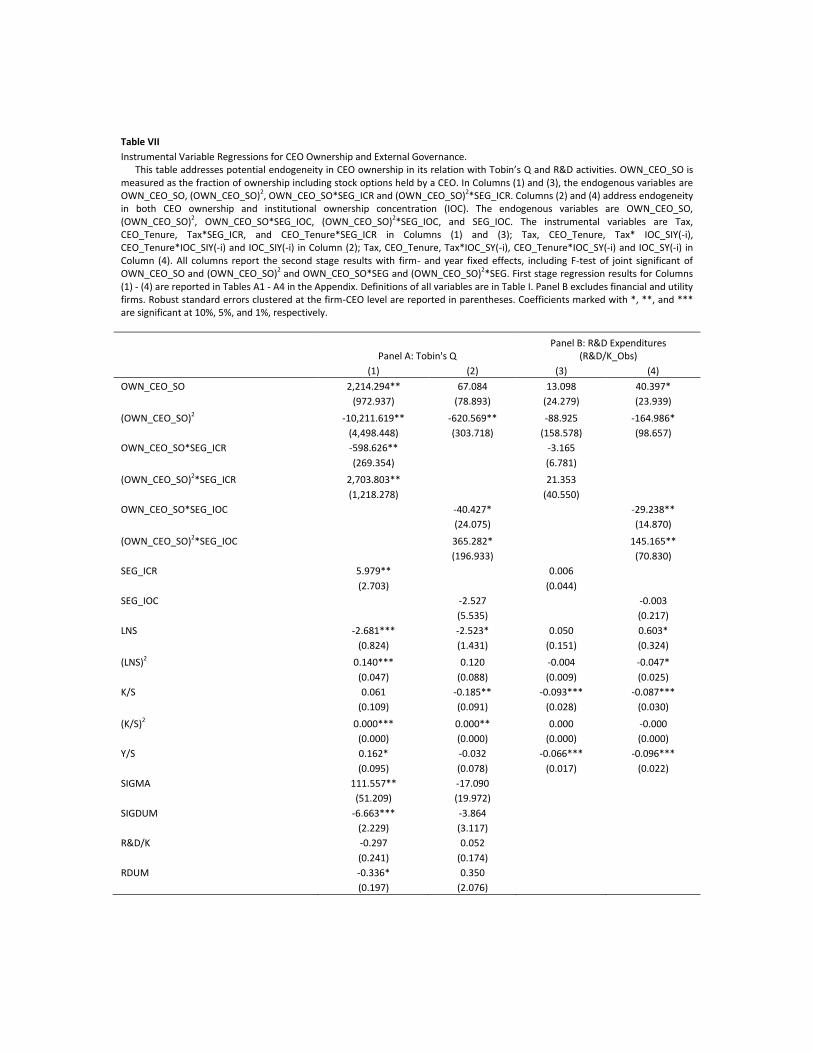
Table VII
Instrumental Variable Regressions for CEO Ownership and External Governance. This table addresses potential endogeneity in CEO ownership in its relation with Tobin’s Q and R&D activities. OWN_CEO_SO is measured as the fraction of ownership including stock options held by a CEO. In Columns (1) and (3), the endogenous variables are OWN_CEO_SO, (OWN_CEO_SO)2, OWN_CEO_SO*SEG_ICR and (OWN_CEO_SO)2*SEG_ICR. Columns (2) and (4) address endogeneity in both CEO ownership and institutional ownership concentration (IOC). The endogenous variables are OWN_CEO_SO, (OWN_CEO_SO)2, OWN_CEO_SO*SEG_IOC, (OWN_CEO_SO)2*SEG_IOC, and SEG_IOC. The instrumental variables are Tax, CEO_Tenure, Tax*SEG_ICR, and CEO_Tenure*SEG_ICR in Columns (1) and (3); Tax, CEO_Tenure, Tax* IOC_SIY(-i), CEO_Tenure*IOC_SIY(-i) and IOC_SIY(-i) in Column (2); Tax, CEO_Tenure, Tax*IOC_SY(-i), CEO_Tenure*IOC_SY(-i) and IOC_SY(-i) in Column (4). All columns report the second stage results with firm- and year fixed effects, including F-test of joint significant of OWN_CEO_SO and (OWN_CEO_SO)2 and OWN_CEO_SO*SEG and (OWN_CEO_SO)2*SEG. First stage regression results for Columns (1) - (4) are reported in Tables A1 - A4 in the Appendix. Definitions of all variables are in Table I. Panel B excludes financial and utility firms. Robust standard errors clustered at the firm-CEO level are reported in parentheses. Coefficients marked with *, **, and *** are significant at 10%, 5%, and 1%, respectively.
Panel A: Tobin's Q Panel B: R&D Expenditures
(R&D/K_Obs)
(1) (2) (3) (4)
OWN_CEO_SO 2,214.294** 67.084 13.098 40.397*
(972.937) (78.893) (24.279) (23.939)
(OWN_CEO_SO)2 -10,211.619** -620.569** -88.925 -164.986*
(4,498.448) (303.718) (158.578) (98.657)
OWN_CEO_SO*SEG_ICR -598.626** -3.165
(269.354) (6.781)
(OWN_CEO_SO)2*SEG_ICR 2,703.803** 21.353
(1,218.278) (40.550)
OWN_CEO_SO*SEG_IOC -40.427* -29.238**
(24.075) (14.870)
(OWN_CEO_SO)2*SEG_IOC 365.282* 145.165**
(196.933) (70.830)
SEG_ICR 5.979** 0.006
(2.703) (0.044)
SEG_IOC -2.527 -0.003
(5.535) (0.217)
LNS -2.681*** -2.523* 0.050 0.603*
(0.824) (1.431) (0.151) (0.324)
(LNS)2 0.140*** 0.120 -0.004 -0.047*
(0.047) (0.088) (0.009) (0.025)
K/S 0.061 -0.185** -0.093*** -0.087***
(0.109) (0.091) (0.028) (0.030)
(K/S)2 0.000*** 0.000** 0.000 -0.000
(0.000) (0.000) (0.000) (0.000)
Y/S 0.162* -0.032 -0.066*** -0.096***
(0.095) (0.078) (0.017) (0.022)
SIGMA 111.557** -17.090
(51.209) (19.972)
SIGDUM -6.663*** -3.864
(2.229) (3.117)
R&D/K -0.297 0.052
(0.241) (0.174)
RDUM -0.336* 0.350
(0.197) (2.076)
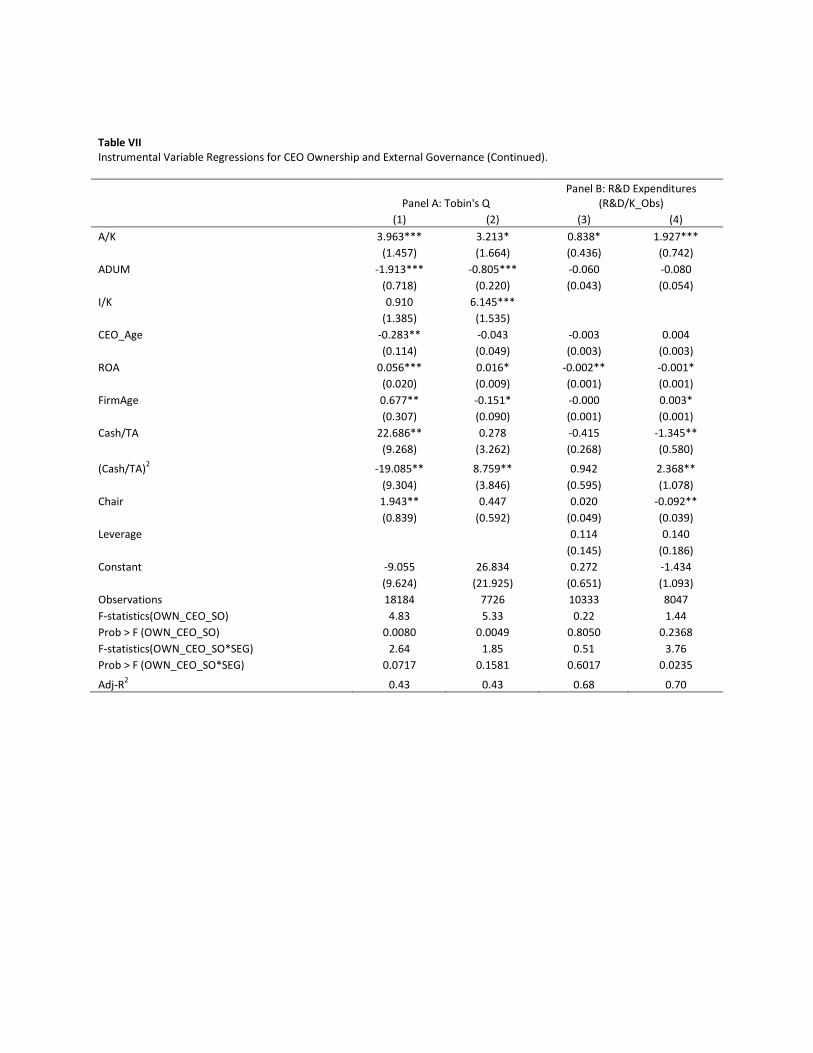
Table VII Instrumental Variable Regressions for CEO Ownership and External Governance (Continued).
Panel A: Tobin's Q Panel B: R&D Expenditures
(R&D/K_Obs)
(1) (2) (3) (4)
A/K 3.963*** 3.213* 0.838* 1.927***
(1.457) (1.664) (0.436) (0.742)
ADUM -1.913*** -0.805*** -0.060 -0.080
(0.718) (0.220) (0.043) (0.054)
I/K 0.910 6.145***
(1.385) (1.535)
CEO_Age -0.283** -0.043 -0.003 0.004
(0.114) (0.049) (0.003) (0.003)
ROA 0.056*** 0.016* -0.002** -0.001*
(0.020) (0.009) (0.001) (0.001)
FirmAge 0.677** -0.151* -0.000 0.003*
(0.307) (0.090) (0.001) (0.001)
Cash/TA 22.686** 0.278 -0.415 -1.345**
(9.268) (3.262) (0.268) (0.580)
(Cash/TA)2 -19.085** 8.759** 0.942 2.368**
(9.304) (3.846) (0.595) (1.078)
Chair 1.943** 0.447 0.020 -0.092**
(0.839) (0.592) (0.049) (0.039)
Leverage 0.114 0.140
(0.145) (0.186)
Constant -9.055 26.834 0.272 -1.434
(9.624) (21.925) (0.651) (1.093)
Observations 18184 7726 10333 8047
F-statistics(OWN_CEO_SO) 4.83 5.33 0.22 1.44
Prob > F (OWN_CEO_SO) 0.0080 0.0049 0.8050 0.2368
F-statistics(OWN_CEO_SO*SEG) 2.64 1.85 0.51 3.76
Prob > F (OWN_CEO_SO*SEG) 0.0717 0.1581 0.6017 0.0235
Adj-R2 0.43 0.43 0.68 0.70
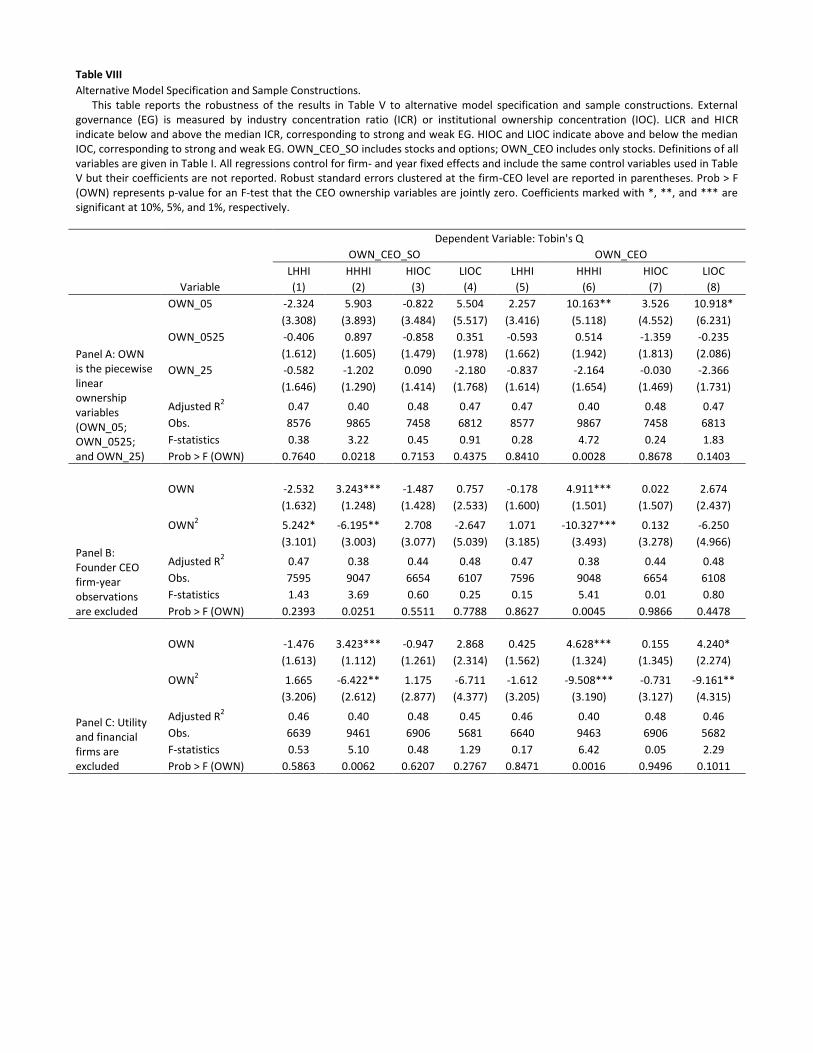
Table VIII
Alternative Model Specification and Sample Constructions. This table reports the robustness of the results in Table V to alternative model specification and sample constructions. External governance (EG) is measured by industry concentration ratio (ICR) or institutional ownership concentration (IOC). LICR and HICR indicate below and above the median ICR, corresponding to strong and weak EG. HIOC and LIOC indicate above and below the median IOC, corresponding to strong and weak EG. OWN_CEO_SO includes stocks and options; OWN_CEO includes only stocks. Definitions of all variables are given in Table I. All regressions control for firm- and year fixed effects and include the same control variables used in Table V but their coefficients are not reported. Robust standard errors clustered at the firm-CEO level are reported in parentheses. Prob > F (OWN) represents p-value for an F-test that the CEO ownership variables are jointly zero. Coefficients marked with *, **, and *** are significant at 10%, 5%, and 1%, respectively.
Dependent Variable: Tobin's Q
OWN_CEO_SO OWN_CEO
LHHI HHHI HIOC LIOC LHHI HHHI HIOC LIOC
Variable (1) (2) (3) (4) (5) (6) (7) (8)
Panel A: OWN is the piecewise linear ownership variables (OWN_05; OWN_0525; and OWN_25)
OWN_05 -2.324 5.903 -0.822 5.504 2.257 10.163** 3.526 10.918*
(3.308) (3.893) (3.484) (5.517) (3.416) (5.118) (4.552) (6.231)
OWN_0525 -0.406 0.897 -0.858 0.351 -0.593 0.514 -1.359 -0.235
(1.612) (1.605) (1.479) (1.978) (1.662) (1.942) (1.813) (2.086)
OWN_25 -0.582 -1.202 0.090 -2.180 -0.837 -2.164 -0.030 -2.366
(1.646) (1.290) (1.414) (1.768) (1.614) (1.654) (1.469) (1.731)
Adjusted R2 0.47 0.40 0.48 0.47 0.47 0.40 0.48 0.47
Obs. 8576 9865 7458 6812 8577 9867 7458 6813
F-statistics 0.38 3.22 0.45 0.91 0.28 4.72 0.24 1.83
Prob > F (OWN) 0.7640 0.0218 0.7153 0.4375 0.8410 0.0028 0.8678 0.1403
Panel B: Founder CEO firm-year observations are excluded
OWN -2.532 3.243*** -1.487 0.757 -0.178 4.911*** 0.022 2.674
(1.632) (1.248) (1.428) (2.533) (1.600) (1.501) (1.507) (2.437)
OWN2 5.242* -6.195** 2.708 -2.647 1.071 -10.327*** 0.132 -6.250
(3.101) (3.003) (3.077) (5.039) (3.185) (3.493) (3.278) (4.966)
Adjusted R2 0.47 0.38 0.44 0.48 0.47 0.38 0.44 0.48
Obs. 7595 9047 6654 6107 7596 9048 6654 6108
F-statistics 1.43 3.69 0.60 0.25 0.15 5.41 0.01 0.80
Prob > F (OWN) 0.2393 0.0251 0.5511 0.7788 0.8627 0.0045 0.9866 0.4478
Panel C: Utility and financial firms are excluded
OWN -1.476 3.423*** -0.947 2.868 0.425 4.628*** 0.155 4.240*
(1.613) (1.112) (1.261) (2.314) (1.562) (1.324) (1.345) (2.274)
OWN2 1.665 -6.422** 1.175 -6.711 -1.612 -9.508*** -0.731 -9.161**
(3.206) (2.612) (2.877) (4.377) (3.205) (3.190) (3.127) (4.315)
Adjusted R2 0.46 0.40 0.48 0.45 0.46 0.40 0.48 0.46
Obs. 6639 9461 6906 5681 6640 9463 6906 5682
F-statistics 0.53 5.10 0.48 1.29 0.17 6.42 0.05 2.29
Prob > F (OWN) 0.5863 0.0062 0.6207 0.2767 0.8471 0.0016 0.9496 0.1011
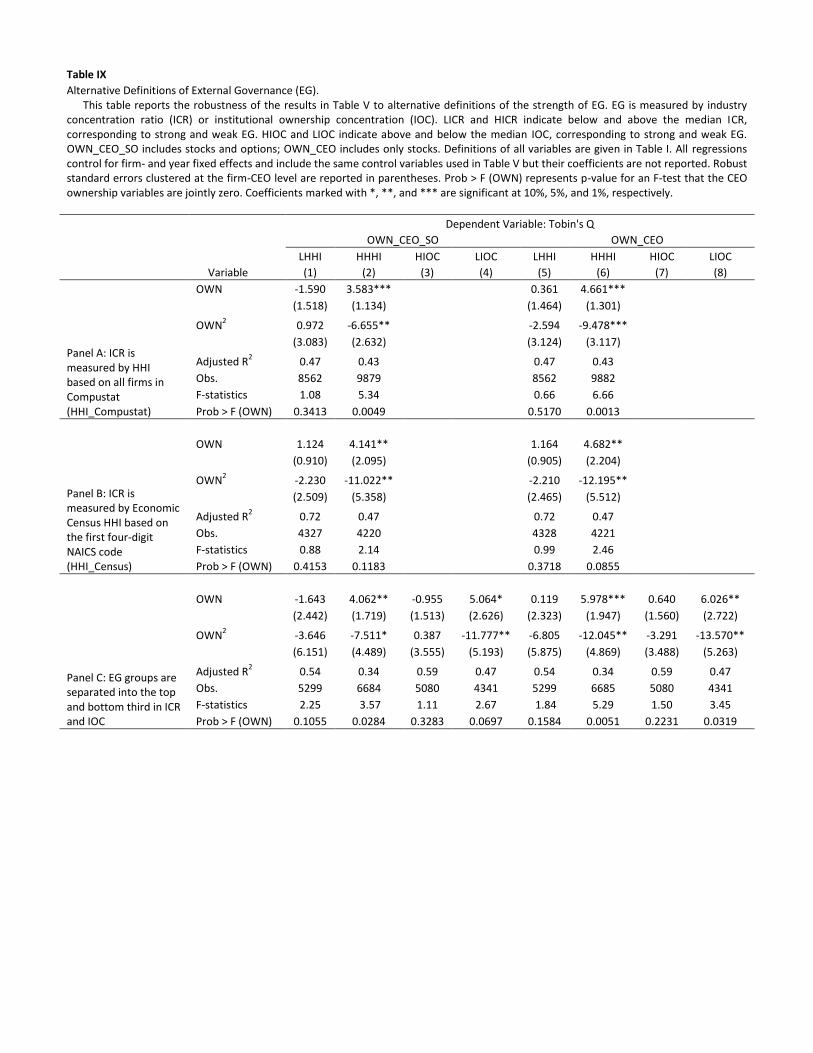
Table IX
Alternative Definitions of External Governance (EG). This table reports the robustness of the results in Table V to alternative definitions of the strength of EG. EG is measured by industry concentration ratio (ICR) or institutional ownership concentration (IOC). LICR and HICR indicate below and above the median ICR, corresponding to strong and weak EG. HIOC and LIOC indicate above and below the median IOC, corresponding to strong and weak EG. OWN_CEO_SO includes stocks and options; OWN_CEO includes only stocks. Definitions of all variables are given in Table I. All regressions control for firm- and year fixed effects and include the same control variables used in Table V but their coefficients are not reported. Robust standard errors clustered at the firm-CEO level are reported in parentheses. Prob > F (OWN) represents p-value for an F-test that the CEO ownership variables are jointly zero. Coefficients marked with *, **, and *** are significant at 10%, 5%, and 1%, respectively.
Dependent Variable: Tobin's Q
OWN_CEO_SO OWN_CEO
LHHI HHHI HIOC LIOC LHHI HHHI HIOC LIOC
Variable (1) (2) (3) (4) (5) (6) (7) (8)
Panel A: ICR is measured by HHI based on all firms in Compustat (HHI_Compustat)
OWN -1.590 3.583*** 0.361 4.661***
(1.518) (1.134) (1.464) (1.301)
OWN2 0.972 -6.655** -2.594 -9.478***
(3.083) (2.632) (3.124) (3.117)
Adjusted R2 0.47 0.43 0.47 0.43
Obs. 8562 9879 8562 9882
F-statistics 1.08 5.34 0.66 6.66
Prob > F (OWN) 0.3413 0.0049 0.5170 0.0013
Panel B: ICR is measured by Economic Census HHI based on the first four-digit NAICS code (HHI_Census)
OWN 1.124 4.141** 1.164 4.682**
(0.910) (2.095) (0.905) (2.204)
OWN2 -2.230 -11.022** -2.210 -12.195**
(2.509) (5.358) (2.465) (5.512)
Adjusted R2 0.72 0.47 0.72 0.47
Obs. 4327 4220 4328 4221
F-statistics 0.88 2.14 0.99 2.46
Prob > F (OWN) 0.4153 0.1183 0.3718 0.0855
Panel C: EG groups are separated into the top and bottom third in ICR and IOC
OWN -1.643 4.062** -0.955 5.064* 0.119 5.978*** 0.640 6.026**
(2.442) (1.719) (1.513) (2.626) (2.323) (1.947) (1.560) (2.722)
OWN2 -3.646 -7.511* 0.387 -11.777** -6.805 -12.045** -3.291 -13.570**
(6.151) (4.489) (3.555) (5.193) (5.875) (4.869) (3.488) (5.263)
Adjusted R2 0.54 0.34 0.59 0.47 0.54 0.34 0.59 0.47
Obs. 5299 6684 5080 4341 5299 6685 5080 4341
F-statistics 2.25 3.57 1.11 2.67 1.84 5.29 1.50 3.45
Prob > F (OWN) 0.1055 0.0284 0.3283 0.0697 0.1584 0.0051 0.2231 0.0319
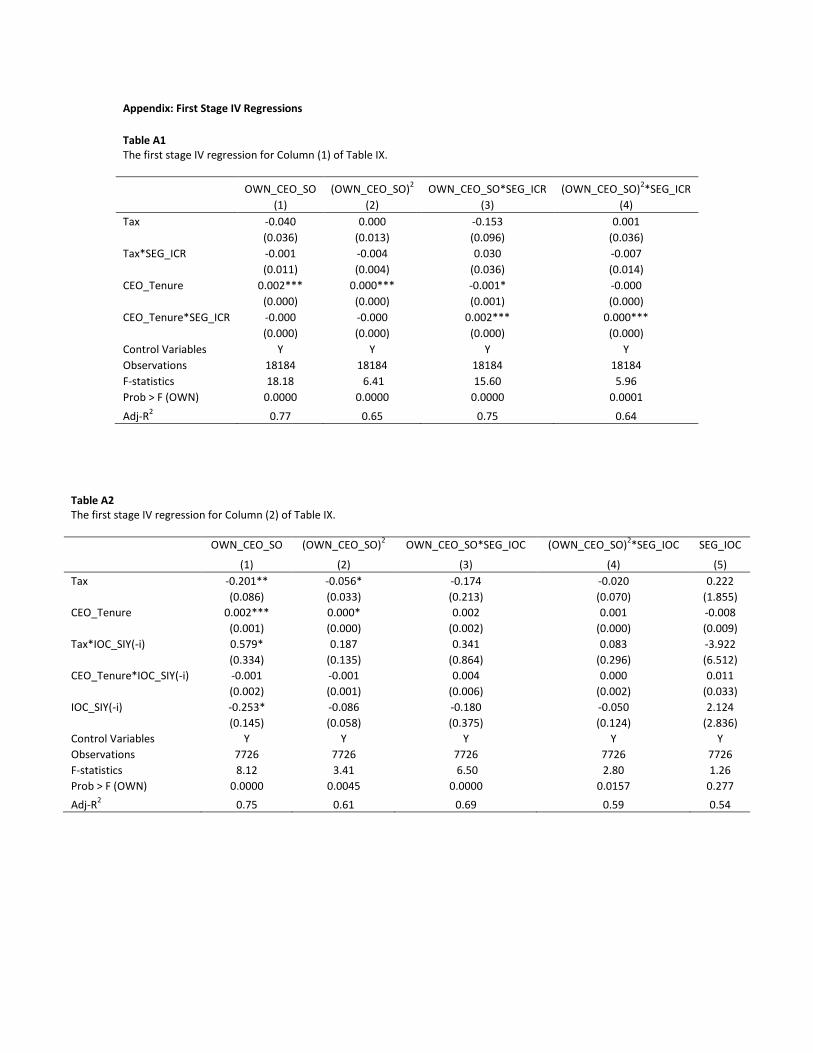
Appendix: First Stage IV Regressions
Table A1 The first stage IV regression for Column (1) of Table IX.
OWN_CEO_SO (OWN_CEO_SO)2 OWN_CEO_SO*SEG_ICR (OWN_CEO_SO)
2*SEG_ICR
(1) (2) (3) (4)
Tax -0.040 0.000 -0.153 0.001
(0.036) (0.013) (0.096) (0.036)
Tax*SEG_ICR -0.001 -0.004 0.030 -0.007
(0.011) (0.004) (0.036) (0.014)
CEO_Tenure 0.002*** 0.000*** -0.001* -0.000
(0.000) (0.000) (0.001) (0.000)
CEO_Tenure*SEG_ICR -0.000 -0.000 0.002*** 0.000***
(0.000) (0.000) (0.000) (0.000)
Control Variables Y Y Y Y
Observations 18184 18184 18184 18184
F-statistics 18.18 6.41 15.60 5.96
Prob > F (OWN) 0.0000 0.0000 0.0000 0.0001
Adj-R2 0.77 0.65 0.75 0.64
Table A2 The first stage IV regression for Column (2) of Table IX.
OWN_CEO_SO (OWN_CEO_SO)2 OWN_CEO_SO*SEG_IOC (OWN_CEO_SO)
2*SEG_IOC SEG_IOC
(1) (2) (3) (4) (5)
Tax -0.201** -0.056* -0.174 -0.020 0.222
(0.086) (0.033) (0.213) (0.070) (1.855)
CEO_Tenure 0.002*** 0.000* 0.002 0.001 -0.008
(0.001) (0.000) (0.002) (0.000) (0.009)
Tax*IOC_SIY(-i) 0.579* 0.187 0.341 0.083 -3.922
(0.334) (0.135) (0.864) (0.296) (6.512)
CEO_Tenure*IOC_SIY(-i) -0.001 -0.001 0.004 0.000 0.011
(0.002) (0.001) (0.006) (0.002) (0.033)
IOC_SIY(-i) -0.253* -0.086 -0.180 -0.050 2.124
(0.145) (0.058) (0.375) (0.124) (2.836)
Control Variables Y Y Y Y Y
Observations 7726 7726 7726 7726 7726
F-statistics 8.12 3.41 6.50 2.80 1.26
Prob > F (OWN) 0.0000 0.0045 0.0000 0.0157 0.277
Adj-R2 0.75 0.61 0.69 0.59 0.54
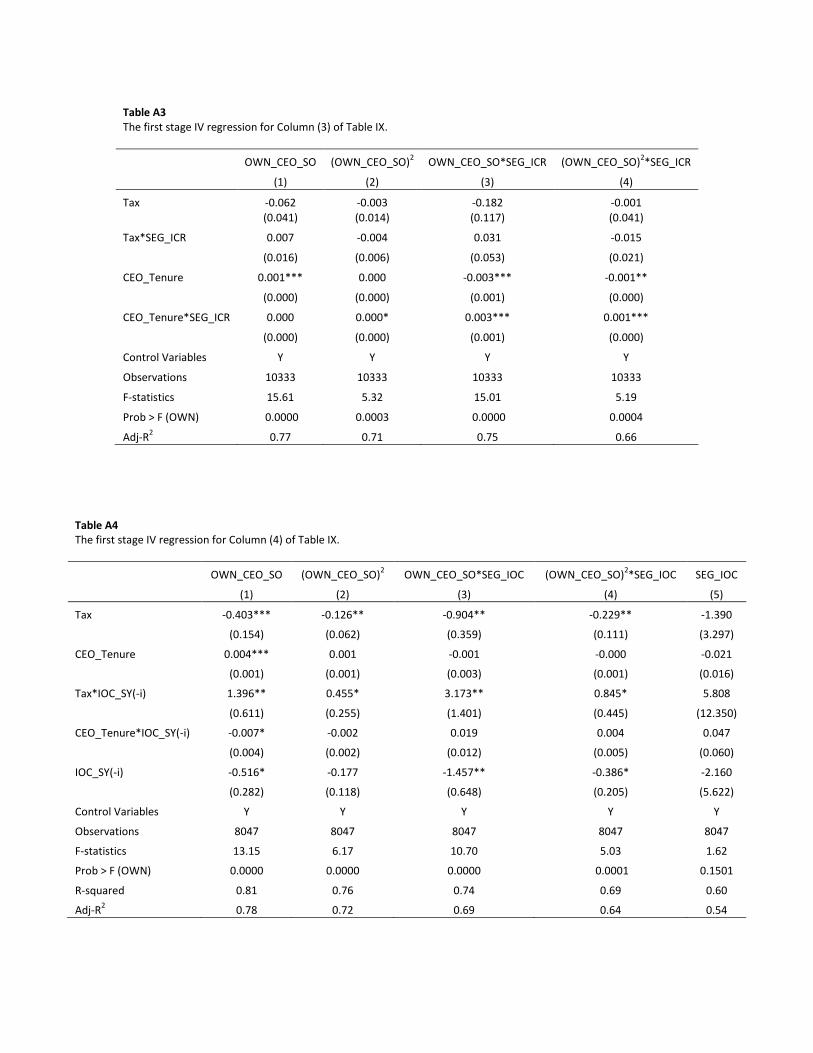
Table A3 The first stage IV regression for Column (3) of Table IX.
OWN_CEO_SO (OWN_CEO_SO)2 OWN_CEO_SO*SEG_ICR (OWN_CEO_SO)
2*SEG_ICR
(1) (2) (3) (4)
Tax -0.062 -0.003 -0.182 -0.001
(0.041) (0.014) (0.117) (0.041)
Tax*SEG_ICR 0.007 -0.004 0.031 -0.015
(0.016) (0.006) (0.053) (0.021)
CEO_Tenure 0.001*** 0.000 -0.003*** -0.001**
(0.000) (0.000) (0.001) (0.000)
CEO_Tenure*SEG_ICR 0.000 0.000* 0.003*** 0.001***
(0.000) (0.000) (0.001) (0.000)
Control Variables Y Y Y Y
Observations 10333 10333 10333 10333
F-statistics 15.61 5.32 15.01 5.19
Prob > F (OWN) 0.0000 0.0003 0.0000 0.0004
Adj-R2 0.77 0.71 0.75 0.66
Table A4 The first stage IV regression for Column (4) of Table IX.
OWN_CEO_SO (OWN_CEO_SO)2 OWN_CEO_SO*SEG_IOC (OWN_CEO_SO)
2*SEG_IOC SEG_IOC
(1) (2) (3) (4) (5)
Tax -0.403*** -0.126** -0.904** -0.229** -1.390
(0.154) (0.062) (0.359) (0.111) (3.297)
CEO_Tenure 0.004*** 0.001 -0.001 -0.000 -0.021
(0.001) (0.001) (0.003) (0.001) (0.016)
Tax*IOC_SY(-i) 1.396** 0.455* 3.173** 0.845* 5.808
(0.611) (0.255) (1.401) (0.445) (12.350)
CEO_Tenure*IOC_SY(-i) -0.007* -0.002 0.019 0.004 0.047
(0.004) (0.002) (0.012) (0.005) (0.060)
IOC_SY(-i) -0.516* -0.177 -1.457** -0.386* -2.160
(0.282) (0.118) (0.648) (0.205) (5.622)
Control Variables Y Y Y Y Y
Observations 8047 8047 8047 8047 8047
F-statistics 13.15 6.17 10.70 5.03 1.62
Prob > F (OWN) 0.0000 0.0000 0.0000 0.0001 0.1501
R-squared 0.81 0.76 0.74 0.69 0.60
Adj-R2 0.78 0.72 0.69 0.64 0.54