priority threat management for imperilled species of the...
TRANSCRIPT

Priority Threat Management for Imperilled Species of the Queensland Brigalow Belt


iii
Rocío Ponce Reyes1, Jennifer Firn1,4, Sam Nicol1,5, Iadine Chadès1,5, Danial S Stratford2, Tara G Martin1,5, Stuart Whitten3, Josie Carwardine1,5
1 CSIROEcosciences Precinct Boggo Road
Brisbane, Australia
2 CSIROBlack Mountain
Canberra, Australia
3 CSIROBellenden Street, Crace
Canberra, Australia
4 School of Earth, Environmental and Biological SciencesQueensland University of Technology
Brisbane, Australia
5 ARC Centre of Excellence for Environmental DecisionsNERP Environmental Decisions Hub
Centre for Biodiversity & Conservation Science University of Queensland
Brisbane, Australia
Priority Threat Management for Imperilled Species of the Queensland Brigalow Belt
CoverGolden-tailed gecko Strophurus taenicaudainhabits open woodland and open forests from the Darling Downs in southern Queensland to Rockhampton, an area that is going to be impacted by coal seam gas development. Currently the golden-tailed gecko is listed as near threatened by Queensland’s Nature Conservation Act 1992 and as medium priority under the Back on Track framework.
Eric Vanderduys
LeftBoowinda Gorgewas formed by extreme flows of water, carving the sandstones of the Upper Gorge in Carnarvon National Park. Goowinda is an Indigenous word for ‘thunder’.
Rocío Ponce Reyes
ISBN 978-1-4863-0578-0
Citation Ponce Reyes, R, Firn, J, Nicol, S, Chadès, I, Stratford, DS, Martin, TG, Whitten, S, Carwardine, J 2016 Priority Threat Management for Imperilled Species of the Queensland Brigalow Belt CSIRO, Brisbane.

iv
This report would not have been possible without the invaluable input of experts and stakeholders in biodiversity, conservation and management of the Brigalow Belt. Of the participants involved, the following people agreed to be acknowledged for volunteering their time to attend workshops and / or follow-up efforts to define the distributions of threatened species of the Brigalow Belt, their recommendations concerning key threats and effective strategies for mitigating these threats and estimates of costs, feasibility and benefits to the persistence of the key flora and fauna of concern.
Stephen Balcome Australian Rivers Institute, Griffith UniversityRob Coulson Origin EnergyWes Davidson Queensland Department of Environment and Heritage ProtectionJohn Dwyer University of QueenslandTeresa Eyre Queensland Department of Science, Information Technology and InnovationRod Fensham University of QueenslandDamian Ferguson AgForceMike Gregory Queensland Department of Environment and Heritage ProtectionCraig Hempel Queensland Department of Environment and Heritage ProtectionMark Kennard Australian Rivers Institute, Griffith UniversityMartine Maron University of QueenslandJuliana McCosker Queensland Department of Environment and Heritage ProtectionAlistair Melzer University of Southern QueenslandKate Reardon-Smith University of Southern QueenslandAndy Reeson CSIROClaire Rodgers Central Highlands Regional Resources Use Planning CooperativeLeonie Seabrook University of QueenslandHugo Spooner Avocet Nature ReserveMartin Taylor WWFEric Vanderduys CSIROKen Waterton Yukenbulla ServicesBruce Wilson EcoLogical AustraliaQueensland Murray-Darling Committee
The authors would like to acknowledge Craig Salt (Sustainable Consulting) for exceptional workshop facilitation, Jutta Beher, Maria Margarita Berzunza, Jasmine Lee and Martin Peron for their help facilitating the workshop.
Acknowledgements
This report was funded by the Gas Industry Social and Environmental Research Alliance (GISERA). GISERA is a collaborative vehicle established to undertake publicly-reported independent research addressing the socio-economic and environmental impacts of Australia’s natural gas industries. The governance structure for GISERA is designed to provide for and protect research independence and transparency of funded research. See gisera.org.au for more information about GISERA’s governance structure, funded projects and research findings.

1
Contents
ACKNOWLEDGEMENTS iv
EXECUTIVE SUMMARY 3
01 THE BRIGALOW BELT 111.1 Biodiversity and
ecological values 15
1.2 Current land use, threats and impacts on biodiversity 18
1.3 Summary of current conservation management 28
02 PROJECT AIMS AND SCOPE 33
03 THE PRIORITY THREAT MANAGEMENT APPROACH 37
3.1 Parameter definition and information collation 37
3.2 Analysis 43
04 PRIORITISATION OF THREAT MANAGEMENT STRATEGIES 47
4.1 Appraisal and ranked management strategies 47
4.2 Strategies required to avoid losses and secure biodiversity 52
05 IMPLICATIONS FOR DECISION MAKING 59
5.1 Using the information in this report 59
5.2 Limitations and future research directions 61
06 CONCLUDING REMARKS 65
07 REFERENCES 69
08 APPENDICES 75Appendix 1: Methodological details 75
Appendix 2: Extended results 90
Sensitivity and uncertainty analysis 90
Results of optimisation 92


3
In this report, we present a costed and prioritised set of feasible threat management strategies for protecting 179 of the most threatened native plant and animal species of the Brigalow Belt bioregion, a highly modified biodiversity hotspot covering 20% of Queensland, Australia. The 12 strategies outlined here were designed through a consultation process with 40 experts and stakeholders in biodiversity and land management of the region, using the best available scientific data and expert knowledge.
We prioritise strategies by their ecological cost-effectiveness, which is the expected improvement in persistence of the imperilled species generated by the strategy divided by its expected cost of implementation over the next 50 years. We assess which combinations of strategies offer the best investment options under limited budgets and provide flexible, rational and repeatable guidance for making management decisions to protect the iconic biodiversity of the region.
The biodiversity of the Brigalow Belt is of national and global significance. This bioregion supports more bird species than any other bioregion in Australia, including the rare glossy black-cockatoo and the red goshawk. It is home to reptiles that occur nowhere else in the world,
such as the golden-tailed gecko and the brigalow scaly-foot, and holds some of the last remaining wild populations of iconic Australian mammals: the bridled nailtail wallaby and the northern hairy-nosed wombat.
The ecological values of Queensland’s Brigalow Belt are under threat due to a myriad of anthropogenic activities. A threat is a process resulting from an activity that puts one or more species at risk of decline or loss. Land clearing and agricultural expansion since the mid 1800s make it one of Australia’s most ecologically transformed areas. Further threats include invasive plants and animals, pollution, changed fire, grazing and hydrological regimes, and climate change. On top of this, the expansion of the coal seam gas industry introduces more
pressure on native species populations in the region.
Within the Brigalow Belt, eight species are extinct, including local extirpations of the eastern quoll and the northern bettong, and global extinctions of species such as the Darling Downs hopping mouse. A total of 147 species and 100 ecological communities are listed as threatened at the Queensland state level. The once dominant brigalow forest, giving the region its name, only covers 5% of its original land area.
Many land managers in the region are working to conserve and protect the significant ecological values of the region. Land management decisions would benefit from a region-wide assessment of threat management options because there are limited resources and efforts to
Executive Summary
Barking owl Ninox connivensinhabits open woodlands. Although it is not currently listed in Queensland, habitat degradation and fragmentation are important threats to this species.
Eric Vanderduys
4
spend on protecting species and habitats. A priority threat management approach has been used successfully elsewhere in relatively intact landscapes (e.g. Kimberley (Carwardine et al. 2011) Pilbara (Carwardine et al. 2014; Chadès et al. 2015) and Lake Eyre Basin (Firn et al. 2015a; Firn et al. 2015b)).
This project applies a priority threat management approach to the Brigalow Belt bioregion and discovers novel and practical strategies to best protect its imperilled species.
The approach involves a review of existing literature, data and methods for conservation decisions in the region and a structured elicitation approach with experts and stakeholders (Carwardine et al. 2012). Much of the information necessary for defining and prioritising threat management strategies was collected at a workshop and follow-up consultations with 40 participants. The participants identified 179 species (102 plants and 77 animals) as ‘imperilled’ based on state and federal legislation and expert knowledge of the likelihood of significant declines over the next 50 years. The participants defined ten
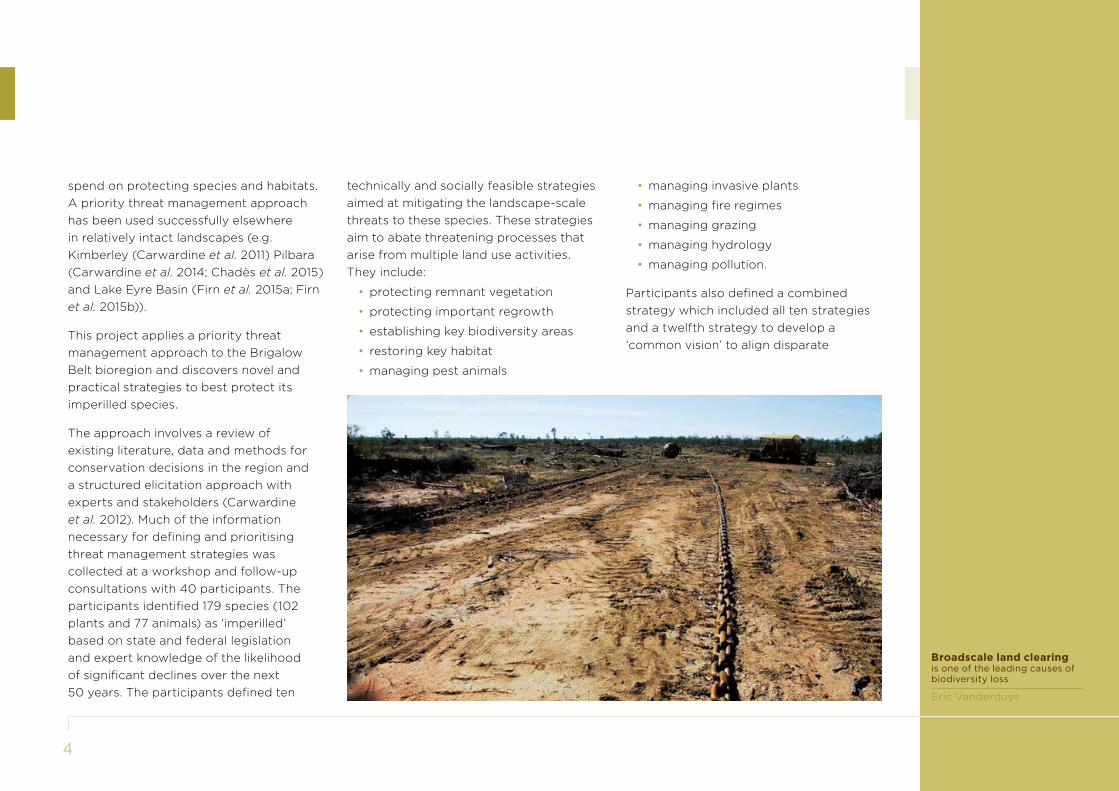
technically and socially feasible strategies aimed at mitigating the landscape-scale threats to these species. These strategies aim to abate threatening processes that arise from multiple land use activities. They include:
• protecting remnant vegetation
• protecting important regrowth
• establishing key biodiversity areas
• restoring key habitat
• managing pest animals
• managing invasive plants
• managing fire regimes
• managing grazing
• managing hydrology
• managing pollution.
Participants also defined a combined strategy which included all ten strategies and a twelfth strategy to develop a ‘common vision’ to align disparate
Broadscale land clearingis one of the leading causes of biodiversity loss
Eric Vanderduys

5
stakeholder values and strengthen conservation in the region.
Participants identified the actions required to implement each strategy and the associated financial costs over 50 years. Given their knowledge of practical management and biodiversity, experts also estimated how feasible it would be to implement each action. Biodiversity experts estimated the likelihood of functional persistence of each species over the next 50 years under a baseline scenario with no management strategies and with the implementation of each strategy, with and without the common vision. We then calculated the ecological cost-effectiveness of each strategy, multiplying its expected benefit (the improved persistence of species under the implementation of the strategy) by the feasibility of the strategy divided by its expected cost over 50 years. In the case that the total budget to implement all strategies is not available, we used a complementarity analysis to assess which strategies present the best investments depending on budgets and targets for species persistence.
Queensland’s bottle tree Brachychiton rupestrisa common emergent tree species in the Bonewood scrub at the former Brigalow Research Station in Central Queensland.
John Dwyer

6
Our key findings are:
• Multiple, cumulative anthropogenic land use activities are threatening the persistence of native species in the region, now and over the next 50 years. Without effective implementation of the strategies recommended in this report, 21 species are likely to be functionally lost from the region over the next 50 years (persistence probabilities < 50%).
• Implementing the suite of management strategies outlined in this report, including the common vision, at an average annualised cost of $57.5 m / year could avert the loss from the region of 12 of these species, including the koala, bridled nailtail wallaby and silver perch.
• In a highly transformed and contested region such as the Brigalow Belt, it was not deemed feasible to halt all threatening processes that impact biodiversity persistence. Even with implementation of all the strategies outlined in this report, nine species including the northern hairy-nosed wombat and the Condamine earless dragon face greater than a 50% chance of functional loss from the region. Species-specific management responses are likely to be required to
Management of fireis one of the most cost-effective strategies.
Eric Vanderduys

7
avoid the functional extinction of these species from the region.
• The biodiversity experts accounted for the cumulative effect of multiple threats when estimating the baseline persistence values and the benefits of the strategies. Native species of the Brigalow Belt were generally less likely to persist than native species in less developed / contested landscapes (Carwardine et al. 2011; Carwardine et al. 2012; Carwardine et al. 2014; Chadès et al. 2015).
• The most cost-effective strategies for improving the overall persistence of imperilled species in the region are the management of fire regimes and invasive plants, at an average annual cost of $0.55 m and $1.53 m respectively. These strategies were ranked first and second for improving the persistence of native plants, animals and all 179 native species combined. Managing hydrology and establishing key biodiversity areas were ranked third and fourth most cost-effective overall.
• Mammals are the most threatened group of species considered. Half of the 14 mammal species assessed are likely to be functionally lost from the region without implementation of
the strategies. Ten of these species could be increased to at least a 50% chance of survival if all strategies were implemented. The most effective strategies for improving the persistence of mammal species were the management of fire and invasive
animals. The management of invasive animals was a relatively expensive strategy ($12.7 m / year), involving a large number of actions. Targeted implementation of a subset of these actions could be undertaken to benefit specific species.
Eastern pebble-mound mouse Pseudomys patrius.Mammals are the most threatened group in the Brigalow Belt.
Eric Vanderduys

8
• The building of a common vision for the Brigalow Belt bioregion (estimated cost of $0.2m / year over 50 years) represented a critically important strategy over the next 50 years. The common vision strategy is expected to increase the feasibility of the others strategies by between 5 and 21%, resulting in improvements in species persistence. Almost every strategy became more cost-effective if it was implemented along with the common vision, indicating that the improvement in expected benefits generated by the common vision outweighed the additional cost of developing the vision.
While we have gathered the best available scientific and expert knowledge in this analysis, uncertainties exist around the estimates of costs, benefits and feasibility of management strategies. However, the cost-effectiveness ranks of strategies were relatively robust to the uncertainty in expert estimates of persistence, with fire management ranked consistently higher than all other strategies.
This study is the first region-wide cost-effectiveness analysis of strategies to improve the persistence of 179
Buffel grass Cenchrus cilliarisis a prominent environmental weed throughout the Brigalow Belt.
Eric Vanderduys

9
threatened species of the Brigalow Belt in Queensland. Priority management strategies for achieving other goals such as improvements in broader ecological values, ecosystem services, agricultural productivity or livelihoods may differ from those results we present. While we attempted to consult a broad and representative group of participants, we were unable to capture the views of all stakeholders due to limitations of time, resources and availability to participate. As such, this report presents an adaptable set of priority strategies for the Brigalow Belt bioregion in which additional information, data values and preferences can be included during decision-making processes.
A broad change in social engagement, collective decision-making and land management was deemed critical for maintaining the biodiversity of the Brigalow Belt over the next 50 years and beyond. Experts considered the prospects for biodiversity in the region are great but only if transformative action can take place over the coming two decades through the building of a common vision for the region. A strongly endorsed
vision supported by key stakeholders, landowners and local governments could ensure that the proposed changes in management are implemented in a framework that values the biodiversity and environmental resources of the region with the same weighting as the current emphasis on production and economics. Such a common vision for the Brigalow Belt could be built at a relatively low cost by harnessing the collective energy and talent in the region and using a number of successful case studies on individual
properties as models to propel change. Stakeholders in the bioregion face significant challenges and opportunities for protecting, rebuilding and shaping a future for the regional biodiversity that represents the needs of the community, industries, native species and ecosystems. We hope to assist in this process by highlighting the key landscape-scale threat management strategies and the importance of a common vision for conserving the Brigalow Belt’s biodiversity.
Carnarvon National Parkencompasses 298,000 ha and 40 regional ecosystems, nine of which are listed as endangered under the Queensland Vegetation Management Act 1999.
Rocío Ponce Reyes

Figure 1 The Brigalow Belt bioregion in Queensland and the remnant and cleared vegetation
10
IBRA* Brigalow Belt North
IBRA* Brigalow Belt South
Surat and Bowen Basins
*Interim Biogeographic Regionalisation for Australia
Remnant vegetation
Mature regrowth
Non-remnant vegetation
Water
kilometres
Townsville
Brisbane
RomaChinchilla
Toowoomba
0 200

11
The Brigalow Belt bioregion in Queensland is a biodiversity hotspot that is flanked by coastal tropical rainforests to the east and the arid and semi-arid wooded grassland interior of central Queensland to the west. It is broadly split into two regions: the Brigalow Belt North has a semiarid to tropical climate and a predominantly summer rainfall; while the Brigalow Belt South, 20% of which occurs in New South Wales, has a sub-tropical climate and a summer dominant rainfall (Figure 1). The Brigalow Belt North is located entirely in Queensland and covers an area of 13.7 million ha with a population of 44,000, predominantly based on larger settlements. The Brigalow Belt South in Queensland covers over 21.6 million ha, and it is inhabited by approximately 324,000 persons (Australian Bureau of Statistics 2013).
The Brigalow Belt is named after the Aboriginal word ‘brigalow’, describing the region’s dominant tree species (Acacia harpophylla) which are characterised by silver foliage and grow up to 25 metres in height, forming extensive open-forest communities. Brigalow forests grow on relatively fertile soils, so were cleared for agricultural development during the mid-19th century (Accad 2001, Johnson 1976) (Figure 1). Since European settlement in the 1840s an estimated 7 million ha of brigalow forest has been cleared and the remaining 600,000 ha is found in small, isolated and often linear
fragments (Dwyer et al. 2009). Remnant brigalow forests are now protected as endangered ecological communities (Ngugi et al. 2011) under Australia’s Environment Protection and Biodiversity Conservation Act 1999 (EPBC Act 1999), and as an endangered regional ecosystem under the Queensland Vegetation Management Act 1999 (VM Act 1999).
The vast majority of the Brigalow Belt bioregion is currently used for pastoralism and other more intensive agricultural practices (Figure 2). This bioregion also coincides with the Bowen and Surat
geological basins (Figure 1), key basins for the expanding energy industry. Native vegetation now covers 15 m ha (42%) of the region, including 1.8 m ha (5%) of regrowth (Figure 1). The region has a relatively low representation in the national protected area estate, with no Indigenous protected areas and just 2.3% of the Brigalow Belt North and 4.5% of the Queensland part of the Brigalow Belt South are protected (Figure 2).
The Brigalow Belt bioregion was originally managed by Traditional Owners whose management practices included burning.
01 The Brigalow Beltvalues, threats and conservation


13
Figure 2 Land cover and land use in the Brigalow Belt
Isla Gorge National Parkin Central Queensland Sandstone Belt was established as National Park in 1964 due to its outstanding scenery and rich plant life
John Dwyer
National Parks and conservation areas
Production from dryland agriculture and plantations
Prdocution from irrigated agriculture and plantations
Production from relatively natural environments
Intensive uses
Water
Native Title
kilometres
Townsville
Brisbane
RomaChinchilla
Toowoomba
0 200

14
The Traditional Owners of the region hail from a diversity of Indigenous language groups, predominantly from the Northeast and Riverine regions (Horton 1996). The region remains important for Indigenous culture, with 3.3 m ha under native title, mostly covering pastoral land and some
conservation areas. Numerous heritage sites are found in the region, examples include the Art Gallery and the Cathedral in Carnarvon National Park and Moonda Gudda in the Blackdown Tableland National Park.
The first European settlers arrived in the region in the 1840s, leading to changes from Indigenous land management practices. The most significant landscape transformations occurred during the 1950s-1960s, when government policy and the use of new technology facilitated the clearing of the fertile brigalow forests. The federal and state governments established the Brigalow and Other Lands Development Scheme, which provided infrastructure, financial assistance and a block of bushland to new settlers, many of whom were soldiers returning from the Second World War (Seabrook et al 2006). The settlers were expected to clear their land and establish a farm within 15 years to contribute to productivity increases in central Queensland. The amount of native vegetation cleared under the Scheme was estimated to be 4.4 m ha (Bureau of Agricultural Economics 1963).
Land clearing of native vegetation on the fertile clay soils in the Brigalow Belt bioregion continued in the following decades. Remnant vegetation legislative protection began with the Land Act 1994, followed by the more stringent Vegetation Management Act 1999, and by 2006
Long-legged worm skink Anomalopus mackayiis listed as endangered under the Queensland’s Nature Conservation Act 1992, as vulnerable under the EPBC Act and as a high conservation priority under Back on Track. The habitat of this skink is eucalypt open woodland and low open grassland. Unfortunately, very little natural vegetation remains in good condition in the known range of this skink due to overgrazing, clearance of vegetation for agriculture and grazing, soil compaction and erosion and loss of ground litter.
Eric Vanderduys

15
broadscale clearing of remnant vegetation was banned. Queensland, by 2009, was also protecting endangered secondary vegetation (regrowth), including brigalow forests, through the Vegetation Management (Regrowth Clearing Moratorium) Act 1999. The amount of land clearing in Queensland was significantly reduced during 2006–2011. With the establishment of the Vegetation Management Framework Amendment Act in 2013 the protection of high-value regrowth on freehold and Indigenous land was removed and broadscale land clearing for agriculture was permitted. Clearing for the mining and coal seam gas (CSG) industries and their associated activities and infrastructure is regulated by the Mineral Resources Act 1989 and the Petroleum and Gas (Production and Safety) Act 2004 and allowed as an incidental activity for the construction or operation of CSG facilities (including prospecting and pipelines). However when threatened species or communities are concerned, it is regulated by the EPBC Act, Nature Conservation Act 1992 and is subject to the Queensland Environmental Offsets Act 2014.
1.1 Biodiversity and ecological values
The Brigalow Belt is a unique environment, being located in a transition zone between coastal and semi-arid zones and between tropical and temperate climates. It is recognised by the Australian Government as a biodiversity hotspot, particularly for faunal species. The Brigalow Belt bioregion supports an exceptionally high number of resident bird species (492), which represents the highest bird diversity of any bioregion in Australia. Some of the common woodland birds in the region are the mallee ringneck (Barnardius zonarius), brown treecreeper (Climacteris picumnus), spotted bowerbird
(Chlamydera maculata), grey-crowned babbler (Pomatostomus temporalis), inland thornbill (Acanthiza apicalis) and several species of honeyeaters. The region also contains important habitat for rare and threatened species including the glossy black-cockatoo (Calyptorhynchus lathami), the black-throated finch (Poephila cincta cincta) and the red goshawk (Erythrotriorchis radiatus).
The Brigalow Belt is home to at least three species of reptiles that do not occur anywhere else in the world: the golden-tailed gecko (Strophurus taenicauda as shown on the front cover), the brigalow scaly-foot (Paradelma orientalis) and the retro slider (Lerista allanae). For many of
Brown treecreeper Climacteris picumnusis the largest Australasian treecreeper. They are found in the drier open forests and woodlands. Although they are not listed for conservation, these birds are threatened by land clearing and competition with invasive species, like the noisy miners.
May-Le Ng

16
the Brigalow reptile species there is little data on populations and many have very restricted distributions — in some cases, such as the retro slider (see page 55), just a few square kilometres – often separated by unsuitable habitat. Other threatened reptiles in the region include the yakka skink (Egernia rugosa, see page 64) and the common death adder (Acanthophis antarcticus).
The Queensland Brigalow Belt bioregion is home to the last naturally occurring population of the endangered bridled nailtail wallaby (Onychogalea fraenata, see page 53) at Taunton National Park and the only remaining wild population of the critically endangered northern hairy-nosed wombat (Lasiorhinus krefftii) at Epping National Park. Other imperilled mammals that occur in the Brigalow Belt bioregion include koalas (Phascolarctos cinereus), gliders, dunnarts, wallabies and bats. At least two species of mammals are totally extinct, the white-footed rabbit-rat (Conilurus albipes) and the Darling Downs hopping mouse (Notomys mordax); while the brush-tailed bettong (Bettongia penicillata) is extinct in the wild. Five other mammal species have been regionally
Northern spadefoot toad Notaden melanoscaphusknown to occur in woodlands and open forest in northern Australia. Although this species is not listed, the Townsville population is considered as locally significant.
Eric Vanderduys

17
extirpated from this bioregion in the last 200 years – the bilby (Macrotis lagotis), eastern quoll (Dasyurus viverrinus), northern bettong (Bettongia tropica), boodie (Bettongia lesueur), and western quoll (Dasyurus geoffroii).
The silver perch (Bidyanus bidyanus) is listed as critically endangered while three other freshwater fish, specifically the sawfish (Pristis microdon), the Australian lungfish (Neoceratodus fosteri) and the Murray cod (Maccullochella peelii peelii), are listed as vulnerable (EPBC Act 1999).
The Brigalow Belt bioregion is home to many plant species endemic to Australia including its namesake brigalow trees. Other important vegetation types in this region are alluvial open eucalypt woodlands (dominated by poplar box (Eucalyptus populnea); coolabah (E. microtheca) and Queensland bluegrass grasslands (Dicanthium sericeum)) (Queensland Herbarium, 2004). In the sandy ridges and plains the predominant species are cypress pine (Callitris spp.), bulloak (Allocasuarina luehmannii) and silver-leaved ironbark (E. melanophloia). In the north and east of the region,
vegetation is mainly dry eucalypt woodland comprising ironbarks (E. crebra and allied species) and spotted gum (Corymbia citriodora) occurring on skeletal soils (Seabrook et al. 2006).
Threatened Ecological Communities in the region include: ‘Brigalow (Acacia harpophylla dominant and co-dominant)’; ‘Semi-evergreen vine thickets of the Brigalow Belt (North and South) and Nandewar Bioregions’ (SEVT); and ‘Natural Grasslands of the Queensland Central Highlands and the northern Fitzroy Basin’. These threatened communities are listed under the EPBC Act 1999 and are cleared to 5-15% of their original extent. The key processes threatening these communities include cultivation, commercial livestock grazing and associated management, including sowing of exotic pasture grasses (Fensham 1998, 1999). Plant species listed as threatened under the EPBC Act 1999 and / or the Queensland Nature Conservation Act 1992 include: Cyperus clarus, Dichanthium queenslandicum, Digitaria porrecta, and Trioncinia retroflexa; Desmodium campylocaulon, Picris evae, Thesium australe and Dichanthium sericum.
Rough tree fern Cyathea australis
Rocío Ponce Reyes

18
In the following sections we describe the known threats faced by the ecological communities and species of the Brigalow Belt bioregion and current conservation efforts. We then provide a rationale for a threat management prioritisation approach that, if implemented, will aid in the recovery and persistence of imperilled species in the Brigalow Belt bioregion.
1.2 Current land use, threats and impacts on biodiversity
The Brigalow Belt is one of the most transformed regions in Australia (Butler 2009) and its biodiversity has been negatively impacted by many anthropogenic activities that produce cumulative impacts on biodiversity. For example, clearing native vegetation for pastoral activities, mining, urban developments and more recently for the development of the coal seam gas industry. Other threats to the biodiversity of the Brigalow Belt bioregion are invasive species, changes to hydrology and fire regimes, pollution, and climate change (Ferrier et al. 2012). Many of these threats
Mook Mook lookout at Blackdown Tableland National Parkin Central Queensland. The Blackdown Tableland rises abruptly from the plains below to 600 m, providing of spectacular views.
Rocío Ponce Reyes

19
are not only cumulative but are likely to have compounding effects (Mantyka-Pringle et al. 2011). Cumulative impacts can be positive or negative and they can vary in intensity and extent (spatial and temporal) (Frank et al 2010). The following section provides a brief description on how each of the key threats impact upon biodiversity in the region.
Grazing
Livestock grazing, primarily wool production, was one of the first significant threats to biodiversity imposed by European settlers in the Brigalow Belt (Nix 1994). Currently, about 80% and 90% of the southern and the northern parts of the bioregions, respectively, is grazed by cattle and sheep (Bastin & ACRIS Management Committee 2008).
Grazing by livestock impacts biodiversity through a range of habitat changes, such as the direct removal of trees to promote grass growth. It also changes the structure and species composition of the understory grasslands themselves, including the loss of perennial tussock grasses in favour
of exotic annuals. These structural and compositional changes in the vegetation lead to altered habitat for fauna that use the vegetation for foraging, breeding and shelter (Martin & McIntyre 2007). Soil compaction and erosion, and degradation of riparian habitats are common impacts from grazing. Altered populations of native herbivores (kangaroos and wallabies) and naturalised introduced herbivores such as goats, donkeys, deer and horses also contribute to grazing pressure.
Cultivation of arable crops
Clearing for cropping in the Brigalow Belt began during the 1870s, once overgrazing of palatable grass reduced the potential for grazing sheep in areas of the region (Seabrook et al. 2006). The main agricultural crops produced in the Brigalow Belt bioregion today are wheat, cotton and sorghum. Cropping was generally limited to the eastern part of the Darling Downs. Agricultural growth was initially limited because produce was difficult to transport and the domestic market was small. Between the 1950s and 1990s, the federal and state governments
actively promoted human settlement in and clearing of the natural brigalow landscape to enable agricultural expansion (Lindenmayer & Burgman 2005).
Brigalow forests are generally associated with cracking clay soils that are high in salt content and, once cleared, the soils become less fertile (Dwyer 2007). Several hypotheses could explain this fertility loss. Brigalow trees are able to fix nitrogen from the atmosphere, thus once removed, nitrogen inputs are disrupted. High productivity pastures or crops replace the cleared forests and may act to lock up more nutrients from the soil with accelerated nutrient cycling. Annual cropping systems are also less efficient at capturing water with the consequence that the water table rises in the soil profile, mobilising salts and further increasing the already high salt content. Therefore once Brigalow communities are removed, soil fertility declines and this is more accelerated in cropping systems than in pastures (Dwyer 2007).

20
Coal mining
During 2013-14, Queensland contributed more than 85% of coal produced in Australia (Queensland DNRM 2015). The largest coal reserve in Australia is located within the Brigalow Belt’s Bowen Basin. Currently, 29 open-cut and 12 underground coal mines are operating in the Bowen Basin while two new coal mines are under construction and 13 new leases have been approved or
are undergoing the approval process (Queensland DNRM 2015).
Coal mining involves the removal of large volumes of overlying strata called ‘spoil’ to extract the coal seams at depths of up to 200 metres (Queensland DNRM 2015). Negative impacts of coal mining include habitat loss and fragmentation due to the destruction of all vegetation cover and underlying soils; modification of landscape structure, especially by mounding the spoil in relatively flat country and
alteration to ground and surface water (e.g. increased use of water, changes in stream connectivity, introduction of pollutants and potentially increased salinity and turbidity (Kaye 2012)). Other impacts of coal mines include dust, noise, vibration, light pollution, soil erosion, road construction and vehicle strikes with wildlife and facilitation of the establishment of invasive plant species (see Bridge (2004) for a review).
Sorghum cultivationhas been actively promoted by state and federal governments
Rocío Ponce Reyes

21
The Australian and state governments require the rehabilitation of land disturbed by any mining activities (Queensland DEHP 2012) to provide safe, stable, and non-polluting ecosystems (Australian Government 2006). Mine site rehabilitation in Queensland to date has involved the establishment of bushland or monocultures such as exotic buffel grass (Erskine & Fletcher 2013).
Coal Seam Gas industry development and associated infrastructure
Coal Seam Gas (CSG) development is an emerging and expanding activity in the already disturbed and highly contested Brigalow Belt bioregion of Queensland. The production of CSG involves pumping groundwater from coal seams (at depths of 300–1000 metres) to the surface, sometimes with the assistance of high-pressure hydraulic fracturing to release gas (for more detail, see CSIRO (2012); GISERA (2014b); Moore (2012)). In 2010, CSG production represented 10% of Australia’s natural gas production and this figure is growing rapidly, fuelled by export
demands (Williams et al. 2012a). The Bowen and Surat basins (Figure 1) contain almost two-thirds of Australia’s known CSG reserves. CSG infrastructure and transport in the region consists of wells, gas and water plants, storage facilities, roads and pipelines to the LNG plant on Curtis Island.
The CSG industry adds to existing threatening processes in the region, such
as clearing and fragmentation of native vegetation, increased invasive species and fire risk and changes to the hydrology of groundwater-dependent ecosystems (for more detail, see Kaye (2012); Northrup and Wittemyer (2013); Tan et al. (2015); Williams et al. (2012a)). Even though the land clearing and water extraction related to the CSG industry is predicted to be smaller than the historical impacts from agriculture and / or urban development,
Coal Seam Gas pipelineinfrastructure and associated vegetation clearing
Sean Lowry

22
further use of an already highly transformed region can have significant impacts on biodiversity (Williams et al. 2012a). Existing declines in the density and distribution of amphibians, reptiles, birds and medium to large mammals are likely to be exacerbated by road strikes (Taylor & Goldingay 2010), noise disturbances (Laurance 2015; Ware et al. 2015), increased predation (Doherty et al. 2015;
Graham et al. 2012; Richardson et al. 1997), and aggressive noisy miners (Manorina melanocephala) (Maron and Kennedy 2007; Maron et al. 2013) arising from CSG development. The water extraction and treatment process may impact on ‘The community of native species dependent on natural discharge of groundwater from the Great Artesian Basin’, a threatened ecological community (TEC) found at
the Springsure, Eulo and Bourke Spring groups (Fensham et al. 2010; Water Group 2010).
Development projects, including CSG developments across Australia, are now legally regulated to avoid, rehabilitate and offset damages (Maron et al. 2015). However, being a relatively recent and rapidly developing industry, the long-term impacts of the CSG industry on biodiversity remain largely unquantified, with no comprehensive peer-reviewed studies yet in Australia (see Northrup and Wittemyer (2013) and Williams et al. (2014) for a review). The effectiveness of mitigation strategies are not always fully understood nor measured in relation to cumulative impacts at a landscape scale (Williams et al. 2014). Biodiversity offset projects are challenging to implement successfully and there is typically a time lag until suitable habitat is created (Sonter et al. 2014), which can result in the loss of dependent species (Gardner et al. 2013; Maron et al. 2012; Miller et al. 2015; Vesk et al. 2008). Improved knowledge of the impacts of CSG on biodiversity may lead to changes in mitigation strategies.
Noisy miners Manorina melanocephalaaggressively exclude other birds from their territory.
Eric Vanderduys

23
Changes to hydrology and pollution
The major rivers in the Brigalow Belt bioregion are the Fitzroy, Belyando and Burdekin which flow eastwards towards the coast; while the Maranoa, Warrego and Condamine rivers flow west into the Murray-Darling basin. The ecosystems of the Brigalow Belt are characterised by unique climatic zones, edaphic conditions and complex hydrology (Lloyd 1984). Changes to water quality and hydrology in the bioregion, therefore, have significant impacts on flora and fauna. Agriculture, the mining and CSG industries, road construction and urban development contribute to water pollution through soil erosion and sedimentation, nutrient runoff, and the potential release of saline water, chemicals or treated water (Roth et al. 2002).
Changes to hydrology in the region may arise through the extraction and re-deposition of groundwater for the resources and agricultural industries. The removal of water in large quantities has the potential to impact groundwater levels and flow in surrounding aquifer
systems and cause surface subsidence in some locations (GISERA 2014a). Reduced groundwater levels have the potential to impact the discharge at spring complexes, which could lead to the loss of some complexes and the species that depend on them. Water extraction, in conjunction with the changes in hydrology due to the clearing of mature brigalow forest, could result in widespread secondary salinisation throughout the Brigalow Belt, especially because of the already high salt content in the soil (Webb 1984).
The cumulative impacts of dams, including weirs, off-river storage and diversion
practices, reduces the frequency and volume of flows to floodplains (Kingsford 2000). These alterations to flow regimes present a significant threat to biodiversity in the Brigalow Belt, impacting on riverine and floodplain flora and fauna. Floodplains in the Brigalow Belt are in locations characterised by extraordinary amounts of biodiversity and are dependent on flows from rivers. In addition, artificial watering points extend the range of and increase the numbers of cats, foxes and pigs which pose further threats to native species (James et al. 1999).Rail train
used to transport coal from mines to the port.
Rocío Ponce Reyes

24
Invasive animals
Invasive animals have devastating impacts on Australian fauna. The Australia-wide decline in small to medium size mammals is attributed largely to predation by feral cats and foxes (Legge et al. 2011; Woinarski et al. 2015). Extensive grazing of the Australian landscape, made
possible by the provision of permanent water sources like dams and bores, has contributed to the expansion of populations of pest species in the last few decades. Invasive animals in the Brigalow Belt include feral pigs, rabbits, cats, dogs, foxes, deer (Butler 2008) and the native but invasive honeyeater, the noisy miner. A single feral cat can kill between five and
30 animals in one night (see Legge et al 2011). The native predators which depend on small mammals, reptiles, amphibians and birds for their food source are also negatively impacted. Feral herbivores, such as goats, deer and rabbits compete with native wildlife, damage vegetation and degrade soils.
Cats Felis catuskill small native animals and compete with native predators.
Eric Vanderduys

25
Invasive plants
Some invasive plant species have drastically altered the plant species composition and the structure of native vegetation (Grice 2006), which affects the habitat quality for animals that rely on these vegetation communities. Currently Weeds Australia (weeds.org.au accessed on June 2nd 2015) has recorded 163 and 227 invasive plant species in the Brigalow Belt North and Brigalow Belt South bioregions respectively, 50 of which are considered to have a significant impact or potential impact (Martin et al. 2006). One of the first recorded invasive plants in the BBS was prickly pear (Opuntia spp.), which was originally brought to Australia for the development of the cochineal dye industry and introduced into domestic gardens in the 1860s. By the 1890s, the prickly pear was found throughout many of the brigalow forests in the south of the bioregion (Dodd 1940). Prickly pear was a survivor of the 1901-02 drought, and was spread due to the practice of feeding it to livestock (Seabrook et al. 2006). By 1926 prickly pear had invaded 55% (12 million hectares) of the Brigalow Belt South, but
ceased to be a significant problem by 1934 due to biological control by the moth, Cactoblastis cactorum (Dodd 1940).
Pasture grasses, such as buffel grass and African lovegrass (Firn 2009), are now the most threatening invasive plant species in the region. They displace native plant species such as forbs and
reduce forage availability for native herbivores, like the bridled nailtail wallaby (Butler 2008). Buffel grass is a robust perennial of variable morphology. It has a deep and extensive root system and is resilient to grazing, burning and drought. It responds rapidly to rainfall and seeds prolifically. These traits mean that buffel
Buffel grass Cenchrus ciliarisspreads quickly and can dominate.
Eric Vanderduys

26
grass can spread quickly and dominate the herbaceous vegetation in some land types, although these capacities vary between varieties and ecosystems (Fairfax & Fensham 2000; Franks 2002; Jackson 2005; Eyre et al. 2009). Unlike native tussock-forming grasses, buffel grass forms continuous swards of high biomass grass, creating ideal conditions for fire. The increase in fire frequency further enhances suitability for buffel grass establishment and spread, creating ideal conditions for this commercially valuable but invasive species (Martin et al. 2012).
Fire
Altered fire regimes are an increasing threat in the Brigalow Belt. According to Nix (1994) in pre-European times, fire was rare in mature brigalow forests due to very sparse grass cover. Only relatively small portions of the Brigalow Belt bioregion were burnt in most recent years (between 3 and 5.5% over the past 20 years) (Bastin & ACRIS Management Committee 2008). However, fire risk is predicted to increase due to the widespread exotic grass species invasions, particularly buffel grass (Dwyer et al. 2010). The high productivity
of buffel grass compared with native plant species in Australian ecosystems means it can reach high biomass in low nutrient soils and low and pulsed rainfall, resulting in detrimental alterations to natural fire regimes (Butler & Fairfax 2003; McDonald & McPherson 2013; Schlesinger et al. 2013).
In addition, climate change is causing increased temperatures and lower and altered rainfall patterns in the Brigalow
Belt, contributing to the dominance and spread of high productivity exotic pasture grasses like buffel grass. Together these changes increase the incidence of high-intensity fires in the region, resulting in widespread alteration of landscapes, a loss of floral and faunal diversity, and impacts on Indigenous culture (Butler & Fairfax 2003; Woinarski et al. 2004; Miller et al. 2010; McDonald & McPherson 2013; Schlesinger et al. 2013).
Altered fire regimesare an increasing threat.
Eric Vanderduys

27
Climate change
The climate is changing globally at an unprecedented rate due to industrialisation and the resultant increase in atmospheric greenhouse gas concentration (IPCC 2007a). Substantial changes can be expected in natural and human-altered systems driven by rising atmospheric CO2, ocean acidification, increasing temperatures, declining rainfall, altered rainfall patterns, altered oceanic currents and changed disturbance regimes (IPCC 2007b). These will result in shifts in species distributions, changes in interactions between species and species extinctions or appearance of novel ecosystems (Ferrier et al. 2012). Terrestrial regions of Queensland have warmed more than the Australian average in the last 50 years. Over the same period, rainfall has declined significantly across the central and coastal regions of the state (Williams et al. 2012b). Climate change can act additionally to existing pressures on already stressed ecosystems, and interacts with disturbance regimes (such as altered fire regimes), land use change, water extraction, pollution, over harvesting, habitat degradation,
disease and pathogens, eutrophication, invasive alien species and other agents of change. This can create rapid ecosystem transformations and reduce the supply of familiar ecosystem goods and services (Williams et al. 2012b). For example, a global assessment by Mantyka-Pringle et al. (2011) revealed habitat loss and fragmentation effects on fauna and flora have been greatest in regions with high maximum temperatures. Conversely, they were lowest in areas where average rainfall has increased over the past 100 years. A recent priority threat management study of the threats presented by invasive animals in the Lake Eyre Basin found that considering climate change impacts increases the number of strategies needed to be implemented to secure threatened flora and fauna (Firn et al 2013, 2015a, 2015b).
While activities in the region such as cattle grazing and energy production contribute to climate change, we did not attempt to directly address climate change through landscape-scale threat management actions. However, the experts and stakeholders brought together during the workshop, who live and work within
Climate changeis predicted to increase temperature, decrease rainfall and increase the frequency and severity of extreme events like droughts and cyclones. Fire risk is expected to increase as a consequence of climate change.
Rocío Ponce Reyes

28
the region’s variable climates, were asked to consider climate variability in their estimates of cost, feasibilities and biodiversity benefits.
1.3 Summary of current conservation management
Current conservation management within the Brigalow Belt bioregion occurs through federal and state government initiatives, non-government organisations (NGOs), Indigenous land managers, private landholders, community groups and industries (McAlpine et al. 2011). The region’s 29 national parks are managed by the Queensland Government through the Department of National Parks, Sport and Racing. The largest of these include Carnarvon National Park (2,948 km2), Expedition National Park, Barakula State Forest, Oakvale State Forest and Blackdown Tableland National Park. There are also four Conservation Parks and one Resource Reserve that protect brigalow ecosystems (ehp.qld.gov.au) and several state forests that are managed primarily for nature conservation by
Carnarvon National Parkis arguably the best known of the Brigalow Belt’s national parks.
Rocío Ponce Reyes

29
the Department of Natural Resources and Mines (nrm.qld.gov.au). The National Landcare program (nrm.gov.au), financed by the Australian Federal Government, supports the protection, conservation and rehabilitation of the natural environment in Australia as well as encouraging sustainable agriculture. It aims to achieve an environment that is healthy, better protected, well-managed and resilient, and provides essential ecosystem services in a changing climate through funding Natural Resource Management (NRM) to improve biodiversity and farm practices. Eight NRM regions include parts of Queensland’s Brigalow Belt bioregion: Queensland Murray-Darling Committee, NQ Dry Tropics NRM, Burnett Mary Regional Group, Condamine Alliance, Desert Channels Queensland, Fitzroy Basin Association, SEQ Catchments, South West NRM.
Amongst the state initiatives aimed at conservation of Queensland’s biodiversity is ‘Back on Track’ (BoT), a species-based prioritisation to guide management jointly funded by the Queensland and Australian governments. This initiative prioritises Queensland’s native species for
conservation management and recovery, to support informed decision-making and assist with the strategic allocation of limited resources by NRM bodies and communities. Back on Track has six stages based on Marsh et al. (2007):
1 identify the priority threatened species for each NRM region in Queensland
2 collate regionally specific information
3 gather local expertise and knowledge of threats and actions to achieve species recovery through workshops
4 research post workshop and develop action documents and consultation
5 produce the Regional Actions for Biodiversity document
6 implement and review.
The Actions for Biodiversity documents provide conservation priorities and suggested recovery actions for the species in each of the 14 NRMs in Queensland (ehp.qld.gov.au/wildlife/species-recovery). BoT findings have been used to develop two cross-regional plans (‘Enhancing Biodiversity Hotspots along Western Queensland Stock Routes’ and ‘Bringing Back the Beach Scrub’) and to inform research priorities for threatened species, legislative
Cat fencebuilt to protect young bridled nailtail wallabies at Avocet Nature Reserve.
Rocío Ponce Reyes

30
listings and recovery plans. ‘Back on Track’ is a framework that prioritises species, but it is not a cost-effective prioritisation approach, as it does not integrate information on the costs of conservation strategies or the expected benefits of implementing strategies on species persistence, in order to prioritise them.
Land owners and managers play a vital role in conserving the natural assets of the Brigalow Belt region by managing their land for biodiversity. Indigenous land managers are managing landscape-scale threats on National Parks through collaborations with NRM groups, NGOs, industries and Australian and Queensland Government programs. For example, Traditional Owners carry out weed and fire management across different land tenure types through the Indigenous owned company ‘Yukenbulla’. Many private land holders have established a nature refuge on their properties. The Nature Refuges Program (ehp.qld.gov.au/ecosystems/nature-refuges/
the_nature_refuges_program.html) is the primary voluntary conservation covenanting program from the Queensland Government through the Department of Environment and Heritage Protection
Remnant patch of mature brigalowkept as a bridled nailtail wallaby nursery inside the cat fence in the Avocet Nature Reserve.
Rocío Ponce Reyes

31
(EHP) that assists landholders in their conservation efforts. This program is delivered by the Nature Assist Staff from EHP, who assesses the land’s conservation values and considers the significance of the potential nature refuge at a property, landscape and strategic level.
Biodiversity offsets are voluntary or mandatory investments in conservation management that attempt to redress unavoidable clearing or other biodiversity impacts. For example, Origin Energy through their offset program manages about 8,000 ha of brigalow vegetation and semi-evergreen vine thicket, and a 190 ha property with suitable habitat for cycads has been established. The federal government’s Significant Impact Guideline (Biodiversity Integration and Offsets – Ecosystem Outcomes 2014) determines whether an environmental offset is required due to the significance of the residual impact from a prescribed activity. A valid offset provides additional benefits to biodiversity above what would have happened without the impact or without the offset (Maron et al 2015). The offsets can be delivered as financial settlement offsets, proponent-driven
offsets or as a combination of both. A financial settlement offset is a payment for a significant residual impact of the prescribed environmental asset, while proponent-driven offsets are land-based offsets and / or delivery of actions in Direct Benefit Management Plans. The ‘Direct Benefit Management Plan offsets’ offer pre-approved packaged investments that outline priority actions to address specific threats and provide substantial benefits for particular natural assets.
Several NGOs such as Bush Heritage, Greening Australia and the World Wide Fund for Nature (WWF) are working in the area. Bush Heritage works with Indigenous managers, farmers, pastoralists and other conservation organisations to identify conservation threats, plan strategies, source funding and develop skills and resources needed for the long-term sustainability of the country. Bush Heritage has two reserves in the Brigalow Belt: Carnarvon Station Reserve and Goonderoo Reserve. The 60,000 ha Carnarvon Station Reserve protects critical habitat for ten listed species including the northern quoll. The key management strategies in the
Carnarvon Station Reserve are livestock exclusion and cessation of clearing and cultivation, fire management to prevent large bushfires and control of key invasive species such as buffel grass and feral herbivores. Goonderoo is a 593 ha reserve that provides refuge for endangered species such as the bridled nailtail wallaby, bandicoots, bettongs, squatter pigeons and koalas and vegetation communities such as the brigalow shrublands, bluegrass grassland and poplar box woodlands.
Greening Australia together with the Fitzroy Basin Association and Australia Pacific LNG are collaborating to locate and protect nest eggs of the vulnerable Fitzroy River turtle (Rheodytes leukops) from predators. WWF and the Queensland Brigalow Belt Reptile Recovery Team developed a multi-species recovery plan to address the protection and threat management of 16 endangered reptile species of the Brigalow Belt. This plan is currently awaiting signoff from the state and federal governments and, once approved, will be implemented by the Queensland Murray Darling Committee.


33
This project aims to provide a rational and transparent approach to guide cost-effective investment in threat management for protecting the imperilled species of Queensland’s Brigalow Belt. We used empirical data and expert judgements to estimate the costs and the expected benefits of conservation strategies to improve the persistence of the Brigalow’s flora and fauna. Our study builds on previous similar approaches that use cost-effectiveness analysis to prioritise conservation management options (Possingham et al. 2002; Joseph et al. 2009; Carwardine et al. 2011; Carwardine et al. 2012; Pannell et al. 2013; Firn et al. 2015a; Firn et al. 2015b). The range of feasible conservation strategies that we evaluate here are aimed at minimising the impact of multiple threats to threatened native fauna and flora of the Brigalow Belt bioregion.
Our approach appraises conservation management strategies by integrating estimates of their costs, feasibilities and benefits to threatened biodiversity in a rational, transparent and systematic manner.
Specifically the project aims to:
• define a list of the most threatened flora and fauna species (species of concern) that are important for sustaining key ecological values of the Brigalow Belt bioregion.
• develop a set of costed management strategies that minimise the threats to Brigalow Belt species of concern.
• provide information on prioritisation of the most cost-effective threat management strategies for conserving species and the combinations of strategies that are optimal for protecting species under a range of limited budget scenarios.
• supply recommendations and information that are useful for a range of decision makers.
• ensure the approach can be updated with, or inform analyses which consider information outside that used in this analysis.
02 Project aims and scope
LeftThe koala Phascolarctos cinereusis listed as vulnerable under both the EPBC and under Queensland’s Nature Conservation Act 1992. They can be found in open forests and woodlands. The biggest threat to koalas is habitat loss followed by death from car hits, disease and dogs.
Eric Vanderduys
RightOoline Cadellia pentastylisis listed as vulnerable under both the EPBC and under Queensland’s Nature Conservation Act 1992, and as critical under the Back on Track framework. It grows on moderately fertile soils that are also suited to agriculture or pastures and therefore it has been subjected to extensive clearing.
John Dwyer

34
We acknowledge that many factors other than the needs of threatened species come into play in conservation decision-making. In particular, we recognise the great importance of the priorities of local land owners and users, including Indigenous people, pastoralists and the mining sector. However, we were unable to collect and analyse comprehensive information on the knowledge, preferences, social considerations and cultural values of these groups as a full stakeholder engagement process was outside the scope of this project.
Our specific focus is on 77 threatened fauna species and 102 threatened flora species. We quantify the potential benefits for biodiversity in the region if the most pressing threats were managed. It is also likely that our results present a best case scenario in terms of the potential for species losses without effective strategies. Future threats such as climate change may compound the effects of the current threats evaluated in this report.
The intent of this document is to provide usable information on the priority of
strategies based on their ecological cost-effectiveness, not to promote a particular management decision. We envisage this information will be useful to support decision-makers (government and non-government conservation agencies, Traditional Owners, mining companies, pastoralists and others) as they plan and implement threat management strategies for conserving the Brigalow Belt’s unique biodiversity.
LeftLand clearinghas a major impact on biodiversity.
Eric Vanderduys
RightThe Cathedral Cave in Carnarvon National Parkwas occupied about 3,500 years ago for the first time. It is suggested this cave was used as a temporary outstation shelter for people who carried food (grey kangaroos and Macrozamia shells) from far away. The wall is painted with one of the largest and most spectacular rock art galleries in Queensland (Beaton 1991).
Rocío Ponce Reyes


37
3.1 Parameter definition and information collation
Applying a threat management prioritisation approach to appraise conservation strategies in Queensland’s Brigalow Belt requires the collation of existing information from the published and grey literature and through extensive consultation with experts and stakeholders.
The process we followed has seven stages:
1 literature review and development of a database to identify the threatened vertebrate species and plants of the Brigalow Belt in Queensland.
2 identification of stakeholders and experts; initiation of engagement
3 definition of the parameters for the prioritisation approach
4 identification of management strategies
5 estimation of the costs, expected benefits and feasibility of each of the strategies
6 analysis and reporting
7 guidance on stakeholder engagement and pathways to ensure the approach is useful to decision makers and managers.
A large part of the data for this project was compiled during a three day workshop (Brisbane, October 2014).
At the commencement of the project, potential participants were identified based on their expected ability to contribute to the range of data required. Potential experts included landholders, Indigenous representation, park managers, non-government organisations (e.g. WWF), universities (University of Queensland, Queensland University of Technology, Griffith University, Central Queensland University and University of Southern Queensland), CSIRO scientists, employees from the Commonwealth Department of the Environment, the Queensland Department of Environment and Heritage Protection, resources industry (Origin) and private
environmental consultants. Expertise was specifically sought in the following areas:
• threats to biodiversity in the region
• costs and feasibility of implementing threat management strategies
• the ecology of threatened species
• their responses to threatening processes and management strategies; and
• people and industries of the region.
Invitations to attend the workshop or participate in follow-up discussions were distributed via email and phone. Invitees were provided with background to the project and asked about their interest and availability to either be present at the workshop or participate through pre- and post- workshop discussions.
03 The Priority Threat Management Approach
Collared delma Delma torquatais the smallest of the legless lizards and it is listed as vulnerable under both the EPBC and under Queensland’s Nature Conservation Act 1992, and as a high priority under the Back on Track framework. This species inhabits eucalypt woodlands dominated by ironbarks.
Eric Vanderduys

38
Of the 63 experts and stakeholders contacted, a total of 29 participants took part in the three day workshop in Brisbane (October 2014). Many of these participants, and 11 additional participants, were also involved in follow-up discussions via email or phone and in person to provide, check, compare and discuss estimates for biodiversity benefits, costs and feasibility (see Section 4.3).
Collating existing background information
Threatened fauna and flora species within the Brigalow Belt bioregion in Queensland were compiled in a database (see Appendix 1). The species recorded in the Atlas of Living Australia (ala.org.au), filtered with the Brigalow Belt North and the Queensland part of the South bioregion, comprised: 1,885 known terrestrial vertebrate and 5,762 known terrestrial plant species. Of these, some 151 vertebrate species and 187 plant species are threatened in different categories under the different legislations and at least eight vertebrate species are already extinct from the region. The
following international, federal and state legislation were consulted to identify the conservation status of the listed species:
• Environmental Protection of Biodiversity and Conservation Act 1999 (EPBC, Australian Government
• Nature Conservation Act 1992 (NCA, Queensland Government)
• Back on Track (BoT, Queensland Government)
• Australian Society for Fish Biology – Conservation Status of Australian Fishes (ASFB)
• International Union for the Conservation of Nature Red List of Threatened (IUCN).
In addition to formally listed species known from the previously cited legislation, the final database was modified by the addition of some species not-yet-listed and deletion of species for which the experts did not feel confident to provide an estimate. For example, during the workshop the experts suggested including some bird species that are threatened
Remnant of brigalow woodlandone of the most cleared vegetation types in Australia with less than 17% of their original extent remaining in small and isolated patches.
Eric Vanderduys

39
but not yet listed and some invertebrate species that are highly threatened. We also reviewed published and grey literature to identify existing empirical and scientific information and to highlight the gaps that needed to be filled using a structured elicitation process with experts and stakeholders.
Problem and parameter definition
The objective of this research was to define and prioritise feasible threat management strategies for the biodiversity of the Brigalow Belt based on ecological cost-effectiveness. The analysis was restricted to the Queensland portion of the Brigalow Belt bioregion. Experts agreed to focus on 179 of the most threatened native species (77 fauna and 102 plants) in this region, and ensured that at least one participant was able to estimate the persistence of each species under different management scenarios. In Appendix 1, we define the parameters for the cost-effectiveness analysis, including the components of the benefits, feasibility and costs of strategies.
Expert and stakeholder consultation and data collection
The list of 77 fauna species and 102 plants species that this study focuses on includes 162 species classified as threatened under federal and state legislation and 17 additional species that experts considered of conservation significance which are of least concern or not currently listed (Table A1, Appendix 1). We did not include species that are migratory, nomadic vagrants or marine.
The list of species and management strategies for the analyses were discussed and refined through a structured elicitation approach guided by a professional facilitator and a team of researchers with skills in decision analysis. The main threats according to the literature were identified in advance of the workshop, then discussed and modified by the experts in the elicitation process. Similarly, existing management strategies to address these threats were proposed to the experts who were asked to modify strategies if they believed improvement was possible.
Experts came together in workshopsto develop feasible management strategies.
Craig Salt

40
Workshop participants worked together to define a set of socially and technically feasible management strategies. Twelve strategies were agreed upon for the Brigalow Belt bioregion. Strategies 1–10 were defined as a set of actions that can be implemented collectively to mitigate threats to imperilled species at the landscape level. Strategy 11 is a composite of strategies 1-10. An additional strategy involving the development of a common vision for the region completes the set.
The resulting strategies are:
1 Protect remnant vegetation
2 Protect important regrowth
3 Establish key biodiversity areas
4 Restore key habitat
5 Manage pest animals
6 Manage invasive plants
7 Manage fire regimes
8 Manage grazing
9 Manage hydrology
10 Manage pollution
11 Strategies 1-10 combined
12 Build a common vision
Participants were split into small groups depending on their expertise and each group was led by two facilitators. Within the small groups, experts defined the set of underlying actions required to implement each strategy and estimated the costs and feasibility of each action. Relevant maps were available to help participants with discussion and estimation. Information gathered in the small groups was collated and presented to the whole group when consensus was required. Fixed and variable costs were estimated by the experts in a range of units, using existing information where available. Some costs were estimated post-workshop and participants were asked to comment on their validity and revise them if necessary. The feasibility of each action was defined by two elements that were collected during the workshop: the probability of uptake (the likelihood that the action would be implemented, taking into account the economic, social and political factors) and the probability of success of the action (the likelihood that if implemented the action would be effective, see Appendix 1 for more details). The feasibility of each strategy
Grazingwas one of the first significant threats imposed in the Brigalow Belt by European settlers, beginning in the 1840s.
Eric Vanderduys

41
was calculated by averaging the feasibility values across all actions in the strategy. Eleven stakeholders and experts not involved in the workshop also contributed with their experience and expertise in costs and feasibility of actions.
Biodiversity experts were asked to provide independent, anonymous estimates of the potential benefit of each strategy to each of the 179 imperilled species. The potential benefit is defined as the summed improvement in the probability of functional persistence of all species over 50 years of a successfully implemented strategy compared with not implementing the strategy. Functional persistence is the likelihood that the population of a species will remain at levels high enough to maintain their ecological function in 50
years. Experts were asked to estimate the probability of persistence of each species under a ‘baseline scenario’ in which no management strategies were implemented unless they were considered part of a minimum duty of care; followed by an estimate of the species persistence under each of the different individual strategies. Following the workshop, the experts were invited to anonymously revise their estimates in light of the responses of the other experts, using a modified Delphi approach (Speirs-Bridge et al. 2010) (see Appendix 1 for more details). The benefit of implemented strategies was evaluated at the bioregion scale, while acknowledging that individual strategies would have different treatment areas across the bioregion.
A common vision for the Brigalow Belt
The Brigalow Belt bioregion has a diverse range of land uses and values, with a similarly diverse group of stakeholders. Biodiversity conservation is an important goal for the region, but it must be considered alongside many other goals that compete for limited space and other resources. Working together with all stakeholders in the Brigalow Belt is critical to successful biodiversity conservation. Workshop participants expressed the opinion that management efforts are currently largely focussed on individual goals and agendas, so management has been sporadic and poorly focussed. Many of the threats to biodiversity in the Brigalow Belt are landscape-level threats that can only be effectively managed by focussed action. Workshop participants adamantly expressed that a shared vision that encourages decisions based on cooperation across tenures to achieve lasting results was needed.
Agreeing on a shared vision requires stakeholders to define objectives for the bioregion that balance environmental,
Agriculture, mining, road building and urban developmentall contribute to water pollution through soil erosion.
Eric Vanderduys

42
social and economic aspects. This may require stakeholders to compromise, but once a shared vision is agreed then action can be taken to achieve the vision with minimal loss to all stakeholders (e.g. some tools might include: economic incentives to restore biodiversity values, assigning values to natural and social capital to create markets). Workshop participants agreed that the shared vision needs to be driven by local stakeholders, with a participatory, bottom-up leadership style to ensure that local people are the
creators of the vision for their region. In addition, stakeholders should have an equal say in the vision, regardless of their economic contribution to the region (for more information, see Appendix 1).
At the workshop, the build a common vision strategy was evaluated as an ‘overarching’ strategy that could be implemented together with any of the other strategies. The workshop participants established that the vision would not directly impact the probabilities of persistence of listed species, but was
an enabling strategy that would increase the feasibility of implementing the practical threat management strategies. To incorporate this recommendation into the prioritisation analyses, we developed two scenarios: the first where strategies were implemented without a common vision; and the second where strategies were implemented with a common vision. Participants were asked to provide revised feasibility values for each action with and without the implementation of a common vision across the Brigalow Belt bioregion.
Arcadia Valley Roadruns between Lake Nuga Nuga National Park and Expedition National Park. This area was originally cleared for beef production, however, in recent years the CSG extraction process has been initiated.
Rocío Ponce Reyes
43
3.2 Analysis
Expected benefits and costs for each strategy
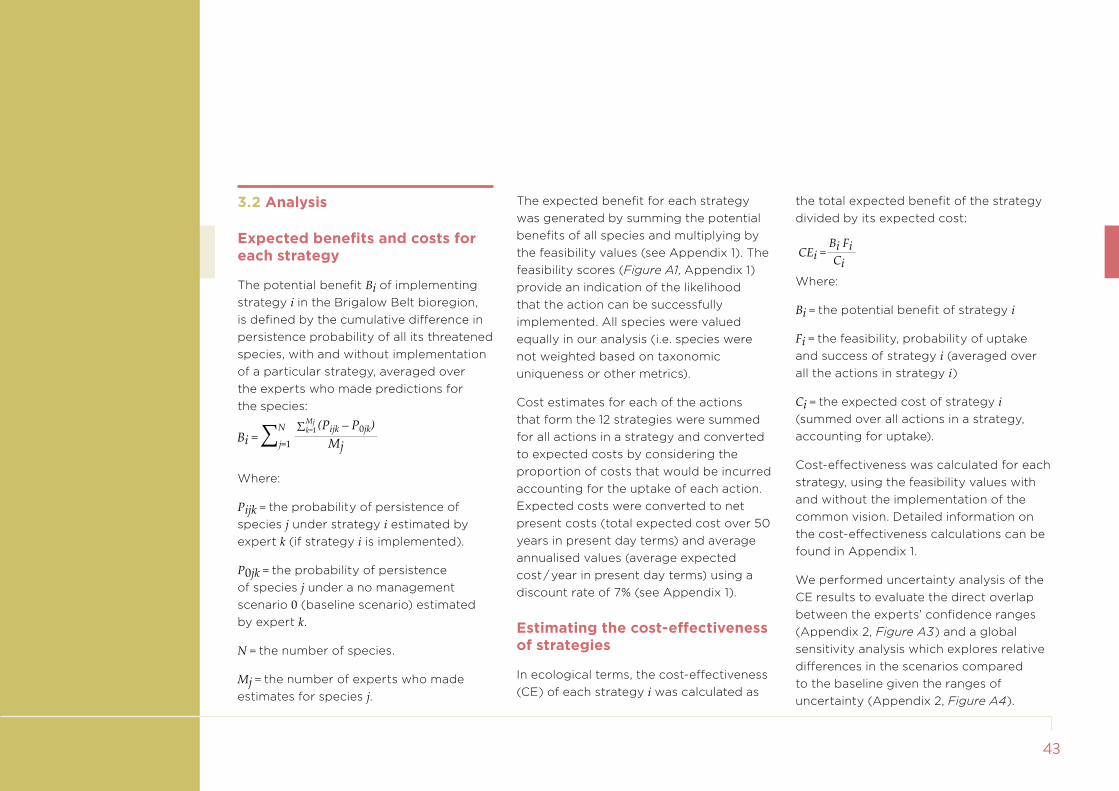
The potential benefit Bi of implementing strategy i in the Brigalow Belt bioregion, is defined by the cumulative difference in persistence probability of all its threatened species, with and without implementation of a particular strategy, averaged over the experts who made predictions for the species:
Where:
Pijk = the probability of persistence of species j under strategy i estimated by expert k (if strategy i is implemented).
P0jk = the probability of persistence of species j under a no management scenario 0 (baseline scenario) estimated by expert k.
N = the number of species.
Mj = the number of experts who made estimates for species j.
The expected benefit for each strategy was generated by summing the potential benefits of all species and multiplying by the feasibility values (see Appendix 1). The feasibility scores (Figure A1, Appendix 1) provide an indication of the likelihood that the action can be successfully implemented. All species were valued equally in our analysis (i.e. species were not weighted based on taxonomic uniqueness or other metrics).
Cost estimates for each of the actions that form the 12 strategies were summed for all actions in a strategy and converted to expected costs by considering the proportion of costs that would be incurred accounting for the uptake of each action. Expected costs were converted to net present costs (total expected cost over 50 years in present day terms) and average annualised values (average expected cost / year in present day terms) using a discount rate of 7% (see Appendix 1).
Estimating the cost-effectiveness of strategies
In ecological terms, the cost-effectiveness (CE) of each strategy i was calculated as
the total expected benefit of the strategy divided by its expected cost:
CEi = Bi Fi
CiWhere:
Bi = the potential benefit of strategy i
Fi = the feasibility, probability of uptake and success of strategy i (averaged over all the actions in strategy i)
Ci = the expected cost of strategy i (summed over all actions in a strategy, accounting for uptake).
Cost-effectiveness was calculated for each strategy, using the feasibility values with and without the implementation of the common vision. Detailed information on the cost-effectiveness calculations can be found in Appendix 1.
We performed uncertainty analysis of the CE results to evaluate the direct overlap between the experts’ confidence ranges (Appendix 2, Figure A3) and a global sensitivity analysis which explores relative differences in the scenarios compared to the baseline given the ranges of uncertainty (Appendix 2, Figure A4).

44
Estimating the value of the common vision
Experts estimated the cost of developing and implementing the common vision along with the other strategies at $3 m over three years (this equals an average annualised cost of $0.2 m over 50 years), after which time it would be self-sustaining. In order to determine whether this cost is worth incurring, and also acknowledging the uncertainty
around it, we evaluated the range of costs for the common vision over which its implementation improved the cost-effectiveness of strategies. For this analysis we evaluated each strategy separately, assuming that only one of the strategies 1–11 was implemented at any one time. We added the cost of the common vision to the cost of each strategy and recalculated the cost-effectiveness of each strategy using the improved feasibility values and increased cost generated by
adding the common vision (Table 1). If this value is less than the expert-derived cost of the common vision then there is a net benefit to implementing the common vision. By inverting the cost-effectiveness equation we then determined the amount of funds that could theoretically be spent on the common vision while still improving the cost-effectiveness of the strategy. We termed this the ‘break-even’ cost of the common vision. Nuga Nuga National Park
Danial S. Stratford

45
Optimal spending of limited budgets
The above cost-effectiveness analysis ranks the individual management strategies that provide the greatest overall improvements in species persistence per unit cost. However it does not consider the effects of implementing combinations of strategies simultaneously. If more than one strategy is implemented, there are
likely to be complementarities between strategies. For example, a set of strategies that exhibit the highest individually ranked cost-effectiveness may tend to benefit a smaller number of species and may be less desirable than a combination of strategies that benefit a larger number of species (Chadès et al. 2015). To determine the set of management strategies which are the most complementary options depending on budgets, we apply a
multi-objective optimisation approach (see Appendix 1). A ‘secure’ species was defined as a species that is estimated to persist with a probability that exceeds a fixed persistence threshold over 50 years. We investigated three persistence thresholds (90%, 70% and 50%) over a range of budget levels (Nemhauser & Ullmann 1996). Further information on the calculation of the optimal solutions is included in Appendix 1.
Nuga Nuga National Parkhas the largest natural water body within the central Queensland Sandstone Belt. It is believed this lake was formed only 160 years ago as a result of flooding and heavy rains. This park protects several imperilled ecosystems like the brigalow and the semi-evergreen vine thicket.
Rocío Ponce Reyes


47
4.1 Appraisal and ranked management strategies
The most cost-effective strategy for improving the persistence of the Brigalow Belt’s imperilled species is managing fire, followed by managing invasive plants. The third highest ranked strategy alternated between establishing key biodiversity areas (flora) and managing hydrology (fauna). Managing grazing and restoring key habitat were also ranked moderately high across all species. The cost-effectiveness rankings of strategies varied little when appraising fauna and flora species separately and in combination (Table 1).
The cost-effectiveness ranks of the strategies were reasonably robust to the uncertainty in persistence estimates for the 179 species both with and without the common vision (Appendix 2). Fire management was consistently ranked highest in terms of cost-effectiveness, despite this strategy having the highest levels of uncertainty in benefit estimates. The three key parameters: costs, feasibility and benefit estimates, were found to have a similar weight of impact upon the overall cost-effectiveness ranks (Appendix 2), indicating that no particular parameter is driving these results.
Managing fire regimes ranks six out of eleven in terms of its average potential
benefit (4.1 across all species) for the imperilled species of the Queensland Brigalow Belt bioregion for the next 50 years. However, due to its relative low cost (about $0.5 m / year) and high feasibility (0.62 without a common vision) it is predicted to be the most cost-effective strategy. Managing invasive plants is almost three times as expensive ($1.5 m / year) as the estimated cost for managing fire regimes and has a smaller average potential benefit (3.8), but has the highest feasibility (0.66) of all strategies. The management of hydrology, similarly, has a low average potential benefit (2.9) but is relatively inexpensive ($1.2 m / year) and has a moderately high feasibility (0.53), making it the third most
cost-effective strategy for fauna species and when fauna and flora species are combined. For flora species, the third most cost-effective strategy was identifying the key biodiversity areas to protect. Although it costs almost twice as much as managing hydrology, the establish key biodiversity areas strategy ($3 m / year) has one of the top ranked average potential benefits (6.2) and a moderate feasibility (0.5 without a common vision) (Table 1).
The combined strategy provided the highest average expected benefit overall (12.3) and was also the most expensive ($57 m / year), as this strategy involves implementing all ten strategies. Two individual strategies, protecting remnant
04 Prioritisation of Threat Management Strategies
Black-throated finch Poephila cincta cinctais listed as endangered under both the EPBC and under Queensland’s Nature Conservation Act 1992 and as a high priority for conservation under the Back on Track framework. It inhabits grassy, open woodlands and forests, typically dominated by Eucalyptus, Corymbia and Melaleuca and its decline coincided with the development of pastoralism. Also the trapping of birds for captive trade may have led to the extinction of some populations.
Eric Vanderduys

48
vegetation and establish key biodiversity areas had the highest average expected benefits (6.2) of the individual strategies for all fauna and flora species combined. These two strategies had also the highest benefit for flora species (4.3 and 4.0 respectively). However the cost of protecting remnant vegetation was one of the highest ($12.5 m / year) and
therefore it ranked 7 (flora) or 8 (fauna and all combined).
Incentive schemes proposed for the long-term security of vegetation management in the strategies to protect remnant vegetation, important regrowth and establish key biodiversity areas increased the overall cost of these strategies.
The incentive scheme action within the identification and protection of key biodiversity areas strategy in long term programs was significantly cheaper ($2 m / year) compared to the other incentive schemes.
The strategy for restoring key habitat for species and communities had the second highest average benefit for fauna (8.9), but the benefit of this strategy for flora species was relatively low (1.8). This strategy was estimated to cost $3.7 m / year to implement and it ranked 6 (flora) or 5 (fauna and all combined). Restoring habitat included an action on implementing restoration based on situation analysis that required $10 m every five years and $1 m / year to allow regrowth and prevent further clearing of brigalow, SEVT and other vegetation types.
The strategy for managing grazing had a relatively high average potential benefit (5.2) but also a relatively high cost ($4.1 m / year). The high cost of this strategy is explained by the action designed to identify areas where the intensification of grazing would have the greatest impact on biodiversity. Part of
Managing grazinghas a high potential benefit at a relatively high cost.
Eric Vanderduys

49
this action suggests an incentive scheme to compensate landowners for their loss of production, and in some cases landholders may be able to receive funds for sequestering carbon through planting trees or managing regrowth (Carwardine et al. 2015; Evans et al. 2015).
The differences in the order of magnitude of the cost-effectiveness scores is explained by the range of costs for implementing strategies — $0.5 m / year to $18.2 m / year (Table 1). The lowest ranked strategies in the CE analyses were managing pest animals and pollution. Both strategies had the highest costs. Managing pest animals was a large suite of actions (Table 1; Table A2, Appendix 1) that incorporated standard approaches (some examples included baiting and ripping to manage rabbits; shooting, trapping and fencing to eliminate cats and foxes; shooting, trapping, fencing and baiting for feral ungulates and removing colonies of noisy miners) and novel approaches and research (e.g. avoiding internal fragmentation of vegetation remnants by linear infrastructure (roads, tracks) and creating strategic long unburnt habitat in landscapes, as refugia for
small fauna to protect them from cats and foxes). While experts felt that these actions should be bundled together in terms of implementation and estimating benefits, strategies with many actions bundled together could mask the cost-effectiveness of individual actions. Although the benefits of the pest animal strategy were relatively high, particularly for fauna (4.0 overall and 7.0 for fauna), experts believed many of the actions within this strategy had a low feasibility (average 0.46) and due to its high cost it ranked second last in the CE analysis. It is likely to be worth investigating the
partial implementation of the pest animal strategy due to its importance for the persistence of fauna such as mammals.
Managing pollution for biodiversity was the strategy predicted to have the lowest benefit for the species of concern (terrestrial fauna and flora) and the highest cost. The goal of this strategy was to reduce water pollution from agriculture and industry that impacts threatened species and its actions followed the reef plan procedure to reduce pollutants in rivers (State of Queensland 2013).
Brigalow Acacia harpophyllaregrowth coming up in pastures.
John Dwyer

50
Strategy Average benefit /species (fauna n=77)
Average benefit /species (flora n=102)
Average benefit / species
(combined n=179)
Feasibility no
common vision (0-1)
Feasibility with
common vision (0-1)
Net present cost
($m over 50 years)
Annualised average
cost ($m / year)
Rank Fauna (CE score)
Rank Flora (CE score)
Rank total (CE score)
Rank with common
vision (CE score)
Common vision break-
even cost ($m / year)
1 Protect remnant vegetation 8.5 4.3 6.2 0.47 0.62 171 12.4 8 (0.25) 7 (0.16) 8 (0.41) 8 (0.53) 3.92
2 Protect important regrowth 6.8 1.3 3.7 0.40 0.61 56 4.0 7 (0.52) 8 (0.13) 7 (0.65) 7 (0.94) 2.12
3 Establish key biodiversity areas 9.0 4.0 6.2 0.50 0.67 41 3.0 4 (1.17) 3 (0.68) 4 (1.85) 3 (2.33) 1.01
4 Restore key habitats 8.9 1.8 4.9 0.54 0.63 52 3.7 5 (1.01) 6 (0.27) 5 (1.28) 5 (1.42) 0.59
5 Manage pest animals 7.0 1.6 4.0 0.46 0.59 178 12.7 9 (0.20) 9 (0.06) 9 (0.25) 9 (0.32) 3.50
6 Manage invasive plants 5.2 2.6 3.8 0.66 0.74 21 1.5 2 (1.75) 2 (1.18) 2 (2.93) 2 (2.90) 0.17
7 Manage fire regimes 6.2 2.4 4.1 0.62 0.68 8 0.5 1 (5.69) 1 (2.88) 1 (8.58) 1 (6.88) 0.05
8 Manage grazing 7.5 3.5 5.2 0.54 0.65 56 4.1 6 (0.76) 5 (0.45) 6 (1.21) 6 (1.39) 0.82
9 Manage hydrology 4.7 1.6 2.9 0.53 0.61 17 1.2 3 (1.56) 4 (0.63) 3 (2.19) 4 (2.22) 0.20
10 Manage pollution 4.6 0.9 2.5 0.56 0.61 252 18.2 10 (0.11) 10 (0.03) 10 (0.14) 10 (0.15) 1.79
11 Strategies 1-10 combined 18.8 7.2 12.3 0.66 0.74 791 57.3 (0.17) (0.09) (0.25) (0.26) 6.44
12 Build a common vision 3 0.2
Table 1 Appraisal of key conservation strategies for threatened species across the Brigalow Belt bioregion in Queensland: average potential benefits per species for flora, fauna and all combined; feasibility with and without the common vision; net present cost and annualised average costs; cost-effectiveness ranks and scores for flora, fauna and all species combined; and the break-even cost of the common vision when implemented with each strategy independently

51
The value of a common vision
The experts estimated that building a common vision for the region would increase the likelihood of all the strategies being feasibly implemented compared to if the common vision was not implemented. The common vision improved the feasibility of the threat management strategies and it cost only $0.2 m / year on average over the 50 year time period. The feasibility of strategies without the common vision ranged from 0.40-0.66, increasing to 0.59–0.74 if the common vision was implemented, which means that on average the expected benefits were 5-21% higher under a common vision scenario.
When looking across all species, the strategy ranks were almost identical when the common vision was included (only key biodiversity areas and hydrology switched between ranks 3 and 4). However, the cost-effectiveness of all strategies increased with the implementation of a common vision, apart from the two most cost-effective strategies (managing fire and managing invasive plants) (Table 1).
This is because the common vision generates a higher expected benefit by increasing the feasibility for each of the strategies, for a relatively small cost. In many cases, substantially more than $0.2 m / year could be cost-effectively spent on the common vision (Table 1). For example, up to $3.9 m / year could theoretically be spent on the common vision when implemented along with the protection of remnant vegetation strategy – any funds beyond this would not be an efficient option to improve species persistence through increasing the likely success of strategies (in this case, the common vision improves the
feasibility from 0.47 to 0.62). For the strategies for managing invasive plants and hydrology the break-even price was approximately equal to the estimated cost of building a common vision strategy, indicating that the common vision offers a negligible additional benefit for the extra cost required. If the combined strategy 11 was implemented, up to $6.4 m / year could be cost-effectively spent on the common vision. These results show that the common vision is almost always a worthwhile investment, particularly if more than one strategy will be implemented in combination.
Rubber vine Cryptostegia grandifloraManagement of invasive plants is one of the two most cost-effective strategies
Eric Vanderduys
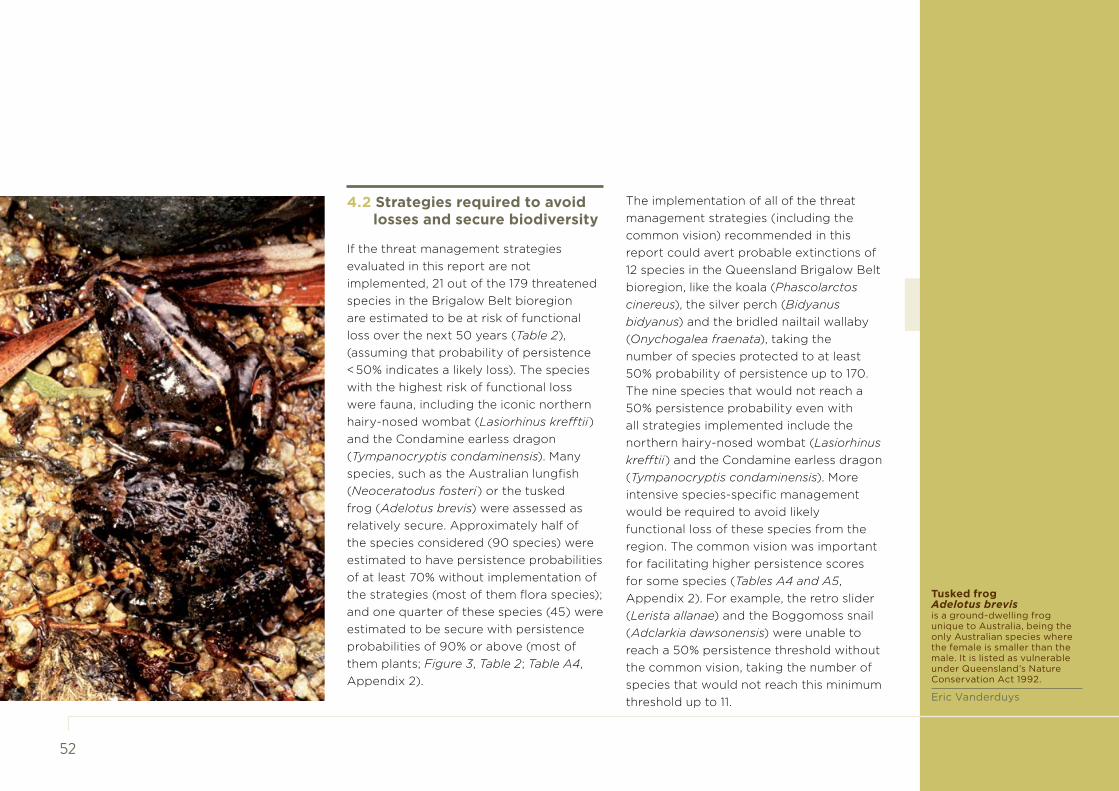
52
4.2 Strategies required to avoid losses and secure biodiversity
If the threat management strategies evaluated in this report are not implemented, 21 out of the 179 threatened species in the Brigalow Belt bioregion are estimated to be at risk of functional loss over the next 50 years (Table 2), (assuming that probability of persistence < 50% indicates a likely loss). The species with the highest risk of functional loss were fauna, including the iconic northern hairy-nosed wombat (Lasiorhinus krefftii) and the Condamine earless dragon (Tympanocryptis condaminensis). Many species, such as the Australian lungfish (Neoceratodus fosteri) or the tusked frog (Adelotus brevis) were assessed as relatively secure. Approximately half of the species considered (90 species) were estimated to have persistence probabilities of at least 70% without implementation of the strategies (most of them flora species); and one quarter of these species (45) were estimated to be secure with persistence probabilities of 90% or above (most of them plants; Figure 3, Table 2; Table A4, Appendix 2).
The implementation of all of the threat management strategies (including the common vision) recommended in this report could avert probable extinctions of 12 species in the Queensland Brigalow Belt bioregion, like the koala (Phascolarctos cinereus), the silver perch (Bidyanus bidyanus) and the bridled nailtail wallaby (Onychogalea fraenata), taking the number of species protected to at least 50% probability of persistence up to 170. The nine species that would not reach a 50% persistence probability even with all strategies implemented include the northern hairy-nosed wombat (Lasiorhinus krefftii) and the Condamine earless dragon (Tympanocryptis condaminensis). More intensive species-specific management would be required to avoid likely functional loss of these species from the region. The common vision was important for facilitating higher persistence scores for some species (Tables A4 and A5, Appendix 2). For example, the retro slider (Lerista allanae) and the Boggomoss snail (Adclarkia dawsonensis) were unable to reach a 50% persistence threshold without the common vision, taking the number of species that would not reach this minimum threshold up to 11.
Tusked frog Adelotus brevisis a ground-dwelling frog unique to Australia, being the only Australian species where the female is smaller than the male. It is listed as vulnerable under Queensland’s Nature Conservation Act 1992.
Eric Vanderduys

53
Optimal sets of strategies under limited budgets
The complementary sets of strategies for maximising the number of species with at least a 50% probability of persistence were the same with and without the common vision across all budgets (Figure 3; Tables A4 and A5, Appendix 2). However, the extra $0.2 m per year spent on the common vision pulled one or two species above the threshold, depending on the overall budget. For example, the cost of implementing invasive plants and hydrology together without the common vision is $3 m / year, providing 165 species with a greater than 50% likelihood of persistence. The implementation of these strategies with the common vision would cost $3.2 m / year and would increase the number of species above the threshold to 166 (Tables A4 and A5, Appendix 2).
Mammals are the most threatened group: half of the 14 assessed mammal species were likely to be lost from the region without implementation of the threat management strategies (< 50% persistence threshold). If all the strategies were implemented, four mammal species (the
northern hairy-nosed wombat (Lasiorhinus krefftii), the brush-tailed rock-wallaby (Petrogale penicillata), the grey-headed flying-fox (Pteropus poliocephalus) and the water mouse (Xeromys myoides)) were predicted to remain below the 50% persistence threshold. The common vision was important for increasing the probability of persistence of the koala to at least 50% if limited funds were available (Tables A4 and A5, Appendix 2).
Without implementing any of the management strategies, all the flora species, amphibians and fish, with the exception of the silver perch, are estimated to have at least 50% chance of persistence in the next 50 years. An investment of $2.2 m / year could secure the silver perch by implementing fire and hydrology management strategies. Alternatively, investing $2.7 m / year in the management of invasive plants and hydrology strategies would secure (greater than 50% persistence) the northern quoll and the Lerista karlschmiditi (skink) but not the silver perch. The building and implementation of a common vision is predicted to increase the persistence probability of one reptile
Bridled nailtail wallaby Onychogalea fraenatais listed as endangered under both the EPBC Act and Queensland’s Nature Conservation Act 1992. It ranks as critical under the Back on Track framework. It is estimated that the current range of this wallaby is only 5% of its original range.
Liana Joseph

54
No Common Vision Common Vision
Number of species in category
No strategies All strategies All strategies
≤ 50% 50-70% 70-90% ≥ 90% ≤ 50% 50-70% 70-90% ≥ 90% ≤ 50% 50-70% 70-90% ≥ 90%
Amphibians 3 0 3 0 0 0 0 3 0 0 0 3 0Birds 31 6 19 4 2 4 11 14 2 4 10 15 2Fish 7 1 5 1 0 0 3 4 0 0 3 4 0Invertebrates 4 1 3 0 0 1 3 0 0 0 4 0 0Mammals 14 7 7 0 0 4 6 4 0 4 5 5 0Reptiles 18 6 10 2 0 2 5 10 1 1 5 11 1Total 77 21 47 7 2 11 28 35 3 9 27 38 3
Brigalow 8 0 0 5 3 0 0 5 3 0 0 7 1Ephemeral wetlands and riparian zones
4 0 0 3 1 0 0 2 2 0 0 4 0
Grasslands 9 0 3 3 3 0 1 5 3 0 1 8 0Notophyll vine forest (NVF) 7 0 2 2 3 0 0 4 3 0 0 0 7Open forests and woodlands 41 0 8 13 20 0 3 18 20 0 3 16 22Open shrublands and heathlands 8 0 1 5 2 0 0 6 2 0 0 2 6Permanent wetlands 4 0 2 1 1 0 0 3 1 0 0 3 1Serpentine 9 0 1 4 4 0 0 5 4 0 0 9 0Semi-evergreen vine thicket (SEVT) 12 0 4 2 6 0 0 6 6 0 0 3 9Total 102 0 21 38 43 0 4 54 44 0 4 52 46
Table 2 Summary table indicating the number of species by categories that are likely to be lost (< 50%) or secured (≥ 50%, 70% or 90%) without any strategies and with all strategies implemented, with and without the common vision

55
and one invertebrate (snail) species above the 50% threshold when compared to not implementing the strategy. For example the skink, retro slider (Lerista allanae), was secured to above a 50% threshold when the common vision was included.
This lizard was thought to be Australia’s only extinct reptile, but was rediscovered in 2009 and currently is known from two or three locations. Fire, exotic grasses and feral animals are thought to be the
main threats to this species (theconversation.com/
australian-endangered-species-retro-slider-120760).
A higher persistence threshold of 70% was possible for many species under a myriad of complementary sets of strategies. The
Retro slider Lerista allanaeThis skink was thought to be Australia’s only extinct reptile, but was rediscovered in 2009 and currently is known from two or three locations. Fire, exotic grasses and feral animals are thought to be the main threats to this species.
Eric Vanderduys

56
Figure 3 The number of species that are likely to be secured at three persistence thresholds (50%, 70% and 90%) with the common vision (bold lines) and without the common vision (dotted lines) for different investment levels spent optimally and effectively on targeted threat management
Solid lines are with the Common VisionDashed lines are without
50% threshold
70% threshold
90% threshold
180
160
140
120
100
80
60
40
20
0 10 20 30Annual budget (AUD millions)
Spec
ies
abov
e p
ersi
sten
ce t
hres
hold
s
40 50 60

57
recommended combinations of strategies varied whether the common vision was considered or not (bold line and dashed line respectively in Figure 3). For a budget of just under $20 m / year implementing the common vision along with size strategies (2, 3, 4, 7, 8, 9) could protect 115 species (64% of all the species) to above the 70% threshold (Table 2; Tables A4 and A5, Appendix 2). Of these, 108 species could be secured spending only $6.5 m / year by implementing only four strategies (3, 6, 7 and 9) with the common vision. Without the common vision,
securing these 108 species would cost $28.5 m / year (strategies 1, 2, 3, 4, 8 and 9).
All strategies would need to be implemented to increase the number of species above a 90% threshold from the 45 species already estimated to have this level of security without the implementation of these strategies. The cost of the combined strategy is $57.3 m / year without the common vision, securing an additional two species, or $57.5 m / year with the common vision, securing four extra species. The only fauna species predicted to attain a probability
of persistence higher than 90% when all strategies are implemented was the yellow-naped snake (Furina barnardi). The additional flora species secured to above 90% persistence by the combined strategy are Paspalidium udum without the common vision and the Yarwun whitewood (Atalaya collina), kooraloo (Cupaniopsis shirleyana) and small-leaved denhamia (Denhamia parvifolia) with the common vision (Tables A4 and A5, Appendix 2).
Black-necked stork Ephippiorhynchus asiaticusis the only stork in Australia. It is also referred to as the Jabiru. It inhabits wetlands like floodplains of rivers and occasionally these birds are found in grasslands or woodland areas searching for food. It is considered near threatened under Queensland’s Nature Conservation Act 1992.
Eric Vanderduys


59
5.1 Using the information in this report
The information we present in this report can be used to aid investment decisions for improving the likely outcomes for imperilled species in the Brigalow Belt over the next 50 years. For the first time in the Brigalow Belt we have gathered the costs of maintaining functional populations of these species by abating the key threats (identified by stakeholders) through land management strategies.
Our analysis indicates that in a highly transformed region such as the Brigalow Belt, threat management strategies alone may be insufficient to secure all species. Nine of the fauna species considered were unable to be secured to a 50% chance of persistence even with implementation of all strategies – in these cases, more intensive species-specific management, much of which exists in recovery plans, is likely to be required to avoid species losses. Together these can be used to support implementation activities, such as Conservation Action Plans that can be undertaken by non-government organisations, the Queensland Government’s Nature Refuges Program and Direct Benefit Management Scheme, and the Australian Government’s program to expand the national protected area
estate, including Indigenous protected areas. Our research indicates that a community-driven, holistic management approach, which builds broad stakeholder support for the program, will also be required for maximising outcomes. A strong community approach will ensure the continuity of economic prosperity and also help to facilitate the political and economic support from key decision makers at a regional, state and national level needed to provide strong momentum for change in these areas. Community support is critical in reducing costs, delivering outcomes and building resilient solutions that will provide a lasting change in attitudes and actions in this environmental resource management issue.
On a technical level, a combination of cost-effectiveness ranking analysis and complementarity analysis is useful for informing decisions, depending upon the amount of funding available and the objective at hand. Implementing the most cost-effective strategy is typically a low-risk decision, particularly in this case, where fire management is consistently ranked first. If funds are available for developing a more comprehensive management plan, the complementarity analysis can advise on which combinations of strategies are likely to be the best investments under different budgets. The common vision becomes an important strategy as soon as more than the first three most cost-effective strategies are implemented. The aim of building a common vision is to incorporate the
05 Implications for Decision Making
Red goshawk Erythrotriorchis radiatusis listed as endangered under Queensland’s Nature Conservation Act 1992, vulnerable under the EPBC Act and it ranks as a high priority under the Back on Track framework.
James Watson

60
multiple values of stakeholders in a balanced way that improves the outcomes for biodiversity and the many other values of the Brigalow Belt. Many workshop participants felt that a shared vision could transform existing frustrations among stakeholders into conservation opportunities for the region. Further work is required to establish this common vision.
Some of the funds for conserving species already exist as part of current conservation projects (for example, the reduction in sediments, nutrients and pesticides in waterways, as part of the Reef Water Quality Protection Plan 2013). However our results suggest that further investment is necessary to overcome threats to the listed flora and fauna of the region. Additional funding should build upon and enhance existing successful initiatives, both for practical
and economic efficiency and to ensure that the knowledge and experience of existing managers and decision-makers is retained. Indigenous participation in conservation management can be enhanced through a ranger program. In most cases the effectiveness, feasibility and impact of strategies are uncertain. In some cases more research is required to help define the actions taken and new information may require that the approach is re-visited in the future. An adaptive management approach should be part of any implementation plan to reduce these uncertainties over time (McCarthy & Possingham 2007).
The objective of our analysis is to improve the persistence of listed species, however we acknowledge the importance of other objectives in the Brigalow Belt. Our prioritisation of conservation strategies
is intended as a guide. We do not comprehensively address the cultural, socio-economic or spatial components required for implementation. These components are a necessary part of the process to develop a common vision, and may change the priority order and appropriateness of the strategies in different locations. Nor do we evaluate the broader benefits of these strategies. We acknowledge that the implementation of the strategies presented would benefit not only the threatened species in the region, but also other species, employment, sustainability (improvement in pastoral, agricultural and mining industry practices) and ecosystem services such as carbon sequestration, clean water and improved soil health. The cost-effectiveness of the strategies identified here may change when different kinds of benefits are included.
Sunrise in Nuga Nuga National Park
Rocío Ponce Reyes

61
5.2 Limitations and future research directions
The research we present here estimates the likely losses of threatened species faced by the Queensland Brigalow Belt if further targeted investment in conservation management of the region is not made. We also detail here the optimal individual strategies and the complementary sets of strategies, including the creation of a ‘common vision’ amongst the diverse range of stakeholders, for avoiding these losses. The methods we use are explicit, systematic and knowledge-based. The priorities generated can be updated as improved information on the costs and benefits of conservation actions becomes available.
In order to conduct these analyses the following set of assumptions and simplifications were required:
• The cumulative impact of interacting threats stemming from multiple industries and land-use activities is the critical determinant of biodiversity persistence. As such, we did not attempt to compare the relative
impacts of any particular industry or activity. Each industry poses multiple threats. Threats with potential for abatement were addressed as part of the set of feasible management strategies, and not separated by particular industries or activities.
• The majority of data used in these analyses were based on the experts’ and stakeholders’ knowledge that may or may not include beliefs formed on the basis of published, peer-reviewed scientific research. Given the urgency of many conservation issues, particularly in regards to threatened species, in many cases it is better to make decisions using expert knowledge, rather than to avoid decisions for lack of data or to spend limited budgets on activities that are not cost-effective.
• For many of the conservation actions, costs were based on estimates provided by workshop participants and in follow up conversations; actual costs may prove to be higher or lower, and will likely change over time. Pilots and business cases can be useful in firming up such costs before widespread implementation.
Diamond firetail Stagonopleura guttatais a little finch found in open grassy woodlands or heath grasslands with scattered trees. It ranks as a high priority in the Back on Track framework and it is listed as least concern under Queensland’s Nature Conservation Act 1992. The main threats to this bird are changes in vegetation structure due to overgrazing, weed invasion, competition with invasive species and predation.
Mat & Cathy Gilfedder
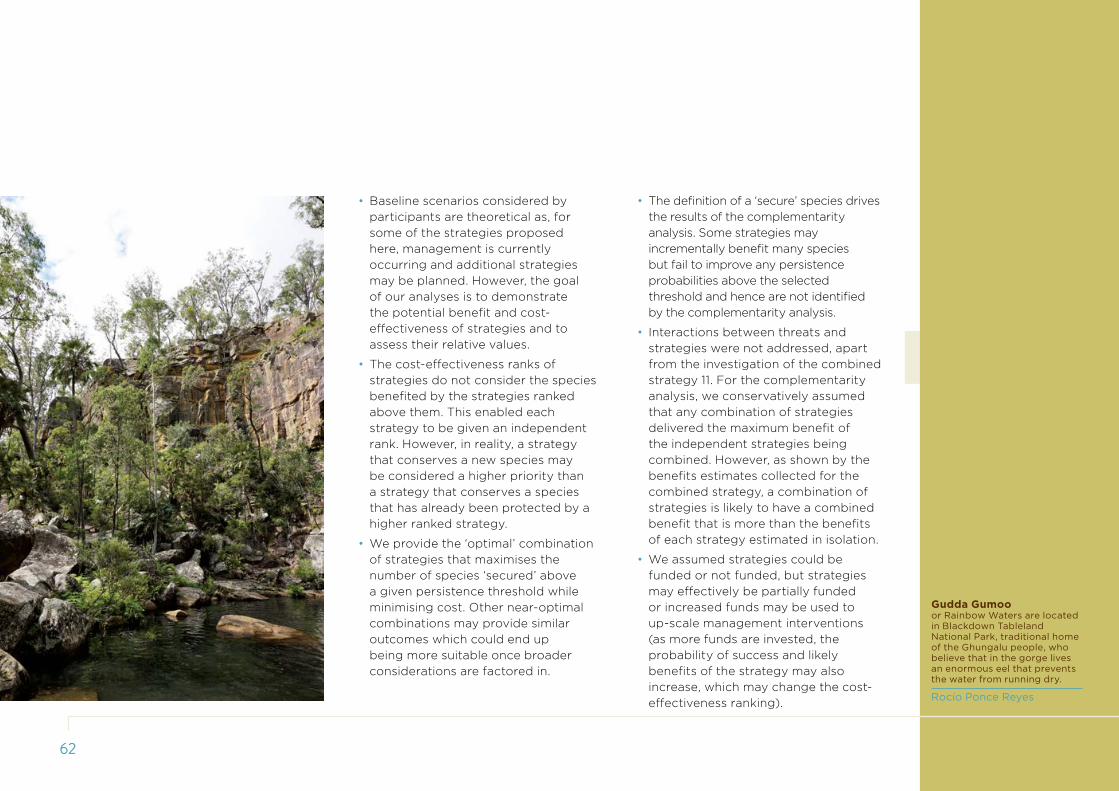
62
• Baseline scenarios considered by participants are theoretical as, for some of the strategies proposed here, management is currently occurring and additional strategies may be planned. However, the goal of our analyses is to demonstrate the potential benefit and cost-effectiveness of strategies and to assess their relative values.
• The cost-effectiveness ranks of strategies do not consider the species benefited by the strategies ranked above them. This enabled each strategy to be given an independent rank. However, in reality, a strategy that conserves a new species may be considered a higher priority than a strategy that conserves a species that has already been protected by a higher ranked strategy.
• We provide the ‘optimal’ combination of strategies that maximises the number of species ‘secured’ above a given persistence threshold while minimising cost. Other near-optimal combinations may provide similar outcomes which could end up being more suitable once broader considerations are factored in.
• The definition of a ‘secure’ species drives the results of the complementarity analysis. Some strategies may incrementally benefit many species but fail to improve any persistence probabilities above the selected threshold and hence are not identified by the complementarity analysis.
• Interactions between threats and strategies were not addressed, apart from the investigation of the combined strategy 11. For the complementarity analysis, we conservatively assumed that any combination of strategies delivered the maximum benefit of the independent strategies being combined. However, as shown by the benefits estimates collected for the combined strategy, a combination of strategies is likely to have a combined benefit that is more than the benefits of each strategy estimated in isolation.
• We assumed strategies could be funded or not funded, but strategies may effectively be partially funded or increased funds may be used to up-scale management interventions (as more funds are invested, the probability of success and likely benefits of the strategy may also increase, which may change the cost-effectiveness ranking).
Gudda Gumooor Rainbow Waters are located in Blackdown Tableland National Park, traditional home of the Ghungalu people, who believe that in the gorge lives an enormous eel that prevents the water from running dry.
Rocío Ponce Reyes

63
• Many participants made useful suggestions for adding extra actions to strategies and for splitting large strategies post-workshop. However we were restricted to the 12 strategies agreed upon at the workshop to be consistent with the information already elicited on species persistence estimates for these strategies. We have listed additional ideas for management strategies in Appendix 1.
• While we did not attempt to address global climate change on the regional landscape management scale of the Brigalow Belt, we acknowledge that strategies to reduce greenhouse gas emissions are possible in the region, such as conversion to lower emission energy production technology, e.g. renewable energy.
• There are many uncertainties in future conditions for the Brigalow Belt bioregion. For example, the consequences of climate change and future developments may vary from current predictions and may compound the existing threats and accelerate declines. A precautionary approach suggests that we should invest early, monitor and review the effectiveness of strategies, and be vigilant in identifying emerging changes.
This research highlighted a number of important incidental findings that led us to make the following recommendations for future directions:
• Ongoing effort to predict future threats, their likely consequences on native species and how to minimise negative impacts (e.g., climate change, expansion of CSG, coal mining or intensive agriculture, and invasive flora and fauna).
• The development of appropriate methods for integrating this approach with cultural and socio-economic considerations.
• Designing implementation pathways in collaboration with stakeholders including examining the relationship between the nature of the prioritised threats and managements, predominant tenure arrangements, and the available investment pathways.
• Development of an adaptive management framework to update data as more information becomes available and to monitor and evaluate management effectiveness.
• Research to improve the effectiveness and efficiency of management strategies.
Brigalow Acacia harpophyllaseedlings growing in a log.
John Dwyer

Yakka skink Egernia rugosa

65
Accumulating threats are posing significant challenges to the survival of the unique biodiversity of the Brigalow Belt bioregion. This report presents crucial and timely information for the future of the imperilled species of this biodiversity hotspot. Effective threat management strategies have the potential to save 12 of the 21 species that are otherwise likely to be lost from the region in the next 50 years.
We address this conservation opportunity by providing a systematic, region-wide assessment of the best management strategies to enhance the functional persistence of threatened species across the Brigalow Belt bioregion. We present an aggregation of the knowledge on the ecology and management of the Brigalow Belt of 40 experts and stakeholders by defining and analysing a set of costed strategies to help guide decision-making.
According to our analysis, the most cost-effective threat management strategy to protect imperilled species (flora and fauna species combined) in the Brigalow Belt was managing fire. This strategy includes the implementation of a coordinated plan using current knowledge to create a mosaic of habitat with different ages since burnt. This strategy also suggests the implementation
of fire regimes to effectively manage grasslands for the Condamine earless dragon (Tympanocryptis condaminensis) and threatened grass species such as Dichanthium queenslandicum, while protecting fire sensitive areas. The biodiversity of the region is adapted to fire management as it was a traditional Indigenous practice recognised for
managing fire loads, ‘cleaning’ country and promoting food plants (Bowman 1998). The second most cost-effective strategy was managing invasive plants and the third was managing hydrology. The cost for implementing these top three strategies is about $3.27 m / year over 50 years, benefiting all the 179 species to some extent.
06 Concluding Remarks
LeftYakka skink Egernia rugosais listed as vulnerable under both the EPBC Act and under Queensland’s Nature Conservation Act 1992; it also ranks as a medium priority under the Back on Track framework. It has been found in rocky outcrops associated with ironbark forests, woodlands, brigalow forests and open shrubland. Apart from habitat loss and habitat degradation, this species is threatened by invasive animals like pigs and rabbits and is predated by cats and foxes.
Eric Vanderduys
RightPurple spotted gudgeon Mogurnda adspersa
Eric Vanderduys
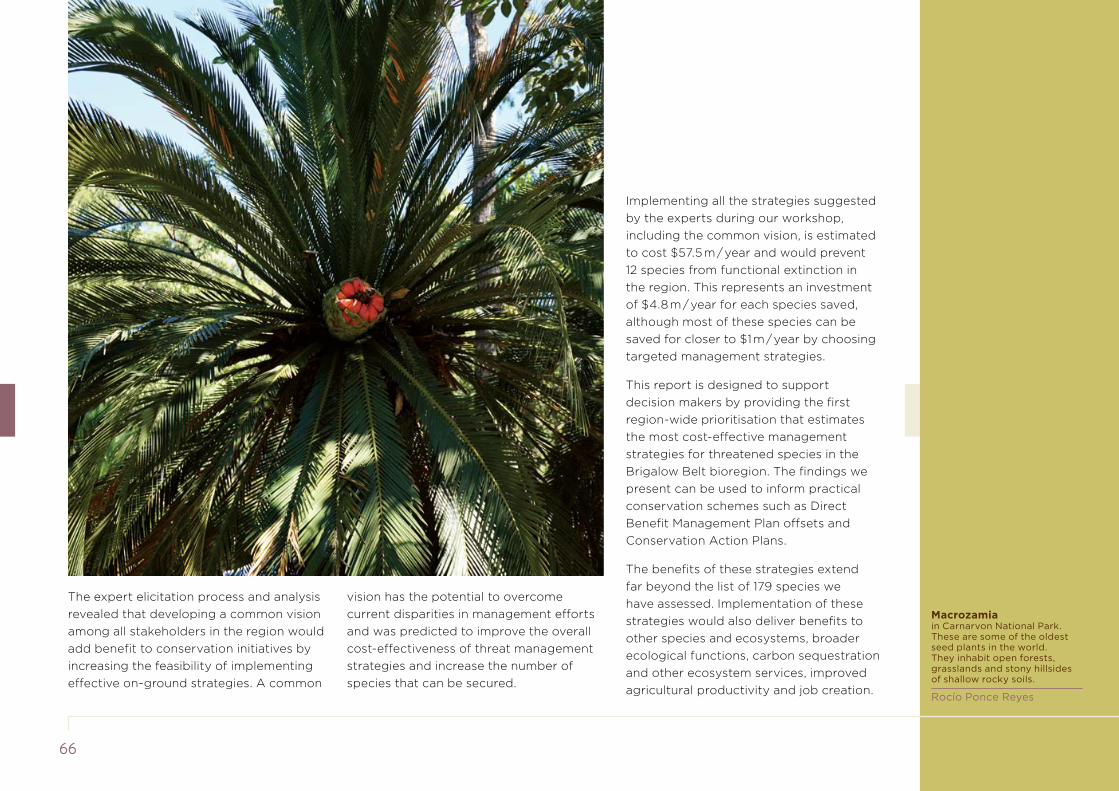
66
The expert elicitation process and analysis revealed that developing a common vision among all stakeholders in the region would add benefit to conservation initiatives by increasing the feasibility of implementing effective on-ground strategies. A common
vision has the potential to overcome current disparities in management efforts and was predicted to improve the overall cost-effectiveness of threat management strategies and increase the number of species that can be secured.
Implementing all the strategies suggested by the experts during our workshop, including the common vision, is estimated to cost $57.5 m / year and would prevent 12 species from functional extinction in the region. This represents an investment of $4.8 m / year for each species saved, although most of these species can be saved for closer to $1 m / year by choosing targeted management strategies.
This report is designed to support decision makers by providing the first region-wide prioritisation that estimates the most cost-effective management strategies for threatened species in the Brigalow Belt bioregion. The findings we present can be used to inform practical conservation schemes such as Direct Benefit Management Plan offsets and Conservation Action Plans.
The benefits of these strategies extend far beyond the list of 179 species we have assessed. Implementation of these strategies would also deliver benefits to other species and ecosystems, broader ecological functions, carbon sequestration and other ecosystem services, improved agricultural productivity and job creation.
Macrozamiain Carnarvon National Park. These are some of the oldest seed plants in the world. They inhabit open forests, grasslands and stony hillsides of shallow rocky soils.
Rocío Ponce Reyes

67
Gudda Gumoo (Rainbow Falls)in Blackdown Tableland National Park in central Queensland. Settlers began entering the area by the 1860s. The phosphorus-deficient soils of the tableland thwarted the early attempts to graze cattle in the area, as cattle developed chalky bones.
Rocío Ponce Reyes
Queensland’s Brigalow Belt bioregion is a biodiversity hotspot of national and global significance but is it also a region of exceptional mineral resources and agricultural production. These often competing land uses and values have made decisions and actions highly controversial in the Brigalow Belt, but a common vision that unites stakeholders with the local community and gains political and economic support could make a critical difference over the next 50 years. A community-based approach can deliver more cost-effective and lasting conservation outcomes in the region. Key strategies identified in this report, including fire management and invasive plant control, could provide great benefit for ensuring the persistence of the most imperilled flora and fauna of this region. The opportunity now exists to implement a systematic, region-wide conservation strategy that includes input from a diverse range of stakeholder sectors to build a common vision and protect the region’s unique biodiversity.
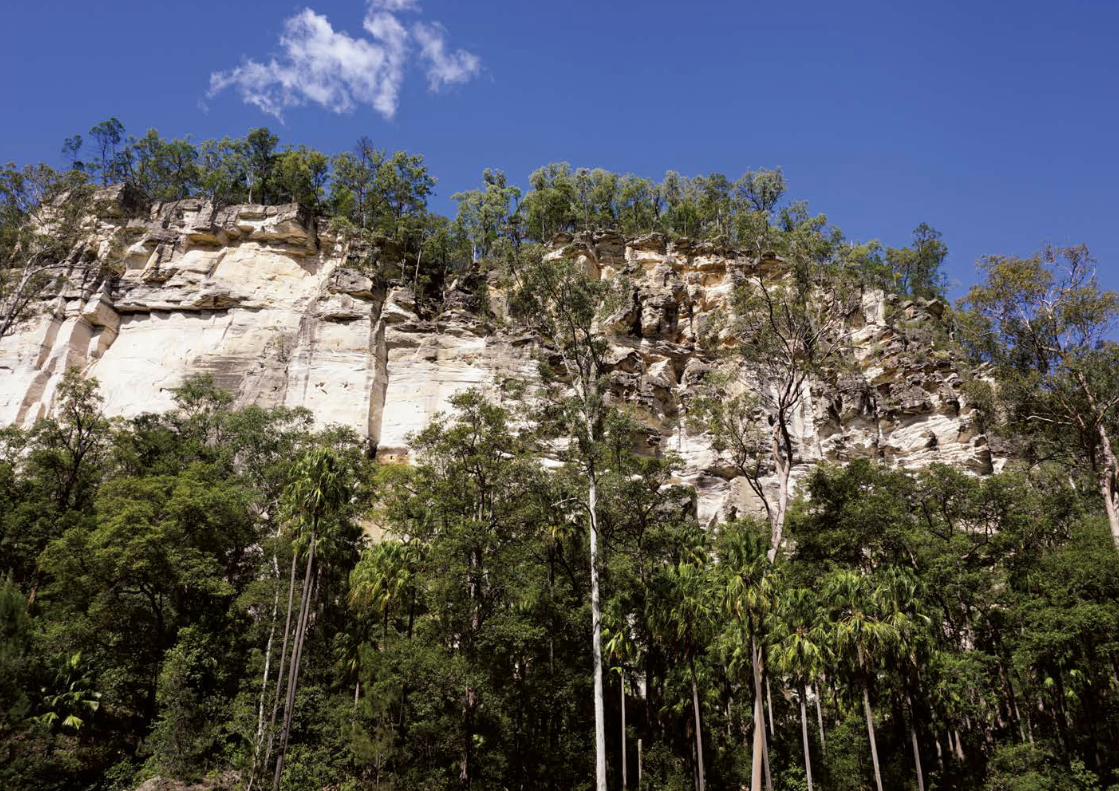

69
Accad A 2001 Remnant Vegetation in Queensland: Analysis of Pre-clearing, Remnant 1997–1999 Regional Ecosystem Information Queensland Herbarium Toowong, Queensland.
Australian Bureau of Statistics 2013 Queensland (Main Statistical Area Structure), Population stat.abs.gov.au/itt/r.jsp?databyregion
Australian Government 2006 Mine closure and completion. Leading practice sustainable development program for the mining industry. Department of Industry, Tourism, and Resources, Canberra, Australia.
Bastin G & the ACRIS Management Committee 2008 ‘Rangelands 2008 – Taking the Pulse’ National Land and Water Resources Audit Canberra.
Beaton JM 1991 ‘Cathedral cave: a rock shelter in Carnarvon Gorge, Queensland’ Queensland Archaeological Research, 33–84.
Bowman D 1998 Fire on the Savannas: Voices from the Landscape (ed. D Schulz) Cooperative Research Centre for the Sustainable Development of Tropical Savannas.
Bridge G 2004 ‘Contested terrain: Mining and the environment’ Annual Review of Environment and Resources 29, 205-259.
Bureau of Agricultural Economics 1963 The Economics of Brigalow Land Development in the Fitzroy Basin, Queensland Bureau of Agricultural Economics, Canberra.
Butler DW 2008 Recovery plan for the “Brigalow (Acacia harpophylla) dominant and co-dominant” endangered ecological community (draft of July 2008) Report to the Department of the Environment and Water Resources, Canberra. Queensland National Parks and Wildlife Service Brisbane.
Butler DW 2009 ‘Planning iterative investment for landscape restoration: Choice of biodiversity indicator makes a difference’ Biological Conservation, 142, 2202–2216.
Butler DW & Fairfax RJ 2003 ‘Buffel grass and fire in a gidgee and brigalow woodland: a case study from central Queensland’ Ecological Management & Restoration 4, 120–125.
Carwardine J, Hawkins C, Polglase P, Possingham HP, Reeson A, Renwick AR, Watts M & Martin TG 2015 ‘Spatial Priorities for Restoring Biodiverse Carbon Forests’ BioScience.
Carwardine J, Nicol S, van Leeuwen S, Walters B, Firn J, Reeson A, Martin TG & Chadès I 2014 Priority threat management for Pilbara species of conservation significance CSIRO Ecosystems Sciences, Brisbane.
Carwardine J, O’Connor T, Legge S, Mackey B, Possingham HP & Martin TG 2012 ‘Prioritizing threat management for biodiversity conservation’ Conservation Letters, 5, 196–204.
Carwardine J, O’Connor T, Legge S, Mackey B, Possingham HP & Martin TG 2011 Priority threat management to protect Kimberley wildlife CSIRO Ecosystem Sciences, Brisbane.
Chadès I, Nicol S, van Leeuwen S, Walters B, Firn J, Reeson A, Martin TG & Carwardine J 2015 ‘Benefits of integrating complementarity into priority threat management’ Conservation Biology 29, 525–536.
CSIRO 2012 Coal seam gas developments – predicting impacts Commonwealth Scientific and Industrial Research Organisation Canberra.
Department of Primary Industries and Fisheries 2008 Rabbit control in Queensland – A guide for land managers Department of Primary Industries and Fisheries, Queensland.
Dodd AP 1940 The Biological Campaign Against Prickly Pear The Commonwealth Prickly Pear Board, Brisbane.
Doherty TS, Bengsen AJ & Davis RA 2015 ‘A critical review of habitat use by feral cats and key directions for future research and management’ Wildlife Research 41, 435–446.
Dwyer JM 2007 Restoration of Remnant Population and Community Structure in Brigalow Regrowth University of Queensland.
07 References
The porous sandstone of the gorgesin Carnarvon National Park capture water before it enters the Great Artesian Basin.
Rocío Ponce Reyes

70
Dwyer JM, Fensham RJ & Buckley YM 2010 ‘Agricultural legacy, climate, and soil influence the restoration and carbon potential of woody regrowth in Australia’ Ecological Applications 20, 1838–1850.
Dwyer JM, Fensham RJ, Butler DW & Buckley YM 2009 ‘Carbon for conservation: Assessing the potential for win–win investment in an extensive Australian regrowth ecosystem’ Agriculture, Ecosystems & Environment 134, 1–7.
Erskine P & Fletcher A 2013 ‘Novel ecosystems created by coal mines in central Queensland’s Bowen Basin’ Ecological Processes 2, 1–12.
Evans MC, Carwardine J, Fensham RJ, Butler DW, Wilson KA, Possingham HP & Martin TG 2015 ‘Carbon farming via assisted natural regeneration as a cost-effective mechanism for restoring biodiversity in agricultural landscapes’ Environmental Science & Policy 50, 114–129.
Eyre TJ, Wang J, Venz MF, Chilcott C & Whish G 2009 ‘Buffel grass in Queensland’s semi-arid woodlands: Response to local and landscape scale variables, and relationship with grass, forb and reptile species’ Rangeland Journal 31, 293–305.
Fairfax RJ & Fensham RJ 2000 ‘The effects of exotic pasture development on floristic diversity in central Queensland. Australia’ Biodiversity Conservation 94, 11–21.
Fensham RJ 1998 ‘The grassy vegetation of the Darling Downs, South-Eastern Queensland, Australia. Floristics and grazing effects’ Biological Conservation, 84, 301–310.
Fensham RJ 1999 ‘Native grasslands of the Central Highlands, Queensland, Australia. Floristics, regional context and conservation’ Rangeland Journal, 21, 82–103.
Fensham RJ, Ponder WF & Fairfax RJ 2010 Recovery plan for the community of native species dependent on natural discharge of groundwater from the Great Artesian Basin Report to Department of the Environment, Water, Heritage and the Arts, Canberra. Queensland Department of Environment and Resource Management, Brisbane.
Ferrier S, Harwood T & Williams, KJ 2012 Queensland’s biodiversity under climate change: Ecological scaling of terrestrial environmental change CSIRO Climate Adaptation Flagship Working Paper No. 12B.
Firn J 2009 ‘African lovegrass in Australia: a valuable pasture species or embarrassing invader?’ Tropical Grasslands 43, 86–97.
Firn J, Martin TG, Walters B, Hayes J, Nicol S, Chadès I & Carwardine J 2013 Priority threat management of invasive plant species in the Lake Eyre Basin CSIRO Climate Adaptation Flagship Working paper No. 17 (CSIRO and Queensland University of Technology).
Firn J, Maggini R, Chadès I, Nicol S, Walters B, Reeson A, Martin TG, Possingham HP, Pichancourt JB, Ponce Reyes R & Carwardine J 2015a Priority threat management of Invasive Animals to protect biodiversity in the Lake Eyre Basin CSIRO Brisbane.
Firn J, Martin TG, Chadès I, Walters B, Hayes J, Nicol S & Carwardine J 2015b ‘Priority threat management of non-native plants to maintain ecosystem integrity across heterogeneous landscapes Journal of Applied Ecology.
Franks AJ 2002 ‘The ecological consequences of buffel grass Cenchrus ciliaris establishment within remnant vegetation of Queensland’ Pacific Conservation Biology 8, 99–107.
Gardner TA, Von Hase A, Brownlie S, Ekstrom JMM, Pilgrim JD, Savy CE, Stephens RTT, Treweek JO, Ussher GT, Ward G & Ten Kate K 2013 ‘Biodiversity Offsets and the Challenge of Achieving No Net Loss’ Conservation Biology 27, 1254–1264.
GISERA 2014a Coal seam gas developments – predicting impacts Fact sheet in GISERA, editor. gisera.org.au
GISERA 2014b What is coal seam gas? Fact sheet in GISERA, editor. gisera.org.au
Graham CA, Maron M & McAlpine CA 2012 ‘Influence of landscape structure on invasive predators: feral cats and red foxes in the brigalow landscapes, Queensland, Australia’ Wildlife Research 39, 661–676.

71
Grice AC 2006 ‘The impacts of invasive plant species on the biodiversity of Australian rangelands’. The Rangeland Journal 28, 27–35.
Horton DR (creator) 1996 Aboriginal Studies Press, AIATSIS and Auslig/Sinclair, Knight, Merz aiatsis.gov.au/explore/articles/aboriginal-australia-map
IBRA version 7 2012 Australian Government Department of Sustainability, Environment, Water, Population and Communities and State/Territory land management agencies.
IPCC 2007a Climate change 2007: impacts, adaptation and vulnerability (ed. CU Press) New York.
IPCC 2007b Climate Change 2007: The Physical Science Basis Contribution of Working Group I to the Fourth Assessment Report of the Intergovernmental Panel on Climate Change Geneva, Switzerland.
Jackson J 2005 ‘Is there a relationship between herbaceous species richness and buffel grass (Cenchrus ciliaris)?’ Austral Ecology 30, 505–517.
James CD, Landsberg J & Morton SR 1999 ‘Provision of watering points in the Australian arid zone: a review of effects on biota’ Journal of Arid Environments 41, 87–121.
Johnson RW 1976 ‘Competition between brigalow (Acacia harpophylla) suckers and establishing pastures following pulling and burning’ Queensland Journal of Agricultural and Animal Sciences 33, 43–65.
Joseph LN, Maloney RF & Possingham HP 2009 ‘Optimal Allocation of Resources among Threatened Species: a Project Prioritization Protocol’ Conservation Biology 23, 328–338.
Kaye L, Barrett D, Vink S, Roux E, Murray C-E, White J & Robbins S 2012 Coal Seam Gas, Coal and Agriculture: Water Implications Centre for Water in the Minerals Industry, Sustainable Minerals Institute, University of Queensland, Brisbane.
Kingsford RT 2000 ‘Ecological impacts of dams, water diversions and river management on floodplain wetlands in Australia’ Austral Ecology 25, 109–127.
Laurance WF 2015 ‘Wildlife struggle in an increasingly noisy world’ Proceedings of the National Academy of Sciences 112, 11995–11996.
Legge S, Kennedy MS, Lloyd RAY, Murphy SA & Fisher A 2011 ‘Rapid recovery of mammal fauna in the central Kimberley, northern Australia, following the removal of introduced herbivores’ Austral Ecology 36, 791–799.
Lindenmayer DB & Burgman MA 2005 Practical Conservation Biology CSIRO, Collingwood, Australia.
Lloyd PL 1984 The climatic environment of the Brigalow Belt of Queensland (ed. A Bailey) The Brigalow Belt of Australia. The Royal Society of Queensland, Brisbane
Mantyka-Pringle CS, Martin TG & Rhodes JR 2011 ‘Interactions between climate and habitat loss effects on biodiversity: a systematic review and meta-analysis’ Global Change Biology 18, 1239–1252.
Maron M, Gordon A, Mackey BG, Possingham HP, Watson JEM 2015 ‘Stop misuse of biodiversity offsets’ Nature 523, 401-403
Maron M, Grey MJ, Catterall CP, Major RE, Oliver DL, Clarke MF, Loyn RH, MacNally R, Davidson I & Thomson JR 2013 ‘Avifaunal disarray due to a single despotic species’ Diversity and Distributions, 19, 1468–1479.
Maron M, Hobbs RJ, Moilanen A, Matthews JW, Christie K, Gardner TA, Keith DA, Lindenmayer DB & McAlpine CA 2012 ‘Faustian bargains? Restoration realities in the context of biodiversity offset policies.’ Biological Conservation 155, 141–148.
Maron M & Kennedy S 2007 ‘Roads, fire and aggressive competitors: Determinants of bird distribution in subtropical production forests’ Forest Ecology and Management 24, 24–31.
Marsh H, Dennis A, Hines H, Kutt A, McDonald K, Weber E, Williams S & Winter J 2007 ‘Optimizing Allocation of Management Resources for Wildlife’ Conservation Biology 21, 387–399.
Martin TG, Campbell S & Grounds S 2006 ‘Weeds of Australian rangelands’ The Rangeland Journal 28, 3–26.

72
Martin TG & McIntyre S 2007 ‘Impacts of livestock grazing and tree clearing on birds of woodland and riparian habitats’ Conservation Biology 21, 504–514.
Martin TG, Murphy H & Liedloff A 2012 Invasive species and climate change: a framework for predicting species distribution when data are scarce CSIRO Climate Adaptation Flagship Working Paper No. 13G.
McAlpine CA, Maron M, Smith G, Bowen M, Seabrook L, Dwyer JM, Butler S, Graham C & Goulding W 2011 Conserving biodiversity in brigalow landscapes gpem.uq.edu.au/docs/Brigalow/ConservingBrigalowLandscapesl.pdf
McBride MF, Fidler F & Burgman MA 2012 ‘Evaluating the accuracy and calibration of expert predictions under uncertainty: predicting the outcomes of ecological research’ Diversity and Distributions 18, 782–794.
McCarthy MA & Possingham HP 2007 ‘Active Adaptive Management for Conservation’ Conservation Biology 21, 956–963.
McDonald CJ & McPherson GR 2013 ‘Creating hotter fires in the Sonoran Desert: buffelgrass produces copious fuels and high fire temperatures’ Fire Ecology 9, 26–39.
Miller G, Friedel M, Adam P & Chewings V 2010 ‘Ecological impacts of buffel grass (Cenchrus ciliaris L.) invasion in central Australia—does field evidence support a fire-invasion feedback?’ The Rangeland Journal 32, 353–365.
Miller, KL, Trezise JA, Kraus S, Dripps K, Evans MC, Gibbons P, Possingham HP & Maron M 2015 ‘The development of the Australian environmental offsets policy: from theory to practice’ Environmental Conservation FirstView 1–9.
Moore TA 2012 ‘Coalbed methane: A review’ International Journal of Coal Geology 101, 36–81.
Nemhauser GL & Ullmann Z 1969 ‘Discrete dynamic programming and capital allocation’ Management Science 15, 494–505.
Ngugi MR, Johnson RW & McDonald WJF 2011 ‘Restoration of ecosystems for biodiversity and carbon sequestration: Simulating growth dynamics of brigalow vegetation communities in Australia’ Ecological Modelling 222, 785–794.
Nix 1994 ‘The Brigalow’ Australian environmental history: essays and cases (ed. S Dovers). Oxford University Press, Melbourne, Victoria, Australia.
Northrup JM & Wittemyer G 2013. ‘Characterising the impacts of emerging energy development on wildlife, with an eye towards mitigation’ Ecology Letters 16,112–125.
Pannell DJ, Roberts AM, Park G & Alexander J 2013 ‘Designing a practical and rigorous framework for comprehensive evaluation and prioritisation of environmental projects’ Wildlife Research 40, 126–133.
Peres-Neto PR, Legendre P, Dray SP & Borcard D 2006 ‘Variation partitioning of species data matrices: Estimation and comparison of fractions’ Ecology 87, 2614–2625.
Possingham HP, Ryan S, Baxter J & Morton S 2002 Setting Biodiverstity Priorities A paper prepared as part of the activities of the working group producing the report Sustaining our Natural Systems and Biodiversity Prime Minister’s Science, Engineering and Innovation Council Australia.
Queensland coal mines and advanced projects 2015 Queensland Department of Natural Resources and Mines dnrm.qld.gov.au
Queensland DEHP 2012 Rehabilitation requirements for mining projects EM1122 version 1. Queensland Department of Environment and Heritage Protection, Brisbane.
Richardson JH, Shore RF, Treweek JR & Larkin SBC 1997. ‘Are major roads a barrier to small mammals?’ Journal of Zoology 243, 840–846.
Roth C, Lawson G & Cavanagh D 2002 Overview of key Natural Resource Management issues in the Burdekin Catchment, with particular reference to water quality and salinity CSIRO Land and Water.

73
Schlesinger C, White S & Muldoon S 2013 ‘Spatial pattern and severity of fire in areas with and without buffel grass (Cenchrus ciliaris) and effects on native vegetation in central Australia’ Austral Ecology 38, 831–840.
Seabrook L, McAlpine C & Fensham R 2006 ‘Cattle, crops and clearing: Regional drivers of landscape change in the Brigalow Belt, Queensland, Australia, 1840–2004’ Landscape and Urban Planning 78, 373–385.
Sonter LJ, Barrett DJ & Soares-Filho BS 2014 ‘Offsetting the impacts of mining to achieve no net loss of native vegetation’ Conservation Biology 28, 1068–1076.
Speirs-Bridge A, Fidler F, McBride M, Flander L, Cumming G & Burgman M 2010 ‘Reducing Overconfidence in the Interval Judgments of Experts’ Risk Analysis 30, 512–523.
State of Queensland 2013 Reef Water Quality Protection Plan Queensland Government and Australian Government.
Tan P-L, George D & Comino M 2015 ‘Cumulative risk management, coal seam gas, sustainable water, and agriculture in Australia’ International Journal of Water Resources Development 1–19.
Taylor BD & Goldingay RL 2010 ‘Roads and wildlife: Impacts, mitigation and implications for wildlife management in Australia’ Wildlife Research 37, 320–331.
Vesk PA, Nolan R, Thomson JR, Dorrough JW & MacNally R 2008 ‘Time lags in provision of habitat resources through revegetation’ Biological Conservation 141, 174–186.
Ware HE, McClure CJW, Carlisle JD & Barber JR 2015 ‘A phantom road experiment reveals traffic noise is an invisible source of habitat degradation’ Proceedings of the National Academy of Sciences 112, 12105–12109.
Water Group 2010 Water Group Advice on EPBC Act Referrals.
Webb AA 1984 Consequences of agricultural land use in the Brigalow Belt The Brigalow Belt of Australia (ed. A Bailey). Queensland Department of Primary Industries Brisbane, 131–147.
Williams E, Erskine P, Schoettker B, Adams-Hosking C, McAlpine C & Seabrook L 2014 Scoping study: final report–The Potential Impacts of Coal Seam Gas on Biodiversity The Sustainable Minerals Institute and Landscape Ecology and Conservation Group, The School of Geography, Planning and Environmental Management, University of Queensland, Brisbane.
Williams J, Stubbs T & Milligan A 2012a An analysis of coal seam gas production and natural resource management in Australia A report prepared for the Australian Council of Environmental Deans and Directors. John Williams Scientific Services Pty Ltd.
Williams KJ, Dunlop M, Bustamante RH, Murphy HT, Ferrier S, Wise RM, Liedloff A, Skewes T, Harwood TD, Kroon F, Williams RJ, Joehnk K, Crimp S, Stafford Smith M, James C & Booth T 2012b Queensland’s biodiversity under climate change: impacts and adaptation – synthesis report (ed. report prepared for the Queensland Government B). CSIRO Climate Adaptation Flagship Canberra.
Woinarski JCZ, Burbidge AH & Harrison PL 2015 ‘Ongoing unravelling of a continental fauna: Decline and extinction of Australian mammals since European settlement’ Proceedings of the National Academy of Sciences Early Edition: pnas.org/ cgi/doi/10.1073/pnas.1417301112
Woinarski JCZ, Risler J & Kean L 2004 ‘Response of vegetation and vertebrate fauna to 23 years of fire exclusion in a tropical Eucalyptus open forest, Northern Territory, Australia’ Austral Ecology 29, 156–176.


75
Species list
Table A1a Focal threatened fauna species in the Brigalow Belt bioregion listed in the Environment Protection and Biodiversity Conservation Act (EPBC), Nature Conservation Act (NCA, Queensland Government), Back on Track (BoT) and Australian Society for Fish Biology – Conservation Status of Australian Fishes (ASFB). CR = Critically endangered; E = Endangered; V = Vulnerable; NT = Near threatened; LC = Least concern
TAXON CONSERVATION STATUS
Category Scientific name Common name EPBC NCA BoT ASFB
Amphibians Adelotus brevis Tusked frog V
Amphibians Cyclorana verrucosa Rough collared frog NT
Amphibians Notaden melanoscaphus (Townsville population)
Northern spadefoot toad
Birds Anthochaera phrygia Regent honeyeater CR E
Birds Burhinus grallarius Bushstone curlew
Birds Calyptorhynchus lathami Glossy black-cockatoo V High
Birds Climacteris picumnus Brown treecreeper
Birds Daphoenositta chrysoptera Varied sittella
Birds Ephippiorhynchus asiaticus Black-necked stork NT
Birds Epthianura crocea macgregori Yellow chat (Dawson) CR E High
Birds Erythrotriorchis radiatus Red goshawk V E High
Birds Esacus magnirostris Beach stone-curlew V High
Birds Geophaps scripta scripta Squatter pigeon (southern subsp.) V V
Birds Glossopsitta pusilla Little lorikeet
Birds Grantiella picta Painted honeyeater V High
Birds Lathamus discolor Swift parrot E E Medium
Birds Lophoictinia isura Square-tailed kite NT
Birds Melanodryas cucullata Hooded robin LC High
08 AppendicesAppendix 1: Methodological details
Rufous bettong (rat-kangaroo) Aepyprymnus rufescensAlthough this species is not currently considered as a high conservation priority a great part of their distribution coincides with high intensity land use (such as mining). This together with foxes and rabbits and droughts have result in population declines of this mammal.
Eric Vanderduys

76
TAXON CONSERVATION STATUS
Category Scientific name Common name EPBC NCA BoT ASFB
Birds Melithreptus gularis Black-chinned honeyeater NT
Birds Neochmia ruficauda ruficauda Star finch (eastern subsp.) E E
Birds Neophema pulchella Turquoise parrot NT
Birds Nettapus coromandelianus Cotton pygmy-goose NT
Birds Ninox connivens Barking owl
Birds Ninox strenua Powerful owl V
Birds Poephila cincta cincta Black-throated finch (southern subsp.) E E High
Birds Pomatostomus temporalis Grey-crowned babbler
Birds Pyrrholaemus sagittatus Speckled warbler
Birds Rostratula australis Australian painted snipe E V
Birds Stagonopleura guttata Diamond firetail LC High
Birds Sternula albifrons Little tern LC High
Birds Stictonetta naevosa Freckled duck NT
Birds Tadorna radjah Radjah shelduck NT
Birds Turnix melanogaster Black-breasted button-quail V V Critical
Birds Tyto novaehollandiae Masked owl
Fish Bidyanus bidyanus Silver perch CR V
Fish Gadopsis marmoratus River blackfish
Fish Maccullochella mariensis Mary River cod E High
Fish Maccullochella peelii Murray cod V Critical V
Fish Mogurnda adspersa Purple spotted gudgeon
Fish Neoceratodus forsteri Australian lungfish V V
Fish Pristis microdon Freshwater sawfish
Invertebrates Acrodipsas illidgei Illidge's ant-blue V Critical
Invertebrates Adclarkia dawsonensis Boggomoss snail CR Critical
Invertebrates Euastacus armatus Spiny crayfish
Invertebrates Hypochrysops piceata Bulloak jewel (butterfly) E High
Mammals Aepyprymnus rufescens Rufous bettong LC
Mammals Chalinolobus picatus Little pied bat NT
Mammals Dasyurus hallucatus Northern quoll E LC

77
TAXON CONSERVATION STATUS
Category Scientific name Common name EPBC NCA BoT ASFB
Mammals Lagorchestes conspicillatus Spectacled hare-wallaby V
Mammals Lasiorhinus krefftii Northern hairy-nosed wombat E E Critical
Mammals Macroderma gigas Ghost bat V Critical
Mammals Onychogalea fraenata Bridled nailtail wallaby E E Critical
Mammals Petrogale penicillata Brush-tailed rock-wallaby V V High
Mammals Phascolarctos cinereus Koala (Brigalow Belt region) V V
Mammals Pseudomys patrius Eastern pebble-mound mouse
Mammals Pteropus poliocephalus Grey-headed flying-fox E V Critical
Mammals Saccolaimus saccolaimus nudicluniatus
Bare-rumped sheathtail bat CR E High
Mammals Taphozous australis Coastal sheathtail bat V High
Mammals Xeromys myoides Water mouse V V High
Reptiles Acanthophis antarcticus Common death adder NT
Reptiles Anomalopus mackayi Long-legged worm-skink V E High
Reptiles Aspidites ramsayi Woma NT High
Reptiles Delma inornata High
Reptiles Delma labialis Striped-tailed delma V
Reptiles Delma torquata Collared delma V V High
Reptiles Denisonia maculata Ornamental snake V V
Reptiles Egernia rugosa Yakka skink V V Medium
Reptiles Elseya albagula Snapping turtle from Broken River LC High
Reptiles Furina barnardi Yellow-naped snake NT
Reptiles Furina dunmalli Dunmall's snake V V
Reptiles Hemiaspis damelii Grey snake E
Reptiles Lerista allanae Retro slider E E High
Reptiles Lerista karlschmidti NT
Reptiles Paradelma orientalis Brigalow scaly-foot LC LC Medium
Reptiles Rheodytes leukops Fitzroy River turtle V V High
Reptiles Strophurus taenicauda Golden-tailed gecko NT Medium
Reptiles Tympanocryptis condaminensis Condamine earless dragon E E

78
Table A1b Focal threatened flora species in the Brigalow Belt bioregion listed in the Environment Protection and Biodiversity Conservation Act (EPBC), Nature Conservation Act (NCA, Queensland Government) and Back on Track (BoT).
TAXON CONSERVATION STATUS
Ecological community Scientific Name Common name EPBC NCA BoT
Brigalow Rutidosis lanata E
Brigalow Solanum dissectum E
Brigalow Xerothamnella herbacea E E
Brigalow Homopholis belsonii Belson's panic V E
Brigalow Solanum elachophyllum E
Brigalow Solanum johnsonianum E
Brigalow Solanum adenophorum Hairy nightshade E High
Brigalow Rutidosis crispata V
Ephemeral wetlands and riparian zones Microcarpaea agonis E E
Ephemeral wetlands and riparian zones Livistona lanuginosa Waxy cabbage palm V V Critical
Ephemeral wetlands and riparian zones Paspalidium udum V
Ephemeral wetlands and riparian zones Picris barbarorum Plains picris V
Grasslands Solanum papaverifolium E
Grasslands Swainsona murrayana Slender darling pea V V
Grasslands Trioncinia retroflexa E High
Grasslands Bothriocloa bunyensis Bunya Mountains bluegrass V V
Grasslands Dichanthium queenslandicum King blue-grass E V
Grasslands Cymbonotus maidenii E
Grasslands Cyperus clarus V
Grasslands Thesium australe Austral toad-flax V V
Grasslands Picris evae Hawk weed V V High
NVF Cossinia australiana Cossinia E E
NVF Fontainea rostrata Deep Creek fontainea V V
NVF Lastreopsis silvestris V
NVF Clematis fawcettii Northern clematis V V

79
TAXON CONSERVATION STATUS
Ecological community Scientific Name Common name EPBC NCA BoT
NVF Cupaniopsis shirleyana Kooraloo V V
NVF (edges) Corchorus hygrophilus V
NVF (edges) Ozothamnus eriocephalus V V
Open forests and woodlands Paspalidium batianoffii
Open forests and woodlands Acacia pedleyi V
Open forests and woodlands Macrozamia cranei E E
Open forests and woodlands Solanum stenopterum V High
Open forests and woodlands Genoplesium pedersonii V
Open forests and woodlands Acacia curranii Curly-bark wattle V V
Open forests and woodlands Acacia deuteroneura V V
Open forests and woodlands Acacia hockingsii V
Open forests and woodlands Acacia islana Isla Gorge wattle V
Open forests and woodlands Acacia tingoorensis V High
Open forests and woodlands Bertya granitica E E
Open forests and woodlands Corymbia clandestina V V
Open forests and woodlands Daviesia discolor V V
Open forests and woodlands Daviesia quoquoversus V
Open forests and woodlands Eucalyptus argophloia Chinchilla white gum V V Critical
Open forests and woodlands Eucalyptus pachycalyx subsp. waajensis
Pumpkin gum E
Open forests and woodlands Eucalyptus virens Shiny-leaved ironbark V V
Open forests and woodlands Genoplesium validum V
Open forests and woodlands Homoranthus papillatus Mouse bush V
Open forests and woodlands Lissanthe brevistyla V
Open forests and woodlands Melaleuca irbyana Weeping paperbark E
Open forests and woodlands Philotheca sporadica Kogan waxflower V V
Open forests and woodlands Pomaderris coomingalensis E High

80
TAXON CONSERVATION STATUS
Ecological community Scientific Name Common name EPBC NCA BoT
Open forests and woodlands Rhaponticum australe Native thistle V V
Open forests and woodlands Trioncinia patens E
Open forests and woodlands Westringia parvifolia V V
Open forests and woodlands Acacia argyrotricha V
Open forests and woodlands Acacia handonis Hando's wattle V V
Open forests and woodlands Aristida granitica E E
Open forests and woodlands Macrozamia conferta V V Critical
Open forests and woodlands Homoranthus decumbens E V High
Open forests and woodlands Macrozamia crassifolia V Critical
Open forests and woodlands Commersonia pearnii E High
Open forests and woodlands Eucalyptus paedoglauca Mt Stuart ironbark V V High
Open forests and woodlands Leptospermum venustum V
Open forests and woodlands Macrozamia machinii V V
Open forests and woodlands Acacia lauta Tara wattle V V
Open forests and woodlands Apatophyllum flavovirens E
Open forests and woodlands Aristida annua V V
Open forests and woodlands Bertya calycina V V
Open forests and woodlands Cycas megacarpa E E
Open shrublands and heathlands Micromyrtus carinata Gurulmundi heath-myrtle E
Open shrublands and heathlands Rhaphidospora bonneyana V V
Open shrublands and heathlands Micromyrtus patula E
Open shrublands and heathlands Acacia wardellii V
Open shrublands and heathlands Acacia barakulensis Waajie wattle V
Open shrublands and heathlands Calytrix gurulmundensis V V
Open shrublands and heathlands Acacia porcata E E High
Open shrublands and heathlands Aristida forsteri E
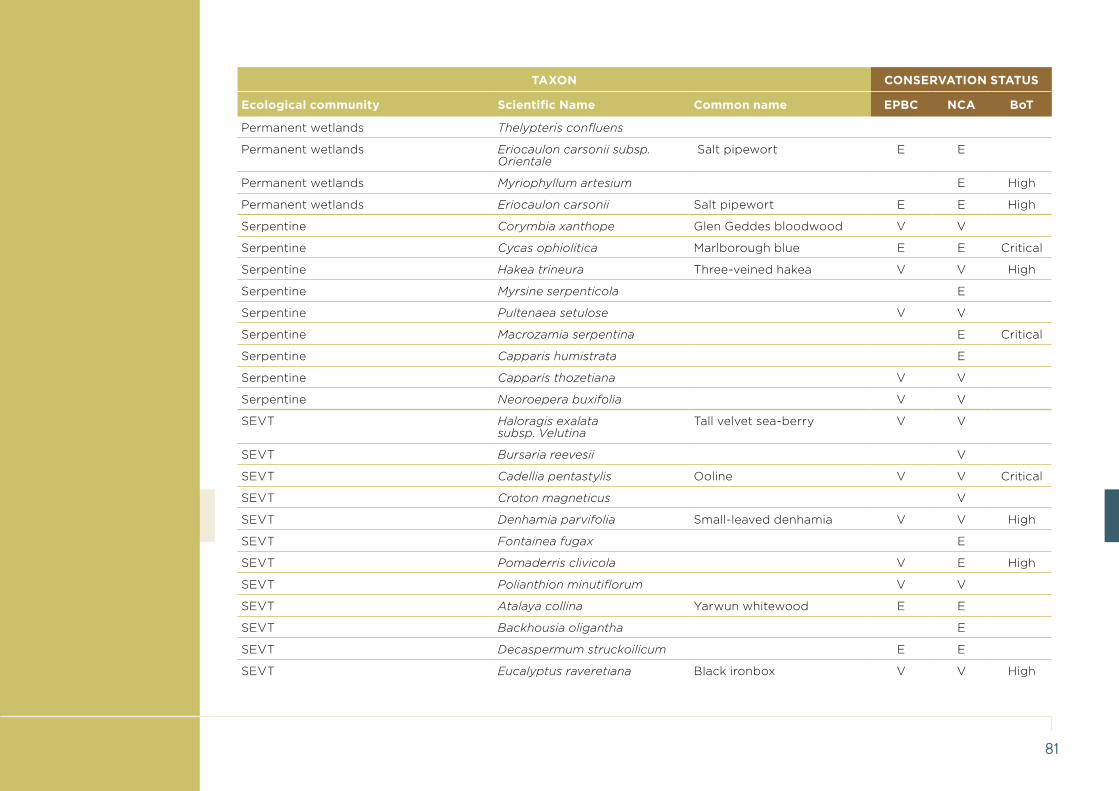
81
TAXON CONSERVATION STATUS
Ecological community Scientific Name Common name EPBC NCA BoT
Permanent wetlands Thelypteris confluens
Permanent wetlands Eriocaulon carsonii subsp. Orientale
Salt pipewort E E
Permanent wetlands Myriophyllum artesium E High
Permanent wetlands Eriocaulon carsonii Salt pipewort E E High
Serpentine Corymbia xanthope Glen Geddes bloodwood V V
Serpentine Cycas ophiolitica Marlborough blue E E Critical
Serpentine Hakea trineura Three-veined hakea V V High
Serpentine Myrsine serpenticola E
Serpentine Pultenaea setulose V V
Serpentine Macrozamia serpentina E Critical
Serpentine Capparis humistrata E
Serpentine Capparis thozetiana V V
Serpentine Neoroepera buxifolia V V
SEVT Haloragis exalata subsp. Velutina
Tall velvet sea-berry V V
SEVT Bursaria reevesii V
SEVT Cadellia pentastylis Ooline V V Critical
SEVT Croton magneticus V
SEVT Denhamia parvifolia Small-leaved denhamia V V High
SEVT Fontainea fugax E
SEVT Pomaderris clivicola V E High
SEVT Polianthion minutiflorum V V
SEVT Atalaya collina Yarwun whitewood E E
SEVT Backhousia oligantha E
SEVT Decaspermum struckoilicum E E
SEVT Eucalyptus raveretiana Black ironbox V V High

82
Details of management strategies
Table A2 Descriptions of the actions within the strategies developed by the experts during the workshop
Strategy Action
1 Protect remnant vegetation
Goal: Stop the clearing of native remnant vegetation where possible
Establish an independent scientific advisory committee to pursue ongoing sustainable management of the region that includes gathering and sharing information, public awareness campaigns and lobbying for legislative changes.
Additional funds for driving legislation changes to:
• stop clearing native vegetation (all remnant and strategic regrowth locations)
• achieve at least 30% of original extent for each Broad Vegetation Group
• connect landscapes
• protect key habitats
• ensure properties are in good functional condition (30% vegetation on each property, regional vegetation management plan).
Communication piece for promotion of best practice land management for biodiversity, using examples of existing success stories.
Incentive scheme for landholders to retain and manage vegetation.
2 Protect important regrowth
Goal: Strategically protect regrowth in locations important for biodiversity
Independent committee – as above.
Additional funds for driving legislation changes – as above.
Communication piece – as above.
Identify important regrowth locations for protection.
Incentive scheme – as above but at approximately 10% of the cost since regrowth represents 10% of extant vegetation.
3 Establish key biodiversity areas
Goal: Identify key biodiversity areas to protect
Survey key sites / areas to better understand key areas for biodiversity and what they contain.
Incentive scheme for engaging landholders, educating about important areas and securing key biodiversity areas in long-term programs.
Monitoring at the landscape level.

83
Strategy Action
4 Restore key habitat
Goal: Restore habitat for key species and communities
Identify and map the location of good candidates for restoration, with consideration of important regrowth locations that require restoration and protection.
Identify the causes of current state of species and communities.
Implement restoration based on situation analysis.
Allow regrowth / prevent further clearing of Brigalow, SEVT and other vegetation types respecting pre-cleared veg type.
Implement restoration aspects of existing recovery plans.
5 Manage pest animals
Goal: Reduce the impact of priority pest animals (rabbits, hares, cats, foxes, wild dogs, ungulates*) on threatened species
*Experts did not consider cane toads to be a key threat in the region
Map areas of distribution of feral herbivores (rabbits and hares) – this has been undertaken and is available at feralscan.org
Bait and rip to 50% or 90% of areas impacted by rabbits and hares (depending upon location).
Shoot, trap and fence to eliminate feral ungulates from strategic locations.
Remove colonies of noisy miners (by shooting) from strategic locations.
Undertake complementary restoration action where appropriate (fire exclusion, suckers regeneration, replanting, reducing grazing pressure).
Investigate and educate on the value of landscape-scale control of cats, wild dogs and foxes in the Brigalow Belt utilising all the available control tools (e.g. baiting, shooting and fencing from strategic locations, fire and grazing management, mesopredator regulation of cats by dingoes) and develop baits and other technologies that are targeted at better reducing feral cats.
Avoid internal fragmentation by linear infrastructure inside vegetation and further timber removal (thinning).
Create strategic long unburnt habitat landscapes as refugia for small fauna as protection from cats and foxes.
Undertake research trials and user experiments to find innovative techniques (e.g. Judas animals / hormonal treatments, corrals, grooming traps, etc.).

84
Strategy Action
6 Manage invasive plants
Goal: Reduce the impact of priority invasive plants on threatened species
Understand and manage drivers of weed invasion. Identify and learn from case studies of success / failure and develop a map for areas requiring priority actions. Use soil tests to determine soil condition (landscape management).
Institute reward system for successful methods for eradicating weeds and showcase good practice by landholders to drive innovation.
Capacity building: improve , train and up-skill existing weed officers.
Improve wash down station signage on highways.
Develop a Community Of Practice (COP) for threats for everyone to follow (industry especially) to share tips and best practices, and to provide support for each other. Should work with local government authorities. Possibly include COP for nurseries to stop spread of garden-based pests.
7 Manage fire regimes
Goal: Manage fire regimes for threatened species
Develop and implement a coordinated fire management plan for the Brigalow Belt bioregion. Manage fire using current knowledge with the interim goal of managing fire frequency, intensity and extent for maximum habitat variety (pyrodiversity) for a suite of fire regimes, i.e. create mosaic of different “age since burnt” habitats.
Implement fire management for protection of grassland (including protection of Tympanocryptis condaminensis).
Protect fire sensitive areas. Identify their current state and develop a plan accordingly.
8 Manage grazing
Goal: Manage grazing and browsing for threatened species
Promote good management (including the economic benefit) through communication. Identify and celebrate “champions”.
Improve existing best grazing land management practices to include biodiversity.
Decide on a viable grazing regime to maintain stock routes, road corridors and camping water reserves and communicate to councils. Plans should incorporate how often and how much grazing can occur.
Identify areas where intensification of grazing should not occur / be reduced because of importance for biodiversity and provide incentives for landowners to reduce grazing in these areas.

85
Strategy Action
9 Manage hydrology
Goal: Manage hydrology for threatened species
Develop catchment management strategy that accounts for cumulative impact on biodiversity that includes:
a establishing ecological (not only chemical) outcomes and targets to achieve
b providing statutory agreement to meet ecological targets
c stopping stream diversion
d determining control discharge frequency and quality on ephemeral streams and water bodies to replicate natural system.
Establish long-term research program that investigates the impact on species of concern and ecosystems. Include ongoing periodic monitoring; and research into habitat degradation and cascading effects.
Lobby regulators to avoid mining underneath waterways – especially while reviewing Water Act.
10 Manage pollution
Goal: Manage pollution for threatened species
Reduce pollution from agriculture and industry on water that impacts threatened species.
Monitor and feedback.
Develop best management guidelines and extension.
11 Combined strategy Strategies 1–10 combined.
12 Build a common vision Define a shared vision that incorporates environmental, social and political aspects in a balanced way.
Establish a “champion” and a core set of people to initiate the vision, but keep it a grass-roots process.
Identify the key people in the best position to drive the shared vision.
Develop and synthesise relevant background information.
Working with one or more coordinator(s) to scope and refine the vision with representation from all stakeholders.
Communicate the vision among sectors.

86
Additional actions were suggested post-workshop. As biodiversity experts did not consider them when estimating the persistence values we did not include them in the CE or in the complementarity analysis. These suggestions may be useful to consider in further analysis and implementation:
• recovery plans for the habitat of other species, like the ornamental snake, yakka skink, south-eastern long-eared bat, black-breasted button quail, red goshawk, Fitzroy River turtle, large-eared pied bat, koala, northern quoll and squatter pigeon
• consider carbon farming in the incentive scheme in strategy 2
• the need to investigate the utility of grazing to reduce the dominance of environmental weeds in key habitats and to encourage the use of grazing to control fuel loads in some fire sensitive ecosystems
• explicit provision for acquisition of new reserves and national parks along with incentives for nature refuges under permanent protection.
Parameters
Benefits
The benefits of each strategy were estimated with the improvement of the probability of persistence of each threatened species if the strategy was implemented, compared to the baseline scenario (no strategies implemented). Functional persistence was defined as the probability that a species would exists over 50 years at high enough level to perform its ecological function. The probability of persistence was estimated under the assumption that actions would be implemented with no delay. Other existing or currently unrealised threats were assumed to be constant and continue to impact persistence unless they were altered by the management strategy.
Workshop participants estimated the probability of persistence for each of the 11 strategies under a baseline scenario, as well as a probability of persistence of each species if each of the strategies were implemented. Participants provided the persistence estimate using the four-point
approach (Speirs-Bridge et al. 2010): a best guess, best and worst-case scenario (upper and lower bounds) around the best guess, and a confidence estimate.
Experts made estimates solely for those species and strategies for which they felt confident in their knowledge.
Costs
During the workshop, participants were asked to list the set of actions associated with each strategy and the costs of each action.
To aid participants with the costs estimation, they were provided with Table A3. Costs were based on past experiences executing similar actions. Some costs could not be estimated during the workshop, due to the lack of information or time. Therefore stakeholders (from the Department of the Environment, AgForce, landholders, helicopter shooters, NRMs) some of whom didn’t participate in the workshop were also consulted. Workshop participants were given the option to revise and modify the compiled costs.

87
Feasibility
The feasibility of the actions was estimated by the experts considering the uptake likelihood of an action and the likelihood of success. Uptake likelihood is the percentage of situations where a decision-maker would accept an action (for example, perhaps 60% of the landowners would be amenable to eradicate feral herbivores for biodiversity). The likelihood of success is the percentage of times an action would achieve previously stated goals if implemented (for example, even though a plan to manage feral herbivores is implemented, due to extreme environmental conditions the populations grow more than predicted and the benefits of the actions are not visible). Feasibility was calculated as the product of the likelihoods of uptake and success.
A scale (Figure A1) was provided to the experts during the workshop as a guide.
Table A3 Aid table to estimate the costs an units used for estimating the costs of actions
Include, as applicable, the costs of:
a Materials, fuel, transport and equipment
b Labour and / or number of FTEs, even if these people are already employed
c Accommodation, travel etc.
d Monitoring: gathering information or surveys (pre-action) / monitoring for reporting purposes (post-action) / experimental monitoring for adaptive management if learning is part of the action
e Devising a management plan
f Capacity building: training staff / education and extension / stakeholder engagement processes
g Coordinating implementation.
Do not include costs that are incurred as part of management to meet ongoing minimum duty of care requirements
All costs should have a unit, extent and time period
Unit Extent Time period
• $, $K, $M
• FTEs
• Hours of labour
• Accommodation
• Per hectare
• Per land management type
• Per subregion
• For entire treatment area
• For entire region
• Once-off establishment costs
• Cost over a period (e.g. first 5 years)
• Fixed annual costs
• Variable annual costs (give indication of the variable, e.g. rainfall)

88
Analysis
Determining the costs across the region
The costs of all actions were converted to a total expected annual cost across the region. For some cases, the costs would be affected by the uptake, so to determine the expected annual cost, the potential cost was modified with the likelihood of uptake. For example, to estimate the cost of managing feral rabbits and hares, we estimated the total farming land area in the Brigalow Belt and assumed that rabbits occurred in 10% of each property. For properties smaller than 1500 ha we considered that a tractor was needed ($8 / ha). For properties equal to or greater than 1500 ha we assumed a bulldozer was required: $1200 / km2 (Department of Primary Industries and Fisheries 2008) updated with inflation rate of 1.2%. We
reduced the total cost by half to reflect the estimate that approximately 50% of landholders would take up this approach.
The expected present value cost (Ci) of an action i over 50 years at an r discount rate of 7% per year was determined using the present value equation, which measures the present value of a series of equal payments (Cannual) over a number of time series:
Where
t varied from 1 to 50 years depending on the action. The expected cost of each strategy over 50 years was determined by summing Ci across all actions involved with implementing the strategy.
Figure A1 The participants were provided with a likelihood scale as a guide to predict the likelihood of strategy being implemented and would be successful if adopted
(Almost) certain
Probable
Likely
Fifty-fifty
Unlikely
Improbable
(Almost) impossible
100%
85
75
50
25
15
0

89
Optimal solutions for securing species at fixed persistence threshold
A multi-objective optimisation problem was solved to identify the optimal groups of strategies that maximise the number of species above a persistence threshold (50%, 70% and 90%) at a minimum cost. Our optimal solutions are Pareto optimal solutions (Nemhauser & Ullmann 1969). The set of optimal strategies that maximises the number of species above a given persistence threshold (τ) and minimises the cost of implementing these strategies was found:
Where:
xi is a binary decision variable that denotes whether or not each strategy is included in the optimal set of strategies. xi has value 1 if the strategy is selected and has value 0 otherwise. A vector x∈{x1,x2,…,xS} represents a combination of selected strategies.
Pij identifies whether species j is expected to reach a given persistence threshold if strategy i is implemented. Pij has value 1 if the expected benefit of applying strategy i for species j is above the persistence threshold i.e. BijFi + B0j >τ with
.
Pij has value 0 if this threshold is not exceeded.
S is the total number of strategies being considered (S=11).
Mj is the number of experts who estimated the persistence for species j.
We solve this multi-objective combinatorial optimisation problem by iteratively removing the dominant decisions, identifying suboptimal group of strategies. A decision x’ is dominated by a decision x if it secures fewer species and is more expensive to implement.
Swift parrot Lathamus discoloris listed as endangered under both the EPBC Act and under Queensland’s Nature Conservation Act 1992 and as medium priority under the Back on Track framework. Although swift parrots breed in the eastern coast of Tasmania, they migrate to mainland Australia in autumn to the dry open, box ironbark forests and woodlands. Habitat loss is a big threat to this species.
Mat & Cathy Gilfedder

90
Sensitivity and uncertainty analysis
An uncertainty analysis was performed on the cost-effectiveness of each strategy based upon the persistence probabilities for each species as provided during the structured elicitation process. Within the structured expert elicitation process, experts provided a most likely, low and high persistence probability for each species, as well as the confidence level associated with these bounds. The uncertainty analysis involved 10,000 iterations of a Monte Carlo simulation with values within each iteration generated from a constrained beta-PERT distribution. In each iteration, the values from the beta-PERT distribution for each species were seeded with a random number, and incorporated the probability values provided by each expert for each species (McBride et al. 2012). This enabled the quantification of the model confidence levels for each strategy based upon the range of likely outcomes and considers the minimum bounds (most pessimistic), maximum bounds (most optimistic) and mean (most likely) outcomes
for the cost effectiveness of each management strategy.
The uncertainty analysis indicated that the strategies were reasonably robust to the uncertainty associated with the persistence estimates of the 179 species under each strategy. The uncertainty
analysis demonstrated a clear benefit associated with the cost effectiveness of the leading management strategies, with the most pessimistic outcome associated with the fire management strategy providing better outcomes over the most optimistic values of the other strategies (Figure A2).
10
Common vision
Co
st-e
�ec
tive
ness
No common vision
8
6
4
2
0
1 re
mn
ant
2 re
gro
wth
3 ke
y B
D a
reas
4 r
esto
re h
abit
at
5 p
est
anim
als
6 in
vasi
ve p
lan
ts
7 fi
re r
egim
es
8 g
razi
ng
9 h
ydro
log
y
10 p
ollu
tio
n
11 a
ll
10
8
6
4
2
0
1 re
mn
ant
2 re
gro
wth
3 ke
y B
D a
reas
4 r
esto
re h
abit
at
5 p
est
anim
als
6 in
vasi
ve p
lan
ts
7 fi
re r
egim
es
8 g
razi
ng
9 h
ydro
log
y
10 p
ollu
tio
n
11 a
ll
Figure A2 Uncertainty analysis on the cost-effectiveness of each strategy based upon the persistence probabilities for each species as provided during the structured elicitation process
Appendix 2: Extended results

91
The uncertainty analysis of the species persistence probabilities was complemented by a sensitivity analysis of the three model input components (the persistence probabilities, the feasibility and the expected cost of each management strategy) to assess their relative influence within the model structure. This analysis was based on 10,000 samples of each model input from a uniform distribution ranging from 70% to 130% of the original input value to assess the relative contribution of each model input within the model structure. The uniform distribution was selected, to be assumption-free, as both cost and feasibility values were considered as most likely values only. The model outputs associated with each combination of randomly-scaled inputs was assessed using Variance Partitioning with Partial Redundancy Analysis to quantify the influence of the values of each parameter in contributing to the model outputs within the structure of the model. Variance Partitioning provides a non-parametric method for conducting direct explanatory analysis in which the association among output values is assessed according to
their relationship between the parameter and the response output (Peres-Neto et al. 2006).
The sensitivity analysis demonstrated that the model was suitably sensitive to the model inputs, with proportional changes in persistence probabilities, costs and feasibilities being reflected in model
outputs. This analysis demonstrates that each of the model inputs are equitably associated with model results (Figure A3) given the structure of the model and the range in analysis inputs (species values account for 32% of the variability; feasibility accounts for 32% and cost accounts for 33%).
Figure A3 Relative contribution of the different input components of the model (species persistence probabilities, strategy cost and feasibility) in determining the model outputs.
0.33
0.32
PERSISTENCEPROBABILITIES FEASIBILITY
COST
0.32
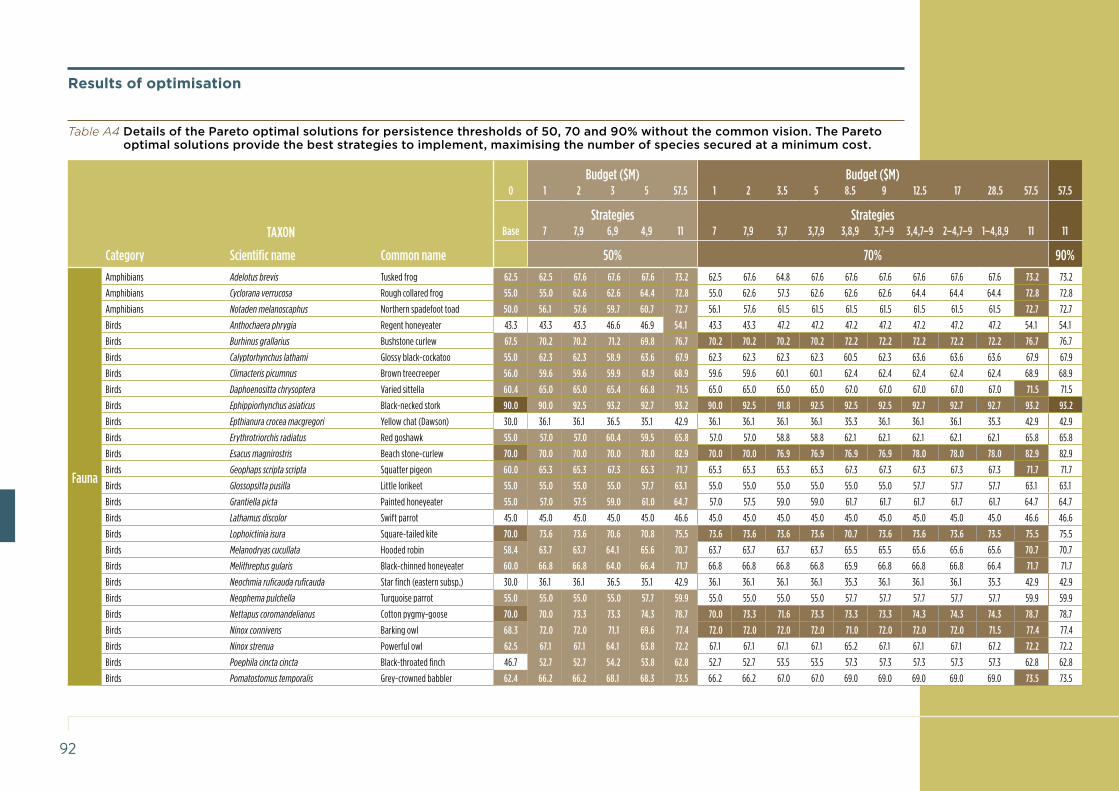
92
Budget ($M) Budget ($M)0 1 2 3 5 57.5 1 2 3.5 5 8.5 9 12.5 17 28.5 57.5 57.5
Strategies StrategiesTAXON Base 7 7,9 6,9 4,9 11 7 7,9 3,7 3,7,9 3,8,9 3,7–9 3,4,7–9 2–4,7–9 1–4,8,9 11 11
Category Scientific name Common name 50% 70% 90%
Fauna
Amphibians Adelotus brevis Tusked frog 62.5 62.5 67.6 67.6 67.6 73.2 62.5 67.6 64.8 67.6 67.6 67.6 67.6 67.6 67.6 73.2 73.2
Amphibians Cyclorana verrucosa Rough collared frog 55.0 55.0 62.6 62.6 64.4 72.8 55.0 62.6 57.3 62.6 62.6 62.6 64.4 64.4 64.4 72.8 72.8
Amphibians Notaden melanoscaphus Northern spadefoot toad 50.0 56.1 57.6 59.7 60.7 72.7 56.1 57.6 61.5 61.5 61.5 61.5 61.5 61.5 61.5 72.7 72.7
Birds Anthochaera phrygia Regent honeyeater 43.3 43.3 43.3 46.6 46.9 54.1 43.3 43.3 47.2 47.2 47.2 47.2 47.2 47.2 47.2 54.1 54.1
Birds Burhinus grallarius Bushstone curlew 67.5 70.2 70.2 71.2 69.8 76.7 70.2 70.2 70.2 70.2 72.2 72.2 72.2 72.2 72.2 76.7 76.7
Birds Calyptorhynchus lathami Glossy black-cockatoo 55.0 62.3 62.3 58.9 63.6 67.9 62.3 62.3 62.3 62.3 60.5 62.3 63.6 63.6 63.6 67.9 67.9
Birds Climacteris picumnus Brown treecreeper 56.0 59.6 59.6 59.9 61.9 68.9 59.6 59.6 60.1 60.1 62.4 62.4 62.4 62.4 62.4 68.9 68.9
Birds Daphoenositta chrysoptera Varied sittella 60.4 65.0 65.0 65.4 66.8 71.5 65.0 65.0 65.0 65.0 67.0 67.0 67.0 67.0 67.0 71.5 71.5
Birds Ephippiorhynchus asiaticus Black-necked stork 90.0 90.0 92.5 93.2 92.7 93.2 90.0 92.5 91.8 92.5 92.5 92.5 92.7 92.7 92.7 93.2 93.2
Birds Epthianura crocea macgregori Yellow chat (Dawson) 30.0 36.1 36.1 36.5 35.1 42.9 36.1 36.1 36.1 36.1 35.3 36.1 36.1 36.1 35.3 42.9 42.9
Birds Erythrotriorchis radiatus Red goshawk 55.0 57.0 57.0 60.4 59.5 65.8 57.0 57.0 58.8 58.8 62.1 62.1 62.1 62.1 62.1 65.8 65.8
Birds Esacus magnirostris Beach stone-curlew 70.0 70.0 70.0 70.0 78.0 82.9 70.0 70.0 76.9 76.9 76.9 76.9 78.0 78.0 78.0 82.9 82.9
Birds Geophaps scripta scripta Squatter pigeon 60.0 65.3 65.3 67.3 65.3 71.7 65.3 65.3 65.3 65.3 67.3 67.3 67.3 67.3 67.3 71.7 71.7
Birds Glossopsitta pusilla Little lorikeet 55.0 55.0 55.0 55.0 57.7 63.1 55.0 55.0 55.0 55.0 55.0 55.0 57.7 57.7 57.7 63.1 63.1
Birds Grantiella picta Painted honeyeater 55.0 57.0 57.5 59.0 61.0 64.7 57.0 57.5 59.0 59.0 61.7 61.7 61.7 61.7 61.7 64.7 64.7
Birds Lathamus discolor Swift parrot 45.0 45.0 45.0 45.0 45.0 46.6 45.0 45.0 45.0 45.0 45.0 45.0 45.0 45.0 45.0 46.6 46.6
Birds Lophoictinia isura Square-tailed kite 70.0 73.6 73.6 70.6 70.8 75.5 73.6 73.6 73.6 73.6 70.7 73.6 73.6 73.6 73.5 75.5 75.5
Birds Melanodryas cucullata Hooded robin 58.4 63.7 63.7 64.1 65.6 70.7 63.7 63.7 63.7 63.7 65.5 65.5 65.6 65.6 65.6 70.7 70.7
Birds Melithreptus gularis Black-chinned honeyeater 60.0 66.8 66.8 64.0 66.4 71.7 66.8 66.8 66.8 66.8 65.9 66.8 66.8 66.8 66.4 71.7 71.7
Birds Neochmia ruficauda ruficauda Star finch (eastern subsp.) 30.0 36.1 36.1 36.5 35.1 42.9 36.1 36.1 36.1 36.1 35.3 36.1 36.1 36.1 35.3 42.9 42.9
Birds Neophema pulchella Turquoise parrot 55.0 55.0 55.0 55.0 57.7 59.9 55.0 55.0 55.0 55.0 57.7 57.7 57.7 57.7 57.7 59.9 59.9
Birds Nettapus coromandelianus Cotton pygmy-goose 70.0 70.0 73.3 73.3 74.3 78.7 70.0 73.3 71.6 73.3 73.3 73.3 74.3 74.3 74.3 78.7 78.7
Birds Ninox connivens Barking owl 68.3 72.0 72.0 71.1 69.6 77.4 72.0 72.0 72.0 72.0 71.0 72.0 72.0 72.0 71.5 77.4 77.4
Birds Ninox strenua Powerful owl 62.5 67.1 67.1 64.1 63.8 72.2 67.1 67.1 67.1 67.1 65.2 67.1 67.1 67.1 67.2 72.2 72.2
Birds Poephila cincta cincta Black-throated finch 46.7 52.7 52.7 54.2 53.8 62.8 52.7 52.7 53.5 53.5 57.3 57.3 57.3 57.3 57.3 62.8 62.8
Birds Pomatostomus temporalis Grey-crowned babbler 62.4 66.2 66.2 68.1 68.3 73.5 66.2 66.2 67.0 67.0 69.0 69.0 69.0 69.0 69.0 73.5 73.5
Results of optimisation
Table A4 Details of the Pareto optimal solutions for persistence thresholds of 50, 70 and 90% without the common vision. The Pareto optimal solutions provide the best strategies to implement, maximising the number of species secured at a minimum cost.

93
Budget ($M) Budget ($M)0 1 2 3 5 57.5 1 2 3.5 5 8.5 9 12.5 17 28.5 57.5 57.5
Strategies StrategiesTAXON Base 7 7,9 6,9 4,9 11 7 7,9 3,7 3,7,9 3,8,9 3,7–9 3,4,7–9 2–4,7–9 1–4,8,9 11 11
Category Scientific name Common name 50% 70% 90%
Fauna
Birds Pyrrholaemus sagittatus Speckled warbler 61.5 67.6 67.6 67.8 69.8 74.4 67.6 67.6 67.6 67.6 69.8 69.8 69.8 69.8 69.8 74.4 74.4
Birds Rostratula australis Australian painted snipe 50.0 54.6 58.9 58.9 59.4 62.9 54.6 58.9 55.7 58.9 58.9 58.9 59.4 59.4 59.4 62.9 62.9
Birds Stagonopleura guttata Diamond firetail 53.3 55.4 55.4 57.6 58.7 63.0 55.4 55.4 56.4 56.4 60.4 60.4 60.4 60.4 60.4 63.0 63.0
Birds Sternula albifrons Little tern 50.0 50.0 50.0 50.0 50.0 50.0 50.0 50.0 50.0 50.0 50.0 50.0 50.0 50.0 50.0 50.0 50.0
Birds Stictonetta naevosa Freckled duck 70.0 70.0 73.3 73.3 74.3 78.7 70.0 73.3 71.6 73.3 73.3 73.3 74.3 74.3 74.3 78.7 78.7
Birds Tadorna radjah Radjah shelduck 90.0 90.0 91.5 91.5 93.2 94.5 90.0 91.5 93.2 93.2 93.2 93.2 93.2 93.2 93.2 94.5 94.5
Birds Turnix melanogaster Black-breasted button-quail 52.5 61.6 61.6 54.1 60.5 71.9 61.6 61.6 61.6 61.6 58.2 61.6 61.6 61.6 60.5 71.9 71.9
Birds Tyto novaehollandiae Masked owl 40.0 46.1 46.1 40.0 40.0 46.5 46.1 46.1 46.1 46.1 44.6 46.1 46.1 46.1 44.7 46.5 46.5
Fish Bidyanus bidyanus Silver perch 45.0 45.0 50.1 50.1 50.1 56.3 45.0 50.1 46.1 50.1 50.1 50.1 50.1 50.1 50.1 56.3 56.3
Fish Gadopsis marmoratus River blackfish 60.0 60.0 63.8 63.8 64 74.6 60.0 63.8 61.1 63.8 63.8 63.8 64.0 67.4 67.4 74.6 74.6
Fish Maccullochella mariensis Mary River cod 60.0 60.0 65.1 65.1 65.1 72.9 60.0 65.1 60.0 65.1 65.1 65.1 65.1 65.1 65.1 72.9 72.9
Fish Maccullochella peelii Murray cod 75.0 75.0 77.5 77.5 77.5 81.5 75.0 77.5 76.1 77.5 77.5 77.5 77.5 77.5 77.5 81.5 81.5
Fish Mogurnda adspersa Purple spotted gudgeon 66.7 66.7 71.7 71.7 71.7 78.5 66.7 71.7 69.0 71.7 71.7 71.7 71.7 71.7 71.7 78.5 78.5
Fish Neoceratodus forsteri Australian lungfish 56.7 56.7 60.9 60.9 61.1 67.5 56.7 60.9 57.4 60.9 60.9 60.9 61.1 61.1 61.1 67.5 67.5
Fish Pristis microdon Freshwater sawfish 50.0 50.0 55.1 55.1 55.1 56.5 50.0 55.1 50.0 55.1 55.1 55.1 55.1 55.1 55.1 56.5 56.5
Invertebrates Acrodipsas illidgei Illidge’s ant-blue 50.0 50.0 50.0 50.0 50.0 56.5 50.0 50.0 54.6 54.6 54.6 54.6 54.6 54.6 54.7 56.5 56.5
Invertebrates Adclarkia dawsonensis Boggomoss snail 30.0 42.1 42.1 40.2 40.7 49.4 42.1 42.1 42.1 42.1 40.7 42.1 42.1 42.1 40.7 49.4 49.4
Invertebrates Euastacus armatus Spiny crayfish 55.0 55.0 58.8 58.8 58.8 66.3 55.0 58.8 56.1 58.8 58.8 58.8 58.8 58.8 58.8 66.3 66.3
Invertebrates Hypochrysops piceata Bulloak jewel (butterfly) 50.0 56.1 56.1 50.0 55.4 62.9 56.1 56.1 56.1 56.1 50.0 56.1 56.1 56.1 55.4 62.9 62.9
Mammals Aepyprymnus rufescens Rufous bettong 60.0 66.1 66.1 68.1 61.3 77.8 66.1 66.1 66.1 66.1 68.0 68.0 68.0 68.0 68.0 77.8 77.8
Mammals Chalinolobus picatus Little pied bat 65.0 72.6 72.6 65.0 67.7 81.2 72.6 72.6 72.6 72.6 68.4 72.6 72.6 72.6 74.4 81.2 81.2
Mammals Dasyurus hallucatus Northern quoll 46.7 49.7 49.7 53.1 50.2 60.7 49.7 49.7 52.8 52.8 55.6 55.6 55.6 55.6 55.6 60.7 60.7
Mammals Lagorchestes conspicillatus Spectacled hare-wallaby 60.0 67.6 67.6 69.7 68.0 79.4 67.6 67.6 67.6 67.6 70.7 70.7 70.7 70.7 70.7 79.4 79.4
Mammals Lasiorhinus krefftii Northern hairy-nosed wombat 20.0 26.1 26.1 26.5 20.0 32.9 26.1 26.1 26.1 26.1 24.6 26.1 26.1 26.1 24.6 32.9 32.9
Mammals Macroderma gigas Ghost bat 50.0 50.0 50.0 50.0 58.0 62.9 50.0 50.0 56.9 56.9 56.9 56.9 58.0 58.0 58.0 62.9 62.9
Mammals Onychogalea fraenata Bridled nailtail wallaby 46.7 56.8 56.8 53.1 52.0 63.9 56.8 56.8 56.8 56.8 53.8 56.8 56.8 56.8 53.8 63.9 63.9
Mammals Petrogale penicillata Brush-tailed rock-wallaby 30.0 36.1 36.1 30.0 30.0 36.5 36.1 36.1 36.1 36.1 35.3 36.1 36.1 36.1 35.3 36.5 36.5
Mammals Phascolarctos cinereus Koala (Brigalow Belt region) 35.0 49.2 49.2 35.0 47.5 57.7 49.2 49.2 49.2 49.2 48.8 49.2 49.2 49.2 48.8 57.7 57.7
Mammals Pseudomys patrius Eastern pebble-mound mouse 50.0 59.1 59.1 50.0 50.0 62.9 59.1 59.1 59.1 59.1 52.7 59.1 59.1 59.1 52.7 62.9 62.9
Mammals Pteropus poliocephalus Grey-headed flying-fox 20.0 20.0 25.1 25.1 25.4 32.9 20.0 25.1 20.0 25.1 25.1 25.1 25.4 25.4 25.4 32.9 32.9
Mammals Saccolaimus saccolaimus nudicluniatus Bare-rumped sheathtail bat 60.0 60.0 60.0 60.0 60.0 69.7 60.0 60.0 66.9 66.9 66.9 66.9 66.9 66.9 66.9 69.7 69.7
Mammals Taphozous australis Coastal sheathtail bat 65.0 65.0 65.0 68.2 67.7 76.3 65.0 65.0 70.7 70.7 70.7 70.7 70.7 70.7 70.7 76.3 76.3

94
Budget ($M) Budget ($M)0 1 2 3 5 57.5 1 2 3.5 5 8.5 9 12.5 17 28.5 57.5 57.5
Strategies StrategiesTAXON Base 7 7,9 6,9 4,9 11 7 7,9 3,7 3,7,9 3,8,9 3,7–9 3,4,7–9 2–4,7–9 1–4,8,9 11 11
Category Scientific name Common name 50% 70% 90%
Fauna
Mammals Xeromys myoides Water mouse 30.0 30.0 35.1 35.1 35.1 36.5 30.0 35.1 34.6 35.1 35.1 35.1 35.1 35.1 35.1 36.5 36.5
Reptiles Acanthophis antarcticus Common death adder 46.7 53.8 53.8 58.5 56.5 62.6 53.8 53.8 53.8 53.8 53.8 53.8 56.5 56.5 56.5 62.6 62.6
Reptiles Anomalopus mackayi Long-legged worm-skink 45.0 66.3 66.3 64.4 63.7 70.9 66.3 66.3 66.3 66.3 62.8 66.3 66.3 66.3 63.7 70.9 70.9
Reptiles Aspidites ramsayi Woma 53.3 57.9 57.9 58.2 56.0 67.4 57.9 57.9 57.9 57.9 60.0 60.0 60.0 60.0 60.0 67.4 67.4
Reptiles Delma inornata 50.0 59.1 59.1 69.4 66.1 75.9 59.1 59.1 66.0 66.0 68.7 68.7 68.7 68.7 68.7 75.9 75.9
Reptiles Delma labialis Striped-tailed delma 60.0 66.1 66.1 60.0 61.3 66.5 66.1 66.1 66.1 66.1 61.1 66.1 66.1 66.1 63.5 66.5 66.5
Reptiles Delma torquata Collared delma 63.3 63.3 65.9 66.6 65.9 74.1 63.3 65.9 66.4 66.4 66.9 66.9 66.9 66.9 66.9 74.1 74.1
Reptiles Denisonia maculata Ornamental snake 52.5 63.1 63.1 58.9 71.2 75.2 63.1 63.1 64.0 64.0 64.0 64.0 71.2 71.2 71.2 75.2 75.2
Reptiles Egernia rugosa Yakka skink 58.3 62.4 62.4 63.2 64.6 69.1 62.4 62.4 62.4 62.4 62.2 62.4 64.6 64.6 64.6 69.1 69.1
Reptiles Elseya albagula Snapping turtle from Broken River 70.0 70.0 77.6 77.6 77.6 82.9 70.0 77.6 74.6 77.6 77.6 77.6 77.6 77.6 77.6 82.9 82.9
Reptiles Furina barnardi Yellow-naped snake 85.0 85.0 85.0 86.9 86.6 93.4 85.0 85.0 86.4 86.4 86.4 86.4 86.6 86.6 86.6 93.4 93.4
Reptiles Furina dunmalli Dunmall’s snake 67.5 67.5 67.5 67.5 67.5 74.0 67.5 67.5 67.5 67.5 67.5 67.5 67.5 70.7 70.7 74.0 74.0
Reptiles Hemiaspis damelii Grey snake 45.0 66.3 66.3 64.4 63.7 70.9 66.3 66.3 66.3 66.3 62.8 66.3 66.3 66.3 63.7 70.9 70.9
Reptiles Lerista allanae Retro slider 37.5 40.5 40.5 41.7 46.9 48.8 40.5 40.5 45.5 45.5 45.5 45.5 46.9 46.9 46.9 48.8 48.8
Reptiles Lerista karlschmiditi 40.0 40.0 40.0 49.7 50.7 56.2 40.0 40.0 49.2 49.2 49.2 49.2 50.7 50.7 50.7 56.2 56.2
Reptiles Paradelma orientalis Brigalow scaly-foot 57.5 62.6 62.6 59.9 59.0 72.4 62.6 62.6 62.6 62.6 60.9 62.6 62.6 62.6 61.0 72.4 72.4
Reptiles Rheodytes leukops Fitzroy River turtle 60.0 60.0 66.4 66.4 66.4 71.3 60.0 66.4 64.6 66.4 66.4 66.4 66.4 66.4 66.4 71.3 71.3
Reptiles Strophurus taenicauda Golden-tailed gecko 66.7 69.7 69.7 68.8 68.5 78.1 69.7 69.7 69.7 69.7 68.2 69.7 69.7 69.7 70.6 78.1 78.1
Reptiles Tympanocryptis condaminensis Condamine earless dragon 20.0 20.0 20.0 20.0 30.7 32.9 20.0 20.0 29.2 29.2 29.2 29.2 30.7 30.7 30.7 32.9 32.9
Flora
Brigalow Homopholis belsonii Belson's panic 84.5 86.1 86.1 86.2 85.8 86.2 86.1 86.1 86.1 86.1 85.9 86.1 86.1 86.1 85.9 86.2 86.2
Brigalow Rutidosis lanata 79.5 81.1 81.1 80.8 80.8 81.2 81.1 81.1 81.1 81.1 80.9 81.1 81.1 81.1 80.9 81.2 81.2
Brigalow Solanum adenophorum Hairy nightshade 84.5 86.1 86.1 86.2 85.8 86.2 86.1 86.1 86.1 86.1 85.9 86.1 86.1 86.1 85.9 86.2 86.2
Brigalow Solanum dissectum 99.0 99.0 99.0 99.0 99.0 99.0 99.0 99.0 99.0 99.0 99.0 99.0 99.0 99.0 99.0 99.0 99.0
Brigalow Solanum elachophyllum 99.0 99.0 99.0 99.0 99.0 99.0 99.0 99.0 99.0 99.0 99.0 99.0 99.0 99.0 99.0 99.0 99.0
Brigalow Solanum johnsonianum 70.0 73.1 73.1 73.3 72.7 83.2 73.1 73.1 73.1 73.1 78.1 78.1 78.1 78.1 78.1 83.2 83.2
Brigalow Xerothamnella herbacea 99.0 99.0 99.0 99.0 99.0 99.0 99.0 99.0 99.0 99.0 99.0 99.0 99.0 99.0 99.0 99.0 99.0
Brigalow Rutidosis crispata 79.5 82.6 82.6 82.1 82.1 82.8 82.6 82.6 82.6 82.6 82.1 82.6 82.6 82.6 82.1 82.8 82.8
Ephemeral wetlands and riparian zones
Paspalidium udum 79.5 85.7 85.7 86.1 82.2 91.1 85.7 85.7 85.7 85.7 87.6 87.6 87.6 87.6 87.6 91.1 91.1
Ephemeral wetlands and riparian zones
Livistona lanuginosa Waxy cabbage palm 99.0 99.0 99.0 99.0 99.0 99.0 99.0 99.0 99.0 99.0 99.0 99.0 99.0 99.0 99.0 99.0 99.0
Ephemeral wetlands and riparian zones
Picris barbarorum Plains picris 84.5 86.1 86.1 86.2 85.9 86.2 86.1 86.1 86.1 86.1 85.8 86.1 86.1 86.1 85.9 86.2 86.2

95
Budget ($M) Budget ($M)0 1 2 3 5 57.5 1 2 3.5 5 8.5 9 12.5 17 28.5 57.5 57.5
Strategies StrategiesTAXON Base 7 7,9 6,9 4,9 11 7 7,9 3,7 3,7,9 3,8,9 3,7–9 3,4,7–9 2–4,7–9 1–4,8,9 11 11
Category Scientific name Common name 50% 70% 90%
Flora
Ephemeral wetlands and riparian zones
Microcarpaea agonis 70.0 73.1 73.1 73.3 72.7 76.6 73.1 73.1 73.1 73.1 72.7 73.1 73.1 73.1 72.7 76.6 76.6
Grasslands Bothriocloa bunyensis Bunya Mountains bluegrass 70.0 70.0 70.0 73.3 70.0 73.3 70.0 70.0 72.5 72.5 72.5 72.5 72.5 72.5 72.5 73.3 73.3
Grasslands Cymbonotus maidenii 61.8 68.7 68.7 67.8 67.8 75.0 68.7 68.7 68.7 68.7 69.9 69.9 69.9 69.9 69.9 75.0 75.0
Grasslands Cyperus clarus 84.5 86.1 86.1 86.2 85.8 86.2 86.1 86.1 86.1 86.1 85.9 86.1 86.1 86.1 85.9 86.2 86.2
Grasslands Dichanthium queenslandicum King blue-grass 60.0 60.0 60.0 60.0 60.0 60.0 60.0 60.0 60.0 60.0 60.0 60.0 60.0 60.0 60.0 60.0 60.0
Grasslands Picris evae Hawk weed 99.0 99.0 99.0 99.0 99.0 99.0 99.0 99.0 99.0 99.0 99.0 99.0 99.0 99.0 99.0 99.0 99.0
Grasslands Solanum papaverifolium 63.3 65.4 65.4 65.5 65.1 78.8 65.4 65.4 69.2 69.2 69.2 69.2 69.2 69.2 69.2 78.8 78.8
Grasslands Swainsona murrayana Slender darling pea 74.5 77.6 77.6 79.5 77.2 89.4 77.6 77.6 83.3 83.3 83.3 83.3 83.3 83.3 83.3 89.4 89.4
Grasslands Thesium australe Austral toad-flax 99.0 99.0 99.0 99.0 99.0 99.0 99.0 99.0 99.0 99.0 99.0 99.0 99.0 99.0 99.0 99.0 99.0
Grasslands Trioncinia retroflexa 99.0 99.0 99.0 99.0 99.0 99.0 99.0 99.0 99.0 99.0 99.0 99.0 99.0 99.0 99.0 99.0 99.0
NVF Clematis fawcettii Northern clematis 99.0 99.0 99.0 99.0 99.0 99.0 99.0 99.0 99.0 99.0 99.0 99.0 99.0 99.0 99.0 99.0 99.0
NVF Cossinia australiana Cossinia 99.0 99.0 99.0 99.0 99.0 99.0 99.0 99.0 99.0 99.0 99.0 99.0 99.0 99.0 99.0 99.0 99.0
NVF Cupaniopsis shirleyana Kooraloo 99.0 99.0 99.0 99.0 99.0 99.0 99.0 99.0 99.0 99.0 99.0 99.0 99.0 99.0 99.0 99.0 99.0
NVF Fontainea rostrata Deep Creek fontainea 75.0 75.0 75.0 80.0 75.0 80.0 75.0 75.0 75.0 75.0 79.1 79.1 79.1 79.1 79.1 80.0 80.0
NVF Lastreopsis silvestris 70.0 70.0 70.0 70.0 75.4 76.6 70.0 70.0 75.0 75.0 75.0 75.0 75.4 75.4 75.4 76.6 76.6
NVF (edges) Corchorus hygrophilus 69.8 73.7 73.7 75.5 74.5 83.0 73.7 73.7 74.8 74.8 74.8 74.8 74.8 74.8 75.0 83.0 83.0
NVF (edges) Ozothamnus eriocephalus 67.5 70.6 70.6 72.5 70.2 84.0 70.6 70.6 76.3 76.3 79.7 79.7 79.7 79.7 79.7 84.0 84.0
Open forests and woodlands Aristida granitica 90.0 90.0 92.6 92.6 92.6 93.3 90.0 92.6 92.5 92.6 92.6 92.6 92.6 92.6 92.6 93.3 93.3
Open forests and woodlands Acacia argyrotricha 99.0 99.0 99.0 99.0 99.0 99.0 99.0 99.0 99.0 99.0 99.0 99.0 99.0 99.0 99.0 99.0 99.0
Open forests and woodlands Acacia curranii Curly-bark wattle 99.0 99.0 99.0 99.0 99.0 99.0 99.0 99.0 99.0 99.0 99.0 99.0 99.0 99.0 99.0 99.0 99.0
Open forests and woodlands Acacia deuteroneura 73.3 76.5 76.5 78.6 76.0 80.8 76.5 76.5 76.5 76.5 76.5 76.5 76.5 76.5 77.1 80.8 80.8
Open forests and woodlands Acacia handonis Hando's wattle 65.0 68.1 68.1 71.6 67.7 78.2 68.1 68.1 70.0 70.0 70.0 70.0 70.0 70.0 70.0 78.2 78.2
Open forests and woodlands Acacia hockingsii 80.0 81.6 81.6 81.7 81.3 83.3 81.6 81.6 81.6 81.6 81.3 81.6 81.6 81.6 82.3 83.3 83.3
Open forests and woodlands Acacia islana Isla Gorge wattle 90.0 90.0 90.0 90.0 90.0 96.0 90.0 90.0 94.5 94.5 94.5 94.5 94.5 94.5 94.5 96.0 96.0
Open forests and woodlands Acacia lauta Tara wattle 50.0 50.0 50.0 50.0 50.0 63.2 50.0 50.0 60.0 60.0 60.0 60.0 60.0 60.0 60.0 63.2 63.2
Open forests and woodlands Acacia pedleyi 80.0 81.6 81.6 81.7 81.4 81.7 81.6 81.6 81.6 81.6 81.4 81.6 81.6 81.6 81.4 81.7 81.7
Open forests and woodlands Acacia tingoorensis 69.8 69.0 69.0 68.0 66.2 77.9 69.0 69.0 69.5 69.5 70.5 70.5 70.5 70.5 70.5 77.9 77.9
Open forests and woodlands Apatophyllum flavovirens 80.0 80.0 80.0 80.0 80.0 86.6 80.0 80.0 85.0 85.0 85.4 85.4 85.4 85.4 85.4 86.6 86.6
Open forests and woodlands Aristida annua 90.0 90.0 90.0 96.0 90.0 96.0 90.0 90.0 94.5 94.5 94.5 94.5 94.5 94.5 94.5 96.0 96.0
Open forests and woodlands Bertya calycina 60.0 60.0 60.0 60.0 60.0 60.0 60.0 60.0 60.0 60.0 60.0 60.0 60.0 60.0 60.0 60.0 60.0
Open forests and woodlands Bertya granitica 70.0 76.2 76.2 76.6 70.0 76.6 76.2 76.2 76.2 76.2 70.0 76.2 76.2 76.2 70.0 76.6 76.6

96
Budget ($M) Budget ($M)0 1 2 3 5 57.5 1 2 3.5 5 8.5 9 12.5 17 28.5 57.5 57.5
Strategies StrategiesTAXON Base 7 7,9 6,9 4,9 11 7 7,9 3,7 3,7,9 3,8,9 3,7–9 3,4,7–9 2–4,7–9 1–4,8,9 11 11
Category Scientific name Common name 50% 70% 90%
Flora
Open forests and woodlands Commersonia pearnii 74.5 77.6 77.6 77.8 77.2 87.7 77.6 77.6 77.6 77.6 82.6 82.6 82.6 82.6 82.6 87.7 87.7
Open forests and woodlands Corymbia clandestina 76.3 82.6 82.6 77.4 77.2 86.3 82.6 82.6 82.6 82.6 81.3 82.6 82.6 82.6 81.8 86.3 86.3
Open forests and woodlands Cycas megacarpa 99.0 99.0 99.0 99.0 99.0 99.0 99.0 99.0 99.0 99.0 99.0 99.0 99.0 99.0 99.0 99.0 99.0
Open forests and woodlands Daviesia discolor 99.0 99.0 99.0 99.0 99.0 99.0 99.0 99.0 99.0 99.0 99.0 99.0 99.0 99.0 99.0 99.0 99.0
Open forests and woodlands Daviesia quoquoversus 99.0 99.0 99.0 99.0 99.0 99.0 99.0 99.0 99.0 99.0 99.0 99.0 99.0 99.0 99.0 99.0 99.0
Open forests and woodlands Eucalyptus argophloia Chinchilla white gum 99.0 99.0 99.0 99.0 99.0 99.0 99.0 99.0 99.0 99.0 99.0 99.0 99.0 99.0 99.0 99.0 99.0
Open forests and woodlands Eucalyptus pachycalyx subsp. waajensis Pumpkin gum 90.0 90.0 90.0 90.0 90.0 90.0 90.0 90.0 90.0 90.0 90.0 90.0 90.0 90.0 90.0 90.0 90.0
Open forests and woodlands Eucalyptus paedoglauca Mt Stuart ironbark 99.0 99.0 99.0 99.0 99.0 99.0 99.0 99.0 99.0 99.0 99.0 99.0 99.0 99.0 99.0 99.0 99.0
Open forests and woodlands Eucalyptus virens Shiny-leaved ironbark 75.0 81.2 81.2 81.6 80.3 84.6 81.2 81.2 81.2 81.2 80.4 81.2 81.2 81.2 81.8 84.6 84.6
Open forests and woodlands Genoplesium pedersonii 80.0 81.6 81.6 81.3 81.3 81.7 81.6 81.6 81.6 81.6 81.3 81.6 81.6 81.6 81.3 81.7 81.7
Open forests and woodlands Genoplesium validum 80.0 81.6 81.6 81.7 81.3 81.7 81.6 81.6 81.6 81.6 81.4 81.6 81.6 81.6 81.4 81.7 81.7
Open forests and woodlands Homoranthus decumbens 74.5 77.6 77.6 77.8 77.2 86.1 77.6 77.6 77.6 77.6 82.6 82.6 82.6 82.6 82.6 86.1 86.1
Open forests and woodlands Homoranthus papillatus Mouse bush 66.7 70.8 70.8 73.1 69.4 78.6 70.8 70.8 71.5 71.5 73.9 73.9 73.9 73.9 73.9 78.6 78.6
Open forests and woodlands Leptospermum venustum 99.0 99.0 99.0 99.0 99.0 99.0 99.0 99.0 99.0 99.0 99.0 99.0 99.0 99.0 99.0 99.0 99.0
Open forests and woodlands Lissanthe brevistyla 99.0 99.0 99.0 99.0 99.0 99.0 99.0 99.0 99.0 99.0 99.0 99.0 99.0 99.0 99.0 99.0 99.0
Open forests and woodlands Macrozamia conferta 90.0 90.0 90.0 90.0 94.9 96.0 90.0 90.0 94.5 94.5 94.5 94.5 94.9 94.9 94.9 96.0 96.0
Open forests and woodlands Macrozamia crassifolia 99.0 99.0 99.0 99.0 99.0 99.0 99.0 99.0 99.0 99.0 99.0 99.0 99.0 99.0 99.0 99.0 99.0
Open forests and woodlands Macrozamia machinii 63.3 66.5 66.5 68.8 65.1 74.4 66.5 66.5 66.7 66.7 66.7 66.7 66.7 66.7 67.2 74.4 74.4
Open forests and woodlands Melaleuca irbyana Weeping paperbark 50.0 50.0 50.0 50.0 50.0 56.6 50.0 50.0 55.0 55.0 55.4 55.4 55.4 55.4 55.4 56.6 56.6
Open forests and woodlands Paspalidium batianoffii 99.0 99.0 99.0 99.0 99.0 99.0 99.0 99.0 99.0 99.0 99.0 99.0 99.0 99.0 99.0 99.0 99.0
Open forests and woodlands Philotheca sporadica Kogan waxflower 90.0 90.0 90.0 90.0 90.0 90.0 90.0 90.0 90.0 90.0 90.0 90.0 90.0 90.0 90.0 90.0 90.0
Open forests and woodlands Pomaderris coomingalensis 99.0 99.0 99.0 99.0 99.0 99.0 99.0 99.0 99.0 99.0 99.0 99.0 99.0 99.0 99.0 99.0 99.0
Open forests and woodlands Rhaponticum australe Native thistle 99.0 99.0 99.0 99.0 99.0 99.0 99.0 99.0 99.0 99.0 99.0 99.0 99.0 99.0 99.0 99.0 99.0
Open forests and woodlands Solanum stenopterum 99.0 99.0 99.0 99.0 99.0 99.0 99.0 99.0 99.0 99.0 99.0 99.0 99.0 99.0 99.0 99.0 99.0
Open forests and woodlands Trioncinia patens 61.7 66.9 67.8 67.8 67.8 73.8 66.9 67.8 66.9 67.8 67.8 67.8 67.8 67.8 67.9 73.8 73.8
Open forests and woodlands Westringia parvifolia 70.0 73.1 73.1 75.0 72.7 84.9 73.1 73.1 78.8 78.8 78.8 78.8 78.8 78.8 78.8 84.9 84.9
Open forests and woodlands Macrozamia cranei 84.5 86.1 86.1 85.8 85.8 86.2 86.1 86.1 86.1 86.1 85.9 86.1 86.1 86.1 85.9 86.2 86.2
Open shrublands and heathlands Rhaphidospora bonneyana 82.0 82.0 82.0 82.0 82.0 82.0 82.0 82.0 82.0 82.0 82.0 82.0 82.0 82.0 82.0 82.0 82.0
Open shrublands and heathlands Acacia barakulensis Waajie wattle 99.0 99.0 99.0 99.0 99.0 99.0 99.0 99.0 99.0 99.0 99.0 99.0 99.0 99.0 99.0 99.0 99.0
Open shrublands and heathlands Acacia porcata 99.0 99.0 99.0 99.0 99.0 99.0 99.0 99.0 99.0 99.0 99.0 99.0 99.0 99.0 99.0 99.0 99.0
Open shrublands and heathlands Acacia wardellii 84.5 87.6 87.6 84.5 87.2 87.8 87.6 87.6 87.6 87.6 84.5 87.6 87.6 87.6 87.2 87.8 87.8
Open shrublands and heathlands Aristida forsteri 62.5 62.5 63.8 63.8 63.8 70.8 62.5 63.8 67.5 67.5 67.5 67.5 67.5 67.5 67.5 70.8 70.8

97
Budget ($M) Budget ($M)0 1 2 3 5 57.5 1 2 3.5 5 8.5 9 12.5 17 28.5 57.5 57.5
Strategies StrategiesTAXON Base 7 7,9 6,9 4,9 11 7 7,9 3,7 3,7,9 3,8,9 3,7–9 3,4,7–9 2–4,7–9 1–4,8,9 11 11
Category Scientific name Common name 50% 70% 90%
Flora
Open shrublands and heathlands Calytrix gurulmundensis 82.0 85.1 85.1 85.3 82.0 85.3 85.1 85.1 85.1 85.1 82.0 85.1 85.1 85.1 82.0 85.3 85.3
Open shrublands and heathlands Micromyrtus carinata Gurulmundi heath-myrtle 75.0 76.6 76.6 75.0 75.0 76.7 76.6 76.6 76.6 76.6 75.0 76.6 76.6 76.6 76.2 76.7 76.7
Open shrublands and heathlands Micromyrtus patula 70.0 71.6 75.3 75.3 75.3 76.6 71.6 75.3 73.8 75.3 75.3 75.3 75.3 75.3 75.3 76.6 76.6
Permanent wetlands Eriocaulon carsonii Salt pipewort 63.3 65.4 65.4 65.5 65.1 78.8 65.4 65.4 69.2 69.2 69.2 69.2 69.2 69.2 69.2 78.8 78.8
Permanent wetlands Eriocaulon carsonii subsp. Orientale Salt pipewort 99.0 99.0 99.0 99.0 99.0 99.0 99.0 99.0 99.0 99.0 99.0 99.0 99.0 99.0 99.0 99.0 99.0
Permanent wetlands Myriophyllum artesium 80.0 81.6 81.6 81.7 81.3 81.7 81.6 81.6 81.6 81.6 81.4 81.6 81.6 81.6 81.4 81.7 81.7
Permanent wetlands Thelypteris confluens 69.8 69.5 69.5 67.4 69.0 78.5 69.5 69.5 76.4 76.4 76.4 76.4 76.4 76.4 76.4 78.5 78.5
Serpentine Hakea trineura Three-veined hakea 99.0 99.0 99.0 99.0 99.0 99.0 99.0 99.0 99.0 99.0 99.0 99.0 99.0 99.0 99.0 99.0 99.0
Serpentine Macrozamia serpentine 90.0 90.0 90.0 90.0 90.0 90.0 90.0 90.0 90.0 90.0 90.0 90.0 90.0 90.0 90.0 90.0 90.0
Serpentine Myrsine serpenticola 70.0 73.1 73.1 75.0 72.7 84.9 73.1 73.1 78.8 78.8 78.8 78.8 78.8 78.8 78.8 84.9 84.9
Serpentine Neoroepera buxifolia 70.0 73.1 73.1 72.6 72.6 73.3 73.1 73.1 73.1 73.1 72.6 73.1 73.1 73.1 72.6 73.3 73.3
Serpentine Pultenaea setulosa 65.0 67.3 67.3 67.5 67.0 77.4 67.3 67.3 71.9 71.9 71.9 71.9 71.9 71.9 72.0 77.4 77.4
Serpentine Capparis humistrata 80.0 80.0 80.0 83.3 82.7 83.3 80.0 80.0 80.0 80.0 82.7 82.7 82.7 82.7 82.7 83.3 83.3
Serpentine Capparis thozetiana 90.0 90.0 90.0 90.0 90.0 90.0 90.0 90.0 90.0 90.0 90.0 90.0 90.0 90.0 90.0 90.0 90.0
Serpentine Corymbia xanthope Glen Geddes bloodwood 99.0 99.0 99.0 99.0 99.0 99.0 99.0 99.0 99.0 99.0 99.0 99.0 99.0 99.0 99.0 99.0 99.0
Serpentine Cycas ophiolitica Marlborough blue 79.5 85.7 85.7 86.1 82.2 89.4 85.7 85.7 85.7 85.7 84.9 85.7 85.7 85.7 84.9 89.4 89.4
SEVT Atalaya collina Yarwun whitewood 53.3 58.5 58.5 63.3 60.6 72.1 58.5 58.5 59.2 59.2 62.3 62.3 62.3 62.3 62.3 72.1 72.1
SEVT Backhousia oligantha 61.7 66.9 67.8 67.8 67.8 73.8 66.9 67.8 66.9 67.8 67.8 67.8 67.8 67.8 67.9 73.8 73.8
SEVT Bursaria reevesii 90.0 90.0 90.0 90.0 90.0 90.0 90.0 90.0 90.0 90.0 90.0 90.0 90.0 90.0 90.0 90.0 90.0
SEVT Cadellia pentastylis Ooline 99.0 99.0 99.0 99.0 99.0 99.0 99.0 99.0 99.0 99.0 99.0 99.0 99.0 99.0 99.0 99.0 99.0
SEVT Croton magneticus 68.3 71.5 71.5 69.2 71.0 79.4 71.5 71.5 75.0 75.0 75.0 75.0 75.0 75.0 75.3 79.4 79.4
SEVT Decaspermum struckoilicum 99.0 99.0 99.0 99.0 99.0 99.0 99.0 99.0 99.0 99.0 99.0 99.0 99.0 99.0 99.0 99.0 99.0
SEVT Denhamia parvifolia Small-leaved denhamia 90.0 90.0 90.0 90.0 90.0 90.0 90.0 90.0 90.0 90.0 90.0 90.0 90.0 90.0 90.0 90.0 90.0
SEVT Eucalyptus raveretiana Black ironbox 73.0 77.2 77.2 78.5 76.6 80.7 77.2 77.2 78.0 78.0 79.3 79.3 79.3 79.3 79.3 80.7 80.7
SEVT Fontainea fugax 61.7 66.9 70.4 70.4 70.4 73.8 66.9 70.4 66.9 70.4 70.4 70.4 70.4 70.4 70.4 73.8 73.8
SEVT Haloragis exalata subsp. Velutina Tall velvet sea-berry 99.0 99.0 99.0 99.0 99.0 99.0 99.0 99.0 99.0 99.0 99.0 99.0 99.0 99.0 99.0 99.0 99.0
SEVT Polianthion minutiflorum 72.3 73.8 78.2 78.2 78.2 81.3 73.8 78.2 76.6 78.2 78.2 78.2 78.2 78.2 78.2 81.3 81.3
SEVT Pomaderris clivicola 99.0 99.0 99.0 99.0 99.0 99.0 99.0 99.0 99.0 99.0 99.0 99.0 99.0 99.0 99.0 99.0 99.0

98
Budget ($M) Budget ($M)0 1.2 2.2 2.7 3.7 57.7 1.2 2.2 2.7 3.2 3.7 4.7 5.2 6.7 8.2 8.7 9.2 12.2 12.7 13.2 17.2 29.7 57.7 57.7
Strategies StrategiesTAXON Base 7 7,9 6,9 4,9 11 7 7,9 6,7 3 3,6 3,9 3,7,9 3,6,7,9 3,7,8 3,7,9 3,7–9 2,3,7,8 2,3,8,9 2,3,7–9 2–4,7–9 2–5,7–9 11 11
Category Scientific name Common name 50% 70% 90%
Fauna
Amphibians Adelotus brevis Tusked frog 62.5 62.5 68.4 64.3 68.4 74.5 62.5 68.4 64.3 65.7 65.7 68.4 68.4 68.4 67.4 68.4 68.4 67.4 68.4 68.4 68.4 68.4 74.5 74.5
Amphibians Cyclorana verrucosa Rough collared frog 55.0 55.0 63.8 55.0 63.8 75.0 55.0 63.8 55.0 58.2 58.2 63.8 63.8 63.8 63.2 63.8 63.8 64.1 64.1 64.1 66.0 66.0 75.0 75.0
Amphibians Notaden melanoscaphus Northern spadefoot toad
50.0 56.5 58.8 60.9 60.9 75.5 56.5 58.8 60.9 66.0 66.0 66.0 66.0 66.0 66.0 66.0 66.0 66.0 66.0 66.0 66.0 66.0 75.5 75.5
Birds Anthochaera phrygia Regent honeyeater 43.3 43.3 43.3 47.0 47.0 55.5 43.3 43.3 47.0 48.7 48.7 48.7 48.7 48.7 48.7 48.7 48.7 48.7 48.7 48.7 48.7 48.7 55.5 55.5
Birds Burhinus grallarius Bushstone curlew 67.5 70.4 70.4 71.7 71.7 77.9 70.4 70.4 71.7 71.2 71.2 71.2 71.2 71.7 73.2 73.2 73.2 73.2 73.2 73.2 73.2 73.2 77.9 77.9
Birds Calyptorhynchus lathami Glossy black-cockatoo
55.0 62.8 62.8 62.8 62.8 69.6 62.8 62.8 62.8 62.7 62.8 62.7 62.8 62.8 62.8 62.7 62.8 63.5 63.5 63.5 65.0 65.0 69.6 69.6
Birds Climacteris picumnus Brown treecreeper 56.0 59.9 59.9 60.4 60.4 70.6 59.9 59.9 60.4 61.8 61.8 61.8 61.8 61.8 63.9 63.9 63.9 63.9 63.9 63.9 63.9 63.9 70.6 70.6
Birds Daphoenositta chrysoptera
Varied sittella 60.4 65.3 65.3 66.1 66.1 72.9 65.3 65.3 66.1 66.2 66.2 66.2 66.2 66.2 68.5 68.5 68.5 68.5 68.5 68.5 68.5 68.5 72.9 72.9
Birds Ephippiorhynchus asiaticus
Black-necked stork 90.0 90.0 92.9 93.6 93.6 93.6 90.0 92.9 93.6 92.6 92.6 92.9 92.9 93.6 92.6 92.9 92.9 92.6 92.9 92.9 93.1 93.1 93.6 93.6
Birds Epthianura crocea macgregori
Yellow chat (Dawson)
30.0 36.5 36.5 37.3 37.3 44.6 36.5 36.5 37.3 30.0 36.5 35.9 36.5 37.3 36.5 36.5 36.5 36.5 36.5 36.5 36.5 36.5 44.6 44.6
Birds Erythrotriorchis radiatus Red goshawk 55.0 57.2 57.2 61.1 61.1 67.1 57.2 57.2 61.1 60.3 60.3 60.3 60.3 61.1 63.7 63.7 63.7 63.7 63.7 63.7 63.7 63.7 67.1 67.1
Birds Esacus magnirostris Beach stone-curlew 70.0 70.0 70.0 70.0 70.0 84.6 70.0 70.0 70.0 79.6 79.6 79.6 79.6 79.6 79.6 79.6 79.6 79.6 79.6 79.6 79.6 79.6 84.6 84.6
Birds Geophaps scripta scripta Squatter pigeon 60.0 65.7 65.7 68.2 68.2 73.1 65.7 65.7 68.2 67.2 67.2 67.2 67.2 68.2 69.0 69.0 69.0 69.0 69.0 69.0 69.0 69.0 73.1 73.1
Birds Glossopsitta pusilla Little lorikeet 55.0 55.0 55.0 55.0 55.0 64.1 55.0 55.0 55.0 55.0 55.0 55.0 55.0 55.0 55.0 55.0 55.0 58.0 58.0 58.0 58.1 58.1 64.1 64.1
Birds Grantiella picta Painted honeyeater 55.0 57.2 57.9 59.6 59.6 65.9 57.2 57.9 59.6 60.6 60.6 60.6 60.6 60.6 63.2 63.2 63.2 63.2 63.2 63.2 63.2 63.2 65.9 65.9
Birds Lathamus discolor Swift parrot 45.0 45.0 45.0 45.0 45.0 46.8 45.0 45.0 45.0 45.0 45.0 45.0 45.0 45.0 45.0 45.0 45.0 45.0 45.0 45.0 45.0 45.0 46.8 46.8
Birds Lophoictinia isura Square-tailed kite 70.0 73.9 73.9 73.9 73.9 76.2 73.9 73.9 73.9 71.0 73.9 71.0 73.9 73.9 73.9 71.0 73.9 74.0 74.0 74.0 74.0 74.0 76.2 76.2
Birds Melanodryas cucullata Hooded robin 58.4 64.1 64.1 64.8 64.8 72.2 64.1 64.1 64.8 65.3 65.3 65.3 65.3 65.3 67.2 67.2 67.2 67.2 67.2 67.2 67.2 67.2 72.2 72.2
Birds Melithreptus gularis Black-chinned honeyeater
60.0 67.3 67.3 67.3 67.3 73.1 67.3 67.3 67.3 67.7 67.7 67.7 67.7 67.7 67.7 67.7 67.7 67.7 67.7 67.7 67.7 67.7 73.1 73.1
Birds Neochmia ruficauda ruficauda
Star finch (eastern subsp.)
30.0 36.5 36.5 37.3 37.3 44.6 36.5 36.5 37.3 30.0 36.5 35.9 36.5 37.3 36.5 36.5 36.5 36.5 36.5 36.5 36.5 36.5 44.6 44.6
Birds Neophema pulchella Turquoise parrot 55.0 55.0 55.0 55.0 55.0 60.5 55.0 55.0 55.0 55.0 55.0 55.0 55.0 55.0 58.3 58.3 58.3 58.3 58.3 58.3 58.3 58.3 60.5 60.5
Birds Nettapus coromandelianus
Cotton pygmy-goose
70.0 70.0 73.8 70.7 73.8 79.8 70.0 73.8 70.7 72.2 72.2 73.8 73.8 73.8 73.9 73.9 73.9 73.9 73.9 73.9 75.0 75.0 79.8 79.8
Birds Ninox connivens Barking owl 68.3 72.3 72.3 72.3 72.3 78.5 72.3 72.3 72.3 70.0 72.3 70.0 72.3 72.3 72.3 71.6 72.3 72.3 71.6 72.3 72.3 72.3 78.5 78.5
Birds Ninox strenua Powerful owl 62.5 67.4 67.4 67.4 67.4 73.4 67.4 67.4 67.4 64.1 67.4 64.1 67.4 67.4 67.4 65.8 67.4 67.4 65.8 67.4 67.4 67.4 73.4 73.4
Birds Poephila cincta cincta Black-throated finch 46.7 53.2 53.2 55.2 55.2 64.9 53.2 53.2 55.2 56.3 56.3 56.3 56.3 56.3 59.8 59.8 59.8 59.8 59.8 59.8 59.8 59.8 64.9 64.9
Table A5 Details of the Pareto optimal solutions considering the common vision for persistence thresholds of 50, 70 and 90%. The Pareto optimal solutions provide the best strategies to implement, maximising the number of species secured at a minimum cost.

99
Budget ($M) Budget ($M)0 1.2 2.2 2.7 3.7 57.7 1.2 2.2 2.7 3.2 3.7 4.7 5.2 6.7 8.2 8.7 9.2 12.2 12.7 13.2 17.2 29.7 57.7 57.7
Strategies StrategiesTAXON Base 7 7,9 6,9 4,9 11 7 7,9 6,7 3 3,6 3,9 3,7,9 3,6,7,9 3,7,8 3,7,9 3,7–9 2,3,7,8 2,3,8,9 2,3,7–9 2–4,7–9 2–5,7–9 11 11
Category Scientific name Common name 50% 70% 90%
Fauna
Birds Pomatostomus temporalis Grey-crowned babbler
62.4 66.5 66.5 68.8 68.8 74.9 66.5 66.5 68.8 68.8 68.8 68.8 68.8 68.8 70.5 70.5 70.5 70.5 70.5 70.5 70.5 70.5 74.9 74.9
Birds Pyrrholaemus sagittatus Speckled warbler 61.5 68 68 68.6 68.6 76.1 68.0 68.0 68.6 69.4 69.4 69.4 69.4 69.4 71.6 71.6 71.6 71.6 71.6 71.6 71.6 71.6 76.1 76.1
Birds Rostratula australis Australian painted snipe
50.0 54.9 60.3 55.5 60.3 64.6 54.9 60.3 55.5 58.0 58.0 60.3 60.3 60.3 58.0 60.3 60.3 58.0 60.3 60.3 61.0 61.0 64.6 64.6
Birds Stagonopleura guttata Diamond firetail 53.3 55.5 55.5 58.2 58.2 64.3 55.5 55.5 58.2 57.6 57.6 57.6 57.6 58.2 62.1 62.1 62.1 62.1 62.1 62.1 62.1 62.1 64.3 64.3
Birds Sternula albifrons Little tern 50.0 50.0 50.0 50.0 50.0 50.0 50.0 50.0 50.0 50.0 50.0 50.0 50.0 50.0 50.0 50.0 50.0 50.0 50.0 50.0 50.0 50.0 50.0 50.0
Birds Stictonetta naevosa Freckled duck 70.0 70.0 73.8 70.7 73.8 79.8 70.0 73.8 70.7 72.2 72.2 73.8 73.8 73.8 73.9 73.9 73.9 73.9 73.9 73.9 75.0 75.0 79.8 79.8
Birds Tadorna radjah Radjah shelduck 90.0 90.0 91.8 91.5 91.8 95.1 90.0 91.8 91.5 94.5 94.5 94.5 94.5 94.5 94.5 94.5 94.5 94.5 94.5 94.5 94.5 94.5 95.1 95.1
Birds Turnix melanogaster Black-breasted button-quail
52.5 62.3 62.3 62.3 62.3 74.4 62.3 62.3 62.3 60.5 62.3 60.5 62.3 62.3 62.3 60.5 62.3 62.3 60.5 62.3 62.3 62.3 74.4 74.4
Birds Tyto novaehollandiae Masked owl 40.0 46.5 46.5 46.5 46.5 47.3 46.5 46.5 46.5 46.4 46.5 46.4 46.5 46.5 46.5 46.4 46.5 46.5 46.4 46.5 46.5 46.5 47.3 47.3
Fish Bidyanus bidyanus Silver perch 45.0 45.0 50.9 46.8 50.9 57.7 45.0 50.9 46.8 46.6 46.6 50.9 50.9 50.9 48.3 50.9 50.9 48.3 50.9 50.9 50.9 50.9 57.7 57.7
Fish Gadopsis marmoratus River blackfish 60.0 60.0 64.4 60.0 64.4 76.4 60.0 64.4 60.0 61.6 61.6 64.4 64.4 64.4 61.6 64.4 64.4 70.6 70.6 70.6 70.6 70.6 76.4 76.4
Fish Maccullochella mariensis Mary River cod 60.0 60.0 65.9 60.0 65.9 74.6 60.0 65.9 60.0 60.0 60.0 65.9 65.9 65.9 60.0 65.9 65.9 63.0 65.9 65.9 65.9 65.9 74.6 74.6
Fish Maccullochella peelii Murray cod 75.0 75.0 77.9 75.0 77.9 82.3 75.0 77.9 75.0 76.6 76.6 77.9 77.9 77.9 76.6 77.9 77.9 76.6 77.9 77.9 77.9 77.9 82.3 82.3
Fish Mogurnda adspersa Purple spotted gudgeon
66.7 66.7 72.5 69.1 72.5 80.0 66.7 72.5 69.1 69.9 69.9 72.5 72.5 72.5 69.9 72.5 72.5 69.9 72.5 72.5 72.5 72.5 80.0 80.0
Fish Neoceratodus forsteri Australian lungfish 56.7 56.7 61.6 57.9 61.6 68.8 56.7 61.6 57.9 57.7 57.7 61.6 61.6 61.6 58.3 61.6 61.6 58.7 61.6 61.6 61.9 61.9 68.8 68.8
Fish Pristis microdon Freshwater sawfish 50.0 50.0 55.9 50.0 55.9 57.3 50.0 55.9 50.0 50.0 50.0 55.9 55.9 55.9 50.0 55.9 55.9 50.0 55.9 55.9 55.9 55.9 57.3 57.3
Invertebrates Acrodipsas illidgei Illidge's ant-blue 50.0 50.0 50.0 50.0 50.0 57.3 50.0 50.0 50.0 56.4 56.4 56.4 56.4 56.4 56.4 56.4 56.4 56.4 56.4 56.4 56.4 56.4 57.3 57.3
Invertebrates Adclarkia dawsonensis Boggomoss snail 30.0 43.1 43.1 43.1 43.1 51.9 43.1 43.1 43.1 42.8 43.1 42.8 43.1 43.1 43.1 43.1 43.1 43.1 43.1 43.1 43.1 43.1 51.9 51.9
Invertebrates Euastacus armatus Spiny crayfish 55.0 55.0 59.4 55.0 59.4 67.7 55.0 59.4 55.0 56.6 56.6 59.4 59.4 59.4 56.6 59.4 59.4 56.6 59.4 59.4 59.4 59.4 67.7 67.7
Invertebrates Hypochrysops piceata Bulloak jewel (butterfly)
50.0 56.5 56.5 56.5 56.5 64.6 56.5 56.5 56.5 50.0 56.5 50.0 56.5 56.5 56.5 50.0 56.5 56.5 50.0 56.5 56.5 56.5 64.6 64.6
Mammals Aepyprymnus rufescens Rufous bettong 60.0 66.5 66.5 69.1 69.1 80.0 66.5 66.5 69.1 61.6 66.5 61.6 66.5 69.1 69.8 69.8 69.8 69.8 69.8 69.8 69.8 73.1 80 80.0
Mammals Chalinolobus picatus Little pied bat 65.0 73.2 73.2 73.2 73.2 83.2 73.2 73.2 73.2 69.8 73.2 69.8 73.2 73.2 73.2 69.8 73.2 73.2 69.8 73.2 73.2 73.2 83.2 83.2
Mammals Dasyurus hallucatus Northern quoll 46.7 49.9 49.9 54.0 54.0 62.5 49.9 49.9 54.0 55.2 55.2 55.2 55.2 55.2 57.6 57.6 57.6 57.6 57.6 57.6 57.6 57.6 62.5 62.5
Mammals Lagorchestes conspicillatus
Spectacled hare-wallaby
60.0 68.2 68.2 70.9 70.9 81.9 68.2 68.2 70.9 66.4 68.2 66.4 68.2 70.9 73.1 73.1 73.1 73.1 73.1 73.1 73.1 73.1 81.9 81.9
Mammals Lasiorhinus krefftii Northern hairy-nosed wombat
20.0 26.5 26.5 27.3 27.3 34.6 26.5 26.5 27.3 26.4 26.5 26.4 26.5 27.3 26.5 26.4 26.5 26.5 26.4 26.5 26.5 26.5 34.6 34.6
Mammals Macroderma gigas Ghost bat 50.0 50.0 50.0 50.0 50.0 64.6 50.0 50.0 50.0 59.6 59.6 59.6 59.6 59.6 59.6 59.6 59.6 59.6 59.6 59.6 59.6 59.6 64.6 64.6
Mammals Onychogalea fraenata Bridled nailtail wallaby
46.7 57.5 57.5 57.5 57.5 66.1 57.5 57.5 57.5 55.2 57.5 55.2 57.5 57.5 57.5 55.4 57.5 57.5 55.4 57.5 57.5 58.3 66.1 66.1

100
Budget ($M) Budget ($M)0 1.2 2.2 2.7 3.7 57.7 1.2 2.2 2.7 3.2 3.7 4.7 5.2 6.7 8.2 8.7 9.2 12.2 12.7 13.2 17.2 29.7 57.7 57.7
Strategies StrategiesTAXON Base 7 7,9 6,9 4,9 11 7 7,9 6,7 3 3,6 3,9 3,7,9 3,6,7,9 3,7,8 3,7,9 3,7–9 2,3,7,8 2,3,8,9 2,3,7–9 2–4,7–9 2–5,7–9 11 11
Category Scientific name Common name 50% 70% 90%
Fauna
Mammals Petrogale penicillata Brush-tailed rock-wallaby
30.0 36.5 36.5 36.5 36.5 37.3 36.5 36.5 36.5 30.0 36.5 30.0 36.5 36.5 36.5 36.5 36.5 36.5 36.5 36.5 36.5 36.5 37.3 37.3
Mammals Phascolarctos cinereus Koala 35.0 50.2 50.2 50.2 50.2 60.5 50.2 50.2 50.2 54.3 54.3 54.3 54.3 54.3 54.3 54.3 54.3 54.3 54.3 54.3 54.3 54.3 60.5 60.5
Mammals Pseudomys patrius Eastern pebble-mound mouse
50.0 59.8 59.8 59.8 59.8 64.6 59.8 59.8 59.8 53.2 59.8 53.2 59.8 59.8 59.8 53.3 59.8 59.8 53.3 59.8 59.8 59.8 64.6 64.6
Mammals Pteropus poliocephalus Grey-headed flying-fox
20.0 20.0 25.9 20.0 25.9 34.6 20.0 25.9 20.0 20.0 20.0 25.9 25.9 25.9 20.0 25.9 25.9 26.1 26.1 26.1 26.3 26.3 34.6 34.6
Mammals Saccolaimus saccolaimus nudicluniatus
Bare-rumped sheathtail bat
60.0 60.0 60.0 60.0 60.0 70.9 60.0 60.0 60.0 69.6 69.6 69.6 69.6 69.6 69.6 69.6 69.6 69.6 69.6 69.6 69.6 69.6 70.9 70.9
Mammals Taphozous australis Coastal sheathtail bat
65.0 65.0 65.0 68.6 68.6 77.7 65.0 65.0 68.6 73.0 73.0 73.0 73.0 73.0 73.0 73.0 73.0 73.0 73.0 73.0 73.0 73.0 77.7 77.7
Mammals Xeromys myoides Water mouse 30.0 30.0 35.9 30.0 35.9 37.3 30.0 35.9 30.0 36.4 36.4 36.4 36.4 36.4 36.4 36.4 36.4 36.4 36.4 36.4 36.4 36.4 37.3 37.3
Reptiles Acanthophis antarcticus Common death adder
46.7 54.3 54.3 60.0 60.0 64.6 54.3 54.3 60.0 55.2 55.2 55.2 55.2 60.0 55.4 55.4 55.4 55.4 55.4 55.4 58.2 58.2 64.6 64.6
Reptiles Anomalopus mackayi Long-legged worm-skink
45.0 67.9 67.9 67.9 67.9 74.1 67.9 67.9 67.9 67.5 67.9 67.5 67.9 67.9 67.9 67.5 67.9 67.9 67.5 67.9 67.9 67.9 74.1 74.1
Reptiles Aspidites ramsayi Woma 53.3 58.2 58.2 58.8 58.8 69.1 58.2 58.2 58.8 55.5 58.2 55.5 58.2 58.8 61.5 61.5 61.5 61.5 61.5 61.5 61.5 61.5 69.1 69.1
Reptiles Delma inornata 50.0 59.8 59.8 71.9 71.9 79.1 59.8 59.8 71.9 72.5 72.5 72.5 72.5 72.5 72.9 72.9 72.9 72.9 72.9 72.9 72.9 72.9 79.1 79.1
Reptiles Delma labialis Striped-tailed delma
60.0 66.5 66.5 66.5 66.5 67.3 66.5 66.5 66.5 61.6 66.5 61.6 66.5 66.5 66.5 61.6 66.5 66.5 61.6 66.5 66.5 66.5 67.3 67.3
Reptiles Delma torquata Collared delma 63.3 63.3 66.3 67.0 67.0 75.5 63.3 66.3 67.0 67.6 67.6 67.6 67.6 67.6 67.7 67.7 67.7 67.7 67.7 67.7 67.7 67.7 75.5 75.5
Reptiles Denisonia maculata Ornamental snake 52.5 63.9 63.9 63.9 63.9 78.0 63.9 63.9 63.9 68.5 68.5 68.5 68.5 68.5 68.5 68.5 68.5 68.5 68.5 68.5 74.4 74.4 78.0 78.0
Reptiles Egernia rugosa Yakka skink 58.3 62.7 62.7 63.8 63.8 70.5 62.7 62.7 63.8 63.7 63.7 63.7 63.7 63.8 63.7 63.7 63.7 63.7 63.7 63.7 65.6 65.6 70.5 70.5
Reptiles Elseya albagula Snapping turtle from Broken River
70.0 70.0 78.8 70.0 78.8 84.6 70.0 78.8 70.0 76.4 76.4 78.8 78.8 78.8 76.5 78.8 78.8 76.5 78.8 78.8 78.8 78.8 84.6 84.6
Reptiles Furina barnardi Yellow-naped snake 85.0 85.0 85.0 87.2 87.2 94.5 85.0 85.0 87.2 86.9 86.9 86.9 86.9 87.2 86.9 86.9 86.9 86.9 86.9 86.9 86.9 86.9 94.5 94.5
Reptiles Furina dunmalli Dunmall's snake 67.5 67.5 67.5 67.5 67.5 74.8 67.5 67.5 67.5 67.5 67.5 67.5 67.5 67.5 67.5 67.5 67.5 72.1 72.1 72.1 72.1 72.1 74.8 74.8
Reptiles Hemiaspis damelii Grey snake 45.0 67.9 67.9 67.9 67.9 74.1 67.9 67.9 67.9 64.3 67.9 65.5 67.9 67.9 67.9 65.5 67.9 67.9 65.5 67.9 67.9 67.9 74.1 74.1
Reptiles Lerista allanae Retro slider 37.5 40.8 40.8 42.2 42.2 50.2 40.8 40.8 42.2 48.7 48.7 48.7 48.7 48.7 48.7 48.7 48.7 48.7 48.7 48.7 48.7 48.7 50.2 50.2
Reptiles Lerista karlschmiditi 40.0 40.0 40.0 50.9 50.9 58.2 40.0 40.0 50.9 52.8 52.8 52.8 52.8 52.8 52.8 52.8 52.8 52.8 52.8 52.8 52.8 52.8 58.2 58.2
Reptiles Paradelma orientalis Brigalow scaly-foot 57.5 62.9 62.9 62.9 62.9 74.3 62.9 62.9 62.9 62.3 62.9 62.3 62.9 62.9 62.9 62.3 62.9 62.9 62.3 62.9 62.9 64.3 74.3 74.3
Reptiles Rheodytes leukops Fitzroy River turtle 60.0 60.0 67.3 61.1 67.3 72.7 60.0 67.3 61.1 66.4 66.4 67.3 67.3 67.3 66.4 67.3 67.3 66.4 67.3 67.3 67.3 67.3 72.7 72.7
Reptiles Strophurus taenicauda Golden-tailed gecko 66.7 69.9 69.9 69.9 69.9 79.5 69.9 69.9 69.9 68.8 69.9 68.8 69.9 69.9 69.9 68.8 69.9 70.7 70.7 70.7 70.7 70.7 79.5 79.5
Reptiles Tympanocryptis condaminensis
Condamine earless dragon
20.0 20.0 20.0 20.0 20.0 34.6 20.0 20.0 20.0 32.8 32.8 32.8 32.8 32.8 32.8 32.8 32.8 32.8 32.8 32.8 32.8 32.8 34.6 34.6

101
Budget ($M) Budget ($M)0 1.2 2.2 2.7 3.7 57.7 1.2 2.2 2.7 3.2 3.7 4.7 5.2 6.7 8.2 8.7 9.2 12.2 12.7 13.2 17.2 29.7 57.7 57.7
Strategies StrategiesTAXON Base 7 7,9 6,9 4,9 11 7 7,9 6,7 3 3,6 3,9 3,7,9 3,6,7,9 3,7,8 3,7,9 3,7–9 2,3,7,8 2,3,8,9 2,3,7–9 2–4,7–9 2–5,7–9 11 11
Category Scientific name Common name 50% 70% 90%
Flora
Brigalow Homopholis belsonii Belson's panic 99.0 99.0 99.0 99.0 99.0 99.0 99.0 99.0 99.0 99.0 99.0 99.0 99.0 99.0 99.0 99.0 99.0 99.0 99.0 99.0 99.0 99.0 99.0 99.0
Brigalow Rutidosis crispata 80.0 81.7 81.7 81.8 81.8 81.8 81.7 81.7 81.8 80.0 81.7 81.5 81.7 81.8 81.7 81.6 81.7 81.7 81.6 81.7 81.7 81.7 81.8 81.8
Brigalow Rutidosis lanata 73.3 76.7 76.7 79.2 79.2 81.7 76.7 76.7 79.2 77.6 77.6 77.6 77.6 79.2 77.6 77.6 77.6 77.6 77.6 77.6 77.6 77.6 81.7 81.7
Brigalow Solanum adenophorum Hairy nightshade 63.3 66.7 66.7 69.5 69.5 75.6 66.7 66.7 69.5 67.8 67.8 67.8 67.8 69.5 67.8 67.8 67.8 67.8 67.8 67.8 67.8 67.8 75.6 75.6
Brigalow Solanum dissectum 65.0 68.4 68.4 72.4 72.4 79.7 68.4 68.4 72.4 71.7 71.7 71.7 71.7 72.4 71.7 71.7 71.7 71.7 71.7 71.7 71.7 71.7 79.7 79.7
Brigalow Solanum elachophyllum 74.5 77.9 77.9 78.2 78.2 87.4 77.9 77.9 78.2 77.9 77.9 77.9 77.9 78.2 84.2 84.2 84.2 84.2 84.2 84.2 84.2 84.2 87.4 87.4
Brigalow Solanum johnsonianum 66.7 71.2 71.2 73.8 73.8 79.9 71.2 71.2 73.8 73.2 73.2 73.2 73.2 73.8 75.3 75.3 75.3 75.3 75.3 75.3 75.3 75.3 79.9 79.9
Brigalow Xerothamnella herbacea 80.0 81.7 81.7 81.8 81.8 83.7 81.7 81.7 81.8 81.7 81.7 81.7 81.7 81.8 81.7 81.7 81.7 81.7 81.7 81.7 81.7 81.7 83.7 83.7
Ephemeral wetlands and riparian zones
Livistona lanuginosa Waxy cabbage palm
73.0 77.5 77.5 79.1 79.1 81.6 77.5 77.5 79.1 79.7 79.7 79.7 79.7 79.7 80.6 80.6 80.6 80.6 80.6 80.6 80.6 80.6 81.6 81.6
Ephemeral wetlands and riparian zones
Microcarpaea agonis 70.0 70.0 70.0 73.7 73.7 73.7 70.0 70.0 73.7 73.4 73.4 73.4 73.4 73.7 73.4 73.4 73.4 73.4 73.4 73.4 73.4 73.4 73.7 73.7
Ephemeral wetlands and riparian zones
Paspalidium udum 75.0 75.0 75.0 80.5 80.5 80.5 75.0 75.0 80.5 75.0 75.0 75.0 75.0 80.5 79.9 79.9 79.9 79.9 79.9 79.9 79.9 79.9 80.5 80.5
Ephemeral wetlands and riparian zones
Picris barbarorum Plains picris 80.0 81.7 81.7 81.8 81.8 81.8 81.7 81.7 81.8 80.0 81.7 81.5 81.7 81.8 81.7 81.6 81.7 81.7 81.6 81.7 81.7 81.7 81.8 81.8
Grasslands Bothriochloa bunyensis Bunya Mountains bluegrass
70.0 76.8 76.8 77.4 77.4 77.4 76.8 76.8 77.4 70.0 76.8 70.0 76.8 77.4 76.8 70.0 76.8 76.8 70.0 76.8 76.8 76.8 77.4 77.4
Grasslands Cymbonotus maidenii 50.0 50.0 50.0 50.0 50.0 57.4 50.0 50.0 50.0 56.7 56.7 56.7 56.7 56.7 56.7 56.7 56.7 56.7 56.7 56.7 56.7 56.7 57.4 57.4
Grasslands Cyperus clarus 70.0 73.4 73.4 73.7 73.7 77.4 73.4 73.4 73.7 70.0 73.4 73.1 73.4 73.7 73.4 73.2 73.4 73.4 73.2 73.4 73.4 73.4 77.4 77.4
Grasslands Dichanthium queenslandicum
King blue-grass 61.8 69.3 69.3 69.3 69.3 76.5 69.3 69.3 69.3 69.9 69.9 69.9 69.9 69.9 71.5 71.5 71.5 71.5 71.5 71.5 71.5 71.5 76.5 76.5
Grasslands Picris evae Hawk weed 82.0 82.0 82.0 82.0 82.0 82.0 82.0 82.0 82.0 82.0 82.0 82.0 82.0 82.0 82.0 82.0 82.0 82.0 82.0 82.0 82.0 82.0 82.0 82.0
Grasslands Solanum papaverifolium 80.0 80.0 80.0 80.0 80.0 87.4 80.0 80.0 80.0 86.7 86.7 86.7 86.7 86.7 86.7 86.7 86.7 86.7 86.7 86.7 86.7 86.7 87.4 87.4
Grasslands Swainsona murrayana Slender darling pea 62.5 62.5 64.0 62.5 64.0 71.7 62.5 64.0 62.5 69.2 69.2 69.2 69.2 69.2 69.2 69.2 69.2 69.2 69.2 69.2 69.2 69.2 71.7 71.7
Grasslands Thesium australe Austral toad-flax 70.0 71.7 76.1 71.8 76.1 77.4 71.7 76.1 71.8 75.0 75.0 76.1 76.1 76.1 75.0 76.1 76.1 75.0 76.1 76.1 76.1 76.1 77.4 77.4
Grasslands Trioncinia retroflexa 53.3 59.0 59.0 64.4 64.4 74.2 59.0 59.0 64.4 61.2 61.2 61.2 61.2 64.4 64.1 64.1 64.1 64.1 64.1 64.1 64.1 64.1 74.2 74.2
NVF Clematis fawcettii Northern clematis 99.0 99.0 99.0 99.0 99.0 99.0 99.0 99.0 99.0 99.0 99.0 99.0 99.0 99.0 99.0 99.0 99.0 99.0 99.0 99.0 99.0 99.0 99.0 99.0
NVF Cossinia australiana Cossinia 99.0 99.0 99.0 99.0 99.0 99.0 99.0 99.0 99.0 99.0 99.0 99.0 99.0 99.0 99.0 99.0 99.0 99.0 99.0 99.0 99.0 99.0 99.0 99.0
NVF Cupaniopsis shirleyana Kooraloo 74.5 77.9 77.9 80.0 80.0 91.1 77.9 77.9 80.0 86.2 86.2 86.2 86.2 86.2 86.2 86.2 86.2 86.2 86.2 86.2 86.2 86.2 91.1 91.1

102
Budget ($M) Budget ($M)0 1.2 2.2 2.7 3.7 57.7 1.2 2.2 2.7 3.2 3.7 4.7 5.2 6.7 8.2 8.7 9.2 12.2 12.7 13.2 17.2 29.7 57.7 57.7
Strategies StrategiesTAXON Base 7 7,9 6,9 4,9 11 7 7,9 6,7 3 3,6 3,9 3,7,9 3,6,7,9 3,7,8 3,7,9 3,7–9 2,3,7,8 2,3,8,9 2,3,7–9 2–4,7–9 2–5,7–9 11 11
Category Scientific name Common name 50% 70% 90%
Flora
NVF Fontainea rostrata Deep Creek fontainea
90.0 90.0 90.0 90.0 90.0 90.0 90.0 90.0 90.0 90.0 90.0 90.0 90.0 90.0 90.0 90.0 90.0 90.0 90.0 90.0 90.0 90.0 90.0 90.0
NVF Lastreopsis silvestris 90.0 90.0 90.0 90.0 90.0 90.0 90.0 90.0 90.0 90.0 90.0 90.0 90.0 90.0 90.0 90.0 90.0 90.0 90.0 90.0 90.0 90.0 90.0 90.0
NVF (edges) Corchorus hygrophilus 99.0 99.0 99.0 99.0 99.0 99.0 99.0 99.0 99.0 99.0 99.0 99.0 99.0 99.0 99.0 99.0 99.0 99.0 99.0 99.0 99.0 99.0 99.0 99.0
NVF (edges) Ozothamnus eriocephalus 99.0 99.0 99.0 99.0 99.0 99.0 99.0 99.0 99.0 99.0 99.0 99.0 99.0 99.0 99.0 99.0 99.0 99.0 99.0 99.0 99.0 99.0 99.0 99.0
Open forests and woodlands
Acacia argyrotricha 99.0 99.0 99.0 99.0 99.0 99.0 99.0 99.0 99.0 99.0 99.0 99.0 99.0 99.0 99.0 99.0 99.0 99.0 99.0 99.0 99.0 99.0 99.0 99.0
Open forests and woodlands
Acacia curranii Curly-bark wattle 90.0 90.0 90.0 90.0 90.0 90.0 90.0 90.0 90.0 90.0 90.0 90.0 90.0 90.0 90.0 90.0 90.0 90.0 90.0 90.0 90.0 90.0 90.0 90.0
Open forests and woodlands
Acacia deuteroneura 99.0 99.0 99.0 99.0 99.0 99.0 99.0 99.0 99.0 99.0 99.0 99.0 99.0 99.0 99.0 99.0 99.0 99.0 99.0 99.0 99.0 99.0 99.0 99.0
Open forests and woodlands
Acacia handonis Hando's wattle 90.0 90.0 90.0 90.0 90.0 96.6 90.0 90.0 90.0 96.0 96.0 96.0 96.0 96.0 96.0 96.0 96.0 96.0 96.0 96.0 96.0 96.0 96.6 96.6
Open forests and woodlands
Acacia hockingsii 82.0 85.4 85.4 85.7 85.7 85.7 85.4 85.4 85.7 82.0 85.4 82.0 85.4 85.7 85.4 82.0 85.4 85.4 82.0 85.4 85.4 85.4 85.7 85.7
Open forests and woodlands
Acacia islana Isla Gorge wattle 80.0 80.0 80.0 83.7 83.7 83.7 80.0 80.0 83.7 80.0 80.0 80.0 80.0 83.7 83.2 83.2 83.2 83.2 83.2 83.2 83.2 83.2 83.7 83.7
Open forests and woodlands
Acacia lauta Tara wattle 99.0 99.0 99.0 99.0 99.0 99.0 99.0 99.0 99.0 99.0 99.0 99.0 99.0 99.0 99.0 99.0 99.0 99.0 99.0 99.0 99.0 99.0 99.0 99.0
Open forests and woodlands
Acacia pedleyi 80.0 81.7 81.7 81.8 81.8 81.8 81.7 81.7 81.8 80.0 81.7 81.5 81.7 81.8 81.7 81.6 81.7 81.7 81.6 81.7 81.7 81.7 81.8 81.8
Open forests and woodlands
Acacia tingoorensis 90.0 90.0 90.0 90.0 90.0 90.0 90.0 90.0 90.0 90.0 90.0 90.0 90.0 90.0 90.0 90.0 90.0 90.0 90.0 90.0 90.0 90.0 90.0 90.0
Open forests and woodlands
Apatophyllum flavovirens 79.5 81.2 81.2 81.2 81.2 81.3 81.2 81.2 81.2 79.5 81.2 81.0 81.2 81.2 81.2 81.1 81.2 81.2 81.1 81.2 81.2 81.2 81.3 81.3
Open forests and woodlands
Aristida annua 84.5 86.2 86.2 86.3 86.3 86.3 86.2 86.2 86.3 84.5 86.2 86.0 86.2 86.3 86.2 86.1 86.2 86.2 86.1 86.2 86.2 86.2 86.3 86.3
Open forests and woodlands
Aristida granitica 84.5 86.2 86.2 86.2 86.2 86.3 86.2 86.2 86.2 84.5 86.2 86.0 86.2 86.2 86.2 86.1 86.2 86.2 86.1 86.2 86.2 86.2 86.3 86.3
Open forests and woodlands
Bertya calycina 99.0 99.0 99.0 99.0 99.0 99.0 99.0 99.0 99.0 99.0 99.0 99.0 99.0 99.0 99.0 99.0 99.0 99.0 99.0 99.0 99.0 99.0 99.0 99.0
Open forests and woodlands
Bertya granitica 99.0 99.0 99.0 99.0 99.0 99.0 99.0 99.0 99.0 99.0 99.0 99.0 99.0 99.0 99.0 99.0 99.0 99.0 99.0 99.0 99.0 99.0 99.0 99.0
Open forests and woodlands
Commersonia pearnii 99.0 99.0 99.0 99.0 99.0 99.0 99.0 99.0 99.0 99.0 99.0 99.0 99.0 99.0 99.0 99.0 99.0 99.0 99.0 99.0 99.0 99.0 99.0 99.0
Open forests and woodlands
Corymbia clandestina 76.3 83.2 83.2 83.2 83.2 87.4 83.2 83.2 83.2 83.0 83.2 83.0 83.2 83.2 83.2 83.0 83.2 83.2 83.0 83.2 83.2 83.2 87.4 87.4

103
Budget ($M) Budget ($M)0 1.2 2.2 2.7 3.7 57.7 1.2 2.2 2.7 3.2 3.7 4.7 5.2 6.7 8.2 8.7 9.2 12.2 12.7 13.2 17.2 29.7 57.7 57.7
Strategies StrategiesTAXON Base 7 7,9 6,9 4,9 11 7 7,9 6,7 3 3,6 3,9 3,7,9 3,6,7,9 3,7,8 3,7,9 3,7–9 2,3,7,8 2,3,8,9 2,3,7–9 2–4,7–9 2–5,7–9 11 11
Category Scientific name Common name 50% 70% 90%
Flora
Open forests and woodlands
Cycas megacarpa 66.3 69.7 69.7 69.7 69.7 79.8 69.7 69.7 69.7 79.8 79.8 79.8 79.8 79.8 79.8 79.8 79.8 79.8 79.8 79.8 79.8 79.8 79.8 79.8
Open forests and woodlands
Daviesia discolor 99.0 99.0 99.0 99.0 99.0 99.0 99.0 99.0 99.0 99.0 99.0 99.0 99.0 99.0 99.0 99.0 99.0 99.0 99.0 99.0 99.0 99.0 99.0 99.0
Open forests and woodlands
Daviesia quoquoversus 99.0 99.0 99.0 99.0 99.0 99.0 99.0 99.0 99.0 99.0 99.0 99.0 99.0 99.0 99.0 99.0 99.0 99.0 99.0 99.0 99.0 99.0 99.0 99.0
Open forests and woodlands
Eucalyptus argophloia Chinchilla white gum
84.5 86.2 86.2 86.3 86.3 86.3 86.2 86.2 86.3 84.5 86.2 86.0 86.2 86.3 86.2 86.1 86.2 86.2 86.1 86.2 86.2 86.2 86.3 86.3
Open forests and woodlands
Eucalyptus pachycalyx subsp. waajensis
Pumpkin gum 99.0 99.0 99.0 99.0 99.0 99.0 99.0 99.0 99.0 99.0 99.0 99.0 99.0 99.0 99.0 99.0 99.0 99.0 99.0 99.0 99.0 99.0 99.0 99.0
Open forests and woodlands
Eucalyptus paedoglauca Mt Stuart ironbark 72.3 74.0 79.2 77.8 79.2 82.4 74.0 79.2 77.8 78.1 78.1 79.2 79.2 79.2 78.1 79.2 79.2 78.1 79.2 79.2 79.2 79.2 82.4 82.4
Open forests and woodlands
Eucalyptus virens Shiny-leaved ironbark
99.0 99.0 99.0 99.0 99.0 99.0 99.0 99.0 99.0 99.0 99.0 99.0 99.0 99.0 99.0 99.0 99.0 99.0 99.0 99.0 99.0 99.0 99.0 99.0
Open forests and woodlands
Genoplesium pedersonii 60.0 60.0 60.0 60.0 60.0 60.0 60.0 60.0 60.0 60.0 60.0 60.0 60.0 60.0 60.0 60.0 60.0 60.0 60.0 60.0 60.0 60.0 60.0 60.0
Open forests and woodlands
Genoplesium validum 60.0 60.0 60.0 60.0 60.0 60.0 60.0 60.0 60.0 60.0 60.0 60.0 60.0 60.0 60.0 60.0 60.0 60.0 60.0 60.0 60.0 60.0 60.0 60.0
Open forests and woodlands
Homoranthus decumbens 90.0 90.0 90.0 90.0 90.0 90.0 90.0 90.0 90.0 90.0 90.0 90.0 90.0 90.0 90.0 90.0 90.0 90.0 90.0 90.0 90.0 90.0 90.0 90.0
Open forests and woodlands
Homoranthus papillatus Mouse bush 99.0 99.0 99.0 99.0 99.0 99.0 99.0 99.0 99.0 99.0 99.0 99.0 99.0 99.0 99.0 99.0 99.0 99.0 99.0 99.0 99.0 99.0 99.0 99.0
Open forests and woodlands
Leptospermum venustum 99.0 99.0 99.0 99.0 99.0 99.0 99.0 99.0 99.0 99.0 99.0 99.0 99.0 99.0 99.0 99.0 99.0 99.0 99.0 99.0 99.0 99.0 99.0 99.0
Open forests and woodlands
Lissanthe brevistyla 99.0 99.0 99.0 99.0 99.0 99.0 99.0 99.0 99.0 99.0 99.0 99.0 99.0 99.0 99.0 99.0 99.0 99.0 99.0 99.0 99.0 99.0 99.0 99.0
Open forests and woodlands
Macrozamia conferta 99.0 99.0 99.0 99.0 99.0 99.0 99.0 99.0 99.0 99.0 99.0 99.0 99.0 99.0 99.0 99.0 99.0 99.0 99.0 99.0 99.0 99.0 99.0 99.0
Open forests and woodlands
Macrozamia cranei 84.5 87.9 87.9 87.9 87.9 88.2 87.9 87.9 87.9 84.5 87.9 84.5 87.9 87.9 87.9 84.5 87.9 87.9 87.5 87.9 87.9 87.9 88.2 88.2
Open forests and woodlands
Macrozamia crassifolia 75.0 76.7 76.7 76.7 76.7 76.8 76.7 76.7 76.7 75.0 76.7 75.0 76.7 76.7 76.7 75.0 76.7 76.7 75.0 76.7 76.7 76.7 76.8 76.8
Open forests and woodlands
Macrozamia machinii 99.0 99.0 99.0 99.0 99.0 99.0 99.0 99.0 99.0 99.0 99.0 99.0 99.0 99.0 99.0 99.0 99.0 99.0 99.0 99.0 99.0 99.0 99.0 99.0
Open forests and woodlands
Melaleuca irbyana Weeping paperbark 75.0 81.8 81.8 82.4 82.4 85.7 81.8 81.8 82.4 78.0 81.8 81.1 81.8 82.4 81.8 81.5 81.8 81.8 81.5 81.8 81.8 81.8 85.7 85.7

104
Budget ($M) Budget ($M)0 1.2 2.2 2.7 3.7 57.7 1.2 2.2 2.7 3.2 3.7 4.7 5.2 6.7 8.2 8.7 9.2 12.2 12.7 13.2 17.2 29.7 57.7 57.7
Strategies StrategiesTAXON Base 7 7,9 6,9 4,9 11 7 7,9 6,7 3 3,6 3,9 3,7,9 3,6,7,9 3,7,8 3,7,9 3,7–9 2,3,7,8 2,3,8,9 2,3,7–9 2–4,7–9 2–5,7–9 11 11
Category Scientific name Common name 50% 70% 90%
Flora
Open forests and woodlands
Paspalidium batianoffii 50.0 50.0 50.0 50.0 50.0 64.7 50.0 50.0 50.0 63.4 63.4 63.4 63.4 63.4 63.4 63.4 63.4 63.4 63.4 63.4 63.4 63.4 64.7 64.7
Open forests and woodlands
Philotheca sporadica Kogan waxflower 80.0 81.7 81.7 81.7 81.7 81.8 81.7 81.7 81.7 80.0 81.7 81.5 81.7 81.7 81.7 81.5 81.7 81.7 81.5 81.7 81.7 81.7 81.8 81.8
Open forests and woodlands
Pomaderris coomingalensis
99.0 99.0 99.0 99.0 99.0 99.0 99.0 99.0 99.0 99.0 99.0 99.0 99.0 99.0 99.0 99.0 99.0 99.0 99.0 99.0 99.0 99.0 99.0 99.0
Open forests and woodlands
Rhaponticum australe Native thistle 84.5 86.2 86.2 86.3 86.3 86.3 86.2 86.2 86.3 84.5 86.2 86.0 86.2 86.3 86.2 86.1 86.2 86.2 86.1 86.2 86.2 86.2 86.3 86.3
Open forests and woodlands
Solanum stenopterum 90.0 90.0 90.0 96.6 96.6 96.6 90.0 90.0 96.6 96.0 96.0 96.0 96.0 96.6 96.0 96.0 96.0 96.0 96.0 96.0 96.0 96.0 96.6 96.6
Open forests and woodlands
Trioncinia patens 70.0 70.0 70.0 70.0 70.0 77.4 70.0 70.0 70.0 76.7 76.7 76.7 76.7 76.7 76.7 76.7 76.7 76.7 76.7 76.7 76.7 76.7 77.4 77.4
Open forests and woodlands
Westringia parvifolia 99.0 99 99 99 99 99 99.0 99.0 99.0 99.0 99.0 99.0 99.0 99.0 99.0 99.0 99.0 99.0 99.0 99.0 99.0 99.0 99.0 99.0
Open shrublands and heathlands
Acacia barakulensis Waajie wattle 99.0 99.0 99.0 99.0 99.0 99.0 99.0 99.0 99.0 99.0 99.0 99.0 99.0 99.0 99.0 99.0 99.0 99.0 99.0 99.0 99.0 99.0 99.0 99.0
Open shrublands and heathlands
Acacia porcata 79.5 82.9 82.9 82.9 82.9 83.2 82.9 82.9 82.9 79.5 82.9 82.6 82.9 82.9 82.9 82.6 82.9 82.9 82.6 82.9 82.9 82.9 83.2 83.2
Open shrublands and heathlands
Acacia wardellii 99.0 99.0 99.0 99.0 99.0 99.0 99.0 99.0 99.0 99.0 99.0 99.0 99.0 99.0 99.0 99.0 99.0 99.0 99.0 99.0 99.0 99.0 99.0 99.0
Open shrublands and heathlands
Aristida forsteri 99.0 99.0 99.0 99.0 99.0 99.0 99.0 99.0 99.0 99.0 99.0 99.0 99.0 99.0 99.0 99.0 99.0 99.0 99.0 99.0 99.0 99.0 99.0 99.0
Open shrublands and heathlands
Calytrix gurulmundensis 84.5 86.2 86.2 86.3 86.3 86.3 86.2 86.2 86.3 84.5 86.2 86.0 86.2 86.3 86.2 86.0 86.2 86.2 86.0 86.2 86.2 86.2 86.3 86.3
Open shrublands and heathlands
Micromyrtus carinata Gurulmundi heath-myrtle
99.0 99.0 99.0 99.0 99.0 99.0 99.0 99.0 99.0 99.0 99.0 99.0 99.0 99.0 99.0 99.0 99.0 99.0 99.0 99.0 99.0 99.0 99.0 99.0
Open shrublands and heathlands
Micromyrtus patula 90.0 90.0 90.0 90.0 90.0 96.6 90.0 90.0 90.0 96.0 96.0 96.0 96.0 96.0 96.0 96.0 96.0 96.0 96.0 96.0 96.0 96.0 96.6 96.6
Open shrublands and heathlands
Rhaphidospora bonneyana
99.0 99.0 99.0 99.0 99.0 99.0 99.0 99.0 99.0 99.0 99.0 99.0 99.0 99.0 99.0 99.0 99.0 99.0 99.0 99.0 99.0 99.0 99.0 99.0
Permanent wetlands
Eriocaulon carsonii Salt pipewort 61.7 67.3 68.8 67.8 68.8 75.2 67.3 68.8 67.8 66.1 67.3 68.8 68.8 68.8 68.2 68.8 68.8 68.2 68.8 68.8 68.8 68.8 75.2 75.2
Permanent wetlands
Eriocaulon carsonii subsp. Orientale
Salt pipewort 61.7 67.3 68.8 67.8 68.8 75.2 67.3 68.8 67.8 66.1 67.3 68.8 68.8 68.8 68.2 68.8 68.8 68.2 68.8 68.8 68.8 68.8 75.2 75.2
Permanent wetlands
Myriophyllum artesium 61.7 67.3 71.9 67.8 71.9 75.2 67.3 71.9 67.8 66.1 67.3 71.9 71.9 71.9 68.2 71.9 71.9 68.2 71.9 71.9 71.9 71.9 75.2 75.2

105
Budget ($M) Budget ($M)0 1.2 2.2 2.7 3.7 57.7 1.2 2.2 2.7 3.2 3.7 4.7 5.2 6.7 8.2 8.7 9.2 12.2 12.7 13.2 17.2 29.7 57.7 57.7
Strategies StrategiesTAXON Base 7 7,9 6,9 4,9 11 7 7,9 6,7 3 3,6 3,9 3,7,9 3,6,7,9 3,7,8 3,7,9 3,7–9 2,3,7,8 2,3,8,9 2,3,7–9 2–4,7–9 2–5,7–9 11 11
Category Scientific name Common name 50% 70% 90%
Flora
Permanent wetlands
Thelypteris confluens 90.0 90.0 93.1 90.0 93.1 93.7 90.0 93.1 90.0 93.4 93.4 93.4 93.4 93.4 93.4 93.4 93.4 93.4 93.4 93.4 93.4 93.4 93.7 93.7
Serpentine Capparis humistrata 70.0 73.4 73.4 73.7 73.7 84.7 73.4 73.4 73.7 73.4 73.4 73.4 73.4 73.7 79.7 79.7 79.7 79.7 79.7 79.7 79.7 79.7 84.7 84.7
Serpentine Capparis thozetiana 63.3 65.6 65.6 65.8 65.8 80.5 65.6 65.6 65.8 71.2 71.2 71.2 71.2 71.2 71.2 71.2 71.2 71.2 71.2 71.2 71.2 71.2 80.5 80.5
Serpentine Corymbia xanthope Glen Geddes bloodwood
64.0 69.5 69.5 69.5 69.5 79.5 69.5 69.5 69.5 71.4 71.4 71.4 71.4 71.4 71.8 71.8 71.8 71.8 71.8 71.8 71.8 71.8 79.5 79.5
Serpentine Cycas ophiolitica Marlborough blue 68.3 71.7 71.7 71.7 71.7 80.6 71.7 71.7 71.7 77.3 77.3 77.3 77.3 77.3 77.3 77.3 77.3 77.3 77.3 77.3 77.3 77.3 80.6 80.6
Serpentine Hakea trineura Three-veined hakea 63.3 65.6 65.6 65.8 65.8 80.5 65.6 65.6 65.8 71.2 71.2 71.2 71.2 71.2 71.2 71.2 71.2 71.2 71.2 71.2 71.2 71.2 80.5 80.5
Serpentine Macrozamia serpentina 65.0 67.6 67.6 67.8 67.8 78.8 67.6 67.6 67.8 74.2 74.2 74.2 74.2 74.2 74.2 74.2 74.2 74.2 74.2 74.2 74.2 74.2 78.8 78.8
Serpentine Myrsine serpenticola 70.0 73.4 73.4 75.5 75.5 86.6 73.4 73.4 75.5 81.7 81.7 81.7 81.7 81.7 81.7 81.7 81.7 81.7 81.7 81.7 81.7 81.7 86.6 86.6
Serpentine Neoroepera buxifolia 70.0 73.4 73.4 75.5 75.5 86.6 73.4 73.4 75.5 81.7 81.7 81.7 81.7 81.7 81.7 81.7 81.7 81.7 81.7 81.7 81.7 81.7 86.6 86.6
Serpentine Pultenaea setulose 67.5 70.9 70.9 73.0 73.0 85.9 70.9 70.9 73.0 79.2 79.2 79.2 79.2 79.2 82.1 82.1 82.1 82.1 82.1 82.1 82.1 82.1 85.9 85.9
SEVT Atalaya collina Yarwun whitewood 79.5 86.3 86.3 86.9 86.9 92.4 86.3 86.3 86.9 82.9 86.3 82.9 86.3 86.9 89.2 89.2 89.2 89.2 89.2 89.2 89.2 89.2 92.4 92.4
SEVT Backhousia oligantha 90.0 90.0 90.0 90.0 90.0 90.0 90.0 90.0 90.0 90.0 90.0 90.0 90.0 90.0 90.0 90.0 90.0 90.0 90.0 90.0 90.0 90.0 90.0 90.0
SEVT Bursaria reevesii 74.5 77.9 77.9 78.2 78.2 89.2 77.9 77.9 78.2 77.9 77.9 77.9 77.9 78.2 84.2 84.2 84.2 84.2 84.2 84.2 84.2 84.2 89.2 89.2
SEVT Cadellia pentastylis Ooline 69.8 74.0 74.0 76.2 76.2 84.5 74.0 74.0 76.2 76.5 76.5 76.5 76.5 76.5 76.5 76.5 76.5 76.6 76.6 76.6 76.6 76.6 84.5 84.5
SEVT Croton magneticus 99.0 99.0 99.0 99.0 99.0 99.0 99.0 99.0 99.0 99.0 99.0 99.0 99.0 99.0 99.0 99.0 99.0 99.0 99.0 99.0 99.0 99.0 99.0 99.0
SEVT Decaspermum struckoilicum
99.0 99.0 99.0 99.0 99.0 99.0 99.0 99.0 99.0 99.0 99.0 99.0 99.0 99.0 99.0 99.0 99.0 99.0 99.0 99.0 99.0 99.0 99.0 99.0
SEVT Denhamia parvifolia Small-leaved denhamia
79.5 86.3 86.3 86.9 86.9 90.5 86.3 86.3 86.9 82.9 86.3 82.9 86.3 86.9 86.3 86.0 86.3 86.3 86.0 86.3 86.3 86.3 90.5 90.5
SEVT Eucalyptus raveretiana Black ironbox 99.0 99.0 99.0 99.0 99.0 99.0 99.0 99.0 99.0 99.0 99.0 99.0 99.0 99.0 99.0 99.0 99.0 99.0 99.0 99.0 99.0 99.0 99.0 99.0
SEVT Fontainea fugax 99.0 99.0 99.0 99.0 99.0 99.0 99.0 99.0 99.0 99.0 99.0 99.0 99.0 99.0 99.0 99.0 99.0 99.0 99.0 99.0 99.0 99.0 99.0 99.0
SEVT Haloragis exalata subsp. Velutina
Tall velvet sea-berry
99.0 99.0 99.0 99.0 99.0 99.0 99.0 99.0 99.0 99.0 99.0 99.0 99.0 99.0 99.0 99.0 99.0 99.0 99.0 99.0 99.0 99.0 99.0 99.0
SEVT Polianthion minutiflorum 70.0 73.4 73.4 73.4 73.4 73.7 73.4 73.4 73.4 70.0 73.4 73.1 73.4 73.4 73.4 73.1 73.4 73.4 73.1 73.4 73.4 73.4 73.7 73.7
SEVT Pomaderris clivicola 99.0 99.0 99.0 99.0 99.0 99.0 99.0 99.0 99.0 99.0 99.0 99.0 99.0 99.0 99.0 99.0 99.0 99.0 99.0 99.0 99.0 99.0 99.0 99.0


107
LeftCoastal sheathtail bat Taphozous australisis listed as vulnerable under Queensland’s Nature Conservation Act 1992 and as high priority under the Back on Track framework. It is thought that alteration of their foraging habitat through sand mining and coastal development threatens the species.
Eric Vanderduys
Back coverMook Mook, Blackdown Tableland National Park
Rocío Ponce Reyes
© 2016 CSIRO. To the extent permitted by law, all rights are reserved and no part of this publication covered by copyright may be reproduced or copied in any form or by any means except with the written permission of CSIRO.
Important disclaimer
CSIRO acknowledges the contributions to this publication of workshop participants; however, the views in the publication do not necessarily reflect the views of the participating organisations. CSIRO advises that the information contained in this publication comprises general statements based on scientific research. The reader is advised and needs to be aware that such information may be incomplete or unable to be used in any specific situation.
No reliance or actions must therefore be made on that information without seeking prior expert professional, scientific and technical advice.
This research cannot be used to compare the relative impacts of any particular industry. Each industry poses multiple threats. Threats with potential for abatement were addressed as part of the set of feasible management strategies, and not separated by particular industries or activities.
To the extent permitted by law, CSIRO (including its employees and consultants) excludes all liability to any person for any consequences,including but not limited to all losses, damages, costs, expenses and any other compensation, arising directly or indirectly from using this publication (in part or in whole) and any information or material contained in it.Design by Evidently So evidentlyso.com.au
