priority 1 processing* regulatory …priority 1 (accelerated rids processing* regulatory information...
TRANSCRIPT

PRIORITY 1 (ACCELERATED RIDS PROCESSING*
REGULATORY INFORMATION DISTRIBUTION SYSTEM (RIDS)
ACCESSION NBR:9408250255 DOC.DATE: 94/08/09 NOTARIZED: NO FACIL:50-305 Kewaunee Nuclear Power Plant, Wisconsin Public Servic AUTH.NAME AUTHOR AFFILIATION WANNER,D.L. Wisconsin Public Service Corp. SCHROCK,C.A. Wisconsin Public Service Corp. RECIP.NAME RECIPIENT AFFILIATION
SUBJECT: "KNPP Cycle 20 Startup Rept." W/940817 ltr.
DISTRIBUTION CODE: IE26D COPIES RECEIVED:LTR L ENCL TITLE: Startup Report/Refueling Report (per Tech Specs)
NOTES:
DOCKET # 05000305
F
R
SIZE: _
INTERNAL:
,EXTERNAL:
RECIPIENT ID CODE/NAME
PD3-3 PD
ACRS NUDOCS-ABSTRACT RGN3 FILE 01
NOAC
COPIES LTTR ENCL
1 1
5 1 1
5 1 1
RECIPIENT ID CODE/NAME
LAUFER,R
NRR/SRXB RG E I- E
COPIES LTTR ENCL
2 2
1 02 1
1 1 NRC PDR
1 T 1
Y1 1
1
D
C
C
U
M
E
N
T
NOTE TO ALL "RIDS" RECIPIENTS: PLEASE HELP US TO REDUCE WASTE! CONTACT THE DOCUMENT CONTROL DESK, ROOM Pl-37 (EXT 504-2083) TO ELIMINATE YOUR NAME FROM DISTRIBUTION LISTS FOR DOCUMENTS YOU DON'T NEED!
TOTAL NUMBER OF COPIES REQUIRED: LTTR
I
14 ENCL 14

WPSC (414) 433-1599 TELECOPIER,(414) 433-5544
NRC-94-088
EASYLINK 62891993
WISCONSIN PUBLIC SERVICE CORPORATION
600 North Adams * P.O. Box 19002 * Green Bay, WI 54307-9002
August 17, 1994
U. S. Nuclear Regulatory Commission ATTN: Document Control Desk Washington, D.C. 20555
Ladies/Gentlemen:
Docket 50-305 Operating License DPR-43 Kewaunee Nuclear Power Plant Cycle 20 Startup Report
In accordance with our practice of reporting the results of physics tests, enclosed is a copy of the Kewaunee Nuclear Power Plant Cycle 20 Startup Report.
Sincerely,
C. A. Schrock Manager - Nuclear Engineering
BJD/san
cc - US NRC - Region III - w/o attach. US NRC Resident Inspector - w/o attach.
LIClNRC\CYCLE-ST.WP
c? 4Q325(1f!8I 9
'R'2

0 0
KEWAUNEE NUCLEAR POWER PLANT
CYCLE 20 STARTUP REPORT
JULY 1994
WISCONSIN PUBLIC SERVICE CORPORATION WISCONSIN POWER & LIGHT COMPANY MADISON GAS & ELECTRIC COMPANY

0DOCKET 50-305
KEWAUNEE NUCLEAR POWER PLANT
STARTUP REPORT
CYCLE 20
JULY 1994
WISCONSIN PUBLIC SERVICE CORPORATION
GREEN BAY, WISCONSIN

KEWAUNEE NUCLEAR POWER PLANT
STARTUP REPORT
CYCLE 20
JULY 1994
Prepared By:
Reviewed By:
Reviewed By:
Reviewed By:
Reviewed By:
I * Qjwfx ANuclear Fuel Engineer
Reactor Supervisor
Nuclear uel Analysis upervisor
/irecto '-Nuc1~n Fuel
Q;C L-Al-. . Licensing & Systems Superintendent
Date: 7 (
Date:
Date:
Date:
Date:
Approved By: Date: *KVice resident-Poer Supply & Engineering
- 1 -

TABLE OF CONTENTS
1.0 Introduction, Summary, and Conclusion
1.1 Introduction . . . . . . . . .
1.2 Summary......... . . . .
1.3 Conclusion
2.0 RCCA Measurements . .........
2.1 RCCA Drop Time Measurements
2.2 RCCA Bank Measurements . . . .
2.2.1 Rod Swap Results . . . .
2.3 Shutdown Margin Evaluation
3.0 Boron
3.1
3.2
3.3
Endpoints and Boron Worth
Boron Endpoints..
Differential Boron Worth
Boron Letdown ......
Measurements 12
12
12
12
4.0 Isothermal .Temperature Coefficient . . . . .
5.0 Power Distribution
5.1 Summary of Power Distribution Criteria
5.2 Power Distribution Measurements . . . .
6.0 Reactor Startup Calibrations
6.1 Rod Position Calibration . . . . . . .
6.2 Nuclear Instrumentation Calibration
7.0 References
-ii-
1
2
3
6
6
6
6
7
18
18
19
29
29
30
. . 31

0LIST OF TABLES
BOC Physics Test
RCCA Drop Time Measurements . . . . . . . ... .
RCCA Bank Worth Summary ............
Minimum Shutdown Margin Analysis
RCCA Bank Endpoint.Measurements ..... ....
Differential Boron Worth
Isothermal Temperature Coefficient
Flux Map Chronology and Reactor Characteristics
Verification of Acceptance Criteria . ......
Verification of Review Criteria . . ......
-iii-
Table
Table
Table
Table
Table
Table
Table
Table
Table
Table
1.1
2.1
2.2
2.3
3.1
3.2
4.1
5.1
5.2
5.3
4
8
9 . . . . . . . .18
... . . . . . 49 . . . . 11 . .. 13
. . . . . . 14
. .. 17
. . . . . . . 20
. . 21
. . . . 22

LIST OF FIGURES
Figure
Figure
Figure
Figure
Figure
Figure
Figure
Figure
Figure
1.1
2.1
3.1
5.1
5.2
5.3
5.4
5.5
5.6
-iv-
Core Loading Map . . . . * * * * * *
RCCA Bank C Integral and Differential
Boron Concentration vs. Burnup . . .
Power Distribution for Flux Map 2001
Power Distribution for Flux Map 2002
Power Distribution for Flux Map 2003
Power Distribution for Flux Map 2004
Power Distribution for Flux Map 2005
Power Distribution for Flux Map 2006
* . . . . . . . . . . . 5
Worth . .. . . . . . . .. 10
. . . .. . . . . . . . 15
. . . . . ... . . . . .. 23
. . .. . . . . . . . . . 24
. . . . . . . . . I. . . 25
. ... . . . . . . . . . 26
. . . . . . . . . . .. . 27
. . . . .. . . . . . . . 28

1.0 INTRODUCTION, SUMMARY, AND CONCLUSION
1.1 Introduction
This report presents the results of the physics tests performed during startup
of Kewaunee Cycle 20. The core design and reload safety evaluation were
performed by Wisconsin Public Service Corporation (1) using methods previously
described in WPS topical reports (2,3). The results of the physics tests were
compared to WPS analytical results to confirm calculated safety margins. The
tests performed and reported herein satisfy the requirements of the Reactor
Test Program (4).
During Cycle 19-20 refueling, 36 of the 121 fuel assemblies in the core were
replaced with fresh fuel assemblies. Twelve are Siemens Power Corporation
design (5), enriched to 3.5 weight percent U235, and twenty-four are Siemens
Power Corporation design (5), enriched to 3.7 weight percent U235. The
Cycle 20 core consists of the following regions of fuel:
Number of Previous
Duty Cycles
3
2
3
3
2
1
1
0
0
Number of Assemblies
1
4
8
8
28
32
4
12 (Feed)
24 (Feed)
Region
13
18
18
18
20
21
21
22
22
ID
M
T
T
T
W
x x z z
Vendor
SPC
SPC
SPC
SPC
SPC
SPC
WES
SPC
SPC
Initial U235 W/O
3.4
3.5
3.4
3.5 3.4
3.4
3.1
3.5
3.7
- 1 -

The core loading pattern, assembly identification, RCCA bank identification,
instrument thimble I.D., thermocouple I.D., and burnable poison rod
configurations for Cycle 20 are presented in Figure 1.1.
On May 6, 1994, at 1739 hours, initial criticality was achieved on the
Cycle 20 core. The schedule of physics tests and measurements is outlined in
Table 1.1.
1.2 Summary
RCCA measurements are shown in Section 2. All RCCA drop time measurements
were within Technical Specification limits. RCCA bank worths were measured
using the rod swap reactivity comparison technique previously described (4,6).
The reactivity comparison was made to the reference bank, Bank C, which was
measured using the dilution technique. All results were within the
established acceptance criteria (4), and thereby demonstrated adequate
shutdown margin.
Section 3 presents the boron endpoint and boron worth measurements. The
endpoint measurements for ARO and Bank C In core configurations were within
the acceptance criteria (4). The available boron letdown data covering the
first month of reactor operation is also shown. The agreement between
measurements and predictions meets the review and acceptance criteria (4).
Section 4 shows the results of the isothermal temperature coefficient
measurements. The differences between measurements and predictions were
within the acceptance criteria (4).
- 2 -

Power distributions ere measured via flux maps usinfthe INCORE code for
beginning of cycle (BOC) core conditions covering power escalation to 100
percent full power equilibrium xenon. The results indicate compliance with.
Technical Specification limits (7) and are presented in Section 5. Section 6
discusses the various calibrations performed during the startup of Cycle 20.
1.3 Conclusion
The startup testing of Kewaunee's Cycle 20 core verified that the reactor.core
has been properly loaded and the core characteristics satisfy the Technical
Specifications (7) and are consistent with the parameters used in the design
and safety analysis (1).
- 3 -

TABLE 1.1
BOC Physics Test
Test
Control Rod Operability Test
Hot Rod Drops
RPI Calibrations
Initial Criticality
Reactivity Computer Checkout
ARO Endpoint
Bank C Worth (Dilution)
Bank C In-ORO Endpoint
Bank C (Boration)
ITC Determination
Power Ascension Flux Map 2001
Power Ascension Flux Map 2002
Power Ascension Flux Map 2003
Power Ascension Flux Map 2004
Power Ascension Flux Map 2005
Power Ascension Flux Map 2006
Date Completed Time Completed
5/2/94 0300
5/4/94 1200
5/5/94 2300
5/6/94 1739
5/7/94 0250
5/7/94 0412
5/7/94 0515
5/7/94 0715
5/7/94 1152
5/7/94 1400
5/8/94 0446
5/10/94 1422
5/15/94 1537
5/18/94 0756
5/19/94 1349
5/24/94 1403
Plant Conditions
Cold SD
HSD
HSD
HZP
HZP
HZP
HZP
HZP
HZP
HZP
25%
37%
74%
91%
100%
100%
- 4 -

0Figure 1.1
Core Loading Map
4 . 5 6 7 8 9 10 11 12 13
T31 Ms0T
1-i 3 eR
LOOP B
C X36
2
0 1o 22 4
22: 12P23
E s25 Nis
F ~ TS5 119 X1 I
J.J G W0OM W32 T IS .H T32 Z28 XSI
X20 222
K 3
LOOP ax 1
L
m
I ~It ~ I&Y~~ f TZ7 7 !rY *t ~Y?~ ~ - - -
SO3 12P30
wo9 609 TIS Xi5 235 12P29
N17 r21 5 226 X21233
Tm1
L5i 1415
236 12P28
rn~
627 Z 23 NIB
I I UI 1
2 2N 2NSS 12N48 12P24
10 T6 60 10XS 1 21 -24
US2 T21 0 x122 1428 Zola wo01 ZI 25 1 3 NSO - 12 120 2S 12N 3 2
U - - LL
-L W22 X29 WO2 X2 0 8 w S N1 20 X14 Z21 TSO
r 0 12N1 0 1
Z201 X'7 X 23 M01 X24 X 28. 206 rT10 wa3 W26 12N5 12A 12N 2 12N08 12NI6 12NS4
W27 X16 NIS X2N6 M29 X0 31 M2 218 T33
2 ki1 37 TSl
zov T2s xas xis xso Ta1 Zo2 WSI ZSY
3 NSI 2 1 15S 98
T22 212 N20 IlZl N01 Zi0 T25 IS1 X12 12N52 12N53 12N45. 12P25
Z27 12P2 7
wil X02 TOO xOi W23
T36
in....
N21
..JI
fL. Zo0
T29
Z32 x05
( LOOP A
\ LOOP A
OD SP ( OLD BPR)
LID! T/C THIMBLE
CYCLE TWENTY
-5-
1 2 3
33
x35
.
X25 117
X27-I
Zs3 is

2.0 RCCA MEASUREMENTS
2.1 RCCA Droo Time Measurements
RCCA drop times to dashpot and rod bottom were measured at hot shutdown core
conditions. The results of the hot shutdown measurements are presented in
Table 2.1. The acceptance criterion (4) of 1.8 seconds to dashpot is
adequately met for all fuel.
2.2 RCCA Bank Measurements
During Cycle 20 startup the reactivity of the reference bank (Bank C) was
measured during dilution using the reactivity computer. The reactivity worth
of the remaining banks was inferred using rod swap reactivity comparisons to
the reference bank.
2.2.1 Rod Swap Results
The worth of the reference bank (Bank C) measured during dilution
differed from the WPSC predicted Bank C worth by 5.3 pcm or 0.5 percent.
A comparison of the measured to predicted reference bank integral and
differential worth is presented in Figure 2.1.
-6 -

Rod swap results for the remaining banks are presented in Table 2.2. The
measured to predicted total rod worth difference is 0.6 percent which is
within the acceptance criteria of 10.0 percent. All individual bank worths
were within the 15.0 percent measured to predicted review criterion.
2.3 Shutdown Margin Evaluation
Prior to power escalation a shutdown margin evaluation was made to verify the
existence of core shutdown capability. The minimum shutdown margins at
beginning and end of cycle are presented in Table 2.3. A 10 percent
uncertainty in the calculation of rod worth is allowed for in these shutdown
margin analyses. Since the measured rod worths resulted in less than a 10
percent difference from predicted values, the analysis in Table 2.3 is
conservative and no additional evaluations were required.
- 7 -

TABLE 2.1
Kewaunee Cycle 20
RCCA Drop Time Measurements
Hot Zero Power
All Fuel
Average Dashpot 1.258 Delta T (Sec)
Standard Deviation 0.026
Average Rod Bottom 1.753 Delta T (Sec)
Standard Deviation 0.029
- 8 -

TABLE 2.2
Kewaunee Cycle 20
RCCA Bank Worth Summary
Reference Bank Measured by Dilution/Reactivity Computer
Rod Swap. Method RCCA Measured
Bank Worth (PCM)
D 610.6
C* 1004.3
B 787.6
A 936.1
SA 635.0
SB 641.1
Total 4614.7
* Reference bank
WPS Predicted
Worth (PCM)
618
999
740
943
644
644
4588
Difference (PCM)
-7.4
5.3
47.6
-6.9
-9.0
-2.9
26.7
Percent Difference
-1.2
0.5
6.4
-0.7
-1.4
-0.5
0.6
- 9 -

FIGURE 2.1
RCCA Bank C Integral and Differential Worth
CYCLE 20, OMW D/MTU NOXE.HZP,1L408PPM 0MAUE
II T r 4 - - r I - - r - - r 3
I f I I I
~5.S0 1 L. I L L L~
u
3.3. 3.0 so .. L Ti .. 1... I L -----------
. 10. L0. :0 _0. -0 -0 -0 60. -0 100 I30 320 - 50 L0 IS.30 7. 10 90 0.20 2.20 Z-STP : :THO 11R1 N
CYCL 2050J/T OEHP,'OpM~MAuE
(r 0044 -- 4
It J i I- I L -L J f -. I- I L L
00 . . .. . .
I I I L L J - J - I - L A L L -I I 1 LI I. L
eso I I I I I I I I I I I Ir
1.)00.
-4 - I - I . - -I- - 4 - -- I - I L. 1 - I
-L I- A I -L J J I L -I- - J L
- 75-- -- -- ------- ------------------------------- -- -- 1---r -4
1 L -I -I- I I I I L J I I I
- SOo. T rL IJ - . 3. .
00- I- A I -L J J I L -J I I L Ir f I I I I I I I I I I
- I- - - - -- - - - - - ----- - - - - - -Z 200. T - - r - -r - -I i--r -- r ---- n --- I- I -,7 -- l- I -r -I
. I -I -A L I - L- I
,.0 1 L -L I I -L - I -L , I I I I IL I
To r - Io I - r I T 3 I T
I . . . . .. . . . .I I I1T -r 7
0. 3. 2. 3. ~. 5. 6. 7. 6. 90. 300. 330. 120. 130. 110. 150. 360. 170. ]60. 390. 200. 230. 220. 230. 0. 0. 0. o. 1).. 5STEPS WITHDfRAN
- 10 -

1 0 TABLE 2.3
Kewaunee Cycle 20
Minimum Shutdown Margin Analysis
RCCA Bank Worths (PCM)
N
N-1
Less 10 Percent
Sub Total
Total Requirements (Including Uncertainties)
Shutdown Margin
Required Shutdown Margin
BOC
6155
5297
530
4767
2383
2384
1000
- 11 -
EOC
6265
5496
550
4946
2151
2795
2000

3.0 BORON ENDPOINTS AND BORON WORTH MEASUREMENTS
3.1 Boron Endpoints
Dilution is stopped at the near ARO and at the Reference Bank nearly inserted
core conditions. Boron concentration is allowed to stabilize. The critical
boron concentration for these core configurations is then determined by boron
endpoint measurement.
Table 3.1 lists the measured and WPSC predicted boron endpoints for the RCCA
bank configurations shown. The results indicate a difference of -27 ppm and
-23 ppm for the ARO and Bank C In conditions, respectively. The acceptance
criterion on the all rods out boron endpoint is ±100 PPM, thus, the boron
endpoint comparisons are considered acceptable.
3.2 Differential Boron Worth
The differential boron worth is calculated by dividing the worth of control
Bank C by the difference in boron concentration of the corresponding bank out
and bank in configuration. Table 3.2 presents a comparison between measured
and predicted boron concentration change and differential boron worth. No
acceptance criteria are applied to these comparisons.
3.3 Boron Letdown
The measured boron concentration data for the first month of power operation
is corrected to nominal core conditions and presented versus cycle burnup in
Figure 3.1. The predicted boron letdown curve is included for comparison.
- 12 -

TABLE 3.1
Kewaunee Cycle 20
RCCA Bank Endpoint Measurements
RCCA Bank Confiquration.
All Rods Out
Bank C In
Measured Endpoint (PPM)
1441
1324
WPS Predicted Endpoint (PPM) Difference (PPM)
1468
1347
-27
-23
- 13 -
0 0

TABLE 3.2
Kewaunee Cycle 20
Differential Boron Worth
RCCA Bank Confiquration
ARO to C Bank In
RCCA Bank Configuration
ARO/C Bank In
CB Change Measured (PPM)
117
Measured Boron Worth (PCM/PPM)
-8.6
CB Chaige Predicted (PPM)
121
Predicted Boron Worth (PCM/PPM)
-8.3
Percent Difference
-3.4
Difference (PCM/PPM)
-0.3
- 14 -
0 0

FIGURE 3.1
BORON CONCENTRATION VS. BURNUP CYCLE 20 HFP, ARO, EQXE
uu. 0 u.
- 15 -
0
1000.
900.
800.
00
z
I
z L) z 0 Ci
z 0 ar: 0
700.
600.
500.
4J00.
300.
200.
100.
.PRrflirir
0.
BURNUP (MWD/MTU)
I I I I I I I I I i I I I I I I I I I I I I I I I I I I I I I I I I I I I I I I I I I I I I I.
0 ~~~ 100 200 I00 I00 500 I 00 700 800 900 100
1000.
.. un .
.

4.0 ISOTHERMAL TEMPERATURE COEFFICIENT
The measurement of the isothermal temperature coefficient was accomplished by
monitoring reactivity while cooling down and heating up the reactor by manual
control of the steam dump valves. The temperature and reactivity changes were
plotted on an X-Y recorder and the temperature coefficient was obtained from
the slope of this curve.
Core conditions at the time of the measurement were Bank 0 slightly inserted,
all other.RCCA banks full out, with a boron concentration of 1432 ppm. These
conditions approximate the HZP, all rods out core condition which yields the
most conservative (least negative) isothermal temperature coefficient
measurement.
Table 4.1 presents the heatup and cooldown core conditions and compares the
measured and predicted values for the isothermal temperature coefficient. The
review criterion (4) of +3 PCM/OF was met.
- 16 -

TABLE 4.1
Kewaunee Cycle 20
Isothermal Temperature Coefficient
Cooldown
Tave Start
Tave End
Bank D
Boron Concentration
- 546.0 0F
- 540.7OF
- 202 Steps
- 1432 PPM
Measured ITC (PCM/*F)
-2.68
WPSC Predicted ITC (PCM/0 F)
-4.41
Difference (PCM/0 F)
1.73
Heat Up
Tave Start
Tave End
Bank D
Boron Concentration -
Measured ITC (PCM/0 F)
-3.20
WPSC Predicted ITC (PCM/oF)
-4.20
Difference (PCM/oF)
1.00
- 17 -
540. 10F
543.7 0F
194 Steps
1432 PPM

5.0 POWER DISTRIBUTION
5.1 Summary of Power Distribution Criteria
Power distribution predictions are verified through data recorded using the
incore detector system and processed through the INCORE computer code. The
computer code calculates FQEQ and FDHN which are limited by technical
specifications. These parameters are defined as the acceptance criteria on a
flux map (4).
The review criterion for measurement is that the percent differences of the
normalized reaction rate integrals of symmetric thimbles do not exceed 10
percent at low power physics test conditions and 6 percent at equilibrium
conditions (4).
The review criterion for the prediction is that the standard deviation of the
percent differences between measured and predicted reaction rate integrals
does not exceed 5 percent.
The review criteria for the INCORE calculated quadrant powers are that the
quadrant tilt is less than 4 percent at low power physics test conditions and
less than 2 percent at equilibrium conditions (4).
- 18 -

5.2 Power DistributionMeasurements
Table 5.1 identifies the reactor conditions for each flux map recorded at the
beginning of Cycle 20.
Comparisons of measured to predicted power distributions for the flux maps are
exhibited in Figures 5.1 through 5.6. As evidenced by the figures, the outer
region of the core is initially overpredicted by approximately 5 percent and
decreases with burnup to less than 4 percent.
Table 5.2 identifies flux map peak FDHN and minimum margin FQEQ. This table
addresses acceptance criteria by verifying that technical specification limits
are not exceeded. Table 5.2 also identifies FQW for the four Westinghouse
assemblies and verifies that applied limits are reviewed. The Cycle 20 flux
maps met all acceptance criteria.
Table 5.3 addresses the established review criteria for the flux maps. All
review criteria were met-for all the Cycle 20 flux maps.
- 19 -

0 0 TABLE 5.1
Flux Map Chronology and Reactor Characteristics
Percent D Rods Exposure Map Date Power Xenon Boron PPM Steps MDW/MTU 2001 5/8/94 25 NON-EQ. 1384 143 0 2002 5/10/94 37 NON-EQ. 1107 150 31 2003 5/15/94 74 NON-EQ. 1016 191 114 2004 5/18/94 91 NON-EQ. 965 204 195 2005 5/19/94 100 NON-EQ. 916 215 214 2006 5/24/94 100 EQ. 892 230 414
- 20 -

TABLE 5.2
Verification of Acceptance Criteria
Flux Map Core Location FEQ Limit
2001 L-06 ED,30 2.48 4.55
2002 L-06 ED,30 2.35 4.55
2003 B-06 EK,30 2.13 3.02
2004 B-06 EK,31 2.07 2.46
2005 8-06 GK,32. 2.07 2.28
2006 F-02 KE,32 2.04 2.28
W Assembly Flux Map Core. Location FOW Limit
2001 C11 1.63 4.10
2002 C11 1.56 4.10
2003 C11 1.50 2.76
2004 K03 1.44 2.25
2005 K03 1.43 2.05
2006 K03 1.41 2.05
Flux Map Core Location FDHN Limit
2001 H-09 EK 1.53 1.78
2002 E-08 KJ 1.51 1.74
2003 B-06 EK 1.50 . 1.63
2004 8-06 EK 1.50 1.58
2005 B-06 EK 1.50 1.55
2006 B-06 EK 1.49 1.55
FQEQ, FQW, and FDHN include appropriate uncertainties and penalties.
Limit on FQEQ and FQW is a function of core power and axial location.
Limit on FDHN is a function of Core Power and Assembly Burnup.
- 21 -

TABLE 5.3
Verification of Review Criteria
(a) Maximum Percent Difference
1.6
2.1
1.8
1.6
1.4
1.2
(b) Standard Deviation
1.7
1.3
1.3
1.4
1.4
1.5
(c) Maximum Quadrant Tilt
0.3
0.2
0.3
0.3
0.5
0.4
(a) Maximum Percent Difference between symmetric thimbles for measured reaction
rate integrals. Review criterion is 10 percent at low power. Review
criterion is 6 percent at equilibrium power.
(b) Standard Deviation of the percent difference between measured and predicted
reaction rate integrals. Review criterion is 5 percent.
(c) Percent Maximum Quadrant Tilt from normalized calculated quadrant powers.
Review criteria are 4 percent at low power and 2 percent at equilibrium power.
- 22 -
0 0
Flux Map
2001
2002
2003
2004
2005
2006

Figure 5.1
Power Distribution for Flux Map 2001
1 2 3 4 5 6 7 8 9 10 11
1.012 1.014 -0.24
1.011 1.017 -0.62
1.172 1.173 -0.09
0.294 0.298 -1.34
1.117 1.119 -0.20
1.358 1.357 0.09
0.322 0.329 -2.07
0.795 0.803 -0.92
1.318 1.312 0.46
0.290 0.298 -2.78
0.598 1.043 1. 134 0.720 1.125 1.034 0.60 1
0.60 1 1.057 1.150 0.736 1. 150 1.057 0.60 1
-0.63 -1.36 -1.36 -2. 11 -2. 19 -2. 17 -0.12 U. 518 0.630
0. 622
0.6221.2 47 1.250 -0.28
1. 2L4 1.242 0.16
1.375 1.357 1.36
0.809 0.803 0.76
~* - 4 - 40.591 0.601 -1.78
0.285 0.298
0.314 0.329
1.107 1.119 -1.08
1.371 1.357 1.02
0.998 1.017 -1.87
1.184 1.173 0.95
1.249 1.250
-0.11
0.597 1.241 1.113 1.242 1.038 1.191 1.027 1.232 1.118 1.259 0.608 0.600 1.246 1.116 1.245 1.037 1.198 1.037 1.245 1.116 1.246 0.600 -0.43 -0.43 -0.27 -0.23 0.08 -0.59 -0.99 -1.03 0.16 1.01 1.33
1.051 1.053 -0.24
1.007 1.014 -0.66
0.603 1.254 1.123 1.252 1.044 1.206 1.044 1.250 1.095 1.229 0.592 0.600 1.246 1.116 1.245 1.037 1.198 1.037 1.245 1.116 1.246 0.600 0.58 0.65 0.58 0.57 0.68 0.68 0.67 0.43 -1.85 -1.35 -1.32
1.250 1.242 0.68
1.028 1.014 1.36
0.617 0.622 -0.85
1.009
1.014 -0.46
1.20
1.242 -0.15
1. 178
1.173 0.43
1.364
1.357
0.51,
1.329
1.312 1.31
0.723
0.736 -1.73
1. 190 1.173 1.47
1.236 1 .242 -0.46
1.240 1.250 -0.85
1 .001 1.017 -1.57
1.US9
1.057
-1.69
1.131 1.119 1.05
1.130
1.150 -1.71
1.117 1.119 -0.17
1.129
1.150 -1.83
0.289 0.298
1.008 1.017 -0.86
1.035
1.057
-2.06
1.224 1.250 -2.06
0.589
0.601 -2.06
0.617 0.622 -0.85
1.075 1.053 2.09
1.039 1.053 -1.35
/LOOP F
% LOOP F
DFLUX MRP 2001
U5-- 23 -
M..._±EASURED FOHN
PREDICTED FDHN
PERCENT OIFFERENCE
1
RA I t I 4-
LOOP 8
12 13
B
I-.
t I~-
D
E
F
.G
H
0.298 1.199 1.120 1.038 1.357 1.195 1.334 1.206 1.364 1.042 1.128 1.151 0.296 0.297 1.145 1.112 1.030 1.349 1.190 1.324 1.190 1.349 1.030 1.112 1.145 0.297 0.37 0.37 0.68 0.79 0.60 0.39 0.73 1.34 1.13 1.18 1.41 0.47 -0.17
0.325 0.726 0.801 1.193 1.315 1.331 0.985 1.344 1.324 1.207 0.811 0.735 0.326 0.327 0.732 0.799 1.192 1.302 1.319 0.967 1.319 1.302 1.192 0.799 0.732 0.327 -0.52 -0.77 0.25 0.09 1.02 0.92 1.92 1.93 1.67 1.28 1.49 0.37 -0.34
0.295 1.135 1.114 1.031 1.363 1.200 1.347 1.211 1.374 1.035 1.114 1.13Y 0.290 0.297 1.145 1.112 1.030 1.349 1.190 1.324 1.190 1.349 1.030 1.112 1.15 0.297 -0.64 -0.86 0.15 0.07 1.07 0.84 1.71 1.78 1.82 0.51 0.17 -0.94 -2.39
1.043
1.053 -0.98
LOOP 8K
L
M
30
I
I II
0.598
0.601 -0.63
1.057
-11.36
1134
1.150
-1.36
0.720
0.736
-2.11
1.125
1.150
-2.19
1.034
1.057
-2.17
0.601
0.601
-0.12
0.518 0.622
-0.63
0.630
0.622
1.33
-4. I6 -4.44 -3.28
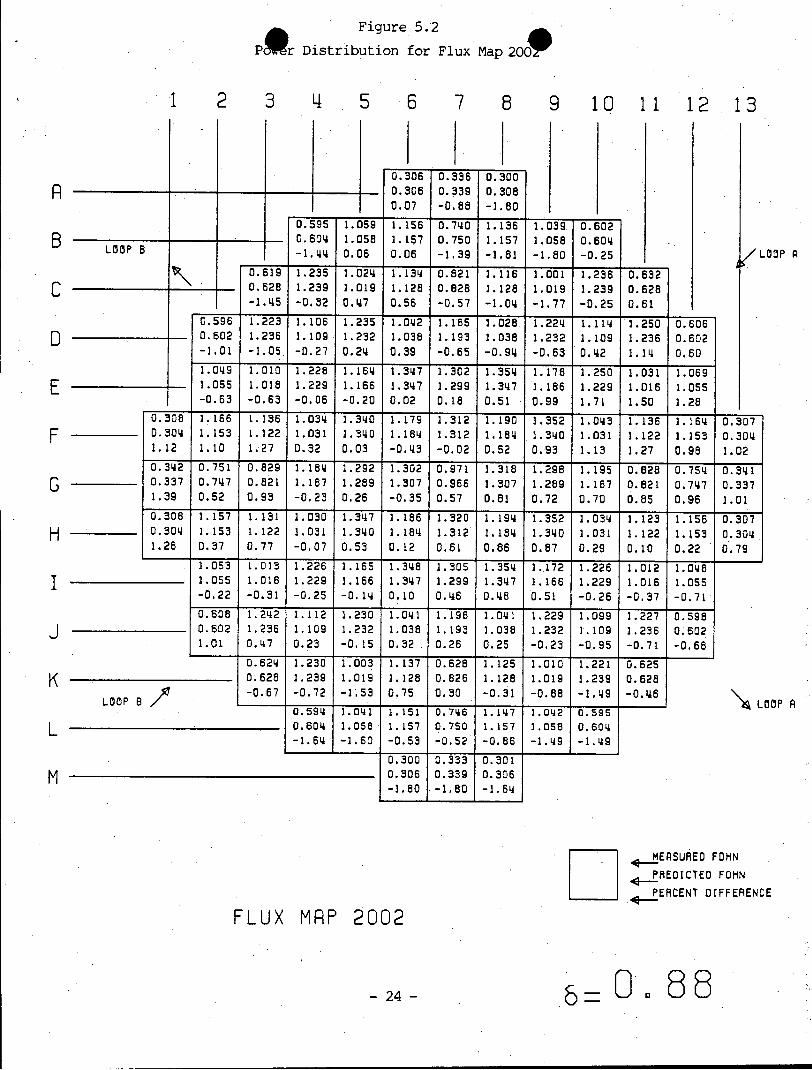
Figure 5.2
Pr Distribution for Flux Map 2000
1 2 3 4 5 6 7 8 9
9 4 4 4 1.-
LOiP B I
4 4-
LOOP B /L
1.09
1.055 -0.63
1.024 1.019 0.47
1. 16
1.166 -0.20
0.306 0.306 0.07
1.134 1.128 0.56
1.347
1.3147 0.02
0.336 0.339 -0.88
I 9 I I
0.821 0.826 -0.57
1.302 1.299 0.18
0.300 0.306 -1.80
0. 6014 1.058 1. 157 0.750 1. 157 1.058 0. 6014 -1.1414 0.06 0.06 -1.39 .-1.81 -1.80 -0.25 - 9 -- 4 - 4 4. 4 1 .1. 0.619 0.632
0.628
0.6281.235 1.239 -0.32
1.230 1.239 -0.72
- ~4 i-.-~--~4 4 41.041 1.05 -1.60
-- I
1.116 1.128 -1.04
1.354 1.3147 0.51
1.001 1.019 -1.77
1. 178 1.166 0.99
1.236 1.239 -0.25
1.250 1.229 1.71
0.596 1.223 1.106 1.235 1.042 1.185 1.028 1.224 1.114 1.250 0.606 0.602 1.236 1.109 1.232 1.038 1.193 1.038 1.232 1.109 1.236 0.602 -1.01 -1.05, -0.27 0.24. 0.39 -0.65 -0.94 -0.63 0.142 1.14 0.60
0.624 0.628 -0.67
1.228 1.229 -0.06
C
E
F
H
0.608 1.242 1.112 1.230 1.041 1.196 1.041 1.229 1.099 1.227 0.598 0.602 1.236 1.109 1.232 1.038 1.193 1.038 1.232 1.109 1.236 0.602 1.01 0.47 0.23 -0.15 0.32 . 0.28 0.25 -0.23 -0.95 -0.71 -0.68
1.226 1.229 -0.25
0.5994 0.604 -1.64
1.165 1.166 -0.14
1.348 1.347 0.10
1.305 1.299 0.146
1.354 1.347 0.48
1.172 1.166 0.51
1.226 1.229 -0.26
1.010
1.016 -0.63
1.013 1.016 -0.31
1 .003 1.019 -1'.53
1. 137 1.128 0.75
1.151
1.157 -0.53
0.300 0.306 -1.80
0.828 0.826 0.30
0.746 0.750 -0.52
0.333 0.339 -1.80
1.125 1.128 -0.31
1.147 1.157 -0.86
0.301 0.306 -1.64
1.010 1.019 -0.88
1.042 1 .058 -1.49
1.221 1.239 -1.149
0.595 0.604 -1.49
1.031
1.016 1.50
1.012 1.016 -0.37
0.625 0.628 -0.48
1.069 1.055 1.26
1.048 1.055 -0.71
7 LOOP A
\ LOOP A
FLUX MRP 2002
- 24 -
MEASURED FOHN
PREDICTED FDHN
PERCENT DIFFERENCE
0a 88
R
10 11 12 13
1.053 1.055 -0.22
0.308 1.166 1.136 1.034 1.340 1.179 1.312 1.190 1.352 1.043 1.136 1.164 0.307 0.304 1.153 1.122 1.031 1.340 1.184 1.312 1.184 1.340 1.031 1.122 1.153 0.304 1.12 1.10 1.27 0.32 0.03 -0.43 -0.02 0.52 0.93 1.13 1.27 0.98 1.02
0.342 0.751 0.829 1.184 1.292 1.302 0.971 1.318 1.298 1.195 0.828 0.754 0.31 0.337 0.747 0.821 1.187 1.289 1.307 0.966 1.307 1.289 1.187 0.821 0.747 0.337 1.39 0.52 0.93 -0.23 0.26 -0.35 0.57 0.81 0.72 0.70 0.85 0.96 1.01
0.308 1.157 1.131 1.030 1.347 1.186 1.320 1.194 1.352 1.034 1.123 1.156 0.307 0.30 1.153 1.122 1.031 1.340 1.184 1.312 1.184 1.340 1.031 1.122 1.153 0.304. 1.28 0.37 0.77 -0.07 0.53 0.12 0.61 0.86 0.87 0.29 0.10 0.22 0.79
J
M
I0.595 0.609 -1.99
1.059 1.058 0.06
1.158 1.157 0.06
0.740 0.750 -1.39
1.138 1.157 -1.81
1.039 1.058 -1.80
0.602 0.604 -0.25
0.519 0.628 -1.45
0.632 0.628 0.61

* Figure 5.3
Power Distribution for Flux Map 2003
1
+
LOOP B
1.041 1.038 0.28
LOOP 8 /
2 3 4 5 6 7 8 9 10 11
0.320 0.356 0.309 0.317 0.359 0.317 0.95 -0.86 -2.58
- --- t ~ I - I -
0.596 0.600 -0.63
1.051 1.0141 0.95
1.164 1.153 0.95
0.774 0.784 -1.21
0.632 0.623 1.36
0.619 0.623 -0.74
1.025
1.0 41 -1.53
I I I. 0.599 0.600 -0.18
0.619 0.623 -0.63
1.129 1.153 -2.06
~1 .020 0.6001.020 0 1.041 -2.04-2.014 -0.051.200
1.200 -0.05
1.001 1.015 -1.143
1. 141 1.153 -1.04
____ A 4 4 ~ -0.313 0.317 -1.35
1.016 1.013 0.28
1.198 1.200 -0.14
1.207 1.211 -0.38
0.591
0.600 -1.58
1.022 1.015 0.65
1.155 1.157 -0.21
1.158 1.151 0.60
1.332 1.332 -0.04
1. 136
1.153 -1.149
0.309 0.317 -2.149
0.921 0.923 -0.24
1.294 1.289 0.37
0.772
0.784 -1.149
0.350 0.359 -2.148
1.139 1.151 -1.09
1.339 1.332 0.50
0.997 1.015 -1.75
1.171 1.157 1.22
1.039
1.041 -0.20
1.031 1.013 1.79
12 13
0.598 1.195 1.088 1.216 1.052 1.206 1.038 1.206 1.096 1.216 0.607 0.599 1.197 1.089 1.213 1.0149 1.211 1.049 1.213 1.089 1.197 0.599 -0.17 -0.19 -0.12 0.26 0.32 -0.44 -1.02 -0.56 0.62 1.60 1.37
1.234 1.211 1.87
0.320 1.165 1.158 1.042 1.325 1.176 1.300 1.189 1.341 1.054 1.158 1.154 0.317
0.316 1.150 1.145 1.043 1.325 1.179 1.297 1.179 1.325 1.043 1.145 1.150 0.316 1.27 1.26 1.16 -0.08 -0.03 -0.30 0.26 0.83 1.18 1.02 1.17 0.31 0.38
0.359 0.781 0.924 1.200 1.280 1.287 0.975 1.303 1.289 1.211 0.925 0.782 0.358 0.357 0.781 0.919 1.205 1.280 1.293 0.971 1.293 1.280 1.205 0.919 0.781 0.357 0.50 0.00 0.59 -0.43 -0.02 -0.46 0.42 0.80 0.72 0.52 0.65 0.22 0.25
0.317 1.149 1.151 1.044 1.333 1.182 1.300 1.186 1.335 1.041 1.112 1.142 0.313 0.316 1.150 1.145 1.043 1.325 1.179 1.297 1.179 1.325 1.013 1.1145 1.150 0.316 0.38 -0.14 0.48 0.07 0.58 0.21 0.22 0.59 0.75 0.12 -0.25 -0.72 -0.98
C
D
E
F
G
H
0.602 1.204 1.096 1.220 1.049 1.208 1.047 1.212 1.077 1.183 0.592 0.599 1.197 1.089 1.213 1.049 1.211 1.0149 1.213 1.089 1.197 0.599
0.60 0.57 0.60 0.60 0.02 -0.24 -0.24 -0.12 -1.15 -1.19 -1.19
1.031 1.038 -0.67
1.009
1.013 -0.40
1.211 1.211 -0.03
1.191 1.200 -0.75
1. 165
1.157 0.67
1.336
1.332 0.27
1. 146
1.151 -0.149
1.291
1.289 0.12
0.920
0.923 -0.31
1.334 1.332 0.14
1. 1 48
1.151 -0.27
1. 161
1.157 0.32
1.0 14
1.015 -0.16
1. 198
1.200 -0.20
1.006 1.013 -0.69
0.616 0.623 -1.22
1.056 1.038 1.70
1.026 1.038 -1.19
('LOOP A
\ LOOP A
DFLUX MRP 2003
MEASURED FOHN
PREDICTED FOMN
PERCENT DIFFERENCE
-- 91- 25 -
R
B
1.207 1.211 -0.37
K
L
M
0.60 0 0.600 -0.05

Figure 5.4
r Distribution for Flux Map 2
1 2 3 4
-*1*-
1.019 1.012 0.67
1.203 1.205 -0.20
0.594 0.600 -0.95
5 6 7 8 9 10 11
0.328 0.365 0.313 0.322 0.367 0.322 1.96 -0.146 -2.79
1.172
1.149 1.97
1.166 1.157 0.79
0.597 1.181 1.078 1.208 1.055 1.212 1.045 1.201 1.088 1.20010.606 0.598 1.183 1.083 1.208 1.054 1.216 1.054 1.208 1.083 1.183 0.598 -0.13 -0.18 -0.51 -0.03 0.11 -0.35 -0.90 -0.54 0.48 1.45 1.37
0.945 0.955 -1.05
1.124 1.149 -2.17
0.599 0.600 -0.08
1.185
1.186
-0.00
0.617 0.623 -1.11
____ A. 4 -~ 4 4 .4. 4 4
0.313
0.322 -2.89
0.777 0.79S -2.16
0.356 0.367 -2.89
1.154 1.156 -0. 14
1.024 1.033 -0.89
1.327 1.327 -0.01
1.287 1.286 0.10
1.329 1.327 0.15
1.135 1.1149 -1.23
0.318 0.322 -1.21
1.165 1.156 0.75
1.039 1.033 0.54
1.224 1.205 1.54
0.603 0.600 0.55
1.031 1.012 1.86
12 13
1.038 1.031 0.68
C
E
F
G
H
0.605 1.197 1.094 1.219 1.051 1.207 1.047 1.201 1.072 1.170 0.592 0.598 1.183 1.083 1.208 1.054 1.216 1.054 1.208 1.083 1.183 0.598 1.20 1.16 1.00 0.89 -0.28 -0.71 -0.70 -0.60 -1.01 -1.06 -1.05
1.026 1.031 -0.51
1.013 1.012 0.08
0.623 0.623 -0.11
1.208 1.205 0.28
1.184 1.186 -0.13
1.164 1.156 0.68
1.007 1.015 -0.79
1.331 1.327 0.29
1.141 1.157 -1.43
1.285 1.286 -0.08
1.326 1.327 -0.08
1.151 1.157 -0.51
1.156 1.156 0.00
1.015 1.015 -0.01
1.200 1.205 -0.44
1.193 1.186 0.55
1.005 1.0i2 -0.68
/LOOP
\ a LOiP A
1.054 1.031 2.20
DFLUX MRP 2004
- 26 -
MERSURED FOHN
PREDICTED FDHN 4- E F
PERCENT DIFFERENCE
---- 01
R
B LOiP B
1.020 1.031 -1.06
0.326 1.163 1.165 1.0q7 1.321 1.177 1.292 1.182 1.330 1.057 1.168 1.148 0.321 0.321 1.145 1.152 1.047 1.321 1.179 1.293 1.179 1.321 1.047 1.152 1.145 0.321 1.56 1.55 1.16 0.03 -0.02 -0.14 -0.05 0.27 0.70 0.93 1.42 0.25 -0.06
0.367 0.792 0.956 1.207 1.277 1.287 0.977 1.294 1.281 1.217 0.960 0.793 0.364 0.365 0.792 0.951 1.211 1.277 1.289 0.976 1.289 1.277 1.211 0.951 0.792 0.365 0.36 0.04 0.58 -0.30 0.00 -0.19 0.10 0.36 0.32 0.45 0.94 0.14 -0.25
0.322 1.144 1.158 1.047 1.326 1.181 1.294 1.183 1.327 1.048 1.151 1.134 0.313 0.321 1.145 1.152 1.047 1.321 1.179 1.293 1.179 1.321 1.047 1.152 1.145 0.321 0.19 -0.11 0.49 0.00 0.35 0.18 0.11 0.36 0.43 0.09 -0.11 -0.93 -2.31
LOiP B
L
M
0.594
0.600
-0.98
1.180
1.186
-0.53
1.053
1.033
1.97
1.024
1.015
0.99
0.789
0.795
-0.76
0.957
0.955
0.23
1.126
1.1499
-1.98
1.1465
1.157
-0.96
.1.013 1.033
-1.96
0.999
1.015
-1.56
0.617
0.623
-0.99
0.632
0.623
1.38
1 1

Figure 5.5 ower Distribution for Flux Map 2005
5 6 7 8 9
LOOP 8
1.015 1.012 0.31
U.5 6
0.600 -0.73
1.175 1.180 -0.43
1.U5
1.031 2.05
1.026 1.015 1.11
1.153 1.154 -0.13
1.002 1.015 -1.26
0.332 0.325 2.06
1.172
1.148 2.05
1.171 1.161 0.83
1.322 1.323 -0.05
1.151 1.161
-0.84
0.370 0.372 -0.43
0.797 0.802 -0.55
- I + I. .4. 1 L I. 0.620
0.633 -1.77 -1.77 -0.08
0.625
0.625
0.598 1.17 .1.078 1.206 1.057 1.2141 1.0L7 1.200 1.086 1.193 0.607 0.599 1.177 1.081 1.204 1.055 1.217 1.055 1.204 1.081 1.177 0.599 -0.20 -0.23 -0.24 0.18 0.16 -0.23 -0.79 -0.37 0.44 1.38 1.34
0.622 0.625 -0.42
0.591 0.600 -1.47
1.017
1 .031 -1.39
0.600 0.600 -0.03
0.973 0.969 0.36
1.284 1.282 0.13
0.963 0.969 -0.62
0.785 0.802 -2.02
0.350 0.372 -3.17
0.316 0.325 -2.77
1. 125 1.013 0.500
1.148 1.031
0.600
1.177 1.180 -0.26
1.180 1.180 -0.03
4 .4. 4 4 -4. 41.125 1.148 -2.01
+4 ~t ~0.315
0.325 -3.17
1.152 1.161 -0.82
1.325
1.323 0.15
1.156 1.161 -0.41
1.133
1.148 -1.33
0.320 0.325 -1.63
1.002 1.015 -1.28
1.153 1.154 0.81
1.013 1.015 -0.19
1.031 1.031 -0.04
1.179 1.180 -0.08
1. 198 1.201 -0.24
1.163 1.154 0.81
0.606 1.192 1.093 1.216 1.054 1.211 1.050 1.200 1.070 1.164 0.592 0.599 1.177 1.081 1.204 1.055 1.217 1.055 1.204 1.081 1.177 0.599 1.24 1.24 1.10 1.02 -0.13 -0.51 -0.50 -0.35 -1.01 -1.11 -1.12
1.014
1.012 0.24
1.206 1.201 0.43
1.326 1.323 0.23
1.281 1.282 -0.09
1.322 1.323 -0.08
1.154 1.154 -0.03
1.21B 1.201 1.43
1.194 1.201 -0.62
1.031 1.012 1.91
1.004 1.0.12 -0.83
0.617 0.625 -1.22
1.054 1.029 2.40
1.018 1.029 -1.12
j/LOOP F
LOOP A
DFLUX MRP 2005
- 27 -
4 EASURED FOHN
PREDICTED FDHN
PERCENT DIFFERENCE
1o 01
1 2 3 4
R
B
4 4
10 11 12 13
4 I.-C
D
E
F
G
H
1.032
1.029 0.30
0.328 1.161 1.169 1.049 1.318 1.175 1.291 1.183 1.328 1.054 1.166 1.145 0.325 0.324 1.145 1.155 1.049 1.317 1.177 1.289 1.177 1.317 1.049 1.155 1.145 0.324 1.42 1.40 1.19 0.03 0.03 -0.18 0.12 0.47 0.80 0.46 0.96 -0.03 0.19
0.373 0.801 0.973 1.209 1.275 1.281 0.979 1.291 1.278 1.210 0.969 0.797 0.370 0.370 0.799 0.965 1.211 1.274 1.285 0.977 1.285 1.274 1.211 0.965 0.799 0.370 0.70 0.34 0.83 -0.17 0.05 -0.29 0.24 0.49 0.33 -0.11 0.33 -0.19 0.00
0.326 1.148 1.164 1.052 1.325 1.179 1.290 1.181 1.322 1.046 1.147 1.130 0.317 0.324 1.145 1.155 1.049 1.317 1.177 1.289 1.177 1.317 1.049 1.155 1.145 0.324 0.56 0.21 0.74 0.27 0.56 0.18 0.07 0.33 0.36 -0.33 -0.72 -1.31 -2.01
I
J
1.027 1.029 -0.20
LOOP B
L
M
1.128 1.148 -1.77
1.013 1.031 -1.77
0.500 0.600 -0.08
0.620 0.625 -0.74
0.633 0.625 1.34

P Figure 5.6
P r Distribution for Flux Map 20O
1 2 3 5 6 7 8 9 10 11
0.332 0.373 0.318 0.326 0.374 0.326 1.93 -0.21 -2.2
-0.69 1.93 1.94 -0.63 -1.79 0.13 El. 818 0.633
0.623
0.6231.174 1.174
-0.03
1.181 1.174
0.56.4 4 I. ~4. 4 4. 4
0.594 0.598 -0.74
0.315 0.326 -3.38
0.361 0.374 -3.40
0.321 0.326 -1.44
LOOP B
12 13
1.054 1.023 3.05
/'LCIP A
1.015 1.011 0.43
1. 198 1.202 -0.32
1.027
1.014 1.28
1.018 1.025 -0.66
1.175 1.163 1.01
1.324 -0.27
1.121 1.145 -2.10
0.984 0.982 0.18
1.*282
1.285 -0.26
0.788 0.804 -2.11
1.125 1.145 -1.80
0.596 1.169 1.079 1.204 1.059 1.215 1.049 1.200 1.088 1.194 0.607 0.597 1.171 1.079 1.204 1.058 1.222 1.058 1.204 1.079 1.171 0.597 -0.12 -0.15 0.01 0.02 0.10 -0.61 -0.90 -0.32 0.84 1.92 1.68
0.625 0.623 0.34
0.601 0.598 0.57
1.152 1.163 -0.95
1.324 1.324
-0.02
1.132 1.145 -1.19
0.995 1.014 -1.55
1.165 1.154 0.92
1.031
1.025 0.56
1.175 1.174 0.13
1.* 199 1.154 -0.47
1.195 1.202 -0.57
0.609 1.193 1.092 1.213 1.053 1.216 1.052 1.199 1.069 1.161 0.591 0.597 1.171 1.079 1.204 1.058 1.222 1.058 1.204 1.079 1.171 0.597 2.06 1.90 1.20 0.72 -0.48 -0.53 -0.53 -0.40 -0.92 -0.87 -0.85
1.016 1.011 0.46
1.205 1.202
0.22
1.178 1.174 0.31
1.151 1.154 -0.23
1.009 1.014 -0.55
1.320 1.324 -0.31
1.154 1.163 -0.81
1.281 1.285 -0.33
0.976 0.982 -0.62
1.320 1.324 -0.32
1.160 1.163 -0.22
1.151 1.154 -0.27
1.015 1.014 0.10
0.618 0.623 -0.82
1.014 1.023 -0.87
\ LOOP A
1.229 1.202 2.20
1.038 1.011 2.61
1.004 1.011 -0.67
DFLUX MRP 2006
MEASURED FOHN PREDICTED FOHN
PERCENT DIFFERENCE
- 28 -
R
B
C
D1.028 1.023 0.43
F
G
H
0.329 1.156 1.173 1.052 1.313 1.169 1.283 1.177 1.326 1.058 1.175 1.144 0.327 0.325 1.141 1.158 1.052 1.317 1.178 1.289 1.178 1.317 1.052 1.158 1.141 0.325 1.32 1.33 1.30 -0.03 -0.31 -0.77 -0.48 -0.07 0.68 0.57 1.43 0.28 0.62
0.374 0.803 0.986 1.214 1.275 1.276 0.975 1.284 1.275 1.214 0.983 0.803 0.374 0.372 0.802 0.978 1.217 1.276 1.285 0.978 1.285 1.276 1.217 0.978 0.802 0.372 0.56 0.11 0.78 -0.30 -0.11 -0.75 -0.30 -0.08 -0.09 -0.25 0.55 0.10 0.40
0.326 1.141 1.166 1.052 1.320 1.175 1.285 1.177 1.317 1.048 1.150 1.127 0.319 0.325 1.141 1.158 1.052 1.317 1.178 1.289 1.178 1.317 1.052 1.158 1.141 0.325 0.43 -0.01 0.66 -0.04 0.24 -0.30 -0.28 -0.08 -0.01 -0.41 -0.68 -1.22 -1.82
1.023 1.023 -0.06
K
L
M
LOOP B /
06
0.598
-0.691.025
1.93
1.1675
1.990.804
-0.63
1.007
1.025
-1.79
0.599
0.598 0.13
U.518 0.623
-0.69
0.533 0.623
1.67

6.0 REACTOR STARTUP CALIBRATIONS
6.1 Rod Position Calibration
The rod position indicators are calibrated each refueling in accordance with
an approved surveillance procedure. The calibration includes the following:
a) The position signal output is checked at 20 and 200 steps for all rods.
b) The rod bottom lamps are checked to assure that they light at the proper
rod height.
c.) The control room rod position indicators are calibrated to.read correctly
at 20 and 200 steps.
d) The pulse-to-analog convertor alignment is checked.
e) The rod bottom bypass bi-stable trip setpoint is checked.
The calibration was performed satisfactorily during the Cycle 20 startup; no
problems or abnormalities were encountered and site procedure acceptance
criteria were met. At full power an adjustment was made to selected RPI
channels to compensate for the temperature increase associated with power
ascension.
- 29 -

6.2 Nuclear Instrumentation Calibration
The nuclear instrumentation (NI) calibration was performed in accordance with
the Kewaunee Reactor Test Program during the Cycle 20 startup (4). A flux map
was performed at approximately 75 percent power. The incore axial offset was
determined from the data collected during the map. The NI's were then
calibrated with a conservative incore axial offset-to-excore axial offset
ratio of 1.7.
- 30 -

7.0 REFERENCES
(1) "Reload Safety Evaluation for Kewaunee-Cycle 20," Wisconsin Public
Service Corporation, February 1994.
(2) "Qualification of Reactor Physics Methods for Application to Kewaunee,"
Wisconsin Public Service Corporation, October 1978.
(3) "Reload Safety Evaluation Methods for Application to Kewaunee",
WPSRSEM-NP-A, Revision 2, October 1988.
(4) "Reactor Test Program, Kewaunee Nuclear Power Plant," Wisconsin Public
Service Corporation, May 1979. (Revision 3, March 1987)
(5) "Generic Mechanical and Thermal Hydraulic Design for Exxon Nuclear
14 x 14 Reload Assemblies with Zircaloy Guide Tubes for Westinghouse
2-Loop Pressurized Water Reactors," Exxon Nuclear Corporation, November
1978.
(6) "Rod Exchange Technique for Rod Worth Measurement" and "Rod Worth
Verification Tests Utilizing RCC Bank Interchange," Westinghouse
Corporation, May 12, 1978.
(7) "Kewaunee Nuclear Power Plant Technical Specifications," Wisconsin
Public Service Corporation, Docket 50-305.
- 31 -