principles of planning for sustaining placesmedia2.planning.org/apa2012/presentations/s520... ·...
TRANSCRIPT

Principles of Planning for Sustaining Places
David R. Godschalk FAICP UNC Chapel Hill
Making Comprehensive Plans to Sustain Places
APA Conference Los Angeles 15 April 2012
Agenda
Sustaining Places Task Force charge, process, state of art
Sustaining Places planning principles
examples from reviewed plans
Beyond best practices---cities as sustainable resource producers further thoughts & speculations

Sustainability—Defining Challenge of 21st Century
Issues
Resource depletion
Climate instability
Energy production
Economic stress
Social inequity
Public health
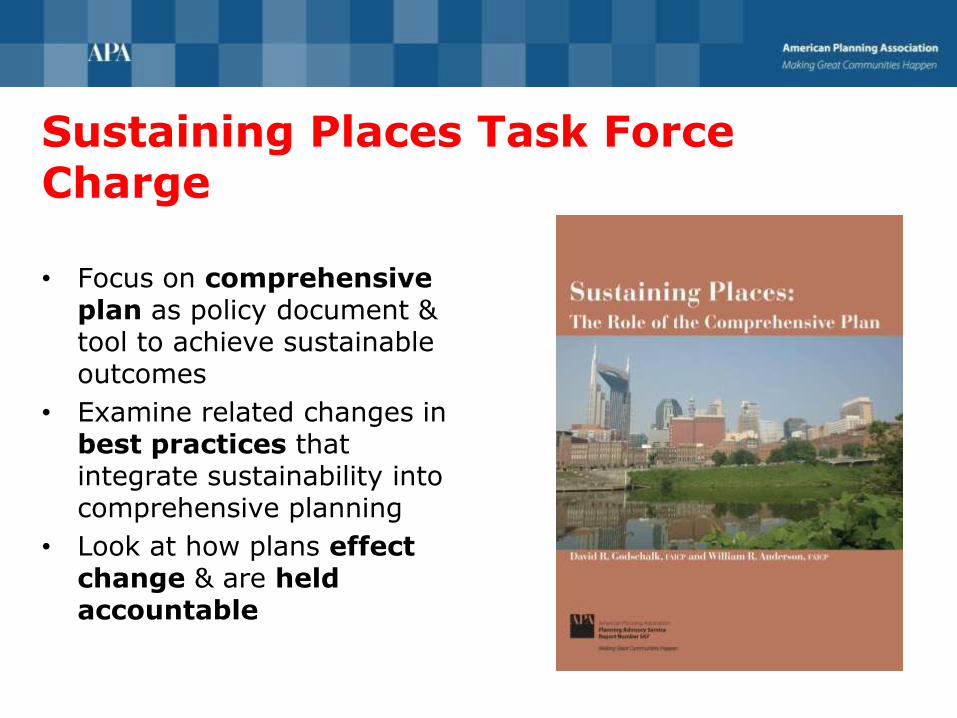
Sustaining Places Task Force Charge
• Focus on comprehensive plan as policy document & tool to achieve sustainable outcomes
• Examine related changes in best practices that integrate sustainability into comprehensive planning
• Look at how plans effect change & are held accountable

Task Force
Appoint. Fall
2010
Report Drafting
Interim Report
April 2011
Corres. Comm. Review
Final Report
Fall 2011
William Anderson FAICP co-chair
David Godschalk FAICP co-chair
Rudayna Abdo AICP
Kenneth Bowers AICP
Timothy Beatley
Benjamin Herman FAICP
Stephen Hardy AICP
Daniel Lerch
Ann McAfee
William Moomaw
David Rouse AICP
Eric Shaw
Sustaining Places Task Force Process PAS
REPORT
Jan.
2012
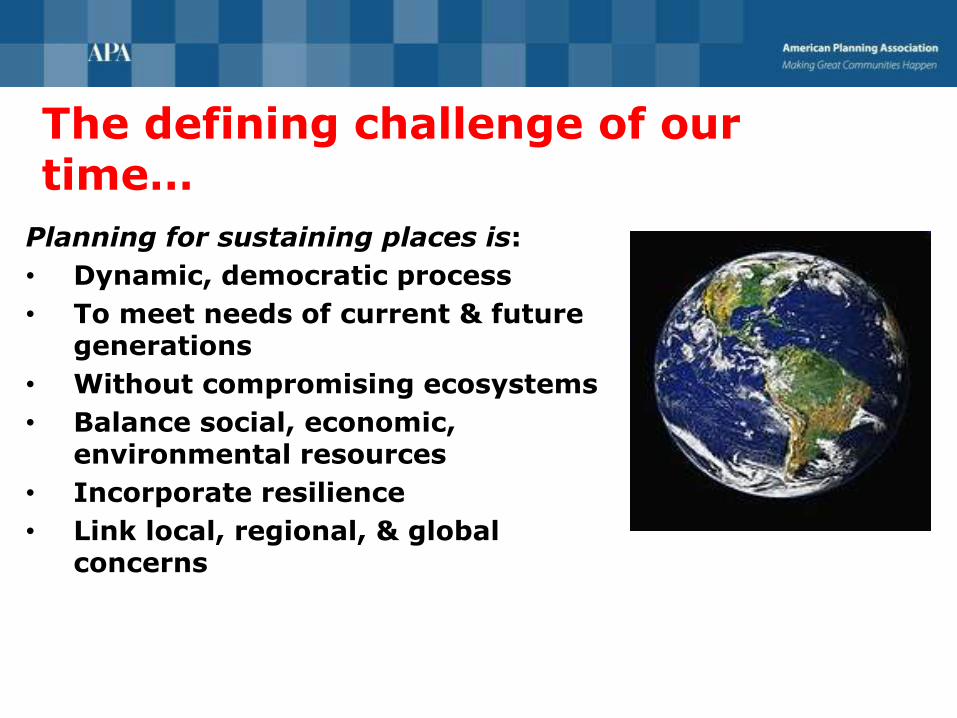
The defining challenge of our time…
Planning for sustaining places is:
• Dynamic, democratic process
• To meet needs of current & future generations
• Without compromising ecosystems
• Balance social, economic, environmental resources
• Incorporate resilience
• Link local, regional, & global concerns
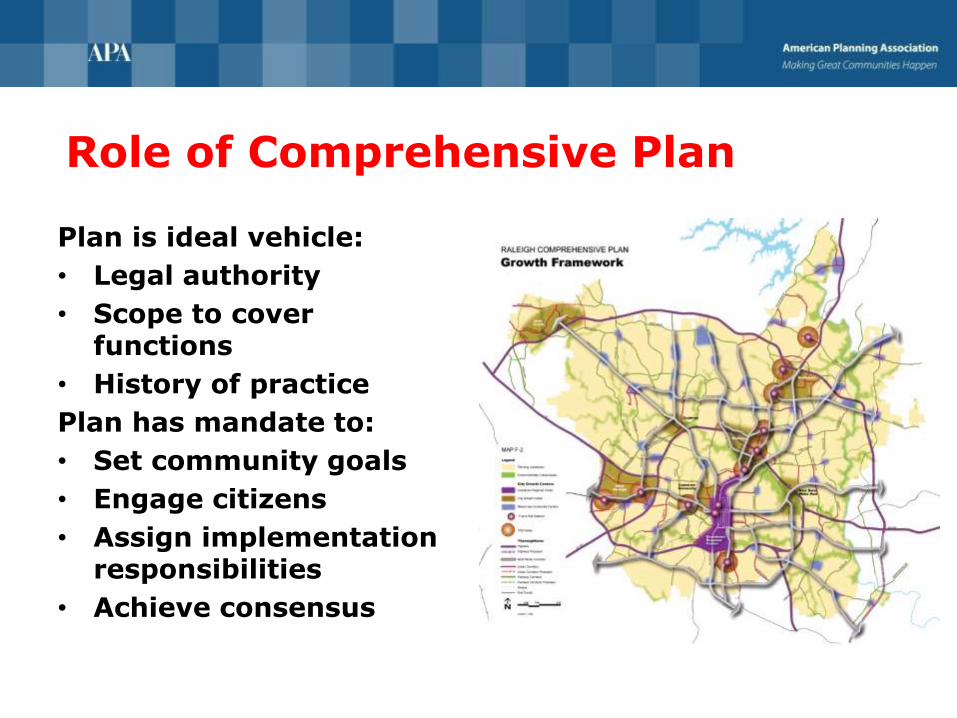
Role of Comprehensive Plan
Plan is ideal vehicle:
• Legal authority
• Scope to cover functions
• History of practice
Plan has mandate to:
• Set community goals
• Engage citizens
• Assign implementation responsibilities
• Achieve consensus

Region:
San Diego Region CA
County:
Marin County CA, Union County OH
Growing Large City:
Seattle WA
Shrinking Large City: Philadelphia PA, Cleveland OH
Medium/Small City:
Fort Collins CO, Albany NY, Burlington VT, Keene NH
Plans Reviewed

Characteristics of Plans for Sustaining Places
• Adopt sustainability principles
• Integrate policies across programs
• Consider equity, health & wellbeing impacts
• Act on scientific evidence
• Address demands with limited funds
• Implement non-traditional goals
• Monitor sustainability metrics
• Link to regional plans
• Conduct stakeholder engagement

Emerging Model of Sustaining Places Planning
Adaptive planning
Sustainability goals
Integrated technical & participatory tracks
Evidence-based scenarios—What If?
Metric outcome measures
Target tracking
Ongoing implementation
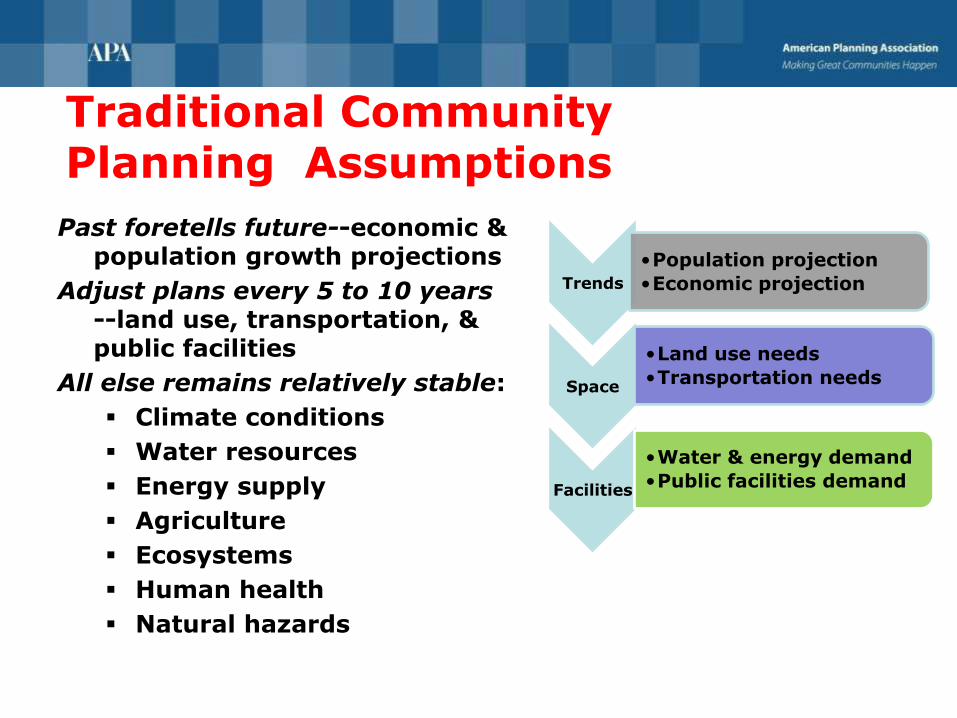
Traditional Community Planning Assumptions
Past foretells future--economic & population growth projections
Adjust plans every 5 to 10 years --land use, transportation, & public facilities
All else remains relatively stable:
Climate conditions
Water resources
Energy supply
Agriculture
Ecosystems
Human health
Natural hazards
Trends
•Population projection
•Economic projection
Space
•Land use needs
•Transportation needs
Facilities
•Water & energy demand
•Public facilities demand
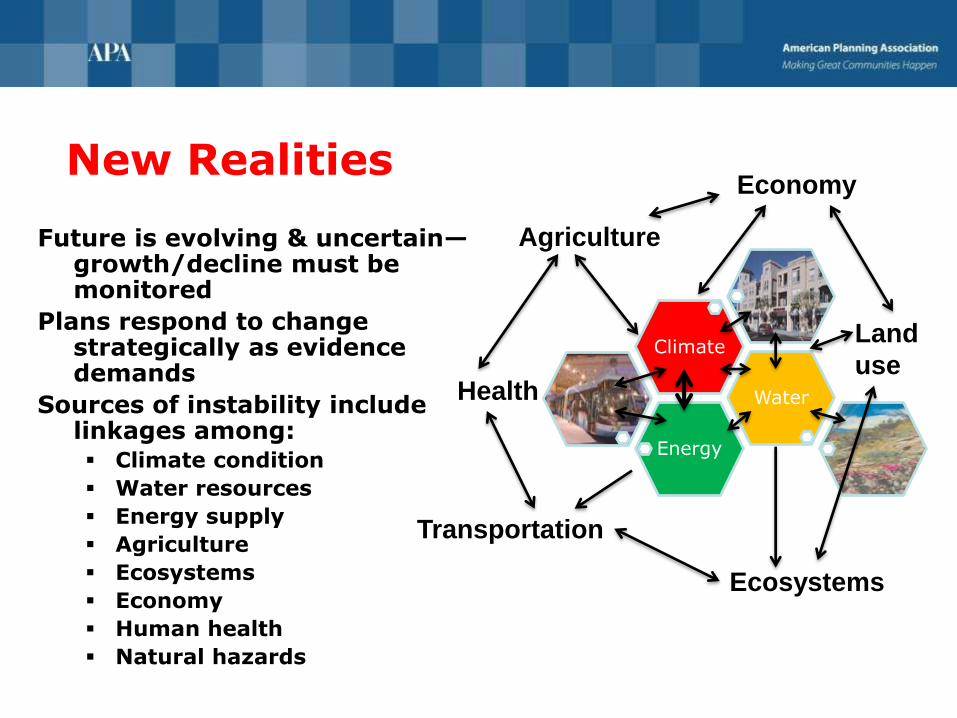
New Realities
Future is evolving & uncertain—growth/decline must be monitored
Plans respond to change strategically as evidence demands
Sources of instability include linkages among: Climate condition
Water resources
Energy supply
Agriculture
Ecosystems
Economy
Human health
Natural hazards
Energy
Water
Climate Land
use
Ecosystems
Agriculture
Health
Transportation
Economy
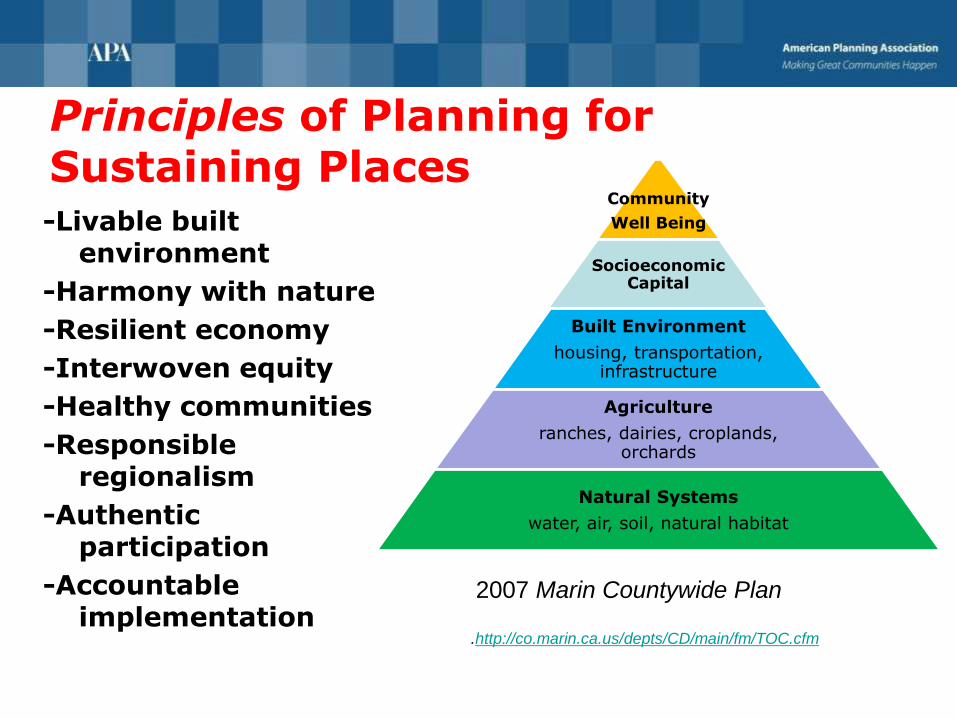
Principles of Planning for Sustaining Places -Livable built
environment
-Harmony with nature
-Resilient economy
-Interwoven equity
-Healthy communities
-Responsible regionalism
-Authentic participation
-Accountable implementation
2007 Marin Countywide Plan
.http://co.marin.ca.us/depts/CD/main/fm/TOC.cfm
Community
Well Being
Socioeconomic Capital
Built Environment
housing, transportation, infrastructure
Agriculture
ranches, dairies, croplands, orchards
Natural Systems
water, air, soil, natural habitat

Livable Built Environment Principle
Ensure that all elements of the built environment, including land use, transportation, housing, energy, and infrastructure, work together to provide sustainable, green places for living, working, and recreation with a high quality of life.
Characteristics: Transportation choices Green building stands.
Mixed land use at different scales Renewable energy
Infill development Urban design standards
Range of housing types Regional transportation
Access to public facilities Complete streets
Walkable neighborhoods Historic preservation

Livable Built Environment Example
2004 Sustainable Seattle Plan
Urban Village strategy combines smart growth, urban design, & participation
Balances environment, equity, & economic—the 3-E goal
Seattle’s Core Values:
Community
Environmental Stewardship
Economic Opportunity & Security
Social Equity

Harmony with Nature Principle
Ensure that contributions of natural resources to human wellbeing are explicitly recognized and valued and that maintaining their health is a primary objective.
Characteristics: Conserve natural areas Reduce carbon footprints
Restore & connect habitats Respect topography
Meet air quality standards Achieve climate goals
Increase energy security Commit to green building
Reduce solid waste streams Restore/manage streams
Manage stormwater Conserve resources
Responsible stewardship Safe/adequate water supply
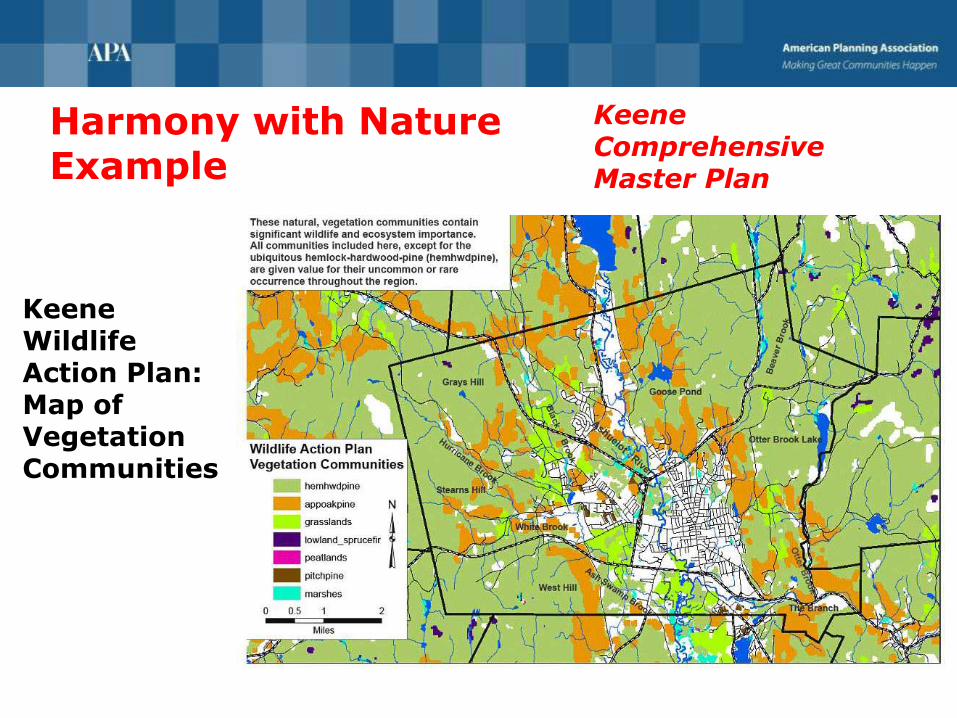
Harmony with Nature Example
http://ci.keene.nh.us/departments/planning/keene-cmp-2010
Keene Comprehensive Master Plan
Keene Wildlife Action Plan: Map of Vegetation Communities

Resilient Economy Principle
Ensure that the community is prepared to deal with both
positive and negative changes to its economic health and to
initiate sustainable urban development and redevelopment
that foster business growth and reliance on local assets.
Characteristics: Economic growth capacity Balanced land use mix
Commercial/industrial land supply Transport access to jobs
Green business encouragement Local ownership promotion
Regional competition response Neighborhoods at risk plans
Community-based economic develop. Jobs w/competitive wages
Innovative/entrepreneurial atmosphere Educational partnerships
Fiscal sustainability/transparency Efficient infrastructure
Advance plans for disaster recovery
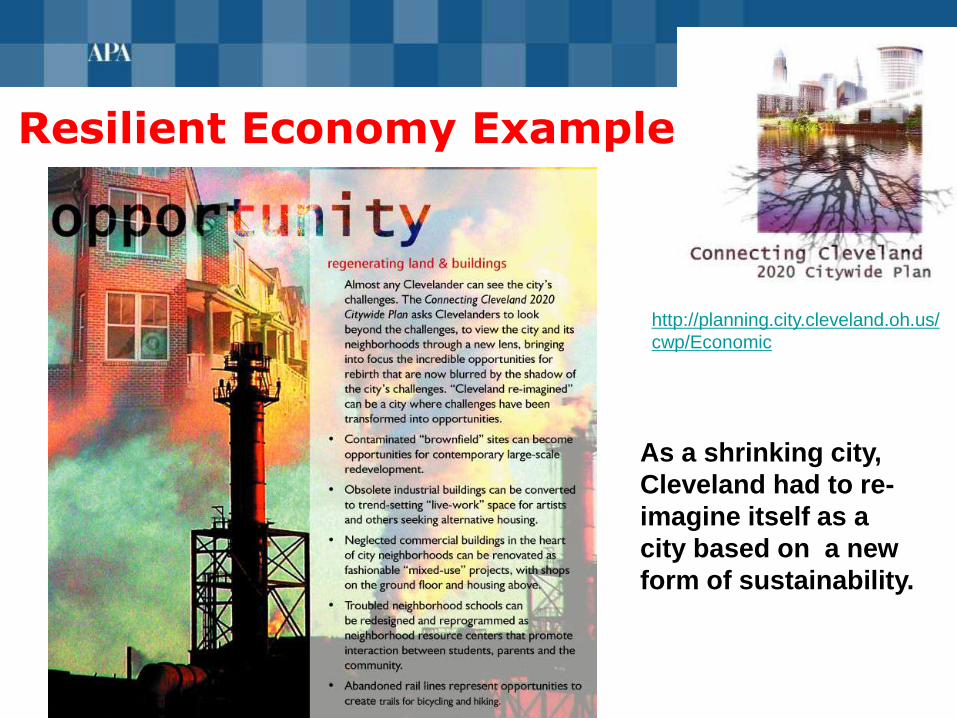
Resilient Economy Example
http://planning.city.cleveland.oh.us/
cwp/Economic
As a shrinking city,
Cleveland had to re-
imagine itself as a
city based on a new
form of sustainability.

Interwoven Equity Principle
Ensure fairness and equity in providing for the housing, services, health, safety, and livelihood needs of all citizens and groups.
Characteristics: Provide affordable housing Coordinate jobs/housing
Improve poor neighborhoods Improve at-risk health
Include under-served in planning Promote workplace diversity
Protect vulnerable from hazards Improve old infrastructure
Distribute costs/benefits equitably Measure plan outcomes
Make services accessible to minorities

Interwoven Equity Example
http://cultivatingcommunity.net
/draft-plan.html
Change zoning & subdivision regulations…to accommodate housing types for seniors, empty nesters, young singles, those with disabilities, & others.
Offer incentives (streamlined development review, density bonus, height bonus, etc.) to encourage mixed-income developments with variety of housing types.

Healthy Communities Principle
Ensure that public health needs are recognized and addressed through provisions for healthy foods, physical activity, access to recreation, health care, environmental justice, and safe neighborhoods.
Characteristics: Safe & healthy neighborhoods Accessible parks, open space
Opportunities for active lifestyles Locally grown healthy food
Wellness of at-risk populations Adequate schools for all
Mitigated brownfield sites Support for arts & culture
Design for walking & biking Environmental justice
Access to affordable health care

Healthy Communities Example KEY PRINCIPLES Community Safety •Foster a safe community. Community Wellness •Provide opportunities for healthy & active lifestyles. •Support local food production ACTIONS Near Term • Develop policy for agricultural
activities on Natural Areas Program lands.
• Convene inter-departmental team to acquire/manage open lands.
• Build partnerships to support community garden plots.
Community gardens and markets help to increase options & availability of healthy & local food options.
www.fcgov.com/advanceplanning/city-plan.php
Responsible Regionalism Principle
Ensure that all local proposals account for ,connect with, and support the plans of adjacent jurisdictions and the surrounding region.
Characteristics: City & regional activity connections Green-print plans
Fair share housing Infrastructure
Pop & econ projections Needs & priorities
Regional visions & plans Shared fiscal resources
Coordinate regional land use, open space & mobility programs
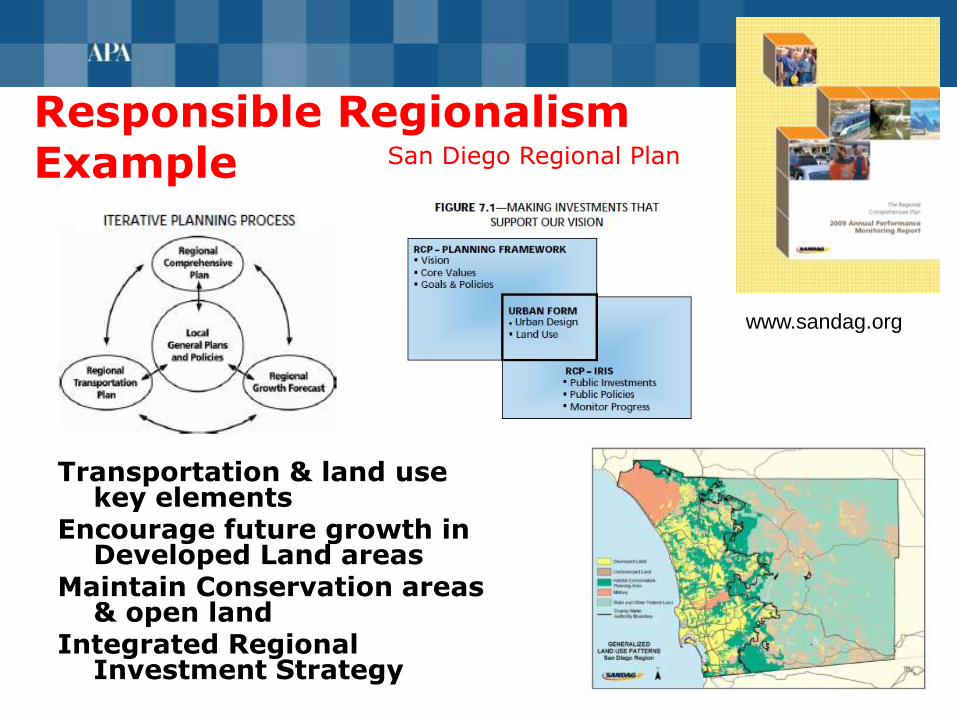
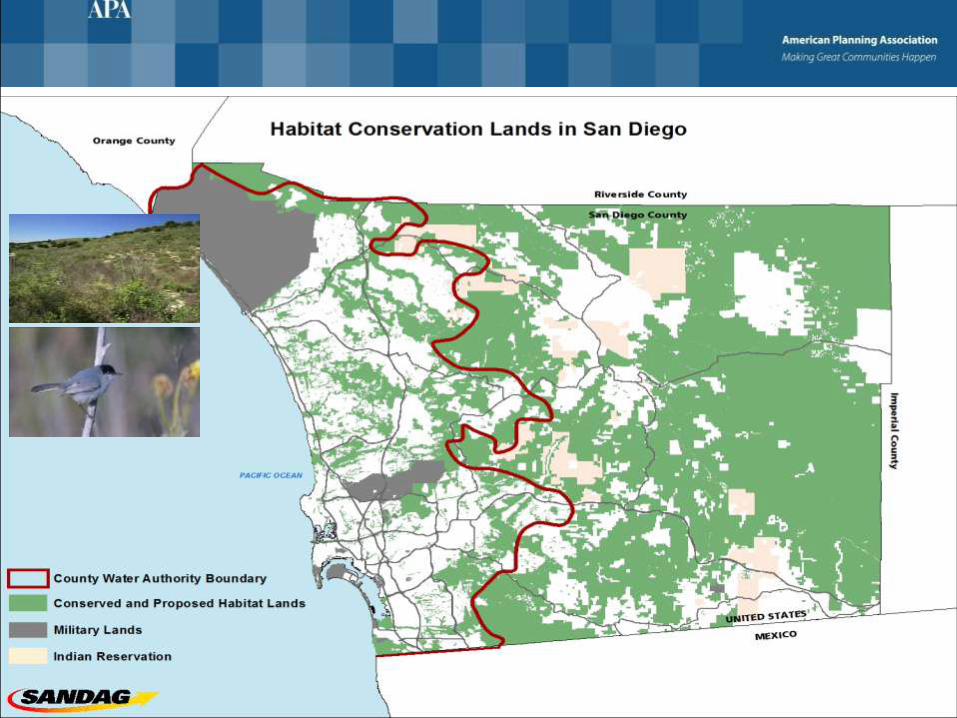
Responsible Regionalism Example
Transportation & land use key elements
Encourage future growth in Developed Land areas
Maintain Conservation areas & open land
Integrated Regional Investment Strategy
www.sandag.org
San Diego Regional Plan
Authentic Participation Principle Ensure that the planning process actively involves all
segments of the community in analyzing issues, generating visions, developing plans, and monitoring outcomes.
Characteristics: City/neighborhood involvement Diverse participation
Organize constituencies Stakeholder reps.
Techniques geared to populations Ongoing information
Social media use Disadvantaged leadership
Agency staff involvement Transparent decisions
Alternative vision scenarios & outcome evaluations
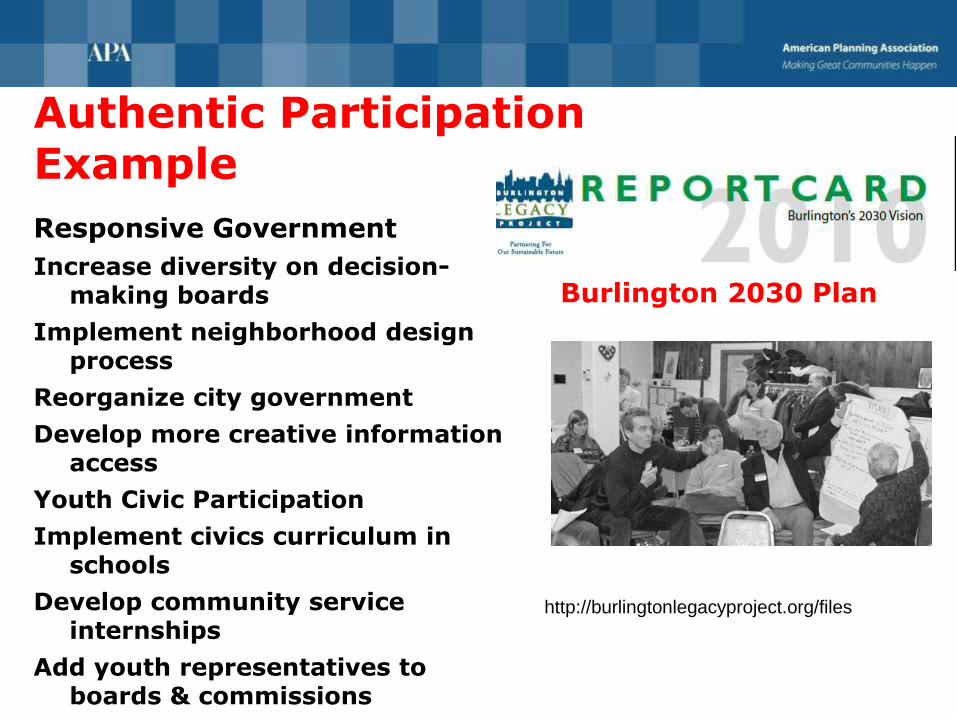
Authentic Participation Example
Responsive Government
Increase diversity on decision-making boards
Implement neighborhood design process
Reorganize city government
Develop more creative information access
Youth Civic Participation
Implement civics curriculum in schools
Develop community service internships
Add youth representatives to boards & commissions
http://burlingtonlegacyproject.org/files
Burlington 2030 Plan
Accountable Implementation Principle
Ensure that responsibilities for carrying out the plan are clearly stated, along with metrics for evaluating progress in achieving desired outcomes.
Characteristics: Involve public in goal setting Use indicators/metrics
Coordinate implementing agencies Assign responsibilities
Set plan-related invest. priorities Commit resources
Monitor outcomes/goal progress Report during budgeting
Balance upgrades, new services & green technology

Accountable Implementation Example
What must change in Albany as a system? Which strategies target needed changes? Keys to achieving the vision: • Improve Albany’s image &
quality of life • Increase fiscal capacity • Facilitate & mobilize private
investment • Establish Albany’s
reputation as a Green Community http://albany2030.org
Albany 2030 Plan

Beyond Best Practices: Cities as Resource Producers
• Settling for neutral impacts (emissions trading, green building, etc.) won’t make up for past damage or sustain future growth
• Turn cities from consumers into producers of environmental resources—biodiversity, energy, clean air & water
• Use metrics to identify & measure real sustainability
• Shape development decisions with real time outcome monitoring http://oursurprisingworld.com/acros-
fukuoka-the-serene-green-roof-of-
japan/

Recommendations for APA—Lead the Way • Establish professional culture of
sustaining places in planning practice & education
• Conduct research & develop sustaining places knowledge, concepts, &techniques
• Develop education & awareness to widen public & professional understanding of sustaining places planning
Sustaining Places Plan
Comprehensive Plan Accreditation

References
Birkeland, Janis. 2008. Positive Development: From Vicious Circles to Virtuous Cycles through Built Environmental Design. Sterling, VA: Earthscan.
Condon, Patrick M. 2010. Seven Rules for Sustainable Communities: Design Strategies for the Post-Carbon World. Washington, DC: Island Press.
Feiden, Wayne, and Elisabeth Hamlin. 2011. Assessing Sustainability: A Guide for Local Governments. (PAS 565) APA Planners Press.
Godschalk, D.R., and W. Anderson. 2012. Sustaining Places: The Role of the Comprehensive Plan. APA PAS Report #567, January.
Hollander, Justin B. 2011. Sunburnt Cities: The Great Recession, Depopulation, and Urban Planning in the American Sunbelt. New York: Routledge.
Mohsen, Mostafavi, and Gareth Doherty (eds.). 2010. Ecological Urbanism. Lars Muller Publishers.
Sartè, S. Bry. 2010. Sustainable Infrastructure: The Guide to Green Engineering and Design. Hoboken, NJ: John Wiley & Sons Inc.

Making Comprehensive Plans to Sustain Places
David Godschalk FAICP, Professor Emeritus, University of North Carolina, Chapel Hill
William Anderson FAICP, Principal/Vice President, AECOM, San Diego
Alex Hinds, Co-Founder Center for Sustainable Communities, Sonoma State University
APA Conference Los Angeles 15 April 2012
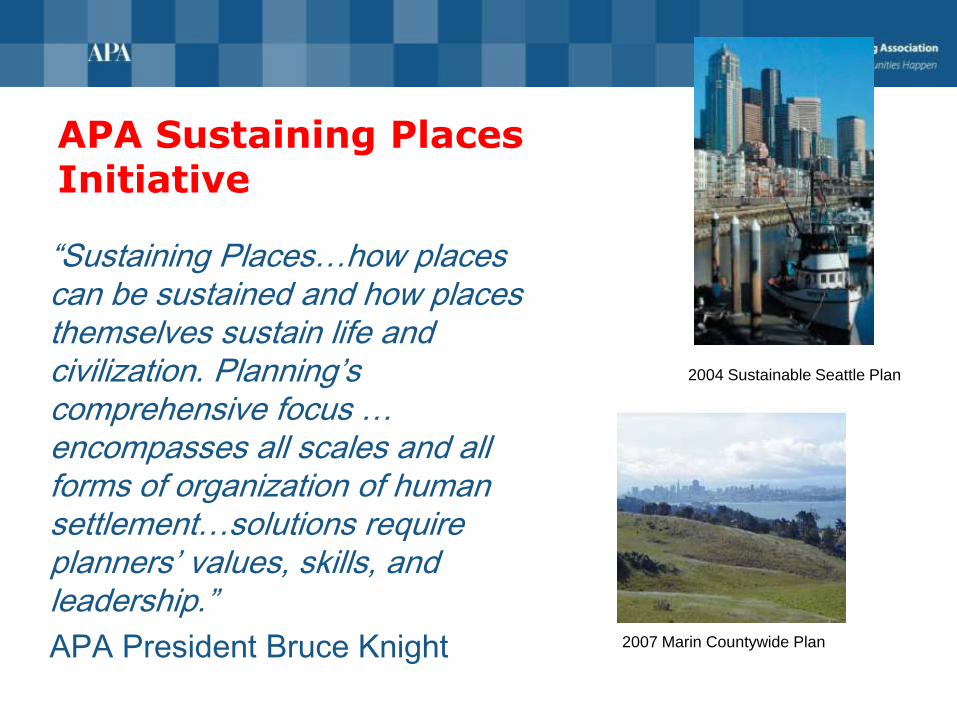
APA Sustaining Places Initiative
“Sustaining Places…how places can be sustained and how places themselves sustain life and civilization. Planning’s comprehensive focus … encompasses all scales and all forms of organization of human settlement…solutions require planners’ values, skills, and leadership.”
APA President Bruce Knight
2004 Sustainable Seattle Plan
2007 Marin Countywide Plan
Batting Order
David Godschalk Role of Comprehensive Plan. Planning principles.
William Anderson Planning scales . Implementation. San Diego Regional Plan.
Alex Hinds Plan metrics. Public participation. Marin Countywide Plan.

Continuing Education Credit for AIA Members This session has been approved to provide 1.25
LU/HSW/SD credits.
Sign up on sheet at back of room to claim credits.

Sustaining Places Planning Scale and the Vertical Integration of Plans
William Anderson, FAICP
Principal/Vice-President, AECOM
Supply of resources is regional Air, water, habitat, energy, employment
Demand for resources are local decisions
Land use, transportation choice, energy use, water use
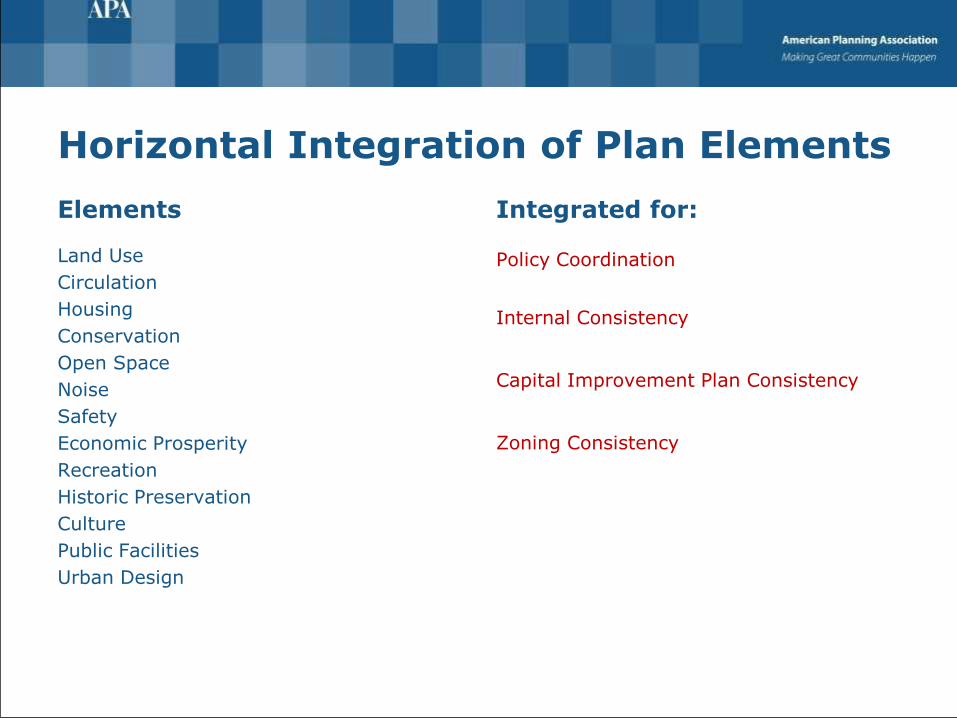
Horizontal Integration of Plan Elements
Elements
Land Use
Circulation
Housing
Conservation
Open Space
Noise
Safety
Economic Prosperity
Recreation
Historic Preservation
Culture
Public Facilities
Urban Design
Integrated for:
Policy Coordination
Internal Consistency
Capital Improvement Plan Consistency
Zoning Consistency


Planning Scale Example sustainability policies
Regional Plan • Air quality management • Habitat conservation system • Watershed and water quality management • Regional transportation network
Local Jurisdiction Plan • Land use types and location policies • Green building policies • Jobs/housing coordination • Economic base capacity • Bicycle circulation network
Community Plan • Parcel land use & zoning • Community public facilities strategy • Housing options • Mobility connections & pedestrian master plan • Community character & urban design policies
Master Plan • Development program • Building & site design • Passive energy systems • Landscaping for water conservation • Bicycle, pedestrian, and transit network connections

The
San Diego
Example
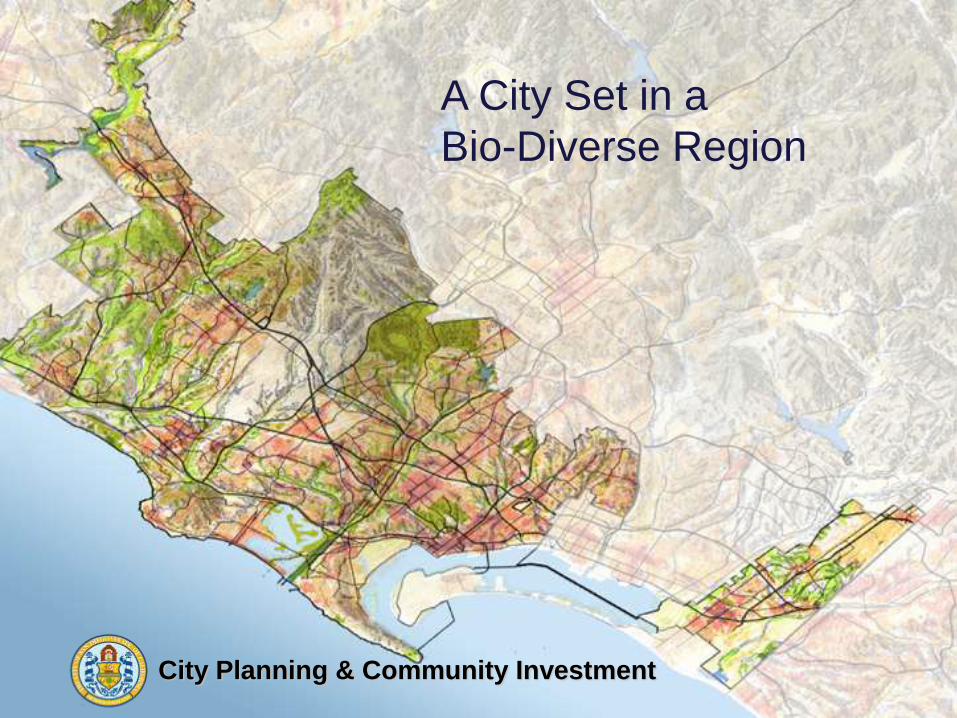
City Planning & Community Investment
A City Set in a
Bio-Diverse Region
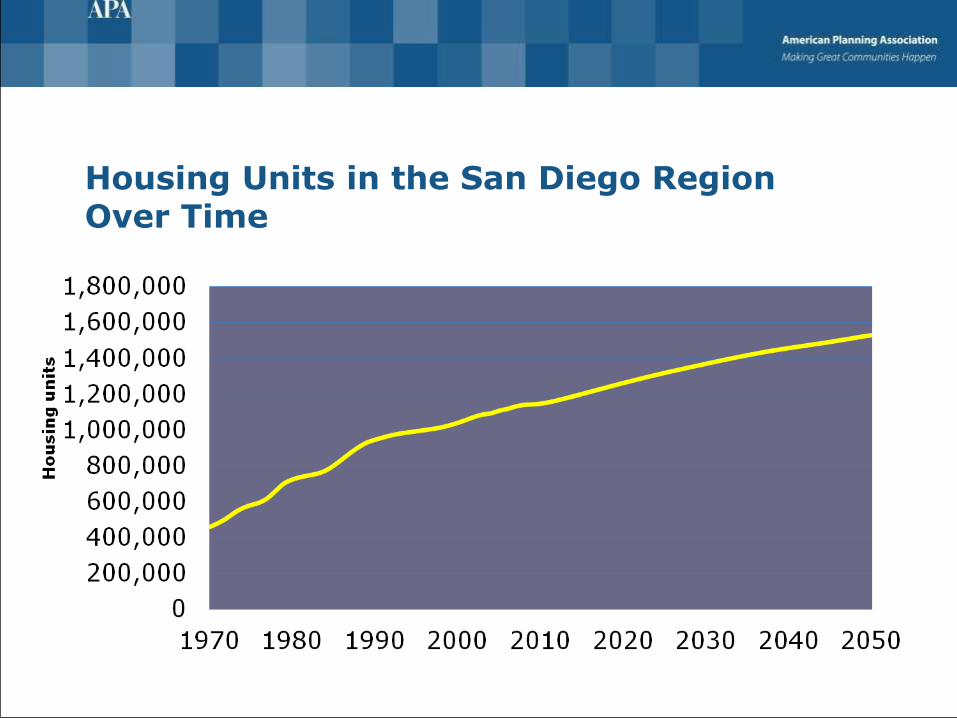
Housing Units in the San Diego Region Over Time
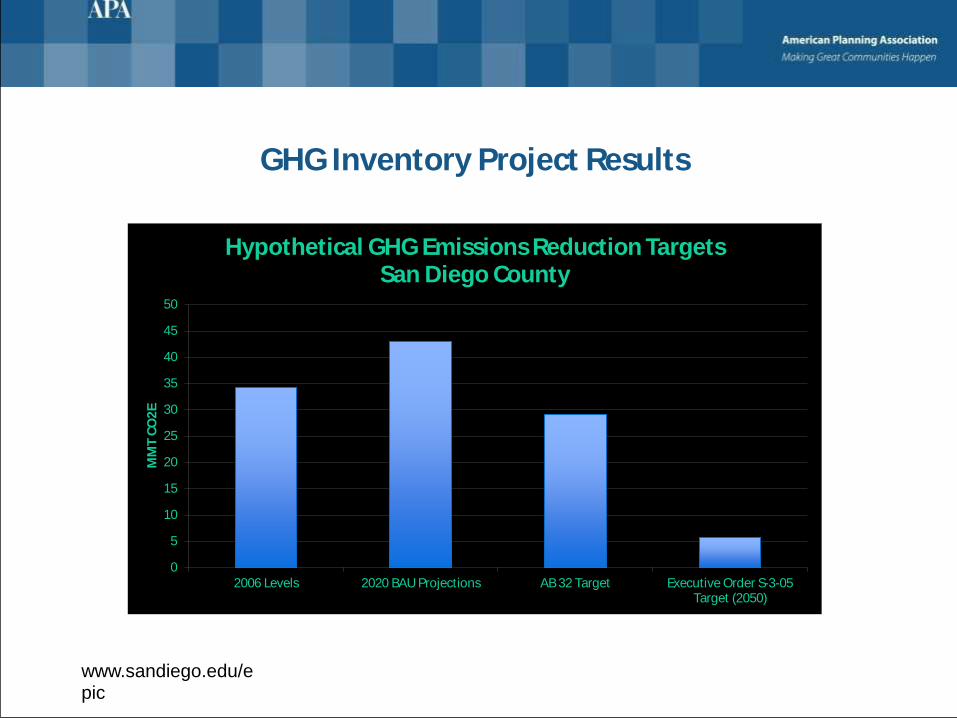
GHG Inventory Project Results
www.sandiego.edu/epic
0
5
10
15
20
25
30
35
40
45
50
2006 Levels 2020 BAU Projections AB 32 Target Executive Order S-3-05Target (2050)
MM
T C
O2
E
Hypothetical GHG Emissions Reduction Targets San Diego County
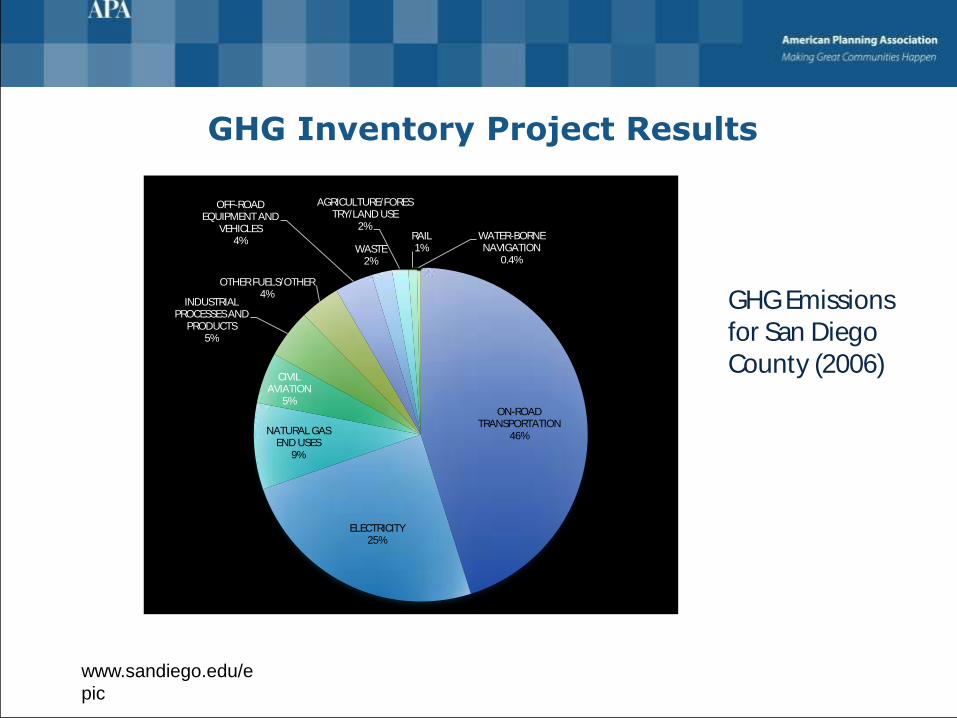
ON-ROAD TRANSPORTATION
46%
ELECTRICITY 25%
NATURAL GAS END USES
9%
CIVIL AVIATION
5%
INDUSTRIAL PROCESSES AND
PRODUCTS 5%
OTHER FUELS/OTHER 4%
OFF-ROAD EQUIPMENT AND
VEHICLES 4%
WASTE 2%
AGRICULTURE/FORESTRY/LAND USE
2% RAIL 1%
WATER-BORNE NAVIGATION
0.4%
GHG Inventory Project Results
www.sandiego.edu/e
pic
GHG Emissions for San Diego County (2006)


Smart Growth Concept Map
13
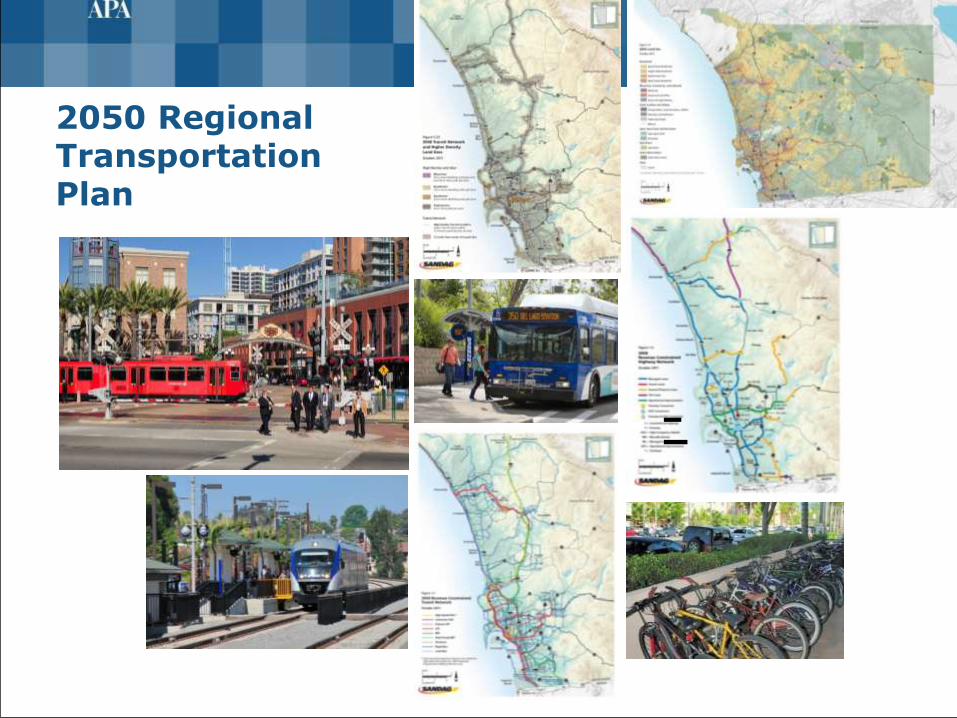
2050 Regional Transportation Plan

Smart Growth Tools for Local Jurisdictions
Smart Growth Incentive Program and Environmental Mitigation Program
Visual Simulations
Resources
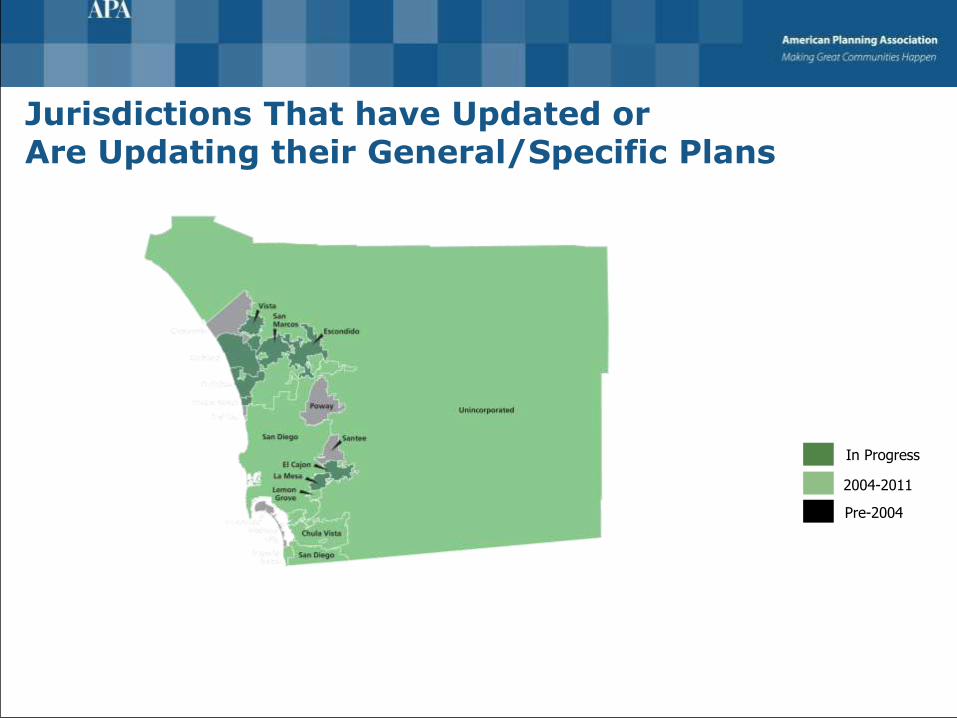
Jurisdictions That have Updated or Are Updating their General/Specific Plans
Pre-2004
2004-2011
In Progress
A City of Villages

Prime Industrial
Lands

Village Propensity Map

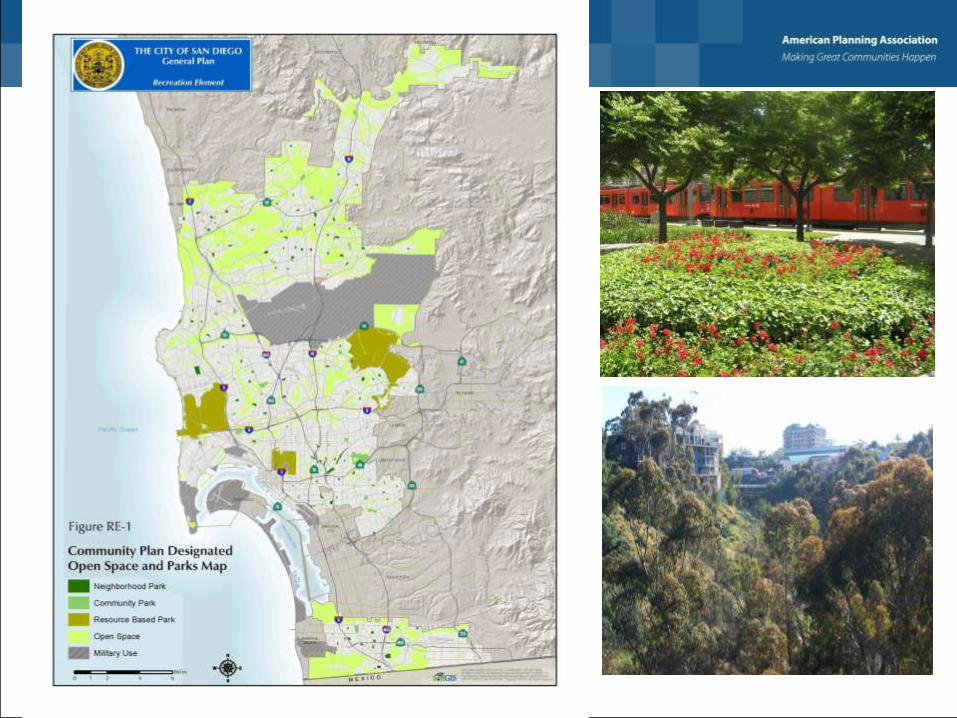
Conservation Element
Climate Change
Reduce carbon footprint,
mitigate impacts, and adapt to changes
Address sustainable building and practices that reduce global climate change
Encourage clean tech industries to benefit San Diego’s environment and economy

Climate Change Addressed Throughout the General Plan

Community Plans
Sign montage
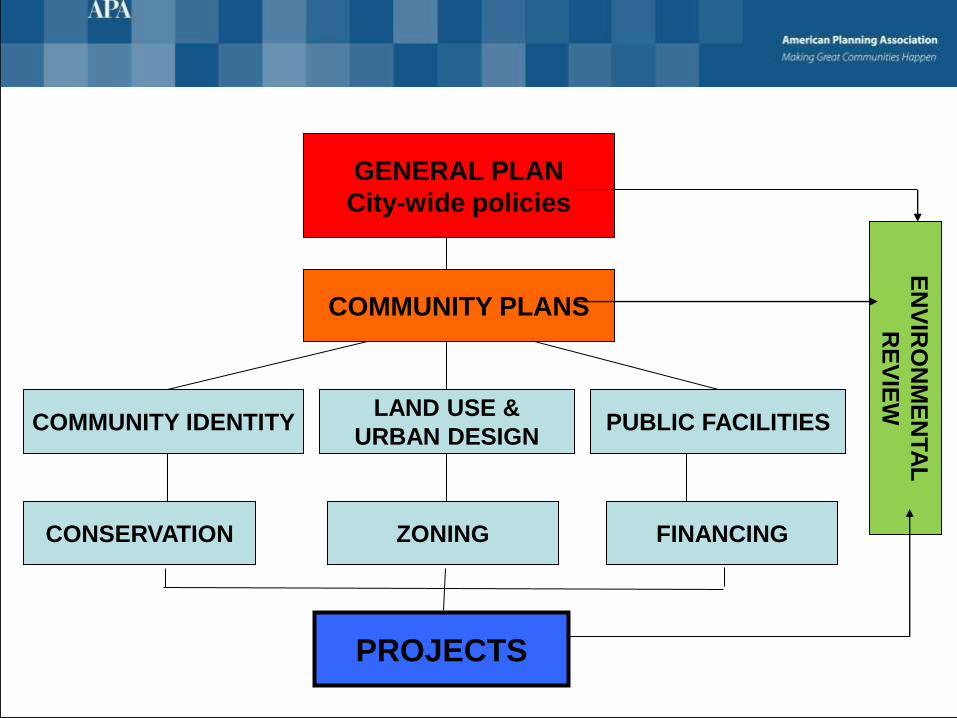
COMMUNITY IDENTITY
CONSERVATION
GENERAL PLAN
City-wide policies
COMMUNITY PLANS
LAND USE &
URBAN DESIGN PUBLIC FACILITIES
ZONING FINANCING
PROJECTS
EN
VIR
ON
ME
NTA
L
RE
VIE
W
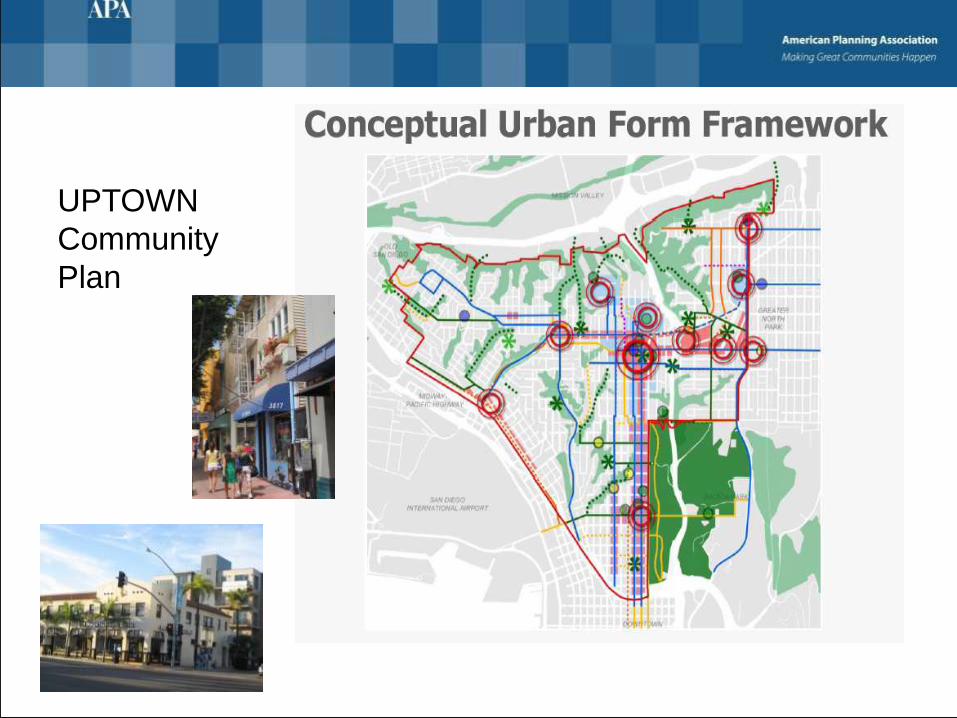
UPTOWN
Community
Plan

The Uptown District Master Plan

The Uptown District
• 318 Residential Units (townhomes, flats, and artist’s
lofts ranging from 652 to 1,249 square feet)
• 145,000 square feet of Commercial and Retail space,
one of Southern California’s most successful Ralph’s
grocery stores
• Neighborhood Community Center and Public Green
A 14-acre mixed-use redevelopment
project initiated by the City of San
Diego Planning Department in 1986.
Thank you.

National APA Conference, Los Angeles, April 15, 2012
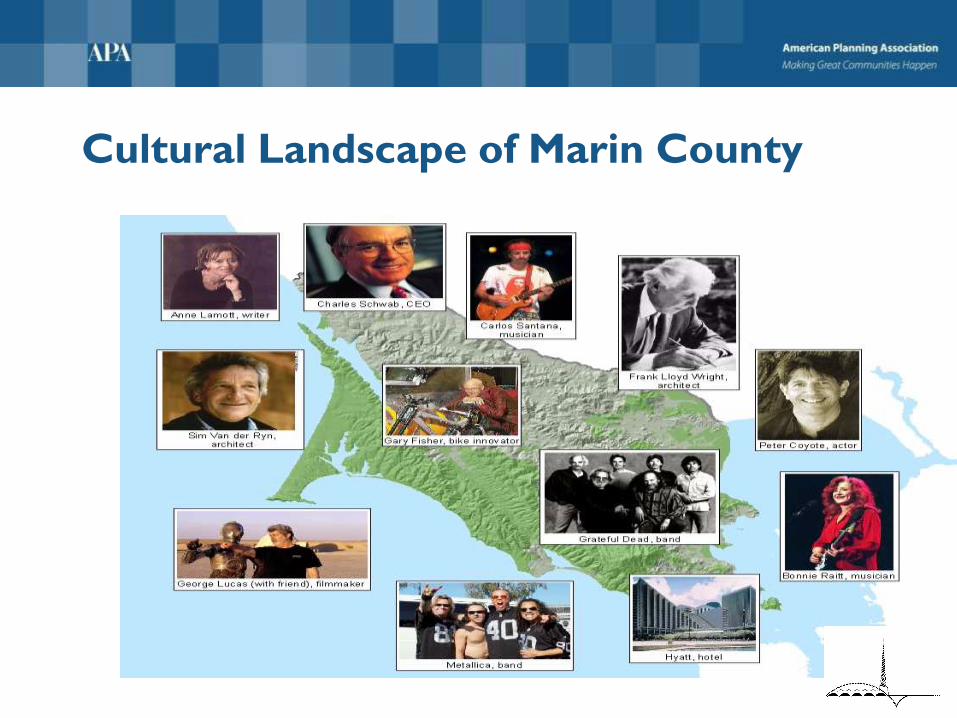
Cultural Landscape of Marin County

“Planning is best done in advance” - Anonymous
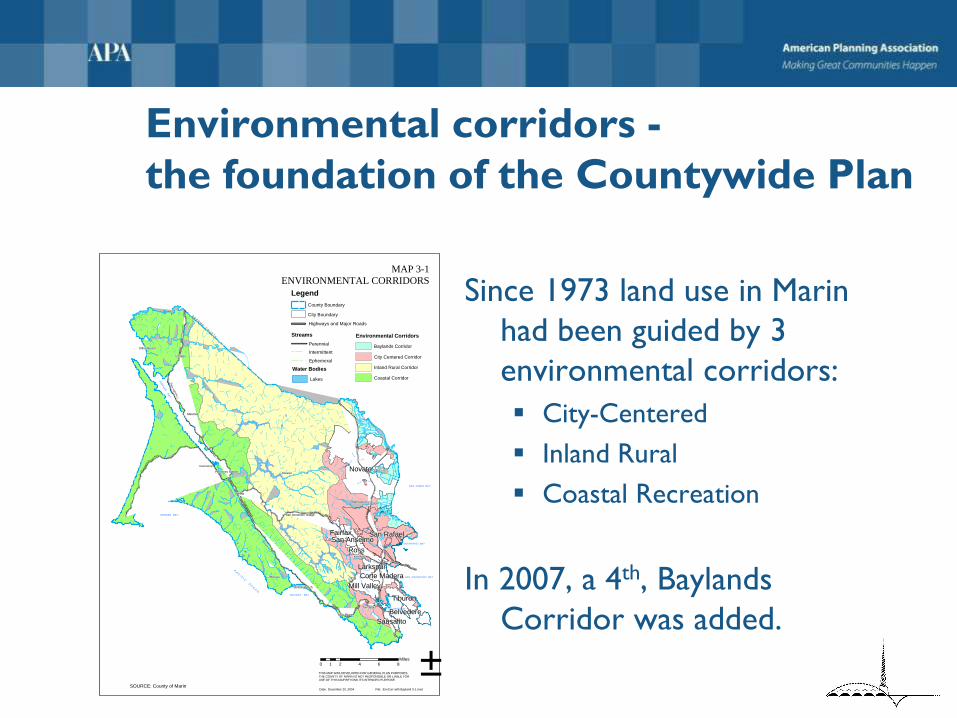
Environmental corridors -
the foundation of the Countywide Plan
Since 1973 land use in Marin
had been guided by 3
environmental corridors:
City-Centered
Inland Rural
Coastal Recreation
In 2007, a 4th, Baylands
Corridor was added.
Pin
e Gulc
h Cre ek
Ol em
a
Cre
ek
La
gunit as C
re e k
San Geroni mo C reek
Lagu
n itas Creek
Halleck Cre
ek
Arro yo
A
vichi
N
ovat o Cr eek
Arr oyo
San Jos e
Miller Creek
S
le epy
Ho
l
l ow
Creek
Gall inas Creek
San Rafael C
k
Fai rfax Creek
San A nselm o
Cre
ek
Corte Madera Ck
Ro
ss C
r eek
Larks p u
r C
reek
A
rr oyo Corte M
ader a d
el PresidioRedw
ood C reek
Coy
ote Cr e ek
Eskoot Creek
Petalu
ma River
Sa n Anton io Creek
Sal mon Cre ek
Ch
ileno Creek
Walker
Cre
ek
Ste m
ple C r eek
Est
ero d
e A
merican o
US
Hig
hw
ay 1
01S
tate
Hig
hw
ay 1
Sir Francis D rake Blv
d
I-580
Sir F
rancis
Dra ke
Blvd
Sta
te H
ighw
ay 1
TO
MA
LES
BA
Y
DRAKES BAY
SAN FRANCISCO BAY
SAN PABLO BAY
SAN RAFAEL BAY
BOLINAS BAY
RICHARDSON
BAY
P A C
I F I C O
C E
A N
S O N
O M
A C O
U N T Y
Novato
Tiburon
Sausalito
San Rafael
Olema
Bolinas
Nicasio
Tomales
Marshall
Marinwood
Inverness
Kentfield
Muir Beach
Dillon Beach
Stinson Beach
Pt. Reyes Station
Ross
Fairfax
Larkspur
Belvedere
Mill Valley
San Anselmo
Corte Madera
Tamalpais
San Geronimo Village
±0 2 4 6 81Miles
THIS MAP WAS DEVELOPED FOR GENERAL PLAN PURPOSES.THE COUNTY OF MARIN IS NOT RESPONSIBLE OR LIABLE FORUSE OF THIS MAP BEYOND ITS INTENDED PURPOSE.
MAP 3-1
ENVIRONMENTAL CORRIDORS
SOURCE: County of Marin
Water Bodies
Streams
Legend
Lakes
Perennial
Intermittent
County Boundary
City Boundary
Highways and Major Roads
Ephemeral
Date: December 20, 2004 File: EnvCorr with Bayland 3-1.mxd
Environmental Corridors
City Centered Corridor
Inland Rural Corridor
Coastal Corridor
Baylands Corridor

What’s Required in a General Plan?
According to California law, there are 7 mandatory elements: Land Use
Circulation
Housing
Conservation
Open Space
Noise
Safety

CWP Public Outreach and Community Participation:
Extensive public outreach and education (since 2000)
4 Working Groups (2001-02)
• Guiding Principles
• Natural Systems/Ag
• Built Environment
• Socioeconomics
+ San Quentin Reuse Committee
Plan was finally adopted in 2007
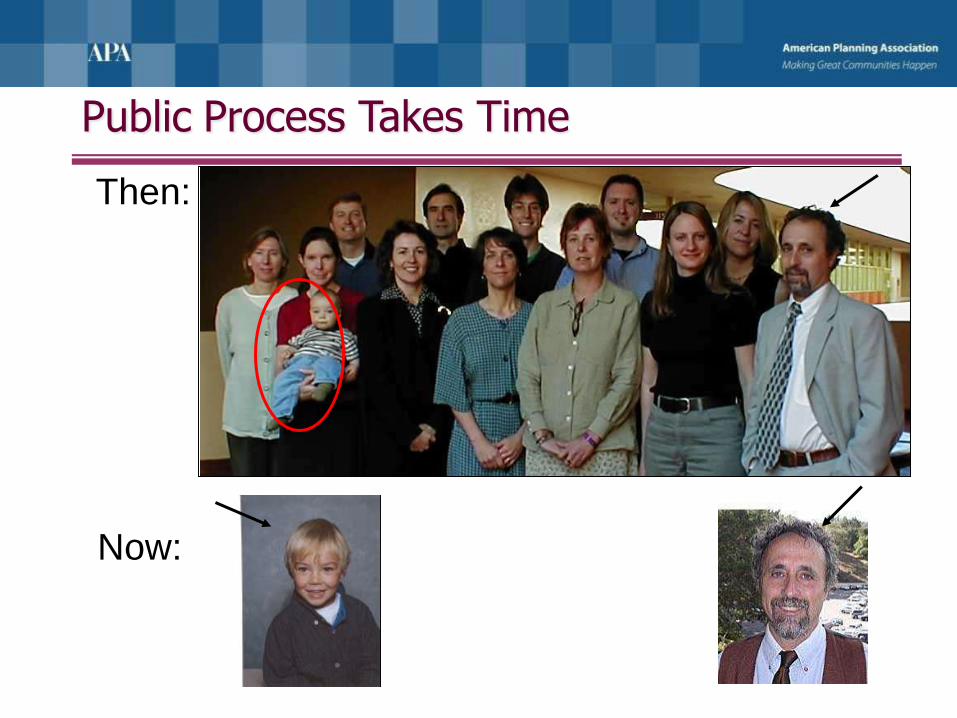
Public Process Takes Time
Then:
Now:

Marin Countywide Plan’s
Framework for Sustainability

Ecological Footprint Comparison
27.4
24.021.8
13.0
9.5
3.1 2.5
0.0
5.0
10.0
15.0
20.0
25.0
30.0
Marin
County
United
States
Canada France Italy Chile Mexico
Acr
es
per
Pe
rso
n

How Does Marin’s Footprint Compare to Other San
Francisco Bay Area Counties?
Number of earths that would be required to serve the footprint of
each S.F. Bay Area County:

Marin Countywide Plan
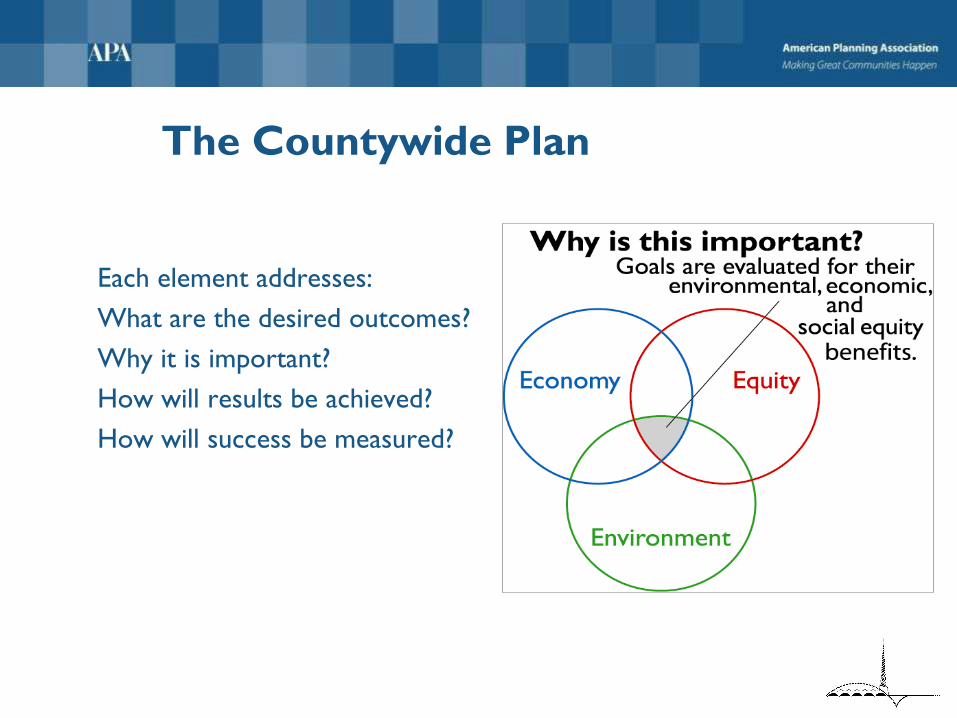
Each element addresses:
What are the desired outcomes?
Why it is important?
How will results be achieved?
How will success be measured?
The Countywide Plan

Indicators, Benchmarks & Targets
• Measuring Success
• Non-binding information tools
• Not required in general plans
• Feedback loops
• Opportunity to evaluate & reconsider strategies
Pin
e G
ulc
h C
reek
Ol em
a
C
re
ek
L
a
gu
nit as Cre
ek
San Geroni mo C reek
L
agu
n itas Creek
Halleck Cre
ek
Arro yo
Avic
hi
No
vat o
Cr eek
Arr o
yo San Jos e
Miller Creek
Sle e
py H
o
l
l ow
C
reek
Gall inas Creek
San Rafael Ck
Fai rfax Cree
k
San A nselm o
Cre
ek
Corte
Madera Ck
Ro
ss
C r e
ek
Larks p u
r
Creek
Arr oyo C
orte
Mad
era d
el Presid
ioRedw
ood C reek
Co
yote Cr e ek
Eskoot Cre
ek
Petalu
ma River
Sa n Anton io Creek
Sal mon Cre ek
Ch
ileno Creek
Walker
Cre
ek
Ste m
p
le C r eek
Est
ero d
e A
merican o
US
Hig
hw
ay 1
01S
tate
Hig
hw
ay 1
Sir Francis D rake Blv
d
I-580
Sir
Fra
ncis
Dra k
e B
lvd
Sta
te H
ighw
ay 1
TO
MA
LE
S B
AY
DRAKES BAY
SAN FRANCISCO BAY
SAN PABLO BAY
SAN RAFAEL BAY
BOLINAS BAY
RICHARDSON
BAY
P A C
I F I C O
C E
A N
S O
N O
M A
C O
U N
T Y
Novato
Tiburon
Sausalito
San Rafael
Olema
Bolinas
Nicasio
Tomales
Marshall
Marinwood
Inverness
Kentfield
Muir Beach
Dillon Beach
Stinson Beach
Pt. Reyes Station
Ross
Fairfax
Larkspur
Belvedere
Mill Valley
San Anselmo
Corte Madera
Tamalpais
San Geronimo Village
±0 2 4 6 81Miles
THIS MAP WAS DEVELOPED FOR GENERAL PLAN PURPOSES.THE COUNTY OF MARIN IS NOT RESPONSIBLE OR LIABLE FORUSE OF THIS MAP BEYOND ITS INTENDED PURPOSE.
MAP 3-1
ENVIRONMENTAL CORRIDORS
SOURCE: County of Marin
Water Bodies
Streams
Legend
Lakes
Perennial
Intermittent
County Boundary
City Boundary
Highways and Major Roads
Ephemeral
Date: December 20, 2004 File: EnvCorr with Bayland 3-1.mxd
Environmental Corridors
City Centered Corridor
Inland Rural Corridor
Coastal Corridor
Baylands Corridor
14

Natural Systems & Agriculture
Biological resources
Water resources
Environmental Hazards
Atmosphere and climate
Open space
Trails
Agriculture and food
Topics in the Natural Systems & Agriculture Element:

2005 Countywide GHG Emissions: Tons CO2e & Percent by Sector
Industrial
65,000
2%
Commercial
390,000
12%
Residential
596,000
19%
Transportat ion
1,983,000
62%
Waste
56,965
2%
Agricultural
97,000
4%
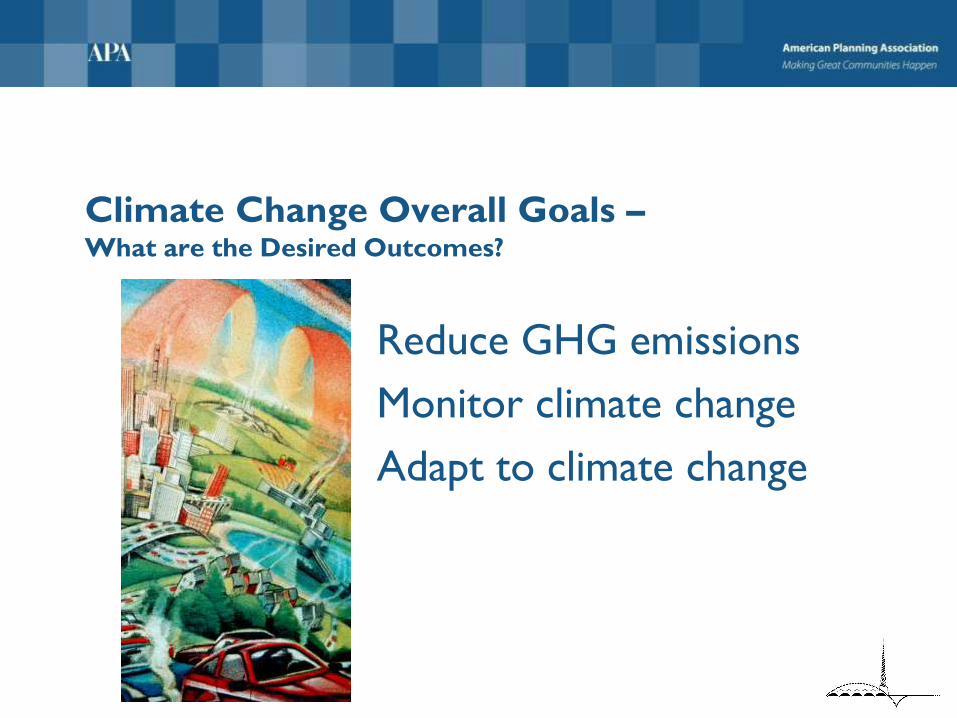
Climate Change Overall Goals – What are the Desired Outcomes?
Reduce GHG emissions
Monitor climate change
Adapt to climate change
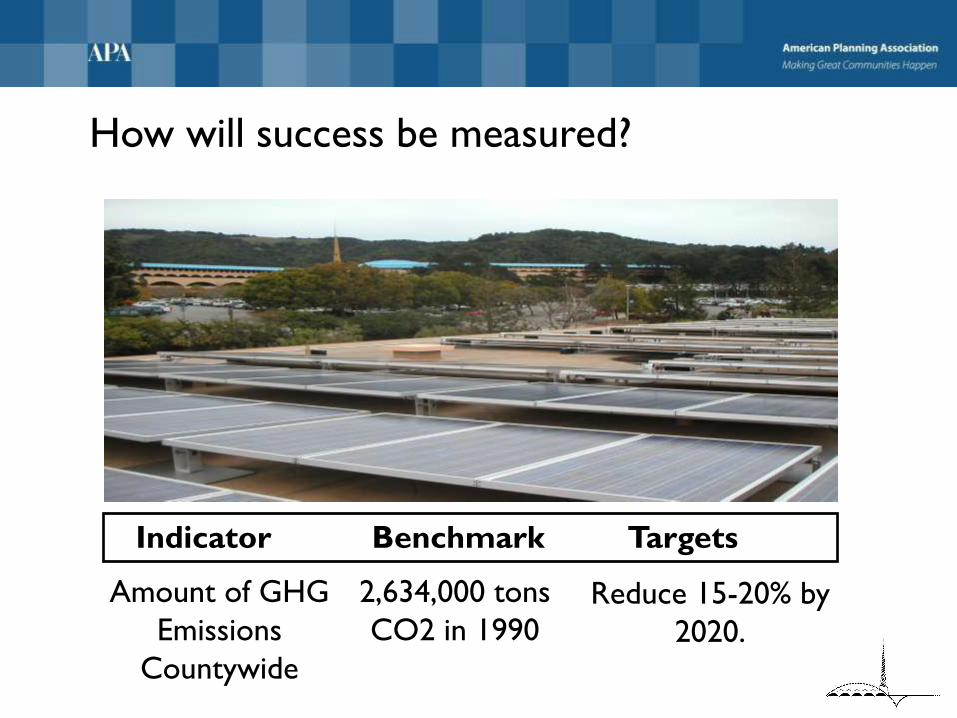
Indicator Benchmark Targets
Amount of GHG
Emissions
Countywide
Reduce 15-20% by
2020.
2,634,000 tons
CO2 in 1990
How will success be measured?

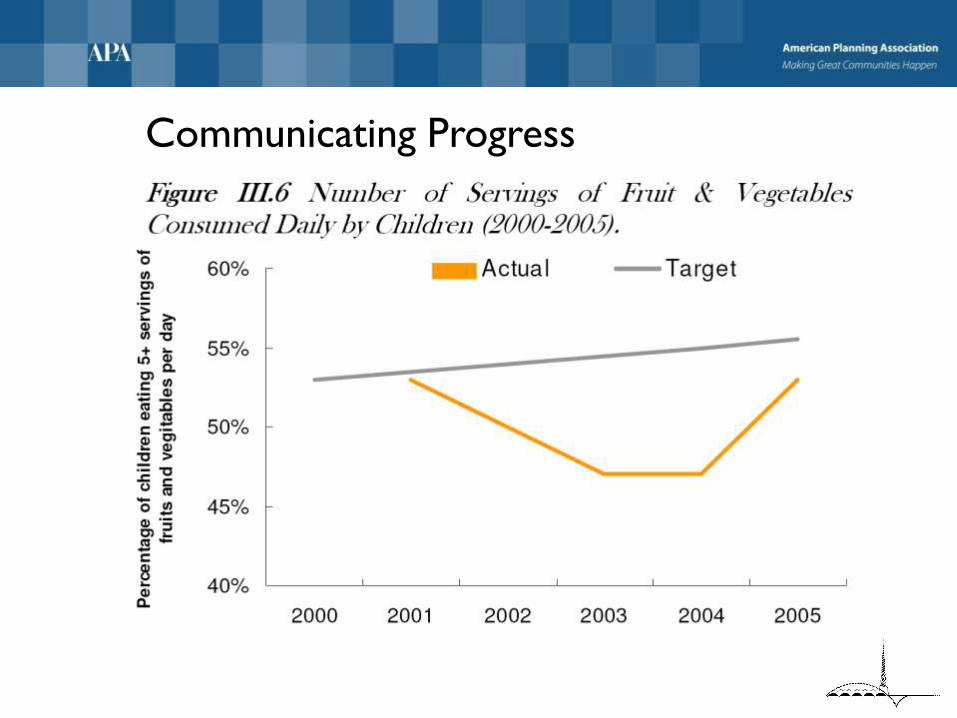
Communicating Progress
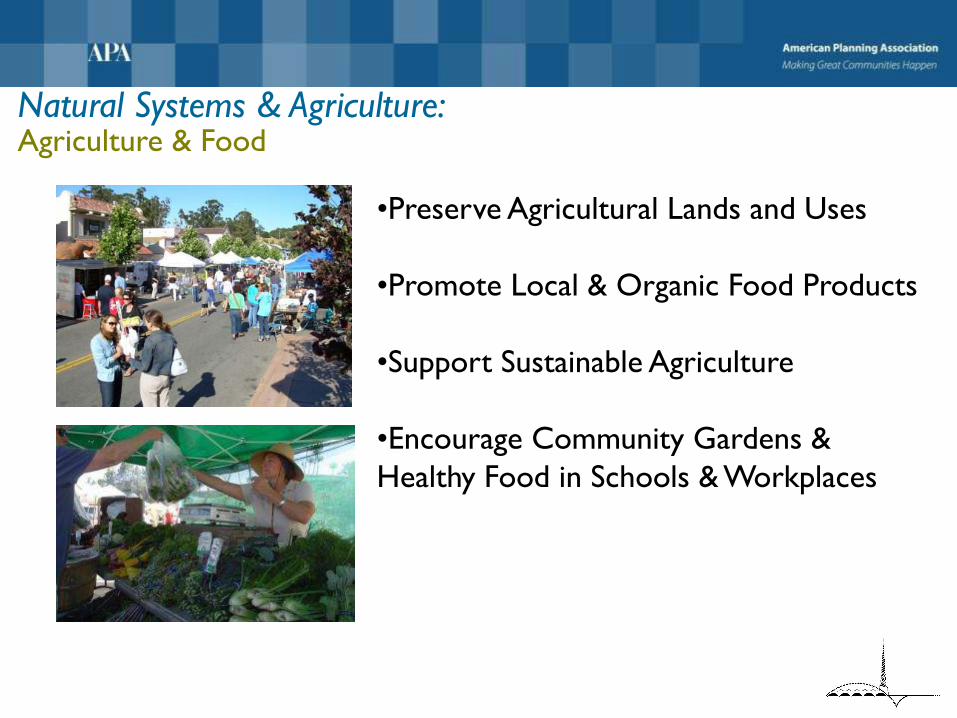
•Preserve Agricultural Lands and Uses
•Promote Local & Organic Food Products
•Support Sustainable Agriculture
•Encourage Community Gardens &
Healthy Food in Schools & Workplaces
Agriculture & Food Natural Systems & Agriculture:

Indicator Benchmark Targets
Acres of land
farmed
organically
Increase by 1,500%
by 2010 and
1,700% by 2015
357 acres in 2000
How will success be measured?
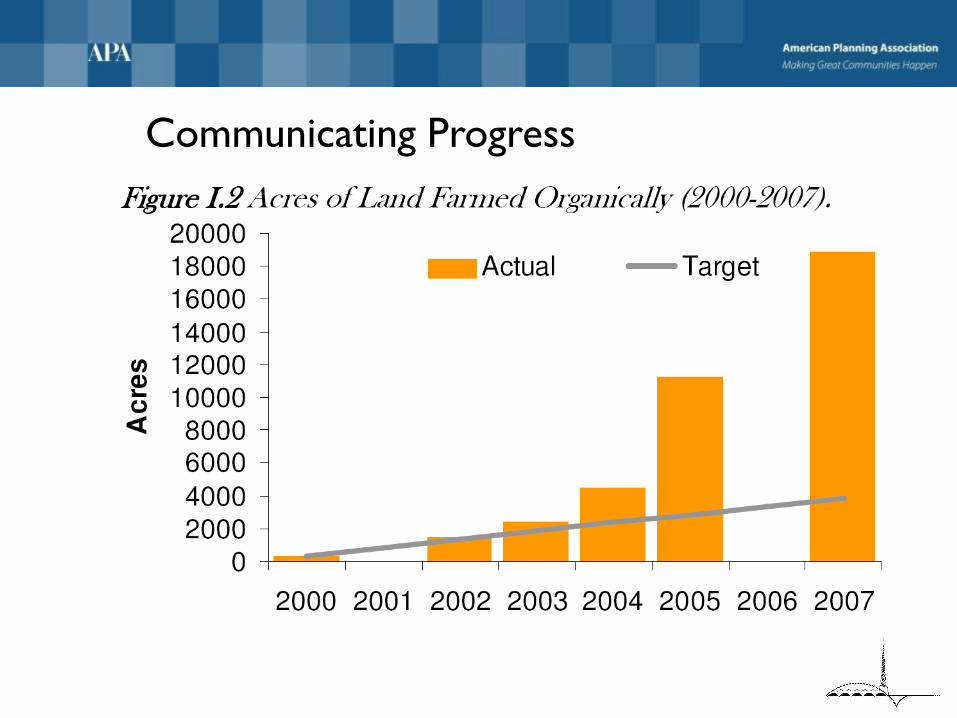
Communicating Progress
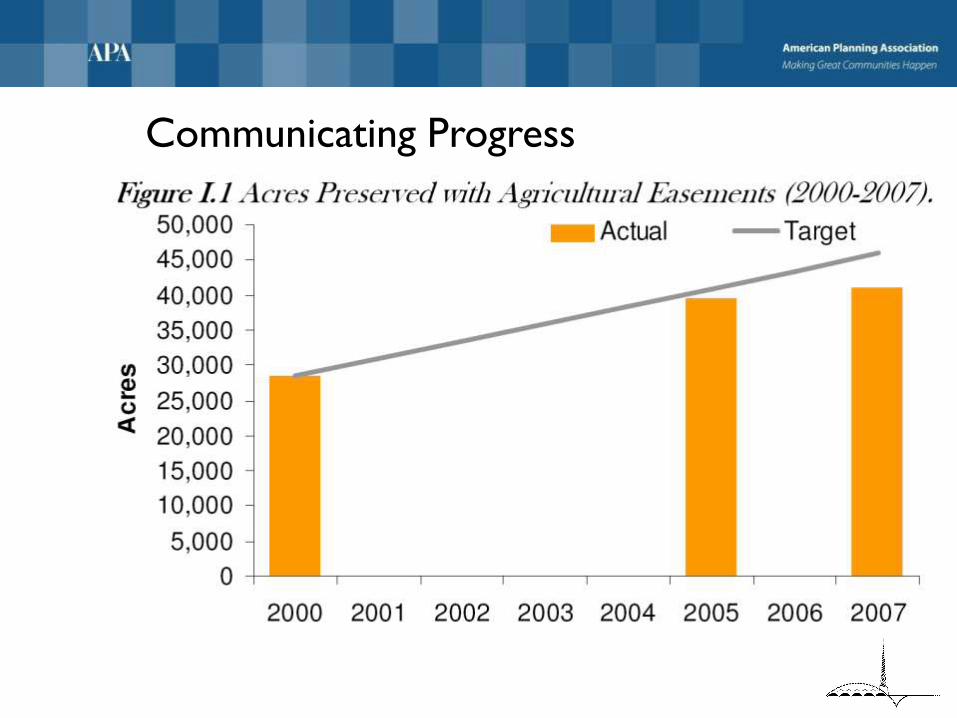
Communicating Progress
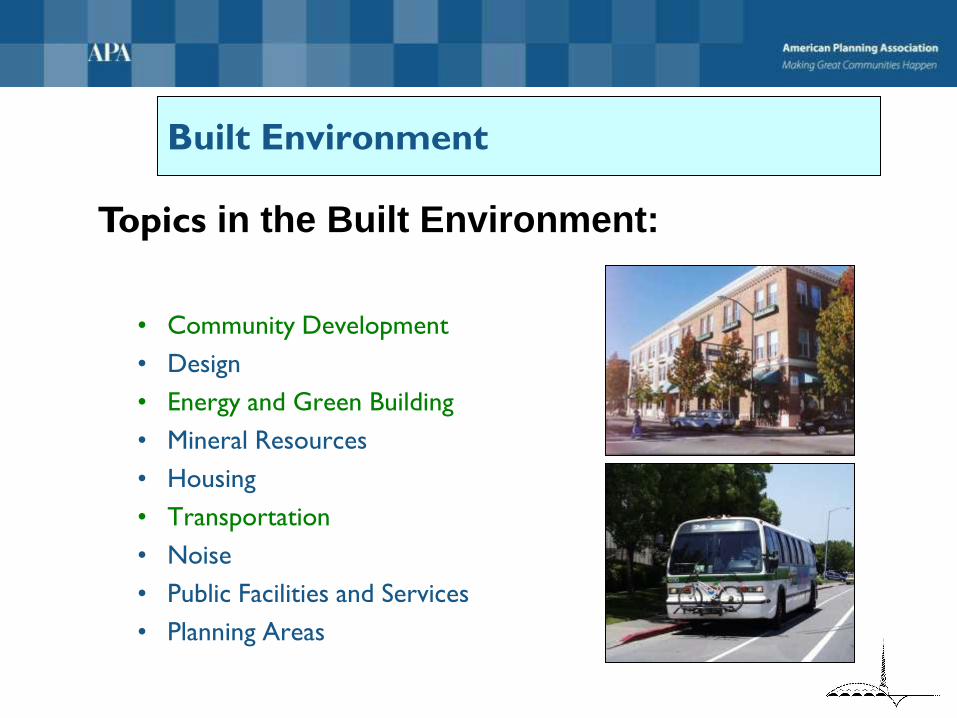
Built Environment
• Community Development
• Design
• Energy and Green Building
• Mineral Resources
• Housing
• Transportation
• Noise
• Public Facilities and Services
• Planning Areas
Topics in the Built Environment:

Greening our Built Environment
- Limit sprawl, restrict development in environmentally sensitive areas
- Require mixed-use in commercial areas
- Housing Overlay Designation – Focus affordable & workforce
housing near jobs, transit & services
- Require Green Building
- Retrofit existing buildings
- Pursue Community Choice Aggregation
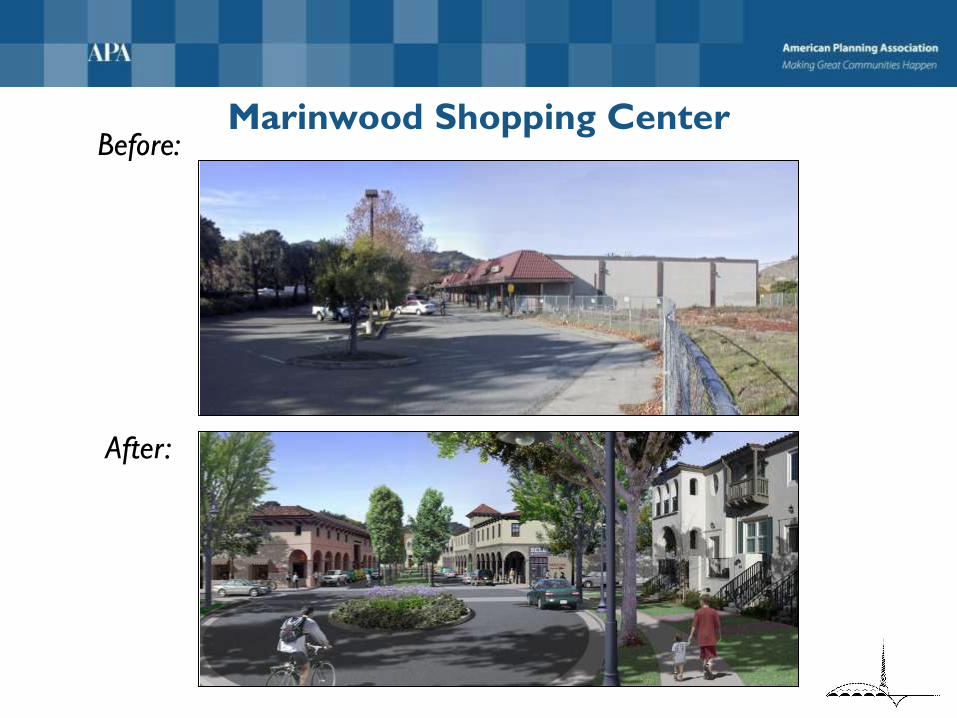
Marinwood Shopping Center Before:
After:
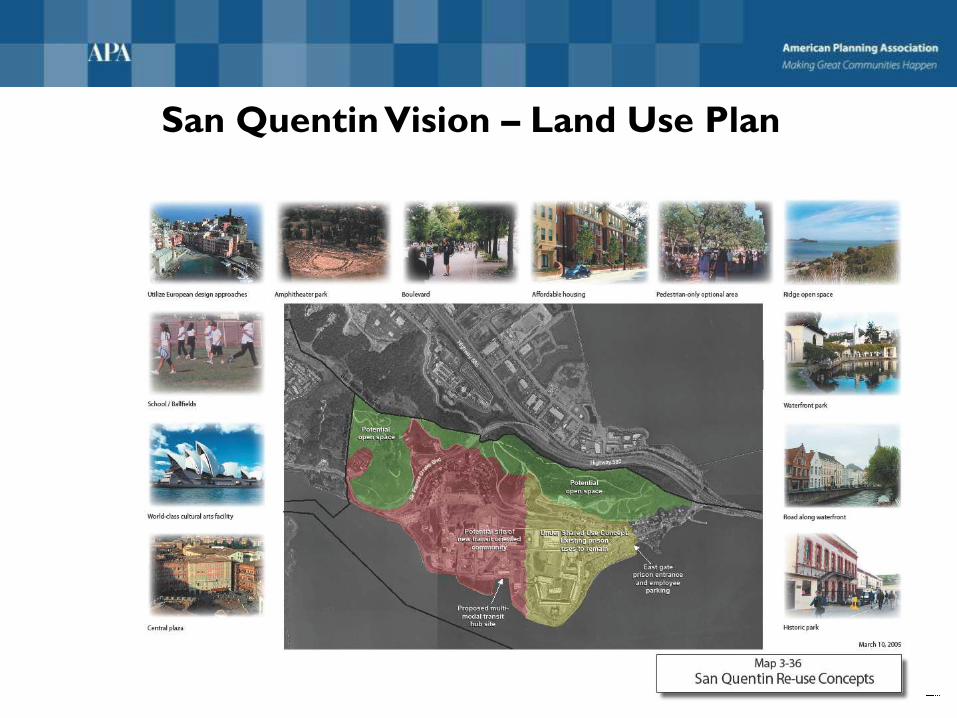
San Quentin Vision – Land Use Plan

How do we Green Transportation?

GREENING Transportation
- Prioritize funding for projects that reduce fossil-fuel use and single-
occupancy auto trips
- Provide incentives for public transit, bicycles, vanpools, carpools,
car sharing, walking
- Reduce parking requirements if located near transit or in trip
reduction programs

Communicating Progress
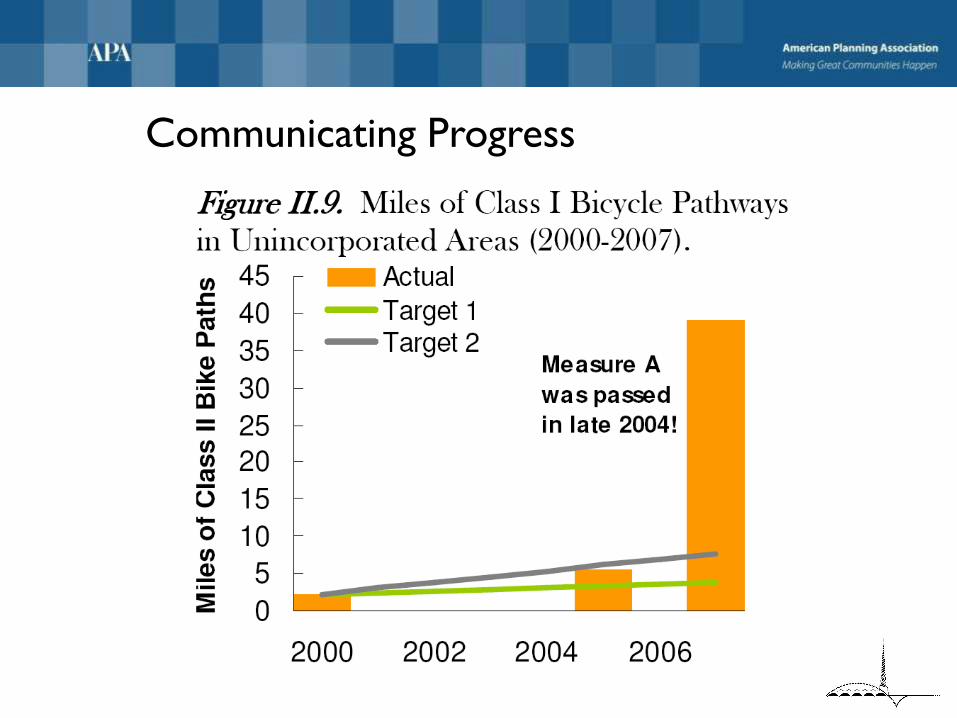
Communicating Progress

Socioeconomic
Topics in the Socioeconomic Element:
• Economy
• Childcare
• Public Safety
• Community Participation
• Diversity
• Education
• Environmental Justice
• Public Health
• Arts and Culture
• Historical and Archaeological Resources
• Parks and Recreation

Indicator Benchmark Targets
Number of
certified
“green”
businesses
Increase to
250 by 2010,
and 400 by
2015
0 in 2000
How will success be measured?

Communicating Progress

Public Health
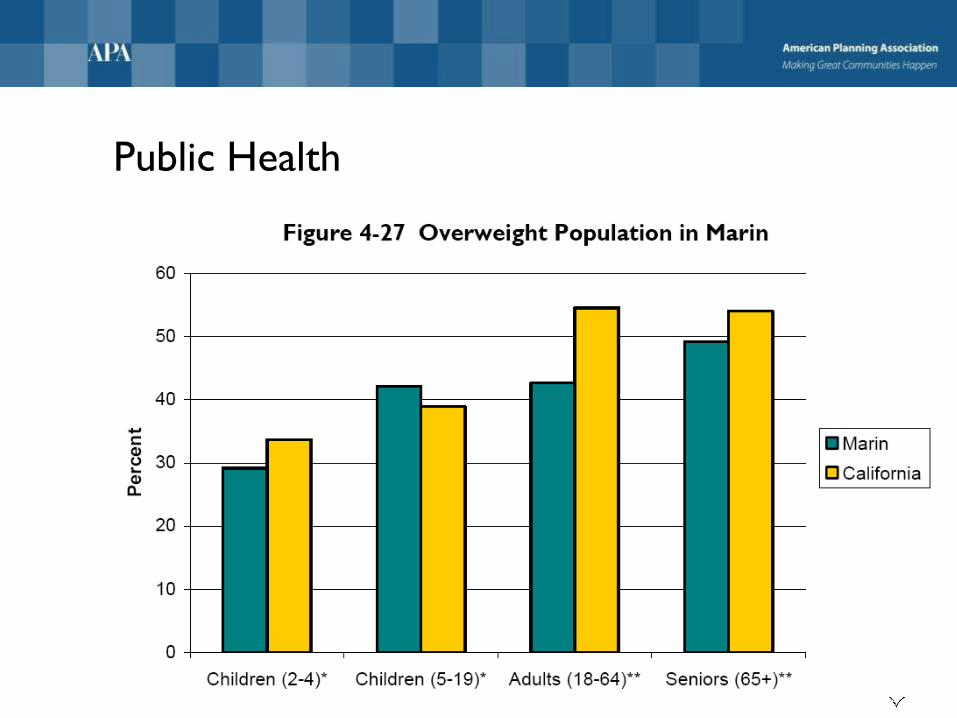
Public Health

What are the desired outcomes?
Goal: Reduced rates of Obesity, Eating Disorders, and Chronic Disease
Such as Heart Disease and Breast Cancer
How?
Promote Nutrition Education and Access to Healthy Foods
Promote Physical Activity
Promote Healthy Environments
Develop Disease Prevention and Management Programs

Indicator Benchmark Targets
Percent of
population
overweight &
obese.
10% decrease in obesity by
2015. Children: physical
activity up 10%, eating 5
servings of fruit & veggies
per day, up by 10%
34% children over
weight/obese in 2001;
60% exercised at least
20 minutes at least 3
days per week in 2002
How will success be measured?
Communicating Progress

See-it Viewer: allows the public to follow
progress of key indicators

From Planning to More Implementation

Marin Indicators Report

Indicator Trends
Clear Progress
Moderate
Performance Improvement Area
1. Agriculture 1. Education 1. Housing
2. Arts & Culture 2. Transportation 2. Child Care
3. Biological Resources 3. Climate Change
4. Energy & Green Building 4. Economy
5. Food
6. Open Space
7. Public Facilities & Services
8. Public Health
9. Public Safety

• Local government JPA purchases power
• Buy or own power
• Local government advantages
• JPA created – 2008-09
• Customers are “in” unless they “opt-out”
• PG&E continues to deliver electricity & serve
customers
What is Marin Clean Energy? Renewable Energy:
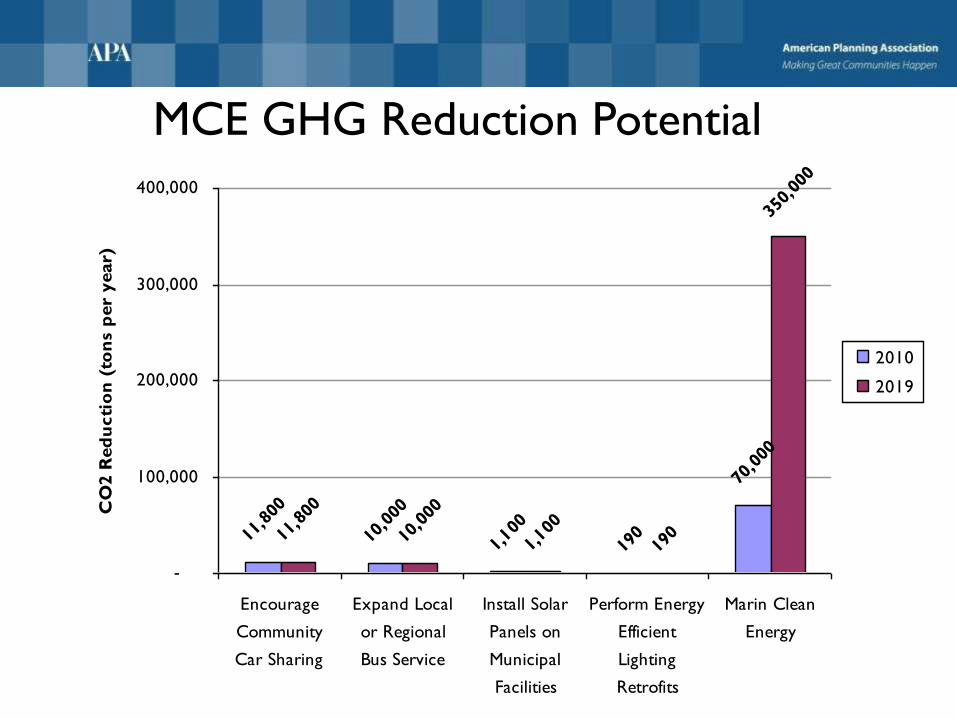
11,
800
10,
000
1,1
00
190
70,
000
11,
800
10,
000
1,1
00
190
350
,000
-
100,000
200,000
300,000
400,000
Encourage
Community
Car Sharing
Expand Local
or Regional
Bus Service
Install Solar
Panels on
Municipal
Facilities
Perform Energy
Efficient
Lighting
Retrofits
Marin Clean
Energy
CO
2 R
ed
ucti
on
(to
ns
per
year)
2010
2019
MCE GHG Reduction Potential

Energy Options - Light Green or Deep Green
Light Green
Initially 25% renewable, increasing to
50% within 5 years
Competitive Costs
78% Fossil Free
47
Deep Green
100% renewable
$0.01 premium for kilowatt-hour

Renewables Portfolio Standard
Projected Procurement – 2010
0%
5%
10%
15%
20%
25%
30%
MEA PG&E SCE SDG&E SPPC PacCorp
California RPS Mandate – 20%
48

- Marin County Community Dev.
Agency
- Global Footprint Network
-Bay Conservation & Development Commission
- Climate Protection Campaign
- Real Living Solutions
- Marin Clean Energy
Special thanks to:
Deep Green
100% renewable
$0.01 premium for kilowatt-hour

Contact Information: Alex Hinds, Co-founder Center for Sustainable Communities, Dept of Environmental Studies and Planning Sonoma State University, Rohnert Park, CA [email protected]