principles of monitoring port performance
TRANSCRIPT

PRINCIPLES OF MONITORING PORT PERFORMANCE CAP-HAITIEN PORT REGULATORY STRENGTHENING PROJECT
February 2018

PRINCIPLES OF MONITORING PORT PERFORMANCE
Activity Title: Cap-Haïtien Port Regulatory Strengthening Project Sponsoring USAID Office: Office of Infrastructure Contract Number: AID-521-C-16-00003 Contractor: Nathan Associates Inc.
Disclaimer
This document is made possible through the support of the American people through the U.S. Agency for International Development (USAID). The contents of this document are the sole responsibility of the author or authors and do not necessarily reflect the views of USAID or the United States government.

CONTENTS
ACRONYMS 1
INTRODUCTION 2
EVOLUTION OF PORT INDICATORS 5
Growing Interest in Monitoring Port Performance 6
Port Performance Measurement for Benchmarking Against Other Ports 7
Port Authority Administration Indicators 14
Where We Go From Here 17
CONCEPTS AND BEST PRACTICES 19
Assessing Performance 23
Time Accounting System 26
Regulation by Contract 32
Vessel and Gate Operations Reports 34
HAITIAN CONTEXT 38
Current Situation at Cap Haitien Port 38
Examples from Other Haitian Ports 40
Assessment of Proposed Performance monitoring at CHP 43
CONCLUSIONS AND RECOMMENDATIONS 48
Specific Requirements for Monitoring Port Performance at Cap Haitien Port 48
Access to the Major Operations Reports Generated by the TOS 49
Proposed Extended List of Performance Indicators to be Generated by the TOS 49
Defining Adequate Target Values Indicators 52
Calculating Performance Indicators 52
Interim Period 53
Non-Containerized Cargo 53

P R I N C I P L E S O F P O R T P E R F O R M A N C E M O N I T O R I N G | 2
Measuring Port Authority Performance 53
USER MANUAL 55
APN Access to TOS 55
Illustative Examples of Calculating Performance Indicators 55
Fulfilling Regulatory Functions: Monitoring, Enforcement and Taking Corrective Actions 64
ILLUSTRATIONS
Figures Figure 1. Port Logistics Chain 3 Figure 2. Deming's (Plan, Do, Check, Act) Wheel of Continuous Quality Management 6 Figure 3. Comparative Regional Berth Productivity Levels by Vessel Size 10 Figure 4. Basic Marine Terminal Stock and Flow 20 Figure 5. Time Accounting System for Port Operations 28 Figure 6. Ship (Vessel) Operation Report 35 Figure 7. Gate Operation Report 36 Figure 8. Ship (Vessel) Operation Report 37 Figure 9. Example of CPS' Crane Productivity 41 Figure 10. Vessel Operation Report 58 Figure 11. Crane Operation Report 59 Figure 12. Gate Operation Report 61 Figure 13. Yard Operation Report 63
Tables Table 1. DEA Scores of 20 Italian Ports 11 Table 2. Regulatory Indicators for Operational Efficiency and Level fo Service 12 Table 3. UNCTAD Port Authority Scorecard Indicators 16 Table 4. European Sea Ports Organization Port Indicators 17 Table 5. Example of Contractual Performance Indicators 33 Table 6. Proposed Performance Indicators in Draft PPP Contract 44 Table 7. Berth Performance Indicators 50 Table 8. Suggested Port Authority Indicators 54 Table 9. Data Items and Performance Indicators 56

ACRONYMS
APN Autorité Portuaire Nationale
APEC Asia-Pacific Economic Cooperation Forum
CHP Cap Haïtien Port
CSR Corporate Social Responsibility
CY Container Yard
DEA Data Envelopment Analysis
FA Factor Analysis
FTE Full Time Equivalent (for employee status)
HA Hectares
HHI Herfindahl-Hirschman Index
JOC Journal of Commerce
LOA Length overall (of a ship)
LOS Level of Service
MHC Mobile Harbor Crane
Mty Empty (containers)
PAP Port a Prince
PCA Principal Components Analysis
PI Performance Indicators
PPP Public-Private Partnership
PPRISM Port Performance Indicators: Selection and Measurement
USAID U.S. Agency for International Development
S&F Stock & flow
TEU Twenty foot equivalent units
TOS Terminal Operation System
UNCTAD United Nations Conference on Trade and Development

INTRODUCTION
The Autorité Portuaire Nationale of Haiti (APN) in the near future for the first time will engage a private sector operator for a container terminal. The terminal will be built in the Port of Cap Haitien (CHP), a relatively small port that also handles bulk and breakbulk cargoes. As the terminal operator will hold a monopoly position for the foreseeable future and hence will not be subjected to competitive influences, the government of Haiti will impose minimum performance standards within the concession contract to ensure a reasonable level of service and productivity in the terminal. While APN will impose these standards, APN is also interested in monitoring other dimensions of operations not under the terminal operator’s control or not necessarily addressed within the contract’s performance provisions. Such monitoring can be used for benchmarking against prior years’ performance or against rival or best practice operators in other ports, or for planning purposes to prepare for capacity expansion. As many relevant performance indicators, or the data for their calculation, are generated through an operator’s terminal operating system (TOS), it is expected that there will be a provision in the concession contract that requires the operator to provide the needed data to APN. And APN may have audit authority to validate the data the terminal operator provides.
Indicators are generally derived from the various activities that occur between the port’s entrance buoy and the port (or terminal) gate, constituting the port logistics chain. Figure 1 is a graphic representation of the port logistics chain. It identifies a range of basic services and who is charged for these services – generally, the shipper (the importer and exporter) and carrier (or ship’s agent). The graphic shows the sequence of 11 general activities in the port container terminal and the descriptions of each of these activities. Terminal operators usually employ TOSs to ensure equipment readiness to carry a container and real time tracking of each container’s position in the terminal and stage of customs processing. In this way, containers and equipment are optimally staged, reducing idle time of both equipment and containers. Data are collected through the TOS that can be used by the port authority or regulatory body for monitoring terminal operator performance and adherence to tariff and performance standards in concession agreements. Normally, operational performance indicators are tied to the activities that occur within the port logistics chain.

P R I N C I P L E S O F P O R T P E R F O R M A N C E M O N I T O R I N G | 3
Figure 1. The Port Logistics Chain1
While port authorities have an interest in understanding the performance of their terminals, it is in their interest to ensure they perform their port administration responsibilities effectively. Effective resource allocation is the rallying cry for modernized port authorities and stakeholders
1 Based on Kent, Paul E. and Alan Fox, “Is Puerto Limon a Real Lemon? The Impact of Port Inefficiency on a National Economy”, in The International Handbook of Maritime Economics, edited by Kevin Cullinane, 2011.
1) A vessel pilot boards the vessel and guides the vessel’s captain through the port’s entrance channel. If no berth is available, the vessel is assigned to an anchorage area. Tugs then help maneuver the vessel to the berth. Line handlers then tie two lines to the berth. At this point, the ship has incurred charges for navigation or port dues (to cover the cost of dredging the channel and providing lights and buoys for navigation safety), pilotage, tug assist, and line handling.
2) Once the vessel is secured to the berth, the port authority or terminal operator may apply a berthage charge, essentially a “parking” fee usually calculated on the basis of time and vessel size (length). The berthage charge stops when the last line is untied from the ship as it leaves the berth. The charge is applied to the vessel. In some cases, line handling may be incorporated into the berthage charge.
3) Inspection authorities (e.g. defense security, drug enforcement, immigration) may board the ship. Usually cargo is not loaded or unloaded until the authorities have completed their inspections.
4) Longshoremen load or unload cargo using a crane. Containers are “lashed” (secured to the crane) and moved from the ship to the “apron,” the area at the berth set aside for loading and unloading. If a terminal operator’s crane is used, then a charge for crane use is applied to the ship.
5) The port authority may impose a “wharfage” charge, which is intended to cover the use of the apron and other areas of the terminal where the container is moved to or from storage. Wharfage is charged to the shipper (i.e., importer or exporter).
6) The container seal is inspected and a fee may apply, in which it is charged to the shipper. 7) The container is moved to or from an assigned slot in the “yard”. Container storage operations occur in
the yard. This area as a whole constitutes “dispatch,” where the container is moved to or from an assigned slot (a space in the yard). Dispatch fees are charged to the shipper. Some ports, particularly smaller ones, may not have a true storage area, but instead have a small area that serves as a buffer between the berth operation and the area behind the berth. In such cases, trucks quickly evacuate containers from the buffer storage area or the container may be loaded onto a truck directly from the vessel for immediate evacuation to an off-dock storage area, sometimes referred to as a satellite storage area. Haiti’s Cap Haitien and the Aleman container terminal in Puerto Limón, Costa Rica have very limited or no buffer storage capacity and hence require prompt evacuation of containers.
8) The container is stored until it is inspected and claimed by the importer. In some ports, off-dock storage areas exist but their relevance decreases as the port increases capacity.
9) The container is inspected by customs and moved onto a truck chassis. 10) Some ports may employ container scanners and a charge for scanning usually applies to the shipper. 11) Gate processing includes weighing the container and reviewing paperwork. Charges for weighing the
container apply to the shipper.

P R I N C I P L E S O F P O R T P E R F O R M A N C E M O N I T O R I N G | 4
Authorities are keenly aware of the consequences on them of administrative and cost burdens reflected in port authority charges and regulations; stakeholders also demand that resources are properly allocated to ensure effective stewardship of public access infrastructure. Additionally, some port authorities, even if reflecting the landlord model, also provide services to port users, the performance of which the port authority should monitor. In Cap Haitien, for example, both pilotage and tug assist are provided by the port authority. Vessel waiting time for either of these services can have a significant cost consequence to the vessel operator using the port.
For container terminal operations, performance indicators are generally universal. This means that the indicators that are germane to the CHP terminal will also be relevant to terminals that APN may concession in future years. So while the focus of this report is on Cap Haitien, the operational indicators we recommend here can be readily applied to other terminals; in some cases, the indicators may also be relevant to non-containerized operations.
Chapter 2 of this report presents a general description of performance indicators and some of the methods used to calculate them. There is keen interest, particularly in the post-port reform era, in an ability to compare competitiveness of one port relative to others as well as to gauge the effectiveness of port administration. But as we explain, the popularity of some methods used, especially in the academic arenas, do not provide much guidance to port authorities and terminal operators as to the areas that they need to improve. We assert that the best method used is one that generates indicators that operators, port authorities, and regulators understand. This understanding cannot come from “scores” that are not tied to carrier or terminal activity.
Chapter 3 presents a foundation from which port indicators are generated. We briefly describe how a stock and flow model, derived from operations research concepts, illustrates the marine terminal’s main components and the flows between these components, representing both a set of productivity and utilization indicators relative to components and flows. We then describe how performance is assessed and how indicators are presented. Using a port time accounting system borrowed from the authors’ contribution to the World Bank’s Port Reform Toolkit, we describe the primary indicators derived from the port time accounting system relative to the terminal’s berth, yard, and gate areas, with particular attention to the indicators relevant to the performance standards in concession contracts.
Chapter 4 begins with a review of Haiti’s port operational environments. This includes the facilities in CHP, Port au Prince (PAP), Port Lafito, and Terminal Varruex and the operations reporting systems employed. We then review the indicators that are likely to be included in the CHP concession contract and the ability of these indicators to address the regulatory, administrative, and planning roles of the port authority.
Chapter 5 concludes the report with a set of recommendations for monitoring CHP performance and ensuring access to needed data. We then recommend a set of indicators related to berth, yard, and gate performance and the basis for their calculations. We also provide recommendations for indicators for APN to use given its landlord administration role. Chapter 6 provides instructions for data collection and indicator calculation related to the port performance indicator tool that accompanies this report.

P R I N C I P L E S O F P O R T P E R F O R M A N C E M O N I T O R I N G | 5
EVOLUTION OF PORT INDICATORS
There is an old management adage that declares “You cannot manage what you do not measure”. This suggests neither the port authority nor the terminal operator can expect to perform at a certain level unless it knows how it is doing and how its decisions may affect performance. From a landlord port authority perspective, this means how effective resources are being utilized to facilitate safe, secure, and efficient environments for port users while maintaining a competitive port system. From the terminal operator’s point of view, the chief concern is to provide efficient vessel and terminal handling services to customers at the lowest possible cost.
The need to “measure” for the sake of good management was popularized by the Deming Plan-Do-Check-Act wheel of continuous improvement in an organization.2 Deming, drawing on the 1920s work of statistician Walter Shewart, advocated for a continuous quality improvement process consisting of a sequence of four repetitive steps to improve organizational performance (Figure 1); as improvements are made, new standards for performance are set. This gave rise to Deming’s total quality management (TQM) concept in the 1980s, engendering keen interest among management executives to ensure their organizations perform well and compete better. This would eventually find its way to the public sector as well. Reinventing government, and the management concepts espoused by Deming and Osborne and Gaebler3, among others, would eventually find their way into the port privatization waves of the 1980s and 1990s.
2 Deming’s sequence of steps were defined as follows: Plan -- plan ahead for change and analyze and predict the results; Do -- execute the plan, taking small steps in controlled circumstances; Check: study the results; and Act: take action to standardize or improve the process. See Deming, W. Edwards, Out of the Crisis, Cambridge, Mass. : MIT Press, 2002.
3 See Osborne, David and Ted Gaebler, Reinventing Government – How the Entrepreneurial Spirit is Transforming the Public Sector, Addison-Wesley Publ. Co., 1992. Osborne and Gaebler believed at the time that the United States was undergoing an “American Perestroika”. Like the Soviet version, they believed governments wanted to introduce market forces into monopolistic government enterprises in an effort to reduce spending. The bureaucratic rigidities observed by management gurus Thomas Peters, W. Edwards Deming, and Peter Drucker in private companies were similar to the bureaucratic maladies of government agencies, while both private and public organization structures were bound by strict work rules and centralized command that tied to the Industrial Age. "Hierarchical, centralized bureaucracies designed in the 1930s or 1940s simply do not function well in the rapidly changing, information-rich,

P R I N C I P L E S O F P O R T P E R F O R M A N C E M O N I T O R I N G | 6
GROWING INTEREST IN MONITORING PORT PERFORMANCE As public enterprises, port authorities would appear on the radar screen of government reform efforts. These began in the United Kingdom in the 1980s and would spread to Asia and Latin America later in the 1980s and in the following decade. Port reformers justified privatization in part by the promise of improvements in port services as responsibility for providing them was transferred to the private sector. The performance lexicon of the private sector would find their way to government as reformers desired to show lower costs and improved services in the terminals that were now under private sector control. Additionally, though the early public-private partnership transaction experience showed reformers were generally able to avoid transfer of service responsibility to monopoly terminal operators, the scale of investment needed relative to cargo volumes was large; hence, most privatization transactions, while avoiding monopolies, still resulted in oligopolistic environments; the risk in anticompetitive behavior would emerge as a regulatory concern given the very limited number of operators that would vie for the market. So concerns about the competitive playing field while ensuring competitiveness would engender an interest in controlling tariffs and imposing minimum
knowledge-intensive society and economy of the 1990s," they wrote, thereby calling for a transformation consisting of flattening hierarchies, decentralizing decision-making, pursuing productivity-enhancing technologies, and stressing quality and customer satisfaction.
Source: Vietze, Johannes, Wikimedia Commons, June 17, 2013, available at: https://commons.wikimedia.org/wiki/File:PDCA_Process.png.
Figure 2. Deming’s (Plan, Do, Check, Act) Wheel of Continuous Quality Management

P R I N C I P L E S O F P O R T P E R F O R M A N C E M O N I T O R I N G | 7
operational standards, usually in the form of tariff and service level provisions incorporated in concession bid terms and concession contracts or imposed by regulators.
Regulatory bodies such as, for example, Peru’s OSITRAN (Supervisory Organization for Public Transport Infrastructure -- Organismo Supervisor de la Inversión en Infraestructura de Transporte Público ), which has the authority to set tariffs and impose service performance standards on terminal operators, would be organized to monitor performance and set tariffs, while many countries (including Peru) impose maximum tariff limits and minimal operational performance standards on concessionaires as part of their contracts. While aimed at ensuring minimal standards are met, port authorities may be assigned performance monitoring responsibility to ensure port users receive services that meet acceptable standards in countries where there are no port sector regulatory agencies. Additionally, performance monitoring allows port authorities to diagnose operational problems, define the risk of congestion, and to formulate strategies for mitigating them. For example, a container terminal operator’s berth occupancy approaching 75% may signal the need to expand the port’s physical capacity assuming the berth operation is efficient; the port authority can also collect and assess certain indicators to determine if the berth operation is not efficient. Finally, port authorities receiving complaints about service quality can further investigate if the complaint has merit given the monitored operational performance level.
Port authorities are also interested in determining the impact of policy changes and strategies on the competitiveness of their port system. When governments and port authorities formulate policies and strategies, they need to know whether they had their intended impact or unintended (deleterious) consequences. Performance indicators can be devised to reflect the impact of policy and other government interventions. For example, a change in customs procedures that allows expedient evacuation of an import container to an off-dock terminal can alleviate yard congestion, which if not alleviated hinders berth productivity, which would be reflected in a berth utilization indicator. In a congested environment, a change in government imposed policy for setting container yard storage fees or establishing free storage time can also encourage shippers to evacuate quickly their containers after the free storage period; the shippers’ reaction to the policy changes may be reflected in the average container dwell time indicator.
PORT PERFORMANCE MEASUREMENT FOR BENCHMARKING AGAINST OTHER PORTS Another dimension of port performance measurement is in relation to benchmarking against other rival or global standard ports. Port authorities are challenged to get data relevant to operational performance in other port jurisdictions as many data are held confidential by terminal operators. In some cases, port regulators will report certain indicators; the noted OSITRAN regulatory agency is particularly transparent about indicators it collects in relation to performance standards imposed on the two terminal operators in the Port of Callao.
Recognizing the difficult data challenge, many researchers and scholars have sought to devise other methods for developing scores that serve as proxies for overall port performance. One popular method is data envelopment analysis (DEA), a technique that generates scores and

P R I N C I P L E S O F P O R T P E R F O R M A N C E M O N I T O R I N G | 8
rankings (see Text Box 1).4 Roll and Hayuth5 were the first to apply DEA to the port sector. They designed an environment of 20 hypothetical ports using capital and labour as inputs (resources needed for producing outputs) and cargo throughput, service levels, number of ship calls, and customer satisfaction as outputs. They concluded that ports that can accommodate large vessels are more efficient than those that cannot. This conclusion is expected given more cranes can be deployed for larger vessels and the length of lateral crane movements is shorter, hence reducing the average crane cycle time per crane.
In evaluating the performance of Brazilian, Argentinean, and Uruguayan ports, Rios and Macada6 define number of cranes, number of berths, size of terminal area, number of employees, and number of equipment as inputs for measuring performance as represented by outputs, in this case, the number of TEUs handled and the average number of containers moved per ship-hour. They do not consider factors that may distinguish the performance of one port from another, such as domestic versus transhipment container handling, ship size, and the crane technology used, where all these factors can affect productivity. For example, transhipment handling normally has shorter distances between the berth and the container’s first point of rest or between the position of the container in the yard to the berth, as transhipment storage tends to be closer to the berth area than domestic container storage. Additionally, the larger the ship, the more cranes that can be deployed to the vessel. A higher number of gantry cranes reduces the length of lateral crane movements needed to serve the vessels, hence reducing the average crane cycle time per container. Crane technology itself will also have an effect on crane productivity. We can expect a gantry crane to have a productivity level of 25-30 moves per crane-hour, with some terminal operators reporting 40 or moves per crane hour. This compares favorably with mobile cranes and ship’s cranes, which have productivity levels of about 18 and 4-6 moves per crane hour, respectively. In short, berth productivity, which is the summation of crane productivity per vessel hour, will increase as vessel size increases (Figure 2). Hence, any study of port performance should not ignore differing factors that influence indicators of one port over another, particularly crane technology and vessel size.
4 The technique was developed by Charnes et al, who believed that the efficiency of a number of “producers” can be evaluated to derive comparative efficiency scores. The usual statistical approach to measuring efficiency is to evaluate producers relative to the average producer. But the DEA approach evaluates producers relative to the best producer. Thus, if Producer I generates A(I) units of production with B(I) inputs, then other producers should also be able to do the same if they work efficiently. If Producer II generates A(II) units of production with B(II) inputs, then other producers should be capable of producing at the same efficiency. Producers I, II, and others are then combined to form a composite producer with composite inputs and composite outputs. See Charnes, A., W. W. Cooper, and E. Rhodes, “Measuring the efficiency of decision making units”, European Journal of Operational Research, 1978, Volume 2, pp. 429-444.
5 Roll, Y. and Y. Hayuth, “Port performance comparison applying data envelopment analysis (DEA)”, Maritime Policy and Management, Volume 20, Number 2, 1993, pp. 153-161.
6 Rios, L. R., and A. C. Gastaud Macada, “Analyzing the relative efficiency of container terminals of Mercosur using DEA”, Maritime Economics & Logistics, Volume 8, Number 4, 2006, pp. 331-346, also available at: https://www.researchgate.net/publication/5223629_Analysing_the_Relative_Efficiency_of_Container_Terminals_of_Mercosur_using_DEA.

P R I N C I P L E S O F P O R T P E R F O R M A N C E M O N I T O R I N G | 9
We can demonstrate the use of DEA through the following example. Let’s
assume operators A, B, and C each have 100 container ships of the same size
calling their terminals. Operator A is good at loading/discharge productivity
(moves/ship-hour), Operator C has the lowest berth waiting time, and B falls
somewhere in between for berth waiting time and loading/discharge
productivity.
• Operator A: 100 ships, 40 moves/ship-hour, 20 hours berth waiting
time
• Operator B: 100 ships, 20 moves/ship-hour, 5 hours berth waiting time
• Operator C: 100 ships, 10 moves/ship-hour, 0 hours berth waiting
time
Now, as a DEA analyst, we are like home car builder mechanics who combine
parts from different units. Consider Operator A. Clearly no combination of
Operators B and C can produce 40 moves per ship/hour with the constraint of
100 ships. Therefore, A is efficient at crane handling and receives an efficiency
score of 1.0.
On the basis of the above data, we can also see that Operator C is efficient
because no combination of Operators A and B can produce 0 berth waiting time
in 100 ship calls. Operator C is minimizing berth waiting time more efficiently
than any other operator just as Operator A is handling containers more
efficiently than the other operators. Operator C focuses on minimizing berth
waiting time while Operator A focuses on berth productivity. Operator B would
have been more productive if it had reduced its berth waiting time like Operator
C and paid more attention to berth productivity like Operator A. Since B was
not that productive, it must not be as capable as either A or C and its efficiency
score would be below 1.0 to reflect this.
The example above can be made more confusing if the DEA model considers
unequal values of inputs instead of the constant 100 ship calls—creating a
multiple input problem or adding more data points—but the principles hold. Still,
the general approach is to consider a range of “production” inputs that produce
specific outputs.
Text Box 1. Illustrative Application of DEA

P R I N C I P L E S O F P O R T P E R F O R M A N C E M O N I T O R I N G | 10
Table 1 provides an example of a set of DEA-generated scores. These are drawn from a DEA application to assess the relative efficiency of 24 Italian ports.7 The author used liquid and bulk tonnages, number of ships, number of passengers, container moves and TEUs, and sales revenues as input variables for the model and number of personnel, asset value, and operational costs as output variables. Among the author’s conclusions are 1) Italian ports should expand their assets through investment or through mergers and acquisitions, 2) they should focus on the container trades because the container business generates more revenues, and 3) they should constrain the size of their labor force. Though these conclusions are correlated with the scores, they do not provide much practical guidance on the “how” to respond to them, so have no obvious meaning to a terminal operator or a port authority. The scores don’t provide much guidance as to why they are high, or why they are low, or why one port or terminal is ranked higher or lower than other ones. Hence, the score does not provide a direction towards a solution that a terminal operator or port authority needs to tackle a performance constraint.
Despite its shortcomings, DEA lends itself to assessing performance on a wide scale and should not be dismissed as a useful technique for comparative port performance. Additionally, data for inputs, regardless of specifics, can be readily available as are data for outputs. Still, the DEA
7 Barros, Carlos Pastana, “A Benchmark Analysis of Italian Seaports Using Data Envelopment Analysis”, Maritime Economics & Logistics, December 2006, Volume 8, Number 4, pp. 347-365.
Source: JOC Group Inc., Berth Productivity – The Trends, Outlook and Market Forces Impacting Ship Turnaround Times, July 2014, available at: https://www.joc.com/whitepaper/berth-productivity-trends-outlook-and-market-forces-impacting-ship-turnaround-times-0.
Figure 3. Comparative Regional Berth Productivity Levels by Vessel Size
0
20
40
60
80
100
120
140
10,000+ 7,501-10,000 5,001-7,500 2,501-5,000 2,500 or lessVes
sel P
rodu
ctiv
ity
per
Hou
r (T
EU
s)
Vessel Size Capacity in TEUs
Europe, Mid East, Africa Asia/Pacific Americas

P R I N C I P L E S O F P O R T P E R F O R M A N C E M O N I T O R I N G | 11
scoring does not report on factors of most concern to the industry: efficiency and productivity related to time.
More recent research provides some guidance on the indicators that can be generated for benchmarking and concession contract regulation purposes; Kent and Ashar, drawing on the port time accounting system they developed for the World Bank’s Port Reform Toolkit8, suggest
8 World Bank, Port Reform Toolkit, “Module 6, Port Regulation: Overseeing the Economic Public Interest in Ports, World Bank”, Second Edition, 2007.
Source: Barros, Carlos Pastana, “A Benchmark Analysis of Italian Seaports Using Data Envelopment Analysis”, Maritime Economics & Logistics, December 2006, Volume 8, Number 4, pp. 347-365.
Table 1. DEA Scores of 24 Italian Ports

P R I N C I P L E S O F P O R T P E R F O R M A N C E M O N I T O R I N G | 12
two sets of indicators for purposes of performance standards in concession contracts in a case study of Colombia’s port system (Table 2)9. The port accounting system, described later, accounts for the elapsed times associated with vessel and cargo movements from a port’s entrance buoy through the berth area. Kent and Ashar devised indicators relative to the two categories of operational efficiency and level of service, the first composed of ship, crane, and berth throughput productivity, and the second ship delay, truck delay, and truck turn time. Their reasoning is that these indicators are most indicative of the risk of terminal congestion. They also consider factors that can influence productivity, such as the load and discharge volume per call, crane technology deployed, and cargo type. Importantly, based on interviews with shippers and operators, they provide standards of performance for each of the indicators, as Table 2 shows.
Kent and Ashar later extended their research in a test application of their indicators to a selected sample of six Central American commercial gateway ports and three Latin American benchmark
ports known to operate at global standards.10 While they were able to obtain the majority of needed information to determine a limited number of indicators, the process was still somewhat onerous, and hence they conducted additional analysis in an effort to reduce the number of
9 Kent, Paul E. and Asaf Ashar, “Port Performance Indicators for Regulators and Concession Contracts”, paper presented to the International Association of Maritime Economists, Carcavelos, Portugal, July 2010; available at: http://www.asafashar.com/IAME_2010_Article_Performance_Indicators_for_Regulators_Final_Final.pdf.
10 Kent, Paul E., Asaf Ashar, and Gerardo Ayzanoa, “How Fit Are Central America’s Ports? An Exercise in Measuring Port Performance”, paper presented to the International Association of Maritime Economists, Norfolk, Virginia, July 2014.
Table 2. Regulatory Indicators for Operational Efficiency and Level of Service
Source: Kent, Paul E. and Asaf Ashar, “Port Performance Indicators for Regulators and Concession Contracts”, paper presented to the International Association of Maritime Economists, Carcavelos, Portugal, July 2010; available at: http://www.asafashar.com/IAME_2010_Article_Performance_Indicators_for_Regulators_Final_Final.pdf.

P R I N C I P L E S O F P O R T P E R F O R M A N C E M O N I T O R I N G | 13
indicators collected that would still be reasonably reflective of comparative performance. Using Principal Components Analysis (PCA), which discerns the indicators most representative of port performance, they were able to reduce the number of indicators to two, including ship productivity and crane productivity, greatly easing the process of data collection (Text Box 2).
The above discussion focused on the generation of performance indicators that can serve the port authority’s purpose of monitoring terminal operations performance or for gauging the relative
Sources: World Bank, Connecting to Compete – Trade Logistics in the Local Economy, The Logistics Performance Index and Its Indicators, Washington, D.C., 2010, available at http://siteresources.worldbank.org/INTTLF/Resources/LPI2010_for_web.pdf; Asia-Pacific Economic Cooperation (APEC), The Economic Impact of Enhanced Multimodal Connectivity in the APEC Region, APEC Policy Support Unit, Singapore, 2012, available at: http://publications.apec.org/publication-detail.php?pub_id=1028); United Nations Conference on Trade and Development (UNCTAD), Review of Maritime Transport, Annual Liner Shipping Connectivity Index (LSCI) Index, Trade Logistics Branch of the Division on Technology and Logistics, Geneva, Switzerland, available at http://unctad.org/en/pages/PublicationWebflyer.aspx?publicationid=380).
PCA is a commonly used technique in statistics and econometrics. In our port and
logistics world. The World Bank’s Logistics Performance Index uses a PCA-weighted
average of six raw data series that capture performance along the most important
dimensions of logistics activities. Similarly, UNCTAD uses PCA to produce an index
based on a set of raw data that covers the main dimensions of international maritime
transport. And APEC (the Asia Economic Cooperation forum) used PCA to produce an
index of multimodal transport connectivity, this time based on raw performance data for
the main modes of transport as well as the logistics sector.
PCA takes a number of raw data series and compresses them into one or more summary
indicators—“principal components”—using an optimal weighting scheme. Each index is
therefore a weighted average of the raw data used to produce it, with weights chosen so
that the index accounts for the maximum possible proportion of the variance in the
original data series. A PCA application can eliminate some data because it may show a
reduced number of data still adequately represents the phenomenon being measured.
When the data set is reduced, further analysis can be made simpler and future data set
requirements can be reduced without losing important information. There are several
conditions with which the data should conform for a solid PCA analysis (e.g. data should
have Gaussian or normal distribution); however, the present data set can still be useful for
illustrating a valid approach for reducing data collection efforts and provide the solid basis
for ranking terminals relative to operational performance.
Text Box 2. The Principal Components Analysis Technique for Reducing Data Requirements

P R I N C I P L E S O F P O R T P E R F O R M A N C E M O N I T O R I N G | 14
standing of its terminals among rival and benchmark ports. For comparative performance assessment, research shows that the port authority can focus on two productivity indicators when comparing its performance with other ports, as the PCA analysis demonstrated. However, when benchmarking its own terminals against prior years’ performance, the port authority has the ability to access data for a range of indicators, as long as the data are made available. In the case of private operators, concession and other agreements can compel private operators to provide needed data for indicator calculation; agreements can also subject operators to operational audits to ensure accuracy and reliability of collected data.
Port authorities, as administrators, also should monitor their own performance. This suggests an orientation towards resource allocation and management effectiveness. We address the range of indicators that port authorities can use. The ultimate indicators, addressed later in this report, depend on port authority objectives and strategy for performance improvement as well as regulatory requirements that may be imposed by other government agencies.
PORT AUTHORITY ADMINISTRATION INDICATORS Businesses tend to measure performance in order to monitor and control their operations, drive improvement, maximize the effectiveness of the improvement effort, achieve alignment with organizational goals and objectives, and to reward and discipline.11 So they tend to use quantifiable measures indicative of performance over time, which can number in the hundreds. As earlier noted, indicators not only enable organizations to track their performance, but also to compare it against other businesses within its industry. In the context of port reform, port authorities and regulators want to use a set of indicators that allows them to gauge the quality of services transferred to the private sector. But indicators could also be related to any performance standards incorporated into concession contracts, for benchmarking against rival or “best practice” ports for assessing relative competitiveness, or for benchmarking against prior years’ performance to monitor for improvements or declines.
While port authorities have an interest in monitoring port operator performance, they also have an interest in following their own performance. A classic source for port authority indicators is the United Nations Conference on Trade and Development (UNCTAD) Port Performance Indicators manual published in 197612, well before the tide of the first privatization wave of the 1980s. As such, port authorities, referred to as operating port authorities, directly managed port operations, with port authority personnel operating equipment and supervising labor gangs.13 Hence, the UNCTAD manual identifies indicators for port authority
11 Bititci, U. S., Carrie, A., & Turner, T.,“Integrated Performance Measurement Systems: Structure and Dynamics”, Business Performance Measurement: Theory and Practice, A. Neely (Ed.), Cambridge: Cambridge University Press, 2002, pp. 174-197.
12 United Nations Conference on Trade and Development, Port Performance Indicators, May 1976, Geneva. Available at: http://unctad.org/en/PublicationsLibrary/tdbc4d131sup1rev1_en.pdf.
13 Some port authorities (e.g. Karachi Port Trust) in the 1970s also enlisted labor from established labor pools not directly employed by the port authority. Usually, such labor pools included strictly manual labor for lashing containers and carrying sacks and boxes from or to breakbulk vessels.
P R I N C I P L E S O F P O R T P E R F O R M A N C E M O N I T O R I N G | 15
administration effectiveness and operations efficiency, focusing on financial performance and resource allocation for the former and operations efficiency for the latter, such as revenue per ton or TEU handled, expenditures per ton or TEU handled, number of employees per unit tons or containers handled, and so on.
UNCTAD provided an update on performance indicators in 2016, generally reflecting indicators relevant to the post-port reform era, focusing on four strategic dimensions of port administration, including finance, operations, human resources and market.14 Interestingly, the market dimension focuses on customer satisfaction, reflecting the renewed interest in keeping customers happy and placating any concerns they may have, though the dimension is also intended to reflect port market share by cargo type, and service effectiveness to customers.15 UNCTAD proposes developing a scorecard, which is intended to reflect relative standing among several port authorities, the data for which are collected from surveys to port authorities. While comparative data are useful to provide comparisons among a group of port authorities, comparisons can be distorted by the nature of port service offerings. For example, labor costs as a percent of total revenues, cargo dues as a percent of revenues, and so on, can be quite different between ports predominated by container activities and those predominated by bulk or breakbulk cargoes. Even among a population of primarily container ports, indicators can be quite divergent between container ports predominated by transshipment containers and those predominated by domestic or even reefer trades. Still, the indicators can be useful for a port authority to benchmark against prior year results. Table 3 presents UNCTAD’s range of indicators associated with its port (authority) scorecard.
UNCTAD also uses indicators from global sources, which can be very useful for monitoring and benchmarking performance of certain activities within the port area but not necessarily under the port authority’s jurisdiction or control, such as customs and liner connectivity offered to port customers. Customs indicators can alert the port authority to constraints influencing operational performance16, while liner shipping connectivity can inform the port authority of the extent of options its customers have for importing and exporting their freight.17 One advantage to such sources is that they are updated annually or biennially and readily available.
14 United Nations Conference on Trade and Development, Port Management Series, “Volume 4 Port Performance – Linking Performance Indicators to Strategic Objectives”, June 2016, Geneva. Available in English at: http://unctad.org/en/PublicationsLibrary/dtlkdb2016d1_en.pdf; available in French at: http://unctad.org/fr/PublicationsLibrary/dtlkdb2016d1_fr.pdf.
15 Ibid, p. 12.
16 Good sources indicating customs performance include the World Bank’s Logistics Performance Index where 163 countries are assessed relative to logistics-related criteria, including customs, infrastructure, international shipments, logistics competence, and timeliness. The customs indicator refers to the efficiency of the clearance process. See Arvis, Jean-François, Daniel Saslavsky, Lauri Ojala, Ben Shepherd, Christina Busch, Anasuya Raj, Tapio Naula, Connecting to Compete 2016 Trade Logistics in the Global Economy The Logistics Performance Index and Its Indicators, The World Bank, 2016; available at: https://wb-lpi-media.s3.amazonaws.com/LPI_Report_2016.pdf.
17 The Liner Shipping Connectivity Index shows the extent to which countries are connected to global shipping networks. The United Nations Conference on Trade and Development (UNCTAD) calculates the index based on five maritime components in each country, including the number of ships, their container carrying capacity, maximum vessel size, number of services, and number of companies that deploy container ships in a country's ports. The index

P R I N C I P L E S O F P O R T P E R F O R M A N C E M O N I T O R I N G | 16
The European Sea Ports Organization (ESPO) and the European Commission jointly created a port performance indicator reporting system to keep stakeholders informed of the port system’s ability to meet expectations. Over the years, individual countries have adopted different port governance systems, so the indicator project, referred to as PPRISM (Port Performance Indicators: Selection and Measurement), is aimed in part at assessing the effectiveness of the various governance models (see Table 4) while communicating with stakeholders the port system’s economic, social, and environmental impacts. ESPO identifies five categories of indicators, generally intended to illustrate advancements individual port authorities have made to serve customers and support economic growth and European Union policy. For example, the logistics chain and operational category reports on-time performance for both vessels and inland transport modes, vessel turn-around time, and the availability of port community systems to support information sharing among the various port users. The socio-economic category includes number of employees, amount of investment made, and the extent of training provided to port authority employees, all of interest to the port
is intended to reflect each country’s position within global container shipping networks. The higher the score, the easier it is to access the global maritime freight transport system. For a description of the Liner Shipping Connectivity Index, see United Nations Conference on Trade and Development, Review of Maritime Transport, UNCTAD, 2016, pp. 41-42, available at: http://unctad.org/en/PublicationsLibrary/rmt2016_en.pdf; for time series index data, updated annually, see http://unctadstat.unctad.org/wds/TableViewer/tableView.aspx?ReportId=92.
Source: United Nations Conference on Trade and Development, Port Management Series, “Volume 4 Port Performance – Linking Performance Indicators to Strategic Objectives”, June 2016, Geneva, Table 2, p. 22.
Table 3. UNCTAD Port Authority Scorecard Indicators
Category Indicator
EBITDA/revenue (operating margin)Vessel dues/revenueCargo dues/revenueRents/revenueLabor cost/revenueOther fees/revenue
Tons/employeeRevenue/employeeEBITDA/employeeLabor cost/employeeTraining costs/wages
Average waiting time (hours)Average overall vessel length per vessel (m)Average draft per vessel (m)Average gross tonnage per vessel
Average tonnage per arrivalTons per working hour, dry bulkBox per hour, containersTwenty-foot equivalent unit dwell time (days)Tons per hour, l iquid bulkTons per hectare - allTons per berth meter -- all
Quality of port infrastructureLiner shipping connectivity indexBurden of customs procedures
Female participation rate
Gend
er
Equi
tyFi
nanc
eHu
man
Re
sour
ces
Vess
el
Ope
ratio
nsCa
rgo
Ope
ratio
nsW
orld
De
velo
pmen
t In
dica
tor D
ata

P R I N C I P L E S O F P O R T P E R F O R M A N C E M O N I T O R I N G | 17
community. The environmental category provides indicators related to meeting the European Union’s environmental management systems standard, the existence of an environmental monitoring program, and utility resource usage. And, in an effort to monitor market concentration and perhaps market behavior, the market trends and structure category includes market share as well as the Herfindahl-Hirschman Index (HHI)18.
WHERE WE GO FROM HERE The above discussion illustrates the myriad indicators that can be used to assess port performance. From an operational performance dimension, indicators depend on the intended
18 HHI is a measure of the dominance of firms competing in the same market. HHI is calculated by squaring the market share of each firm competing in the market and then summing the resulting numbers. In the United States, an HHI score of 1,500 and 2,500 indicates the market is moderately concentrated while a score above 2,500 indicates the market to be highly concentrated. Mergers in highly concentrated markets that increase the HHI score by more than 200 points are assumed to increase market power and hence may be opposed by regulatory authorities subject to further investigation of competitive effects. See U.S. Department of Justice & Federal Trade Commission, Horizontal Merger Guidelines Section 5.2 (2010), available at https://www.justice.gov/atr/horizontal-merger-guidelines-08192010#5c.
Category Indicator
Maritime connectivityIntermodal connectivityOn-time performance (sea-going)On-time performance (inland waterways, rail , road)
Mean-time customs clearanceAvailabil ity of port community systemsShip turnaround time
Integration port clusterExtent of performance managementExistence of performance measurementFormal reporting CSRMarket opennessPort authority investmentSafety/securityPort authority employee productivityAutonomous management
Gove
rnan
ce In
dica
tors
Logi
stic
s Cha
in a
nd
Ope
ratio
nal
Category Indicator
Maritime trafficHerfindahl-Hirschman Index (HHI)Vessel trafficMarket shareLoad rateContainer dependencyCall sizeModal split
Employment (direct and indirect)Added value (direct and indirect)Direct Gross added value per FTE*Financial healthTraining per FTE*Investment
Total energy consumedCarbon footprintTotal water consumptionAmount of wasteEnvironmental management systems standardExistence of aspects inventoryExisting monitoring program
Mar
ket T
rend
s & S
truc
ture
In
dica
tors
Soci
o-ec
onom
ic
Indi
cato
rsEn
viro
nmen
tal
Indi
cato
rs Note: FTE refers to full-time equivalent employee status; CSR is corporate social responsibility. Source: For a detailed description of these indicators, see European Sea Ports Organization, “Project Executive Report (PPRISM WP4 D4.2)”, Port Performance Indicators – Selection and Measurement Indicators, January 2012, available at: http://pprism.espo.be/ProjectResults.aspx.
Table 4. European Sea Ports Organization Port Indicators
P R I N C I P L E S O F P O R T P E R F O R M A N C E M O N I T O R I N G | 18
use of a performance indicator system, such as the port authority’s desire to benchmark the performance of terminals within its jurisdiction against rival or “best practice” terminals, to benchmark its jurisdiction’s terminal operations against prior years, or to incorporate indicators as part of a concession contract’s minimum performance standards. Indicators are usually based on the myriad activities that take place in a port terminal, and in some cases may represent certain components of each activity; there is a potential indicator for any component activity that encompasses time or cost aspects. Next, we describe the best practice standard indicators employed by terminal operators today.

P R I N C I P L E S O F P O R T P E R F O R M A N C E M O N I T O R I N G | 19
CONCEPTS AND BEST PRACTICES
Whether ports are small, meaning they have relatively small volumes, or large, where volume is sufficient to support several terminal operators, we can expect at best that ports are oligopolistic. Accordingly, even where there may be several operators in a single port, or several operators located among several ports that vie for the same hinterlands, there will likely be a risk of anticompetitive behavior because terminal operator markets tend to be highly concentrated. We noted earlier the use of the HHI to determine how concentrated the container terminal services industry can be; the extent of dominance is a concern to competition regulators as such conditions are ripe for pricing and market collusion as well as predatory pricing.19
The primary strategy to prevent anticompetitive behavior is to create competition, but in markets where cargo volumes are low and therefore competition is not possible, then countries engage in tariff regulation and may impose minimum operational standards to ensure port customers receive a certain level of services. As earlier noted, tariffs can be controlled via the concession contract or imposed directly by an economic regulator. In the former instance, governments have either determined what a maximum tariff should be and request that bidders bid below that maximum (e.g., Chile) or they can undergo a review process, subject to terminal operator’s petition for a tariff review (e.g. Peru), or both (also Peru). Price regulation can only ensure that the tariff for a service is in line with the cost of providing this service, or with tariffs in similar ports; it does not directly relate to the quality of that service. Indeed, to save on cost and increase profit, port operators may be tempted to provide a lower quality service. For
19 Predatory pricing occurs when a terminal operator sets prices below long run marginal costs in an effort to eliminate the competition or prevent new competition from entering the markets. Predatory pricing is illegal under the competition laws of most countries as it makes markets more susceptible to monopoly, but a Supreme Court decision in the United States raised the bar for demonstrating that a company has engaged in predation. The Court’s Brooke decision compels a party to prove that below cost pricing has occurred and that the predation party can later raise prices to recover its investment in below cost pricing. See Bolton, Patrick, Joseph F. Brodley, and Michael H. Riordan, Predatory Pricing: Strategic Theory and Legal Policy, undated; available at https://www.justice.gov/atr/predatory-pricing-strategic-theory-and-legal-policy#N69.

P R I N C I P L E S O F P O R T P E R F O R M A N C E M O N I T O R I N G | 20
example, to reduce cost the operator may decide to limit the number of gangs working a ship, or limit overtime and night shifts, resulting in a longer vessel time at berth and higher cost to the vessel operator. Performance indicators are expected to complement the tariff control system by adding performance control since both forms of control influence the cost of using the port.
In deriving the indicators that should be employed for monitoring terminal performance, it is helpful to understand the dynamic behavior of terminal operations. Stock and flow analysis, originating from System Dynamics20,21, simulates the operations of ports (marine terminals) and facilitates the derivation of indicators measuring their performance. A stock accumulates over time by inflows or may be depleted by outflows. So stocks can only change through these flows. So a marine terminal, characterized as having container inflows and outflows, can be functionally represented as a network of stocks (inventories of containers) and flows (transfers of containers) that add or subtract from these stocks.
Our simple marine terminal can be functionally depicted as a combination of:
• Stock Holding Components – These include berths for holding ships, storage yards for containers, transit sheds for loose cargoes, silos for dry bulk cargoes, tanks for liquid bulk cargoes, parking lots for trucks, etc.; and
20 Systems dynamics modeling methods was developed in the 1950s by James Forrester, one of the first professors of the Sloan School of Management at the Massachusetts Institute of Technology.
21 For an early application of System Dynamics in ports see: Ashar, A. Productivity, Capacity and Equity in the Port of San Juan, WWS/World Wide Shipping, May 1991; and Ashar, A. and Ayzanoa, G., Stock and Flow Methodology for Calculating Capacity of Cargo Transfer Terminals, Proceeding of Second Annual Conference on Transportation Management, Sate University of New York, Maritime College, May 1995.
Source: Nathan Associates Inc.
Figure 4. Basic Marine Terminal Stock and Flow
P R I N C I P L E S O F P O R T P E R F O R M A N C E M O N I T O R I N G | 21
• Flow Moving Components – These include ship’s or shore cranes for moving freight, conveyors for dry bulk cargoes, pipes for liquid bulk, yard tractors, freight delivery trucks, truck-processing stations at gates, etc.
By definition, each flow has to connect at least two stocks (from and to) and each stock normally has to be connected to two flows (in and out). The operation can be even simpler, with the simplest terminals involving at two stocks and one flow. For example, an oil import terminal has two stock components, a tanker vessel at berth and a tank farm on shore, and 1 flow component, a pipe linking the two.22
In most marine terminals, the transfer process is more complex than the simple oil terminal example, consisting of many stocks and flows. For example, the import operation of a generic container terminal consists of two flows (ship-to-yard and yard-to-gate) and two stocks (the berth and the yard storage). Accordingly, the terminal’s overall performance may be adversely affected due to problems in the stock components, such as insufficient berth or yard space, or flow components, such as insufficient velocity of the ship-to-yard or yard-to-gate transfer operations.
In a more realistic presentation of a container terminal, the stock and flow model consists of several additional stocks and flows, with each relating to a separate facility component. For example, let’s say the yard is divided into different sections based on the traffic’s direction and container type: import and export, full and empty, dry and reefer, dangerous, open top, and so on. Likewise, the ship-to-yard and yard-to-gate flows are divided accordingly. In this case, a specific ship-to-yard flow could include moving 40-ft dry import boxes between the ship and the full-import section in the yard. In addition to the primary flows, ship-to-yard and yard-to-gate, there are many secondary flows that are not involving the ship or the gate, such as the transfer to/from Customs, re-arranging of the yard, etc. Our experience suggests that for defining a system of performance indicators, a realistic container terminal stock and flow model should include at least 10 stock components and the main flows among them.
DERIVING PERFORMANCE INDICATORS
Performance Indicators vs. Descriptive Statistics There is a difference between descriptive statistics of a terminal and its performance. Descriptive statistics relate to the terminal characteristics of both its facilities (supply) and traffic (demand). Performance indicators measure the performance of the facilities in handling the traffic included in the descriptive statistics. However, often statistics and performance indicators are conflated, especially when the descriptive statistics are expressed in statistical terms or ratios. For example, on the facility side, the yard storage, a stock holding component, can be functionally described by its holding capacity (TEUs), its physical dimension (hectares), density (TEUs/hectare) and its relationships to other terminal facilities, such as berthage
22 In a direct transfer terminal, whereby the cargo is transferred from ship to outside trucks, there is no stock component within the terminal. Still, the trucks function here as stock and a shortage of them can negatively affect berth productivity.

P R I N C I P L E S O F P O R T P E R F O R M A N C E M O N I T O R I N G | 22
(hectares/berth, hectares/berth-meter). Respectively, the terminal’s linear berth can be functionally described by its holding capacity (number of berths or number of average size ships), its physical dimension (length in meters) and ratios (cranes/berth or cranes/unit berth length). On the traffic side, descriptive statistics may include total annual throughput (TEUs) and various ratios (average moves/ship-call or call size, TEUs/container, tons/TEU, inbound/outbound, empty/total moves, etc.). For non-containerized cargo, the definition of the cargo units is especially important, such as the slinging of bags (bags/sling, tons/sling).
Descriptive statistics are necessary to allow for meaningful cross-comparisons among terminals using performance indicators. For example, berth productivity commonly is a function of the cranes/berth available, ship size, and the call size of ships handled there. Therefore, a meaningful comparison of berth productivity among terminals should include terminals with similar crane availability and ship and call sizes, as we discussed earlier, as loading/discharge volume and vessel size can influence shoreside productivity. Another factor to consider is crane technology, especially the availability of twin lifting cranes.
Performance Indicators of Stock and Flow Components The depiction of a marine terminal as a network of stocks and flows allows us to specify performance indicators as:
• Productivity Indicators – which measure the velocity of the flow processing components (e.g., moves per berth-hour, moves per gate-lane hour); and
• Utilization Indicators – which measure the level of usage of the stock holding components (e.g., berth, yard and gate utilization).
Still, there is often confusion in the functional differentiation of terminal components which may serve as flow or stock components, depending on the context. For example, a performance indicator can relate to terminal berthage as stock, measuring its utilization as the average time it was occupied by ships (days/year); or as flow, measuring its productivity (moves/berth-hour), based on the velocity of the cranes operating there. Similarly, yard performance can relate to its utilization or the average fraction (%) of the slots occupied by boxes, or productivity (TEU/hectare-year).
As seen above, productivity and utilization indicators are, by nature, are complementary since both convey the idea of efficiency. The main difference between the two is that productivity is commonly measured as an output/input ratio while utilization as a pure ratio (percentage). Unfortunately, the definition of performance indicators in the literature does not always follow this simple rule. For example, the performance indicator of a terminal berth is defined by its flow moving characteristics: TEU per berth-meter-year which, in turn, is a function of both its utilization (% of the time or days per year) and productivity (TEUs per berth-hour).
Productivity vs. Utilization Indicators While productivity and utilization indicators convey the notion of operational efficiency, higher productivity is not always associated with higher utilization (and vice-versa). For example, for a

P R I N C I P L E S O F P O R T P E R F O R M A N C E M O N I T O R I N G | 23
given volume of traffic (TEUs/year), higher berth productivity (TEUs/day) will by definition result in a smaller number of days required to handle this volume and lower berth utilization (operating days/year). Moreover, at times the two even adversely interact. For example, high storage space utilization may increase the cycle time of yard trailers serving the berth, resulting in longer crane waiting times and lower berth productivity. Accordingly, while higher scores for productivity indicators are usually more desirable, higher scores for utilization indicators are not necessarily preferred and the desired scores are commonly based on an optimum.
Level of Service Indicators Every port has port service providers and consumers of their services. In public ports, the providers usually include the port authority, terminal operators, stevedores, Customs, tug assist operators, pilots, and others. The port’s main customers include shipping lines and ship owners, shippers, and truckers. The noted productivity and utilization indicators measure terminal performance from the point of view of port service providers. Another type of indicator, referred to as the level of service, refers to the standards of service that port customers receive from service providers. Hence, level of service indicators are commonly used for regulatory purposes, complementing price regulation as earlier noted. In general, level of service indicators are categorized as those related to:
• Service Time – measuring the service time along with the waiting time for service; and
• Service Quality – measuring service safety, reliability, and integrity (damage and loss prevention).
In the case of shipping lines, the time-related level of service provided at the terminal berth can be measured by the time the ship has to wait for berth availability and the ship’s time required to load and discharge its cargo which, in turn, is a function of berth productivity. The quality-related level of service of the berth can be measured by the availability of sufficient labor and equipment and the percentage of cargo that is damaged in the handling operation.
Productivity, Utilization, and Level of Service The types of indicators just described are closely related and sometimes even overlap. For example, the ship’s working time is determined by berth productivity; as such, higher productivity results in shorter time at the berth and a higher level of service. There are many cases where utilization and level of service are inversely related. For example, a higher berth utilization often results in a longer waiting time for the berth and a lower berth level of service. This tradeoff between utilization and level of service is especially critical where the demand for service is random. Accordingly, a common way to keep a reasonable utilization level along with a reasonable waiting time for service is by controlling demand through operational planning: allocating berthing windows to ships and appointment windows to trucks.
ASSESSING PERFORMANCE The three general methods to determine preferred levels for performance indicators and, accordingly, assess the calculated results include:

P R I N C I P L E S O F P O R T P E R F O R M A N C E M O N I T O R I N G | 24
• Past Performance – based on statistical analysis of the indicator’s time series relative to central values (mean, standard deviation), extreme values and trends;
• Theoretical Performance – based on theoretical engineering models, using specifications of equipment, time and motion studies, etc.; and
• Industry Standards -- based on common industry standards and actual performance of terminals with similar descriptive statistics.
In cases where terminals are being rehabilitated or modernized, the terminal’s past performance is not useful. Likewise, for smaller terminals, developing a theoretical model might not be justified. In such cases, industry standards can be used, but industry standards are more relevant to larger terminals, particularly in cases where the same ships call at several terminals with similar facilities, which may not be the case for smaller terminals.
Another problem in comparative assessments of terminals is the lack of uniformity in the terminology used and the system for reporting or collecting data. For example, the event “starting ship handling” can be defined either as the time when the gang begins climbing the gangway, the gantry moves to position, its boom is finished lowering, the crane’s spreader locks into the first box, etc. Another problem is the commercial sensitivity of performance data. Container terminal operators tend to treat performance information as proprietary.
Level of Detail in Defining Indicators Performance indicators related to both productivity and utilization can be measured either as output/input or pure ratios (%). For example, the common berth productivity indicator for a container terminal is the average moves/berth-hour of the transfer of containers between ships and yard. The handling process is performed by gangs consisting of labor, cranes, yard trailers, and yard cranes, all of which are considered as inputs. Berth productivity can thus be broken down into its specific components and separate indicators can be calculated for each component, as we earlier noted, such as moves/hour per crane, yard trailer, labor, etc. In fact, as we later show, we suggest that both moves/berth-hour and moves/crane-hour be used as performance indicators. Further detailing also can be done on the output side. Likewise, the number of moves can be broken down to regular moves of boxes (ship-to-yard), hatch-covers23, re-handles through the dock, cell-to-cell moves, etc. A similar breakdown could be applied for berth utilization, looking at the fraction of time that the berth was unassigned, assigned but waiting for scheduled ships, occupied by idle ships, occupied by working ships, etc.
The further the breakdown of inputs and outputs, the larger the number of indicators that can be defined resulting in a more accurate system for monitoring terminal performance. But, a larger system of indicators requires compilation of more data and may be more difficult to manage. Based on our experience, we believe that for practical purposes the number of indicators should be limited to no more than ten.
23 Since handling of covers usually takes more time, each handling could be equated to 2 handlings of boxes.

P R I N C I P L E S O F P O R T P E R F O R M A N C E M O N I T O R I N G | 25
Combining Performance Indicators The set of indicators the port authority selects, together with descriptive statistics, defines the marine terminal’s performance profile. Some of the indicators move in conflicting directions as demonstrated in the case of berth utilization vs. ship waiting. The question is how to combine the various indicators to make an overall judgement regarding the terminal’s performance. This question is also important in cases where an overall performance index is required for regulatory control.
One way of resolving the problem of combining multiple indicators into a single index is to assign different weights to each indicator based on professional judgement regarding each indicator’s importance. For example, the weight assigned to a “berth waiting” indicator may be twice the weight assigned to the “berth utilization” indicator.
A relatively new statistical method for combining multiple indicators is based on the earlier described production frontier concept and the related data envelopment analysis (DEA). DEA is geared for assessing operations involved with production with clearly defined variables as inputs or outputs. For example, in evaluating the performance of Brazilian, Argentinean, and Uruguayan ports, the noted Rios Macada study defined the number of cranes, number of berths, size of terminal area, number of employees, and number of equipment as inputs for measuring performance as represented by outputs, in this case, the number of TEUs handled and the average number of containers moved per ship-hour.24
The method generates a so-called “production frontier”, the highest output/input achieved amongst a sample of factories or, in our case, marine terminals, serving as a standard. There are two additional and more general statistical methods used to cope with multiple variables that can also be applied for marine terminals’ performance: factor analysis (FA) and the noted principal components analysis (PCA), both of which are based on sophisticated analysis of the variances of the variables under study. Our own experience is such that the results of DEA, FA and PCA analyses are difficult to interpret as the “scores” do not provide insight as to the constraining or facilitating factors that affect performance. Moreover, the multi-variable index is not tangible and not intuitive. Hence, we suggest to adhere to using simple indicators that are far easier to explain.
Performance Indicators and Capacity In addition to monitoring performance for regulatory purposes, the marine terminal’s system of performance indicators should support the port authority’s administrative and planning functions. The discussion so far focused on the use of indicators for regulation, but generally the same indicators used for regulation are also pertinent to planning. The core activity of the terminal planning process involves comparing future demand forecasts with capacity, identifying capacity shortfalls, and designing expansion projects to fill the gap between them. Calculating the capacity of present and future terminal facilities should in part be based on assumptions regarding their performance. For example, assessing terminal berth capacity (TEUs/year) should
24 Rios, L. R., and A. C. Gastaud Macada, “Analyzing the relative efficiency of container terminals of Mercosur using DEA”. Maritime Economics & Logistics, Volume 8, Number 4, 2006, pp. 331-346.

P R I N C I P L E S O F P O R T P E R F O R M A N C E M O N I T O R I N G | 26
be based on an assumption regarding its productivity (TEUs/day) and utilization level (days/year), since:
Berth Capacity (TEUs/year) = Berth Productivity (TEUs/day) x Berth Utilization (days/year)
whereby,
Berth Productivity (TEUs/day) = Berth Productivity (moves/hour) x number of productive hours per day x ratio of TEUs/move
Accordingly, the higher the assumed productivity and utilization, the higher the resultant calculated berth capacity, demonstrating the use of indicators for capacity planning.
Weak Link Terminal Component The berth is only one component of the marine terminal and not necessarily the one which determines the terminal’s overall capacity. A detailed capacity assessment requires depicting the terminal as a stock and flow network, calculating the capacity of each component and identifying the terminal’s “weak link”, meaning the component with the most constraining capacity which, in turn, determines the terminal’s entire capacity. A related analysis could identify the various measures available to increase the specific capacities of this component and that of the entire terminal.
For example, a comprehensive 2010 study US container terminal capacity identified the container yard as the weak link of most terminals.25 Accordingly, the study suggested that increasing terminal storage capacity could considerably add to the overall capacity of US terminals which, in turn, may delay the need for constructing new terminals. Increasing the storage capacity of the yards can be done either by increasing the storage density of existing yard areas (TEUs/ha), transferring secondary yard storage components (e.g., chassis) to off-terminal locations, or providing additional storage area. Another way of increasing storage capacity is by reducing the demand for storage space and the related inventory of in-terminal boxes by reducing dwell time, using tariff incentives (or disincentives) to encourage quicker evacuation of containers from the terminal.
TIME ACCOUNTING SYSTEM All measures of operational efficiency are related to time. Our system of “time accounting,” presented in the World Bank Port Reform Toolkit’s regulatory module26, is based on the
25 The Tioga Group, Improving Marine Container Terminal Productivity: Development of Productivity Measures, Proposed Sources of Data, and Initial Collection of Data from Proposed Sources, U.S. Maritime Administration, 2010, available at: https://www.marad.dot.gov/wp-content/uploads/pdf/070810_Tioga_CHCP_Productivity_Report.pdf.
26 Port Reform Toolkit, Module 6, Port Regulation: Overseeing the Economic Public Interest in Ports, World Bank, Second Edition, 2007, available at: https://ppiaf.org/sites/ppiaf.org/files/documents/toolkits/Portoolkit/Toolkit/pdf/modules/06_TOOLKIT_Module6.pdf. Subsequently modified to include truck-related indicators in: Kent, Paul E., Asaf Ashar, and Gerardo Ayzanoa, “How Fit Are Central America’s Ports? An Exercise in Measuring Port Performance”, paper presented to the International Association of Maritime Economists, Norfolk, Virginia, July 2014.

P R I N C I P L E S O F P O R T P E R F O R M A N C E M O N I T O R I N G | 27
principles of industrial engineering. The system defines and records a series of events during the handling process along with respective elapsed times between these events. Most ports use this or a similar system as a basis for operational control and have made it an essential part of their terminal operations system reporting.
Figure 5 illustrates the three main components of a terminal (berth, yard, and gate) and the events and elapsed times for each. The figure shows two parallel time lines. The upper one applies to the ship (berth) operation and the lower one to the gangs (cranes) involved in this operation. The intent is to illustrate the functional relationships between the two. The figure shows that overlapping time occurs only with Net Berth and Net Gang Times. Indeed, Net Berth Time equals Net Gang Time only where one gang is employed. A similar depiction of time accounting is also included for the gate operation.
We describe below the indicators that are relevant to berth, yard, and gate operations.
Berth Indicators
Ship’s Handling Cycle The marine terminal’s berth area is usually its most expensive component. Hence, the discussion of berth-related performance indicators is much more detailed than that devoted to the other yard and gate components. Figure 5’s upper portion (the area designated as Ship Time) depicts the range of events and elapsed times that occur during a typical ship call at a port. The entire process, starting when the ship arrives at the entrance buoy and ending when it passes the same buoy on its departure after completing its loading and discharge operation is defined as the ship cycle. As seen in this figure, a typical ship cycle consists of many activities, delimited by a total of 13 time events (t1…t13). Using the various times, we can define numerous indicators based on output/input ratios, or those involving moves and those involving ratios between various elapsed times. For convenience, we characterize the events and related elapsed times in two categories:
• Port Time – Buoy-In to Buoy-Out, or the total time that the ship spends in a port;
• Gross Berth Time – First-Line to Last-Line tied, or the total time that the ship is at berth; and
• Net Berth Time – Gang On-Board to Gang Off-Board, or the total time that the ship is being actively worked.
The Port Time is of most interest to the ship owner. Port time data can be easily collected from the ship’s agent report or the port captain report and verified, including through simple observations. The other times are more difficult to define and can be prone to misinterpretation if not carefully defined.

P R I N C I P L E S O F P O R T P E R F O R M A N C E M O N I T O R I N G | 28
Berth Productivity Indicators In the same Ship Time area of Figure 4, there are two indicators that are the most widely used for berth performance:
• Gross Berth Productivity = Number of boxes moved during ship cycle/Gross Berth Time (hours); and
• Net Berth Productivity = Number of moves handled during ship cycle/Net Berth Time (hours).
Figure 5. Time Accounting System for Port Operations
Source: Adapted from Asaf Ashar, Paul Kent, et al, Port Reform Toolkit, Module 6, Port Regulation: Overseeing the Economic Public Interest in Ports, World Bank, Second Edition, 2007; https://ppiaf.org/sites/ppiaf.org/files/documents/toolkits/Portoolkit/Toolkit/pdf/modules/06_TOOLKIT_Module6.pdf. Subsequently modified to include truck-related indicators in: Kent, Paul E., Asaf Ashar, and Gerardo Ayzanoa, “How Fit Are Central America’s Ports? An Exercise in Measuring Port Performance”, paper presented to the International Association of Maritime Economists, Norfolk, Virginia, July 2014.

P R I N C I P L E S O F P O R T P E R F O R M A N C E M O N I T O R I N G | 29
In many modern ports, the elapsed times between First Line and Gang-on-Board and Gang-off-Board and Last Line are relatively short. In this case, the Gross and Net Berth Productivities are almost similar, in which case only the Gross Berth Productivity is calculated. Port Time is not used in productivity-related performance indicators since it is not directly related to operational efficiency. Port Time is directly related, as we show below, to the berth’s level of service performance indicator. The above definitions of Gross and Net Berth Productivity relate to container terminals, but also can be applied to any terminal by replacing the output units (e.g., tons, autos, etc.).
Gang Productivity Indicators The main factor affecting berth productivity is the number and productivity of gangs serving the ship; each gang includes a shore or ship crane, yard tractors, yard cranes and the respective labor. The area composing Figure 4’s middle portion is referred to as Gang Time, where gang activities during the ship cycle, including main events and elapsed times during the ship-handling process, are defined. As shown in the Figure, the handling process includes delays whereby the gang is either idle (e.g., waiting for a tractor) or involved in indirect activities (e.g., preparations). The most common indicator used for gang productivity is:
Net Gang Productivity = Number of boxes handled during ship cycle/Net Gang Time (hours)
Sometimes, more detailed gang productivity indicators focusing on the gang composition are used, such as, for example, moves/yard tractor, moves/labor-hour, etc. These detailed indicators are of greater interest and relevancy to port operators and therefore not discussed here.
As seen in Figure 5, the Net Berth and Gang Times are overlapping. For clarity, the figure only presents one gang although, in reality, several gangs may simultaneously work the same ship. The Net Gang Productivity is the average of all gangs, calculated by dividing the sum of all moves by all hours.
Berth Utilization Indicators Berth utilization indicators are commonly measured by the proportion of time that the berth is occupied. In cases of terminals with linear berth areas that can accommodate several ships, the indicator also relates to the length of ships (LOA-m). Berth utilization can be defined as:
Gross Berth Utilization (%) = Total Gross Berth Hours per Year with Ship at Berth / Calendar Hours
In most cases, Calendar Hours are simply calculated as 365 x 24 since most container terminals worldwide work continuously.27 Sometimes, the number is reduced to account for holidays and days off due to bad weather.
27 In some terminals there are breaks between shifts and, although rarely, during shifts, for meals.

P R I N C I P L E S O F P O R T P E R F O R M A N C E M O N I T O R I N G | 30
Figure 5 also shows that the ship cycle can be depicted in 3 generic states:
• Working – where a ship is tied to the berth and gangs are working the ship;
• Idling – where a ship is at berth, but not working either because there is no gang or there is a gang but the gang is idle; and
• Unoccupied – where there is no ship at berth.
The idling time is usually due to waiting for clearance, lashing gangs, equipment unavailability and, sometimes, waiting for cargo (late arrival of exports). Accordingly, an additional indicator is defined where these events are subtracted from Gross Berth Time to yield net berth utilization as follows:
Net Berth Utilization (%) = Total Net Berth Hours per Year with Ship at Berth/Calendar Hours
Berth Level of Service Indicators The ship owner’s main interest is to minimize the ship’s time at port. Accordingly, the main level of service indicator of interest to ship owners is Gross Berth Productivity, which determines Gross Berth Time, which usually accounts for most of Port Time. Another level of service indicator of interest relates to the time the ship has to wait for a berth during which the berth is occupied by another ship. Since most terminals have pre-determined berthing windows, the time defined as ship’s waiting only refers to the ship’s arrival within its window boundaries. So berth waiting is calculated as follows:
Berth Waiting = Average Waiting for Berth per Ship
Traditionally, at a time when a ship’s arrival was random, this level of service indicator was measured as the ratio between waiting time and working time. However, this ratio is irrelevant in the era of berthing windows and should be replaced simply by the absolute waiting time (hours).
Yard Indicators The terminal yard performance indicators are more related to the port authority’s administrative and planning role and only indirectly, through berth and gate indicators, to operational efficiency controlled by the terminal operator. The performance indicators related to administration/planning are commonly based on container dwell time (or other cargoes in the case of general cargo terminal) in the terminal. The common indicator for this purpose is an inventory summary report, providing a distribution of import and export, dry, and reefer containers by dwell time. However, terminal operators normally do not share inventory reports as they are considered proprietary.
A related performance indicator measuring space utilization is defined as:
Yard Utilization (%) = Average number of Occupied TEU-slot/Total TEU-slot

P R I N C I P L E S O F P O R T P E R F O R M A N C E M O N I T O R I N G | 31
The number of boxes in the yard can be calculated based on berth and gate operations reports and can be verified by physical counting. High dwell time is usually attributed to financial problems of importers or problems with Customs clearance.28 High dwell time often is the main cause of high yard utilization or congestion.
As noted above, Yard Utilization adversely affects both Berth Productivity and Gate Productivity (or Turn Time, see below). When the yard utilization is high, meaning that the yard is congested, the yard crane productivity is lower and its service time is longer since the crane spends time for locating empty slots to place inbound boxes and for shuffling boxes to locate outbound boxes. The lower yard crane productivity in turn results in berth delays and/or longer truck turn time at the gate.
Yard storage, especially extended yard storage beyond the free storage time, often constitutes a source of additional income for port operators. Tariff regulation typically excludes dwell times beyond those considered as “basic” (typically 2 or 3 days) storage. In a monopolistic setting, the port authority should be watchful that yard congestion will not affect the level of service of the berth and gate.
Another yard indicator, the Number of Turns per Slot (TEU/slot), is usually calculated as the inverse of dwell time:
Number of Turns per Slot = 365 / Dwell Time (days)
For example, if the average dwell time is 7 days, each TEU-slot can handle 365/7 = 52.1 TEUs of throughput annually. This indicator is critical for planning purposes since, based on it and the Peak Factor (usually 1.5), the number of yard slots can be derived as a function of the forecasted throughput.29
Gate Indicators Figure 5’s lower portion depicts the two operations concerned with truck handling cycles: pre-gate waiting and terminal processing, with terminal processing consisting of the activities at the gate and the yard. Accordingly, the two indicators related to terminal gate performance are:
Pre-Gate Waiting (in minutes) – which is the average waiting time per truck since arrival until gate processing commences; and
Terminal Turn Time (minutes) – which is the average time per truck between gate check-in and gate departure.
28 High average dwell time of containers can also be attributed to excess capacity. The terminal operator can decrease its storage charges to encourage storage use, which may increase dwell time.
29 The peak factor represents the relationship between annual container handling capability and the storage capacity of a container terminal.

P R I N C I P L E S O F P O R T P E R F O R M A N C E M O N I T O R I N G | 32
Both indicators are presented as daily (or sometimes monthly) averages along with its distribution or, at a minimum, upper bound times (e.g., the time value of the 90th percentile). The variations are usually more prevalent in Pre-Gate Waiting than in Terminal Turn Time. Longer pre-gate waiting times are often attributed to the uneven distribution of truck arrival during gate hours, with many trucks arriving in the early morning and after lunch hours. These peaks could be eliminated by implementing truck appointment systems akin to vessel berthing window systems. However, while gate appointments have become more prevalent in recent years, in most terminals the gate arrival of trucks is still random, especially for imports.30 Likewise, the processing of import containers is often longer due to Customs. The result is that in most terminals there is a long waiting line of trucks in the inbound direction.
The collection of pre-gate waiting times is difficult since only a few terminals have a special pre-gate truck staging area where initial processing of trucks can take place, including recording their arrival times. In most terminals trucks queue on city streets and no orderly information on arrival time is available.
The turn time for trucks varies according to the type of transaction; the most common are:
• Picking up Import Container
• Bringing in Export Container
• Picking up Empty Container
• Returning Empty Container
In addition to the four basic transactions, there are many combinations, such as Returning Empty + Picking Up Import or Bringing-In Export and Picking-Up Empty; there is also the rare possibility of Bringing-In Export and Picking-Up Import. Each transaction involves different gate and yard activities and therefore takes different times with those solely related to empty boxes usually being the shortest. Hence, desirably, the indicators are related to Terminal Turn Time.
Another somewhat uncommon gate productivity indicator measures the processing velocity of gate lanes:
Gate Productivity = Average Time (min) to Process Truck (per transaction type)
Calculating this indicator requires recording the time that the gate processing ends.
REGULATION BY CONTRACT As earlier noted, concession contracts may include mandated performance standards. Non-compliance may result in penalties or even contract default. Determining the standards to incorporate in concession contracts normally requires in-depth study of the operational
30 A pilot program for the truck appointment system at the Port of New York & New Jersey began at the port’s Global Container Terminal on October 31, 2016. Prior to the pilot program, hundreds of trucks lined up before the gate’s opening at 6 am.

P R I N C I P L E S O F P O R T P E R F O R M A N C E M O N I T O R I N G | 33
environment where the terminal operates. For example, the value for gross berth productivity depends on ship and call size, type and number of ship-handling equipment (ship’s gear, mobile cranes, gantry cranes31), yard equipment, labor contract, etc. The specific values can be derived through:
• Engineering/Operational Analysis, based on equipment specifications; • Comparison to similar ports handling similar ships; and • Assessment of past performance data.
In some cases, the concession may involve a brownfield port that remains operational while port improvements are being made. Hence, future performance standards cannot be based on prior or ongoing conditions. In such situations, initial indicator values can be defined on the basis of other ports that handle the same ships. The values can be adjusted later on to better reflect the specific operation once the port improvement program is completed as well when market conditions or operational change, such as growth in demand and the placement of additional shore cranes introduced by port operators to meet demand growth.
Regulation System In most concession contacts, the performance standards are simple. A short list of indicators is defined that prescribe minimum values and penalties for noncompliance. Sometimes, the definitions of times and quantities are vague, resulting in unnecessary friction and possibly legal challenges as operators and authorities interpret indicators differently or operators may claim circumstances outside their control adversely affecting performance levels. Some contracts require a fact finding process and professional judgement by an independent party seeking to establish whether it was the port operator’s fault before imposing penalties.
The final determination of performance indicators for concession contracts should be determined in part in consultation with the port authority. Table 5 shows a list of performance indicators taken from a recent concession contract. As seen in this list, the indicators do not relate to ship’s waiting or on berth and yard utilizations.
Table 5. Example of Contractual Performance Indicators
Type of Service Performance Indicator Standard
Services to Ships Time to Start Operation [a] – Average 20 minutes
Time to Start Operation – 90% Upper Bound 30 minutes
Services to Trucks Turn Time Single Operations - 90% Upper Bound 45 minutes
Turn Time Double Operations - 90% Upper Bound 60 minutes
Waiting Time at Gate – Average 40 minutes
Waiting Time at Gate – 90% Upper Bound 75 minutes
Services to Cargoes Productivity of Gantry Crane – Average 20 moves/hr
Productivity of Mobile Crane – Average 14 moves/hr
31 Productivity is also affected by the specific characteristics of the crane, such as crane cycle speed, twin-lifting capability, anti-sway, etc.

P R I N C I P L E S O F P O R T P E R F O R M A N C E M O N I T O R I N G | 34
Average Number of Gantry Cranes per Ship – Less than 250 moves/call 1 crane
Average Number of Gantry Cranes per Ship – 250-800 moves/call 1.75 cranes
Average Number of Gantry Cranes per Ship – More than 800
moves/call
2.5 cranes
[a] Time to Start Operation = First Line to First Box.
case in more competitive settings involving larger ports, we suggest that the operators will submit “raw” operations reports with original data and the performance indicator calculations to be done by the APN. The operations reports could be those already used by port operators to avoid the burden of generating an additional set of reports for regulatory purposes.
The main advantage of obtaining operations reports is the ease of verifying their correctness. For example, it is easy to check the starting time of a ship or the time the gate was open in the morning. Another advantage is that having the raw data will assist APN in studies and analyses required in support of its planning and administrative roles.
VESSEL AND GATE OPERATIONS REPORTS
Flow Reports As discussed above, a useful presentation of a marine terminal is as a network of stock and flow components. The flow-related performance indicators measure the productivities of the flow’s moving components. The data required to calculate these indicators can be sourced in two basic flow-depicting reports:
• Ship or Vessel Operation Report – A summary of all the times, events and cargo types and quantities for each ship handled at CHP; and
• Gate Operations Report – A summary of all the times, events and cargo types and quantities for each truck handled at CHP.
The Ship Operating Report should be submitted per ship, encompassing the entire time that the ship spent at the port (Port Time), which can include several days. The Gate Operations Report should be submitted on a daily basis. These two reports provide all the data required for calculating berth, gang and gate productivity performance indicators as defined in Chapters II, III and IV. To the best of our knowledge, operations reports are not presently submitted to APN either in PAP or in CHP.
Ship (Vessel) Operation Report Figure 6 shows a typical Vessel Operations Report used by the operator at a major container terminal in Colombia. The information in this report is mostly automatically sourced via the computerized Terminal Operation System (TOS) and partially through manual reporting. The manual reporting relates to ship times. The report includes data for both Berth and Crane Productivity indicators.

P R I N C I P L E S O F P O R T P E R F O R M A N C E M O N I T O R I N G | 35
Figure 6. Ship (Vessel) Operation Report
Gate Operation Report Figure 7 shows a typical gate operations report. As the Figure shows, the transactions could involve more than one box (e.g., two import 20-ft boxes) and more than one direction (e.g., deliver export and pick-up export).

P R I N C I P L E S O F P O R T P E R F O R M A N C E M O N I T O R I N G | 36
Figure 7. Gate Operations Report
Stock Reports The stock reports, such as berth utilization, truck que, yard inventory, etc., do not require additional reports but can be easily derived from flow reports: the ship and gate operations reports. Stock is equal to the difference between the flows. For example:
Yard Inventory = Sum of In-Flows from Ships and Gate – Sum of Out-Flows from Ships and Gate
Figure 8 presents a sample yard inventory report.
Note: “Mty” refers to empty containers.
Daily Gate ReportOpen 7:00
Daily Gate Report: 1 - 2 - 2017 Close 19:30
Wait Turnaround
Arrived In Out Minutes MinutesFull-
InFull-Out
Mty-In
Mty-Out
1 12345ABC 7:00:00 AM 7:10:00 AM 8:00:00 AM 10 50 12 12345ABC 9:03:00 AM 9:05:00 AM 10:00:00 AM 2 55 13 12345ABC 11:00:00 AM 11:30:00 AM 12:00:00 PM 30 304 12345ABC 11:09:00 AM 11:30:00 AM 1:15:00 PM 21 105 2 25 12345ABC 12:00:00 PM 2:40:00 PM 5:00:00 PM 160 140 1 16 12345ABC 2:00:00 PM 2:40:00 PM 3:00:00 PM 40 20 17 12345ABC 3:00:00 PM 3:00:00 PM 5:59:00 PM 0 179 1 18 12345ABC 4:00:00 PM 4:30:00 PM 5:00:00 PM 30 30 19 12345ABC 5:00:00 PM 6:30:00 PM 7:00:00 PM 90 30 1
101112
Truck NumberTransactionsTimes

P R I N C I P L E S O F P O R T P E R F O R M A N C E M O N I T O R I N G | 37
Figure 8. Ship (Vessel) Operation Report
200 30 500Total Dry Reefer Empty Dry Reefer Empty
Starting 322 100 22 200 50.0% 73.3% 40.0%2/1/2017 350 120 30 150 60.0% 100.0% 30.0%2/2/2017 304 135 29 140 67.5% 96.7% 28.0%2/3/2017 281 106 26 149 53.0% 86.7% 29.8%2/4/2017 272 97 26 149 48.5% 86.7% 29.8%2/5/2017 285 110 26 149 55.0% 86.7% 29.8%2/6/2017 279 104 26 149 52.0% 86.7% 29.8%2/7/2017 294 119 26 149 59.5% 86.7% 29.8%2/8/2017 309 134 26 149 67.0% 86.7% 29.8%
…2/28/2017Average 327 127.5 29.5 145 63.8% 98.3% 29.0%
Note: Dry and Reefer only include full boxes
Yard Inventory Report
DateInventory
y p y Utilization

P R I N C I P L E S O F P O R T P E R F O R M A N C E M O N I T O R I N G | 38
HAITIAN CONTEXT
This section reviews the present operational reporting system of CHP and other of Haiti’s container terminals and the proposed performance monitoring indicators in the draft concession contract. Our intention here is to assess whether the performance indicators proposed in the contract can provide APN with the adequate operational data required to fulfill its functions of regulation, administration and planning. This is followed by recommendations in the subsequent chapter.
CURRENT SITUATION AT CAP HAITIEN PORT
Terminal Facilities and Equipment CHP’s present berth (dock) consists of 2 sections: (a) 250-m long commercial; and (b) 115-m cruise section perpendicular to the commercial section. There is currently no dedicated container berth at CHP. The commercial berth’s overall length is sufficient for accommodating 2 small containerships similar to those now calling CHP. The total terminal area is 5.5 ha, including a dedicated container yard (CY) of about 1.7 ha. The CY is operated by Cap Terminal under a long-term lease contract. Cap Terminal also has the right to handle all the containerships at the public berth. Cap Terminal’s CY is accessed via a dedicated container gate. Another gate is used for the general-cargo and domestic terminal. The commercial berth also has a small Ro/Ro protrusion.
The future container terminal includes a dedicated, single marginal berth of 150 m, with 2 mooring dolphins extending 30 m on each side. The total vessel breasting length is 210 m (150 + 30 + 30). The CY area is about 3 ha. No future expansion plans are indicated. Presumably, the proposed terminal’s capacity is expected to be sufficient for the long future. The terminal area includes 1.2 ha of undeveloped area. Any expansion beyond it would be expensive, requiring reclamation. Likewise, extension of the dock would require expensive, deep-water construction.
Cap Terminal has a single crawler crane (American, 225 ton), used mainly for handling Antillean ships; the CMA-CGM ship uses its own gear. The CY is served by 3 top-loaders.

P R I N C I P L E S O F P O R T P E R F O R M A N C E M O N I T O R I N G | 39
The planned container terminal will have a single mobile harbor crane (MHC). MHCs are common in small container terminals, including the two used in PAP area.
Shipping Lines, Throughput and Productivity The present CHP container terminal receives two weekly calls by Antillean Line (Miami) and CMA-CGM (Kingston). Antillean Line operates small gearless ships, the largest of which is 84-m LOA with 161 TEU capacity; CMA-CGM operates a larger, 123-m LOA, 677-TEU capacity ship equipped with 2 x 45-ton cranes.
CAP’s current throughput is estimated at about 10,000 TEUs, with forecasts indicating an increase to 18,000 TEUs by 2020 and 22,000 TEUs by 2025.32 The number of moves per call, referred to as call size, ranges from 50-80 moves/call and the productivity ranges 10-12 moves/hour.33 Accordingly, the vessels typically stay 4-6 hours at the port.
Operations Reporting System Most container terminals employ highly-sophisticated and fully computerized systems for collecting and processing operational data, defined as TOS. The main advantage of the computerized TOS is the ability to electronically transfer data, using Electronic Data Interchange, including ships’ manifests and respective bills of ladings. The basic TOS is an inventory management software. The more advanced TOS has additional modules for operations planning of both vessel stowage and yard stacks, providing the so-called job ordering or sequencing. Most TOSs also have built-in performance monitoring modules, including automated calculation of performance indicators.
The present level of activity at CHP, as seen above, is quite small and, according to Cap Terminal, does not justify the investment in a computerized TOS. The operations data are therefore now managed manually. Likewise, the transfer of operational data is not an issue today since APN does not require it and Cap Terminal does not provide operational data to the local APN. The operational data that APN now compiles is based on the manifest obtained from ship’s agents and Customs. Accordingly, APN only publishes a monthly statistical report including throughputs and number of calls by cargo and vessel type. These data are limited and not sufficiently detailed for calculating performance indicators.
32 According to AECOM/IHS quoted at the IFC’s project description, 2015.
33 The productivity referred to in this chapter and the following ones concerned with other container terminals follows the definition of NET productivity, or first-to-last box (box-box).

P R I N C I P L E S O F P O R T P E R F O R M A N C E M O N I T O R I N G | 40
EXAMPLES FROM OTHER HAITIAN PORTS
Port Au Prince -- CPS
Terminal Facilities and Equipment The PAP container terminal includes the North Pier and the CY behind it. The North Pier was recently rebuilt after the destruction by the 2010 earthquake, with a total length of 415 m, sufficient for handling 2 or 3 vessels simultaneously. The pier belongs to APN and is operating as a public pier, available to any port operator (stevedore). In reality, it is solely used by CPS, which owns the CY adjacent to it, with a total area of about 50 ha.
Current ship-handling equipment includes 3 MHCs (Terrex – Gottwald, 125 ton, Model 6 G HMK 6507, two-rope-grab). All cranes belong to CPS. The CY is served by a combination of 22 top-loaders and reach-stackers.
Shipping Lines, Throughput and Productivity The terminal is served by many lines, among them Maersk, MSC, Crowley, Zim, CMA-CGM, Hamburg Sud and CFS, a regional feeder line. The total throughput is about 60,000 TEUs. Call size widely varies from 80 moves/call for Antillean to 400 moves/call for the larger shipping lines. A recent MSC vessel handled 1,200 moves, mostly empty containers accumulated from previous voyages. Most vessels are served by 1 crane with productivity ranging 20 – 30 moves/hour.
The vessel handling operation is 24/7, but the gate hours, dictated by Customs, are usually only 8 am – 4 pm. As needed, the in-gate, for delivering exports to the terminal, can be open until 8 pm. Truck turn time is short, at 15 minutes, as long as the required clearances are properly provided. However, this often is not the case due to incomplete documents and clearances.
Operations Reporting System CSP employs a computerized TOS, provided by OCTOPI, a start-up software company based in Miami. OCTOPI is a web-based, low-cost TOS, requiring minimum hardware equipment at the terminal. Much like the more established TOS, OCTOPI allows the terminal operator to electronically accept and send data (EDI) using common file formats such as the XMO, used by Customs, BAPLIE, used by shipping lines, and others. The TOS also can interface with the terminal’s accounting system, providing information for billing.
OCTOPI’s main input/output device is hand-held tablet computers. For example, during the vessel handling process of import container a tallyman carrying a tablet is stationed alongside the vessel. The tallyman identifies each box upon its landing on shore, compares the container number to that provided by the manifest and already available on his tablet, confirms its discharge, inspects the integrity of the box and copies its seal number to the tablet. A second data point is provided by a CY gate clerk where the box is stacked, who also adds the box into the terminal inventory. Currently, box location is organized according to “zones” but, if necessary, it can be detailed by slot number in each zone. Each recording of event (transaction) is automatically stamped with the time in which it occurred.
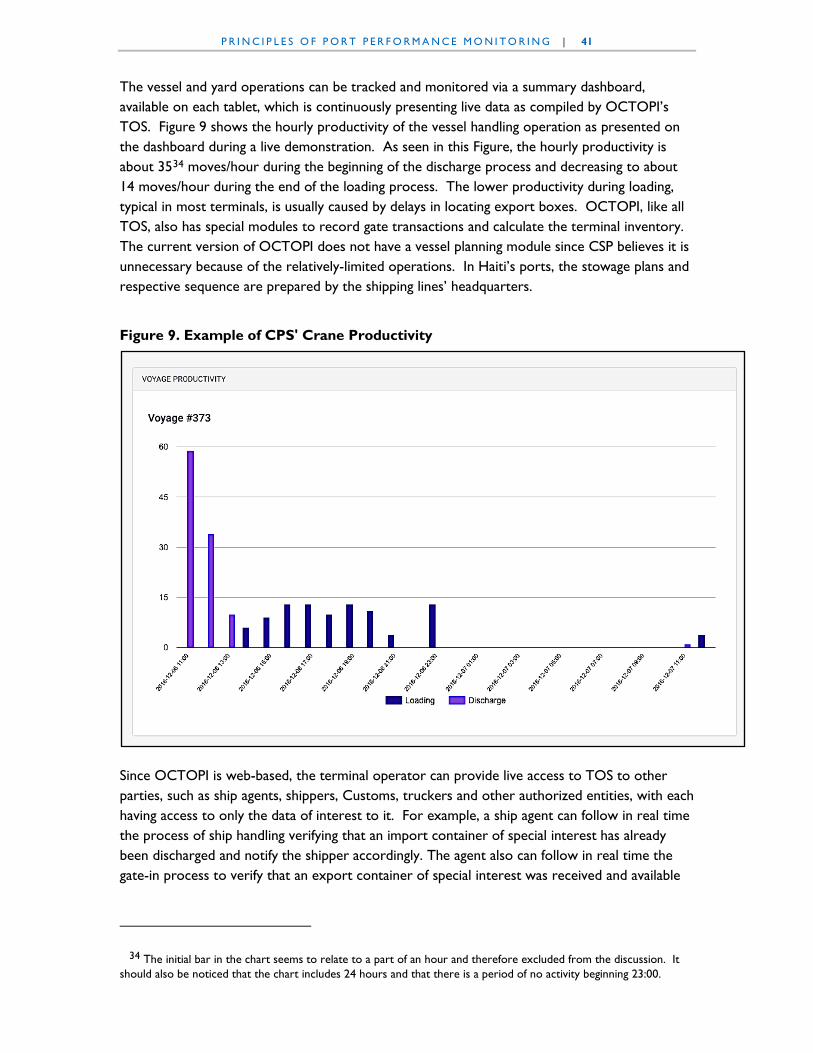
P R I N C I P L E S O F P O R T P E R F O R M A N C E M O N I T O R I N G | 41
The vessel and yard operations can be tracked and monitored via a summary dashboard, available on each tablet, which is continuously presenting live data as compiled by OCTOPI’s TOS. Figure 9 shows the hourly productivity of the vessel handling operation as presented on the dashboard during a live demonstration. As seen in this Figure, the hourly productivity is about 3534 moves/hour during the beginning of the discharge process and decreasing to about 14 moves/hour during the end of the loading process. The lower productivity during loading, typical in most terminals, is usually caused by delays in locating export boxes. OCTOPI, like all TOS, also has special modules to record gate transactions and calculate the terminal inventory. The current version of OCTOPI does not have a vessel planning module since CSP believes it is unnecessary because of the relatively-limited operations. In Haiti’s ports, the stowage plans and respective sequence are prepared by the shipping lines’ headquarters.
Figure 9. Example of CPS' Crane Productivity
Since OCTOPI is web-based, the terminal operator can provide live access to TOS to other parties, such as ship agents, shippers, Customs, truckers and other authorized entities, with each having access to only the data of interest to it. For example, a ship agent can follow in real time the process of ship handling verifying that an import container of special interest has already been discharged and notify the shipper accordingly. The agent also can follow in real time the gate-in process to verify that an export container of special interest was received and available
34 The initial bar in the chart seems to relate to a part of an hour and therefore excluded from the discussion. It should also be noticed that the chart includes 24 hours and that there is a period of no activity beginning 23:00.

P R I N C I P L E S O F P O R T P E R F O R M A N C E M O N I T O R I N G | 42
for ship loading. If required, using OCTOPI, the terminal could also provide APN access to operational data.
Port Lafito
Terminal Facilities and Equipment The container terminal, located about 20 km north of PAP, mainly serves the PAP area and competes with CPS. The terminal is on 300 ha of private waterfront land owned by the GB Group. The current container terminal includes 400 m of marginal berth with 12.5 m depth alongside. There are development plans to extend it to 900 m. The CY is currently at about 13 ha, but was to be doubled to 26 ha by the end of 2016.
The main equipment includes 2 MHCs (Leibherr LMH 420, 125 ton), 2 Reach Stackers and 2 Top Loaders. The MHCs can handle containers, general cargo and bulk cargoes.
Shipping Lines, Operations and Throughput The main shipping lines calling Lafito include Seaboard, with 3 weekly calls, and CFS with 2 weekly calls. Seaboard is a major regional line, focusing on US trades with Caribbean islands and Latin America. CFS is a feeder with its hub in Kingston, Jamaica, mainly handling Zim and Evergreen. Annual throughput is about 45,000 TEUs. The terminal also handles general cargo and, in the future, bulk cargoes.
The terminal is new. It was officially opened for operations on June 2015 with the first vessel call, by the 170-m LOA, 1,732-TEU Seaboard Marine’s Gluechsburg. This ship remained the largest ship calling there.
The current ship-handling productivity, according to Lafito management, averages 27 moves/hour. Since only one berth is presently operational, vessels usually are handled by 2 MHCs, resulting in net berth productivity of 27 x 2 = 54 moves/hour. Accordingly, the berth time of a typical ship with a call size of 200-300 moves/call is 4 – 6 hours. The largest call sizes recorded for Seaboard ships reached 500 moves, consisting mostly of empty boxes.
Vessel handling at berth is non-stop or 24/7, with the work organized in 2 x 12-hour shifts. The gate is only open from 8 am to 4 pm as dictated by the availability of Customs. The truck turn time is about 1 hour, but is expected to be shortened to 20 min in the future.
Operations Reporting System Port Lafito is managed by the US-based SSA, a global port operator. In Lafito, SSA uses a TOS developed by its subsidiary Tideworks Technology, which also is used by about 50 terminals worldwide. Tideworks’ TOS package includes a core, inventory-management module, identified as Tideworks’ Mainsail Vanguard Core TOS. Additional modules include: Forecast web portal, Spinnaker Planning Management System and its Traffic Control equipment dispatch system. In the future, the TOS will also control an off-dock CY at Chancerelle that Port Lafito manages.

P R I N C I P L E S O F P O R T P E R F O R M A N C E M O N I T O R I N G | 43
Currently, the TOS in Port Lafito only includes vessel and gate operations, as is the case with CPS. Since there is no yard congestion, the CY is organized according to zones and categories and there is no need for accurate yard locations (by slot). Likewise, according to the terminal manager, there is no need for the TOS’s forecast and voyage planning modules at this stage. The operations data compiled and analyzed at Port Lafito are not shared with APN.
Terminal Varruex
Terminal Facilities and Equipment Terminal Varreux (TEVASA), owned by the MEVS Group, is currently a multipurpose terminal handling mainly petroleum products and general cargo. The general cargo is handled at a finger pier of 132 x 15 m (length x width), providing berthing for 2 vessels, each on one side. The depth alongside the outer berth is 9.5 m and the inner berth 8.5 m. The total waterfront area is 160 ha. The main equipment is a crawler crane (500 P&H).
TEVASA, jointly with Bollore, a French global port operator, has developed plans for a new container terminal. The terminal will be located on reclaimed land. The initial phase will include a single 200-m berth and 10-ha CY served with 2 MHCs. There also are long-term plans for a larger container terminal with gantry cranes.
Shipping Lines, Throughput and Productivity The current facilities only handle general cargo.
ASSESSMENT OF PROPOSED PERFORMANCE MONITORING AT CHP
Performance Indicators Proposed for PPP
Crane Productivity We noted above that performance indicators usually encompass three areas: Productivity, Utilization, and Level of Service (LOS). Concession contracts, however, commonly only include LOS performance indicators. We also note that concession contracts often specify low values for these performance indicators, considered as “acceptable minimum” standards. This is because concession transaction advisers generally are interested in not raising the bar on performance indicators too high for potential interested operators, which may result in penalties. As a result, performance indicators usually far exceed the standards stipulated in concession contracts. For example, the contractual level of mobile crane productivity in the example provided above is 14 moves/hour, while the actual results recently achieved at this terminal have averaged about 25 moves/hour, or almost 80% higher than the contractual level. As seen in the example of Lafito above, it seems that similar productivities also are presently achieved in Haiti’s terminals.
Table 6 presents the performance indicators for CHP that are specified in the draft concession contract. The proposed monitoring system is limited to two performance indicators: crane

P R I N C I P L E S O F P O R T P E R F O R M A N C E M O N I T O R I N G | 44
Table 6. Proposed Performance Indicators in Draft PPP Contract
Indicator Minimum Service
Requirement Penalty (in $)
Crane productivity for Mobile Harbor Crane
(“MHC”), defined as total handling volumes per
crane, i.e. number of containers moved, divided
by total crane hours from twistlock closing on
1st moved container to twistlock opening on
last moved container without any further
reductions.
Monthly average:
First 24 months of
operation: 12
moves/hour
From 25th month of
operation until end of
contract period: 15
moves/hour
10 USD per container for every
month with crane productivity
below Minimum Service
Requirement
Average maximum truck turn-around time at
the Terminal from entry to exit of the Terminal
when delivering or picking up a container
(excluding customs clearance, documentation
and weighing)
Monthly average:
45 minutes
10 USD per container for every
month exceeding the average
maximum truck turn-around time
Source: Project Agreement V2.
productivity and truck turn time. The first performance indicators relate to the LOS for shipping lines and the second to LOS for truck lines. These proposed indicators follow the “acceptable minimum” concept; for example, crane productivity is specified as 12 moves/hour for the first two years and 15 moves/hour thereafter and both values are low considering the small size of the vessels calling CHP.35 Moreover, the draft contract’s requirement only for monthly averages limits the usefulness of this data item for monitoring operational performance as well as for the administration and planning roles that APN will undertake.
The crane productivity as defined in the current draft concession contract relates to a single MHC and does not take into consideration the productivity of vessels’ cranes. This is a result of a stipulation in the contract that requires shipping lines to use the shore-based crane as a priority, with the intention of providing the terminal operator with sufficient revenues to recover its investment in the MHC. Currently some shipping lines such as CMA-CGM call at CHP with geared vessels, and prefer to use their ship cranes. Consequently, there is a high probability that during the concession contract period, ship cranes may be used in addition to the MHC, to enhance the overall ship-handling productivity, or when the MHC is serving another vessel. Hence, it is important for APN to monitor berth productivity in addition to crane productivity. The target value proposed for the crane productivity indicator, as will be discussed in the next paragraphs, should be based on actual performance at present of Haitian terminals, along with productivity data from similar terminals in the region (if available) with some adjustments to reflect CHP’s specific situation.
35 Handling small vessels involve a short boom trajectory and limited, if any, alongside traveling.

P R I N C I P L E S O F P O R T P E R F O R M A N C E M O N I T O R I N G | 45
Truck Turn Time The truck turn time indicator specified in the current draft concession contract is a maximum monthly average of 45 minutes. This indicator, as proposed, has no reference to the type of gate transaction; it is a monthly average of all transactions. Moreover, the truck turn time refers to the time recorded at the terminal gate and has no reference to waiting time outside of the gate or pre-gate time. Also, it is unclear how in practice these times will be recorded because the time for “customs clearance, documentation and weighing” should be deducted according to the contract’s definition. This requirement complicates the calculation of truck turn time, which typically includes these processes. A further issue is that transactions related to empty boxes are not mentioned in the draft contract. Additionally, container and non-container traffic may share a common gate, so delays may not be attributable to the operator, but to trucks accessing the commercial berth.
There is a wide difference in truck turn times depending on the type of transaction, which can be categorized into 4 basic gate transactions (picking up an import container, bringing in or dropping off an export container, picking up an empty container, and returning an empty container). The most complicated transactions are the combinations, especially those involving two full containers: Export-In and Import-Out by the same truck, which typically takes 3 or 4 times the duration of that of the simplest transaction, usually the Empty-In. Lumping all transactions into one indicator as a monthly average, without detailing even the number and type of transactions, limits the ability of APN to properly monitor gate performance. It also is too general and provides insufficient operational information required by APN to fulfill its planning, regulation and administration roles.
Altogether, the two indicators included in the Contract would perhaps be sufficient for PPPs of mature terminals in a competitive market setting, but not for the specific case of APN in CHP as discussed below.
The Specific Situation at CHP
Monopolistic Setting
The CHP container terminal faces little competition, mostly from other Haitian terminals and, to a lesser extent, the Dominican Republic’s terminals. PAP is located about 250 km away from CHP. In our interviews with PAP terminals we found that the cost of trucking from PAP to CHP is about $1,500 per container under current road conditions whereby a roundtrip requires 2 days. Therefore, trucking local containers (or other cargoes) from PAP to CHP is a realistic option only under unusual circumstances. The barrier of high trucking costs to/from CHP will not change much with the new road, since the 500-km roundtrip cost will probably remain around $700 – 1,000 per container. Another factor protecting CHP from PAP competition is its exemption from the “Mandatory Terminal Surcharge” on some imports (around $155/TEU on average) charged at PAP.
CHP faces limited competition from the Dominican Republic ports, currently handling some of Haiti’s exports due to favorable ship rotations. The average distance between Dominican ports

P R I N C I P L E S O F P O R T P E R F O R M A N C E M O N I T O R I N G | 46
and CHP is similar to that between PAP and CHP, with the addition of the time and cost associated with border crossing. Hence, for all practical purposes, Cap Haitien regional cargo can be considered as captive to CHP port.
CHP’s monopolistic setting is distinct from the competitive setting in PAP. In the PAP area, there are already two modern terminals, CPS and Lafito, to which a third one (Varreux) will soon be added. All three terminals serve the same regional cargo and therefore can be considered as close competitors and all seem to have excess capacity. Further, the proposed CHP container terminal is much smaller than PAP’s existing and future terminals and has limited space available for expansion. Moreover, it is unlikely that in the near future CHP will be able to have two container berths (and hence have intra-port competition), highlighting the importance of monitoring performance.
APN’s Role at Cap Haitien port As part of its landlord role and related regulatory and planning functions, APN in CHP will continue providing anchorage, mooring, pilotage, tuggage, and other services using its own personnel and/or contractors.36 APN has a similar role in PAP; however, in the case of CHP, because of the terminal’s small size and the close adjacencies of public and private sections in it, the possible impact of APN-provided services on operational performance is much higher. For example, delays in pilotage for a single-berth terminal are much more impactful on berth utilization and related LOS than on a two-berth terminal.
There also is a similar case with APN’s future role in planning. Because of CHP’s small size and the limited availability of space for expansion, APN should carefully monitor the capacity utilization situation. This, in turn, requires periodic compilation and assessment of operational data, especially those related to berth and CY utilization levels. It also requires close monitoring of berth productivity, since it is indirectly affecting berth capacity.
External Factors Affecting Performance CHP’s operational performance may be affected by factors beyond the control of the container terminal operator. For example, based on interviews with PAP terminals, delays and longer truck turn times are mostly caused by problems with clearances and documentation. These problems also are reflected in the exclusion of such delays in calculating the Contract’s Turn Time indicator. Another possible cause of long turn times is limited gate hours; extending them beyond the present 8 am-4 pm period mainly depends on Customs. Another example is berth utilization, an important determinant of capacity, which depends on prompt pilotage services and, once the vessel is moored, prompt clearance by respective governmental agencies. Moreover, factors outside the control of the terminal operator could affect even the productivity during the ship handling process. A common example is delays related to the late arrival of export containers.
36 The draft PPP contract stipulates this function: “Berth allocation and traffic management on all port areas outside the Terminal (including but not limited to the new commercial quay) is the responsibility of APN / harbor master of the Port.”

P R I N C I P L E S O F P O R T P E R F O R M A N C E M O N I T O R I N G | 47
In the above-mentioned examples, the terminal operator has little or no control over some of these issues. Still, we would expect the terminal operator to be actively involved in efforts to mitigate them. APN’s ability to ensure smooth operations is much larger in these situations than that of the operator. For example, APN could negotiate with Customs regarding gate hours, educate truck drivers regarding proper documentation, approach shippers regarding excessive dwell times, etc. However, in order to be able to intervene in these situations, APN needs to have access to detailed operational data, well beyond the contract’s indicators, which include only monthly averages of crane productivity and truck turn times.
Non-Containerized Cargo and Coordination Between Operators The current CHP layout consists of three sections:
• Privatized container terminal; • Public (commercial) general-cargo terminal; and • Domestic (cabotage) terminal.
The concession contract relates only to the CHP container terminal and only to its terminal area (not dock). The operation of the other port areas is still undetermined at the time of this report. Options include public management (by APN) or contracting a private sector operator. As APN has not been engaged in operations for many years, the latter is more likely.
According to the Contract, the container terminal operator will have the exclusive right to handle all containers, presumably referring to those carried on-board ships with cellular design (containerships). The concession contract’s intention is that all containerships will be served at the dedicated container dock using the MHC positioned there, with all boxes transferred via special bridge to the adjacent, dedicated container yard for storage. If the single container berth is occupied, the container terminal operator could use the general-cargo, public dock to handle containerships, assuming it is unoccupied by other vessels. Presumably, a similar arrangement also be made with general cargo ships; that is, if the single general cargo dock is occupied while the container dock is free, general-cargo ships could be handled at the container dock. The need to share docks requires coordination and may, at times, create friction in cases of competing demands for berthage. Another point of potential friction between operators is the common gate that both containerized and other cargo will have to share according to the proposed port layout, although there is an option for separate gates. Active APN involvement in managing the public sections and coordinating the operations between the private and public sections will be required. Again, the situation in CHP is quite distinct from that in PAP, whereby terminals operators have de-facto control of their entire facilities, with no need to coordinate with other terminals and no need for APN’s intervention.
P R I N C I P L E S O F P O R T P E R F O R M A N C E M O N I T O R I N G | 48
CONCLUSIONS AND RECOMMENDATIONS
This section provides conclusions and recommendations for port authority staff to take into consideration in undertaking their regulatory functions.
SPECIFIC REQUIREMENTS FOR MONITORING PORT PERFORMANCE AT CAP HAITIEN PORT Based on the particular CHP situation, limiting the operational data provided to APN by the container terminal operator to monthly averages of the two performance indicators proposed in the draft concession contract does not sufficiently address CHP’s specific needs. CHP’s situation mandates closer APN involvement in operations monitoring, well beyond obtaining monthly averages of two performance indicators and imposing penalties in case these averages are below “acceptable minimum” levels. In this respect, APN should be interested more in outlier cases than in averages—which requires access to more granular data.
For example, being alerted by a specific case of unusually-long truck turn, APN should seek explanations from the terminal operator and, if needed, the related Customs officer, ship agent, truck driver or even shipper. This also should be the case if ship’s port time, which encompasses the entire, buoy-in to buoy-out process, is unusually long. In this case, the data should allow APN to assess whether it is because of excessive waiting for pilot, waiting for berth, waiting at berth, low crane productivity, delays in arrival of export cargo, etc. It should be noticed that among the above-listed causes, the terminal operator only directly controls the crane productivity, while the rest are outside its control. It should also be noted that port time, the performance indicator of most interest to the shipping line, is NOT included in the concession contract since it is not controlled by the terminal operator. Our aim is to enable APN to have the data required to track down and review the entire port process and identify, together with the various parties involved in the process, the measures required to rectify it.
In summary, we believe that the role of APN in the specific case of CHP should not be a “performance police,” but should be an informed landlord of a public port facilities, seeking to actively monitor the operational performance of its contractors to insure the productive use of
P R I N C I P L E S O F P O R T P E R F O R M A N C E M O N I T O R I N G | 49
public properties for the benefit of its ultimate customers: shipping lines and shippers. We are aware that our recommendation is somewhat unusual -- but such is the case of CHP.
ACCESS TO THE MAJOR OPERATIONS REPORTS GENERATED BY THE TOS APN’s involvement in active monitoring of the operations of the CHP container terminal requires that the terminal operator provides APN with detailed operational data far beyond the two performance indicators included in the Contract. More specifically, the operator should provide APN with the:
• Vessel Operations Report; • Yard Inventory Report; and • Gate Traffic Report.
Those reports are automatically generated by the TOS and can be shared electronically in real time with APN via Electronic Data Interchange.37 Moreover, most TOSs have built-in modules for calculating performance indicators and presenting them in graphical dashboards and also can be programmed to “flag” unusual cases requiring special attention. Accordingly, our recommendation is that CHP’s future container-terminal operator will provide APN with access to its TOS-generated data. This access should be limited to the sections related to operational performance. APN, in turn, should keep this information confidential because it might be commercially sensitive. To re-emphasize, the transfer of operational data, including automatically-calculated indicators, will not require any paperwork and manual transfer of periodic reports.
Schedule 6 of the draft concession contract compels the terminal operator to install a TOS. We reemphasize the need for a computerized TOS as a contractual obligation for the operator (like the requirement of having a MHC) and propose to further detail the requirements for the TOS including the necessary interface for remote access by APN. If there is a second concession contract for a non-containerized cargo operator, the operator should similarly be required to use a TOS and provide APN with data access.
In summary, it is essential that CHP’s private operators maintain computerized TOS and provide APN with access to the operations performance data.
PROPOSED EXTENDED LIST OF PERFORMANCE INDICATORS TO BE GENERATED BY THE TOS The following paragraphs provide a brief summary of the required data and respective KPIs related to the performance of the three main container terminal components: berth, yard and gate.
37 In Port-au-Prince the terminal operator CPS already provides ship agents with “realtime” access to operational data, as part of its Octopi TOS, showing for example a chart of crane productivity automatically calculated during the handling process of an actual ship call.

P R I N C I P L E S O F P O R T P E R F O R M A N C E M O N I T O R I N G | 50
Berth Performance Indicators Berth Performance Indicators relate to the ship handling process, including required data items. These items are usually found at the Vessel Operations report. Table 7 provides definitions for suggested berth performance indicators.
Table 7. Berth Performance Indicators
Indicator Unit of Measure Description/Definition
Port Time Hours Buoy In to Buoy Out
Berth Time Hours First Line to Last Line
Work Time Hours First Box to Last Box
Number of Crane Moves per Call Moves Including Re-Handles
Net Berth Productivity Moves/hour Moves/Work Time
Net Berth Productivity at present in CHP is equivalent to the Crane Productivity indicator included in the concession contract since both relate to the operations of the single MHC serving ships calling CHP. However, in the future, additional MHCs could be deployed and/or ships could work with both ship’s gear and MHC. In this case, the contractual indicator will have to be modified to distinguish between the productivities of the different cranes. A typical Vessel Operating Report38 (see Figure 5) includes all the data items required for calculating the indicators included in Table 7, although some of the data items (e.g., Buoy In time) are usually sourced from external parties (e.g., harbormaster or ship agent). It is suggested that CHP’s operator also will obtain these data items and be required to incorporate those into the TOS. Another more advanced option is that these data will be provided by the Port Captain directly via Electronic Data Interchange.
The operational data per ship should be aggregated into a monthly report, including a calculation of the monthly average of Net Berth Productivity, the equivalent to the crane productivity draft contract’s required indicator. The aggregation and averaging can be done automatically by TOS. In addition, the TOS can perform statistical analysis, relating productivity to ship size, call size, indicating high and low performance for the month and overall. The analysis also could flag outliers according to pre-determined criteria to draw the attention of the terminal operator and APN.
Another indicator that should be calculated on a monthly basis is:
Berth Utilization (%) = Total Berth Hours per Year with Ship at Berth / Calendar Hours
Berth utilization is an important determinant of capacity and should be monitored by APN in its role related to terminal planning. In the particular situation at CHP, berth utilization is important
38 The Vessel Operating Report also serves as a basis for invoicing. The Ship Agent prepares a similar report called Statement of Facts, describing the events and times related to the port call.

P R I N C I P L E S O F P O R T P E R F O R M A N C E M O N I T O R I N G | 51
for monitoring performance and assessing capacity constraints in berths handling non-containerized or mixed cargo.
Yard Indicators The performance indicators for container yard operations are more relevant to APN’s planning roles and indirectly affect the berth and gate performance indicators included in the draft contract. The first report required here is the Daily Inventory Report, which includes the number of boxes stacked in the terminal (at a certain time, usually at the end of the previous day), categorized by type (dry/reefer, loaded/empty) and direction (import/export). As we have noted, there is no need for a manual report since TOS usually provides the data “online”.
The proposed performance indicators for the container yard performance relate to its slot utilization and dwell time, including:
Inventory (TEUs) = Average number of TEUs in the container yard
Yard Utilization (%) = Average number of Occupied TEU-slot / Total TEU-slot
Average Dwell Time (days) = by type (reefer/dry) and direction (import/ export)
As before, in addition to averages, TOS should be able to highlight outliers according to pre-determined criteria, e.g., if yard utilization reaches above 80%. In the case of dwell time, a common report (“aging”) includes a statistical distribution, e.g., the dwell days of the highest 10%, etc. In most TOSs, the above data are part of the standard package; otherwise, it requires minor programing.
Gate Indicators The daily gate report includes a summary of all gate transactions, the times they began and took to complete. There are four basic single transactions: Import-In, Export-Out, Empty-In and Empty-Out; and three double transactions: Import-In+Export Out, Empty-In+Export-Out, and Empty-In+Empty-Out. The last transaction relates to either different types of boxes or different shipping lines. The daily gate report should be aggregated on a monthly basis and the average monthly time of all transactions calculated as required by the Contract; most of the gate information is collected as required by the International Ship and Port Facility Security (ISPS) convention. We suggest expanding the performance indicator required by the draft contract to include, in addition to the all-average truck turn time, a breakdown by transaction type. Accordingly, the suggested performance indicator is:
Truck Turn Time (minutes) – The average time per truck (per transaction) since starting the gate-in process until completing the gate-out one.
In addition to averages, a related analysis could include a distribution similar to that mentioned for dwell time, focusing on highlighting outliers. The distribution of gate transactions should also be by the hour of the day, days of the week, etc., in order to identify peak or idle periods.

P R I N C I P L E S O F P O R T P E R F O R M A N C E M O N I T O R I N G | 52
We learned from interviews that there are quite a few cases where gate transactions cannot be completed (“trouble cases”). Hence, we suggest that in addition to reporting completed transactions there will be a daily list of incompleted ones, specifying reasons for why they occur. This can point APN in the right direction for mitigating or resolving issues toed to incompleted transactions.
Important information for gate and yard performance is trucks’ waiting time prior to being processed at the gate, usually defined as pre-gate waiting. Currently, none of Haiti (and very few worldwide) terminals collect these data since there is no reliable source for it. However, modern TOS could allow collecting this data via smart phones, which might be the case with CHP’s TOS. The suggested performance indicator in this case is:
Pre-gate Truck Waiting (minutes) – The average waiting time per truck since arrival to the queue until gate processing begins
In summary, it is essential that APN monitor berth, yard and gate KPIs in addition to the two contractually required indicators. In particular, Net Berth Productivity, Berth Utilization, Yard Utilization, Dwell Time, Truck-Turn Time by Transaction Type, and Pre-gate Truck Waiting time are important indications of port performance.
DEFINING ADEQUATE TARGET VALUES INDICATORS There are three general methods to determine desirable target values for performance indicators: past performance, theoretical modeling, and industry standards. However, none of these methods is unequivocally applicable in the case of CHP.
• Past performance cannot serve as a basis since the terminal is undergoing extensive rehabilitation, including the deployment of a modern MHC;
• Devising a theoretical model might not be justified because of the small size of the terminal; and
• Industry standards for such small, single-berth terminals are unavailable.
We suggest, therefore, to base the value of the draft contract’s indicators (and other indicators not included in the Contract) on the actual performance of PAP terminals with some adjustments. PAP terminals operate under the same general operational setting, some of them even handling the same or similar ships that call CHP. Based on these criteria, we propose to compile and analyze sample data from existing PAP and CHP terminals, the result of which will be included as initial performance indicator targets for CHP, as specified in the next chapter on User Manual).
CALCULATING PERFORMANCE INDICATORS The calculation of the required performance indicators by APN could be based on a simple computer program. The input to the program will be the Ship and Gate Operation Reports and the calculation of the performance indicators will be based on simple algebraic formulas. Since it is assumed that terminal operators will be using computerized TOSs, both reports can be produced and transferred to APN electronically. Hence, the entire process of compiling data and calculating performance indicators can be computerized. The availability of operational data

P R I N C I P L E S O F P O R T P E R F O R M A N C E M O N I T O R I N G | 53
will allow modification of the performance indicators and adjusting their standard values as needed.
In summary, APN should be able to easily calculate performance indicators based on data produced by the TOS. The Excel file accompanying this report provides a template for producing these calculations, which are further explained in the User Manual in the following chapter of this report.
INTERIM PERIOD It is our understanding that during the construction period, currently estimated at 2 years, the operations of both the container and commercial berths will be severely disrupted. For part of the time only one berth will be available serving both cargos. Moreover, the KPI proposed for the container terminal are based on the deployment of a modern MHC. Therefore, there is no point in calculating KPI for the interim period – except for training purposes. Accordingly, we recommend that APN will meet with the interim operator of the container terminal to discuss and agree on a reporting system for operational data using the forms provided in this report (or similar). It should be noted, however, that the present operator is not obligated to provide this data.
NON-CONTAINERIZED CARGO The present concession program encompass only the container terminal and only the terminal (upland) portion of it since the non-container berth will remain under the control of APN. Accordingly, the performance monitoring system only encompasses the container terminal and its operator – but not the non-container operations. The non-container operations are presently managed by ship agents and cargo owners, with each having its own system of reporting which, to our understanding is limited. It is impractical to force a uniform reporting system on the non-container operations at this point. If, however, the concession program is expanded to encompass the non-container operations, we recommend that a performance monitoring system based on indicators, similar to that described in this report for containers, be applied to the non-container operations.
MEASURING PORT AUTHORITY PERFORMANCE As earlier mentioned noted, port authorities, as public entities and as administrators of public lands and assets, should be interested in the effectiveness of its administration. Additionally, APN’s current operational services, such as pilotage and tug assist, can influence total port time and berth waiting time. While these times are accounted for in total port and berth waiting time, they are not accounted for separately in the indicators we suggested above. Keeping track of these operational services can help APN identify any deviations from expected times and to drill down for causes of unacceptable levels of performance. Table 8 identifies port authority management effectiveness indicators as well as operational ones associated with pilotage and tug assist. We have also provided a female gender inclusion indicator given Haiti’s constitutional provisions associated with gender equity.

P R I N C I P L E S O F P O R T P E R F O R M A N C E M O N I T O R I N G | 54
Table 8. Suggested Port Authority Indicators
Category Indicator Description/Rationale Calculation Periodicity
Operating Ratio
Describes the relationship between operating expenses and operating revenue. The lower the operating ratio, the fewer expense Haitian gourdes required to produce a gourde of revenue. Removing depreiation from the operating ratio provides an indication of the degree of short run controllable expenses required to produce a gourde of revenue.
operating ratio = (operating expenses minus depreciation)/revenues quarterly
Gross Labor Ratio
Describes APN's personnel costs required to produce a gourde of revenue. Personnel costs should include all employee compensation expenses, including salaries and fringe benefits. Costs for contract employees should be included as well.
labor ratio = all personnel costs/revenues quarterly
Net Labor Ratio
Describes APN's employee costs required to produce a gourde of revenue. Personnel costs should include all employee compensation expenses, including salaries and fringe benefits. Costs for contract employees should be excluded.
labor ratio = (all personnel costs - contract employee costs)/revenues quarterly
Employee Productivity (Containers per Employee)
Number of TEUs per employee examines the physical productivity of APN's labor force. Employees include all permanent, part-time, and contract employees.
employee productivity = total TEUs/number of employees quarterly
Average Container Vessel Pilot Waiting Time
Vessel operators lose time when awaiting for a pilot to board. Pilot waiting time affects both port time and berth waiting time.
Container vessel pilot waiting time = vessel arrival time at entrance bouy - time pilot boards the vessel = total waiting time/number of container vessels
weekly
Average Non-Container Vessel Pilot Waiting Time
Vessel operators lose time when awaiting for a pilot to board. Pilot waiting time affects both port time and berth waiting time. This is collected for all non-containerized vessels.
Container vessel pilot waiting time = vessel arrival time at entrance bouy - time pilot boards the vessel = total waiting time of all container vessels/number of non-container vessels
weekly
Average Container Tug Assist Waiting Time
Vessel operators lose time when awaiting for tug assist services. Tug assist waiting time affects both port time and berth waiting time. Tug assist indicator should distinguish between container and non-containerized vessels.
Tug assist waiting time = container vessel request for tug services - time last tug arrives to the vessel = total waiting time of all non-container vessels/number of container vessels
weekly
Average Non-Container Tug Assist Waiting Time
Vessel operators lose time when awaiting for tug assist services. Tug assist waiting time affects both port time and berth waiting time. Tug assist indicator should distinguish between container and non-containerized vessels.
Tug assist waiting time = non-containerized vessel request for tug services - time last tug arrives to the vessel = total waiting time of all non-container vessels/number of non-container vessels
weekly
Gend
er
Equi
ty
Female participation rate
Haiti 's Constitutional Arts. 17, 35-2, 52-3, & 276-1 provides for gender equity in governmental institutions. APN is a government entity.
Female participation rate = number of full time employees at APN/number of total APN employees
quarterly
Man
agem
ent E
ffect
iven
ess
Serv
ices
Ope
ratio
nal P
erfo
rman
ce

USER MANUAL
This chapter provides practical guidance on defining methods and processes of compiling data on the operations of CHP container terminal and the respective calculations of a set of recommended performance indicators. The section identifies the data requirements for each indicator, the source of these data items, the forms to be used for compiling these items, and the formulas for calculating the various indicators.
APN ACCESS TO TOS Our main recommendation in the previous chapters was that due to the unique circumstances of CHP, APN should be actively monitoring the operations of the CHP container terminal and, in fact, all its container terminals. Accordingly, we suggested that the terminal operator(s) provide APN with detailed operational data to enable APN to calculate a detailed list of indicators – well beyond the two indicators included in the draft concession contract. More specifically, we suggested that the operator provides APN with the operations reports that cover the main operations of most container terminals:
• Vessel Operation Report;
• Gate Operation Report; and
• Yard Operation Report.
This does not mean, however, that the operator will have to manually prepare and submit signed hard-copies of these reports to APN. The draft contract mandates that the future CHP terminal will be managed via computerized TOS and most computerized TOS automatically generate these reports. Moreover, modern TOSs will allow the terminal operator to share these reports “live” with APN via Electronic Data Interchange.
ILLUSTATIVE EXAMPLES OF CALCULATING PERFORMANCE INDICATORS The above chapters defined the recommended performance indicators that APN should be monitoring, and here we further detail the technicalities of compiling these operational data and calculating the performance indicators. The accompanying Excel file includes simple forms to collect relevant data and to calculate the indicators. The forms are populated with a simple numerical example for illustration purposes.

P R I N C I P L E S O F P O R T P E R F O R M A N C E M O N I T O R I N G | 56
A typical container terminal can be depicted as a stock and flow system with two flows: one through the berth and the other through the gate moving boxes into or out of a common stock, or a storage yard. In accordance with this depiction, we first discuss the two flows, or the berth and gate operations and their respective indicators, and then the stock and the container yard operations and respective indicators.
Table 9 presents the main data items related to CHP terminal operations to be collected, compiled and submitted to APN, along with the related PIs calculated based on these items. The first eight data items and the following three performance indicators based on them refer to each ship call. The other items refer to daily reports.
Table 9. Data Items and Performance Indicators
No. Data Item/Indicator Description Unit of Measure
1 Port Time Buoy-In to Buoy Out Hours
2 Berth Gross Time First Line to Last Line Hours
3 Berth Work Time First Box to Last Box Hours
4 Crane Work Time by Crane Type First Box to Last Box Hours
5 Call Size Number of Moves Moves
6 Crane Net Productivity by Crane Type Moves/Work Time Moves/Hour
7 Berth Net Productivity Moves/Work Time Moves/Hour
8 Berth Gross Productivity Work Time/Berth Time Moves/Hour
9 Berth Utilization Total Berth Gross
Time/Available Time
Percent
10 Truck Turn Time by Transaction Type Wait + Terminal Time Minutes
11 Yard Utilization by Box Type Occupied/Capacity Slots Percent
12 Dwell Time by Box Type Time Unload to Pickup Days
The set of data items and indicators included in Table 9 are well beyond those specified in the draft container terminal concession contract, which only included monthly averages of Crane Productivity and Truck Turn-Around Time. Our suggestion for an expanded monitoring system is in line with our view of the future APN acting as an “involved landlord”. Accordingly, we consider the indicators listed in Table 9 as an effective tool, assisting APN in fulfilling its three roles of regulation, administration and planning. Our view is distinct from the draft contract’s more traditional view of the port authority as an “uninvolved landlord”, reflected by the inclusion of only two performance indicators in the draft contract, which are only monthly averages—providing only limited insight, if any, into CHP operations. We follow below with examples of each of Table 9’s indicators.

P R I N C I P L E S O F P O R T P E R F O R M A N C E M O N I T O R I N G | 57
Berth Performance Indicators
Crane and Vessel Operation Report The Berth Net Productivity performance indicator is equal to the Crane Net Productivity indicator in situations like that expected at CHP where ships are only working with a single MHC. However, it could well be that in the future, additional MHCs and/or ships’ cranes will be deployed for ship handling. In this case, the Crane Net Productivity indicator will have to be separated from Berth Net Productivity indicator. In this case, there also will be need for collect separate data on Crane Net Productivities indicators according to different types of cranes serving ships at CHP. Hence, for illustration and training purposes, we present below two separate reports, a Crane Operation Report and a Vessel Operating Report. Typically, the Crane Operation Report is part of the Vessel Operating Report. For clarity, the two reports are presented using a simple format and a simple case of ship handling as a numerical example.
Figure 10 shows a typical Vessel Operation Report form, taken from a major regional terminal. The sample form includes all the data items and performance indicators included in Table 9. For simplicity, we decided to present here a more rudimentary version of the Vessel Operation Report along with a preliminary form of a Crane Operation Report (Figure 11).
Figure 11’s Crane Operation Report describes the operation of a single crane. Operation times included in this report and in the Vessel Operation Report usually are provided by the terminal operator. These times are taken from a log-book of the checker (tallyman, clerk) stationed on the dock nearby the crane. In most modern terminals checkers use hand-held tablet computers for reporting, whereby to each event the computer automatically attach clock time.
Note that Figure 11 is a simple form for collecting and analyzing operational data of the activities of a single crane (or gang) during one shift. The form is incorporated as one column in the Vessel Operation Report. The basis for the report is a time-log, describing the main events during the handling process of a vessel by a single crane, including their clock (continuous) times and performance, mainly the number of moves or other activities (or idling). The clock times are recorded at the end of each event which often includes a group of related activities such as discharging the 25 boxes stowed in Bay 1. For simplicity, the selected example only includes 10 events, depicting the handling of 100 moves (boxes), located in 2 bays.39 Section II. Crane Time Log & Activity of the Vessel Operation Report includes the times, activities and events during the ship-handling process of each crane. The clock time and number of moves are presented in black and the calculated data and indicators in red; explanations of the indicators calculations are in blue.
39 Moves (box handling by a crane) also include “re-handle through the dock”, considered as 2 moves, and “cell-to-cell”, considered as 1 move. Hatch-cover handling in most terminals is not considered as a move but defined as unavoidable delay.

P R I N C I P L E S O F P O R T P E R F O R M A N C E M O N I T O R I N G | 58
Figure 10. Vessel Operations Report
I. GeneralShip NameCrane NumberDateShift
II. Ship's Time LogDescription Clock ElapsedArrival at Buoy 5:00
1 Wait for Pilot 5:30 302 First Line 6:00 303 First Box 7:30 904 Last Box 15:00 4505 Last Line 15:45 456 Departure Buoy 16:00 15
Minute 660Hour 11.00
III. Crane ActivityCrane Number
MHC 1 Ship 1Crane Net-WorkTime 6.25 5.00 11.25 Unavoidable Delays 0.75 1.00 1.75 Crane Time 7.00 6.00 13.00 Avoidable Delays 1.00 2.00 3.00 Crane Gross Time 8.00 8.00 16.00
Total Moves 100 90 190Crane Net-Work Productivity 16.00 18.00 16.89 Crane Net Productivity 14.29 15.00 14.62 Crane Gross Productivity 12.50 11.25 11.88
III. AnalysisTime Breakdown:Berth Work Time 7.50 = 15:00 - 7:30Berth Occupied Time 8.25 = 15:45 - 7:30Port Time 11.00 = 16:00 - 5:00Port Access Time 2.75 = 11.00 - 8.25
Performance Indicators:Berth Net Productivity 25.33 = 190 / 7.50Berth Gross Productivity 23.03 = 190 / 8.25
Total
Hope
17-Jul-17Day
Total
Description
MHC 1, Ship

P R I N C I P L E S O F P O R T P E R F O R M A N C E M O N I T O R I N G | 59
Figure 11. Crane Operations Report
As seen in the simple example included in Figure 11’s Crane Operations Report, the crane productivity varies during the handling process according to type of activity. Usually, unloading (discharge) is faster than loading and handling deck boxes is faster than handling hatch boxes. Section III. Analysis, Time Breakdown includes a summary of the elapsed times grouped according to 3 types of activities:
• Working – Box handling;
• Unavoidable Delays -- Open & close hatch-covers, move crane to/away from vessel and alongside dock, changing spreaders, bad weather, etc.; and
• Avoidable Delays -- Late arrival of labor, breakdown of equipment, waiting for orders, waiting for boxes, etc.
Figure 11’s Section III. Analysis, Performance Indicators includes a calculation of four indicators, based on data already compiled in other sections of the report. The indicators include three levels of crane productivities along with an indicator related to crane’s time utilization. The Crane Net-Work Productivity and Crane Time / Shift Time are not included in the list of indicators recommended included in Table 9. Nevertheless, we suggest to collect and compile these indicators because of the important insight they convey.40
40 For example, the Crane Net-Work Productivity is most comparable regarding crane-operator proficiency, since it excludes delays over which the crane operator has no control.
I. GeneralShip NameCrane NumberDateShift
II. Crane Time Log & ActivityTime (min.) Import Export Total
Work 20 40 20 40 MovesNet Unavoidable Avoidable Moves Moves Moves Moves Moves Moves/Hr
Gang Onboard 7:001 Wait for Crane 7:30 30 302 Open Hatch 1 7:40 10 103 Unload - Bay1 9:00 80 80 15 10 25 18.75 4 Close Hatch 1 9:10 10 105 Move Crane 9:20 10 106 Unload - Bay 2 11:45 145 145 25 20 45 18.62 7 Crane Breakdown 12:15 30 308 Load - Bay 2 14:00 105 105 8 10 18 10.29 9 Move Crane 14:15 15 15
10 Load - Bay 1 15:00 45 45 12 12 16.00 Minute 480 375 45 60 40 30 20 10 100 ---
Hour 8.00 6.25 0.75 1.00
III. AnalysisTime Breakdown: Performance Indicators:Crane Net-WorkTime 6.25 Crane Net-Work Productivity 16.00 = 100 / 6.25Unavoidable Delays 0.75 Crane Net Productivity 14.29 = 100 / 7.00Crane Time 7.00 Crane Gross Productivity 12.50 = 100 / 7.75Avoidable Delays 1.00 Crane Time / Shift Time 88% =7.00 / 8.00Shift Time 8.00
Delays
Total
Prod.
Hope
Day
Description Clock Elapsed
17-Jul-17MHC 1

P R I N C I P L E S O F P O R T P E R F O R M A N C E M O N I T O R I N G | 60
Figure 10’s Vessel Operations Report illustrates a simplified version of this common form used for collecting and analyzing operational data of all cranes involved in the handling process of a vessel, during the entire time of stay at CHP. Ships times (e.g., buoy arrval time) are sourced from external parties (e.g., Port Captain or ship agent). It is suggested that the future CHP’s operator will also be required to obtain these data items and input them to the Vessel Operations Report. Another, more advanced option, is that these data items will be directly fed into the TOS by the Port Captain via electronic data interchange.
Figure 10’s Section II. Ship’s Time Log includes the clock and elapsed times of the main events during the ship stay at the port. Section III. Crane Activity is similar to the same section in the Crane Operation Report, with the activities of each crane described in a summary format using a single column. For simplicity, the specific example included in Figure assumes that the ship stays only one shift, during which it is served by two cranes, a MHC and a shipboard crane. Section III. Analysis includes a summary of the main times and calculation of indicators for the entire ship, based on the two cranes that served it, the Gross and Net Berth Productivity. As shown in the Figure, the time-related calculations are in red and explanations for the Time Breakdown and indicators section are in blue.
As seen in the Figure 10 example, the total time that the ship spends in CHP, from arriving at the entrance buoy until departing, defined as Port Time, extended 11.00 hours, of which the time the ship was tied to the berth, defined as Berth Occupied Time (First line to Last Line), is 8.25 hours and the time during which the cranes were involved in ship handling, defined as Berth Work Time (First Box to Last Box) was 7.50 hours. Of special interest is the Port Access Time, defined as ship’s time spent on maneuvering and, mostly, ship’s waiting for berth, pilot, tug and other avoidable delays which, in our case, is 2.75 hours. The call size or the number of boxes handled by the 2 cranes is 190; crane MHC 1 handles 100 moves and the ship-crane 90 moves. It should be noted that the operational unit is a move (box, container) and not TEU and that the reporting does not differentiate between various types of boxes (full, empty, dry, etc.).
Periodic Summaries The operational data per each ship will be aggregated into a monthly report, including data on Berth Net and Gross Productivities, Berth Work Time, Berth Gross Time and Port Time. The monthly report is a simple list, with each ship’s data appears in one row. The form will provide for calculating the monthly averages, including that of Net Berth Productivity, the equivalent to the crane productivity indicator required by the Contract. The summary monthly report could be provided by using a common spreadsheet program, identifying high and low performances for the month and overall. The program will allow, using regression, to quantify the relations between productivity and ship size, call size, shipping line, etc. The analysis also could flag outliers according to pre-determined criteria, drawing the attention of the terminal operator and APN and provide for the generation of graphical dashboard.
Another indicator that should be calculated on a monthly basis is:
Berth Utilization (%) = Total Berth Gross Time / Available Time
Available Time = Calendar Time – Holidays – Bad Weather

P R I N C I P L E S O F P O R T P E R F O R M A N C E M O N I T O R I N G | 61
Berth utilization is an important determinant of both ship’s waiting for berth and the overall capacity utilization of the terminal and should be closely monitored by APN as part of both its regulatory and planning role.
Gate Performance Indicators Figure 12 shows a simple form for daily collection and analysis of data on gate activities. The activities are arranged according to trucks arrival time and include a time-log of all gate transactions and activities in which the truck (or driver) is involved during its stay at the terminal. The proposed report provides for allocating elapsed times according to 8 types of transactions, pre-gate waiting and no transaction, defined as Problem. The 8 transactions include 4 single transactions: Full-In, Full-Out, Empty-In, and Empty-Out; and 4 double transactions: Full-In+Full Out, Full-In+Empty Out, Empty In+ Full Out, and Empty-In+Empty-Out. The last transaction, involving empty boxes moving in opposite directions, relates to either different types of boxes or boxes belonging to different shipping lines. The clock time (log) recording for each transaction relates to 3 times:
Arrival Time = The time that the truck driver presents his documents at the pre-gate office after parking his truck at the parking lot outside the gate;
Gate-In Time = The time that the actual transaction at the gate begins, with the truck on its way into the terminal; and
Gate-Out Time = The time that the actual transaction at the gate ends, with the truck on its way out of the terminal.
Figure 12. Gate Operations Report
The daily gate report will be aggregated on a monthly basis and monthly average times per transaction calculated, along with an overall average for all transactions as required by the
Open 7:00Daily Gate Report: 1 - 2 - 2017 Close 19:30
Wait Turnaround
Arrived In Out Minutes MinutesFull-
InFull-Out
Empty-In
Empty-Out
1 12345ABC 7:00:00 AM 7:10:00 AM 8:00:00 AM 10 50 12 12345ABC 9:03:00 AM 9:05:00 AM 10:00:00 AM 2 55 13 12345ABC 11:00:00 AM 11:30:00 AM 12:00:00 PM 30 304 12345ABC 11:09:00 AM 11:30:00 AM 1:15:00 PM 21 105 2 25 12345ABC 12:00:00 PM 2:40:00 PM 5:00:00 PM 160 140 1 16 12345ABC 2:00:00 PM 2:40:00 PM 3:00:00 PM 40 20 17 12345ABC 3:00:00 PM 3:00:00 PM 5:59:00 PM 0 179 1 18 12345ABC 4:00:00 PM 4:30:00 PM 5:00:00 PM 30 30 19 12345ABC 5:00:00 PM 6:30:00 PM 7:00:00 PM 90 30 1
101112
Truck NumberTransactionsTimes

P R I N C I P L E S O F P O R T P E R F O R M A N C E M O N I T O R I N G | 62
Contract. Since, as noted in Report I, most of the gate information is collected as required by the International Ship and Port Facility Security (ISPS) convention, the preparation of this report should not add much work to the terminal operator. The Gate Operation Report can be automatically generated by the computerized TOS.
The Contract only requires the calculation of a single performance indicator related to a monthly, all-average, truck turn time. We suggest to expand the Contract requirement to include a breakdown by transaction type and the pre-gate waiting time. Accordingly, our suggested PIs include:
Truck Turn Time (minutes) – The average time per truck per transaction type since starting the gate-in process until completing the gate-out one; and
Truck Waiting Time (minutes) – The average time per truck since arriving at the gate-in until starting the gate-in process.
We also suggest to provide statistics about the failed transaction (“problems” or “trouble cases”), including incidence (% of completed transaction) and description of the reasons (problems with Delivery Orders, Customs Release, etc.).
In addition to averages, a more in-depth analysis should include a time distribution of the various transactions, focusing on flagging out outliers. The distribution of gate transactions should also be by the hour of the day, days of the week, etc., in order to identify peak or idle periods.
Yard Performance Indicators The yard performance indicators are more relevant to the administrative and planning roles of APN and less for its regulatory role. Still, the yard performance affects that of both the berth and gate, including their respective PIs in the Contract. Therefore, although no data on yard performance is required by the Contract, we suggest to include such requirement, along with calculations of related indicators. The yard data and indicators relate to the number of boxes stored inside the terminal (“inventory”), the utilization of storage capacity and, separately, the dwell times of these boxes.
Figure 13 shows a simple form for the daily collection and analysis of yard inventory and the calculation of performance indicators related to storage capacity utilization. The daily inventory report includes the number of boxes stacked in the terminal at a certain time (usually at the end of the previous day), categorized by box type (dry/reefer, full/empty). Sometimes the full (loaded) boxes are further categorized by direction (import/export).41 As noted several times in our discussion thus far, the suggested form included in Table 11 is for illustration purposes. In reality there is no need for such a manual report or even any hardcopy report, since
41 A similar, but more detailed inventory report, is provided by the terminal operator to each of the shipping lines regarding their own boxes.

P R I N C I P L E S O F P O R T P E R F O R M A N C E M O N I T O R I N G | 63
Figure 13. Yard Operation Report
computerized TOS usually provides the data “live”. The suggested form in Figure 12 is monthly, with each row describing a day. All the figures in this report are in TEUs. The report includes three sections for compiling traffic data: Inventory, Berth and Gate. Positive numbers represent in-flows or traffic which increases the inventory and vice-versa. The Inventory column relates to the number of boxes (in TEUs) stored inside the yard at the beginning of the day, which is equal to that at the beginning of the previous day with the daily traffic through the berth and the gate added or subtracted. The Space Utilization section includes the storage capacity of the yard for each type of box and the utilization is calculated by simply dividing the respective inventories by their storage capacity. The proposed performance indicator for the container yard performance relates to its monthly average inventory and slot-capacity utilization or per each type of box:
Inventory (TEUs) = Average number of TEU in the yard
Yard Utilization (%) = Average number of Occupied TEU-slot / Total TEU-slot
In addition to calculating monthly averages a statistical analysis should identify peak situations, whereby utilization approaches 100%, signaling a shortage of space and congestion.
A second performance indicator related to the yard operation is the average dwell time for boxes. This indicator is directly related to the indicator that measures inventory, since a longer dwell time increases the inventory. Analysis of long dwell times is especially revealing in the case of import boxes, including investigation of the underlying reasons and, perhaps, the need to take actions (removal to outside storage, condemnation, etc.).
Average Dwell Time (days) = by type (reefer/dry) and direction (import/ export)
Unlike the data on inventory, data on dwell time (“aging”) is difficult to compile manually. However, most digitized TOSs generate aging reports, including flagging out outliers according to pre-determined criteria.
200 30 500Dry Reefer Total Dry Reefer Empty Dry Reefer Empty Dry Reefer Empty Dry Reefer Empty
Starting 200 30 322 100 22 200 5 -1 10 10 7 -10 50.0% 73.3% 40.0%2/1/2017 200 30 350 120 30 150 10 5 -20 5 -6 10 60.0% 100.0% 30.0%2/2/2017 200 30 304 135 29 140 -4 2 4 -25 -5 5 67.5% 96.7% 28.0%2/3/2017 200 30 281 106 26 149 1 -10 53.0% 86.7% 29.8%2/4/2017 200 30 272 97 26 149 5 8 48.5% 86.7% 29.8%2/5/2017 200 30 285 110 26 149 -8 2 55.0% 86.7% 29.8%2/6/2017 200 30 279 104 26 149 9 6 52.0% 86.7% 29.8%2/7/2017 200 30 294 119 26 149 6 9 59.5% 86.7% 29.8%2/8/2017 200 30 309 134 26 149 4 7 67.0% 86.7% 29.8%
….2/28/2017 200 30Average 327 127.5 29.5 145 3 3.5 -8 -10 -5.5 7.5 63.8% 98.3% 29.0%
Note: Dry and Reefer only include full boxes
DateInventory Berth Gate
y p y Utilization
Capacity

P R I N C I P L E S O F P O R T P E R F O R M A N C E M O N I T O R I N G | 64
FULFILLING REGULATORY FUNCTIONS: MONITORING, ENFORCEMENT AND TAKING CORRECTIVE ACTIONS The objective of the performance operating system and respective performance indicator, as declared at the outset of this report, is to support APN in its regulatory, administrative and planning roles. Unlike the draft contract’s indicators, our indicators are not enforceable and no sanctions are stipulated for not reaching their target values. The indicators discussed in this report are essentially a management tool that should assist APN, the terminal operator(s), port users, Customs and the entire port community in improving the performance of the port system. Accordingly, we suggest that APN will publish a monthly performance report with the indicator results compared to their target value for the community to review. This report is likely to attract much attention especially in such cases where results are unsatisfactory, in which case we suggest APN should lead a corrective effort, being the most senior participant in the port system.
It should be noted that the underlying causes for unsatisfactory results may not necessarily be attributed to the terminal operator. For example, unduly long port time of vessels could be the result of unavailability of pilotage and tug services during nights, failure of ship agents to communicate with APN or the terminal operator, delays in vessel clearance by Customs and Immigration, etc. Likewise, low berth productivity could be the result of interruption of the container activities by commercial activities. The envisioned role of APN is to identify and investigate these problems and initiate a collective effort to remedy them.