basic principles of monitoring and · pdf filemonitoring and evaluation for organizational...
TRANSCRIPT

BASIC PRINCIPLES OF MONITORING
AND EVALUATION


Basic principles of monitoring and evaluation i
CONTENT
1. MONITORING AND EVALUATION: DEFINITIONS
2. THEORY OF CHANGE
3. PERFORMANCE MANAGEMENT SYSTEMS AND
PERFORMANCE MEASUREMENT
4. PERFORMANCE INDICATORS
4.1 Process (implementation) indicators
4.2 Process (implementation) indicators
4.3 Progression indicators (labour market attachment)
5. TARGETS, BASELINE AND DATA SOURCES
6. MEASURING RESULTS
Basic principles of monitoring and evaluation 1
1. MONITORING AND EVALUATION: DEFINITIONS
Youth employment programmes, like any other type of public
policy intervention, are designed to change the current situation of the target group and achieve specific results, like increasing employment or reducing unemployment. The key policy question is whether the planned results (outcomes) were actually achieved. Often, in fact, the attention of policy-makers and programme managers is focused on inputs (e.g. the human and financial resources used to deliver a programme) and outputs (e.g. number of participants), rather than on whether the programme is achieving its intended outcomes (e.g. participants employed or with the skills needed to get productive jobs).
Monitoring and evaluation are the processes that allow policy-makers and programme managers to assess: how an intervention evolves over time (monitoring); how effectively a programme was implemented and whether there are gaps between the planned and achieved results (evaluation); and whether the changes in well-being are due to the programme and to the programme alone (impact evaluation).
Monitoring is a continuous process of collecting and analysing information about a programme, and comparing actual against planned results in order to judge how well the intervention is being implemented. It uses the data generated by the programme itself (characteristics of individual participants, enrolment and attendance, end of programme situation of beneficiaries and costs of the programme) and it makes comparisons across individuals, types of programmes and geographical locations. The existence of a reliable monitoring system is essential for evaluation.
Evaluation is a process that systematically and objectively assesses all the elements of a programme (e.g. design, implementation and results achieved) to determine its overall worth or significance. The objective is to provide credible information for decision-makers to identify ways to achieve more of the desired results. Broadly speaking, there are two main types of evaluation: Performance evaluations focus on the quality of service delivery
and the outcomes (results) achieved by a programme. They typically cover short-term and medium-term outcomes (e.g. student achievement levels, or the number of welfare recipients who move into full-time work). They are carried out on the basis of information regularly collected through the programme monitoring system. Performance evaluation is broader than monitoring. It attempts to determine whether the progress achieved is the result of the intervention, or whether another explanation is responsible for the observed changes.
Impact evaluations look for changes in outcomes that can be directly attributed to the programme being evaluated. They estimate what would have occurred had beneficiaries not participated in the programme. The determination of causality between the programme and a specific outcome is the key feature that distinguishes impact evaluation from any other type of assessment.

2 Basic principles of monitoring and evaluation
Monitoring and evaluation usually include information on the cost of the programme being monitored or evaluated. This allows judging the benefits of a programme against its costs and identifying which intervention has the highest rate of return. Two tools are commonly used. A cost-benefit analysis estimates the total benefit of a
programme compared to its total costs. This type of analysis is normally used ex-ante, to decide among different programme options. The main difficulty is to assign a monetary value to “intangible” benefits. For example, the main benefit of a youth employment programme is the increase of employment and the earning opportunities for participants. These are tangible benefits to which a monetary value can be assigned. However, having a job also increase people’s self-esteem, which is more difficult to express in monetary terms as it has different values for different persons.
A cost-effectiveness analysis compares the costs of two or more programmes in yielding the same outcome. Take for example a wage subsidy and a public work programme. Each has the objective to place young people into jobs, but the wage subsidy does so at the cost of $500 per individual employed, while the second costs $800. In cost-effectiveness terms, the wage subsidy performs better than the public work scheme.

Basic principles of monitoring and evaluation 3
2. THEORY OF CHANGE
A theory of change describes how an intervention will deliver the planned results. A causal/result chain (or logical framework) outlines how the sequence of inputs, activities and outputs of a programme will attain specific outcomes (objectives). This in turn will contribute to the achievement of the overall aim. A causal chain maps: (i) inputs (financial, human and other resources); (ii) activities (actions or work performed to translate inputs into outputs); (iii) outputs (goods produced and services delivered); (iv) outcomes (use of outputs by the target groups); and (v) aim (or final, long-term outcome of the intervention).
In the result chain above, the monitoring system would continuously track: (i) the resources invested in/used by the programme; (ii) the implementation of activities in the planned timeframe; and (iii) the delivery of goods and services. A performance evaluation would, at a specific point of time, judge the inputs-outputs relationship and the immediate outcomes. An impact evaluation would provide evidence on whether the changes observed were caused by the intervention and by this alone.
FINAL OUTCOMES
OUTCOMES
EVALUATION MONITORING
ACTIVITIES INPUTS OUTPUTS
Final programme
goals, typically achieved in the
long-term
Results likely to be achieved
when beneficiaries
use outputs
Tangible goods or services the
programme produces or
delivers
Action taken/work
performed to transform inputs into
outputs
Available resources, including
budget and staff
Implementation Results
Figure 1. Results chain

Basic principles of monitoring and evaluation 4
3. PERFORMANCE MANAGEMENT SYSTEMS AND PERFORMANCE MEASUREMENT
Performance management (or results-based management) is a
strategy designed to achieve changes in the way organizations operate, with improving performance (better results) at the core of the system. Performance measurement (performance monitoring) is concerned more narrowly with the production of information on performance. It focuses on defining objectives, developing indicators, and collecting and analysing data on results. Results-based management systems typically comprise seven stages:
1. Formulating objectives: identifying in clear, measurable terms the results being sought and developing a conceptual framework for how the results will be achieved.
2. Identifying indicators: for each objective, specifying exactly what is to be measured along a scale or dimension.
3. Setting targets: for each indicator, specifying the expected level of results to be achieved by specific dates, which will be used to judge performance.
4. Monitoring results: developing performance-monitoring systems that regularly collect data on the results achieved.
5. Reviewing and reporting results: comparing actual results against the targets (or other criteria for judging performance).
6. Integrating evaluations: conducting evaluations to gather information not available through performance monitoring systems.
7. Using performance information: using information from monitoring and evaluation for organizational learning, decision-making and accountability.
The setting up a performance monitoring system for youth employment programmes, therefore, requires: clarifying programme objectives; identifying performance indicators; setting the baseline and targets, monitoring results, and reporting.
In many instances, the objectives of a youth employment programme are implied rather than expressly stated. In such cases, the first task of performance monitoring is to articulate what the programme intends to achieve in measurable terms. Without clear objectives, in fact, it becomes difficult to choose the most appropriate measures (indicators) and express the programme targets.
Str
ateg
ic p
lan
nin
g
Per
form
ance
mea
sure
men
t
RE
SU
LT
S-B
AS
ED
MA
NA
GE
ME
NT
Figure 2 Steps of performance management systems

5 Basic principles of monitoring and evaluation
4. PERFORMANCE INDICATORS
Performance indicators are concise quantitative and qualitative measures of programme performance that can be easily tracked on a regular basis. Quantitative indicators measure changes in a specific value (number, mean or median) and a percentage. Qualitative indicators provide insights into changes in attitudes, beliefs, motives and behaviours of individuals. Although important, information on these indicators is more time-consuming to collect, measure and analyse, especially in the early stages of programme implementation.
Box .1. Tips for the development of indicators
Relevance. Indicators should be relevant to the needs of the user and to the purpose of monitoring. They should be able to clearly indicate to the user whether progress is being made (or not) in addressing the problems identified.
Disaggregation. Data should be disaggregated according to what is to be measured. For example, for individuals the basic disaggregation is by sex, age group, level of education and other personal characteristics useful to understanding how the programme functions. For services and/or programmes the disaggregation is normally done by type of service/programme.
Comprehensibility. Indicators should be easy to use and understand and data for their calculation relatively simple to collect.
Clarity of definition. A vaguely defined indicator will be open to several interpretations, and may be measured in different ways at different times and places. It is useful in this regard to include the source of data to be used and calculation examples/methods. For example, the indicator “employment of participants at follow-up” will require: (i) specification of what constitutes employment (work for at least one hour for pay, profit or in kind in the 10 days prior to the measurement); (ii) a definition of participants (e.g. those who attended at least 50 per cent of the programme); and (iii) a follow-up timeframe (six months after the completion of the programme). Care must also be taken in defining the standard or benchmark of comparison. For example, in examining the status of young people, what constitutes the norm – the situation of youth in a particular region or at national level?
The number chosen should be small. There are no hard and fast rules to determine the appropriate number of indicators. However, a rule of thumb is that users should avoid two temptations: information overload and over-aggregation (i.e. too much data and designing a composite index based on aggregation and weighting schemes which may conceal important information). A common mistake is to over-engineer a monitoring system (e.g. the collection of data for hundreds of indicators, most of which are not used). In the field of employment programmes, senior officials tend to make use of high-level strategic indicators such as outputs and outcomes. Line managers and their staff, conversely, focus on operational indicators that target processes and services.
Specificity. The selection of indicators should reflect those problems that the youth employment programme intends to address. For example, a programme aimed at providing work experience to early school leavers needs to incorporate indicators on coverage (how many among all school leavers participate in the programme), type of enterprises where the work experience takes place and the occupation, and number of beneficiaries that obtain a job afterwards by individual characteristics (e.g. sex, educational attainment, household status and so on).
Cost. There is a trade off between indicators and the cost of collecting data for their measurement. If the collection of data becomes too expensive and time consuming, the indicator may ultimately lose its relevance.
Technical soundness. Data should be reliable. The user should be informed about how the indicators were constructed and the sources used. A short discussion should be provided about their meaning, interpretation, and, most importantly, their limitations. Indicators must be available on a timely basis, especially if they are to provide feedback during programme implementation.
Forward-looking. A well-designed system of indicators must not be restricted to conveying information about current concerns. Indicators must also measure trends over time.
Adaptability. Indicators should be readily adaptable to use in different regions and circumstances.
Source: adapted from Canadian International Development Agency (CIDA), 1997. Guide to Gender-Sensitive Indicators (Ottawa, CIDA).

Basic principles of monitoring and evaluation 6
When choosing performance indicators, it is important to identify indicators at all levels of the results chain, and not just at the level of outcomes. Information on process is useful for documenting programme implementation over time and explaining differences across programme sites. Information on individual participants (e.g. sex, age group, national origin, medical condition, educational attainment, length of unemployment spells and so on) allows users to judge compliance with targeting criteria. Some examples of the most common implementation indicators are shown in the Table 1 below.
Process indicators Calculation method Disaggregation
1 Composition of entrants,
participants, completers *
Number of entrants in period t*100
= ---------------------------
Total number of entrants in period t
by type of programme
by characteristics of individuals
Programme: training, subsidy, self-
employment, etc.
Individuals by sex, age group, education
level, unemployment duration, type of
disadvantage, prior occupation/work
experience
2 Stock variation of entrants,
participants, completers
Number of entrants in period t
= ---------------------------
Number of entrants in period t-1
As above
3 Inflow of entrants (or
participants)
Number of new entrants in period t
= ---------------------------
Stock of entrants end of period t-1
As above
4 Degree of coverage of target
population (entrants,
participants, completers)
Number of programme entrants*100
= ---------------------------
Total targeted population
As above
5 Implementation Number of implemented actions
= --------------------------
Number of planned actions
As above
6 Average cost per entrant,
participant, completer
Total cost of programme
= ---------------------------
Total number of entrants
By programme
Note: * Entrants are all individuals who start a specific programme. Participants are all individuals who entered and attended the programme for a minimum period of time (usually determined by the rules of the programme as the minimum period required to produce changes, for example 50 per cent of the programme duration). Completers are those who completed the whole programme. Dropouts, usually, are those who left the programme before a minimum period of attendance established by the rules of the programme (e.g. the difference between entrants and participants).
Table.1. Example of common process (implementation) indicators (measurement and disaggregation)
4.1 PROCESS (IMPLEMENTATION)
INDICATORS

7 Basic principles of monitoring and evaluation
The indicator in the first row, for example, serves to determine whether the targeting rules of the programme are being complied with. For instance, in a youth employment programme targeting individuals with less than primary education, the share of entrants by this level of education over the total will determine if eligibility rules are being followed and allow tracking of sites with the best/worst compliance.
The indicators in the second and third rows serve to measure the evolution of the programme’s intake. It is normal, in fact, to see increases in intake as the programme matures. The time t may be any time interval (yearly, quarterly or monthly). The indicator in the fourth row serves to measure the overall coverage of the programme. Depending on its scope, the denominator can be the total number of youth (in a country, region, province or town) or only those who have certain characteristics (e.g. only those who are unemployed, workers in the informal economy, individuals with a low level of education). The indicator in the fifth row serves to measure the pace of implementation compared to the initial plan, while the indicator in the last row is used to calculate overall costs.
Since the overarching objective of youth employment programmes is to help young people get a job, the most significant outcome indicators are: (i) the gross placement (employment) rate by individual characteristics and type of programme; (ii) average cost per young person placed; and (iii) the level of earnings of youth participants employed. The more disaggregated the data, the better, as this allows comparison across individuals, programmes and geographical locations.
Calculation methods and disaggregation are shown in Table 2 below.
Outcome
indicators
Calculation
method
Disaggregation
1 Gross placement rates
(individuals) Number of
placements*100
= -----------------------
Total number
participants
(including dropouts)
by type of programme
by characteristics of individuals
by type of job
Programme: training, subsidy, self-employment,
public work scheme
Individuals by sex, age group, education level,
unemployment duration, type of disadvantage,
prior occupation/work experience
Jobs by economic sector and size of the
enterprise, occupation, contract type and
contract duration
Table 3: Outcome indicators (measurement and disaggregation)
4.2 PROCESS (IMPLEMENTATION) INDICATORS
Basic principles of monitoring and evaluation 8
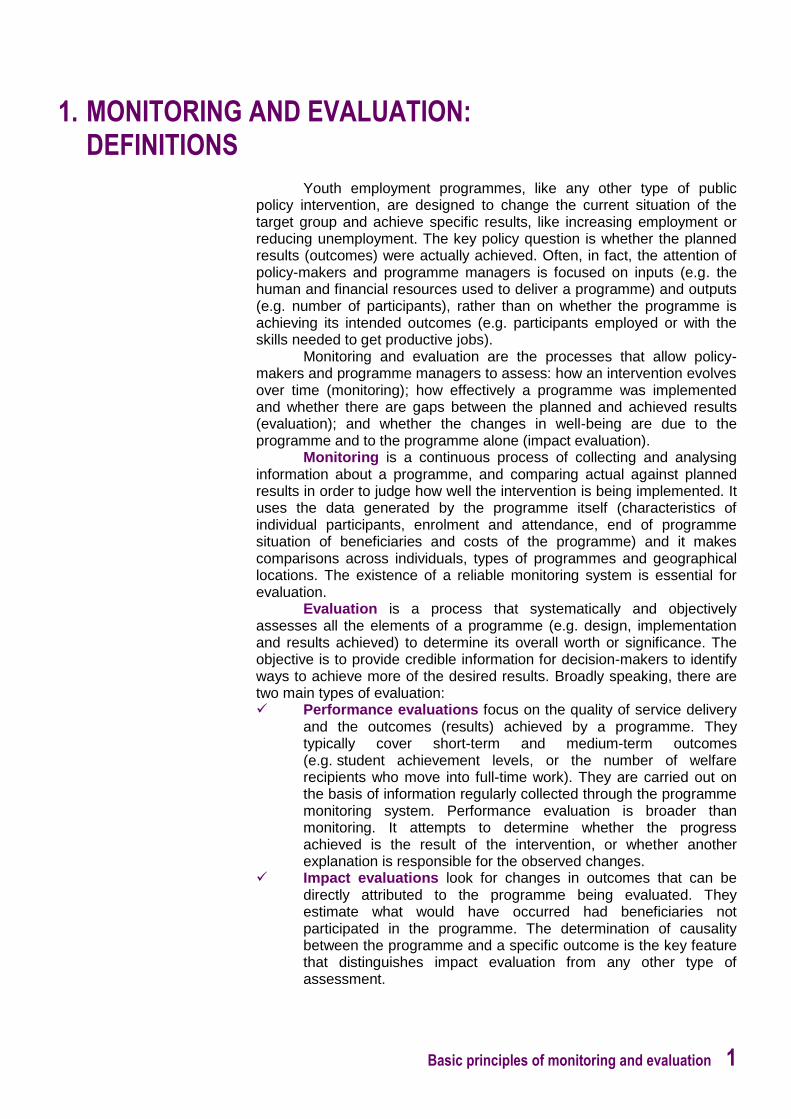
The above-mentioned disaggregation also allows data users to judge the “quality” of the results achieved. The use of total placement as an indicator of performance, in fact, has two main shortcomings. The first is the likely prevalence of short-term employment and the likelihood that beneficiaries re-enter unemployment soon after the end of the programme. The second is the lack of distinction between “easy-to-place” youth (who would eventually get a job also without the programme) and “disadvantaged” youth (who are likely to experience long spells of unemployment if they are not helped). The first issue results in “gaming” behaviour, for example, administrators may be tempted to “cheat” the system by focusing on short-term placement (with no attention to quality) to achieve programme targets. The second gives rise to “creaming” (or cream-skimming), namely the selection for programme participation of those youth most likely to succeed, as compared to those who most need the programme.
The disaggregation proposed in Table 2 corrects these shortcomings by requiring collection of information on the characteristics of individuals employed and the type of jobs they perform. Calculation of hourly wages helps to measure the welfare gains more accurately than total earnings, as young workers may have higher earnings only because they work longer hours.
Cost is another important measure: it allows users to decide whether a programme is cost-effective (e.g. whether the rate of return in terms of placement justifies the resources invested).1 Usually, the overall costs of a programme are compared to those of other programmes with similar objectives and target groups. Overall costs include: 1) the disbursements made to service providers (e.g. the payment made to a training centre to conduct a vocational training course) or to other agencies (e.g. the cost of insuring participants during programme participation); 2) payments made to individual participants (e.g. the reimbursement of transport costs incurred to reach the site of training, subsidies for living costs and so on); and 3) the administrative cost of running the programme.
2 Earnings Number of individuals
placed in a job and earning
(hourly) wages over the
minimum*100
= -----------------------
Number of placements
by type of programme
by characteristics of individuals
by type of jobs
3 Cost per placement Total cost
= -----------------------
Number of placements
by type of programme
1 In terms of youth employment
programmes, cost-efficiency refers to the
simple relation between cost and results
(e.g. cost of the programme vs. number
of individuals placed). Cost-effectiveness
relates also to the quality of placement,
and not only to quantity (e.g. cost of the
programme vs. individuals placed in
“good” jobs).

9 Basic principles of monitoring and evaluation
As outcome indicators depend on the specific objectives of each youth employment programme, each programme has its own. Some examples of outcome indicators for the most common employment programmes are provided in Table 3. When selecting outcome indicators, attention must be paid to the costs and time involved in collecting the data needed. For this reason, it is always better to focus on a few, but well-chosen indicators.
Vocational training
Completion rate
Graduation rate
Drop-out rate
= number of individuals who complete the training programme/number of entrants*
= number of individuals who passed standardized testing at the programme’s
end/number of entrants
= number of individuals who left the course in the first (30, 60, 90) days of
programme/number of entrants
* For training programmes, it is necessary to distinguish between those who
entered the course (entrants) and those who attended a minimum period
(participants). In some programmes, the term “completers” is used to denote
those who complete the whole programme.
Proportion of participants in regular
(unsubsidized) employment at follow-up,
including:
(For on-the-job training): share of trainees employed in same enterprise offering training;
(For all types of training): share of trainees employed in the occupation of training; and
(For all types of training): share of trainees using skills acquired during the training.
= number of participants employed at follow-up/number of entrants/participants
= number of employed trainees in same enterprise/number of trainees employed
= number of trainees employed in occupation of training/number of trainees
employed
= number of trainees employed who use skills learnt/number of trainees employed
Average earnings
= Total earnings of trainees employed/number of trainees employed
= Number of trainees employed earning hourly wages over minimum/number of
trainees employed
Average cost per participant/completer
= total cost /number of participants/completers
Average cost per participant/completer
employed at follow-up
= total cost /number of participants/completer employed
Table 3: Examples of performance indicators for youth employment programmes

Basic principles of monitoring and evaluation 10
Employment subsidy
Proportion of subsidized workers (participants) in
regular employment at follow-up, including:
Share of subsidized workers still employed at follow-up in partner enterprise
= number of subsidized workers employed at follow-up/number of
participants
= number of subsidized workers employed at follow-up in partner
enterprise/number of subsidized workers employed at follow-up
Employment subsidy
Average earnings
= Total earnings of subsidized workers/number of subsidized
workers employed at follow-up
= Number of subsidized workers earning hourly wages over
minimum/number of subsidized workers employed at follow-up
Average cost per subsidized worker employed at
follow-up
= total cost of subsidy/number of subsidized workers employed at
follow-up
Average cost of subsidy per subsidized worker
= total cost subsidy/number of participants
Self-employment assistance
Proportion of persons still self-employed at follow-up
= number of self-employed at follow-up/number of participants
Average earnings
= Total earnings of self-employed/ number of individuals still self-
employed at follow-up
= Number of self-employed earning incomes over the
minimum/number of individuals who are still self-employed at
follow-up*
* To compare self-employment earnings, one can use either the
level of the statutory minimum wage, or the average earning for
self-employed, if available (this is usually calculated by the
statistical office)
Average cost of assistance per person still self-
employed at follow-up
= total cost of assistance/number of self-employed at follow-up
Average cost per participant
= total cost of assistance/number of participants
Average added employment generated by assisted
self-employed
= number of additional jobs created (individuals employed) by self-
employed individuals assisted by the programme
Table 3: Examples of performance indicators for youth employment programmes

11 Basic principles of monitoring and evaluation
Employment programmes usually target individuals who are unemployed according to ILO standards (without work, looking for work and available to work). Registering with the Public Employment Service (PES) is usually considered sufficient for an individual to comply with the three mentioned criteria. Recently, employment programmes started to target individuals that are in the potential labour force, but do not comply with all the criteria of the unemployment definition.2 These individuals (schematically presented in the Figure below) may be targeted by employment programmes aimed at increasing their labour market attachment.
Source: EUROSTAT, Statistics in Focus 2011/57
Progression indicators, therefore, measure the change in labour market status that services and programme produce in individuals that are “detached” from the labour market (in the potential labour force, but not unemployed). For example, progression indicators measure how many individuals who are available, but not seeking work, become unemployed (outflow from inactivity into unemployment, inflow into unemployment) after a job search training; how many of these move to subsidized employment (outflow from unemployment into subsidized employment); and how many (at the end of treatment) become employed (outflow from subsidized to open employment).
In the same way in which progression indicators measure the change in the labour market status of inactive persons, it is possible to design indicators to measure the progress made by individuals in other personal development areas. The main difficulty in designing this type of indicators is to precisely define the characteristics of the different stages of progression and the data that are needed.
EU 27 population (15-74) 337.1 million persons
Employed
215.9 million
Unemployed 22.9 million
Inactive
138.3 million
Other employed 8.5 m Unemployed
22.9 m
2.4 8.2 m Other inactive
Under-employed part-time Available, but not seeking Seeking, but not
immediately available
Labour market attachment
Figure 2: Labour market statuses
4.3 PROGRESSION INDICATORS (LABOUR MARKET ATTACHMENT)
2 For more information see EUROSTAT,
Statistics in Focus 2011/57 at
http://epp.eurostat.ec.europa.eu/cache/I
TY_OFFPUB/KS-SF-11-057/EN/KS-SF-
11-057-EN.PDF
Basic principles of monitoring and evaluation 12
5. TARGETS, BASELINE AND DATA SOURCES
One of the most problematic issues in performance monitoring is the definition of appropriate targets. For example, the information that participants have an average 50 per cent employment rate in the year following programme participation has no value as a measure of performance per se; it needs to be compared against another value. Outcomes can be measured against targets (i.e. particular values specified for an indicator to be accomplished in a specific timeframe) or standards (values that define acceptable performance for a specific programme, usually constructed on figures stemming from the implementation of prior programmes). The setting of targets comprises four steps:
1. Set the baseline. Without a baseline – that is, the value of an indicator just before implementation begins – it is difficult, if not impossible, to establish a realistic performance target. Baseline data is the initial information on programme participants (or other programme aspects) collected prior to programme intervention. They may be established using existing secondary data sources or may require the collection of primary data.
2. Identify trends. This allows users to understand the historical trends in the indicator value over time (e.g. whether available data show changes, either upward or downward over time). Targets should reflect these trends plus the value that a programme is expected to add. For example, if the employment rate of youth with low educational attainment has remained at 40 per cent for the last five years, a reasonable target can be set at a value above that.
3. Review research findings. There is a large body of literature on active labour market programmes targeting youth (design and implementation rather than impact measures). Reviewing research findings may be helpful in setting realistic targets, especially for the most common programmes (e.g. vocational training programmes). For example, the experience of various countries on training programmes targeting youth shows a gross employment rate at follow-up ranging between 50 and 65 per cent of total participants.
4. Benchmarking. An increasingly popular way of setting targets is to use the results of similar high-performance programmes. Also, targets can be set against the placement rate of the programme across different types of participants or the placement rate of the programme across different geographical areas. For example, if the programme targets both adults and young people, the performance of the programme targeting youth can be benchmarked against that of adults. Conversely, if the programme is implemented in multiple locations for the same target group, placement rates can be compared across sites.

13 Basic principles of monitoring and evaluation
The first measurement of a performance indicator is the baseline. A performance baseline is information − quantitative and qualitative − that provides data on the outcome indicators directly affected by the programme at the beginning of the monitoring period.
Baseline information needs to be collected and analysed for each of the indicators selected. For this reason, the more indicators there are, the more complex (and costly) the monitoring process can be. In addition, if an impact evaluation is planned, baseline data needs to be collected on a representative sample of the whole eligible population to allow for the random selection of participants and non-participants. This may considerably increase the cost of data collection. Performance indicators and data collection strategies need to be grounded in the type of data system in place and the figures that can be produced (sources, collection methods, frequency and costs).
The first challenge is to identify the data sources for the performance indicators of the youth employment programme. Data sources for the baseline can be primary (collected by the implementing agency specifically for programme purposes through the running of a baseline survey) or secondary (collected by other entities for other purposes), or (more often) a combination of both. Examples of secondary data sources are the figures of the Labour Force Survey (survey-based data) and labour-related administrative data, generally derived as by-products of administrative procedures (employment services, social security contribution etc.).
When the existing statistical system is unable to provide the data necessary to set the baseline for the youth employment programme, it is necessary to collect figures from primary sources. Primary data can be collected in a number of ways (e.g. through focus group interviews or direct observation). The most common method is to conduct a specifically designed, one-to-one survey of the target group. If primary data need to be collected to build the baseline, the steps to be followed include: (i) selection of the sampling strategy, (ii) design and pilot-testing of the questionnaire; and (iii) data collection and cleaning.

Basic principles of monitoring and evaluation 14
6. MEASURING RESULTS
In order to operationalize a performance monitoring system, records of programme entrants (including information on characteristics such as age, sex, education level and other labour market barriers such as early school leaving, long-term unemployed or degree of disability) need to be combined with evidence of individual outcomes at follow-up. The latter should be gathered either through administrative data or follow-up surveys.
In measurement through administrative data, information on programme participants is matched with information of social security contributions, national insurance or payroll tax agencies after a minimum period of time (usually six months). The key used to match programme participants to administrative records is their unique identification number (e.g. identity number, social security contribution number or fiscal number). There are a number of problems with using administrative records to measure employment at follow-up. First, access to personal data may be restricted by privacy protection legislation. Second, administrative records may not be completely accurate or reliable. They may not provide information on earnings, or there may be delays in the updating of records or the cleaning of corrupt, incomplete or inaccurate figures.
If data on the employment of participants after the programme cannot be derived with certainty from existing data sources, it may be necessary to conduct a follow-up (or tracer) survey on programme participants to measure their (re)employment rate.3 The main distinction between a follow-up and tracer survey is that the latter may not be fully representative. Much depends on the number of beneficiaries that can be “traced” and interviewed many months (if not years) after their participation in the programme.
Typically, six months after the programme’s end, a follow-up survey is conducted with participants to verify their labour market status and level of earnings. Ideally, all participants need to be interviewed either through a one-to-one interview, face to face or by telephone. If the number of participants is large, a representative sample needs to be drawn to ensure the validity of the data collected.
The design and implementation of the follow-up survey follows the same steps of the collection of primary baseline data (selection of the sampling strategy, design and pilot-testing of the questionnaire; and data collection and cleaning). The only difference is that the survey instruments need to be designed to verify both quantity and quality of employment and measure the relevance of service provision to employment outcomes.
3 Tracer studies obtain their name from the primary activity involved, which is to trace, find or locate a group of individuals. Tracer studies are sometimes referred to as follow-up studies because they trace individuals some time after their participation in a programme, and follow-up on what has happened in their lives subsequently. For a complete guide to tracer studies see International Programme on the Elimination of Child Labour (IPEC), 2011. Child Labour Impact Assessment Toolkit: Tracer
Study Manual (Geneva, ILO).
