principal professional development summer 2005 getting ready for school improvement planning office...
TRANSCRIPT

Principal Professional Principal Professional DevelopmentDevelopment
Summer 2005Summer 2005
Getting Ready for School Improvement Planning
Office of School Intervention & SupportOffice of Accountability, Assessment, & Intervention

GoalsGoals
Participants will gain skills for their use of the Participants will gain skills for their use of the Getting Results!Getting Results! frameworks. frameworks.
Participants will:Participants will: become familiar with the differences and become familiar with the differences and
similarities between the 2004 and 2005 PSSA similarities between the 2004 and 2005 PSSA reporting categoriesreporting categories
practice analyzing data and synthesizing practice analyzing data and synthesizing findings from multiple sources using their own findings from multiple sources using their own datadata
engage in discussion of “root causes”engage in discussion of “root causes”

What is What is Getting Results! Getting Results! ??
framework for school improvement planning framework for school improvement planning developed by PDE that the School District of developed by PDE that the School District of Philadelphia has adaptedPhiladelphia has adapted

What’s Different?What’s Different?What are the Implications?What are the Implications?
AYP - Grades 3 through 8 and 11AYP - Grades 3 through 8 and 11 Reported Results - Assessment Anchors Reported Results - Assessment Anchors Parent Involvement Action Sequence New SIP Format PDE Review of SIPs Review of SIPs Science will be introduced in next year’s SIPScience will be introduced in next year’s SIP

Reporting Category StandardA. Comprehension and Reading Skills
1.1 Learning to Read Independently1.2 Reading Critically in All Content Areas
B. Interpretation and Analysis of Fiction and Nonfiction Text
1.1 Learning to Read Independently1.2 Reading Critically in All Content Areas1.3 Reading, Analyzing and Interpreting Literature
Not Assessed 1.7 Characteristics andFunction of the EnglishLanguage
1.8 Research
New PSSA ReadingReporting Categories

Reporting CategoryReporting Category StandardStandard
A. Numbers & Operations 2.1 Numbers
2.2 Computation
B. Measurement 2.3 Measurement
C. Geometry 2.9 Geometry
2.10 Trigonometry
D. Algebraic Concepts 2.8 Algebra
E. Data Analysis &
Probability
2.6 Statistics & Data
2.7 Probability
Standards assessed over the
five reporting categories
2.4 Mathematical Reasoning
2.5 Problem Solving
Not Assessed/Integrated in others 2.11 Concepts of Calculus
New PSSA MathematicsReporting Categories

Getting Results!Getting Results!
School District of Philadelphia
School ImprovementPlanning Process
School District of Philadelphia
School ImprovementPlanning Process
PD CalendarMilestones of
ProgressExecutive Summary
PD CalendarMilestones of
ProgressExecutive Summary
Step 2:DesignStep 2:Design
Step 4:Development
of People
Step 4:Development
of PeopleStep 3:DeliveryStep 3:Delivery
Summary of Shared ValuesSummary of
Shared Values
PrioritizeImprovement
Targets
PrioritizeImprovement
Targets
Step 1:Summarize Data
Identify Root Causes
Step 1:Summarize Data
Identify Root Causes
Step 5:Documentation
Step 5:Documentation
A 5 Step Process

1. READINGAt least 54% of all students will be proficient in Reading, as measured by the annual state-wide PSSA assessments.
2. MATHEMATICSAt least 45% of all students will be proficient in Mathematics, as measured by the annual state-wide PSSA assessments.
3. STUDENT PARTICIPATION IN STATE ASSESSMENTSAt least 95% of eligible students will participate in required state-wide assessments.
4. STUDENT ATTENDANCEStudent attendance in school will improve continuously (to an average of at least 90% by 2014).
5. FOUR-YEAR GRADUATION RATE (high schools only)The 4-year graduation rate for high school students will increase consistently (to at least 80% by 2014).
2005-2007 Student Achievement Improvement Targets *
* If your school has already met these targets for all students and student groups, consider setting your own challenging, ‘stretch’ targets that will ensure continuous improvement of instructional practices and student
achievement.
Every school improvement plan must address the following areas of student success:

Achievement
School Profile
SAT Team
Walk Through
Student Performance
Goals-------------
Strategies &
Interventions
MonitoringOf Evidence
Evaluating
Task
Task
Task
Task
Reporting
ProfessionalDevelopment
Getting Results Process Flow
DATA SOURCES
DataSummary
Step 1
Step 2 Step 3
Step 4
Step 5
Repeat Steps 1 through 5 for each component of the SIP.
TARGETS ACTION SEQUENCES DOCUMENTATION

Summarize the Shared ValuesSummarize the Shared Values
• Summary includes the shared values, mission, Summary includes the shared values, mission, core beliefs, and vision of the school communitycore beliefs, and vision of the school community

Data
Collect, Synthesize, Prioritize and Summarize
Data
Collect, Synthesize, Prioritize and Summarize
analyze student data
identify most significant weaknesses/gaps
prioritize weaknesses/gaps

Data Analysis GuideData Analysis Guide
Worksheets to Assist in Analysis of Multiple Data Sources for School Improvement Planning

Table of Contents
Introduction Page 3
PSSA Data Analysis - Reading Page 6
PSSA Data Analysis – Mathematics Page 15
TerraNova Data Analysis – Reading Page 24
TerraNova Data Analysis – Mathematics Page 27
Benchmark Data Analysis Page 30
Summary of Data Analysis Page 32
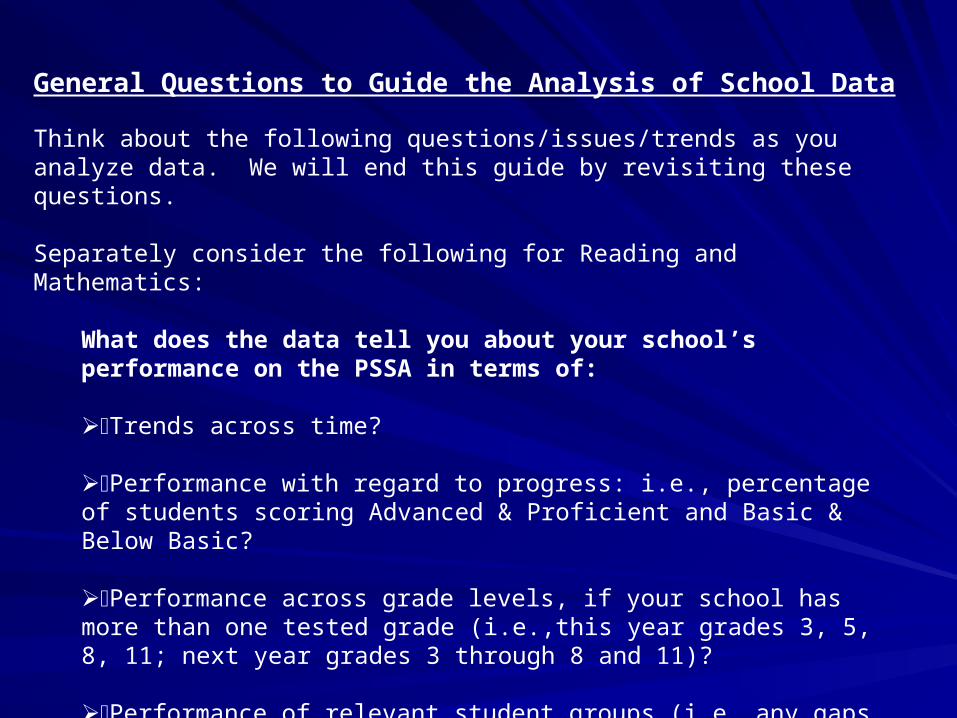
General Questions to Guide the Analysis of School Data
Think about the following questions/issues/trends as you analyze data. We will end this guide by revisiting these questions.
Separately consider the following for Reading and Mathematics:
What does the data tell you about your school’s performance on the PSSA in terms of:
Trends across time?
Performance with regard to progress: i.e., percentage of students scoring Advanced & Proficient and Basic & Below Basic?
Performance across grade levels, if your school has more than one tested grade (i.e.,this year grades 3, 5, 8, 11; next year grades 3 through 8 and 11)?
Performance of relevant student groups (i.e.,any gaps between groups or with respect to the annual target)?
Performance by PSSA Reporting Category and Assessment Anchors?

Worksheets
These worksheets are designed to assist your school team in determining performancetrends from multiple years of PSSA data results prior to synthesizing data from multiplesources for Step 1: DATA of the School Improvement Plan.
Section A: PSSA Performance Levels
What does the data tell you about how your school performed on the PSSA?Percentage (%) of Students Proficient &Advanced, and Basic & Below Basic inReading on the PSSA
Use the data for the school year 2004-2005 from The Pennsylvania School Report:Performance Levels: Reading (page 2) and use the data for previous school years fromyour School Profile* to complete the table below:
Total % Advanced &Proficient
Total % Basic & BelowBasicGrade
2003 2004 2005
Trend↑ ↓ ↔
2003 2004 2005
Trend↑ ↓ ↔
5
8
11

Grade 5Mathematics: Disaggregated Student Group Data: “What percentage of your school’s students scored within each Performance Level?” Use the data from The Pennsylvania
SchoolReport: Overall Performance: Mathematics to complete the table below:
Total % of Advanced andProficient in Mathematics
Total % of Basic andBelow Basic in Mathematics
2003 2004 2005 Trend↑ ↓↔
2003 2004 2005 Trend↑ ↓ ↔
White
Black
Latino/HispanicAsian
NativeAmericanMultiracial
IEP
LEP
EconomicallyDisadvantagedMigrant

PSSA Data Analysis
Section B - Instructional Priorities
Section C - Open-Ended Task Data
Section D - Other Reading Assessment Data

TerraNova / Supera Analysis Worksheet - Reading
Purpose: This document is designed to help you look at several years of TerraNova data by analyzing trends in preparation for identifying target areas for your School Improvement Plan. (Please remember this is one of multiple sources of data that you will use.)The information needed to complete the following two charts can be found in the School Profile on the District’s Website.
Reading
Grade % At/ Above National Average % in Bottom Quartile
Fall 2002 Spring
2003
Total

The information needed to complete this chart is located on the TerraNova Assessment Anchors Report for Reading (CRST 3).
Gr.____Gr.____ Gr.____Gr.____ Gr.____Gr.____ Gr.____Gr.____ Reading Analysis QuestionsReading Analysis Questions
What % of your students mastered Comprehension/Reading What % of your students mastered Comprehension/Reading Skills?Skills?
R.A. 1R.A. 1Fiction TextsFiction Texts
What % of your students mastered Vocabulary Word What % of your students mastered Vocabulary Word Recognition?Recognition?
What % of your students mastered Inferences and What % of your students mastered Inferences and Conclusions?Conclusions?
What % of your students mastered Other Comprehension What % of your students mastered Other Comprehension Skills?Skills?
R.A. 2R.A. 2Nonfiction Nonfiction TextText
What % of your students mastered Vocabulary Word What % of your students mastered Vocabulary Word Recognition?Recognition?
What % of your students mastered Inferences and What % of your students mastered Inferences and Conclusions?Conclusions?
What % of your students mastered Other Comprehension What % of your students mastered Other Comprehension Skills?Skills?
R.B. 1.1, R.B. 1.1, 1.2,1.31.2,1.3Analyze Analyze Fiction/NonficFiction/Nonfictiontion

Benchmark Test Data AnalysisCumulative Benchmark Test Results – October 2004 – June 2005
What do the data show about the school average percentage of items correct compared to the district average? For each Reading Standard, circle the grade level(s) where the average percentage of items correct was low( below 60%) and/or substantially lower( 5-10% point difference) that the average for the District:
Grade Level:
3 4 5 6 7 8 9 10 1.1-Learning to Read Independently
3 4 5 6 7 8 9 10 1.2-Read Critically in All Content Areas
3 4 5 6 7 8 9 10 1.3-Reading, Analyzing and Interpreting Literature
3 4 5 6 7 8 9 10 1.7 Characteristics and Functions of the English Language
3 4 5 6 7 8 9 10 1.8 Research
Comments:__________________________________________________________________________________________________________________________________________________________________________________________________________________

Data Analysis Activity
Do you notice a difference across years?
What about across grades?
Are there discrepancies between Reading and Language?
What are the instructional implications for your school?
Turn to a partner and share your findings.

Benchmark Data Analysis Benchmark Data Analysis ActivityActivity
SchoolName Grade Standard
# ofItems
School %Correct
District %Correct
SCHOOL 5 1.3.5. 33 54.2% 67.7%SCHOOL 6 1.3.6. 36 54.4% 68.2%SCHOOL 7 1.3.7. 25 66.0% 71.3%SCHOOL 6 1.1.6. 52 49.2% 63.3%

Root Causes
Introduction & ExercisesIntroduction & Exercises

Root Causes
A Root Cause is the deepest underlying cause or causes of positive or negative symptoms within any process, which if removed, would result in elimination, or substantial reduction, of the symptom.

Why Root Cause Analysis ?
Root Cause Analysis:
• helps to eliminate the problem, not just the symptom
• conserves scarce resources
• promotes discussion and reflection
• provides rationale for strategy selection

Determining Root Causes
Will correcting or eliminating this root cause result in success?
If yes, then it is a root cause.
If no, then it is a contributing factor.

Possible Root Cause
If teacher content knowledge improves greatly, then student achievement will increase.
Is this necessarily true?

A Guide for Identifying Root Causes
“We can talk or dream about the glorious schools of the future or we can create them .”
Marilyn Ferguson

Dimensions of School Improvement
SUPPORTING REALMparents
governancepersonnel
ENABLING REALMmaterialsschedules
professional developmentorganizational structures
CORE REALMinstructioncurriculumassessments
school leadershipmonitoring
staff accountability for performanceothers identified by the school
fundingstudent readiness to learn
others identified by the school

Checking for UnderstandingChecking for Understanding
What are your questions about
analyzing data and identifying root
causes?

Step 1: DataStep 1: Data
Where are we now?Where are we now?
Summary – includes highlights of the Summary – includes highlights of the analyses of student dataanalyses of student data
Identification of root causes that prevent or Identification of root causes that prevent or promote student achievementpromote student achievement

Step 2: Design
Where do we want to go next?
Step 2: Design
Where do we want to go next?
Select research based, high leverage Select research based, high leverage strategies that address the root causesstrategies that address the root causes
Action sequence for reading and mathematics Action sequence for reading and mathematics is requiredis required
Thematic schools may select a strategy to Thematic schools may select a strategy to support their themesupport their theme

Step 3: Delivery
How are we going to get there?
Step 3: Delivery
How are we going to get there?
Same processSame process Importance of building capacity of staffImportance of building capacity of staff Maximum use of resources (human and financial)Maximum use of resources (human and financial)

Step 4: Development of People
What additional skills do we need?
Step 4: Development of People
What additional skills do we need?
Determine training and skills needed by staffDetermine training and skills needed by staff
Professional development calendar aligns to Professional development calendar aligns to
address rootaddress root causes/student needscauses/student needs

Step 5: Documentation
How do we track our progress?
Step 5: Documentation
How do we track our progress?
Effectiveness of strategiesEffectiveness of strategies
Documentation process (time intervals)Documentation process (time intervals)

Milestones of ProgressMilestones of Progress
Quality of TeachingQuality of Teaching
Quality LeadershipQuality Leadership
Artful Use of InfrastructureArtful Use of Infrastructure
Continuous Learning EthicContinuous Learning Ethic

Checking for UnderstandingChecking for Understanding
What are your questions about the
action sequence?

What can you expect for September?
