princess anne district stormwater … 02, 2017 · sherwood lakes 1. pump station (5 cfs) with...
TRANSCRIPT

Topics
o Sea Level Rise and the Southern Watersheds
o Ashville Park
o Sherwood Lakes
o Kingston Estates
o Drainage Operations & Maintenance in the Southern Watersheds
PRINCESS ANNE DISTRICT STORMWATER PROJECTS
1

SEA LEVEL RISE AND THE SOUTHERN WATERSHEDS
DR. BRIAN BATTEN, DEWBERRY
2
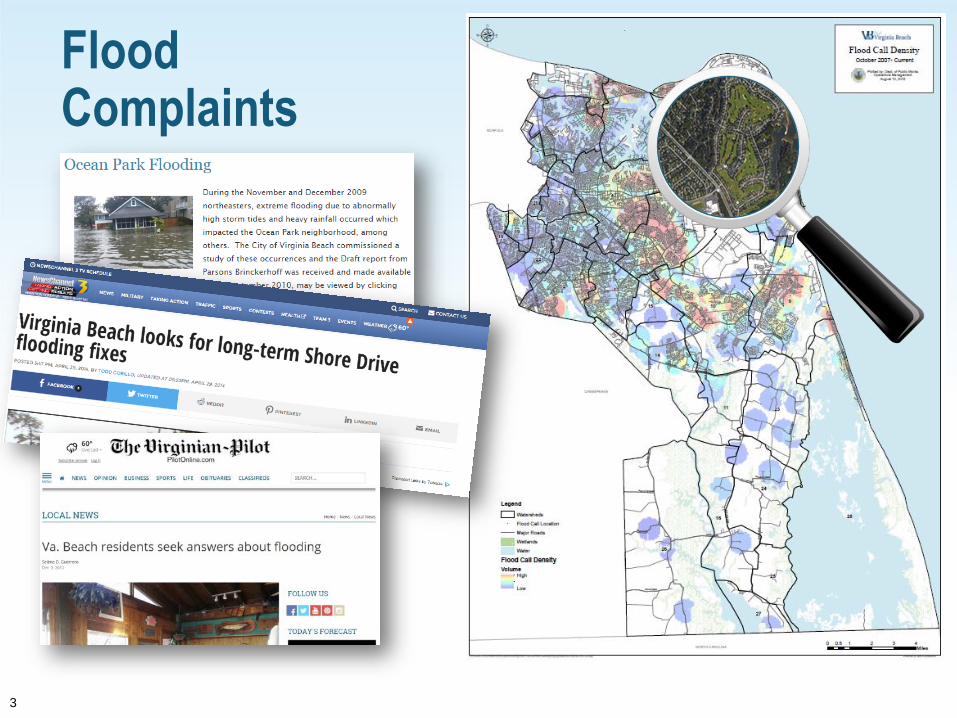
Flood Complaints
3

City Response to Issues
• Virginia Beach City Council provided funding for a
comprehensive sea level rise and recurrent flooding
assessment and response plan in FY15
• Dewberry, a national consultant firm, retained by the City
to conduct study in January 2015
• City awarded $850k grant from NOAA in March 2016
• Collaborative effort with Stormwater Master Plan
4
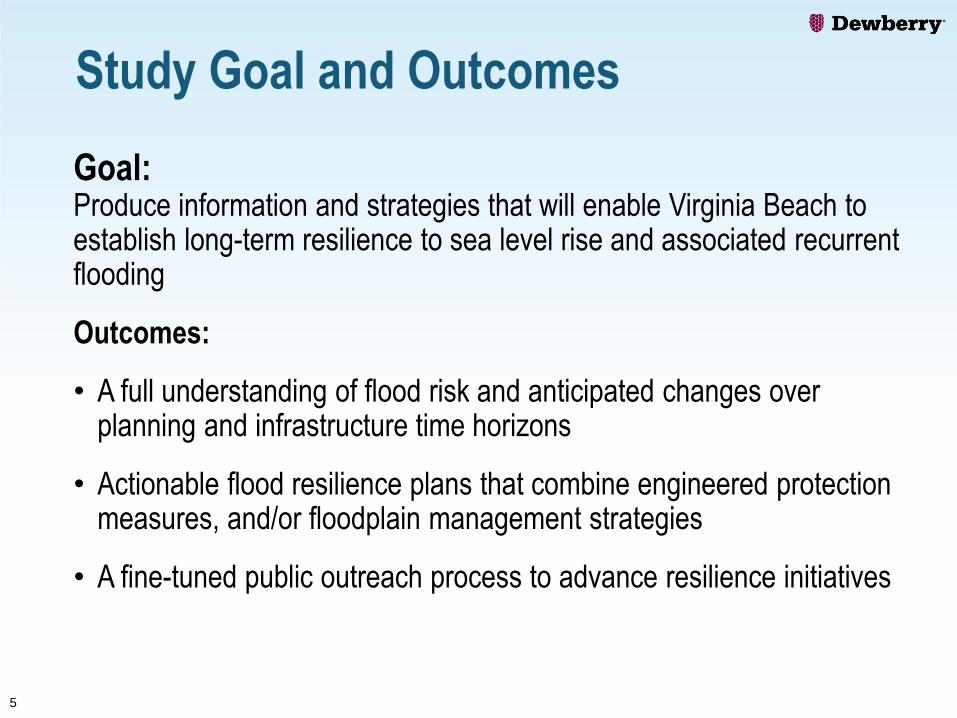
Study Goal and Outcomes
Goal: Produce information and strategies that will enable Virginia Beach to establish long-term resilience to sea level rise and associated recurrent flooding
Outcomes:
• A full understanding of flood risk and anticipated changes over planning and infrastructure time horizons
• Actionable flood resilience plans that combine engineered protection measures, and/or floodplain management strategies
• A fine-tuned public outreach process to advance resilience initiatives
5

Watershed Level Plans• Economic and environmental diversity require 4 distinct
plans
6
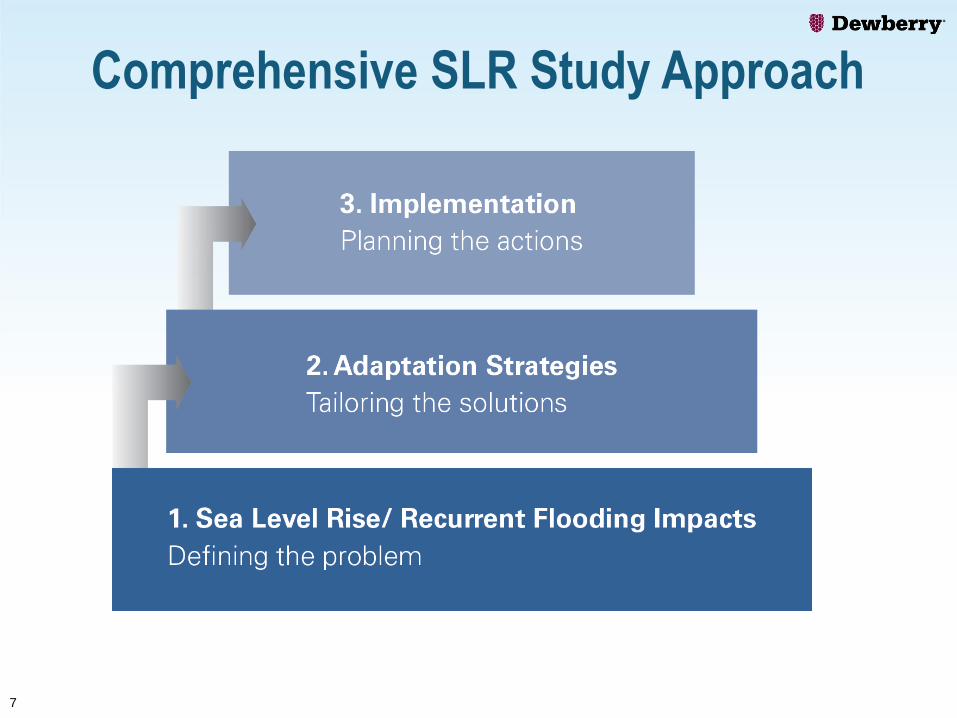
Comprehensive SLR Study Approach
7

Phase 1: Sea Level Rise/Recurrent Flooding Impacts
• Objective: Identify the location, frequency and potential cost of existing and future flood risk to the City
• How will vulnerability change with increasing flood levels due to SLR?
• Where will we see the flood footprint expand?
• How much more frequent will flooding occur?
• What assets are vulnerable?
• What are the losses, how will they change?
• What assets are at the highest risk?
8

SLR Observations
9
Local/Regional Trends
Rise in Last 50-years
Location Increase, ft
Sewells Point 0.8
Chesapeake Bay
Bridge Tunnel1
Duck 0.7
Oregon Inlet 0.7
Norfolk
Chesapeake Bay
Duck, NC

SLR and Recurrent Flooding
Today’s 1-yr water levelwas the 10-yr water level in the 1950s10
Image Credit: NOAA

VB SLR Planning Scenarios
Life Cycle
Alignment
Time
Horizon/
Time
Period
SLR
ValueRelevance Use
Municipal Planning
20-40 years
2035-20551.5 ft
Comprehensive Plan & Outcomes
Short end of Commercial and Utility
life-cycles
Vulnerability assessment
Key planning value
Basis for evaluation of all adaptation strategies
Critical Infrastructure
Long-term awareness
AdaptiveCapacity
50-70 years
2065-2085
3.0 ft
Utility Infrastructure life-cycle
Transportation infrastructure
lifecycles
Residential structure lifecycles
Secondary vulnerability assessment to provide insight into
long-term risk
Basis for long-term infrastructure decisions
Evaluate cost-effectiveness of additional protection for adaptable
resilience strategies
11

Flood Assessment Conditions
• Tidal• Daily tidal flooding
• Future permanent inundation
• Defined by NOAA, Mean Higher High Water
• Nuisance • Wind-driven surge, extreme tide events
• Repetitive losses/loss of function or service
• Defined by water level analysis
• Storm Surge• Nor’easters, tropical storms, hurricanes
• 10-, 25-, 50-, 100-, 500-yr recurrence intervals
• Defined by probabilistic analysis12

Southern Watershed Issues – Wind Tides
13
• Southerly winds push water into Back Bay, North Landing River
• Flood low-lying areas
• Instances since early 1900’s
• Ongoing area of focus
• Design water surface elevations in the Virginia Beach Public Works Standards and Specifications exceeds wind tide levels
Credit: SeaGrant
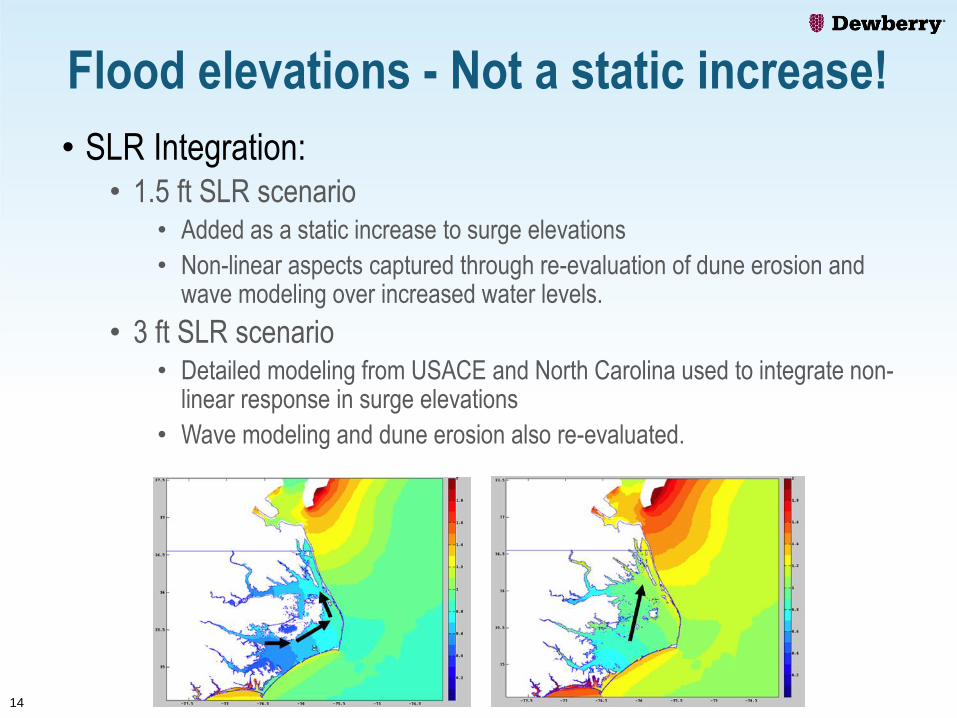
Flood elevations - Not a static increase!
• SLR Integration: • 1.5 ft SLR scenario
• Added as a static increase to surge elevations
• Non-linear aspects captured through re-evaluation of dune erosion and wave modeling over increased water levels.
• 3 ft SLR scenario • Detailed modeling from USACE and North Carolina used to integrate non-
linear response in surge elevations
• Wave modeling and dune erosion also re-evaluated.
14
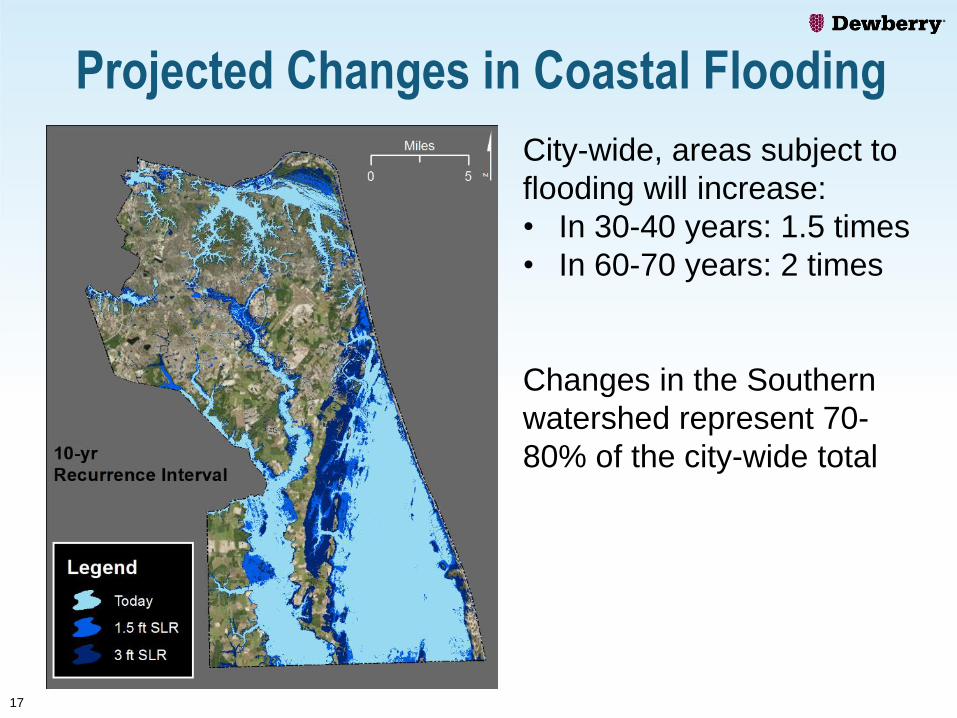
Projected Changes in Coastal Flooding
City-wide, areas subject to
flooding will increase:
• In 30-40 years: 1.5 times
• In 60-70 years: 2 times
Changes in the Southern
watershed represent 70-
80% of the city-wide total
17
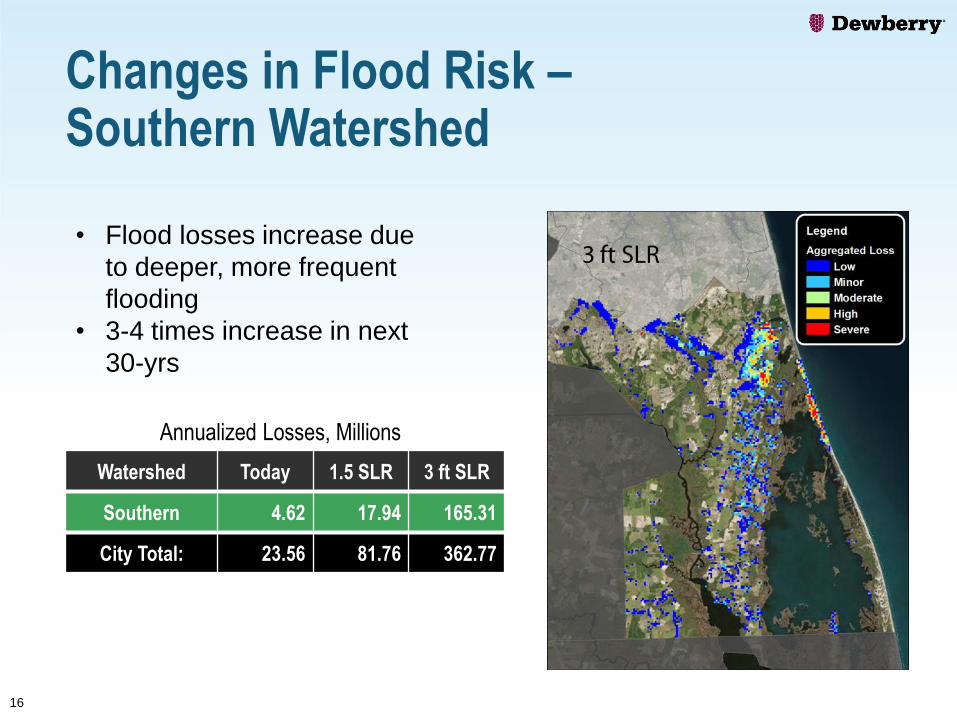
Changes in Flood Risk –Southern Watershed
16
• Flood losses increase due
to deeper, more frequent
flooding
• 3-4 times increase in next
30-yrs
Watershed Today 1.5 SLR 3 ft SLR
Southern 4.62 17.94 165.31
City Total: 23.56 81.76 362.77
Annualized Losses, Millions
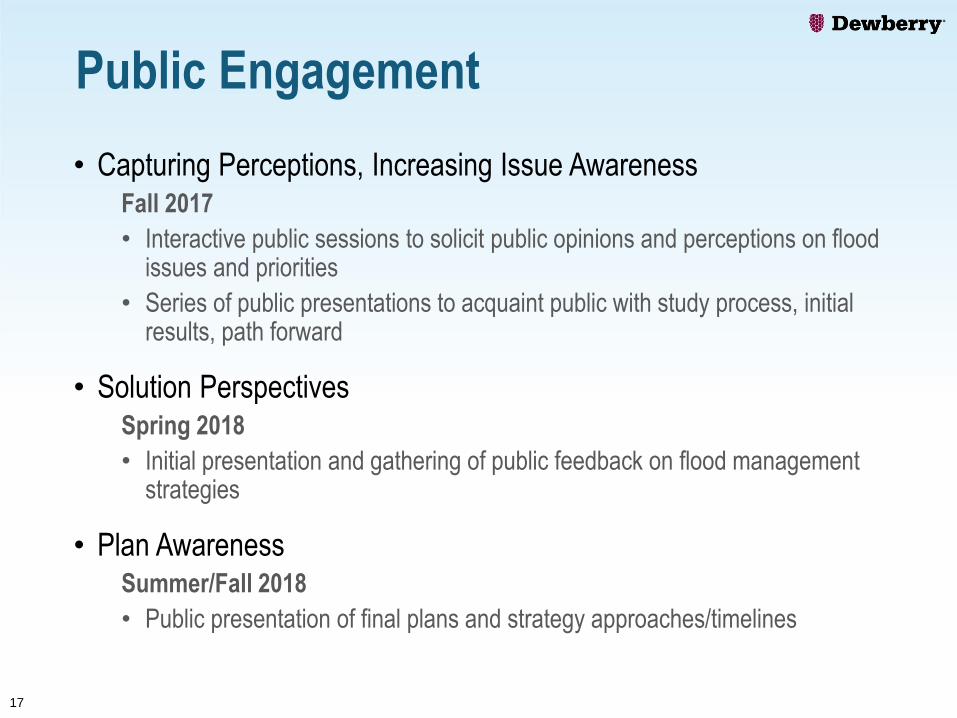
Public Engagement
• Capturing Perceptions, Increasing Issue AwarenessFall 2017
• Interactive public sessions to solicit public opinions and perceptions on flood issues and priorities
• Series of public presentations to acquaint public with study process, initial results, path forward
• Solution PerspectivesSpring 2018
• Initial presentation and gathering of public feedback on flood management strategies
• Plan AwarenessSummer/Fall 2018
• Public presentation of final plans and strategy approaches/timelines
17
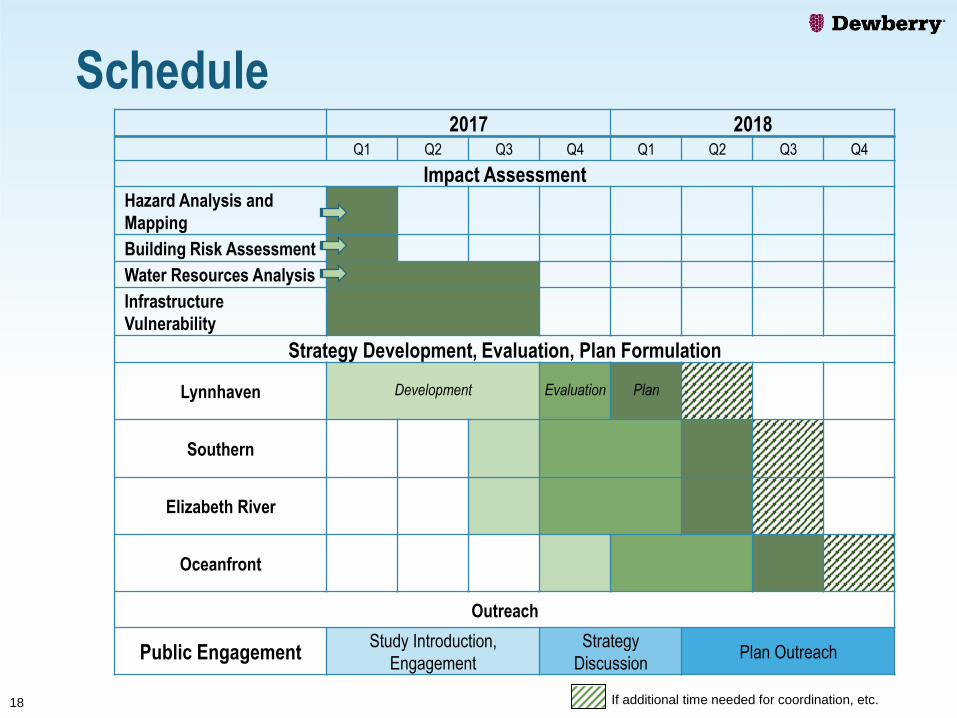
18
2017 2018Q1 Q2 Q3 Q4 Q1 Q2 Q3 Q4
Impact Assessment
Hazard Analysis and
Mapping
Building Risk Assessment
Water Resources Analysis
Infrastructure
Vulnerability
Strategy Development, Evaluation, Plan Formulation
Lynnhaven Development Evaluation Plan
Southern
Elizabeth River
Oceanfront
Outreach
Public EngagementStudy Introduction,
Engagement
Strategy
Discussion Plan Outreach
If additional time needed for coordination, etc.
Schedule

ASHVILLE PARKCJ BODNAR, P.E., PW-ENGINEERING
19

ASHVILLE PARK ENGINEERING ANALYSIS
20
• CDM Smith performed hydraulic analyses of the Ashville Park stormwater system and developed solution alternatives.
• Model of stormwater system was developed using EPA Storm Water Management Model (SWMM).
• EPA SWMM is a complex mathematical model in widespread use across the country (gold standard).
• Nine months to complete, $218,000 to date

ASHVILLE PARK MODEL CALIBRATION
21
• Photos and information from the neighborhood helped provide guidance and after-the-fact water elevation data
• Public Works installed three water surface level gauges for data
• SWMM Model was calibrated using Tropical Storm Julia & Hurricane Matthew
• The model predicted flood water elevations that were within an inch of actual elevations for both storms

ASHVILLE PARK MODEL CALIBRATION
22

Outfall
The outfall system to Flanagan’s Lane and Sandbridge Road is
inadequate. The rock weir cannot pass nearly enough water during a
storm to keep the stormwater within the banks of the lakes
23
STUDY FINDINGS
The receiving ditches and channels
downstream of the outfall do not
have capacity to handle the
stormwater, resulting in higher water
elevations
When water levels are high in Back
Bay and Ashville Bridge Creek, even
less water can pass the outfall

STUDY FINDINGS (CONTINUED)
24
Subdivision Lakes & Stormwater Piping
▪ The stormwater piping and the lakes are inadequate
▪ There is not sufficient lake area to store runoff until it can drain through the system
▪ Higher water levels in the lakes prevent the stormwater pipes in the streets from draining quickly during and after storms
▪ Even with lowered lake elevations and more lake area, the pipe system cannot carry enough stormwater to keep the streets from flooding during significant events

ALTERNATIVES EVALUATED
25
▪ CDM Smith evaluated over 25 improvement scenarios and
provided detailed analyses of the four most viable alternatives
▪ All 4 alternatives provide similar benefits; however, no
improvement can provide complete protection from all storm
events (much greater than 100-year event)
▪ All 4 alternatives require major improvements & upgrades to the
neighborhood drainage system (within the streets)
▪ Alternative D is more resilient to future water levels because of
the location of the proposed pump station
▪ Alternative B is more conducive to phasing and its initial phases
can be implemented faster than the initial phases of Alternative D
▪ In addition to flood reduction, all alternatives provide additional
stormwater quality treatment through expanded and new BMPs
(wet ponds)
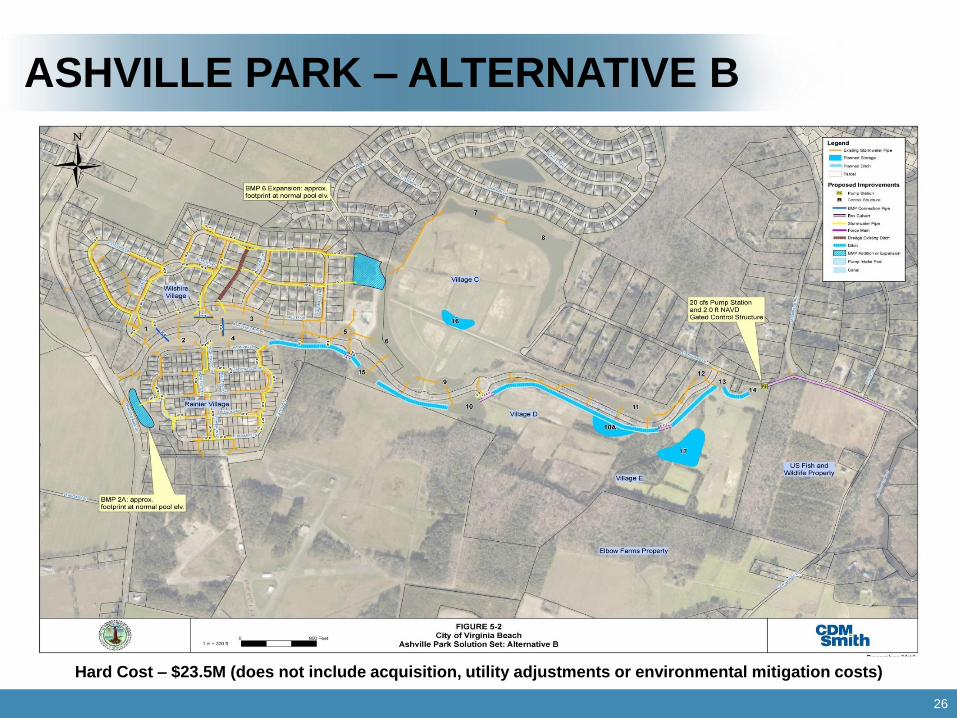
ASHVILLE PARK – ALTERNATIVE B
26
Hard Cost – $23.5M (does not include acquisition, utility adjustments or environmental mitigation costs)
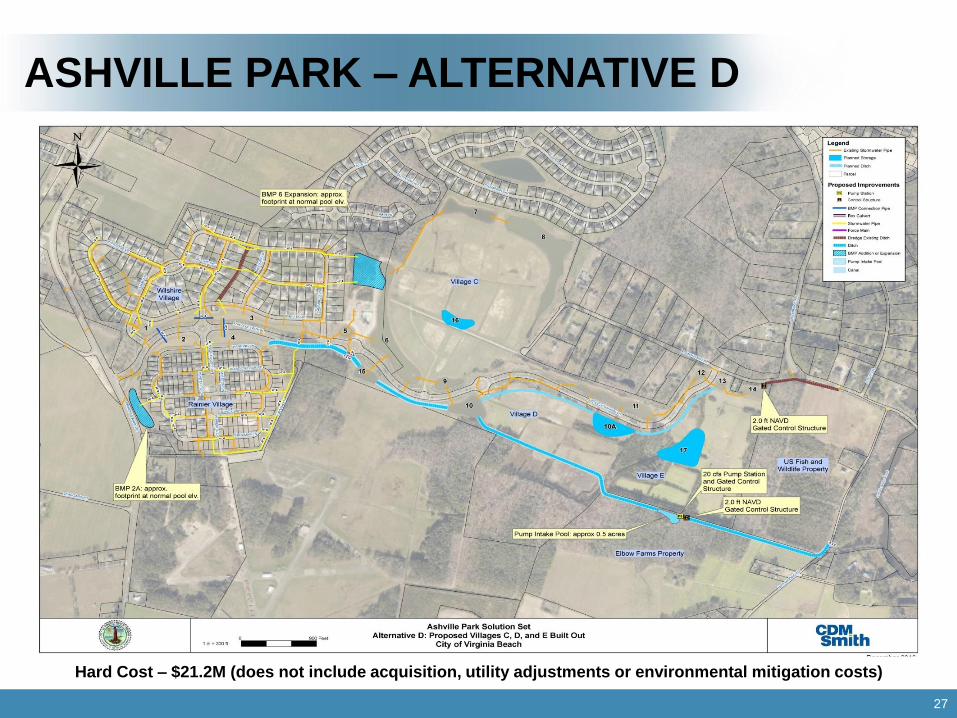
ASHVILLE PARK – ALTERNATIVE D
27
Hard Cost – $21.2M (does not include acquisition, utility adjustments or environmental mitigation costs)

INTERIM IMPROVEMENTS – PHASED APPROACH
28
▪ The FY2018-23 CIP provides $9 million in funding which will allow for the first phase of Alternative B (a.k.a Scenario 5)
o Considerable decrease in flooding duration
o Incremental improvement in the depth of flooding
o Planning level opinion of cost is $8.2 million
▪ The neighborhood and the developer both indicate a desire to continue with the development as long as there are no adverse impacts to the stormwater system in the existing villages
▪ Public Works Engineering has begun the preliminary engineering design of the Scenario 5 improvements

SCENARIO 5 IMPROVEMENTS
29

POSSIBLE VILLAGE C COST-PARTICIPATION
30
▪ Scenario 5 improvements assume Village C will be developed
▪ HomeFed is interested in proceeding with Village C and cost-participating in Scenario 5
▪ Cost-participation based upon additional cost of the phased approach
▪ Cost share is $5.8M (71%) City, $2.4M (29%) HomeFed for initial phase (Alt. B, Scenario 5)
▪ HomeFed to cost participate up to $2.1M in future phases if Villages D & E proceed
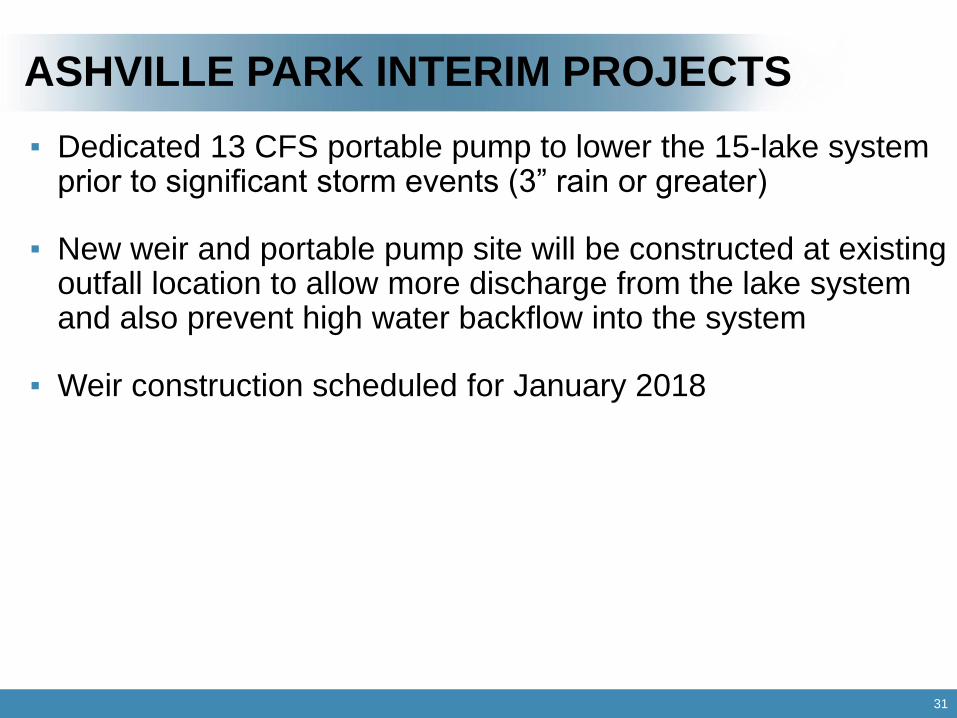
ASHVILLE PARK INTERIM PROJECTS
31
▪ Dedicated 13 CFS portable pump to lower the 15-lake system prior to significant storm events (3” rain or greater)
▪ New weir and portable pump site will be constructed at existing outfall location to allow more discharge from the lake system and also prevent high water backflow into the system
▪ Weir construction scheduled for January 2018
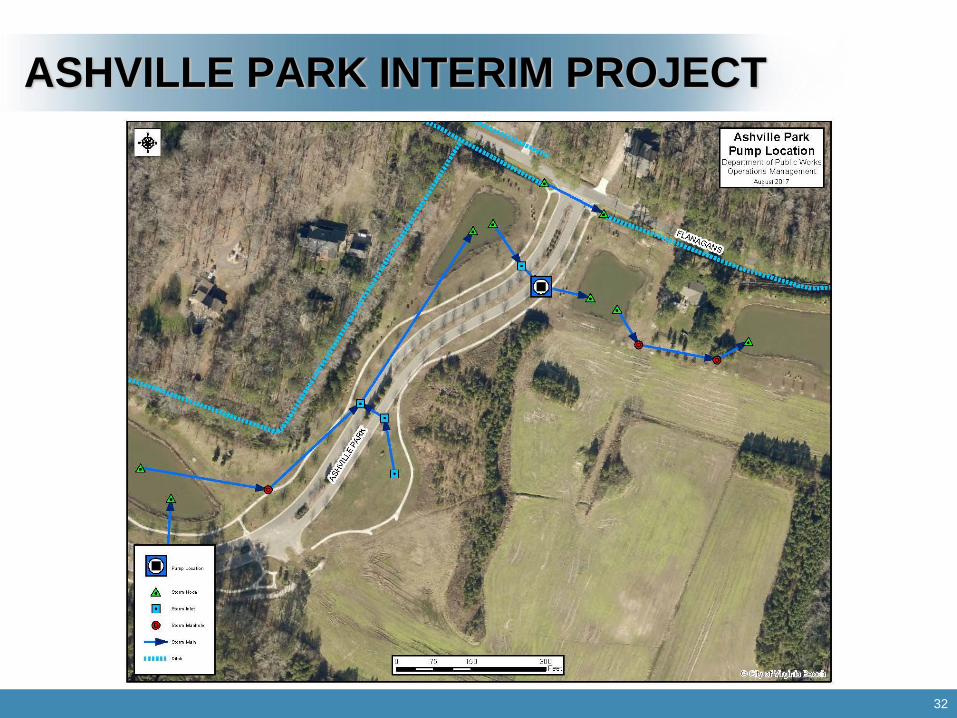
ASHVILLE PARK INTERIM PROJECT
32

SHERWOOD LAKESMIKE MUNDY, P.E., PW-ENGINEERING
33
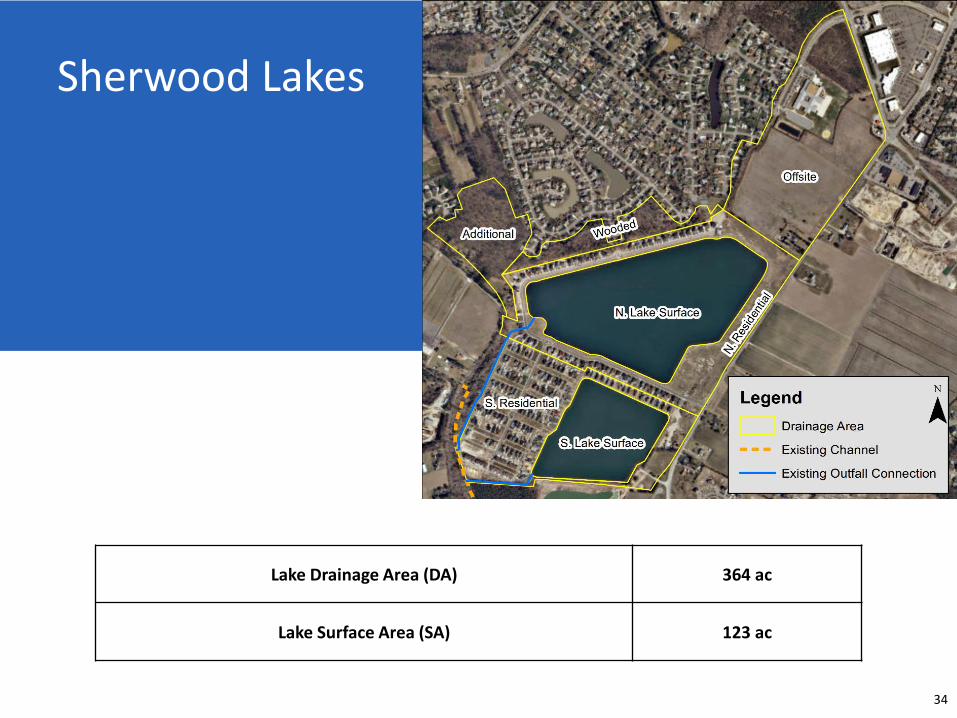
34
Lake Drainage Area (DA) 364 ac
Lake Surface Area (SA) 123 ac
Sherwood Lakes Sherwood Lakes
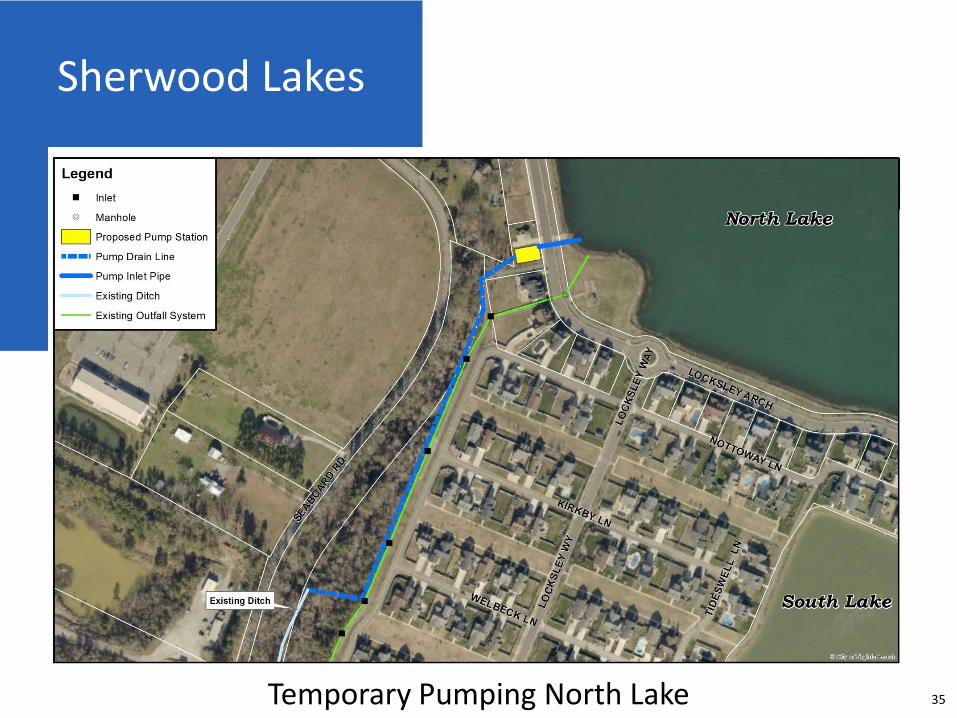
Temporary Pumping North Lake
Sherwood Lakes
35
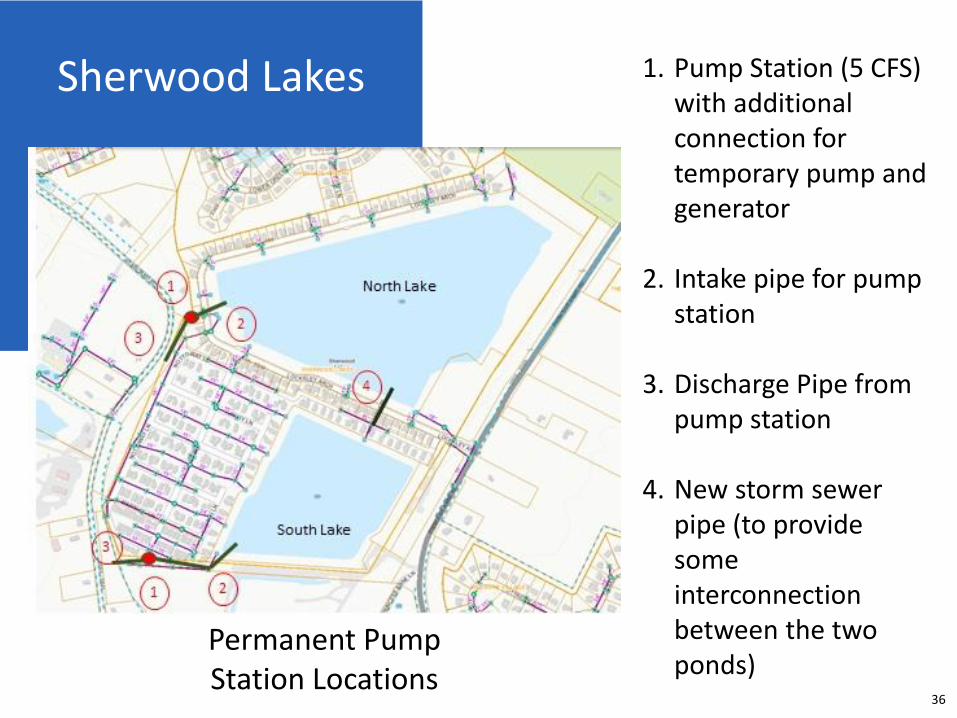
Sherwood Lakes 1. Pump Station (5 CFS) with additional connection for temporary pump and generator
2. Intake pipe for pump station
3. Discharge Pipe from pump station
4. New storm sewer pipe (to provide some interconnection between the two ponds)
Permanent Pump Station Locations
36

KINGSTON ESTATES
(PREVIOUSLY KNOWN AS KING’S LANDING)
LOCATED ON WEST NECK ROAD
37
NANCY MCINTYRE, P.E., L.S., DEVELOPMENT SERVICES ADMINISTRATOR
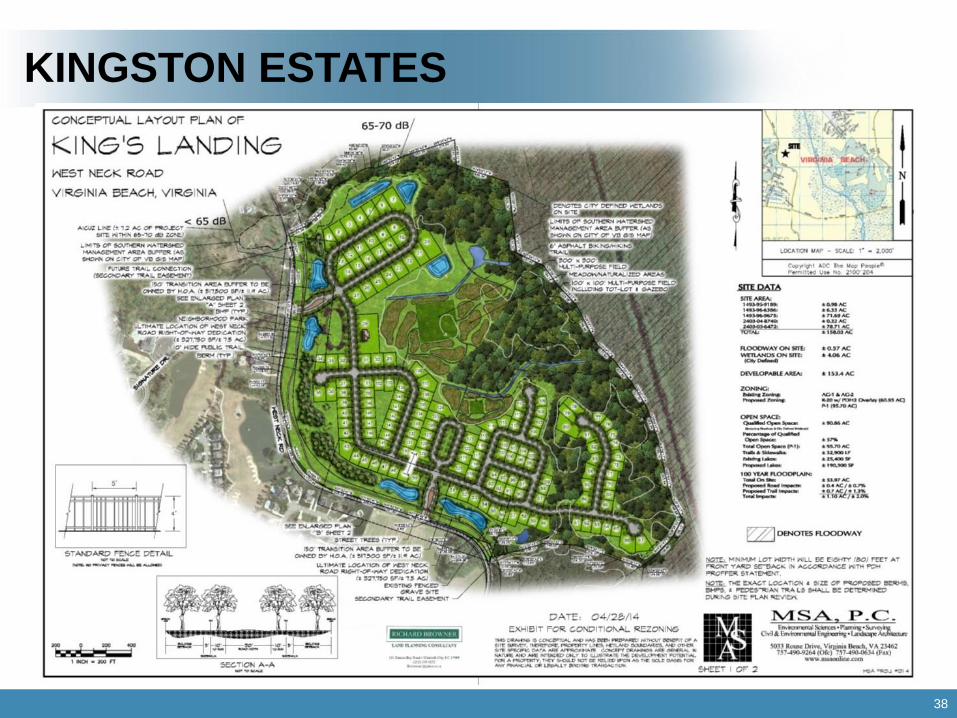
KINGSTON ESTATES
38

KINGSTON ESTATES
39

DRAINAGE OPERATIONS & MAINTENANCE IN THE SOUTHERN WATERSHEDS
MARK JOHNSON, P.E., OPERATIONS ENGINEER
40

CIP PROJECTS
41
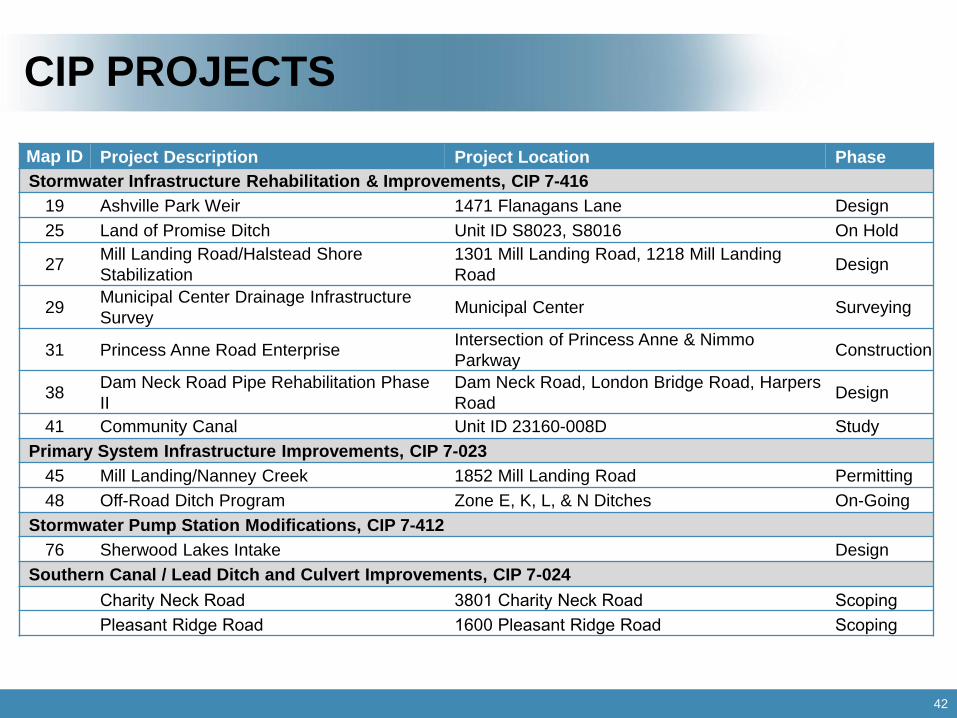
CIP PROJECTS
42
Map ID Project Description Project Location Phase
Stormwater Infrastructure Rehabilitation & Improvements, CIP 7-416
19 Ashville Park Weir 1471 Flanagans Lane Design
25 Land of Promise Ditch Unit ID S8023, S8016 On Hold
27Mill Landing Road/Halstead Shore
Stabilization
1301 Mill Landing Road, 1218 Mill Landing
RoadDesign
29Municipal Center Drainage Infrastructure
SurveyMunicipal Center Surveying
31 Princess Anne Road EnterpriseIntersection of Princess Anne & Nimmo
ParkwayConstruction
38Dam Neck Road Pipe Rehabilitation Phase
II
Dam Neck Road, London Bridge Road, Harpers
RoadDesign
41 Community Canal Unit ID 23160-008D Study
Primary System Infrastructure Improvements, CIP 7-023
45 Mill Landing/Nanney Creek 1852 Mill Landing Road Permitting
48 Off-Road Ditch Program Zone E, K, L, & N Ditches On-Going
Stormwater Pump Station Modifications, CIP 7-412
76 Sherwood Lakes Intake Design
Southern Canal / Lead Ditch and Culvert Improvements, CIP 7-024
Charity Neck Road 3801 Charity Neck Road Scoping
Pleasant Ridge Road 1600 Pleasant Ridge Road Scoping

OFF ROAD DITCH PROGRAM
43
Ditch Cleaning Cycles:
16 years - Original Cycle
8 years - Goal Cycle
12 years - Current Cycle
Other FY 18 Projects:
Canal #2 Inspect/Repair -$300K
Salem Canal Inspect/Repair - $250K
West Neck Creek Inspect/Repair - $350K

STORMWATER MAINTENANCE AND INSPECTIONS
44
▪ Currently 124 open work orders in the Princess Anne District
▪ Roadside Ditch: 11
▪ Cave-in: 81
▪ Pipe Cleaning: 32
▪ Street Sweeping - All City roads are swept 6 times per year (once every other month)
▪ MS4 Inspections
▪ Asset Inspections - 15% of known assets (pipes, structures, ditches) shall be inspected annually
▪ SWMF Inspections – all City maintained SWMF inspected annually, and 20% of the privately maintained SWMF inspected annually.
END OF PRESENTATIONPROCEED TO INFORMATION STATIONS
45