prince of wales hospital patient satisfaction survey april – june 2014
DESCRIPTION
Prince of Wales Hospital Patient Satisfaction Survey April – June 2014. (I) On Admission (Apr – Jun 2014). (I) On Admission. (II) Staying in Ward (Apr – Jun 2014). (II) Staying in Ward. (III) Clinical Service (Apr – Jun 2014). (III) Clinical Service. - PowerPoint PPT PresentationTRANSCRIPT
Prince of Wales HospitalPatient Satisfaction Survey
April – June 2014
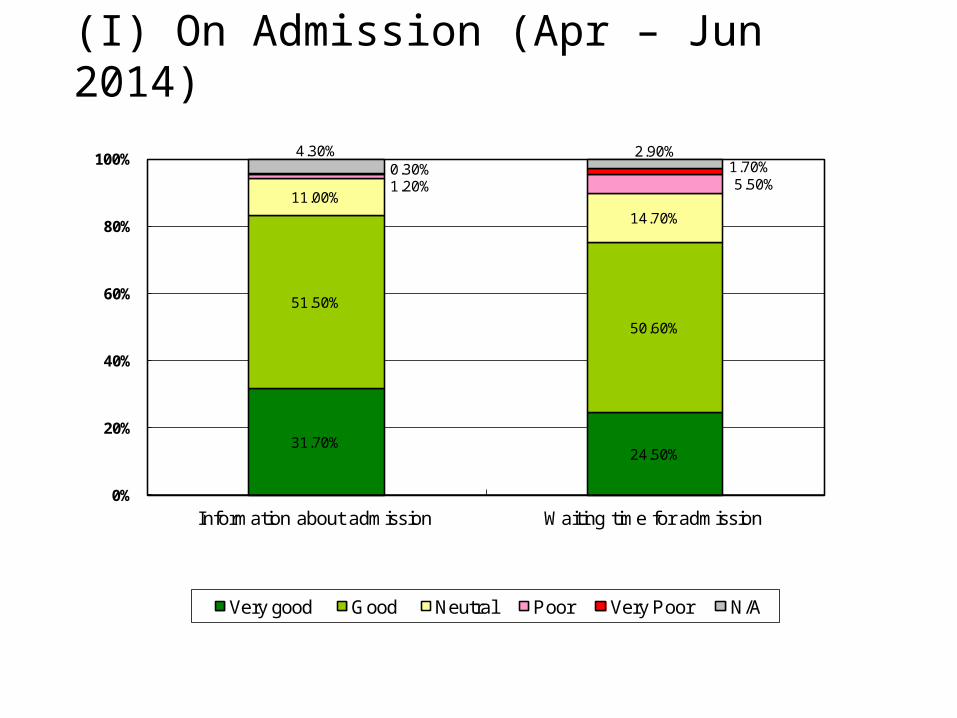
31.70%24.50%
51.50%
50.60%
11.00%
14.70%
1.20% 5.50%0.30% 1.70%
4.30% 2.90%
0%
20%
40%
60%
80%
100%
Information about admission Waiting time for admission
Very good Good Neutral Poor Very Poor N/A
(I) On Admission (Apr – Jun 2014)
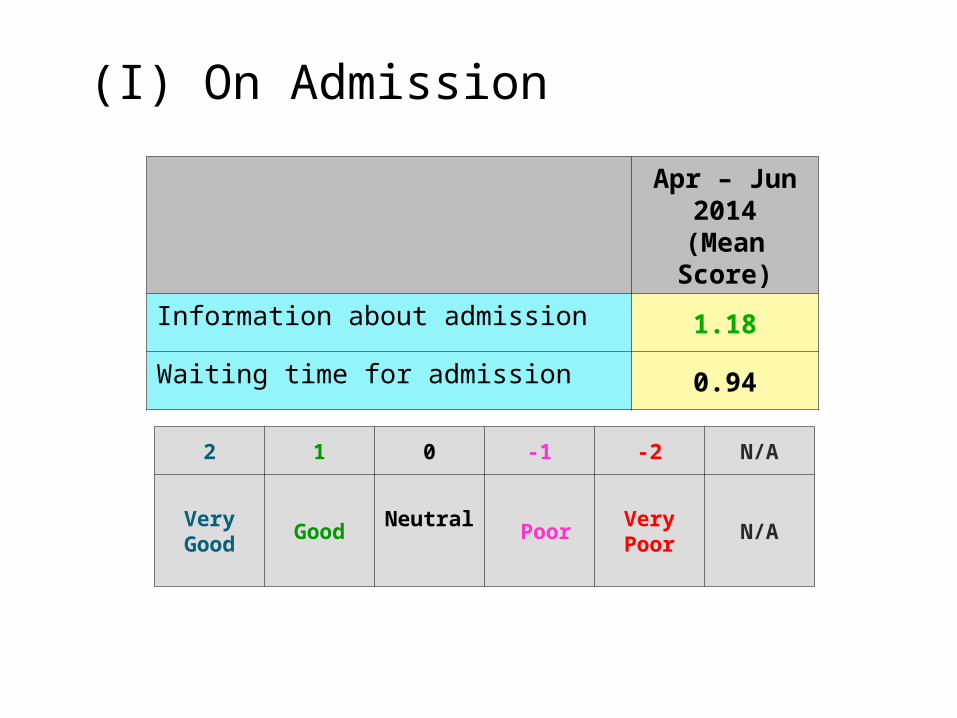
(I) On Admission
Apr – Jun2014
(Mean Score)
Information about admission 1.18
Waiting time for admission 0.94
2 1 0 -1 -2 N/A
Very Good
Good Neutral PoorVery Poor
N/A
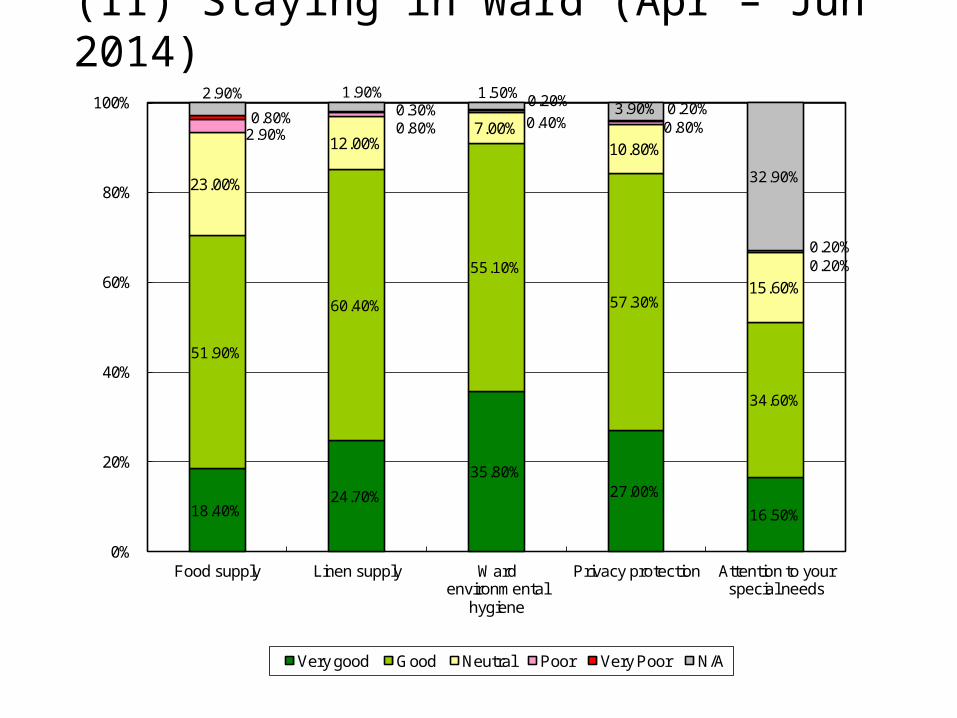
18.40%24.70%
35.80%27.00%
16.50%
51.90%
60.40%
55.10%
57.30%
34.60%
23.00%
12.00%7.00%
10.80%
15.60%
2.90% 0.80% 0.40% 0.80%
0.20%
0.80% 0.30%0.20% 0.20%
0.20%
2.90% 1.90% 1.50%3.90%
32.90%
0%
20%
40%
60%
80%
100%
Food supply Linen supply Ward environmental
hygiene
Privacy protection Attention to your special needs
Very good Good Neutral Poor Very Poor N/A
(II) Staying in Ward (Apr – Jun 2014)
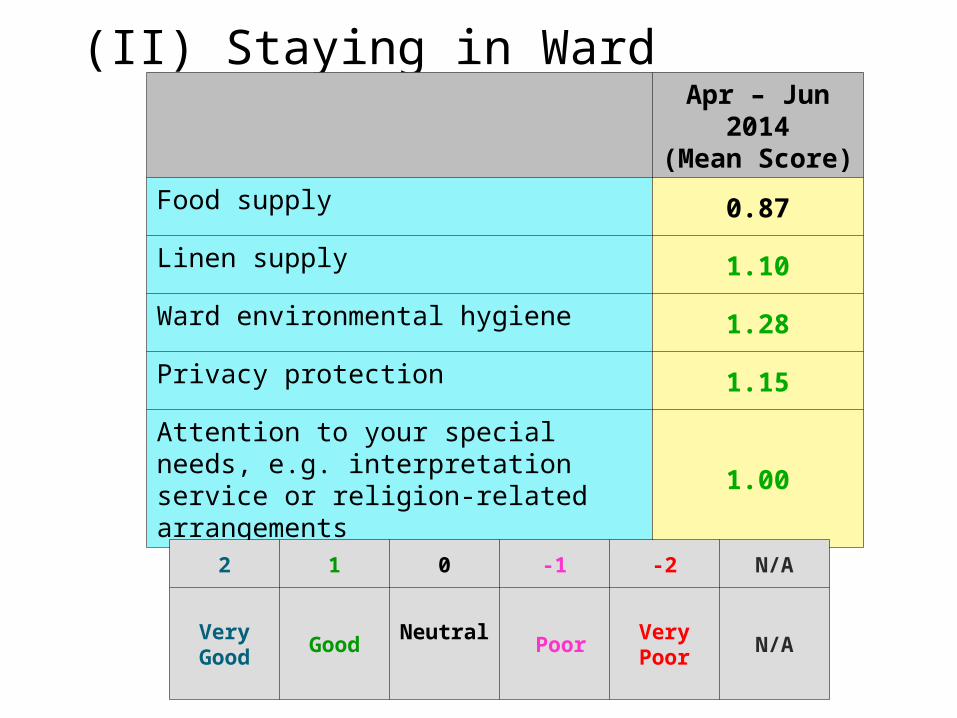
(II) Staying in Ward
Apr – Jun2014
(Mean Score)
Food supply 0.87
Linen supply 1.10
Ward environmental hygiene 1.28
Privacy protection 1.15
Attention to your special needs, e.g. interpretation service or religion-related arrangements
1.00
2 1 0 -1 -2 N/A
Very Good
Good Neutral PoorVery Poor
N/A
35.10%41.50%
51.90%49.50%
8.00%5.90%
1.00%0.80%0.20% 0.10%3.90% 2.20%
0%
20%
40%
60%
80%
100%
Effectiveness of treatment Quality of nurinsg care
Very good Good Neutral Poor Very Poor N/A
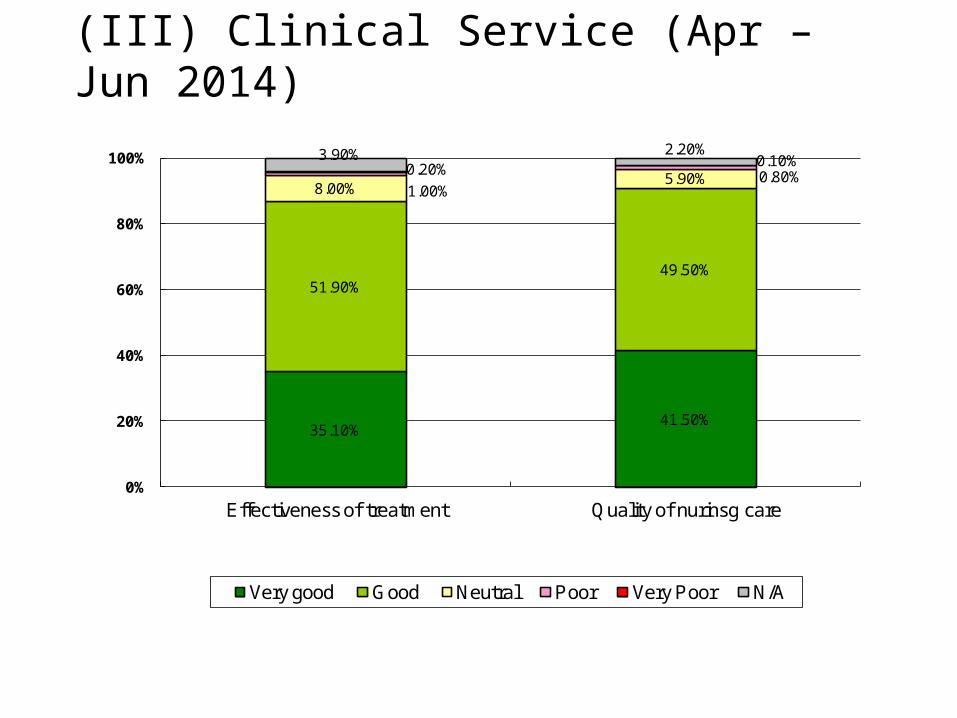
(III) Clinical Service (Apr – Jun 2014)
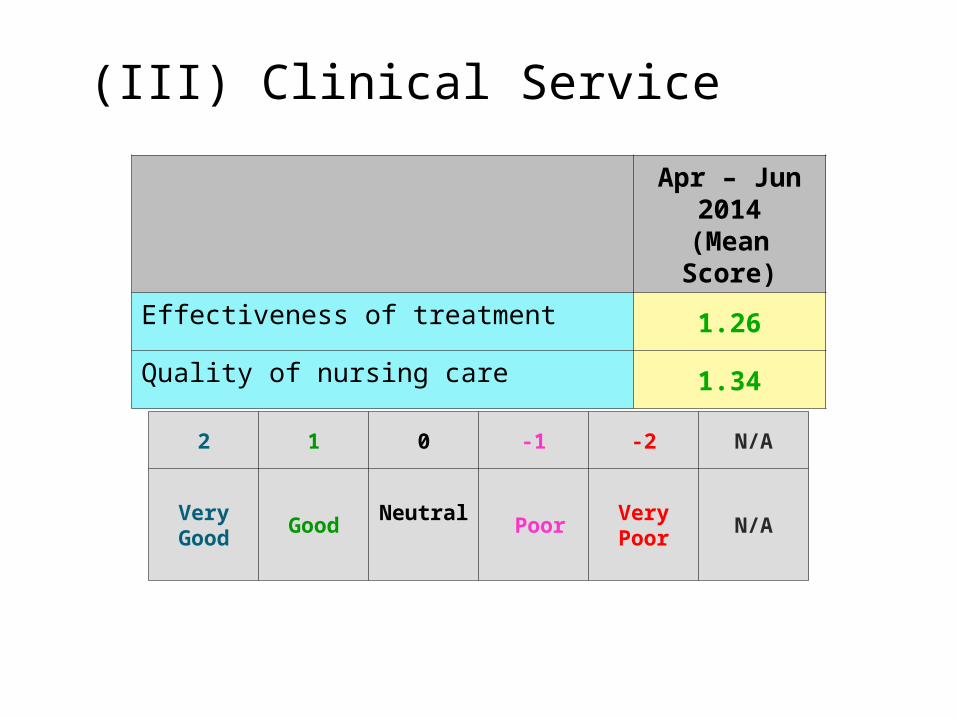
(III) Clinical Service
Apr – Jun2014
(Mean Score)
Effectiveness of treatment 1.26
Quality of nursing care 1.34
2 1 0 -1 -2 N/A
Very Good
Good Neutral PoorVery Poor
N/A
37.40%32.10% 35.70%
30.20%
51.80%
48.90%48.70%
43.20%
6.90%10.70% 7.80%
13.60%
0.90%0.60% 0.50%
0.80%
0.30%0.10% 0.30%
0.30%
2.70%7.70%
7.00%11.90%
0%
20%
40%
60%
80%
100%
Explanation on clinical condition and
treatment plan
Involvement in deciding treatment
plan
Explanation on use of medication
Channels for feedback on hospital
service
Very good Good Neutral Poor Very Poor N/A
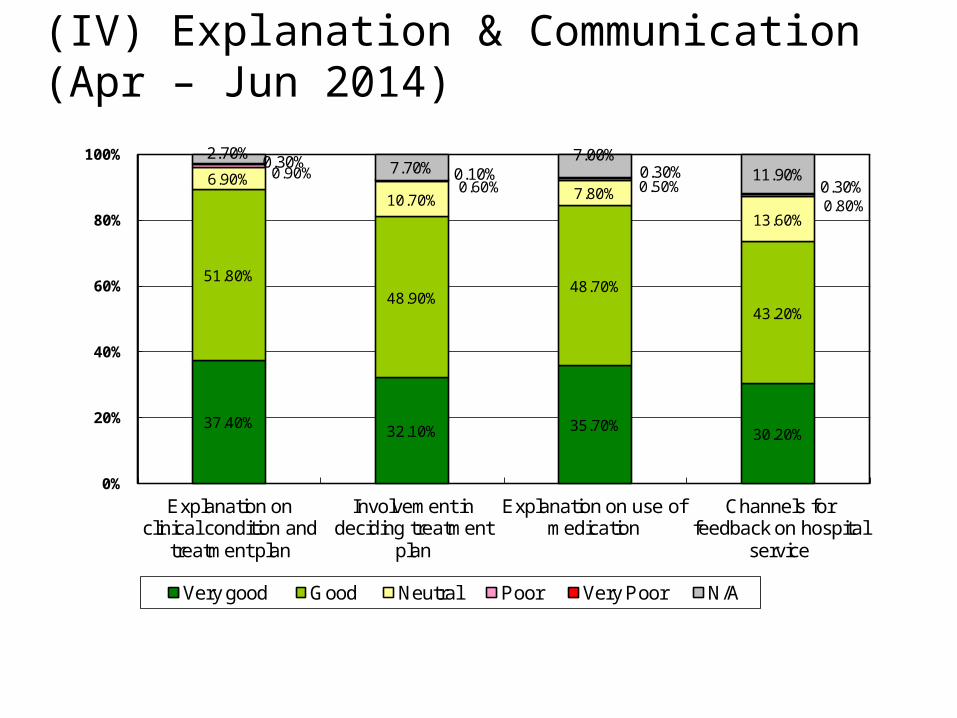
(IV) Explanation & Communication (Apr – Jun 2014)
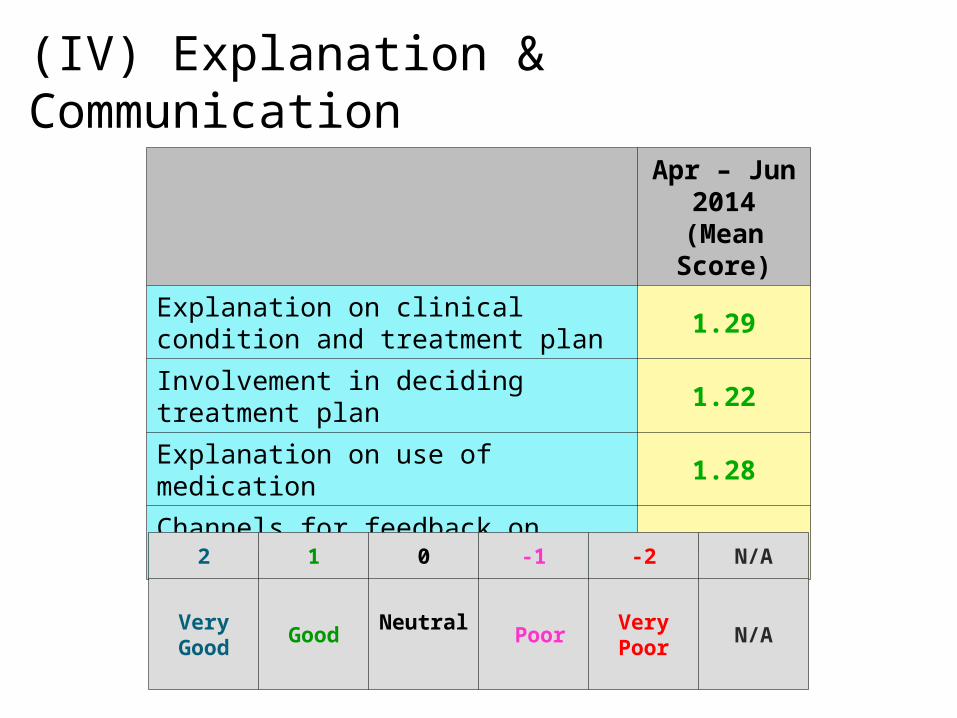
(IV) Explanation & Communication
Apr – Jun2014
(Mean Score)
Explanation on clinical condition and treatment plan
1.29
Involvement in deciding treatment plan 1.22
Explanation on use of medication 1.28
Channels for feedback on hospital service 1.16
2 1 0 -1 -2 N/A
Very Good
Good Neutral PoorVery Poor
N/A
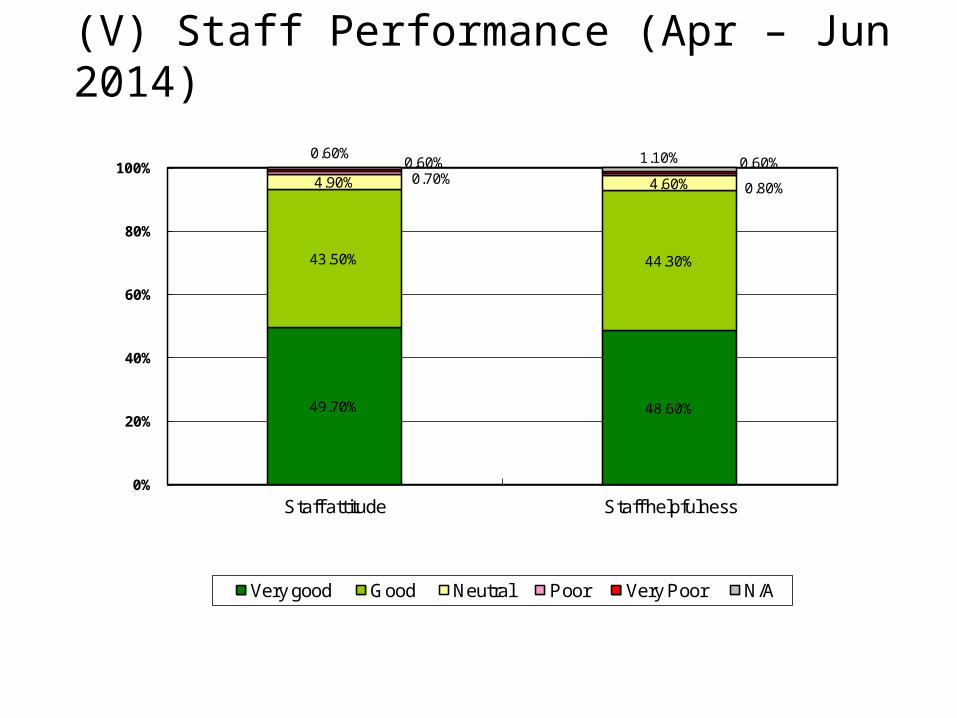
49.70% 48.60%
43.50% 44.30%
4.90% 4.60%0.70%0.80%
0.60% 0.60%0.60% 1.10%
0%
20%
40%
60%
80%
100%
Staff attitude Staff helpfulness
Very good Good Neutral Poor Very Poor N/A
(V) Staff Performance (Apr – Jun 2014)
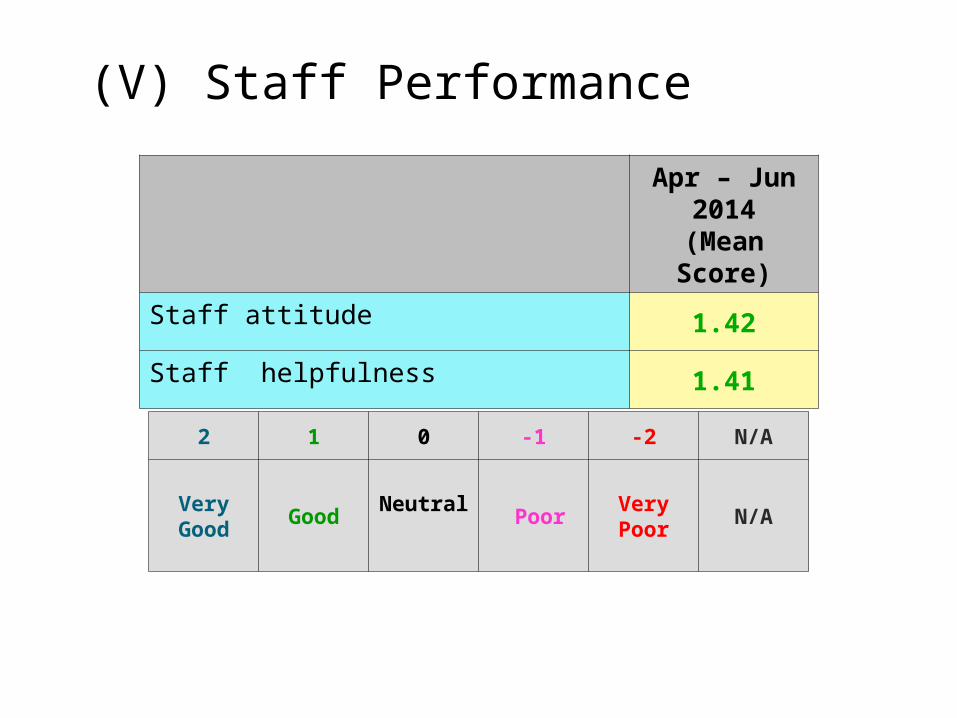
(V) Staff Performance
Apr – Jun2014
(Mean Score)
Staff attitude 1.42
Staff helpfulness 1.41
2 1 0 -1 -2 N/A
Very Good
Good Neutral PoorVery Poor
N/A
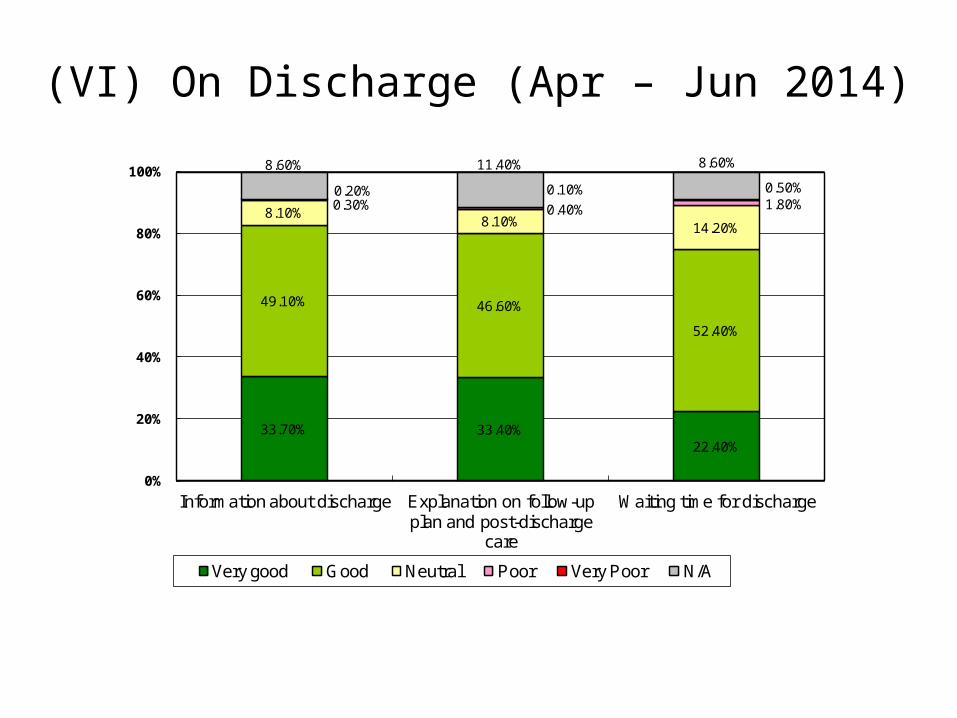
33.70% 33.40%22.40%
49.10% 46.60%
52.40%
8.10%8.10% 14.20%
0.30% 0.40% 1.80%0.20% 0.10% 0.50%
8.60% 11.40% 8.60%
0%
20%
40%
60%
80%
100%
Information about discharge Explanation on follow-up plan and post-discharge
care
Waiting time for discharge
Very good Good Neutral Poor Very Poor N/A
(VI) On Discharge (Apr – Jun 2014)
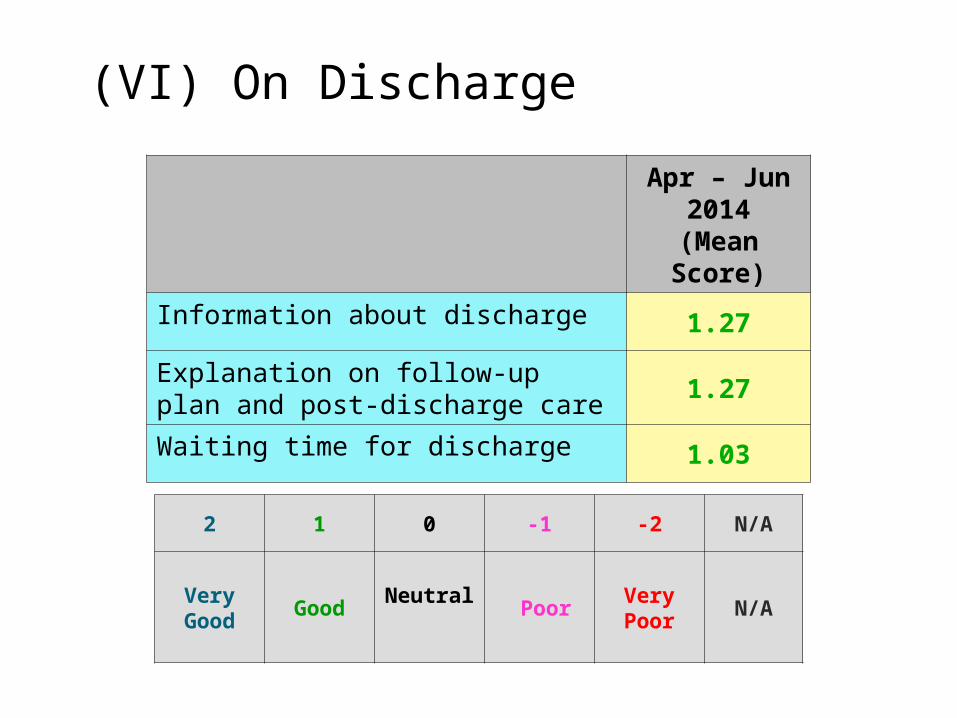
(VI) On Discharge
Apr – Jun2014
(Mean Score)
Information about discharge 1.27
Explanation on follow-up plan and post-discharge care
1.27
Waiting time for discharge 1.03
2 1 0 -1 -2 N/A
Very Good
Good Neutral PoorVery Poor
N/A
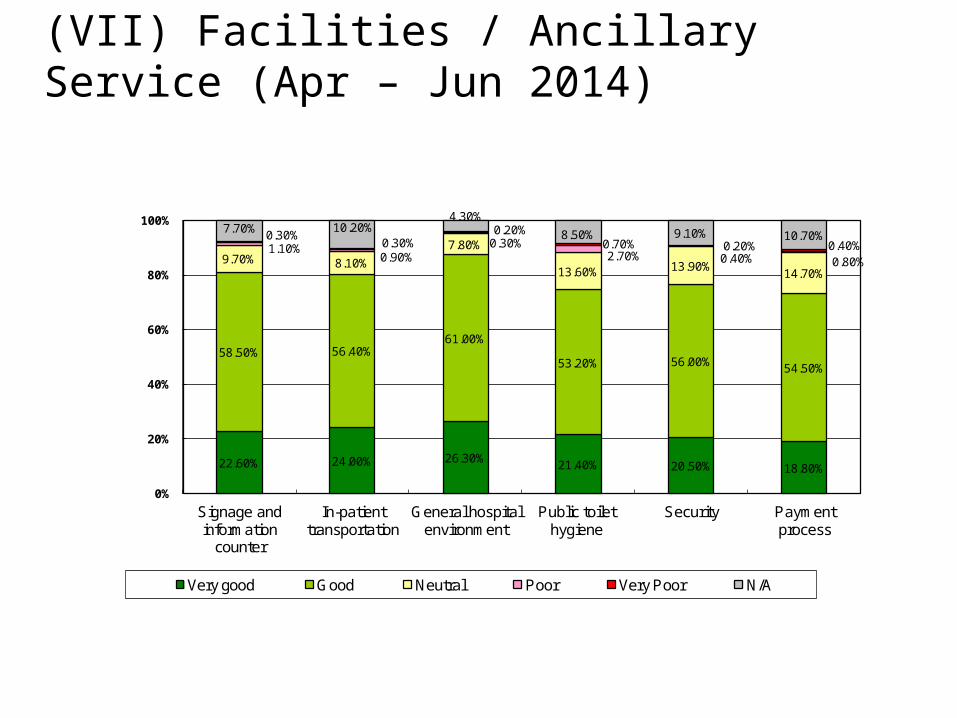
22.60% 24.00% 26.30%21.40% 20.50% 18.80%
58.50% 56.40%61.00%
53.20% 56.00% 54.50%
9.70% 8.10%
7.80%
13.60% 13.90%14.70%
1.10%0.90%
0.30%2.70% 0.40% 0.80%
0.30%0.30%
0.20%0.70% 0.20% 0.40%
7.70% 10.20%4.30%
8.50% 9.10% 10.70%
0%
20%
40%
60%
80%
100%
Signage and information
counter
In-patient transportation
General hospital environment
Public toilet hygiene
Security Payment process
Very good Good Neutral Poor Very Poor N/A
(VII) Facilities / Ancillary Service (Apr – Jun 2014)
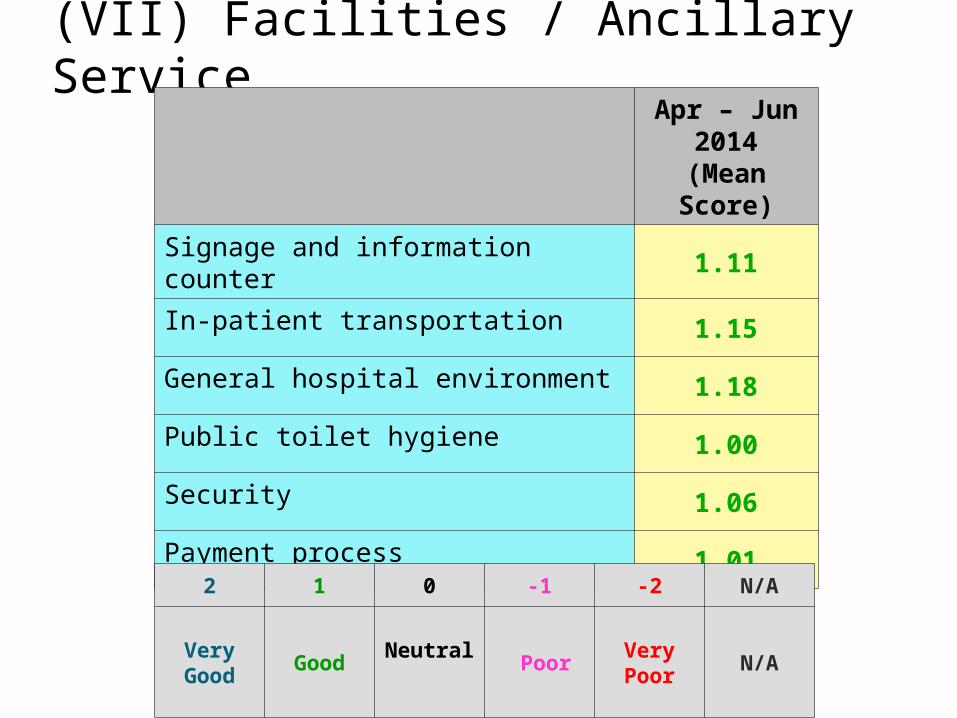
(VII) Facilities / Ancillary Service
Apr – Jun2014
(Mean Score)
Signage and information counter 1.11
In-patient transportation 1.15
General hospital environment 1.18
Public toilet hygiene 1.00
Security 1.06
Payment process 1.01
2 1 0 -1 -2 N/A
Very Good
Good Neutral PoorVery Poor
N/A
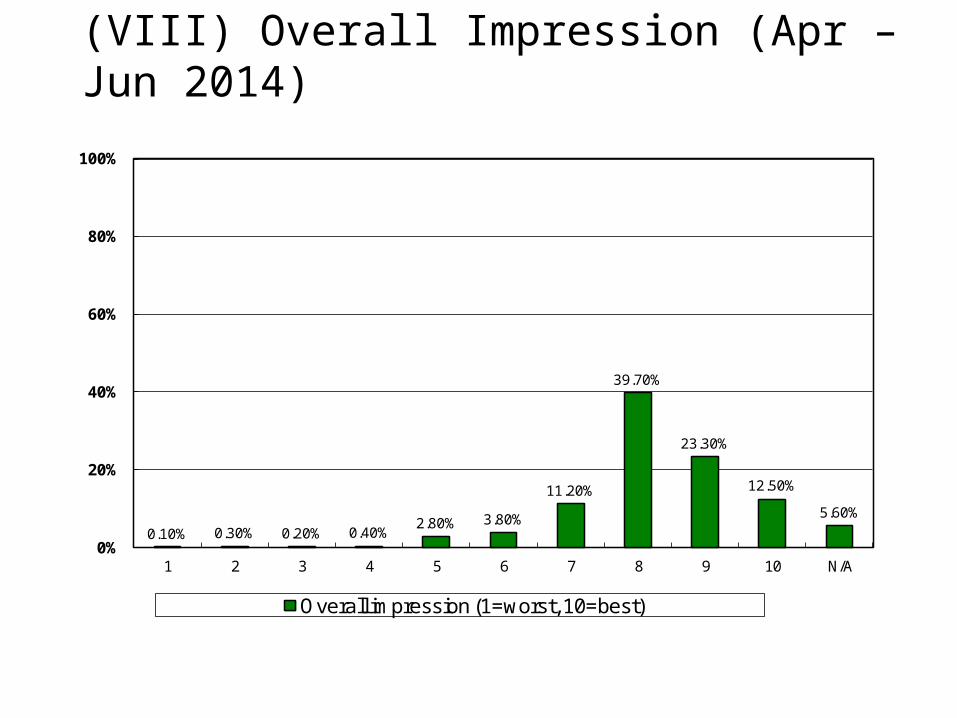
0.10% 0.30% 0.20% 0.40%2.80% 3.80%
11.20%
39.70%
23.30%
12.50%
5.60%
0%
20%
40%
60%
80%
100%
1 2 3 4 5 6 7 8 9 10 N/A
Overall impression (1=worst, 10=best)
(VIII) Overall Impression (Apr – Jun 2014)
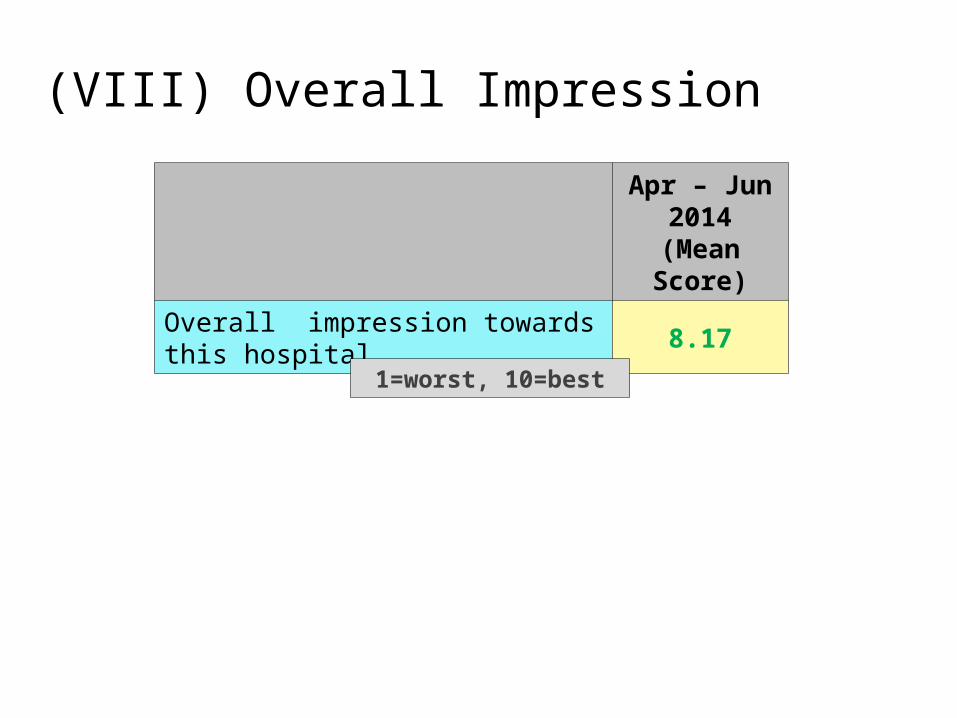
(VIII) Overall Impression
Apr – Jun2014
(Mean Score)
Overall impression towards this hospital 8.17
1=worst, 10=best