prevention of type 2 diabetes mellitus key questions and a call to action
TRANSCRIPT

Prevention ofPrevention of Type 2 Diabetes Mellitus Type 2 Diabetes Mellitus
Key QuestionsKey Questionsandand
A Call to ActionA Call to Action

Prevention of Type 2 Diabetes Prevention of Type 2 Diabetes Mellitus: Table of ContentsMellitus: Table of Contents
SectionSection TopicTopic Slide No.Slide No.
1 Why is prevention of type 2 diabetes imperative? 3-5
2 What is the evidence that type 2 diabetes can be prevented or delayed?
6-23
3 Do prevention interventions have sustained effects?
24-30
4 Are we preventing type 2 diabetes or delaying it? 31-32
5 Is diabetes prevention cost-effective? 33-36
6 Can evidence-based interventions be delivered effectively in lower-cost settings?
37-40
7 Will diabetes prevention “bend the curve” of the epidemic?
41-42
8 How can we most effectively prevent or delay type 2 diabetes?
43-51
9 Conclusions: call to action 52-53

WHY IS PREVENTION OF WHY IS PREVENTION OF TYPE 2 DIABETES TYPE 2 DIABETES IMPERATIVE?IMPERATIVE?
Section 1Section 1

Projecting the Future Diabetes Projecting the Future Diabetes Population: The Imperative for ChangePopulation: The Imperative for Change
U.S
. P
op
ula
tion
wit
hD
iab
ete
s (
%)
Boyle JP, et al. Popul Health Metr. 2010;8(29):1-12.
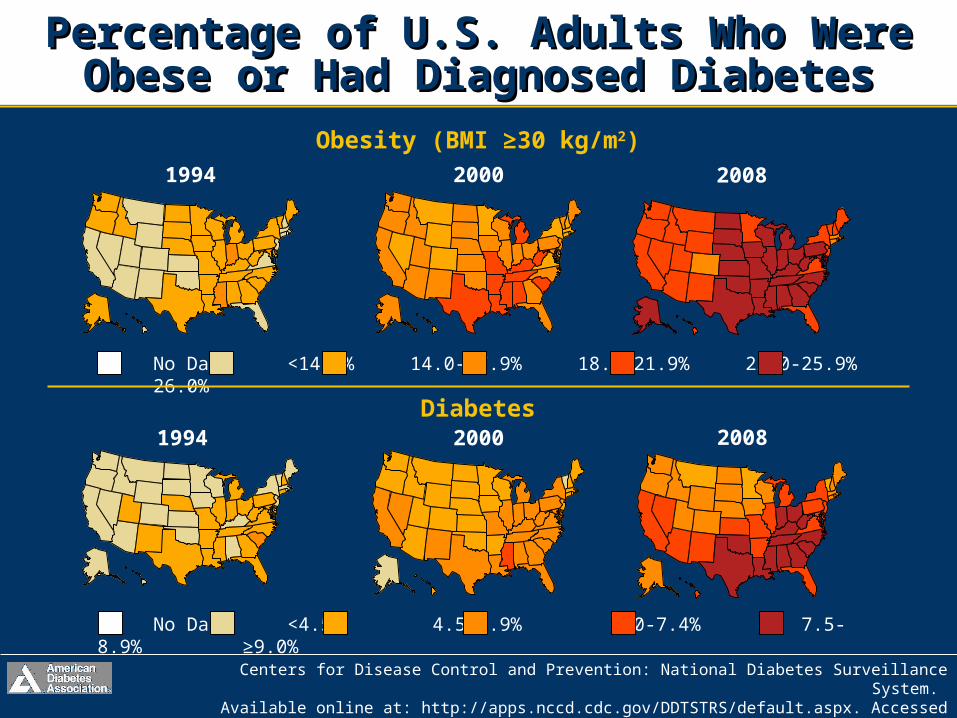
Percentage of U.S. Adults Who Were Percentage of U.S. Adults Who Were Obese or Had Diagnosed DiabetesObese or Had Diagnosed Diabetes
Centers for Disease Control and Prevention: National Diabetes Surveillance System. Available online at: http://apps.nccd.cdc.gov/DDTSTRS/default.aspx. Accessed 10/3/2011.
Obesity (BMI ≥30 kg/m2)
Diabetes
1994
1994
2000
2000
No Data <14.0% 14.0-17.9% 18.0-21.9% 22.0-25.9% 26.0%
No Data <4.5% 4.5-5.9% 6.0-7.4% 7.5-8.9% ≥9.0%
2008
2008

WHAT IS THE EVIDENCE THAT WHAT IS THE EVIDENCE THAT TYPE 2 DIABETESTYPE 2 DIABETESCAN BE PREVENTED OR CAN BE PREVENTED OR DELAYED?DELAYED?
Section 2Section 2

Lifestyle InterventionsLifestyle InterventionsCan Prevent Type 2 Diabetes OnsetCan Prevent Type 2 Diabetes Onset
• Several randomized trials have shown interventions (lifestyle, medications) can decrease rate of onset of diabetes
• Lifestyle: Da Qing, Finnish Diabetes Prevention Study, Diabetes Prevention Program
• Medications: Diabetes Prevention Program (metformin), The Stop-NIDDM (acarbose), DREAM (rosiglitazone), ACT-NOW (pioglitazone)

• 110,660 adults from 33 Da Qing, China, health care clinics screened in 1986 for IGT, type 2 diabetes mellitus
• 577 adults with IGT (WHO criteria) randomized to control (n=138) or one of three lifestyle interventions (n=438)• Diet only• Exercise only• Diet + exercise
• Follow-up at 2-year intervals over 6 years to identify those who developed diabetes
Lifestyle InterventionsLifestyle InterventionsDa Qing Study MethodsDa Qing Study Methods
Pan XR, et al. Diabetes Care. 1997;20:537-544.

• Cumulative incidence of diabetes at6 years was significantly decreased in the active intervention groups (P<0.05)
• When analyzed by clinic, each active intervention group differed significantly from the control (P<0.05)
Lifestyle InterventionsLifestyle InterventionsDa Qing Study ResultsDa Qing Study Results
Pan XR, et al. Diabetes Care. 1997;20:537-544.
Control 67.7% (95% CI, 59.8-75.2)
Diet 43.8% (95% CI, 35.5-52.3)
Exercise 41.1% (95% CI, 33.4-49.4)
Diet + exercise 46.0% (95% CI, 37.3-54.7)

• When stratified as lean or overweight(BMI < or ≥25 kg/m2), relative decrease in rate of development of diabetes in lifestyle intervention groups was similar
• After adjusting for differences in baseline BMI and fasting glucose, all interventions were associated with diabetes risk reduction
Lifestyle InterventionsLifestyle InterventionsDa Qing Study ResultsDa Qing Study Results
Pan XR, et al. Diabetes Care. 1997;20:537-544.
Diet 31% (P<0.03)
Exercise 46% (P<0.0005)
Diet + exercise 42% (P<0.005)

• Active intervention with diet and/or exercise led to a significant decrease in incidence of diabetes over a 6-year period (1986-1992) among those with IGT
• Diabetes incidence (per 100 person years) per year• Control: 14.1 (95% CI 11.2-17.0)• Lifestyle intervention: 7.9 (95% CI, 6.8-9.1)
Lifestyle InterventionsLifestyle InterventionsDa Qing Study ConclusionsDa Qing Study Conclusions
Pan XR, et al. Diabetes Care. 1997;20:537-544.

Lifestyle InterventionsLifestyle InterventionsFinnish Diabetes Prevention StudyFinnish Diabetes Prevention Study
• 522 subjects, 40-65 years of age• BMI ≥25 kg/m2; IGT: 2-h PPG 140-200 mg/dL
• Control group: general oral and written information diet and exercise
• Intervention group: individualized• Reduce weight ≥5%• Decrease fat ≤30%, saturated fat ≤10%
energy• Increase fiber to at least 15 g/1000 kcal• Moderate exercise ≥30 minutes/day
• Primary end point: diagnosis of diabetes
Tuomilehto J, et al for the Finnish Diabetes Prevention Study Group.N Engl J Med. 2001;344:1343-1350.
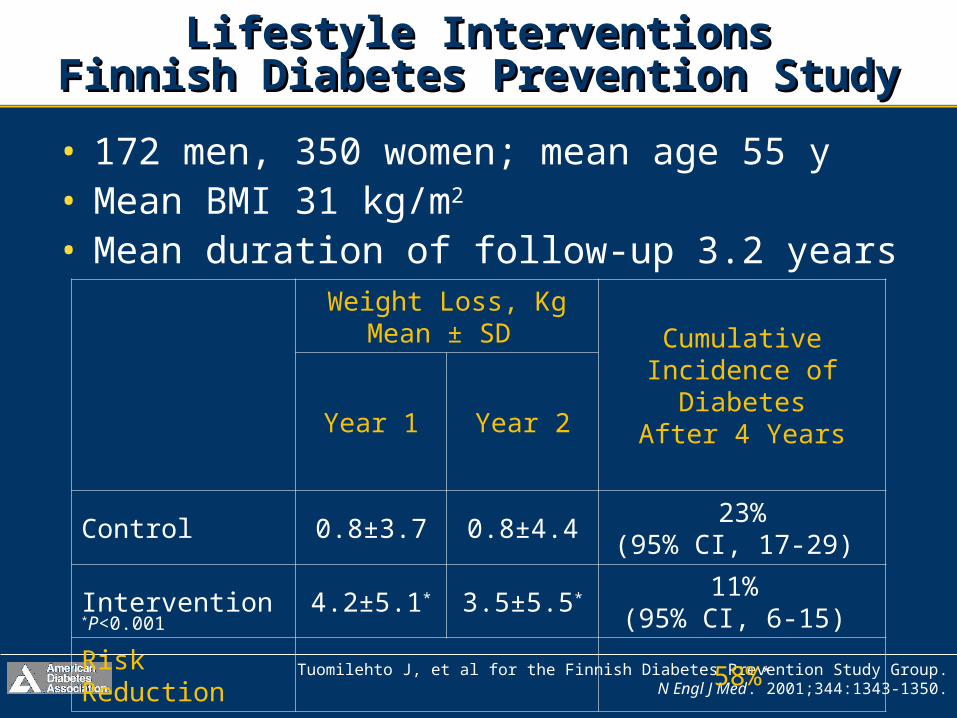
• 172 men, 350 women; mean age 55 y• Mean BMI 31 kg/m2
• Mean duration of follow-up 3.2 years
Lifestyle InterventionsLifestyle InterventionsFinnish Diabetes Prevention StudyFinnish Diabetes Prevention Study
Tuomilehto J, et al for the Finnish Diabetes Prevention Study Group.N Engl J Med. 2001;344:1343-1350.
Weight Loss, KgMean ± SD Cumulative
Incidence of Diabetes
After 4 YearsYear 1 Year 2
Control 0.8±3.7 0.8±4.423%
(95% CI, 17-29)
Intervention 4.2±5.1* 3.5±5.5* 11% (95% CI, 6-15)
Risk Reduction 58%*
*P<0.001

• Reduction in incidence of type 2 diabetes was directly associated with changes in lifestyles of high-risk subjects (ie, those with IGT)• Modifiable risk factors such as obesity, physical
inactivity, suggested as main nongenetic determinants of diabetes
• These results demonstrate that 22 subjects with IGT must be treated with lifestyle intervention for 1 year (or 5 subjects for 5 years) to prevent 1 case of diabetes
Tuomilehto J, et al for the Finnish Diabetes Prevention Study Group.N Engl J Med. 2001;344:1343-1350.
Lifestyle InterventionsLifestyle InterventionsFinnish Diabetes Prevention StudyFinnish Diabetes Prevention Study

• 3,234 nondiabetic persons in 27 clinical centers• BMI ≥24 kg/m2 (≥22 kg/m2 in Asians)
• IGT: FPG 95-125 mg/dL or 2-h PPG 140-199 mg/dL
• From 1996-1999, randomly assigned to• Standard lifestyle + placebo (n=1082)• Standard lifestyle + metformin, initiated at 850
mg orally once daily; at 1 month, increased to 850 mg twice daily (n=1073)
• Intensive lifestyle intervention (n=1079)
Lifestyle InterventionsLifestyle InterventionsDiabetes Prevention ProgramDiabetes Prevention Program
Knowler WC, et al. for the Diabetes Prevention Program Research Group.N Engl J Med. 2002;346:393-403.

Goals of intensive lifestyle intervention
• 7% loss of body weight• Dietary fat goal: 25% of calories from fat
• Calorie intake goal: 1200-1800 kcal/day based on initial body weight
• >150 minutes of physical activities weekly– Similar in intensity to brisk walking; at least
700 kcal/week
• Group received 16-lesson curriculum
Lifestyle InterventionsLifestyle InterventionsDiabetes Prevention ProgramDiabetes Prevention Program
Knowler WC, et al. for the Diabetes Prevention Program Research Group.N Engl J Med. 2002;346:393-403.

• Mean age 50.6 years
• 67.7% women; 45.3% members of minority groups
• Mean BMI 34.0 kg/m2
• 69.4% had a family history of diabetes
• Average follow-up: 2.8 years(range, 1.8-4.6)
Lifestyle InterventionsLifestyle InterventionsDiabetes Prevention ProgramDiabetes Prevention Program
Knowler WC, et al. for the Diabetes Prevention Program Research Group.N Engl J Med. 2002;346:393-403.

Knowler WC, et al. for the Diabetes Prevention Program Research Group.N Engl J Med. 2002;346:393-403.
Lifestyle InterventionsLifestyle InterventionsDiabetes Prevention ProgramDiabetes Prevention Program
Lifestyle Metformin Placebo
5.6 kg 2.1 kg 0.1 kg
Results: average weight loss (P<0.001)
• Those assigned to lifestyle intervention had greater weight loss and increase in physical activity than participants receiving metformin or placebo
• Lifestyle intervention more effective in restoring normal post-load glucose values

Results: intensive lifestyle intervention
Lifestyle InterventionsLifestyle InterventionsDiabetes Prevention ProgramDiabetes Prevention Program
Knowler WC, et al. for the Diabetes Prevention Program Research Group.N Engl J Med. 2002;346:393-403.
At 24 WeeksAt Final
Study Visit
Weight loss ≥7% 50% 38%
Exercise >150 minutes/week
38% 58%

Knowler WC, et al. for the Diabetes Prevention Program Research Group.N Engl J Med. 2002;346:393-403.
MedicationsMedicationsDPP: Metformin InterventionDPP: Metformin Intervention
• Metformin, intensive lifestyle modification delayed or prevented type 2 diabetes vs placebo (11%/year incidence)– Placebo: 11%/year incidence
– Metformin: 7.8%/year incidence*
– Lifestyle intervention: 4.8%/year incidence*
• Risk reduction:– 31% by metformin
– 58% by lifestyle
– 39% lifestyle vs metformin*P<0.001 vs placebo

Knowler WC, et al. for the Diabetes Prevention Program Research Group.N Engl J Med. 2002;346:393-403.
MedicationsMedicationsDPP: Metformin InterventionDPP: Metformin Intervention
• Intensive lifestyle intervention more effective than either metformin or placebo
• By subgroup, metformin more effective if:‒ FPG >110 mg/dL
‒ Age <60 years
‒ BMI >35 kg/m2
• Gender, ethnicity, 2-h PGG, NOT predictive of response
• Use metformin in high-risk individuals

MedicationsMedicationsThe STOP-NIDDM: AcarboseThe STOP-NIDDM: Acarbose
Reprinted with permission from Chiasson JL, et al. Lancet. 2002;359(9323): 2072-2077;Chiasson JL, et al. JAMA. 2003;290(4):486-494.
Acarbose reduced risk of new• Hypertension
>140/90; 5.3% absolute risk reduction (P=0.006)
• Myocardial infarction (P=0.02)
• Any CVD event: CHD, CV death or stroke, CHF, PVD (P=0.03)
Acarbose100 mg TID
n=682
Placebon=686
25% Relative Risk Reduction
P=0.0022

Reprinted with permission from DREAM Trial Investigators. Lancet. 2006;368(9541):1096-1105.
MedicationsMedicationsDREAM: RosiglitazoneDREAM: Rosiglitazone
60%Relative Risk Reduction
HR 0.40 (0.35–0.46) P<0.0001

DeFronzo RA, et al, for the ACT NOW Study. N Engl J Med. 2011;364:1104-1115.
MedicationsMedicationsACT NOW: PioglitazoneACT NOW: Pioglitazone
• Pioglitazone reduced risk of type 2 diabetes mellitus by 72% vs placebo (HR 0.28; 95% CI 0.16–0.49 P<0.001)
• Conversion to normal glucose tolerance: 48% of patients with pioglitazone vs 28% with placebo (P<0.001)
• Pioglitazone reduced fasting glucose,2-hour glucose, HbA1c
• Weight gain, edema observed in the pioglitazone arm

DO PREVENTION DO PREVENTION INTERVENTIONS HAVE INTERVENTIONS HAVE SUSTAINED EFFECTS?SUSTAINED EFFECTS?
Section 3Section 3

• Combined lifestyle intervention vs control• 51% lower incidence of diabetes during
active intervention• 43% lower incidence over 20 years• 3.6 years fewer with diabetes
Lifestyle InterventionsLifestyle InterventionsDa Qing Study 20-Year Follow-Up Da Qing Study 20-Year Follow-Up
Li G, et al. Lancet. 2008;371:1783-1789.
Average Annual
Incidence
20-Year Cumulative Incidence
Controls 11% 93%
Combined lifestyle intervention
7% 80%
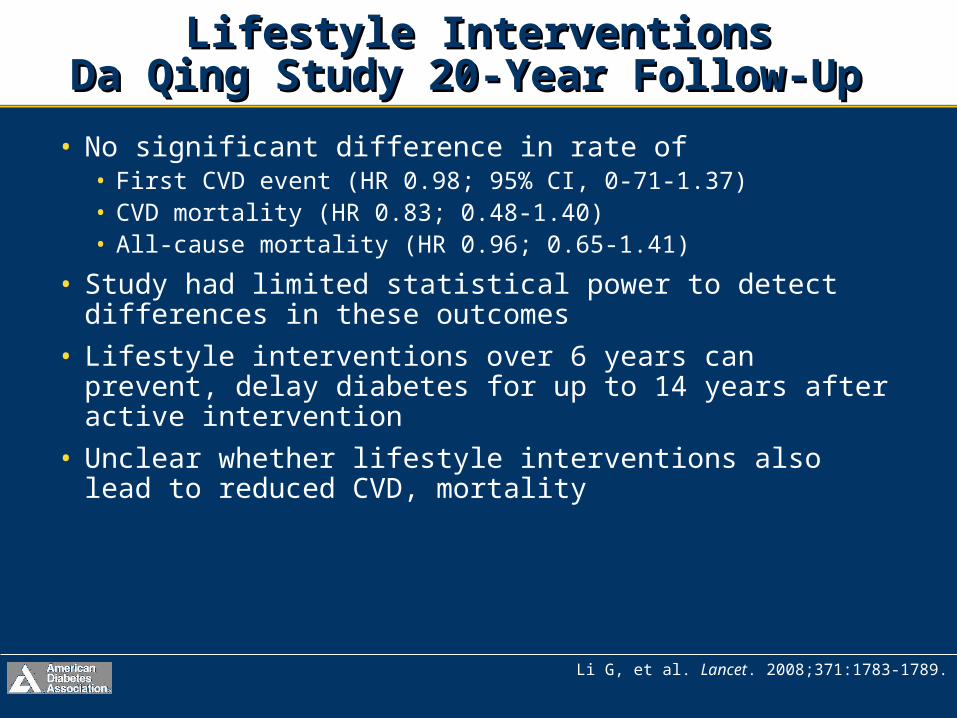
• No significant difference in rate of• First CVD event (HR 0.98; 95% CI, 0-71-1.37)• CVD mortality (HR 0.83; 0.48-1.40)• All-cause mortality (HR 0.96; 0.65-1.41)
• Study had limited statistical power to detect differences in these outcomes
• Lifestyle interventions over 6 years can prevent, delay diabetes for up to 14 years after active intervention
• Unclear whether lifestyle interventions also lead to reduced CVD, mortality
Lifestyle InterventionsLifestyle InterventionsDa Qing Study 20-Year Follow-Up Da Qing Study 20-Year Follow-Up
Li G, et al. Lancet. 2008;371:1783-1789.
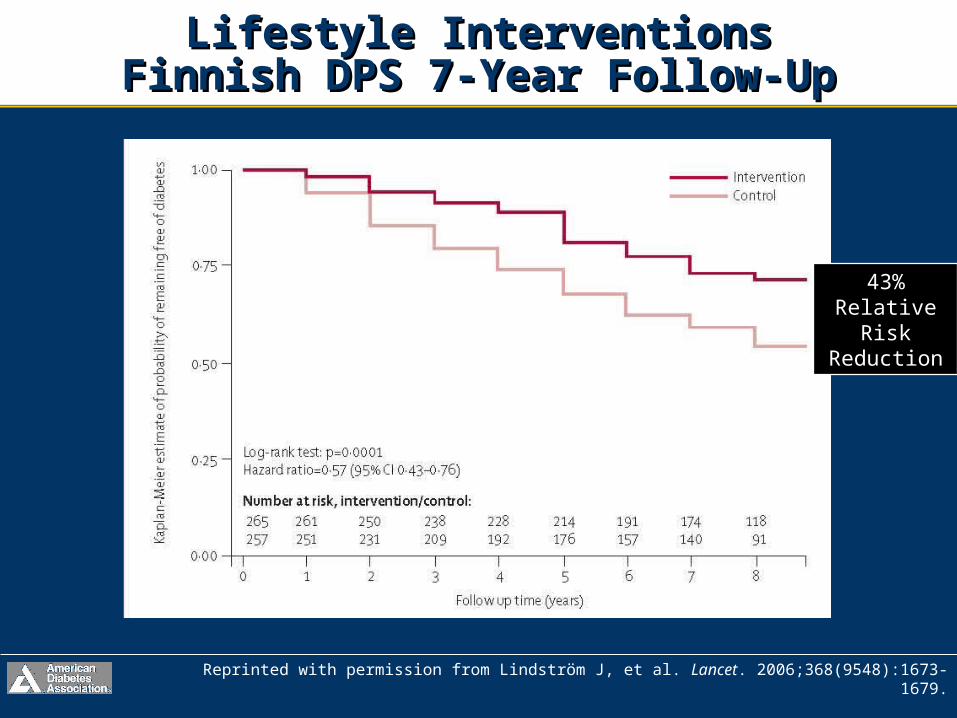
Lifestyle InterventionsLifestyle InterventionsFinnish DPS 7-Year Follow-UpFinnish DPS 7-Year Follow-Up
Reprinted with permission from Lindström J, et al. Lancet. 2006;368(9548):1673-1679.
43% Relative
Risk Reduction

• Brief (1-2 week) drug washout study at end of Diabetes Prevention Program trial
• After washout, diabetes was more frequently diagnosed in metformin vs. placebo (1.49; 0.93, 2.38; P=0.098)
• DPP primary analysis: metformin decreased diabetes risk by 31%
• Washout: 26% accounted for by pharmacological effect of metformin
• Postwashout: diabetes reduced by 25%
DPP: Metformin Had Sustained EffectDPP: Metformin Had Sustained EffectAfter Drug WashoutAfter Drug Washout
Diabetes Prevention Program Research Group. Diabetes Care. 2003;26:977-980.

• During rosiglitazone vs placebo washout– Primary outcome, new-onset diabetes or death:
10.5% vs 9.8% (P=0.59)
– Secondary outcome, regression to normoglycemia: 21.5% vs 23.8% (P=0.33)
– Median follow-up: 71 days (range, 63-86 days)
• Rosiglitazone substantially reduced incidence of type 2 diabetes (DREAM); however, when withdrawn, this effect is not sustained
Rosiglitazone Had No Sustained EffectRosiglitazone Had No Sustained EffectAfter Drug Washout: DREAMAfter Drug Washout: DREAM
The DREAM Trial Investigators. Diabetes Care. 2011;34:1265-1269.

• Lifestyle intervention continues to have an effect; most drugs do not
Lifestyle InterventionsLifestyle InterventionsSummarySummary
Diabetes Care. 1997;20:537-544; N Engl J Med. 2002;344:1343-1350;N Engl J Med. 2002;346;393-403; Diabetes Care. 2011;34:1265-1269;
Lancet. 2002;359(9323): 2072-2077 N Engl J Med. 2011;364:1104-1115.
Study N Intervention Treatment Risk Reduction
DPP IGT 3324 Metformin 3 years 31%
DREAM IGT 5269 Rosiglitazone 3 years 60%
STOP-NIDDM IGT 1429 Acarbose 3 years 21%
ACT NOW IFG ~600 Pioglitazone 3 years 81%
Study N Intervention Treatment Risk Reduction
Da Qing IGT 577 Lifestyle 6 years20 years
34% - 69%
Finnish DPS IGT 523 Lifestyle3+ years7 years 58%
DPP IGT 3324 Lifestyle 3 years 58%
Lif
esty
leP
har
mac
olo
gic

ARE WE PREVENTING TYPE 2 ARE WE PREVENTING TYPE 2 DIABETES OR DELAYING IT?DIABETES OR DELAYING IT?
Section 4Section 4

• During 10-year follow-up since randomization– Original lifestyle group lost, then partly
regained weight
– Modest weight loss with metformin maintained
• Diabetes incidence per 100 person-years
Diabetes Prevention ProgramDiabetes Prevention Program10-Year Follow-Up Study10-Year Follow-Up Study
Diabetes Prevention Program. Lancet. 2009;374:1677-1686.
Lifestyle 5.9 (5.1, 6.8) 34%* (24, 42)
Metformin 4.9 (4.2, 5.7) 18%* (7, 28)
Placebo 5.6 (4.8, 6.5)*vs placebo

IS DIABETES PREVENTION IS DIABETES PREVENTION COST-EFFECTIVE?COST-EFFECTIVE?
Section 5Section 5

• Active interventions (vs placebo) would:
Cost-Effectiveness of Lifestyle Cost-Effectiveness of Lifestyle Modification or Metformin: DPPModification or Metformin: DPP
Herman WH, et al for the Diabetes Prevention Program Research Group.Ann Intern Med. 2005:142:323-332.
Intensive Lifestyle
Metformin
Delay onset oftype 2 diabetes by
11.1 years 3.4 years
Reduce incidence oftype 2 diabetes by
20% 8%
Increase life expectancy by
0.5 years 0.2 years
Cost per QALY $1,124 $31,286
QALY = Quality Adjusted Life Years

• 10-year within-trial cost-effectiveness of the interventions‒ Intensive lifestyle‒ Metformin
• Data on resource utilization, cost, and quality of life collected prospectively
• Economic analyses performed from health system and societal perspectives
Diabetes Prevention Program10-Year Cost-Effectiveness
Diabetes Prevention Program Research Group. Diabetes Care. 2012;35:723-730.

• Lifestyle cost-effective, metformin marginally cost-saving vs placebo
• Investment in lifestyle, metformin interventions for diabetes prevention in high-risk adults provides good value
Diabetes Prevention Program10-Year Cost-Effectiveness
Societal Perspective*
Lifestyle vs Placebo
Metformin vs Placebo
Lifestyle vs Metformin
DPP Group Lifestyle vs
Placebo
Undiscounted 11,274Cost-
saving44,562
Cost-saving
Discounted† 14,365Cost-
saving42,753 1,681
Incremental cost-effectiveness ratios from three different perspectives; ∆cost/∆QALY*Includes direct medical costs and direct nonmedical costs including participant time†Both costs and QALYs are discounted at 3%
Diabetes Prevention Program Research Group. Diabetes Care. 2012;35:723-730.

CAN EVIDENCE-BASED CAN EVIDENCE-BASED INTERVENTIONS BE DELIVERED INTERVENTIONS BE DELIVERED EFFECTIVELY IN LOWER-COST EFFECTIVELY IN LOWER-COST SETTINGS?SETTINGS?
Section 6Section 6

• Adults BMI ≥24 kg/m2, ≥2 diabetes risk factors, blood glucose 110-199 mg/dL
• Randomized to group-based DPP lifestyle intervention or brief counseling (control)
DEPLOY Pilot Study: Diabetes DEPLOY Pilot Study: Diabetes Prevention in the CommunityPrevention in the Community
Ackermann RT, et al. Am J Prevent Med. 2008;35:357-363.
Outcome,4-6 months
Control (n=38)
Intervention (n=39)
P value(vs control)
% changein weight
−2(−3.3, −0.6)
−6(−7.3, −4.7)
< 0.001
% change BMI
−2.3(−3.7, −0.8)
−5.8(−7.3, −4.4)
0.001
Change total cholesterol
+6 mg/dL(−2.8, 14.8)
−21.6 mg/dL−29.9, −13.3)
<0.001

Practice-Based Opportunities for Practice-Based Opportunities for Weight Reduction (POWER)Weight Reduction (POWER)
Appel LJ, et al. N Engl J Med. 2011;365:1959-68.
2-Year Outcome
ControlRemote
Support OnlyIn-Person Support
Mean change in weight from baseline
−0.8 kg −4.6 kg* −5.1 kg*
% patients losing ≥5% of initial weight
18.8% 38.2% 41.4%
*P<0.001 vs control arm
• Obese patients achieve, sustain significant weight loss with behavioral interventions

Diabetes TeleHealth Improves Diabetes TeleHealth Improves Diabetes Self-ManagementDiabetes Self-Management
Davis RM, et al. Diabetes Care. 2010;33:1712–1717.
Reduction in Glycated Hemoglobin
Baseline 6 Months 12 Months
Diabetes TeleCare group
9.4±0.3 8.3±0.3* 8.2±0.4†
Usual care group
8.8±0.3 8.6±0.3 8.6±0.3
• 1-year remote DSME intervention, Diabetes TeleCare (dietitian, nurse/certified diabetes educator
• Improved metabolic control, reduced CV risk
*P=0.003 vs. baseline†P=0.004 vs. baseline

WILL DIABETES PREVENTION WILL DIABETES PREVENTION “BEND THE CURVE” OF THE “BEND THE CURVE” OF THE EPIDEMIC?EPIDEMIC?
Section 7Section 7

• Five-state model
• Potential effect of hypothetical preventive intervention delivered to all with IFG
• If 50% participated and incidence reduced by 50%, would equal 25% reduction in annual incidence of diabetes in the population with IFG
• Would lower the increase in prevalence by 2050 to 1 in 4 (vs 1 in 3)
CDC Modeling Study to ReduceCDC Modeling Study to ReduceFuture Diabetes PrevalenceFuture Diabetes Prevalence
Boyle JP, et al. Popul Health Metr. 2010;8(29):1-12.

HOW CAN WE MOST HOW CAN WE MOST EFFECTIVELY PREVENT OR EFFECTIVELY PREVENT OR DELAY TYPE 2 DIABETES?DELAY TYPE 2 DIABETES?
Section 8Section 8

• Data analyzed from 1,402 adults without diabetes– 2005–2006 NHANES participants
– Valid fasting plasma glucose, oral glucose tolerance tests
• Almost 30% of the US adult population had prediabetes in 2005–2006; only 7.3% were aware they had it
• Adoption of risk reduction behaviors suboptimal
Most People with Diabetes Are Most People with Diabetes Are Unaware of Their ConditionUnaware of Their Condition
Geiss LS, et al. Am J Prevent Med. 2010;38:403-409.

We Need to Test People at RiskWe Need to Test People at Risk
Categories of increased risk for diabetes (Prediabetes)*
FPG 100-125 mg/dl (5.6-6.9 mmol/l): IFGor
2-h plasma glucose in the 75-g OGTT140-199 mg/dl (7.8-11.0 mmol/l): IGT
or
A1C 5.7-6.4%
*For all three tests, risk is continuous, extending below the lower limit of a range and becoming disproportionately greater at higher ends of the range.
ADA. I. Classification and Diagnosis. Diabetes Care 2012;35(suppl 1):S13. Table 3.

Recommendations: Testing for Recommendations: Testing for Diabetes in Asymptomatic PatientsDiabetes in Asymptomatic Patients• Consider testing overweight/obese adults with
one or more additional risk factors– In those without risk factors, begin testing at age
45 years (B)
• If tests are normal– Repeat testing at least at 3-year intervals (E)
• Use A1C, FPG, or 2-h 75-g OGTT (B)
• In those with increased risk for future diabetes– Identify and, if appropriate, treat other CVD risk
factors (B)
ADA. II. Testing in Asymptomatic Patients. Diabetes Care. 2012;35(suppl 1):S13.

Criteria for Testing for Diabetes in Criteria for Testing for Diabetes in Asymptomatic Adult Individuals (1)Asymptomatic Adult Individuals (1)
•Physical inactivity
•First-degree relative with diabetes
•High-risk race/ethnicity (e.g., African American, Latino, Native American, Asian American, Pacific Islander)
•Women who delivered a baby weighing >9 lb or were diagnosed with GDM
•Hypertension (≥140/90 mmHg or on therapy for hypertension)
• HDL cholesterol level<35 mg/dl (0.90 mmol/l) and/or a triglyceride level >250 mg/dl (2.82 mmol/l)
• Women with polycystic ovarian syndrome (PCOS)
• A1C ≥5.7%, IGT, or IFG on previous testing
• Other clinical conditions associated with insulin resistance (e.g., severe obesity, acanthosis nigricans)
• History of CVD
*At-risk BMI may be lower in some ethnic groups.
1. Testing should be considered in all adults who are overweight (BMI ≥25 kg/m2*) and have additional risk factors:
ADA. Testing in Asymptomatic Patients. Diabetes Care. 2012;35(suppl 1):S14. Table 4.

2. In the absence of criteria (risk factors on previous slide), testing for diabetes should begin at age 45 years
3. If results are normal, testing should be repeated at least at 3-year intervals, with consideration of more frequent testing depending on initial results and risk status
ADA. Testing in Asymptomatic Patients. Diabetes Care. 2012;35(suppl 1):S14. Table 4.
Criteria for Testing for Diabetes in Criteria for Testing for Diabetes in Asymptomatic Adult Individuals (2)Asymptomatic Adult Individuals (2)

DPP: Managing PrediabetesDPP: Managing Prediabetes
• For those found to have prediabetes, provide support or referral to encourage
• Weight loss of at least 7%• Moderate exercise of at least 150 minutes
per week• Consider metformin for certain patients
• Obese (BMI ≥35 kg/m2)• <60 years (most effective, 25-44 years)
• Lifestyle interventions feasible, morecost-effective than medications
American Diabetes Association, 2012.

Clinical Tools Effective in Promoting Clinical Tools Effective in Promoting Lifestyle Modification: AGREELifestyle Modification: AGREE
Steps in the lifestyle change process: AGREE
• Assess
• Generate goals
• Record
• Evaluate and Empower
American Diabetes Association. 2008.
Re-
asse
ss

Steps to setting behavioral goals, objectives
1. Focus on developing specific objectives
2. Let the patient take the lead
3. Keep the objectives “FIRM”
• Few in number
• Individualized
• Realistic
• Measurable (frequency and duration)
Clinical Tools Effective in Promoting Clinical Tools Effective in Promoting Lifestyle Modification: FIRMLifestyle Modification: FIRM
Saunders JT, Pastors JG. Curr Diabetes Rep. 2008;8;353-360.

CONCLUSIONS:CONCLUSIONS:CALL TO ACTIONCALL TO ACTION
Section 9Section 9
Conclusions: Call to ActionConclusions: Call to Action
• We must identify patients at highest risk (prediabetes)
• Modest lifestyle changes are most effective
• Sustain interventions
• Increase opportunities for community programs to support prevention
• Delaying or preventing type 2 diabetes is cost-effective and will help turn the tide on the diabetes epidemic