preventing car crime in car parks - center for problem ... · pdf filepreventing car crime in...
TRANSCRIPT

PREVENTING CAR CRIMEIN CAR PARKS
Barry WebbBen Brown
Katherine Bennett
POLICE RESEARCH GROUPCRIME PREVENTION UNIT SERIES: PAPER NO.34LONDON: HOME OFFICE POLICE DEPARTMENT
Editor: Gloria LaycockHome Office Police Research Group
50 Queen Anne’s GateLondon SW1H 9AT
© Crown Copyright 1992First Published 1992
Police Research Group: Crime Prevention Unit Series
The Home Office Police Research Group (PRG) was formed in 1992 to carry out andmanage research relevant to the work of the police service and Home Office PolicyDivisions. One of the major police department divisions which acts as customer forthe PRG is the Home Office Crime Prevention Unit which was formed in 1983 topromote preventative action against crime. It has a particular responsibility todisseminate information on crime prevention topics.
The object of the present series of occasional papers is to present research material in away which should help and inform practitioners, including the police, whose workcan help reduce crime.
ISBN 0 86252 708 2
(ii)

Foreword
In his speech launching Car Crime Prevention Year in February, the then HomeSecretary announced that the Home Office would be publishing research it wascarrying out on car crime in car parks. This report is the outcome.
The car park, as a managed facility, provides a great deal of scope for controlling carcrime. Nevertheless, as this and previous studies have shown, thefts of and from carscan be a serious problem in some car parks. Earlier work has largely focused onevaluating initiatives taken in single car parks. This study takes a wider look at the carpark industry, examining the problem of car crime in many different sorts of public carparking environments commonly found in our city centres and towns, and at trainstations.
The study shows that there is a great deal that car park owners and operators can do tocontrol the problem of car crime, identifying operating methods which are inherentlymore secure than others. The task is how to encourage car park operators to take carcrime into account in their management of car parks. The study discusses the merits oftwo issues currently receiving attention from the police and consumer groups – thedevelopment of a market for secure car parks, by providing motorists with moreinformation about the security levels in car parks, and increasing car park liability forcrime.
I M BURNSDeputy Under Secretary of StateHome OfficeJuly 1992
(iii)

Acknowledgements
Many people helped in the course of this study. We would particularly like to thankthe following for their help and contributions to the project:
the Metropolitan Police, in particular Chief Inspector John Russell, and the CrimePrevention Officers at Kingston and Marylebone - Dick Gerard, Brian Woods, DickCross and Bob Darby;
the British Transport Police, especially Inspector Robson, Sergeant Cooper, and MikeHarbor:
staff at John Lewis and Bentalls in Kingston-upon-Thames, and Richard Jones atSelfridges;
Eric Nicholass, Passenger Security Manager at London Underground; and
Inspector Brian Cain at Derbyshire Constabulary, who provided the data from theACPO Eastern Region study quoted in Section 2 of this report.
Barry WebbBen BrownKatherine Bennett
Home Office Police Research GroupJuly 1992
(iv)

ContentsPage
Foreword
Acknowledgements
List of figures
List of tables
1. IntroductionThe development of off-street parkingThe emergence of car park security as an issueCar crime and the parking environmentThis study
2. Car crime in car parks – the scale of the problem
3. Town centre car parks in Kingston-upon-ThamesTheft of carsTheft from carsCar park utilisation
4. Car parks in Marylebone, central LondonTheft from cars
5. Commuter car parksTheft of carsTheft from cars
6. ConclusionsStaffingCar crime and car park liability
References
Crime Prevention Unit Papers
(iii)
(iv)
(vi)
(vii)
11246
7
10121416
1819
242528
303031
35
37
(v)
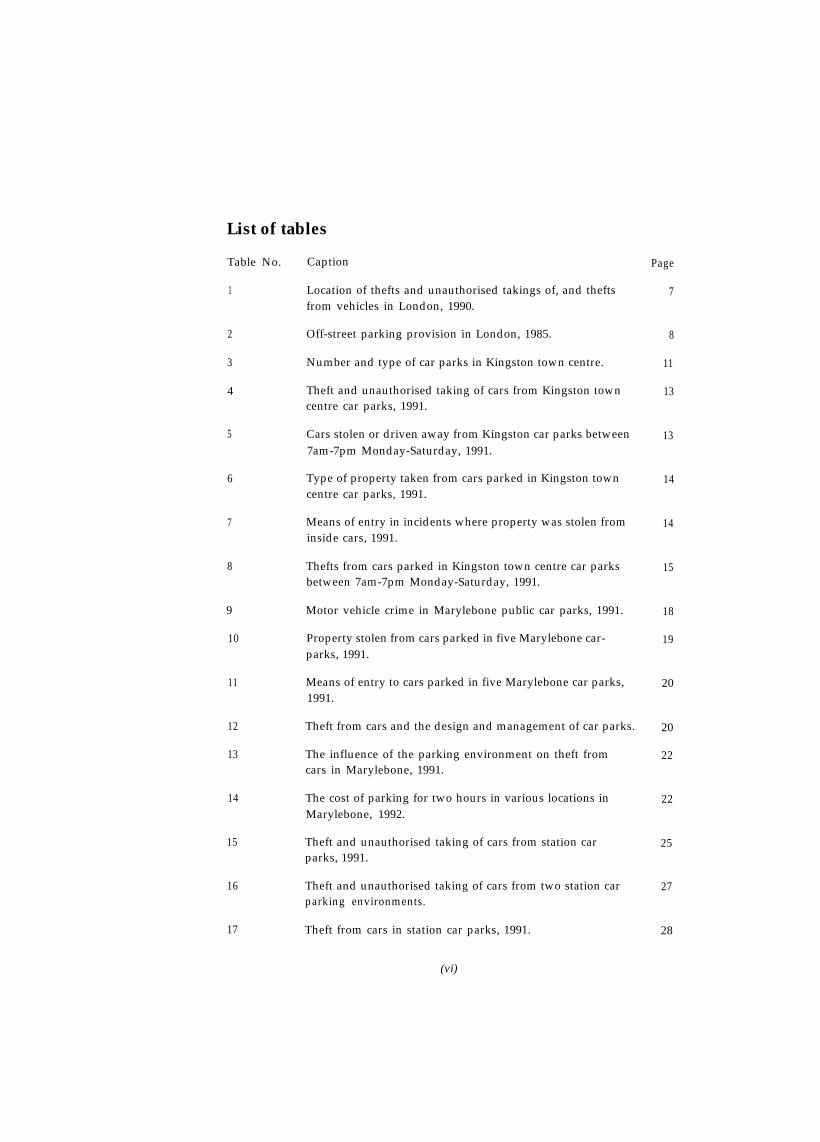
List of tables
Table No. Caption
1
2
3
4
5
6
7
8
9
10
11
12
13
14
15
16
17
Location of thefts and unauthorised takings of, and theftsfrom vehicles in London, 1990.
Off-street parking provision in London, 1985.
Number and type of car parks in Kingston town centre.
Theft and unauthorised taking of cars from Kingston towncentre car parks, 1991.
Cars stolen or driven away from Kingston car parks between7am-7pm Monday-Saturday, 1991.
Type of property taken from cars parked in Kingston towncentre car parks, 1991.
Means of entry in incidents where property was stolen frominside cars, 1991.
Thefts from cars parked in Kingston town centre car parksbetween 7am-7pm Monday-Saturday, 1991.
Motor vehicle crime in Marylebone public car parks, 1991.
Property stolen from cars parked in five Marylebone car-parks, 1991.
Means of entry to cars parked in five Marylebone car parks,1991.
Theft from cars and the design and management of car parks.
The influence of the parking environment on theft fromcars in Marylebone, 1991.
The cost of parking for two hours in various locations inMarylebone, 1992.
Theft and unauthorised taking of cars from station carparks, 1991.
Theft and unauthorised taking of cars from two station carparking environments.
Theft from cars in station car parks, 1991.
(vi)
Page
7
8
11
13
13
14
14
15
18
19
20
20
22
22
25
27
28

List of figures
Figure No. Caption Page
6
7
12
13
1 Proportion of motor vehicle crime taking place in car parksin London, 1990.
2 Location of car park motor vehicle crime in the RoyalBorough of Kingston, 1990.
3a & b ‘Pay & display’ car parks in Kingston town centre.
4a & b Manned entrance/exit car parks in Kingston town centre.
5 Exit barriers at Bentalls ‘pay-on-foot’ car park are operatedby tickets electronically coded by payment machines insidethe car park. The kiosk shown in the photo is permanentlymanned to supervise the barrier equipment.
The attendants’ office at the John Lewis car park is clearlyvisible to all cars entering the car park, and providessupervision over the parking floor.
The average number of cars entering or leaving a Kingstontown centre car park in each of four 15 minute periodsthroughout the day.
8a & b The Welbeck Street car park. Manned exit barriers inmulti-storey car parks prevent theft of, but not theft fromparked cars.
9a & b Selfridges car park. The open layout of the parking floorsfacilitates block parking and supervision of cars byattendants working on each floor.
10a & b Parking in these commuter car parks is controlled by coin-operated road barriers or ramps. The road ramps weresometimes found to be broken.
11 The presence of businesses in these car parks, such as thisfast-food van at Epping, increases supervision of the carpark and prevents car theft.
Unsupervised paths around these car parks provideopportunities for car theft.
Model of an automated stacking car park.
(vii)
8
10
11
12
12
16
17
21
22
26
26
27
33
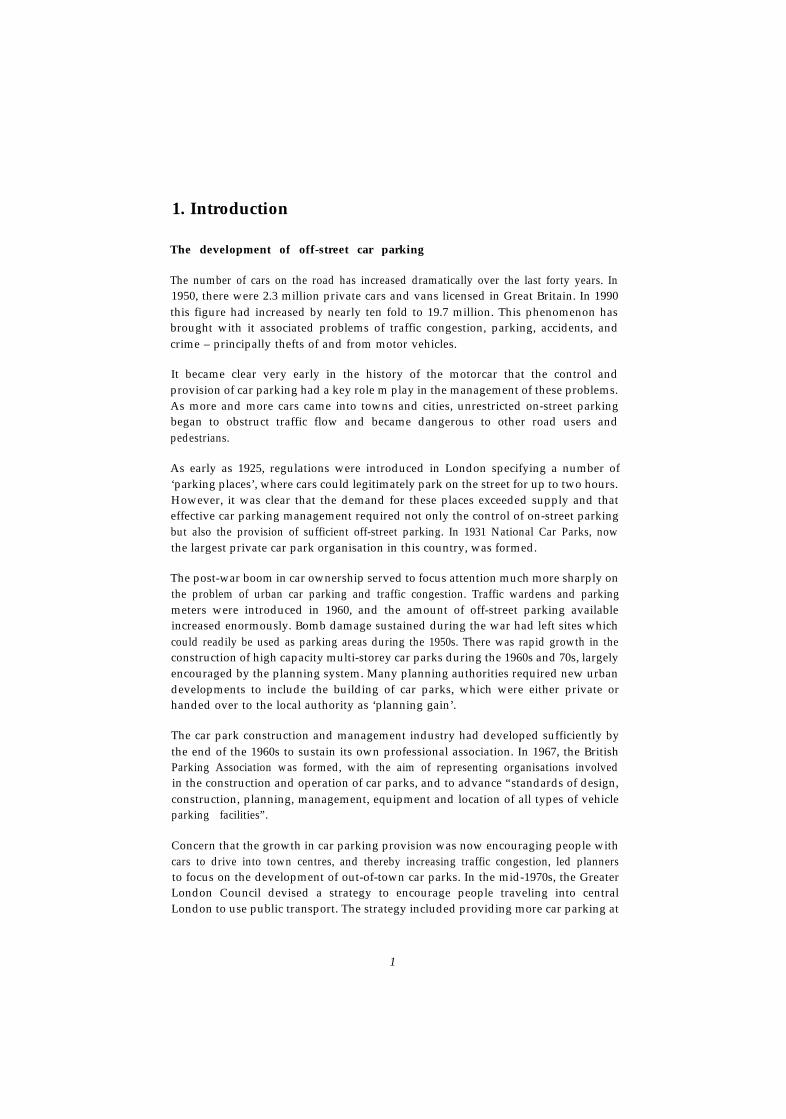
1. Introduction
The development of off-street car parking
The number of cars on the road has increased dramatically over the last forty years. In1950, there were 2.3 million private cars and vans licensed in Great Britain. In 1990this figure had increased by nearly ten fold to 19.7 million. This phenomenon hasbrought with it associated problems of traffic congestion, parking, accidents, andcrime – principally thefts of and from motor vehicles.
It became clear very early in the history of the motorcar that the control andprovision of car parking had a key role m play in the management of these problems.As more and more cars came into towns and cities, unrestricted on-street parkingbegan to obstruct traffic flow and became dangerous to other road users andpedestrians.
As early as 1925, regulations were introduced in London specifying a number of‘parking places’, where cars could legitimately park on the street for up to two hours.However, it was clear that the demand for these places exceeded supply and thateffective car parking management required not only the control of on-street parkingbut also the provision of sufficient off-street parking. In 1931 National Car Parks, nowthe largest private car park organisation in this country, was formed.
The post-war boom in car ownership served to focus attention much more sharply onthe problem of urban car parking and traffic congestion. Traffic wardens and parkingmeters were introduced in 1960, and the amount of off-street parking availableincreased enormously. Bomb damage sustained during the war had left sites whichcould readily be used as parking areas during the 1950s. There was rapid growth in theconstruction of high capacity multi-storey car parks during the 1960s and 70s, largelyencouraged by the planning system. Many planning authorities required new urbandevelopments to include the building of car parks, which were either private orhanded over to the local authority as ‘planning gain’.
The car park construction and management industry had developed sufficiently bythe end of the 1960s to sustain its own professional association. In 1967, the BritishParking Association was formed, with the aim of representing organisations involvedin the construction and operation of car parks, and to advance “standards of design,construction, planning, management, equipment and location of all types of vehicleparking facilities”.
Concern that the growth in car parking provision was now encouraging people withcars to drive into town centres, and thereby increasing traffic congestion, led plannersto focus on the development of out-of-town car parks. In the mid-1970s, the GreaterLondon Council devised a strategy to encourage people traveling into centralLondon to use public transport. The strategy included providing more car parking at
1

train stations in the outer London areas. Statistics published by the GLC on off-streetparking in Greater London show 2,797 car park spaces run by British Rail in 1967. By1985 the figure had risen to 10,086 spaces (Greater London Council, 1969; GreaterLondon Council, 1986).
In the early 1970s, the first of the now popular out-of-town shopping centres was builtin this country at Brent Cross in north London. The provision of large customer carparks free of charge was a crucial part of the development, to attract shoppers awayfrom the congested town centres. Brent Cross provided parking for over 5,000 cars.The concept grew in popularity during the 1980s, and more developments appeared.These ranged from single store sites, typically a supermarket or DIY store, to massiveretail complexes providing parking for as many as 12,000 cars.
Another popular measure to reduce pressure on town centre parking has been theintroduction of ‘park & ride’ schemes. Cars are parked in large car parks located on theedge of town and people ferried to the shops via bus. These schemes have now becomewidespread.
The emergence of car park security as an issue
Public car parks have become common features of our environment, regularly used bymillions of, often fee-paying, car owners. They have therefore begun to attract theattention of consumer groups and others concerned to improve the quality of car parkdesign and management.
Design competitions
The last two years have seen the organisation of the first national car park designcompetitions in this country. These aim to improve car park design by highlightingwhat are considered to be examples of good practice. The first of these was launched in1990 by the Department of Planning and Landscape at Birmingham Polytechnic andthe Urban Design Group, in association with the magazine ‘Planning’. The secondwas launched in 1991 by the English Tourist Board.
The assessment criteria in both competitions were very similar. They focused onplanning context (how well the scheme fits into its surroundings), the quality ofdesign detailing and construction, how well the car park functions (eg traffic flow, easeof parking, convenience of paying), and the provision of facilities such as toilets andinformation.
The issue of security featured to some extent in these awards. However, this has beenspecifically highlighted by consumer groups such as the Automobile Association, theRoyal Automobile Club, and the Consumers’ Association.
2

Consumer group action
In 1990, the Consumers’ Association published results from a survey of 165 car parksin 12 towns and cities to “find out what you get for your money” (Which?, 1990). Thearticle entitled ‘Pay & Dismay’ considered the main problems encountered by car parkusers. These were theft of and from cars, and personal injury resulting from eitherassault or accident. Ten tips for car security were suggested. These included parking ina well-lit car park, choosing one that is staffed, and parking near to the pay booth. Carswere thought to be safer in car parks which required drivers to produce a ticket on exit,providing the system for dealing with drivers who claim to have lost their ticket isefficient.
The article highlighted two key issues which it was felt acted against the interests ofthe consumer. The first concerned the common practice by car park companies ofdisclaiming liability for any loss or damage to vehicles or personal injury to customers.The article stated that the wording on some of the notices displayed on car parks maybe illegal, and that victims of crime or accidents may be able to claim compensation ifit can be proved that the car park staff and management were negligent. The secondissue was the decision by the office of Fair Trading that car park owners are notconsidered to be supplying either goods or services, simply a licence to park. It was feltthat this reduced the control of the development of long-term monopolies.
Car park security has also become an important issue for both the AA and the RAC.In 1991 the AA conducted a survey of 32 multi-storey car parks, assessing them oncleanliness, efficiency, security, and value for money. Poor security was considered tobe the most crucial issue to emerge from the survey.
Efforts have been made by car park owners and operators to improve car park security.A number of car park schemes are included in Safer Cities projects, and the BritishParking Association has held seminars on the subject. However, in a recent confer-ence paper by the RAC’s Director of Public Affairs, improvements in car park securitywere described as “too slow, and too grudging”. Action on both the issues of liabilityand Fair Trading were advocated, to encourage car park companies to improve carpark security.
“We would like to see car park owners who have not providedadequate security measures held legally liable for compensation claimsmade as a result of theft in their car parks – where the motorist canprove that necessary precautions such as removing goods from viewand securing the vehicle had been taken” (Worskett, 1991).
The RAC also holds the view that car parking should not continue to be exempt fromFair Trading legislation, on the grounds that this reduces the competitive incentive toimprove the quality of car parking provision (RAC, 1991).
3

‘Secured car parks’
An initiative to encourage improvement in car park security is currently beingdeveloped by police force crime prevention officers in a working group on car parksecurity. ‘Secured car parks’ is a scheme where car parks meeting specified require-ments are awarded distinctive plaques which can be displayed on the car parkbuilding. The intention is to provide a means by which the public can compare thelevel of security offered by car parks, thereby informing their choice of car park.
The scheme is intended to be launched in September 1992, and participation isvoluntary. It is aimed at developers of new car parks as well as owners and operators ofexisting ones, and can include surface as well as multi-storey car parks. Two levels ofaward are possible – gold or silver, depending on how far the requirements are met.The scheme addresses many aspects of car park design, for example:
l
l
l
l
a good deal of emphasis is given to design layouts that maximisenatural surveillance of parking areas and pedestrian routes;
the required lighting level is that specified by British Standard 5489(1990);
CCTV surveillance or permanent on-site security patrols arerequired;
there should be controlled vehicular access/egress.
Other criteria concern the provision of signs, control of foliage, and use of fencing.
The focus of this initiative is on car park safety and security generally. There is littledoubt that fear of crime can be a problem in some car parks, especially at night. Carparks can be the location for a range of criminal and anti-social behaviour such astheft from cash machines, robbery and other assaults on customers and staff, andvandalism. This report, however, is concerned specifically with the prevention of carcrime in car parks.
Car crime and the parking environment
Problems of theft of and from vehicles have been documented in car parks in towncentres (Laycock & Austin, forthcoming; Poyner, 1992), hospitals (Smith, 1987;Moore, 1990), shipyards (Eck & Spelman, 1992), a University campus (Poyner,1992), industrial estates (Johnston et al, 1990), commuter parking lots (Mancini &Jain, 1987), schools (Wallis & Ford, 1980), and housing estates (Poyner & Webb,1987).
4

The influence of design
Research studies show that the design of the parking environment can have a stronginfluence on the risk of theft of and from parked cars. In their study of residentialcrime, Poyner & Webb (1991) found that communal parking bays were most at riskfrom theft of and from cars. These bays are virtually surface public car parks, separatefrom the housing they serve. Housing layouts where parking was arranged on drive-ways and hardstandings in front of houses provided much more protection for cars,especially if the houses faced each other across the street. The presence of pathwayspassing through or alongside housing areas was an additional important factor inexplaining the distribution of theft from cars.
Design can also help to maximise surveillance of cars parked in public car parks.Poyner (1992) found that of three ‘pay & display’ car parks in Dover town centre,there were considerably fewer thefts of and from cars in the two surface car parks thanin a neighbouring multi-storey car park. Cars parked in the surface car parks weremuch more open to casual supervision from motorists parking their cars and pass-ers-by, and this was thought to be an important influence on the distribution of carcrime.
The local authority was able to reduce thefts of cars in the multi-storey car parkthrough a number of design changes. Pedestrian access to the car park was restricted tothe vehicular entrance/exit point and informal surveillance of this was increased byconstructing an office at the entrance and leasing it out to a local taxi firm. Thesechanges had much less of an effect on thefts from cars, however. Property stolen fromcars were mainly bulky items such as suitcases, and it is thought these thieves enteredthe car park in cars, unlike car thieves who were more likely to be on foot. They wouldhave appeared legitimate users of the car park at the entrance, and once inside theycould steal from cars unobserved.
Car park management
Studies have also shown that there is an important role for management in con-trolling car crime in public car parks, mainly by providing formal supervision.
A manned security gate at the entrance to Surrey University campus was able to keepthefts of cars from the campus surface car parks down to low numbers. The introduc-tion of CCTV surveillance of these car parks monitored by the University securitydepartment reduced thefts from cars (Poyner, 1992).
Thefts of cars in a multi-storey car park in Basingstoke seem to have been controlledby manned exit barriers, where motorists are required to produce parking ticketsbefore they are allowed out. Thieves preferred to steal cars from a nearby unmanned‘pay & display’ surface car park. This was a long stay commuter car park so there waslittle casual surveillance provided by people looking for a parking space. Thefts from
5

cars were more of a problem in the multi-storey car park (Laycock & Austin,forthcoming).
Thefts of vehicles from Hartlepool’s shopping centre car parks were reduced from 84in the nine months before any measures were taken to 18 in the nine monthsafterwards. This was achieved by the introduction of a ‘pay & display’ charging systemmonitored by ticket wardens (parking was originally free of charge) and a 24 hourCCTV camera surveillance system. It is thought that the introduction of parking feesalso had an effect on car park usage, with less long-stay and more short-stay parking.Thefts from vehicles did not reduce, but these were much less of a problem initially(unpublished Safer Cities project evaluation).
In Nottingham, a supervisor was employed to patrol a multi-storey car park. An officewas built for him at the car park entrance. Only small reductions in theft of and fromvehicles followed, but it was felt that the presence of the supervisor had prevented thelarge increases in car crime that had taken place in other town centre multi-storey carparks (unpublished Safer Cities project evaluate.
This study
Most of the research studies which have examined car crime in public car parks havebeen evaluations of initiatives to reduce crime in particular locations. This study wasconducted to examine more systematically the risk of car crime associated with themany different types of public car parking environments that are currently provided inthis country.
The research was conducted in the London area. Three sites were selected for study:
. town centre car parks in Kingston-upon-Thames;
. central London car parks in Marylebone; and
l commuter car parks attached to British Rail and LondonUnderground stations.
Figures from the Metropolitan police show that 85% of vehicles stolen from garage carparks (ie not open air surface car parks) in London are cars, the remainder beingcommercial vehicles (9%) and motor cycles (6%). 92% of thefts from vehicles parkedin garage car parks involve cars. The data presented for the car parks examined in thisstudy will show that the target in nearly all the thefts is a car. The preventive measuressuggested by this study are, therefore, directed mainly at car crime in car parks and maynot all be relevant to other vehicles such as motor cycles. The next chapter examinesthe scale of the problem of car crime in car parks, and this is followed by findings fromeach of the three case studies.
6
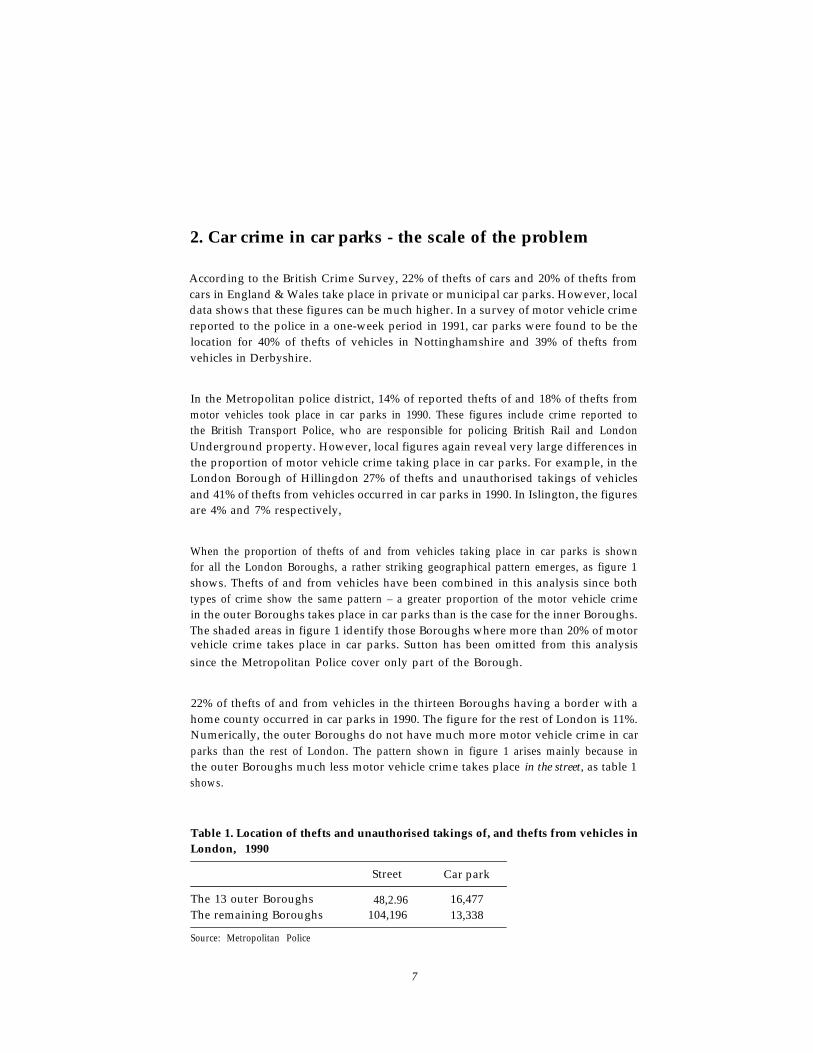
2. Car crime in car parks - the scale of the problem
According to the British Crime Survey, 22% of thefts of cars and 20% of thefts fromcars in England & Wales take place in private or municipal car parks. However, localdata shows that these figures can be much higher. In a survey of motor vehicle crimereported to the police in a one-week period in 1991, car parks were found to be thelocation for 40% of thefts of vehicles in Nottinghamshire and 39% of thefts fromvehicles in Derbyshire.
In the Metropolitan police district, 14% of reported thefts of and 18% of thefts frommotor vehicles took place in car parks in 1990. These figures include crime reported tothe British Transport Police, who are responsible for policing British Rail and LondonUnderground property. However, local figures again reveal very large differences inthe proportion of motor vehicle crime taking place in car parks. For example, in theLondon Borough of Hillingdon 27% of thefts and unauthorised takings of vehiclesand 41% of thefts from vehicles occurred in car parks in 1990. In Islington, the figuresare 4% and 7% respectively,
When the proportion of thefts of and from vehicles taking place in car parks is shownfor all the London Boroughs, a rather striking geographical pattern emerges, as figure 1shows. Thefts of and from vehicles have been combined in this analysis since bothtypes of crime show the same pattern – a greater proportion of the motor vehicle crimein the outer Boroughs takes place in car parks than is the case for the inner Boroughs.The shaded areas in figure 1 identify those Boroughs where more than 20% of motorvehicle crime takes place in car parks. Sutton has been omitted from this analysis
since the Metropolitan Police cover only part of the Borough.
22% of thefts of and from vehicles in the thirteen Boroughs having a border with ahome county occurred in car parks in 1990. The figure for the rest of London is 11%.Numerically, the outer Boroughs do not have much more motor vehicle crime in carparks than the rest of London. The pattern shown in figure 1 arises mainly because inthe outer Boroughs much less motor vehicle crime takes place in the street, as table 1shows.
Table 1. Location of thefts and unauthorised takings of, and thefts from vehicles inLondon, 1990
Street Car park
The 13 outer Boroughs 48,2.96 16,477The remaining Boroughs 104,196 13,338
Source: Metropolitan Police
7

Figure 1. Proportion of motor vehicle crime taking place in car parks in London, 1990
Source: Metropolitan and British Transport Police Forces
There may be many reasons why more of the motor vehicle crime in the outerBoroughs than in the other London Boroughs takes place in car parks. One possibilityseems to be that the greater provision of off-street parking in the outer Boroughs hastaken more cars and car crime off the streets and into the car parks. Figures publishedby the Greater London Council show that the average number of car parks and carpark spaces in an outer Borough is much higher than for other Boroughs. The lastfigures assembled by the GLC on car park provision were for 1985 – these statisticswere no longer kept after that year. However, a small random telephone survey oflocal authorities did not suggest that the number of car parks had changed much since1985. Table 2 shows the figures for car parking in the thirteen outer Boroughscompared with the rest of London.
Table 2. Off-street parking provision in London, 1985
Outer Borough Other Borough
Average number of car parks 41 25Average number of car park spaces 5,869 3,804
Source: Greater London Council (1986)
8

Although there are no data available, it also seems possible that more residentialparking in the less dense, suburban Boroughs will exist on private driveways or garagesthan on the streets. These arrangements are known to suffer much less from car crimethan on-street parking (Poyner & Webb, 1991).
Clearly, car parks can be the location for a large proportion of motor vehicle crime.However, car parks can also be very beneficial from the crime prevention point ofview. They take cars off the streets, where they are very vulnerable to crime, andprovide a parking environment where there is much more potential for effectivelycontrolling crime. The question which the rest of this report addresses is what sorts ofcar park realise this potential and provide parking which is free of theft of and fromcars.
9

3. Town centre car parks in Kingston-upon-Thames
Kingston-upon-Thames is a well-established suburban town centre with a largenumber and variety of car parks representing all those commonly found in towncentres. It is the major shopping centre in the Royal Borough of Kingston, an outerLondon Borough where a high proportion of car crime seemed to take place in carparks (see figure 1 in previous section). A great deal of information on the size,method of operation, opening times, design, and location of car parks was availablefrom local tourist information leaflets provided by the local authority. For all thesereasons, Kingston seemed to provide a useful site in which to examine the problem ofcar crime in town centre car parks.
Crime data for thefts and unauthorised takings of vehicles and thefts from vehiclesparked in car parks in the Royal Borough of Kingston were obtained for 1990. Figure 2shows the proportion of this group of crimes taking place in various sites in theBorough.
Figure 2. Location of car park motor vehicle crime in the Royal Borough ofKingston, 1990
Source: Metropolitan Police
Figure 2 does not take into account the number of parking spaces available in thedifferent locations, so it is not possible to compare the risk of car crime. However, itdoes show where the car park car crime takes place. The largest proportion of car parkmotor vehicle crime (32%) takes place in town centre and other car parks attached toshops. These include the town centres of Surbiton and New Maiden as well asKingston-upon-Thames. Residential car parks also emerge as a problem. The zoo/theme park shown in figure 2 is one site – Chessington World of Adventures.Seventy-one incidents took place here in 1990, a problem clearly related to the size of
10

the site. There is parking space for 9,000 cars, the largest concentration of car parkingin the borough. Other individual sites which emerge as locations for motor vehiclecrime are the Charrington Bowl, a bowling alley where youngsters congregate late atnight, and Kingston General Hospital. Hospital car parks have been found in previousresearch to suffer from problems of car crime (Smith, 1987; Moore, 1990).
This study focused on 19 car parks in Kingston town centre, providing parking spacefor 5,861 cars. Table 3 describes their design and method of operation.
Table 3. Number and type of car parks in Kingston town centre
Number of car parks Number of spaces
PAY & DISPLAY Surface 9 1,185Multi-storey 2 1,207
Underground 1 497
MANNED EXIT Surface 3 400Multi-storey 2 682
PAY ON FOOT Multi-storey 1 1,220Underground 1 670
Source: Directorate of Engineering and Transportation, Royal Borough of Kingston upon Thames.
All the ‘pay & display’ car parks are owned by the local authority. The surface carparks are unmanned, with patrols visiting periodically to check tickets and issueexcess charge tickets. Tickets are checked in the multi-storeys by security guards whoremain on site. The underground car park is sited below a surface car park, and is alsoregularly patrolled by security guards who remain on site. The multi-storey andunderground car parks are closed at night.
Figures 3a and b. ‘Pay & display’ car parks in Kingston town centre
NCP operate both the manned exit multi-storey and one of the manned exit surfacecar parks. Vehicular exits are controlled by an attendant who checks tickets and takesparking fees before raising a road barrier to let cars out. The other two manned exitsurface car parks are large employee car parks, one operated by the County Counciland the other by the Borough Council.
11

Figures 4a and b. Manned entrance/exit car parks in Kingston town centre
The two pay-on-foot car parks are owned and operated by department stores –Bentalls and John Lewis. The pay-on-foot system is an increasingly common methodof operating town centre car parks. The car driver is issued with a ticket by barrierequipment on entering the car park. On returning to the car park and while still onfoot, the driver inserts the ticket into a payment machine on the parking floor andpays the required parking fee. The ticket is electronically coded for use in the exitbarrier equipment and returned to the driver. At the vehicular exit, the driver insertsthe ticket into the automatic barrier equipment. The barrier arm rises and he or shecan drive out of the car park. These car parks close at night.
Figure 5. Exit barriers at Bentalls‘pay-on-foot’ car park are operated bytickets electronically coded by pay-ment machines inside the car park.The kiosk shown in the photo is per-manently manned to supervise thebarrier equipment.
The John Lewis and Bentalls car parks are both fairly recent constructions. It wastherefore decided only to use the most recent (ie 1991) data on thefts and unauthor-ised taking of vehicles, and thefts from vehicles for all town centre car parks. Onehundred and fifty incidents occurred in the town centre car parks during 1991. Theyall involved cars, except for one theft of a moped.
Theft of cars
Sixty cars were stolen or driven away from Kingston town centre car parks in 1991.Ford Escorts were the single most common model taken (n=14). Others incIuded FordCortinas and Fiestas, and Austin Minis. Older cars were targets as well as more recentmodels, with the average age of the stolen car being nine years. The risk to an older ornewer car cannot be assessed} however, without knowing how many of each there areon the road. (see Houghton, 1992).
Table 4 shows the number of cars stolen or driven away from each of the differenttypes of car park in Kingston. A rate of theft per 100 spaces has been calculated so thatthe risks in car parks of different size can be compared.
12

Table 4. Theft and unauthorised taking of cars from Kingston town centre carparks, 1991
Number of offences Rate per 100 spaces
PAY & DISPLAY Surface 34 2.9Multi-storey 11 0.9
Underground 6 1.2
MANNED EXIT Surface 3 0.8Multi-storey 2 0.3
PAY ON FOOT Multi-storey 2 0.2Underground 0 0
The location of two incidents was not known. Source: Metropolitan Police
The highest risk is clearly in the unmanned ‘pay & display’ surface car parks. There ismore than three times the risk of a car being taken from these car parks than in carparks with manned exits. The rate per 100 spaces in these unmanned car parks doesnot reach the level of risk found in some of the very worst high density public housingestates. It is, however, comparable to the rates found in high risk communal car parksassociated with low rise public housing (Poyner & Webb, 1991).
The opening times of these car parks varies considerably, and it is possible that thesurface ‘pay & display’ car parks have more crime because they are open at night whenmany of the other car parks are closed. Data on the time these crimes occurred is veryimprecise. All that is known is the time the car was parked and the time the ownerreturned and discovered the theft. However, it is possible to distinguish thefts whichtook place at night from those that took place during the day. Table 5 shows thosethefts which took place between 7am-7pm Monday-Saturday when all car parks wereopen to the public.
Table 5. Cars stolen or driven away from Kingston car parks between 7am-7pmMonday-Saturday, 1991
Number of offences Rate per 100 spaces
PAY & DISPLAY Surface 24 2.0Multi-storey 11 0.9Underground 6 1.2
MANNED EXIT Surface 2 0.5Multi-storey 2 0.3
PAY ON FOOT Multi-storey 2 0.2Underground o 0
Source: Metropolitan Police
Only 11 (19%) of thefts of cars from these car parks took place during the night,Monday-Saturday. Ten of these occurred in the ‘pay & display’ surface car parks.Nevertheless, table 5 shows that during the day when all car parks are open, cars
13
parked in surface ‘pay & display’ car parks are still much more at risk of being stolenthan in any other type of car park. The risk is much lower in car parks with mannedand closely supervised exits. It is perhaps surprising to find that ‘pay & display’multi-storey and underground car parks have a lower rate of theft than the surface carparks. Poyner (1992), for example, found that the ‘pay & display’ multi-storey car parkin Dover suffered from much more car theft than neighbouring unmanned surface carparks. The rather different pattern found in Kingston may reflect the presence ofsecurity guards on site to patrol the ‘pay & display’ multi-storey car parks periodicallyand check tickets. Table 5 shows that this is not, however, as effective in controllingcar theft as constant supervision and control of the vehicular exits.
Theft from cars
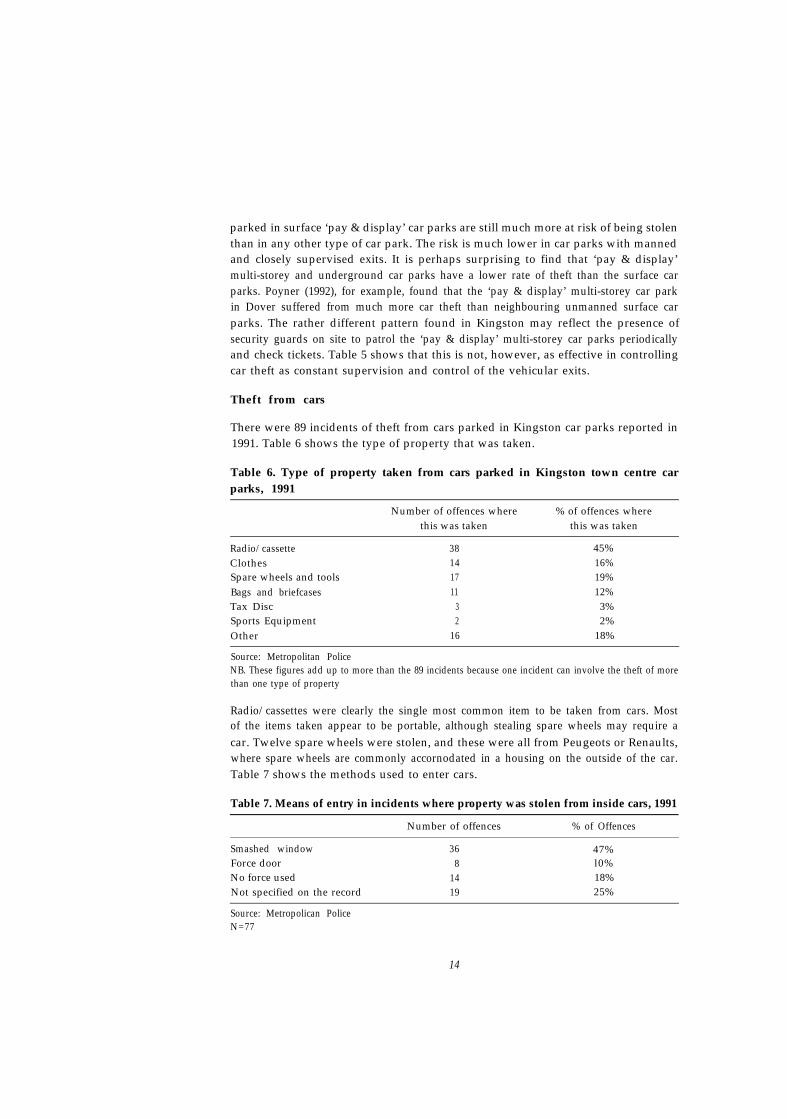
There were 89 incidents of theft from cars parked in Kingston car parks reported in1991. Table 6 shows the type of property that was taken.
Table 6. Type of property taken from cars parked in Kingston town centre carparks, 1991
Number of offences where % of offences wherethis was taken this was taken
Radio/cassette 38 45%Clothes 14 16%Spare wheels and tools 17 19%Bags and briefcases 11 12%Tax Disc 3 3%Sports Equipment 2 2%Other 16 18%
Source: Metropolitan PoliceNB. These figures add up to more than the 89 incidents because one incident can involve the theft of morethan one type of property
Radio/cassettes were clearly the single most common item to be taken from cars. Mostof the items taken appear to be portable, although stealing spare wheels may require acar. Twelve spare wheels were stolen, and these were all from Peugeots or Renaults,where spare wheels are commonly accornodated in a housing on the outside of the car.Table 7 shows the methods used to enter cars.
Table 7. Means of entry in incidents where property was stolen from inside cars, 1991
Number of offences % of Offences
Smashed window 36 47%Force door 8 l0%No force used 14 18%Not specified on the record 19 25%
Source: Metropolican PoliceN=77
14

Force was used to enter cars in over half of these incidents, the most common methodbeing to smash a window. Nevertheless, a significant number of thefts do not seem tohave involved force.
67% of thefts from cars took place during the day between Monday-Saturday. Table 8shows the number for each type of car park.
Table 8. Thefts from cars parked in Kingston town centre car parks between7am-7pm Monday-Saturday, 1991.
Number of offences Rate per 100 spaces
PAY & DISPLAY Surface 24 2.0Multi-storey 15 1.2
Underground 2 0.4
MANNED EXIT Surface 1 0.3Multi-storey 13 1.9
PAY ON FOOT Multi-storey 5 0.4Underground o 0
Source: Metropolitan Police
According to the British Crime Survey, only 40% of thefts from vehicles are reportedto the police unlike thefts of cars which are nearly all reported (Mayhew, Elliott &Dowds, 1989). The data shown in table 8 is therefore likely to underestimate the scaleof the problem. The pattern shown in table 8 is very similar to that found earlier fortheft of cars, with unmanned surface car parks having the highest risk. However, whiletheft of cars was low in manned exit multi-storey car parks, the rate of theft from cars isas high as for unmanned car parks. Clearly, controlling vehicular exit in multi-storeycar parks prevents thefts of cars, but not thefts from parked cars.
The manned exit surface and the pay-on-foot car parks show the lowest risks for boththeft of and from cars. In the surface car parks, attendants controlling vehicular exitshave a good view over the parking areas. Not only can they see most of the parked cars,but they can also be seen from most parts of the car park. These are employee car parksduring the week, and are not open to the public on these days. This may alsocontribute to the low crime rates in these car parks. However, the next chapter willshow that single-level manned-exit car parks which are open to the public also havevery low crime rates.
In the pay-on-foot car parks, vehicular exits are controlled by automatic barrierswhich are very well supervised by attendants who need to ensure the equipment doesnot fail. Each car park has four staff on duty who are employed in a supervisory andsecurity role. In the Bentalls car park, two attendants patrol the car park every halfhour. A kiosk overlooking the exit barriers is constantly staffed (see figure 5), andCCTV cameras also cover the exit and entrance barriers. These are monitored from a
15

central control room. All staff are in radio contact with each other and the controlroom. Customers can also contact staff via an intercom system located at the entranceand exit barriers. The John Lewis car park is smaller with only two levels. Staff areaccommodated in an office located on the main parking floor, and are clearly visible tocustomers as they enter the car park. The ticket machinery lies opposite the office onthe other side of the car park, so that attendants have to cross the parking floor tocheck this equipment and deal with any problems. The pay-on-foot system alsofocuses more customer activity on the parking floor, since parking fees are paid atmachines inside the car parks rather than at the exits.
Figure 6. The attendants’ office at theJohn Lewis car park is clearly visibleto all cars entering the car park, andprovides supervision over the parkingfloor.
Car park utilisation
Most of the town centre car parks appeared to be well-used during the day. Indeed, theresearch team were struck by how busy many of them seemed to be. A small survey wasconducted to count the number of cars entering and leaving a selection of town centrecar parks during the day. Ten car parks were involved in this survey – the twodepartment store and eight ‘pay & display’ car parks. Routinely collected usage datafor the two department store car parks was made available to the researchers. For the‘pay & display’ car parks, cars were counted entering or leaving each car park in four15 minute periods throughout the day. This survey was carried out on a Wednesday inApril, 1992. Figure 7 shows the figures yielded by this survey.
1 6

Figure 7. The average number of cars entering or leaving a Kingston town centrecar park in each of four 15 minute periods throughout the day.
On average, between 40 and 50 cars were found to enter or leave a car park in any 15minute period during the day. This large number of people searching for parkingspaces or passing through the car park provides a significant amount of naturalsurveillance of parked cars. This may explain why the risk of theft of and from carseven in the unmanned surface car parks is much less than in the long stay commutercar parks examined later in this study.
1 7

4. Car parks in Marylebone, central London
Figures published by the Greater London Council for 1985 show that the make-up ofcentral London car parking is very different from the suburban outer boroughs. Thereis a very large concentration of car parks in the City of Westminster – 69 car parkscompared with an average of 30 for other London Boroughs. 94% of these are eitherowned or operated by private companies. In fact, nearly one-third of all the car parksowned and operated by private companies in Greater London are located in West-minster. Half of the car parking space in Westminster is provided in underground carparks, with very little arranged in surface car parks (Greater London Council, 1986).
The Marylebone division of the Metropolitan police force covers the W1 area incentral London. It is bounded on the south side by oxford Street, on the north side byMarylebone Road and Regents Park, with Tottenham Court Road and Edgware Roadon the east and west sides respectively. Hyde Park, Mayfair, Soho, and the theatredistrict lie just across Oxford Street to the south of the division.
There are 14 public car parks in Marylebone, providing a total of 4,126 parking spaces.Five are owned by Westminster City Council, but all 14 car parks are operated byprivate companies – mainly NCP. The car parks range in size from 50 to 650 spaces,although there are only three car parks of less than 100 spaces. Seven are undergroundcar parks, six are multi-storey buildings, and there is one surface car park. All aremanned – mainly by attendants employed to check parking tickets and take fees at theexits, and let cars out by raising exit barriers. Some car parks operate ‘block parking’,either wholly or partially, where attendants park the cars and hold the keys. Table 9shows the motor vehicle crime reported in these car parks for 1991.
Table 9. Motor vehicle crime in Marylebone public car parks, 1991
Number of crimes
Theft from vehicle 430Theft and unauthorised taking of vehicle 2Attempted theft of vehicle 2Attempted theft from vehicle 5Criminal damage 35TOTAL 474
Source: Metropolitan Police
These car parks are remarkably free of thefts of vehicles. Only two vehicles werereported stolen in the year. One was used in a bank robbery and later foundabandoned. However, there were 156 thefts and unauthorised takings of vehicles fromthe streets in this division in 1991. These figures lend strong support to the findingfrom Kingston that manned car parks which supervise and control the exit of carsprevent the theft of cars from those car parks. It is possible that the traffic congestion
18

and complexity of one-way streets in central London also helps to deter thieves, sincethis makes it more difficult for them to escape if the attendant became suspicious.
Theft from cars
Thefts from cars, however, are a considerable problem. The average rate of theft fromvehicle in these car parks is 10 per 100 car park spaces, which is a great deal higherthan for any car park in Kingston.
Thefts in these car parks seem targeted on particular types of cars and property. Thecrime reports for the five largest car parks which had the most theft were examined indetail. Up-market cars were involved in most of these thefts. Mercedes, BMWs, andVW Golfs accounted for 60% of incidents, and other cars included Aston Martins,Porsches, Jaguars, Bentleys, Lotus, Audis, and Range Rovers. Car radio/cassette/CDplayers were taken in 55% of incidents, with car and mobile phones also being popular(table 10). Some of the items stolen were very bulky, for example boxes of clothingsamples, sets of golf clubs (three sets were taken out of one car in one incident) andluggage, and even a photocopier in one case. However, most items seem to be portableand could have been taken away on foot.
Table 10. Property stolen from cars parked in five Marylebone car parks, 1991
Number ofoffences wherethis was stolen
% of offenceswhere this was
stolenRadio/cassette playersCar/mobile phonesClothingLuggageBriefcases
1 9 44 84 23 43 6
55%14%12%10%10%
Source: Metropolitan PoliceN=354
Nearly all cars were forcibly entered, with windows smashed in 84% of incidents(table 11). This suggests that there is no particular problem of drivers leaving theircars unlocked in these car parks. Most incidents took place during the clay. Clearly,thieves felt quitw able to make very determined and noisy entries into cars. These carparks appear to be used by local businessmen, and cars are parked for lengthy periods ofthe day. Half of the cars broken into were parked for five hours or more and only 6%for less than an hour, so there is little of the activity found in shopper car parks.
19

Table 11. Means of entry to cars parked in five Marylebone car parks, 1991
Number of offences % of Offences
Smashed window 296 84%Forced lock 33 9%Ripped soft top 5 1%Open window/unlocked door 2 1%Not known 18 5%
Source: Metropolitan PoliceN=354
The risk of theft from cars varies considerably between the 14 car parks. Crime ratesseem strongly related to the level of supervision provided over the parking floors.Table 12 describes the design and operating characteristics of each car park. Car parksare listed in rank order according to the rate of theft per 100 spaces, with the worst atthe top and the car parks with no crime at the bottom. The double horizontal linehalf-way down the table separates the low and high crime car parks.
Table 12. Theft from cars and the design and management of car parks
Design characteristics Operating
car park Crime N of m/s m/s + u/g surf N of man blockrate spaces u/g floors exit park
barr
Chiltern St 21.0Portman Sq 16.3Cavendish Sq 15.6Bilton Towers 15.6Welbeck St 15.6Harley St 12.4Bryanston St 10.6
Clipstone St 4.8Cramer St 2.0Carburton St 1.6Selfridges 0.3Berners St 0.0Sanderson Hse 0.0Churchill Htl 0.0
Key: Crime rate – number of thefts from cars per 100 parking spacesN of spaces – number of parking spacesm/s – multistory buildingu/g – underground parkingsurf – surface car parkN of floors – number of parking floors, including split levelsman exit barr – manned exit barriersblock park - block parking, ie attendants park some or all cars
20

It is clear from the second to last column in table 12 that manned exit barriers do notcontrol theft from cars parked in multi-storey car parks. The crime rates in the worstcar parks are greater than, or at least equivalent to, any documented in high crimepublic housing estates. For example, Poyner & Webb (1987) found a rate of 7 theftsfrom cars per 100 dwellings on the Pepys estate in 1983. Nationally, thefts from motorvehicles have doubled since 1983 so the very severe crime problem experienced onthat estate in 1983 is comparable to that shown for some of these car parks in 1991.
Figures 8a and b.The Welbeck Street car park. Manned exit barriers in multi-storeycar parks prevent theft of, but not theft from parked cars.
Single level car parks with manned exit barriers have a very much lower risk of theftfrom cars, especially if they are also small car parks. In this environment, it is possiblefor attendants in their kiosks at the exits to supervise a great deal, if not all of theparking floor. Even if they cannot see all the parked cars, the attendants are muchmore likely to hear the sound of breaking glass and reach the location quickly than ina multi-level car park where it can be very difficult to locate the sound of even a caralarm.
Much more radical solutions seem to be required to prevent theft from cars inmulti-storey car parks. Table 12 shows that the two multi-storey car parks operating‘block parking’ were virtually free of such theft. One is the Berners Street car park,operated by NCP, and the other is Selfridges car park. Cars are parked by attendantswho retain the keys, and extract the car when the owner returns and pays the parkingfee. This system provides a great deal of supervision of the parking floors, especiallysince the car park operator is more responsible for the car. In both car parks, publicaccess to the parking floors is very strictly controlled. Doors leading onto the parkingfloors are alarmed, to attract attendants’ attention to anyone approaching the parkedcars. In the NCP car park the one pedestrian access point to the upper parking levels iswell-supervised from the attendants’ kiosk on the ground floor. In Selfridges, there aretwo and sometimes three attendants on each parking floor supervising the 80-140 carsparked on the floor at any one time.
21

Figures 9a and b. Selfridges car park. The open layout of the parking floors facili-tates block parking and supervision of cars by attendants working on each floor.
Table 13 below summarises the effect of these different car parking environments ontheft from cars.
Table 13. The influence of the parking environment on theft from cars in Maryle-bone, 1991
Average crime rate per100 spaces
Multi-level car park with manned exit barriers 15.5Single-level car park with manned exit barriers 4.3Multi-level car park with attendants block parking 0.2
Source: Metropolitan Police
Car parks with attendants block parking cars are clearly virtually crime-free. Data oncar park utilisation was not available, but visits to all car parks showed that all theblock parking and single-level car parks were well-used. It therefore seems unlikelythat the very large differences in crime rate shown in table 13 arise because blockparking and single-level car parks are vastly under-utilised.
Block parking is a considerably more labour intensive system than employing attend-ants simply to operate exit barriers. It might be thought, therefore, that it is economi-cally an unrealistic method of operating a car park. However, the block parking carparks do seem to provide an equally economic service, in the context of centralLondon at least, as other more automated systems. Table 14 compares the parking feesin block parking car parks with other car parks and street meters in Marylebone.
Table 14. The cost of parking for two hours in various locations in Marylebone,1992
Car parks with Other car parks Street meterblock parking
Average charge £3.97 £3.71 £4.00Cheapest charge £2.60 £2.80 £4.00Most extensive charge £5.00 £4.00 £4.00
22
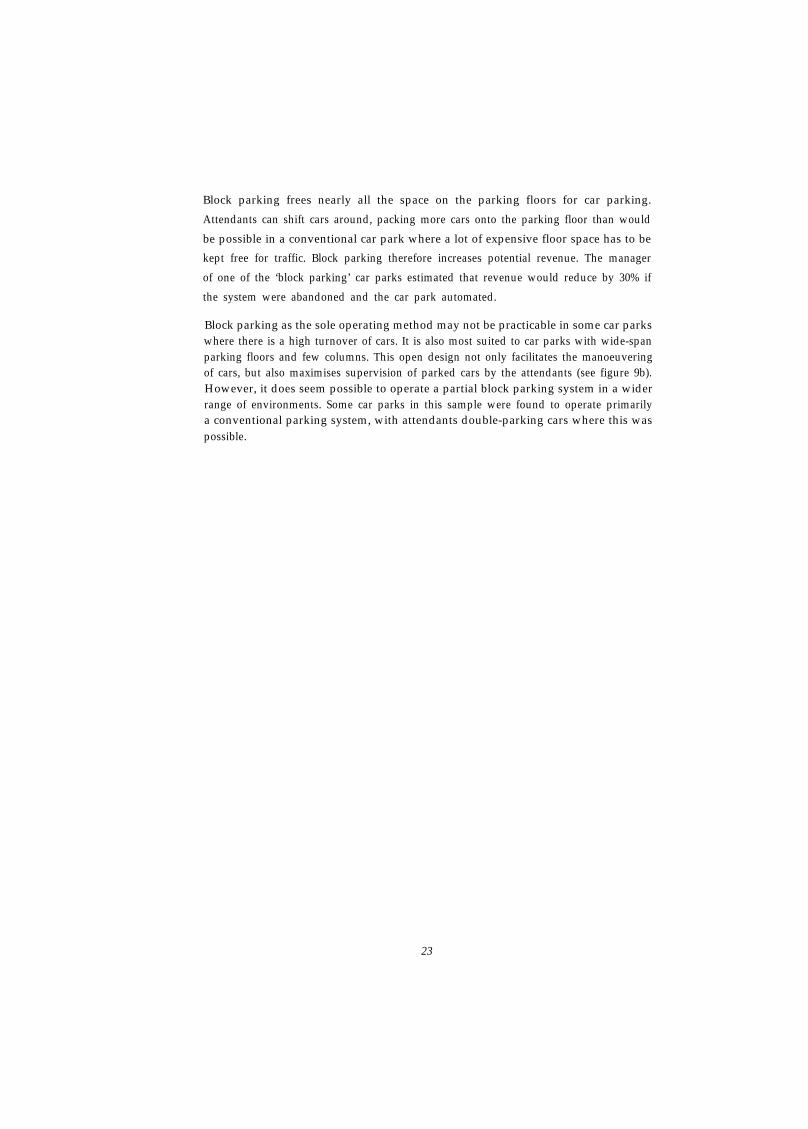
Block parking frees nearly all the space on the parking floors for car parking.
Attendants can shift cars around, packing more cars onto the parking floor than would
be possible in a conventional car park where a lot of expensive floor space has to be
kept free for traffic. Block parking therefore increases potential revenue. The manager
of one of the ‘block parking’ car parks estimated that revenue would reduce by 30% if
the system were abandoned and the car park automated.
Block parking as the sole operating method may not be practicable in some car parkswhere there is a high turnover of cars. It is also most suited to car parks with wide-spanparking floors and few columns. This open design not only facilitates the manoeuveringof cars, but also maximises supervision of parked cars by the attendants (see figure 9b).However, it does seem possible to operate a partial block parking system in a widerrange of environments. Some car parks in this sample were found to operate primarilya conventional parking system, with attendants double-parking cars where this waspossible.
23
5. Commuter car parks
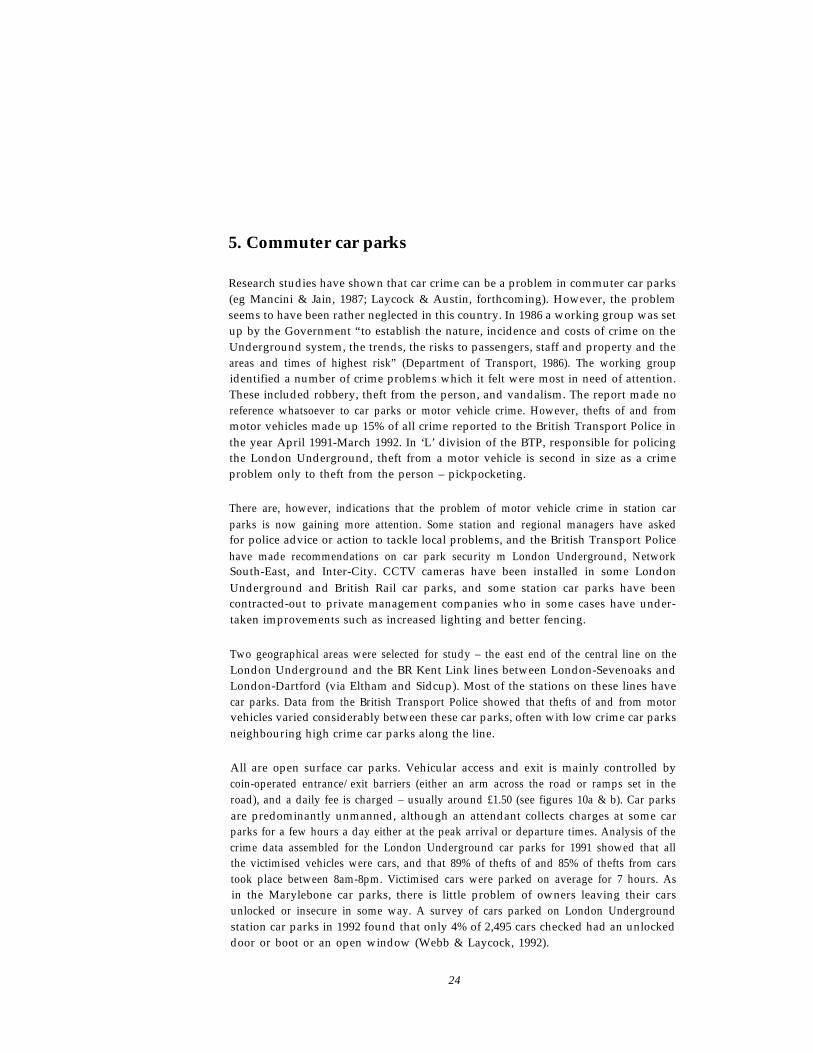
Research studies have shown that car crime can be a problem in commuter car parks(eg Mancini & Jain, 1987; Laycock & Austin, forthcoming). However, the problemseems to have been rather neglected in this country. In 1986 a working group was setup by the Government “to establish the nature, incidence and costs of crime on theUnderground system, the trends, the risks to passengers, staff and property and theareas and times of highest risk” (Department of Transport, 1986). The working groupidentified a number of crime problems which it felt were most in need of attention.These included robbery, theft from the person, and vandalism. The report made noreference whatsoever to car parks or motor vehicle crime. However, thefts of and frommotor vehicles made up 15% of all crime reported to the British Transport Police inthe year April 1991-March 1992. In ‘L’ division of the BTP, responsible for policingthe London Underground, theft from a motor vehicle is second in size as a crimeproblem only to theft from the person – pickpocketing.
There are, however, indications that the problem of motor vehicle crime in station carparks is now gaining more attention. Some station and regional managers have askedfor police advice or action to tackle local problems, and the British Transport Policehave made recommendations on car park security m London Underground, NetworkSouth-East, and Inter-City. CCTV cameras have been installed in some LondonUnderground and British Rail car parks, and some station car parks have beencontracted-out to private management companies who in some cases have under-taken improvements such as increased lighting and better fencing.
Two geographical areas were selected for study – the east end of the central line on theLondon Underground and the BR Kent Link lines between London-Sevenoaks andLondon-Dartford (via Eltham and Sidcup). Most of the stations on these lines havecar parks. Data from the British Transport Police showed that thefts of and from motorvehicles varied considerably between these car parks, often with low crime car parksneighbouring high crime car parks along the line.
All are open surface car parks. Vehicular access and exit is mainly controlled bycoin-operated entrance/exit barriers (either an arm across the road or ramps set in theroad), and a daily fee is charged – usually around £1.50 (see figures 10a & b). Car parksare predominantly unmanned, although an attendant collects charges at some carparks for a few hours a day either at the peak arrival or departure times. Analysis of thecrime data assembled for the London Underground car parks for 1991 showed that allthe victimised vehicles were cars, and that 89% of thefts of and 85% of thefts from carstook place between 8am-8pm. Victimised cars were parked on average for 7 hours. Asin the Marylebone car parks, there is little problem of owners leaving their carsunlocked or insecure in some way. A survey of cars parked on London Undergroundstation car parks in 1992 found that only 4% of 2,495 cars checked had an unlockeddoor or boot or an open window (Webb & Laycock, 1992).
24

Theft of cars
Table 15 shows thefts and unauthorised takings of cars from car parks of more than100 spaces in 1991. The operating system used in these car parks and some otherenvironmental features are also shown. Newbury Park and Sevenoaks have beenomitted from this analysis since these stations have two or three car parks and it wasoften not known from the crime data in which car park the crime occurred.
Table 15. Theft and unauthorised taking of cars from station car parks, 1991
Source: British Transport Police
Key: LU/BR – London Underground or British Rail station
N of spaces – number of car park spaces
Crime rate – number of thefts and unauthorised takings of vehicles per 100 spaces
Aut bar – coin-operated road barriers or ramps at car park entrance/exit
P&D – pay & display car park
Manned – any attendants manning the car park entrance/exit
Shops etc in c park – shops and other businesses located in the car park or at the entrance
Gd vis from plat – good surveillance over the car park from the station platforms
Paths – paths providing pedestrian access to parked cars other than via the vehicular
entrance/exit
2 5

As in previous sections, a crime rate per 100 spaces has been calculated to enablecomparison of the risk between car parks. On this basis, the car parks have been rankordered in table 15 with double horizontal lines separating high, medium and low riskcar parks. Utilisation data were available for the British Rail car parks, and these wereexamined to check how far differences in car park utilisation contributed to thepattern shown in table 15. There was no evidence of any differences in utilisationlarge enough to affect the crime pattern in any significant way.
Table 15 shows the worst crime rates for theft of cars in car parks found in this study.Clearly, cars parked in unmanned car parks where there is little public activity duringthe day have a high risk of being stolen. Coin-operated barriers in themselves do notseem to control the problem greatly. Indeed, it was sometimes found by the researchteam on visiting these car parks that these barriers were broken, and had been so forsome time – another reflection of the poor formal supervision provided over these carparks.
Figures 10a and b. Parking in these commuter car parks is controlled by coin-operated road barriers or ramps. The road ramps were sometimes found to bebroken.
The risk of theft of cars from these car parks does vary considerably, however, and thisseems related to other features of the car park. Seven car parks were found to havebusinesses operating from premises located in the car park itself or at the car parkentrance (see column labelled ‘Shops etc. in c park’). These included flower stalls, taxiand hire car offices, fast-food vans, BR offices, and vehicle servicing garages. It seemsclear from table 15 that the presence of staff and customers associated with thesebusinesses deters cars thieves. Five of the seven car parks all have low crime rates, andnone appears in the high risk group. The influence of surveillance from the stationplatforms is less clear (‘Gd vis from plat’), perhaps because there are few passengersusing the station outside of peak rush hour times. At some of these stations, trains mayalso obscure the view of the car park from the platform.
Figure 11. The presence of businessesin these car parks, such as this fast-food van at Epping, increases super-vision of the car park and prevents cartheft.
26

The presence of pathways on the perimeter of car parks seems to have an importantinfluence on the risk of theft of cars (last column in table 15 – ‘paths’). These pathwaysallow pedestrian access to the parked cars without having to use the main vehicularentrances and exits, reducing the chances of being seen from the station entrance. Insome car parks where these paths exist, there is clear evidence that large holes havebeen made in the fencing which have had to be repaired. Six of the eight car parkswhich had paths on the perimeter are in the high risk group. The one in the low riskgroup at Dartford benefits from substantial natural surveillance provided by BR staff,who have offices in the car park, and from local authority staff working in the civiccentre next to the car park.
Figure 12. Unsupervised pathsaround these car parks provide oppor-tunities for car theft.
Table 16 below compares the risk of theft of cars in the two very different parkingenvironments identified in this study.
Table 16. Theft and unauthorised taking of cars from two station car parkingenvironments
Number of Number of Risk per 100spaces crimes spaces
No surveillance from local businesses,and paths on the perimeter providingaccess to car park (7 car parks) 1,365 157 11.5
Businesses and offices in the car parkor at the car park entrance, and ped-estrian access only via main vehicularentrance (6 car parks) 1,637 56 3.4
Source: British Transport Police
27

Theft from cars
Table 17 shows theft from cars in these station car parks.
Table 17. Theft from cars in station car parks, 1991
Source: British Transport PoliceKey: LU/BR – London Underground or British Rail station
N of spaces – number of car park spacesCrime rate – number of thefts from vehicles per 100 spacesAut bar – coin-operated road barriers or ramps at car park entrance/exitP&D – pay & displayManned - any attendants manning the car park entrances/exitsShops etc in c park – shops and other businesses located in the car park or at the entrance
Gd vis from plat – good surveillance over the car park from the station platformsPaths - paths providing pedestrian access to parked cars other than via the vehicularentrance/exit
The figures in table 17 again demonstrate that managing commuter car parks onlywith automatic coin-operated barriers or ‘pay & display’ machines does little tocontrol theft from cars. The risk of theft from cars in five of these car parks was as highas that found in the very worst central London multi- storey car park.
28

The environmental features found to influence theft of cars have a much weaker effecton theft from cars. Theft from cars, as found in previous sections, is a much moreprevalent and difficult crime to control and requires more determined preventiveeffort. It may not be sufficient to rely on natural surveillance provided by localbusinesses and other activity. The weaker influence of paths on the car park perimeteralso suggests that offenders are more likely to enter the car park in cars rather than onfoot.
29

6. Conclusions
Staffing
There is little doubt that staffing is a crucial issue in the control of car crime in carparks. The highest risk of both theft of and from cars in Kingston was found inunmanned ‘pay & display’ surface car parks. The problem is considerably worse wherecars are left for long periods during the day. The unmanned surface car parks atcommuter train stations had the worst risk for both theft of and from cars found in thisstudy, or indeed documented in any other environment. The automatic coin-oper-ated road barriers by themselves seemed to contribute little to the control of car crimein these car parks.
The presence of people in and around car parks may help to deter thieves. In the busyKingston town centre car parks, both surface and multi-storeys had much lower ratesof theft of and from cars than the commuter car parks where there is little parkingactivity during the day. The level of customer activity during the clay can beinfluenced by pricing policy as well as the location of the car park. In the long staysurface car parks, the presence during the day of staff and customers associated withbusinesses and shops can help to reduce crime. It was not uncommon to find garageservices, flower stalls, fast food vans, taxis, and BR staff offices in station car parks.Where these were found, the car crime rate was much lower, especially theft of cars. Inthis situation, it may be helpful to have most of the parking activity confined to thebeginning and end of the day so that suspicious behaviour is more easily noticedduring the day. It is important that there is no pedestrian access to these car parksother than through the main vehicular entrance.
Natural surveillance is not, however, as effective as constant formal supervision by acar park attendant. In Kingston, the risk of both theft of and from cars in surface carparks was considerably lower where the entrance/exit was manned by an attendantthan when a ‘pay & display’ system was used, even though the unmanned car parkswere very busy.
Multi-storey car parks present a rather different sort of problem. Manning the exits ofmulti-storey car parks is very effective at reducing theft of cars. It does not, however,prevent thefts from cars. This is a more difficult problem to tackle. Car parks whichprovide direct and constant supervision by staff of the parking floors suffer little theftfrom cars. Examples found in this study are the John Lewis car park in Kingston andthose car parks in central London which ‘block parked’ cars, for example Selfridges carpark and others operated by NCP.
The distinctive feature of these car parks is the presence of staff working directly onthe parking floors. There is also much more of a ‘customer service’ quality to the workof car park attendants. Attendants in the John Lewis car park help people who cannotstart their cars or who have locked their keys in the car, look out for problems such as
30

dogs or even children left in cars, and so on. In the block parking car parks it was notuncommon to find attendants washing cars during a lull in business. These tasks addmuch needed variety to the work of a car park attendant, and staff seemed bright,helpful, and interested in their work. The result of all this is active and constantsupervision of parked cars.
One other characteristic of some of these car parks was their approach to the issue ofliability for damage and theft involving parked cars. There was a much greaterwillingness to consider compensation in incidents of this kind. In the departmentstore car parks, drivers were treated as store customers. Their custom was valued, andthe image and reputation of the car park was important for the store as a whole.Indeed, the car park was managed as another department of the store. In the blockparking car parks, the car park operator has more responsibility for the cars since thekeys are handed over to the attendants.
Car crime and car park liability
The question of who bears the costs of car crime in car parks is a crucial one, since itidentifies those with most incentive for tackling the problem. Currently, car parkcustomers bear a substantial proportion of these costs, incurred through repairing orreplacing property or increased insurance premiums. However, the scope for cus-tomers to reduce car crime in car parks is limited. The evidence from this study is thatmost drivers leave their cars properly secured in car parks, especially in long-staycommuter car parks. This is supported by an NOP survey commisioned by the HomeOffice and carried out in January 1992. Only 3.5% of the sample of 1,005 regularvehicle users said they might leave their car unlocked in a car park, compared with27.8% who said they might do so outside their home during the day.
One other way in which car drivers might be able to influence the risk is through theirchoice of car park. By favouring ‘secure’ car parks, drivers would reduce the risk ofcrime to their own car and encourage car park operators m provide safer parkingenvironments to meet this market. One of the reasons Dover District Councilimplemented crime prevention measures in the multi-storey car park was because thecar park’s reputation had become known to local people, and they had begun to useother car parks instead (Poyner, 1992). Drivers could be encouraged to use moresecure car parks through the terms of their car insurance policy. For example, penaltyclauses might be introduced making the driver liable for a certain amount of the loss ifthe car was parked in a sub-security standard car park.
However, there are two serious obstacles which currently prevent drivers from makingthese choices. First, car drivers have no knowledge of the risks of car crime associatedwith individual car parks and are therefore unable to judge which provide safe parkingenvironments. This problem is currently being addressed by the police ‘secured carpark’ scheme, which involves publicising those car parks which in the police’s vieware more secure. There are indications that the potential commercial benefit of being
31

designated a secure car park is recognised, with a number of car park operators alreadyexpressing their interest in participating in the scheme.
The second problem is that in many situations drivers have little if any realistic choiceof car park. Station car parks, for example, often have a virtual monopoly on long-staycommuter parking. In busy city and town centres where there are more car parks, thedemand for car park spaces may exceed the supply to the extent that drivers are onlytoo happy to have found somewhere to park at all, let alone have a choice of car park.In unfamiliar locations, drivers may also not know where all the car parks are,although recent signing systems help in this respect.
This and previous research has shown that there is a great deal that car park managerscan do to reduce car crime in car parks. However, there is currently little incentive forthem to take preventive action. They do not bear the costs of car crime, and in someareas have a virtual monopoly on parking – you either use them or you do not park.
The Consumers’ Association and the RAC have both raised the issue of car parkoperators’ liability for crime in their car parks. The RAC has called for car parkoperators to accept more responsibility for the safety of their customers and security ofvehicles parked on their premises. The argument for making car park operators moreliable to compensation claims from victims of car crime is attractive from the crimeprevention point of view. By making car crime in car parks an operational cost, astrong economic incentive is created for car park managers to monitor the problemand take action if it gets out of hand.
One argument against increasing car park liability in this way is that it would result inincreased parking charges. In some situations, this may displace parking from car parksto the street as drivers search for cheaper parking. The cost of providing off-streetparking may become uneconomic for some, for example small businesses, who mayhave to close their car parks. Any scheme which increased demand for street parkingwould be undesirable since this reduces the scope for protecting cars, increases roadcongestion, and creates even more inconvenience for drivers trying to park their cars.
However, it has been shown in this study that there are situations where ‘crime free’parking can be provided for the same price as car parks which suffer from a lot of carcrime. Automated stacking systems of the kind illustrated in figure 13 where there isno public access to parked cars at all also appear to be receiving increased attention inthis country as an economic solution to parking in city centres (Jabez, 1992). In thesecar parks, cars are driven onto a bogie which is then shuttled into a parking space bycomputer-controlled elevators and guidance systems.
32

Figure 13. Model of an automatedstacking car park
There is limited evidence from two unpublished surveys that drivers might beprepared to pay more for secure parking. The British Transport Police carried out asurvey of 738 drivers using a London Underground car park and found that 58% wouldbe willing to pay more for parking in that car park if there was extra security. A surveyof car park users conducted for Nottingham City Council reported there was “strongevidence from the survey that suggests people would be prepared to pay extra forimproved security measures, especially at night”. However, one has to be careful ininterpreting these findings that respondents are not simply providing ‘acceptable’responses.
Another complication in considering the liability issue is the relationship betweencar park owner and operator in the case of contracted-out car parks. For example,many local authority-owned car parks are contracted-out to private companies. It isunclear in this situation who should be responsible for ensuring that an adequate levelof security is provided in these car parks and who, therefore, should be liable for anycompensation claims. The terms of the contract may also limit the options open to theoperator for managing the car park. Station car parks seem to be particularly confus-ing. It would need to be clear who is responsible for managing car parks at British Railand London Underground interchange stations, or car parks used by Network SouthEast and Inter-City customers.
The circumstances in which car park owners/operators could conceivably be heldliable for compensation would also need to be specified. It seems clear that car parkowners/operators could not fairly be held liable in all circumstances. Calder & Sipes(1992) have recently examined this issue in the US in the context of attacks oncustomers. There is no legal duty in the US for one person to protect another fromsudden criminal attack, but businesses do owe a duty of reasonable care to theircustomers. Calder & Sipes review a sample of liability cases including a numberinvolving parking lots and garages. The review identifies issues such as how muchresponsibility is deemed to lie with the victim and how much with the business; howmuch criminal activity there was in the location beforehand; whether the businesshad warned customers of the risks; and whether the business had introduced anysecurity measures. Many of these issues also seem relevant to car crime. For example,the RAC suggests that drivers would need to prove that they had taken sufficient
33
precautions, such as locking the car and hiding its contents from view. In addition, itwould also be important to protect businesses from fraudulent claims that a car hadbeen stolen or broken into in a car park.
If car crime became an operational issue for car parks, operators would have tomonitor it properly with the result that information on the problem would improvegreatly. Police data on car crime in car parks can be very sparse, and suffer fromproblems identifying location. For example, a car park can be known by two or threedifferent names. There may also be a number of car parks located on one road allreferred to in the same way (eg car park in Acacia Avenue). More precise informationon the location of the parked car in the car park was often not available from policerecords. If data on crime became collected as management information, the un-doubted improvement in detail would enable much more detailed descriptions ofparticular crime problems, and generate a much wider and more precisely targetedrange of crime prevention measures.
34

References
British Standards Institution (1990), Road Lighting. Part 9. Code of practice for lightingfor urban centres and public amenity areas: car parks. London: British StandardsInstitution.
Calder, J.D. & Sipes, D.D. (1992), ‘Crime, security, and premises liability: towardprecision in security expert testimony’. Security Journal, Vol 3, No.2, pages 66-82.
Department of Transport (1986), Crime on the London Underground: a report of a studyby the Department of Transport in conjunction with London Underground, the HomeOffice, the Metropolitan Police and the British Transport Police. London: HMSO.
Eck, J. & Spelman, W. (1992), ‘Thefts from vehicles in shipyard parking lots’, inClarke, R. V. (editor), Situational Crime Prevention: successful case studies. New York,Harrow & Heston.
Greater London Council (1969), 1967 Annual Abstract of Greater London Statistics.London: Greater London Council, Research and Intelligence Unit.
Greater London Council (1986), 1984-85 Annual Abstract of Greater London Stat-istics. London: Greater London Council, Intelligence Unit.
Houghton, G. (1992), Car Crime in England & Wales: the Home Office Car TheftIndex. Crime Prevention Unit Series Paper 33. London: Home Office.
Jabez, A. (1992), ‘Park and Parcel’. Building, 3rd April, pages 48-49.
Johnston, V., Leek, M., Shapland, J., & Wiles, P. (1990), Crimes and other problemson industrial estates. Research report by University of Sheffield.
Laycock, G. & Austin, C. (forthcoming), ‘Crime prevention in parking facilities’.Security Journal.
Mancini, A.A. & Jain, R. (1987), ‘Commuter parking lots – vandalism and deter-rence’. Transportation Quarterly, Vol 41, No 4, pages 539-553.
Mayhew, P., Elliott, D., & Dowds, L. (1989), The 1988 British Crime Survey. HomeOffice Research Study No. 111. London: HMSO.
Moore, D, (1990), A study of crime in two Belfast hospitals using crime analysis method-ology. Belfast: Centre for Independent Research and Analysis of Crime (CIRAC).
Poyner, B. & Webb, B. (1987), Successful Crime Prevention: case studies. London:The Tavistock Institute of Human Relations.
35
Poyner, B. & Webb, B. (1991), Crime Free Housing. Oxford: Butterworth-Heinemann.
Poyner, B. (1992), ‘Situational crime prevention in two parking facilities’, in Clarke,R.V. (editor), Situational Crime Prevention: successful case studies. New York, Harrow& Heston.
RAC (1991), Cars in Cities: how to tackle congestion and improve the quality of life. Policyleaflet 5. London: RAC.
Smith, L.J.F. (1987), Crime in Hospitals: diagnosis and prevention. Crime PreventionUnit Paper 7. London: Home Office.
Wallis, A. & Ford, D. (1980), Crime Prevention Through Environmental Design: theschool demonstration in Broward County, Florida (Executive Summary). WashingtonDC, USA: National Institute of Justice.
Webb, B. & Laycock, G. (1992), Tackling Car Crime: the nature and extent of theproblem. Crime Prevention Unit Paper 32. London: Home Office.
Which? (1990), Pay & dismay? June, pages 330-333.
Worskett, D.H. (1991), ‘Parking: the motorist’s viewpoint’. Paper presented atPTRC Traffex conference, NEC. April.
36

Crime Prevention Unit Papers
2 .
1.
3.
4.
5.
6.
7.
8.
9.
10.
11.
12.
13.
14.
15.
Reducing Burglary: a study of chemists’ shops.Gloria Laycock. 1985. v + 7pp. (0 86353 154 8).
Reducing Crime: developing the role of crime prevention panels.Lorna J F Smith and Gloria Laycock. 1987. v + 14pp. (0 86252 189 0).
Property Marking: a deterrant to domestic burglary?Gloria Laycock. 1985. v + 25pp. (0 86252 193 ?).
Designing for Car Security: towards a crime free car.Dean Southall and Paul Ekblom. 1986. v + 15pp. (0 86252 222 6).
The Prevention of Shop Theft: an approach through crime analysis.Paul Ekblom. 1986. v + 19pp. (0 86252 237 4).
Prepayment Coin Meters: a target for burglary.Nigel Hill.. 1986. v + 15pp. (0 86252 245 5).
Crime in Hospitals: diagnosis and prevention.Lorna J F Smith. 1987. v + 25pp. (0 86252 267 6).
Preventing Juvenile Crime: the Staffordshire Experience.Kevin Heal and Gloria Laycock. 1987. v + 29pp. (0 86252 297 8).
Preventing Robberies at Sub-Post Offices: an evaluation of asecurity initiative. Paul Ekblom. 1987. v + 34pp. (0 86252 300 1).
Getting the Best Out of Crime Analysis.Paul Ekblom. 1988. v + 38pp. (0 86252 307 8).
Retail Crime: Prevention through Crime Analysis.John Burrows. 1988. v + 30pp. (0 86252 313 3).
Neighbourhood Watch in England and Wales: a locational analysis.Sohail Husain. 1988. v + 63pp. (0 86252 314 1).
The Kirkholt Burglary Prevention Project, Rochdale.David Forrester, Mike Chatterton and Ken Pease with the assistanceof Robin Brown. 1988. v + 34pp. (0 86252 333 8).
The Prevention of Robbery at Building Society Branches.Claire Austin. 1988. v + 18pp. (0 86252 337 0).
Crime and Racial Harassment in Asian-run Small Shops:the scope for prevention. Paul Ekblom and Frances Simon with theassistance of Sneh Birdi. 1988. v + 54pp. (0 86252 348 6).
37

16. Crime and Nuisance in the Shopping Centre: a casestudy in crime prevention. Susan Phillips and Raymond Cochrane.1988. v + 32pp. (0 86252 358 3).
17. The Prevention of Fraud.Michael Levi. 1988. v + 19pp. (0 86252 359 1).
18. An Evaluation of Domestic Security Surveys.Gloria Laycock. 1989. v + 33pp. (0 86252 408 3).
19. Downtown Drinkers: the perceptions and fears of the public in a citycentre. Malcolm Ramsay. 1989. v + 23pp. (0 86252 419 9).
20. The Management and Prevention of Juvenile Crime Problems.Barrymore Cooper. 1989. v + 63pp. (0 86252 420 2).
21. Victim Support and Crime Prevention in an Inner-City Setting.Alice Sampson and Graham Farrell. 1990. v + 27pp. (0 86252 504 7).
22. Lagerland Lost? An experiment in keeping drinkers off the street incentral Coventry and elsewhere. Malcolm Ramsay. 1990. v + 38pp. (086252 520 9).
23. The Kirkholt Burglary Prevention Project: Phase II.David Forrester, Samantha Frenz, Martin 0’Connell and Ken Pease. 1990. v+ 51 pp. (0 86252).
24. Probation Practice in Crime Prevention.Jane Geraghty. 1991. v + 45pp. (0 86252 605 1).
25. Lessons from a Victim Support Crime Prevention Project.Alice Sampson. 1991. v + 41pp. (0 86252 616 7).
26. The Prevention of Cheque and Credit Card Fraud.Michael Levi, Paul Bissell and Tony Richardson. 1991.v + 52pp. (0 86252 633 7).
27. Making Crime Prevention Pay: initiatives from business.John Burrows. 1991. v + 50pp. (0 86252 629 9).
28. The Influence of Street Lighting on Crime and Fear of Crime.Stephen Atkins, Sohail Husain, Angele Storey. 1991.v + 77pp. (0 86262 668 X).
29. The Effect of Better Street Lighting on Crime and Fear: a review.Malcolm Ramsay with the assistance of Rosemary Newton.1991. v + 48pp. (0 86252 670 1).
38

30. Reducing Crime on the London Underground: an evaluation ofthree pilot projects. Barry Webb and Gloria Laycock.1992. V + 3lpp. (0 86252 688 4).
31. Assessing Crime Prevention Initiatives: the first steps.Geoff Berry and Mike Carter,1992. v + 46pp. (0 86252 823 2).
32. Tackling Car Crime: the nature and extent of the problem.Barry Webb and Gloria Laycock.1992. v + 32pp. (0 86252 832 1).
33. Car Crime in England & Wales: the Home Office Car Theft Index.George Houghton.1992. (0 86252 712 0).
39