preventing and controlling hypertension: a city health .../media/files/activity files/disease... ·...
TRANSCRIPT
1
Sonia Angell, MD, MPHDirector, CVD Prevention and Control ProgramNew York City Department of Health and Mental Hygiene
Preventing and Controlling Hypertension:
A City Health Department Perspective

2
Outline•
Context–
New York City (NYC) Demographics
–
Epidemiology•
Establishing Priorities –
Value of quality local data
•
Taking Action–
Targeting Health Care System
–
Targeting Community –
City-Wide
•
Conclusion


4
Not So Different: Leading Cause of Death CVD
Data Source: NYCDOHMH Bureau of Vital Statistics, 2006
42%
24%
16%
5%
3%
Heart Disease/StrokeCancerInfluenza/PneumoniaDiabetesAll Other Causes

5
Premature CVD in New York City by Race/Ethnicity
Age Adjusted Death Rates Per 100,000 Population for CVD by Ethnicity: 64 and Younger NYC 1994 to 2006
0
20
40
60
80
100
120
140
1994 1995 1996 1997 1998 1999 2000 2001 2002 2003 2004 2005 2006
Year
Age
Adj
uste
d D
eath
Rat
es P
er 1
00,0
00 P
opul
atio
n
Hispanic Asian White Black Overall
From 1994 to 1999 population counts use Census estimates, from 2000 on population counts use Census estimates as of August 2008. All population counts centered on July 1st.
Source: NYC DOHMH Bureau of Vital Statistics 2006

6
Hypertension as a Local Priority Where’s the data?!
•
Sources–
NYC HANES
–
CHS–
Vital Statistics
–
SPARKS•
Presentation–
GIS
–
‘Epiquery’
•
Agency Priority Setting
•
Community Priority Setting
•
Program –
Design
–
Evaluation–
Monitoring
•
Indicators

7
Wednesday, September 24, 2008 More than 750,000 New Yorkers in Danger of Heart
Attack or Stroke Due to Uncontrolled High Blood Pressure
More than three quarters of a million New Yorkers are at increased risk of heart attack or stroke due to dangerously high blood pressure. High blood pressure is a leading of cause heart disease and stroke, which together take the lives of more than 24,000 New Yorkers every year. PRESS RELEASE # 064-08

8
Examining Disparities: Hypertension Prevalence by
Race and Sex in NYC
* p<0.05 compared to whites
**
*
Source: Angell et al. Circ Cardiovasc Qual Outcomes 2008;1:46-53
2022
3234
24 25
30
25
0
5
10
15
20
25
30
35
40
Men Women
Perc
ent o
f Pop
ulat
ion
NH White NH Black NH Asian Hispanic

9
67
54
33
75
63
44
0
10
20
30
40
50
60
70
80
Aw areness Treatment Control
Perc
ent o
f Pop
ulat
ion
US NYC
Examining Awareness, Treatment and Control among Adults with
Hypertension
Data are age-adjusted to the 2000 US Standard Population
Sources: Ong et al. Hypertension 2007;49:69-75, Angell et al. Circ Cardiovasc Qual Outcomes 2008;1:46-53

10
Examining Treatment Success: Odds of Control Among Treated:
Model 1:Control among ALL ADULTS
Model 2: Control among ADULTS20-64 YEARS OF AGE
Race/ethnicity NH White 1.00 1.00NH Black 0.74 (0.33, 1.67) 0.24 (0.06, 0.92)NH Asian 0.50 (0.16, 1.57) 0.56 (0.09, 3.45)Hispanic 0.75 (0.34, 1.63) 0.46 (0.11, 2.00)
Insurance Coverage Private 1.00 1.00Medicare 0.92 (0.36, 2.33) --Other Govt 0.72 (0.30, 1.76) 0.52 (0.20, 1.32)Uninsured 0.89 (0.30, 2.59) 0.93 (0.27, 3.27)
Have a Routine Yes 1.00 1.00Place Of Care No 0.21 (0.07, 0.66) 0.37 (0.11, 1.28)
* Adjusted for covariates in table plus age, sex, country of birth, education, income
Source: Angell et al. Circ Cardiovasc Qual Outcomes 2008;1:46-53

11
Percent High Blood Pressure13 - 20
21 - 25
26+
Geographic Distribution of Disease: Self-Reported High Blood Pressure
Source: New York City Community Health Survey 2006

12
Examining Relationships

13
Establishing Targets

14
Hypertension Data•
Summary Findings–
Common
–
Disease burden is unevenly distributed•
By socio-economic and geographic indicators–
Disease is poorly controlled
–
Striking disparities in control exist•
Data Supported/Defined–
Justification for local prioritization
–
Target populations and geographic regions–
Potential for systems change
–
Baseline for evaluation

15
Targeting High Risk Populations through Health Care Systems Change

16
•
Improve surveillance–
Establish indicators
•
Effective treatment–
Algorithms
–
Standardize formularies–
Standardize BP measurement
–
Use of registries for planned care–
Provider tools and support
–
Patient tools and support•
Systematic accountability–
Use of indicators for performance feedback
Health Care Systems Change
17
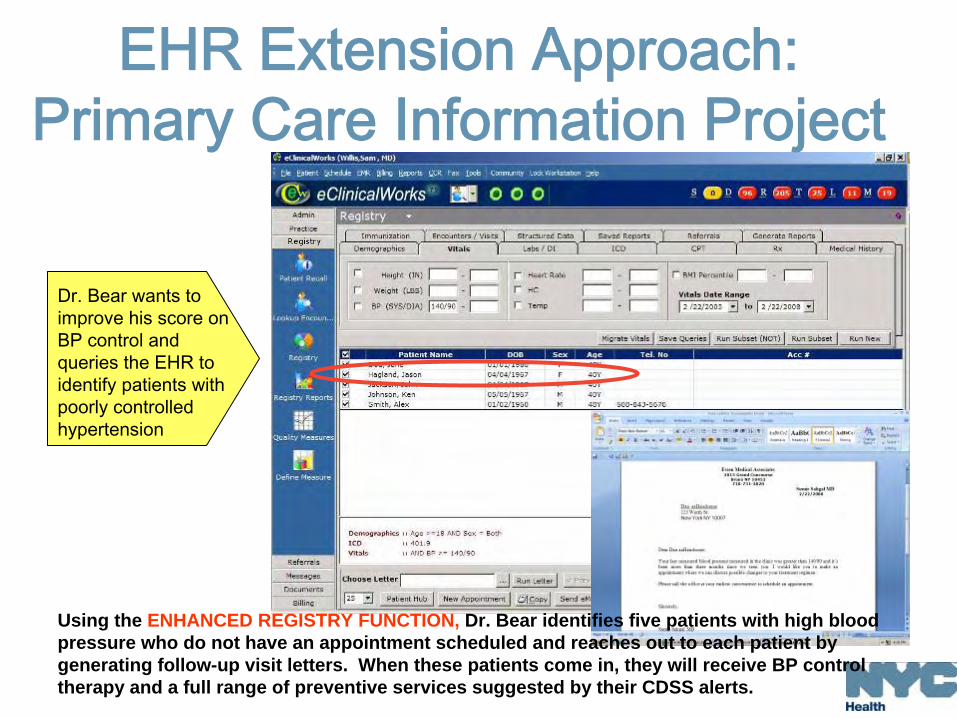
Dr. Bear wants to improve his score on BP control and queries the EHR to identify patients with poorly controlled hypertension
Using the ENHANCED REGISTRY FUNCTION, Dr. Bear identifies five patients with high blood pressure who do not have an appointment scheduled and reaches out to each patient by generating follow-up visit letters. When these patients come in, they will receive BP control therapy and a full range of preventive services suggested by their CDSS alerts.
EHR Extension Approach: Primary Care Information Project

18
Health Care Network Approach: Collaboration with HHC
Largest municipal hospital and health care system in the United States
•
Serves 1.3 million New Yorkers and nearly 400,000 who are uninsured
•
Nearly 5 million outpatient visits annually•
Workforce of 39,000 physicians, nurses, and healthcare professionals
•
Patients speak more than 100 different languages

19
Supporting Practice Change: Indicators, Technical Assistance,
Clinical Practice Tools
Generic25/37.5 mg , 25/50 mgDiazide (HCTZ/ Triamterine)
6. Potassium-sparing Diuretic
Generic25 mg, 50 mg, 100 mgChlorthalidone
5. Thiazide Diuretics
Generic, *Consult with OB-Gyn
200 mg, 300 mgLabetalol*
Generic125 mg, 250 mg, 500 mgMethyldopa 12. Pregnancy (and Stage 2 HTN)
Generic 2.5 mg, 5 mg, 10 mgAmlodipine3. Calcium Channel Blockers
On Patent25 mg, 50 mg, 100 mgLosartan (Cozaar)2. Angiotensin Receptor Blockers (ARB)
Generic5 mg Torsemide
HHC Antihypertensive Medication Formulary Recommendation
Category Medications Dosage Comments
1. Angiotensin Converting Enzyme Inhibitors (ACEI)
Lisinopril (Prinivil) 10 mg, 20 mg Generic
Enalapril (Vasotec) 2.5 mg, 5 mg, 10 mg, 20 mg Generic
Telmasartan (Micardis) 20 mg, 40 mg, 80 mg On Patent
Diltiazem ER 120 mg Generic
4. Beta Blockers Metoprolol XL (Toprol) 25 mg, 50 mg, 100 mg Generic
Carvedilol (Coreg ) 6.25 mg, 12.5 mg, 25 mg Generic, ACCORD, Diabetics
Hydrochlorothiazide 12.5mg, 25 mg Generic
7. Loop Diuretics Furosemide 20 mg, 40 mg, 80 mg Generic
8. Centrally-acting Alpha Agonist
Clonidine 0.1 mg, 0.2 mg, 0.3 mg Generic
9. Vasodilators Hydralazine 10 mg, 25 mg, 50 mg, 100 mg
Generic
Minoxidil 2.5 mg, 5 mg, 10 mg Generic
10, Aldosterone Antagonist Spironolactone 25 mg, 50 mg, 1000 mg Generic
11. Combination Drugs Enalapril/HCTZ 5/12.5 mg, 10/12.5 mg, 25/12.5 mg, 10/25 mg
Generic, Improved Compliance
Lisinopril/HCTZ 10/12.5 mg, 20/12.5 mg, 10/25 mg, 20/25 mg
Generic, Improved Compliance
Losartan/HCTZ 50/12.5 mg, 50/25 mg, 100/25 mg
Generic, Improved Compliance
Amlodipine/Benazepril 5/10 mg, 5/20 mg, 10/20 mg Generic, ACCORD, Improved Compliance
Hydralazine* 10 mg, 25 mg, 50 mg, 100 mg
Generic, *Consult with OB-Gyn

20
Supporting Practice Change: Self Blood Pressure Monitoring,
Nutrition and Medication Adherence Training

21
Supporting Practice Change: Public Health Hypertension Detailing

22
Targeting High Risk Populations in Geographic Regions
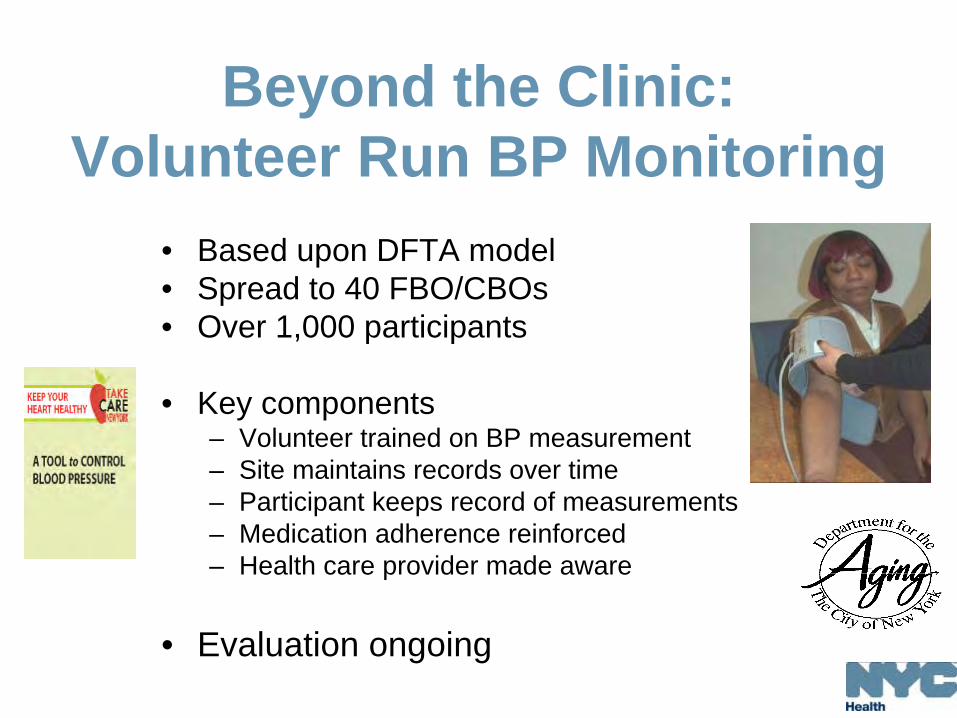
Beyond the Clinic: Volunteer Run BP Monitoring
•
Based upon DFTA model•
Spread to 40 FBO/CBOs
•
Over 1,000 participants
•
Key components–
Volunteer trained on BP measurement–
Site maintains records over time–
Participant keeps record of measurements–
Medication adherence reinforced–
Health care provider made aware
•
Evaluation ongoing

24
Beyond the Clinic: Pharmacies
•
Community pharmacies collaboration•
All pharmacies within geographic with stationary automated blood pressure measurement kiosk
•
Media and marketing campaign:–
Encourages residents to use
–
Pharmacies advertised by:•
Primary care provider
•
FBO and CBOs•
Public housing developments
•
Local billboards

25
Legend# Unknown
# Receiving Basic Kiosk
# Receiving Computer Kiosk
# Participating with Own Kiosk
# Duane Reade
# Rite Aid
# CVS
# Non-Participating
# Chain Other
NYCHA
#
#
##
#
#
#
#
#
#
#
#
# #
#
#
#
##
#
#
#
##
##
#
#
#
#
#
#
##
# ##
# #
##
## #
#
#
# #
#
#
##
#
#
#
##
#
##
##
#
#
#
#
10451
1045 2
10459
10037
10030
10039
10454
1045510474
1 0 0 3 7
1 0 4 5 1
unset
HARLEM RIVER
Legend# Unknown
# Receiving Basic Kiosk
# Receiving Computer Kiosk
# Participating with Own Kiosk
# Duane Reade
# Rite Aid
# CVS
# Non-Participating
# Chain Other
NYCHA
South Bronx
Targeted Pilot Program Areas
Prioritized:•
Pharmacy density and clustering
•
Population density

26
Population Level Interventions: Changing the Food Environment

27
Influencing Individual Decisions

28
0
500
1,000
1,500
2,000
2,500
3,000
3,500
4,000
NHANES I1971-74
NHANES II1976-80
NHANES III1988-94
NHANES IV1999-00
BP Reduction Through Decreasing Salt Intake Would Save Many Lives
Briefel
RR, Johnson CL. Secular trends in dietary intake in the United States. Annu Rev Nutr. 2004;24:401-431
U.S
. adu
lts, 2
0-74
yea
rsS
alt c
onsu
mpt
ion
(mg/
day)
2005 U.S. Dietary Guidelines recommendation for adults
150,000 lives saved w/ lifetime ↓
in intake
Recommended limit for people with hypertension, blacks, middle-aged and older

29Source: CSPI. Adapted from: http://www.cspinet.org/salt/saltreport.pdfData: Mattes, RD. Journal of American College Nutrition, 1991, 10:383-393.
Most Salt Comes from Processed and Restaurant Foods…
Processed and
restaurant foods
77%
12%
While eating
6%
5%
Realistically, individuals
can’t control how much
salt is in the food they eat

30
Action in US Has Been Limited•
Government -
FDA
–
In 1983, FDA Commissioner called for voluntary reductions; little progress
–
Held hearings on salt in fall 2007–
Cities and states testified and submitted comments that support FDA action
•
Private -
Keystone–
Major manufacturers involved
–
Developed front-of-package labeling system for better-for-you products
–
Launched in winter 2008–
Will only affect the portion of products that are labeled, not all products
31
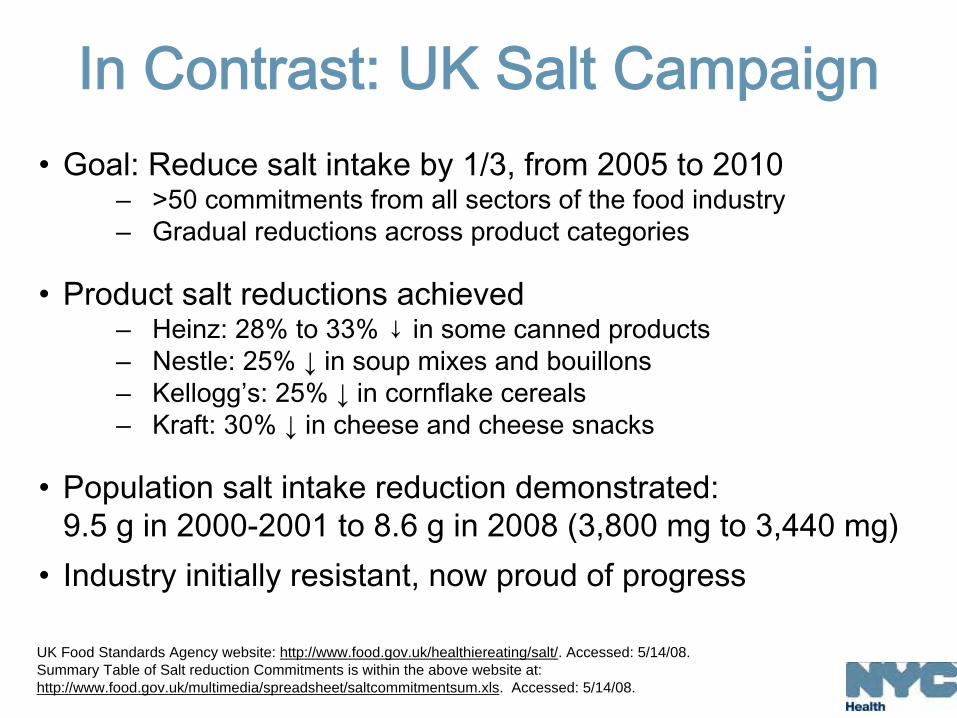
In Contrast: UK Salt Campaign•
Goal: Reduce salt intake by 1/3, from 2005 to 2010
–
>50 commitments from all sectors of the food industry –
Gradual reductions across product categories
•
Product salt reductions achieved–
Heinz: 28% to 33% ↓
in some canned products–
Nestle: 25% ↓
in soup mixes and bouillons–
Kellogg’s: 25% ↓
in cornflake cereals–
Kraft: 30% ↓
in cheese and cheese snacks
•
Population salt intake reduction demonstrated: 9.5 g in 2000-2001 to 8.6 g in 2008 (3,800 mg to 3,440 mg)
•
Industry initially resistant, now proud of progress
UK Food Standards Agency website: http://www.food.gov.uk/healthiereating/salt/. Accessed: 5/14/08. Summary Table of Salt reduction Commitments is within the above website at: http://www.food.gov.uk/multimedia/spreadsheet/saltcommitmentsum.xls.
Accessed: 5/14/08.

32
Salt Reduction Is Imperative: Strategic Opportunity
•
Reducing population salt intake will decrease blood pressure and the risk for heart attack, stroke and death.
•
Lowering food sodium content is key to meaningful reductions in population sodium intake.
•
There is a benefit when many companies in the marketplace reduce salt at the same time.
•
UK has demonstrated a successful model for collaboration.

33
•
Covers all foods purchased and served inschools, daycares, correctional facilitiespublic hospitals, senior centers and others
•
Requirements:–
Sodium, fat, saturated fat, fiber and calorielimits for daily/meal intake
–
Sodium limits by food category–
No artificial trans fat
Aligning City Government Action Nutrition Standards for all NYC Agencies:
Over 225 Million Meals and Snacks served/year

34
In Conclusion
35
Key Components: Local Health Department Strategies to
Prevent and Control Hypertension •
Locally relevant data
•
Interventions–
Evidence-based, scalable
–
Multi-level, multi-factorial design–
Sustainable over time
•
Change the default, support with policy •
Work within/through existing systems •
Measurable outcomes
•
Funding and infrastructure •
Priority alignment at all levels, across institutions
36
Local Health Departments: Unique Position to Influence Change
•
Local Health Department Characteristics–
Stable, known to the community–
Responsibility for all ages, all communities–
Capacity to work at multiple levels simultaneously assuring consistency of messaging
–
Potential collaborators are diverse and shared
•
Key partners in the development, testing innovative models for environmental, food and health systems change;
•
Key partners in the dissemination of effective models which can radically reduce population risk for hypertension disease and increase the likelihood of control.

37
Sonia Angell, MD, MPHDirector, CVD Prevention and Control ProgramNew York City Department of Health and Mental Hygiene
Preventing and Controlling Hypertension:
A City Health Department Perspective