pressure gain combustion advantage in land-based electric
TRANSCRIPT

JOURNAL OF THE GLOBAL POWER AND PROPULSION SOCIETYjournal.gpps.global/jgpps
Pressure gain combustion advantage in land-basedelectric power generation
Original article
Article history:Accepted: 13 January 2017Published: 8 December 2017This paper is the updated version of a paper originally presented at the 1st Global Power and Propulsion Forum, GPPF 2017, in Zurich, Jan 16-18 2017
*Correspondence:SCG: [email protected]
Peer review:Single blind
Copyright:© 2017 Gülen. c This is an open access
article distributed under the Creative
Commons Attribution License (CC‑BY 4.0),
which permits unrestricted use, distribution,
and reproduction in any medium, provided
the original work is properly cited and its
authors credited.
Keywords:pressure gain combustion; gas turbine;
combined cycle; electric power generation
Citation:Gülen S. C. (2017). Pressure gain
combustion advantage in land-based
electric power generation. Journal of the
Global Power and Propulsion Society.
1: 288–302.
https://doi.org/10.22261/JGPPS.K4MD26
Seyfettin C. Gülen1,*
1Bechtel Infrastructure & Power Inc., 12011 Sunset Hills Road, 20190
Reston, USA
Abstract
This article evaluates the improvement in gas turbine combinedcycle power plant efficiency and output via pressure gaincombustion (PGC). Ideal and real cycle calculations are providedfor a rigorous assessment of PGC variants (e.g., detonation anddeflagration) in a realistic power plant framework with advancedheavy-duty industrial gas turbines. It is shown that PGC is thesingle-most potent knob available to the designers for a quan-tum leap in combined cycle performance.
Introduction
Gas turbine combined cycle (GTCC) power plant is the mostefficient and least-polluting fossil fuel-based electric powergeneration technology. Largely driven by turbine inlet tem-perature (TIT) and pressure ratio, the Brayton cycle based“J class” heavy-duty industrial gas turbines with more than40% net thermal efficiency have been the foundation ofcombined cycle power plants with field-proven 60+% netthermal efficiency. Nevertheless, published ratings and fieldperformances show that the 30+ years old steady gain inperformance is rapidly approaching a plateau (Gülen, 2016b,2017). Present state-of-the-art is 1,600°C TIT with cyclepressure ratio of ~23. The enabling technologies are advancedhot gas path (HGP) materials (superalloys), thermal barriercoatings (TBC), film cooling techniques and 3D-aero designsoftware. The next class of machines (say, “K class” for thepurpose of discussion) are targeting 1,700°C TIT, which isputting a big onus on Dry-Low-NOx (DLN) combustortechnology, superalloy capabilities and HGP parts manu-facturability for commensurate film cooling effectiveness.Additive manufacturing (commonly known as “3D Printing”)and ceramic matrix composite (CMC) materials are twopromising technologies to facilitate successful deployment ofthe K class in the next decade or so.
An alternative to the “brute force” approach of ever-increasinghot gas temperatures is fixing the fundamental deficiency ofthe Brayton cycle, namely, reduction of the cycle heat additionirreversibility. (The other big Brayton cycle deficiency, cycle
J. Glob. Power Propuls. Soc. | 2017, 1: 288–302 | https://doi.org/10.22261/JGPPS.K4MD26 288

heat rejection irreversibility, is taken care of very successfully by the steam Rankine “bottoming cycle.”)There are two textbook methods to achieve this end: (i) multiple heat addition steps in series and (ii)constant volume heat addition. The former is deployed in commercially available units (i.e., GT 24/26gas turbines with “sequential” or reheat combustion). The latter, which is the subject of this article, hasbeen on the draft-board for more than half century for aircraft propulsion, i.e., pulsed detonationcombustion, PDC (Kailasanath, 2000). The generic name for the practical devices approximatingconstant volume heat addition is “pressure gain combustor.” The closest practical implementation ofthe process is the explosive combustion inside the cylinder of a reciprocating internal combustionengine (ICE).
The tremendous performance improvement potential of PGC within the context of land-based gasturbines for electric power generation is investigated herein. Fundamental considerations and detailedheat and mass balances show that 65+% net thermal efficiency is readily achievable with TITs wellbelow that of today’s J class units. (The reader is advised to read the Nomenclature section on page 6before continuing to the main body of the article.)
Thermodynamics
The easiest way to demonstrate the performance difference between constant pressure and constantvolume is using an air-standard cycle approach in combination with “mean-effective temperature”analysis. The Brayton cycle (constant pressure heat addition [CPHA]) with standard state-pointnumbering is shown in Figure 1.
All four processes in this cycle, including heat addition, which is represented by the differential form ofthe first law, are steady-state, steady-flow (SSSF) — as appropriate for a turbomachine. This is why theBrayton cycle is an ideal “proxy” for a gas turbine.
The Atkinson cycle has a constant-volume heat addition step, which is a special case of the moregeneral uniform-state, uniform-flow (USUF) process as shown in Figure 2. The Atkinson cycle can beconsidered as a proxy for Holzwarth’s “explosion turbine” (Stodola, 1927). This cycle, under the name“Humphrey,” has been used as an ideal proxy for PDC-based pulsed detonation engines (PDE)(Heiser and Pratt, 2002).
Figure 1. Brayton cycle (heat addition, dP = 0); cycle heat input is represented by the second Tds
equation.
Gülen | PGC in electric power https://journal.gpps.global/a/K4MD26/
J. Glob. Power Propuls. Soc. | 2017, 1: 288–302 | https://doi.org/10.22261/JGPPS.K4MD26 289
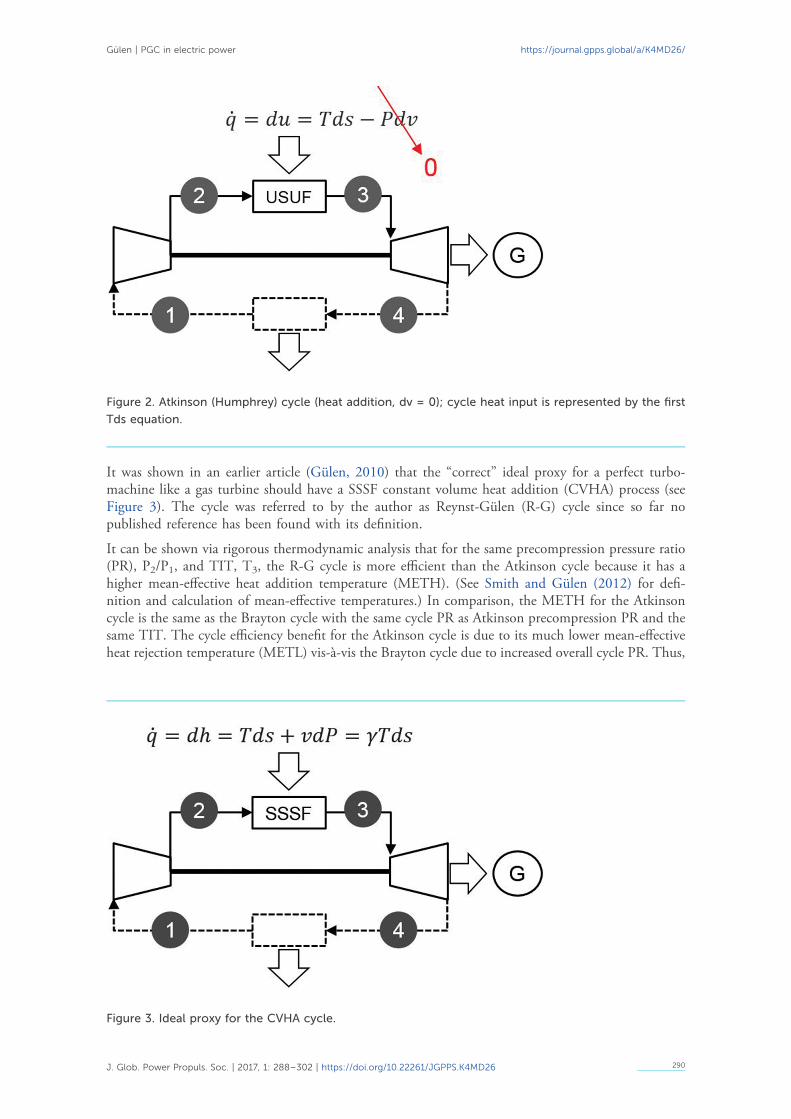
It was shown in an earlier article (Gülen, 2010) that the “correct” ideal proxy for a perfect turbo-machine like a gas turbine should have a SSSF constant volume heat addition (CVHA) process (seeFigure 3). The cycle was referred to by the author as Reynst-Gülen (R-G) cycle since so far nopublished reference has been found with its definition.
It can be shown via rigorous thermodynamic analysis that for the same precompression pressure ratio(PR), P2/P1, and TIT, T3, the R-G cycle is more efficient than the Atkinson cycle because it has ahigher mean-effective heat addition temperature (METH). (See Smith and Gülen (2012) for defi-nition and calculation of mean-effective temperatures.) In comparison, the METH for the Atkinsoncycle is the same as the Brayton cycle with the same cycle PR as Atkinson precompression PR and thesame TIT. The cycle efficiency benefit for the Atkinson cycle is due to its much lower mean-effectiveheat rejection temperature (METL) vis-à-vis the Brayton cycle due to increased overall cycle PR. Thus,
Figure 2. Atkinson (Humphrey) cycle (heat addition, dv = 0); cycle heat input is represented by the first
Tds equation.
Figure 3. Ideal proxy for the CVHA cycle.
Gülen | PGC in electric power https://journal.gpps.global/a/K4MD26/
J. Glob. Power Propuls. Soc. | 2017, 1: 288–302 | https://doi.org/10.22261/JGPPS.K4MD26 290

for a combined cycle where the ideal METL is the same as the ambient temperature, Atkinson(Humphrey) cycle has no benefit over the comparable Brayton cycle.
For numerical comparison, a Brayton cycle with TIT of 2,372°F (1,300°C) and PR of 13 is selected.This is representative of an E class gas turbine, whose average simple and combine cycle ratings, 35.5%and 53.2%, respectively, are obtained from a trade publication (Gas Turbine World, 2016). TheAtkinson cycle is calculated for two different cases: (i) same TIT and (i) same cycle heat addition (atprecompression PR of 13). The R-G cycle is also calculated for two cases: (i) same TIT as the E classand (ii) TIT of 2,700°F (1,482°C, about the same as advanced F class) and precompression PR of 10.The results are shown in Table 1.
The translation from the ideal proxy performance (subscript “id”) to the rating performance (subscript“rat”) is done via the “Carnot Factor” (CF). Note that the air-standard cycle efficiency calculated as
Table 1. Ideal, air-standard cycle calculations (R = 0.068 Btu/lb-R, cp = 0.24 Btu/lb-R, γ = 1.4).
Brayton Atkinson/Humphrey CVHA-SSSF
PRprecomp 13.0 13.0 13.0 13.0 10.0
PRCVHA NA 2.6 3.3 2.6 3.2
PRCycle 13.0 34.1 42.5 34.1 31.5
TIT, °C 1,300 1,300 1,690 1,300 1,482
METHGT, °C 736 736 877 1,140 1,188
METLGT, °C 212 142 180 142 174
wcomp, kJ/kg 313 313 313 313 269
wturb, kJ/kg 820 1,003 1,295 1,003 1,105
wnet, kJ/kg 507 411 592 690 835
qin, kJ/kg 977 698 977 977 1,203
qin,mech, kJ/kg 20% 18%
qout, kJ/kg 469 287 385 287 368
Ideal efficiency 52.0% 58.9% 60.6% 70.7% 69.4%
Rating efficiency 35.5% 40.1% 41.2% 48.1% 47.2%
CF 0.680 0.680 0.680 0.680 0.680
METLCC, °C 15 15 15 15 15
Ideal efficiency 71.5% 71.5% 74.9% 79.6% 80.3%
Rating efficiency 53.2% 53.2% 60.7% 64.5% 65.0%
CF 0.75 0.75 0.81 0.81 0.81
Note that ideal, air-standard Brayton cycle efficiency is a function of cycle PR only; however, TIT influences the combined cycle efficiency.
Gülen | PGC in electric power https://journal.gpps.global/a/K4MD26/
J. Glob. Power Propuls. Soc. | 2017, 1: 288–302 | https://doi.org/10.22261/JGPPS.K4MD26 291

η = −1 METLMETHid (1)
is the efficiency of the “Carnot-equivalent” cycle with isentropic compression/expansion and iso-thermal heat transfer at METL and at METH. The proximity of the actual (rating) efficiency tothe ideal, expressed as a fraction, i.e., CF, is a very good measure of the technology state-of-the-art. For state-of-the-art F, G, H and J class gas turbines, using an ideal cycle basis (but not air-standard), 0.75 and 0.81 are very reliable average CF values for simple and combined cycle,respectively (Gülen, 2013b). On an air-standard cycle basis, 0.68 is a good CF value for simplecycle whereas 0.75–0.82 is a good range for TIT of 1,300–1,600°C on ideal (but not air-standard)basis.
The advantage of CVHA over CPHA, six percentage points in terms of CC efficiency from Table 1, isbest illustrated by a comparison of the respective cycles on the temperature-entropy (T-s) plane (seeFigure 4). For the same TIT as the base Brayton (CPHA) cycle, the R-G cycle has about 730°F (~400°C) higher METH with 2.6 times the cycle PR. About 20% of the cycle heat input is converted intomechanical energy by increasing the pressure of the cycle working fluid. The resultant reduction incycle heat addition reversibility is quantified by the comparison of the two shaded rectangles on the T-sdiagram.
Reynst envisioned a hybrid or turbo-compound cycle where the combustor of the gas turbine isreplaced by a two-stroke reciprocating engine, based on the three-process Lenoir cycle (missing theisentropic compression process), whose shaft drove a compressor. Reynst calculated the efficiency ofthat ideal constant volume combustion (CVC) cycle as a function of its precompression pressure ratio,PR′, and T1 as follows (Equation 12 on page 151 of Reynst, 1961):
η= −θ⋅⎡
⎣
⎢⎢⎢
⎛
⎝⎜
θ
′+
⎞
⎠⎟ −
⎤
⎦
⎥⎥⎥
γ1 1
PR1 1k
1
(2)
θ = =−
q
c TT T
Tin
v 1
3 2
1(3)
where k = 1−1/γ and γ is the specific heat ratio, cp/cv. In fact, Atkinson and Reynst’s ideal CVC cycleare identical for the same non-dimensional heat input parameter, θ. Furthermore, Atkinson and R-Gcycle efficiencies as a function of PR′ and cycle heat addition are also given by the same equation withcp in the denominator of Equation (3) for the R-G cycle (Reynst, 1961).
Figure 4. Comparison of E class Brayton cycle with CPHA and the R-G cycle.
Gülen | PGC in electric power https://journal.gpps.global/a/K4MD26/
J. Glob. Power Propuls. Soc. | 2017, 1: 288–302 | https://doi.org/10.22261/JGPPS.K4MD26 292

Note that the R-G cycle is a theoretical construction with no information regarding its practicalimplementation. Conceptually, the SSSF, CVHA process between state points 2 and 3 in Figure 3 canbe envisioned as an (imaginary) “topping” Brayton cycle gas turbine with CPHA, in which theimaginary turbine drives the imaginary compressor with no net output.
Similarly, the Atkinson/Humphrey cycle is also a theoretical construction, where the USUF, CVHAprocess between state points 2 and 3 in Figure 2 can be envisioned as an (imaginary) “topping”reciprocating (piston-cylinder) ICE. This imaginary ICE works against the back pressure P3 and thusthe expansion stroke produces no output whereas the compression stroke work, v2·(P3−P2) must bedebited against the net output of the main engine. This is why, for the same precompression PR andTIT (or θ), the Atkinson cycle severely under-predicts the performance potential of CVHA and alsowhy the R-G is theoretically correct proxy for a gas turbine with PGC.
As shown in Table 1, with E class TIT and precompression PR, the ideal proxy for a PGC cyclepredicts a realistic CC efficiency of 62%. Presently, the next goal post for GTCC performance is set at65% net thermal efficiency. Earlier studies indicate that this requires nearly 45% GT efficiency with aTIT of 1,700°C (3,092°F, commensurate cycle PR is around 25) (Gülen, 2013b). However, as the lastcolumn in Table 1 shows, this efficiency can be reached with a PGC gas turbine fired at only 2,700°F(less than 1,500°C). Next, the possibility of this performance prediction is going to be investigatedusing a “real cycle” analysis.
PGC in practice
Theoretical benefit of constant-volume combustion with simultaneous temperature and pressure risefrom an ideal cycle perspective is impressive and unassailable. There are several methods to implementa less-than-ideal but still attractive combustion process with pressure gain. The most obvious andalready available method is to use a reciprocating ICE as the combustor (e.g., a “turbocompound”engine á la Napier’s Nomad aircraft engine or Scania truck engines Gülen, 2013a). A recentlyproposed turbocompound reheat gas turbine cycle for small CC applications (about 100 MWe)utilizes this concept (Gülen, 2016a). Unfortunately, for utility-scale large gas turbines, limited massflow capacity of even the largest ICEs makes this an infeasible prospect.
The only possibility for an adiabatic and steady flow process with pressure rise is a supersonic flow witha standing shock wave (idealized as a discontinuity in the flow field.) Similarly, the only possibility fora steady flow process with pressure rise and heat addition is a supersonic flow with a standingdetonation wave. It is not possible to design a combustor with steady supersonic flow (Mach numberof about 3 to 4) and a standing detonation wave in a land-based power generation turbine. The onlypossibility is to create detonation waves at a high frequency (say tens of times per second) inside asemi-closed channel (tube) utilizing a suitable ignition system. The inherent unsteadiness of thepractical detonation combustion led to the concept of intermittent or PDC, which has been seriouslyinvestigated for aircraft propulsion systems for more than half a century (Kailasanath, 2000).
Mechanical problems associated with the PDC (structural integrity of turbine blades, vibration,acoustics, high stress and fatigue) has been a big impediment in development of aircraft enginesutilizing the technology. Rotating or continuous detonation combustion (RDC) concept is a variant,which has the potential of overcoming most of those problems (Lu et al., 2011). Either PDC or RDCis readily applicable to land-based gas turbines for power generation.
Dynamic pressure exchangers or “wave rotors” have also been investigated for pressure gain in com-bustion. A wave rotor (WR) is a rotating, cellular drum between inlet outlet manifolds (Nalim, 1999).The flows inside the manifolds are steady, which is a significant advantage over the PDC with stronglyunsteady, pulsating flow. Pressure gain is generated inside the rotor cells via shock waves generated bystoppage of the outlet flow and compression of the inlet (charge) flow via rotation between themanifolds. While the concept sounds too esoteric at first glance, it should be noted that the Comprexsupercharger developed by Brown Boveri Co. to be used in diesel engines was essentially a WR.
Gülen | PGC in electric power https://journal.gpps.global/a/K4MD26/
J. Glob. Power Propuls. Soc. | 2017, 1: 288–302 | https://doi.org/10.22261/JGPPS.K4MD26 293

Valveless (also called aero-valved) pulse combustor is another method, which generates only a modestpressure gain. It is a variant of the valved pulse combustor used in German V-1 “Buzz Bomb” inWWII (Gülen, 2013a). The mechanical “flapper” valve is replaced by an inlet pipe, which acts as anacoustically modulated aerodynamic valve (i.e., no moving parts).
From a land-based, electric generation perspective the key engineering design criterion is the rela-tionship between pressure and temperature ratios, PR and TR, respectively, in the PGC and therequisite fuel-air ratio (FAR). From that perspective, PDC offers the largest efficiency gain potentialbut is beset by many design challenges, primarily the problem of integration between the unsteadyoutlet gas flow and the steady turbine flow. For large heavy-duty industrial GTs (HDGT), relevantTR range is 2.0–2.5. Pressure rise potential of PDC and WR (using the “perfect” CVC relationshipNalim, 1999) are shown in Figure 5. (Pulse combustion PR is too low to be of much significance,i.e., less than 1.10.) The PDC PR-TR relationship is derived from detailed detonation calculations asdescribed in the Appendix. The result is in good agreement with formulas developed by differentresearchers (Tangirala et al., 2007).
“Real cycle” analysis
Present state-of-the-art in land-based, heavy-duty industrial gas turbine technology is the “J class” with1,600°C TIT and PR of 23. Largest J class HDGTs are 50 Hz machines rated at nearly 500 MWegenerator output and more than 42% thermal efficiency (Gas Turbine World, 2016). Smaller 60 Hzmachines are rated at about 350 MWe with similar efficiency. On a combined cycle basis, J classHDGTs have more than 61% thermal efficiency rating. As the basis of the real cycle analysis, a 60 Hz Jclass HDGT with 700 kg/s (nominal) airflow, PR of 23 and TIT of ~1,600°C is assumed. Thermoflow’sInc.’s Thermoflex (2016) software is used to model the gas turbine with appropriate chargeable andnonchargeable cooling flows (see Figure 6).
The bottoming cycle, comprising the heat recovery steam generator (HRSG), the steam turbinegenerator (STG) and the heat rejection system (once-through, open-loop water-cooled condenser with40 mbar steam pressure), is modelled in Thermoflow’s Inc.’s GT PRO (2016) software. A 2,400 psig(165 barg), 1,112°F (600°C) steam cycle is chosen with state-of-the-art STG technology and suitableexhaust annulus area. The combined cycle net performance is 505.3 MWe and 61.7% thermalefficiency with 174 MWe STG and 8.2 MWe plant auxiliary load (1.6% of the gross output). Gasturbine performance fuel heating to 410°F (210°C) with IP economizer feed water is used.
Figure 5. Pressure-temperature ratios for PDC and “perfect” CVC.
Gülen | PGC in electric power https://journal.gpps.global/a/K4MD26/
J. Glob. Power Propuls. Soc. | 2017, 1: 288–302 | https://doi.org/10.22261/JGPPS.K4MD26 294

The base HDGT in Figure 6 is modified by replacing the combustor with a PGC and adding a boostercompressor (BC) as shown in Figure 7. The BC ensures that chargeable and nonchargeable coolingflows for the turbine stage 1 are delivered from the compressor discharge, which is now at a lowerpressure. This is so because part of the compression duty is taken over by the quasi CVC in the PGC.(Note that the specific volume ratio across a PGC is less than unity; e.g., about 0.6 for a pulsedetonation combustor.) Thus, hot gas pressure at turbine stage 1 is in fact higher than that at thecompressor exit.
PDC is assumed to be the particular PGC process. The PDC is modelled in Thermoflex as adummy compressor-combustor combination controlled by a script (to implement temperature andpressure rise via Equation (A-1) in the Appendix along with the fuel consumption via a heatbalance). A pressure-temperature changer accounts for pressure and purge-air-dilution loss (5% and~100°C, respectively) between the PDC and the turbine inlet (see Figure 8). The unfavourableimpact of the pulsating gas flow, somewhat “smoothed out” in the transition piece between the
Figure 7. Gas turbine with pressure gain combustor.
Figure 6. J class gas turbine model and performance.
Gülen | PGC in electric power https://journal.gpps.global/a/K4MD26/
J. Glob. Power Propuls. Soc. | 2017, 1: 288–302 | https://doi.org/10.22261/JGPPS.K4MD26 295

PDC and stage 1 nozzle, is quantified by a two percentage point debit to the stage 1 isentropicefficiency.
The PDC cycle performance is calculated for different TIT and precompression PR combinations.Fuel compression is not included (i.e., pipeline pressure is assumed to be high enough). However,0.5% transformer loss is accounted for. Booster compressor load is debited to the plant auxiliary load.Selected results are listed in Table 2.
Rigorous heat and mass balance calculations summarized by the performance numbers in Table 2 fullyconfirm the ideal R-G cycle predictions in Table 1. The results also unequivocally demonstrate that, aspredicted by fundamental thermodynamic considerations, the Atkinson/Humphrey cycle is not thecorrect ideal proxy for gas turbines with PGC. It significantly underestimates the performanceimprovement potential of PGC in a combined cycle configuration.
With TIT and cycle PR comparable to those representative of today’s F class technology (~1,500°C),detonation combustion gas turbine is capable of almost 64% net CC efficiency. The 65% goal post isfeasible with state-of-the-art J class TIT. Furthermore, as represented by the ratio of STG and GTGoutputs, the performance increase is largely due to “topping” cycle (i.e., the gas turbine) improvement.Considering that each kilowatt from the bottoming cycle is nearly six to seven times as expensive as akilowatt from the topping cycle, PGC is a truly cost-effective method of achieving significant CCefficiency improvement.
Using the budgetary price numbers from Gas Turbine World (2016), i.e., $225/kW for GTG and$1,500/kW for the bottoming cycle (using STG output), the base J class GTCC of Table 2 costs about$340 million or ~$670/kW. However, with the same $/kW prices, the PGC variants cost around$600/kW. Consequently, in order to be on an equal footing with the base GTCC on a $/kW basis, theprice of the gas turbine with PGC can be raised to ~300/kW.
PDC has been investigated for more than a half century with an eye on aircraft propulsion applica-tions. So far, significant engineering design challenges such as noise, vibration, fatigue, durability, etc.prevented its successful commercialization (Lu et al., 2011; Roy et al., 2004). The absence of weightand volume limitations (up to a point) in a land-based power generation application, renders asatisfactory resolution of some of the most pressing problems possible (e.g., sturdy design of combustorcomponents, space for deflagration-to-detonation [DDT] transition). Whether the theoretical per-formance potential calculated herein via Chapman-Jouget theory will survive a realistic design withmyriad imperfections (e.g., imperfect mixing of fuel and air, unsteady initial conditions, pressure-temperature and composition variation downstream of the detonation wave, etc.) remains an openquestion.
Figure 8. Implementation of the PDC in the Thermoflex model.
Gülen | PGC in electric power https://journal.gpps.global/a/K4MD26/
J. Glob. Power Propuls. Soc. | 2017, 1: 288–302 | https://doi.org/10.22261/JGPPS.K4MD26 296

Nevertheless, even with a more modest approachusing a dynamic pressure exchange (wave rotor)PGC with the “perfect” CVC model for TR-PRprediction, significant CC performance potentialis present (see Figure 9). In this case, 64+% CCefficiency is achievable with a TIT of 2,900°F(~1,600°C), same as today’s state-of-the-art J classgas turbine.
As an indirect substantiation of the performanceprediction in Figure 9, consider a small powerstation concept disclosed in a recent patent(Gülen, 2016c), which approaches the imple-mentation of CVHA in an actual power gen-eration system more modestly. The turbo-compound reheat GT combined cycle is a hybridpower station comprising two different types of
Table 2. Gas turbine with PDC — Rigorous heat and mass balance model results (TIP: Turbine Inlet
Pressure).
Base Pressure gain combustion
GTG output, kWe 339,531 438,104 418,721 398,958 405,541
Heat input, kWth 819,518 892,497 857,284 821,360 848,679
GTG efficiency 41.43% 49.09% 48.84% 48.57% 47.78%
Texh, °C 629 612 593 573 595
mexh, kg/s 700 702 701 700 701
Precompression PR NA 13.6 13.6 13.6 11.9
P2, bara 24.8 13.8 13.8 13.8 12.1
T2, °C 490 371 371 371 346
PDC PR NA 1.854 1.810 1.765 1.821
Cycle PR 23.1 25.2 24.6 24.0 21.7
TIP, bara 23.4 25.6 24.9 24.3 22.0
TIT, °C 1,593 1,593 1,538 1,482 1,482
STG output, kWe 173,722 166,265 156,082 145,705 157,194
CC gross output, kWe 513,253 604,369 574,803 544,663 562,735
Plant auxiliary load, kWe 7,912 24,672 23,001 21,330 19,662
CC net output, kWe 505,341 579,697 551,802 523,332 543,072
CC net efficiency 61.7% 65.0% 64.4% 63.7% 64.0%
Figure 9. Combined cycle efficiency with PGC gas
turbines.
Gülen | PGC in electric power https://journal.gpps.global/a/K4MD26/
J. Glob. Power Propuls. Soc. | 2017, 1: 288–302 | https://doi.org/10.22261/JGPPS.K4MD26 297

prime movers: a recip-engine genset and a gas turbine. The system is shown schematically in Figure 10.In a “proof of concept” 5 × 1 configuration (i.e., five gas engines and one gas turbine) with modifiedoff-the-shelf equipment and two-pressure, non-reheat bottoming cycle it is rated nominally as a115 MW and 57.5% net (ISO base load) small power station with E class TIT (Gülen and Boulden,2015). The piston-cylinder of the recip-engine genset serves as a constant-volume combustor (with ahigh exhaust pressure and reduced shaft output). The efficiency is enhanced by a second combustion(reheat) with a net gain of nearly 4.5 percentage points in combined cycle efficiency with a modesttwo-pressure bottoming cycle.
Conclusions
Application of PGC to a land-based gas turbine for electric power generation holds promise towards65% net combined cycle efficiency at J class TITs. Numerical evaluation of combined cycle efficiencyimprovement via two different methods, i.e., ideal air-standard cycle analysis and rigorous, fullyphysics-based heat-and-mass balance models, lead to consistent results. Even at F class level of firing(about 100°C lower TIT) 63.5% net CC efficiency is possible (which is 1.5 percentage points betterthan the J class GTCC efficiency). Heavy-duty industrial gas turbines provide the design engineerswith a sturdier and larger framework to work in to overcome the usual challenges associated with thedeployment of PGC in aircraft engines. Reduced bottoming cycle contribution should shift the plantcost towards the topping cycle, which is much cheaper on a per kilowatt basis. Since new technologiesunder development such as additive manufacturing and CMC materials are equally applicable to gasturbines with PGC, efficiencies well beyond 65% are conceivable in a not-too-distant future.
Nomenclature
The primary unit system used by the author in calculations described herein is the US customarysystem. Data in tables and figures are converted to SI; however, temperatures in the text are usuallyexpressed in both systems.
Figure 10. Turbocompound reheat GT combined cycle. IC: Intercooler, AC: Aftercooler, CMB: Gas turbine
combustor, TRB: Gas turbine (no compressor).
Gülen | PGC in electric power https://journal.gpps.global/a/K4MD26/
J. Glob. Power Propuls. Soc. | 2017, 1: 288–302 | https://doi.org/10.22261/JGPPS.K4MD26 298
Acronyms are defined where they first appear in the text (some of them also appear in the equations,e.g., PR).
Standard notation is used for fluid properties, i.e., P, T, v, h, u, s, cp, and cv, for pressure, temperature,specific volume, enthalpy, internal energy, entropy and specific heat at constant pressure/volume,respectively.
Cycle state-points are numbered per Figures 1–3 (1 through 4).
Subscripts in, out, air, fuel and mix are self-explanatory. Subscripts exh, id, rat, comp and turb denoteexhaust, ideal, rating, compressor and turbine, respectively.
k = Isentropic exponent (i.e., 1−1/γ)q̇ = Rate of heat transfer, kJ/kg (Btu/lb)
γ = Specific heat ratio
η = Efficiency
θ = Nondimensional heat transfer
τ = Nondimensional temperature, T/T0, where T0 is 59°F (15°C)
Funding sources
None.
Competing interests
S. C. Gülen declares that he has no conflict of interest.
References
Gas Turbine World (2016). Gas Turbine World 2016 Performance Specs, 32nd Edition. Fairfield, CT: Pequot Publishing,46 (1).
Goldmeer J., Tangirala V., and Dean A. (2008). System-level performance estimation of a pulse detonation based hybridengine. Journal of Engineering for Gas Turbines and Power. 130 (1): 011201-1-8. https://doi.org/10.1115/1.2771246.
GT PRO (2016). GT PRO Version 25.0, 2016. Southborough, MA, USA: Thermoflow, Inc.
Gülen S. C. (2010). Gas turbine with constant volume heat addition. ASME 2010 10th Biennial Conference on EngineeringSystems Design and Analysis, Istanbul, Turkey, 12–14 July 2010, International. 235–247. https://doi.org/10.1115/ESDA2010-24817.
Gülen S. C. (2013a). Constant volume combustion: The ultimate gas turbine cycle. Gas Turbine World. 43 (6): 20–27.
Gülen S. C. (2013b). Modern gas turbine combined cycle. Turbomachinery International. 54 (6): 31–35.
Gülen S. C. (2016b). Étude on gas turbine combined cycle power plant – Next 20 years. Journal of Engineering for GasTurbines and Power. 138 (5): 051701.
Gülen S. C. (2016a). Beyond Brayton cycle: It is time to change the paradigm. ASME Turbo Expo 2016: TurbomachineryTechnical Conference and Exposition, Seoul, South Korea, 13–17 June 2016, International Gas Turbine Institute.V003T08A015. https://doi.org/10.1115/GT2016-57979.
Gülen S. C. (2016c). Turbo-compound reheat combined cycle power generation US Patent 9,249,723 B2. 2 February 2016.
Gülen S. C. (2017). Pressure gain combustion advantage in land-based electric power generation. Proceedings of the 1stGlobal Power and Propulsion Forum, Zurich, Switzerland, 16–18 January 2017.
Gülen S. C. and Boulden M. S. (2015). Turbocompound Reheat Gas Turbine Combined Cycle. Power-Gen International2015, December 8–10, 2015, Las Vegas, NV, USA.
Heiser W. H. and Pratt D. T. (2002). Thermodynamic cycle analysis of pulse detonation engines. Journal of Propulsion andPower. 18 (1): 68–76. https://doi.org/10.2514/2.5899.
Kailasanath K. (2000). Review of propulsion applications of detonation waves. AIAA Journal. 38 (9): 1698–1708. https://doi.org/10.2514/2.1156.
Gülen | PGC in electric power https://journal.gpps.global/a/K4MD26/
J. Glob. Power Propuls. Soc. | 2017, 1: 288–302 | https://doi.org/10.22261/JGPPS.K4MD26 299
Landau L. D. and Lifshitz E. M. (1987). Fluid Mechanics, 2nd Edition. Oxford, UK: Pergamon Press.
Liepmann H. W. and Roshko A. (1957). Elements of Gasdynamics. New York, NY USA: John Wiley & Sons.
Lu F. K., Braun E. M., Massa L., and Wilson D. R. (2011). Rotating detonation wave propulsion: Experimental challenges,modeling and engine concepts. AIAA 2011–8043, 47th Joint Propulsion Conference & Exhibit, San Diego, CA.
Nalim M. R. (1999). Assessment of combustion modes for internal combustion wave rotors. Journal of Engineering for GasTurbines and Power. 121 (2): 265–271. https://doi.org/10.1115/1.2817116.
Reynst F. H. (1961). Pulsating Combustion – The Collected Works of F. H. Reynst, edited by Thring M. W. Oxford:Pergamon Press.
Roy G. D., Frolov S. M., Borisov A. A., and Netzer D. W. (2004). Pulse detonation propulsion: challenges, current status,and future perspective. Progress in Energy and Combustion Science. 30 (6): 545–672. https://doi.org/10.1016/j.pecs.2004.05.001.
Smith R. W. and Gülen S. C. (2012). Natural gas power. In: Encyclopedia of Sustainability Science and Technology, editedby Meyers R. A. New York: Springer.
Stodola A. (1927). Steam & Gas Turbines, Authorized Translation from the 6th German Edition by L. C. Löwenstein. NewYork: McGraw-Hill Book Company Inc. 2: 1237.
Stull D. R. and Prophet H. (1971). JANAF Thermodynamic Tables, 2nd Ed. NSRDS-NBS 37, National Bureau ofStandards.
Tangirala V. E., Rasheed A., and Dean A. J. (2007). Performance of a pulse detonation combustor-based hybrid engine.ASME Turbo Expo 2007: Power for Land, Sea, and Air, Montreal, Canada, 14–17 May 2007, International Gas TurbineInstitute. 403–414. https://doi.org/10.1115/GT2007-28056.
Thermoflex (2016). Thermoflex Version 25.0, 2016. Southborough, MA, USA: Thermoflow, Inc.
Thompson P. A. (1988). Compressible Fluid Dynamics (Advanced engineering series). New York, USA: McGraw-Hill, Inc.
Appendix
The detonation problem requires the solution of the jump equations describing the two adiabats,i.e. the leading “frozen” shock with no chemical reaction and the detonation adiabat representing allpossible end states for the combustion process. It can be shown that the only possible solution todetonations in a semi-closed pipe or tube of length L where the detonation is initiated at the closedend (x = 0) and propagates towards the open end (x = L), is a Chapman-Jouget (C-J) detonation(Landau and Lifshitz, 1987). The detonation combustion calculations are based on the five-stagePDC cycle described in Goldmeer et al. (2008). Specifically, compressed air from the GT com-pressor is mixed with fuel. The combustible mixture (i.e. reactants) fills the detonation chamber,which is a semi-closed tube. The detonation starts (the method is not specified) instantaneously atthe closed end of the tube, which is filled with a (premixed) fuel-air mixture. The detonation waveis a C-J wave, which is the only possible solution (e.g. see Landau and Lifshitz, 1987). The C-Jshock wave, idealized as a pressure and temperature discontinuity, propagates towards the open endof the tube. Downstream of the C-J wave, the fluid comprises the complete combustion products. Ararefaction wave follows the C-J wave and satisfies the boundary condition of zero velocity at theclosed end of the tube, x = 0. The pressure of the combustion products drops across the rarefactionwave and the C-J wave exits from the open end of the tube, at x = L, where L is the length of thetube. An expansion (rarefaction) wave starts at the open end and moves to the closed end of thetube. A further drop in the pressure takes place across the expansion wave. The burned combustionproducts evacuate the tube, which is now ready for the next cycle to start with purging and thenfilling with fresh fuel-air mixture. The entire cycle is repeated and results in a “periodic high-pressure zone near the closed end of the tube (Kailasanath, 2000).” In a GT, the fresh air for thedetonation process and the purge air are supplied from the discharge of the compressor and thecombustion products exiting the tube expand through the turbine section to generate useful shaftwork.
The following data is known (or assumed):
1. Fuel mass flow rate, temperature and composition (i.e. natural gas as 100% CH4)
Gülen | PGC in electric power https://journal.gpps.global/a/K4MD26/
J. Glob. Power Propuls. Soc. | 2017, 1: 288–302 | https://doi.org/10.22261/JGPPS.K4MD26 300

2. Air composition, pressure, temperature and mass flow rate (same as the base GT case) at the exit ofthe compressor
3. Purge flow rate is assumed to be 20% of the total of air mass flow rate that enters the reaction andthe fuel flow
Pertinent assumptions implicit in the calculations are as follows: The flow in the PDC chamber, whichis a circular tube with constant cross-sectional area, is one-dimensional (1-D), inviscid and adiabatic.Reactants (i.e. fuel and air) and combustion products are ideal gases with properties per JANAF model(Stull and Prophet, 1971). In other words, they are not assumed to be calorically perfect. Valve(s) thatcontrol the cycle processes open and close instantaneously with no losses. Pressure losses in the PDCare ignored. Static pressure and temperature inside the detonation chamber are assumed to be the sameas total values at the compressor exit. The fuel-air mixture at the beginning of the detonation isassumed to be at the static pressure of the compressed air. Total pressure and temperature at the PDCexit are calculated using stagnation formulas for state 4. The state of the working fluid at the turbinestage-1 nozzle inlet is determined by mixing with purge air. Mixing with purge air is assumed not tochange the total pressure.
The calculation sequence is as follows:
1. Calculate composition, total enthalpy and temperature of the unreacted air (from the compressordischarge) and fuel gas mixture (state 1).
2. Calculate the state of the combustion products downstream of the C-J wave following the theoryoutlined in Thompson (1988), state 2. The hydrodynamic solution of the shock problem involvesthree jump conditions (written for a reference frame that is moving with the shock front) and theideal gas equation of state. The solution is iteratively obtained in Excel using the SOLVER add-into determine the four unknowns from the four equations.
3. Use the PR relationship for the centred (isentropic) rarefaction fan (from Equation 3-24b inLiepmann and Roshko, 1957) to calculate the properties of the combustion products downstreamof the rarefaction wave part of the C-J detonation, state 3.
4. Use the isentropic formula and the overall heat and mass balance to calculate the total propertiesof the state downstream of the expansion wave, state 4. The centred expansion wave starting fromthe open end of the tube and propagating towards the closed end carries with it the “information”that the detonation wave has exited the tube with the ensuing drop in pressure. In laboratoryexperiments, this final expansion (or blow-down) empties the detonation tube and the exitingcombustion products end up with the reservoir pressure. Herein, the final pressure at the exit ofthe PDC, labelled as state 4, is determined from the isentropic p-T relationship and the overallPDC heat balance. This method is different from the time-averaged PR for the detonationcombustion, which is the ratio of the time-averaged total pressure at the PDC exit to the time-averaged total pressure at the PDC inlet.
5. Calculate the final state, i.e. state 5, after mixing with the purge air (pressure losses are neglected.)Calculate the final temperature before the entry to the turbine section by mixing the combustionproducts with the purge air and calculating the enthalpy via simple energy balance.
A conceptual representation of the states 1 to 4 is shown in Figure 11, which qualitatively depicts twopressure transducer signals recorded at two different PDC tube locations in experiments. The numbersare representative for a C-J detonation propagating into a fuel (100% CH4)-air mixture (fuel-air-ratioof ~ 0.04) at Ma = 3.72.
Calculations are done for a range of precompression PRs, ranging from 2 to 8, and FARs, ranging from0.009 to 0.035. The results are cast into transfer functions to be used in GT performance calculations.For typical gas turbine cycle calculations, the temperature ratio across the combustor (TR) is a given(i.e., via TIT or T3) and the PDC pressure ratio is given by:
= ⋅ +TRPR 0.5289 0.3751 (A-1)
Gülen | PGC in electric power https://journal.gpps.global/a/K4MD26/
J. Glob. Power Propuls. Soc. | 2017, 1: 288–302 | https://doi.org/10.22261/JGPPS.K4MD26 301

In the equation above, TR is the nondimensional PDC tube exit temperature T/Tmix, which, in thecycle notation of the states, is T3/T2 or, in the detonation wave notation in Figure 11, T5/T1. For thecalculation of the reactants temperature, the following relationship is used:
=⋅ + ⋅ ⋅
+ ⋅T
c T FAR c T
c FAR cmixp,air 2 p,fuel fuel
p,air p,fuel(A-2)
where FAR is the fuel-air-ratio. Fuel mass flow rate is calculated from the heat and mass balance of thePDC control volume in Figure 8. The results can be cast into a transfer function for FAR, i.e.
∝⎛
⎝⎜
−− τ
⎞
⎠⎟FAR 1 TR
TR 175/ 2
1.1106(A-3)
with a proportionality factor of 1.9.
Figure 11. Conceptual C-J detonation states (state 5 is not shown).
Gülen | PGC in electric power https://journal.gpps.global/a/K4MD26/
J. Glob. Power Propuls. Soc. | 2017, 1: 288–302 | https://doi.org/10.22261/JGPPS.K4MD26 302