press release · 1 press release the board of pirelli & c. s.p.a. approves results to 31 march...
TRANSCRIPT

1
PRESS RELEASE
The Board of Pirelli & C. S.p.A. approves results to 31 March 2019
The economic, asset and financial data to March 31, 2019 were formulated applying the IFRS 16 Leases accounting principle, which establishes a new way of accounting with regard to leasing contracts, with significant effects particularly on the representation of Group net financial debt and EBITDA. It should be noted that the comparative 2018 data have not been restated.
***
Results to 31 March 2019
- Revenues at 1,313.8 million euro, +1.2% at the organic level
- High Value Revenues: +7.3% to 895 million euro (+5.3% at the organic level) thanks to strengthening
in all regions. Accounting for 68.1% of sales, up from 63.6% on 31 March 2018
- High Value Volumes: +4.5%, of which +6.7% volumes from Car ‘New Premium’ (≥18 inches).
Volumes growth of 12.1% of New Premium in the Replacement Channel
- Price/mix: +7.7% supported by growing weight of High Value and improvement in product and
channel mix
- Ebit Adjusted before start-up costs at 230.7 million euro (229.4 million in first quarter 2018) with an
Adjusted Ebit margin before start-up costs of 17.6% (17.5% on 31 March 2018)
- Adjusted Ebit at 219.2 million euro (218.4 million on 31 March 2018), with an Adjusted Ebit margin
of 16.7% (unchanged from 31 March 2018)
- Net profit from continuing operations: +9.7% to 101.4 million euro (92.4 million euro on 31 March
2018)
- Net Financial Position, excluding the impact of the IFRS 16 accounting principle, negative 3,913.0
million euro (-4,387.3 million euro including the 474.3 million euro impact of IFRS16), an increase
from 3,180.1 million euro on 31 December 2018 because of the usual seasonality in working capital
but an improvement compared with 3,938.9 million euro on 31 March 2018 which benefitted from
the impact shareholdings and extraordinary operations of 141.8 million euro.
- Net cash flow before extraordinary operations/participations improved, with cash absorption down
by 162.2 million euro compared with 31 March 2018.
***
2019 Forecast
- Revenues in 2019 are expected to grow by between 3% and 4% (previous indication 4% to 6%)
because of the prolonged weakness of demand in Original Equipment
- High Value confirmed at around 67% of revenues, an improvement from 64% in 2018
- Improvement of profitability confirmed: 2019 adjusted Ebit margin foreseen at ≥19% (prior indication
around 19%), compared with 18.4% in 2018.

2
- High Value confirmed at around 85% of Adjusted Ebit before start-up costs compared with 83% in
2018
- Investments in 2019 at around 400 million euro (previous target around 430 million euro) consistent
with the new market scenario
- Ratio between Net Financial Position and Adjusted Ebitda before start-up costs, estimated at
around 2.1x at end 2019 (2.3x including IFRS16 impact)
***
Milan, 14 May 2019 - The Board of Directors of Pirelli & C. S.p.A. met today and reviewed the results for the
three months ended on 31 March 2019, which confirmed the resilience of the business model focused on
High Value and saw growth in all the main economic indicators.
In particular, the first quarter of 2019 was characterized by:
Organic revenue growth of +1.2%, thanks to the strengthening registered in all regions in the High
Value segment, which today represents 68.1% of total revenues (+4.5 percentage points compared
with 63.6% in first quarter 2018). ). High Value volumes posted growth of +4.5%, in a context that
saw a fall in car production and a slowdown of the Premium Moto market. In this context, Pirelli
nevertheless improved its market share in New Premium Car (+6.7% Pirelli sales’ volumes of Car ≥18” compared with market growth of 5.2%) in particular in the Replacement channel (+12.1% Pirelli
volume growth ≥18’’, compared with 10.5% for the market);
Further reduction of exposure to the Standard segment, with a decline in volumes of 16.6% because
of the acceleration of the exit from lower profit and smaller rim size products in the context of a
general softening of the Standard market. The combined effect of the High Value and Standard
trends resulted in a fall in overall volumes of 6.5%;
Improvement of price/mix, at +7.7% because of the growing weight of the high end, the progressive
improvement of the product and channel mix and price increases in emerging markets and North
America to offset exchange rate volatility;
Implementation of efficiency program (16.4 million euro in first quarter 2019, equal to 1.2% of
revenues) which more than offset production cost inflation (-14.9 million euro);
Ongoing implementation of costs’ recovery actions (12.8 million euro in first quarter 2019) in answer
to Standard’s worsening market trend, particularly in emerging countries;
Sales
Revenues (euro millions) 31/03/2019 % of total 31/03/ 2018 % of total Variation y/y Variation y/y
Organic
High Value
895.0
68.1%
833.9
63.6%
+7.3%
+5.3%
Standard 418.8 31.9% 476.4 36.4% -12.1% -6.0%
Total 1,313.8 100% 1,310.3 100% +0.3% +1.2%
Revenues amounted to 1,313.8 million euro with an organic growth of 1.2% compared with the first quarter
of 2018 thanks to the positive performance of the High Value segment. The total variation in revenues was
+0.3% including exchange rate effects and the adoption of the IAS 29 accounting principle to take account
of Argentina’s high inflation (for a total impact of -0.9%).

3
Revenue variants 31/03/ 2019
Volumes
of which High Value
+4.5%
of which Standard -
16.6%
-6.5%
Price/Mix +7.7%
Exchange rates/IAS 29 Argentina -0.9%
Total variations +0.3%
High Value revenues were 895 million euro, with growth of 7.3% compared with the same period in 2018
(+5.3% organic growth excluding the positive effect of exchange rates of +2.0%), equal to 68.1% of total
revenues, up from 63.6% in the first quarter of 2018.
Volumes in the High Value segment saw growth of 4.5% while volumes of Car New Premium tyres above
18 inches grew by 6.7% (market performance +5.2%), with improvements in market shares in the main
geographic regions. In particular, there was volume growth in the Replacement channel of 12.1%, while in
Original Equipment it was +0.4% because of market weakness in Emea, Apac and North America.
The difference in volume growth between High Value compared with Car ≥ 18 inches stems from the
slowdown in demand for Specialties ≤17”, mainly in Original Equipment, in line with the decline in car
production, the slowdown of the Premium moto market, Original Equipment in Europe, and the Replacement
channel in North America, impacted by the difficult climate conditions which led to the postponement of
buying decisions.
Total volumes decreased by 6.5% which was the result of increases in High Value volumes on the one hand
and the 16.6% fall in Standard volumes on the other. The performance in the Standard segment reflects a
fall in demand in all markets (global Standard car performance -3.1%) and Pirelli’s decision to continue to
reduce volumes of products of lower profitability.
Marked improvement in price/mix (+7.7% in first quarter 2019), underpinned by the growing weight of High Value, from improvements to the mix in the Standard segment and price increases in emerging markets and
North America to offset exchange rate volatility and the performance of raw material costs.
The performance of exchange rates was negative, mainly because of exchange volatility in emerging
markets which, together with the application of the IAS 29 accounting principle to take account of high
inflation in Argentina, had a negative impact of -0.9% in the first quarter of 2019.

4
Profitability
Proftiability* (euro millions) 31/03/2019 % of
revenues
31/03/2018 % of
revenues
Variation y/y
Adjusted Ebitda before start-up costs
327.0
24.9%
298.0
22.7%
+9.7%
Adjusted Ebitda 315.6 24.0% 288.1 22.0% +9.5%
Adjusted Ebit before start-up costs 230.7 17.6% 229.4 17.5% +0.6%
Adjusted Ebit
219.2
16.7%
218.4
16.7%
+0.4%
*beginning from 1 January 2019, leasing rents, previously included in Ebitda, are included as debt reduction for leasing (in the capital quota) and among financial charges (for the interest quota). At the same time, included in Ebit are amortizations for usage rights for goods under lease, initially booked as an asset in the balance sheet against leasing debts.
Adjusted Ebitda before start-up costs on 31 March 2019 was 327 million euro (302 million euro excluding
IRFS 16 impact), an increase of 9.7% compared with 298 million euro in the same period of 2018 (+1.3%
excluding IRFS 16 impact). Ebitda includes a 25 million euro benefit stemming from the application –
beginning from 1 January 2019 - of the new IFRS 16 accounting principle that establishes a new way of
accounting for leasing contracts.
Adjusted ebit before start-up costs grew by 0.6% to 230.7 million euro compared with 229.4 million euro in
the same period a year earlier. The adjusted ebit margin before start-up costs was 17.6%, substantially in
line with the 17.5% of the same period in 2018.
Adjusted ebit was 219.2 million euro (218.4 million euro in first quarter 2018) with a margin of 16.7%, in line
with the first quarter of 2018. Internal levers (price/mix, efficiencies and costs reduction programs) offset
the impacts linked to the deterioration of the external scenario (raw materials, exchange rates, inflation,
weakness of the Original Equipment market in EMEA, Apac and North America) and the fall in volumes in
the Standard segment.
In particular:
the improvement of price/mix (62.7 million euro) contributed to the reduction of the impact from
higher raw material prices (-27 million euro) and the volatility of exchange rates (-2.1 million euro),
as well as the effect of volumes’ decline (-37.7 million euro);
industrial efficiencies (16.4 million euro, 1.2% of revenues) more than compensated for costs’
inflation (-14.9 million euro);
the cost reduction plan of 12.8 million euro to counter the fall in sales in the Standard segment,
particularly in Brazil, more than compensated for the increase in amortizations and other costs linked
to the development of High Value (-8.9 million euro);
start-up costs (mainly relating to the Cyber business and company’s digital transformation) were
slightly higher (+0.5 million euro to 11.5 million euro compared with 11 million euro in first quarter
2018).
Ebit totaled 183.1 million euro (184.0 million euro in first quarter 2018) and included amortizations of
intangible assets, identified in the context of PPA, of 28.7 million euro (in line with first quarter 2018), and
non-recurring and restructuring costs of 5.1 million euro (2.4 million euro in first quarter 2018), and 2.3 million
euro of charges related to the retention plan (3.3 million in first quarter 2018).

5
The result from shareholdings was positive two million euro, an improvement from +0.8 million euro in the
first quarter of 2018.
Net financial charges decreased by 7.1 million euro (from 55.2 million euro in the first quarter of 2018 to
48.1 million euro in the first quarter of 2019) as a result of lower losses on exchange rates (which had
impacted the first quarter of 2018, as a consequence of the devaluation in Argentina) and lower financial
charges connected to coverage operations in Brazil which more than offset higher leasing charges (6.7
million euro) stemming from the application of the new IFRS 16 – Leases accounting principle.
The net result for continuing operations was 101.4 million euro, an increase of 9.7% from 92.4 million euro
in the first quarter of 2018.
Performance by region With the aim of accelerating the implementation of the business model focused on High Value, Pirelli has
adopted a new organizational structure at the regional level composed of five regions rather than six. In
addition to Apac, North America (previously denominated Nafta) and Latam, the two new macro-regions
are:
- Emea (Europe, Middle East, Africa): this area includes Gulf countries, markets with growing
exposure to High Value;
- Russia and Nordics: this area groups markets that are very similar, with the goal of exploiting
production and commercial synergies, in particular regarding Winter.
Revenues (euro millions) 31/03/2019 % of total
31/03/2019
% of total
31/03/2018
Variation y/y Variation y/y
organic
Emea
598.7
45.6%
46.8%
-2.3%
-1.6%
North America 269.8 20.5% 18.6% +10.8% +2.8%
Apac 214.2 16.3% 15.3% +6.8% +4.4%
Latam 167.2 12.7% 14.4% -11.7% +3.3%
Russia & Nordics 63.9 4.9% 4.9% -0.8% +5.0%
Total 1,313.8 100% 100% +0.3% +1.2%
At the geographic level, the Emea region, in the first quarter of 2019, registered an organic variation in
revenues of -1.6% (-2.3% including the effect of exchange rates of -0.7 percentage points) because of
registration decreases in Car registrations and Moto in Europe in the first quarter. Pirelli, however, improved its market share both in Original Equipment Car ≥18’’ – thanks to its diversified homologation portfolio –
and the Replacement channel, thanks the pull-through effect. The challenges of the Original Equipment
market notwithstanding, High Value revenues saw organic growth of 2.0%. On the other hand, the reduction
of exposure to less profitable Standard products continued, with revenues at the organic level decreasing
by 10.8%. Profitability was Mid-teens, a slight decrease compared with the first quarter of 2018 and reflects
the slowdown in the Original Equipment channel.
North America posted organic revenues growth of +2.8% (+10.8% including the positive +8.0 percentage
points effect of exchange rates) driven by High Value (+6.4% organic growth) and in particular by growth in the Replacement channel, with an increase in market share thanks to the success of specialties ≥18’’ and
All Season products. Profitability (adjusted Ebit margin) improved by over two percentage points to the

6
Twenties level (High-teens in first quarter 2018), thanks to the growing weight of the high-end, efficiency
actions on costs and progressive strengthening of the dollar.
Apac posted organic revenue growth of 4.4% (+6.8% including forex, positive impact 2.4 percentage points)
and confirmed its position as the region with the highest profitability (adjusted Ebit margin in the Twenties),
an improvement for the year earlier. Revenues saw organic growth driven by High Value (+6.1%), mainly in
the Replacement channel thanks to the pull through effect and a widening commercial presence with over 4,500 points of sale. Sales of Standard declined (-1.5% organic variation) with a fall in sales of rim sizes ≤17
inches in a context of market weakness in this segment.
Latam recorded an organic variation in revenues of +3.3% (the overall variation was -11.7%, including
exchange rate effects and the application of high inflation accountancy in Argentina in total negative -15
percentage points) impacted above all by the 16.6% decline in volumes. This trend reflects the weakness
of the market (total market -7% in first quarter 2019), the continuation of the focus on mix, with the reduction
of sales of lower profit and smaller rimmed Standard products, and the destination of some production for
export to the North American market. The price/mix saw a marked improvement (+20.0% in the first quarter)
thanks to price increases in Brazil, which took place in the fourth quarter, and the great improvement in the
product mix. Profitability (adjusted Ebit margin) was High-single digit, a slight gain compared with the first
quarter of 2018, because of efficiency actions and mix improvement and reconversion.
The Russia and Nordics region registered organic revenue growth of 5.0% (-0.8% with the negative forex
effect of -5.8 percentage points) thanks to the strategic focus on more profitable segments and the market’s
recovery. This combination of factors had a positive impact on the quarter’s results with organic High Value
revenue growth of 37.4% (+32.4% growth including the negative exchange rate impact of -5 percentage
points) and an organic reduction of Standard revenues of 5.3% (-11.2% including forex). There was a
significant improvement in profitability compared with the first quarter of 2018 (adjusted Ebit margin Double-digit against Mid-single-digit in first quarter 2018).
Net financial position and cash flow
The Net Financial Position, excluding the impact of the new IFRS 16 accounting principle, was negative
3,913.0 million euro (-4,387.3 million euro including the impact of IFRS16 of 474.3 million euro), an increase
from 3,180.1 million euro on 31 December 2018 due to the usual seasonality of working capital but an
improvement compared with 3,938.9 million euro on 31 March 2018, which benefitted from the 141.8 million
euro impact of the disposal of participations and extraordinary operations (mainly due to the sale of the
stake in Mediobanca).
The net cash flow before extraordinary operations/participations, was negative 700.0 million euro, an
improvement of 162.2 million euro compared with the same period a year earlier (-862.2 million euro) thanks
to:
improved management of operating cash (124.5 million euro less cash absorption)
lower financial, non-recurring and restructuring charges (37.7 million euro)
In detail, the net cash flow from operations in the first quarter of 2019 was negative 601.5 million euro, an
improvement of 124.5 million euro compared the figure for the year earlier period (-726.0 million euro) and
reflects:
Investments before IRFS 16 of 78.0 million euro (85.3 million euro in first quarter 2018), 81.2 million
euro including the impact from the application of the new IRFS 16 principle. Investments are mainly
to increase High Value capacity in Europe and North America, the strategic reconversion of Standard
capacity into High Value in Brazil and the constant improvement of mix and quality in all factories;
The absorption of cash linked to the usual seasonality of working capital and other of 836.0 million
euro. This absorption was lower than the figure in the first quarter of 2018 (-928.8 million euro) also
thanks to recovery actions on working capital announced on the occasion of the publication of 2018
results.
7
The performance of working capital and other in the first quarter of 2019 benefitted from:
- The continuation of improvement of the conditions of payment towards suppliers, and
- The launch of recovery actions on commercial credits, through the realignment of the terms of
payment for the main Dealers in Brazil, temporarily extended at the end of 2018 because of the
difficult market conditions.
In particular, inventories registered a volume reduction of 2%, with:
- A decline of 11% in Standard products, in line with the recovery plan announced at the beginning
of the year, and
- An increase of 5% in High Value products, to ensure a better level of service to final customers.
This improvement in warehouse mix and the impact of exchange rates resulted in a slight increase of
inventories in terms of value.
Total cash flow in the first quarter of 2019 was negative 717.2 million euro and included, as well, the impact
of operations on participations that took place during the quarter. In the first quarter of 2018 the total cash
flow was negative 720.4 million euro and included the positive impact of operations on participations and
extraordinary operations for 141.8 million euro (mainly because of the disposal of the stake held in
Mediobanca).
***
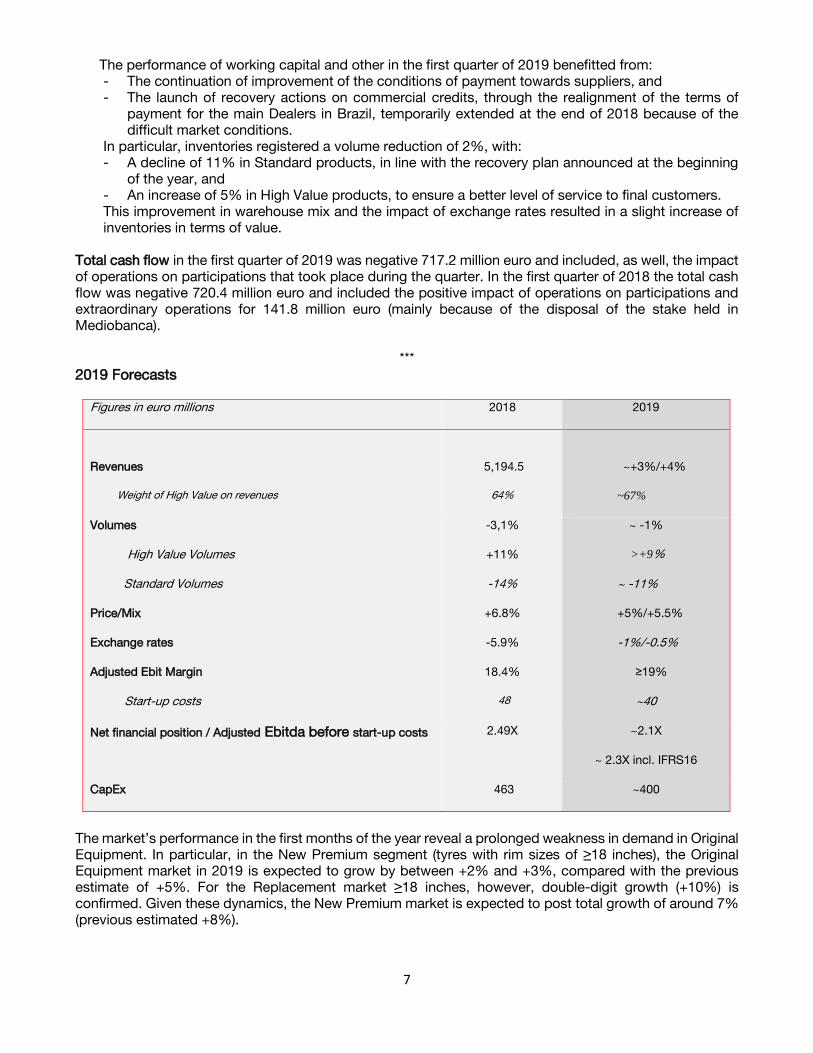
2019 Forecasts
Figures in euro millions 2018 2019
Revenues
Weight of High Value on revenues
5,194.5
64%
~+3%/+4%
~67%
Volumes
High Value Volumes
Standard Volumes
Price/Mix
Exchange rates
Adjusted Ebit Margin
Start-up costs
-3,1%
+11%
-14%
+6.8%
-5.9%
18.4%
48
~ -1%
>+9%
~ -11%
+5%/+5.5%
-1%/-0.5%
≥19%
~40
Net financial position / Adjusted Ebitda before start-up costs 2.49X ~2.1X
~ 2.3X incl. IFRS16
CapEx 463 ~400
The market’s performance in the first months of the year reveal a prolonged weakness in demand in Original
Equipment. In particular, in the New Premium segment (tyres with rim sizes of ≥18 inches), the Original
Equipment market in 2019 is expected to grow by between +2% and +3%, compared with the previous
estimate of +5%. For the Replacement market ≥18 inches, however, double-digit growth (+10%) is
confirmed. Given these dynamics, the New Premium market is expected to post total growth of around 7%
(previous estimated +8%).

8
On the basis of this scenario, Pirelli is revising its estimates for High Value volumes which are now expected
to grow by over 9% (previous indication around +11%), a level that is however above the market’s growth:
In Original Equipment thanks to a diversified portfolio of homologations and new supply contract in
North America and Apac in the second half
In Replacement leveraging the pull-through effect (83% in 2018).
Standard segment volumes have also been revised, with the decline foreseen at -11% (prior indication -
9%/-10%), given the market’s weakness and the accelerated exit from less profitable products.
Total volumes are expected to decrease by about -1% (prior guidance +0%, +1%).
The company confirms expectations of improved price/mix (+5%/+5.5%) and exchange rates (-1%/-0.5%).
The forecasts for 2019 hence are:
Revenue growth of between 3% and 4% (previous indication +4% to +6%) compared with 5,194.5
million euro in 2018, supported by the strengthening of High Value (confirmed at ~67% of revenues)
Profitability growth, with an adjusted Ebit margin foreseen at ≥19% (previous indication 19%)
compared with 18.4% in 2018, supported by improvement in internal levers (price/mix and cost
efficiencies)
Weight of High Value on adjusted Ebit before start-up costs at ~85% (in line with the prior indication)
Debt reduction with a ratio between Net Financial Debt and adjusted Ebitda before start-up costs
at around 2.1x (2.49 at end 2018), around 2.3x including the impact of the adoption of the new
IFRS16 accounting principle
Investments of around 400 million euro (previous indication 430 million euro), consistent with the
new market scenario.
*** Events after 31 March 2019
On 8 April 2019, the sentence of the Federal Regional Tribunal of the First Region (T.R.F.-1 with
headquarters in Brasilia) - which recognized the right of Pirelli’s Brazilian subsidiary Pirelli Pneus Ltda. to
exclude the ICMS (State Tax on Operations levied on the delivery of goods and interstate and inter-
municipal transport and communication services) from the calculation basis of the PIS and COFINS social
contributions for the period 2003-2014 - became final (res judicata).
Following the sentence, of which the market was informed on 1 April 2019, there will be a positive non-
recurring impact in the income statement on the net result of approximately 107 million euro, made up of:
- positive impact on the Operating Result (Ebit) of around 80 million euro
- positive impact on Financial Proceeds of about 82 million euro
- negative fiscal impact of around -55 million euro
The benefits in terms of group cash flow are expected in the 5-year period 2020-2024.
On May 13, 2019, Pirelli announced the reorganization of its production footprint in Brazil to improve
competitiveness in the Country through the creation of a hub for the production of High Value Car,
Motorsport and Moto tyres in Campinas, to which the production of moto tyres will be transferred from
Gravataì. The Company foresees an investment plan of 120 million euro in the period 2019-2021 for the
modernization and reconversion of production plants from Standard to High Value, and the ongoing
improvement of the mix and quality of the factories of Campinas (San Paolo), and Feira de Santana (Bahia).
The resources relative to the reorganization are mainly derived from the signing of the fiscal agreement for
the Patent Box, in October of 2018, which, as then announced, go towards the further focus on High Value
and a quicker reduction of the standard segment. The strengthening of Campinas will permit the hiring of
around 300 people by 2022 and, with the goal of finding an agreement with unions during the period of the
production transfer from Gravataì to Campinas, all possible actions will be taken to mitigate the social
impacts at Gravataì, which today employs around 900 people.

9
***
Conference call
The results to 31 March 2019 will be illustrated today, 14 May 2019, at 18.30 via conference call with the
participation of Executive Vice Chairman and CEO of Pirelli & C. SpA, Marco Tronchetti Provera, and the
top management. Reporters will be able to follow the call, without the possibility of asking questions, by
dialing +39 02 805 88 27. The presentation will also be webcast – in real time – at www.pirelli.com in the
Investors section, where the slides will also be available.
***
The intermediate results for operations to 31 March 2019 will be available to the public by the end of today at
the company’s legal headquarters, as well as on the Company website (www.Pirelli.com) and on the eMarket
storage mechanism (www.emarketstorage.com).
The Manager in charge of preparing the corporate accounting documents of Pirelli & CSpA, Mr. Francesco Tanzi, declares pursuant to paragraph 2 of article 154 bis of the Consolidated Law on Finance that the accounting information contained in this press release
corresponds to the documentary results, books and accounting records.
***
Pirelli Press Office – Tel. +39 02 64424270 – [email protected]
Pirelli Investor Relations – Tel. +39 02 64422949 – [email protected]
www.pirelli.com

10
Pirelli – Economic data to 31.03.2019
(In millions of euro) 1Q 2019 1Q 2018
Net sales 1,313.8 1,310.3
EBITDA adjusted without start-up costs (°) 327.0 298.0
% of net sales 24.9% 22.7%
EBITDA adjusted (°°) 315.6 288.1
% of net sales 24.0% 22.0%
EBITDA (°°°) 308.2 282.4
% of net sales 23.5% 21.6%
EBIT adjusted without start-up costs (°) 230.7 229.4
% of net sales 17.6% 17.5%
EBIT adjusted 219.2 218.4
% of net sales 16.7% 16.7%
Adjustment: - amortisation of intangible assets included in PPA (28.7) (28.7)
- non-recurring, restructuring expenses and other (7.4) (5.7)
EBIT 183.1 184.0
% of net sales 13.9% 14.0%
Net income (loss) from equity investments 2.0 0.8
Financial income/(expenses) (°°°) (48.1) (55.2)
Net income (loss) before tax 137.0 129.6
Tax expenses (35.6) (37.2)
Tax rate % (26.0%) (28.7%)
Net income (loss) related to continuing operations 101.4 92.4
Eanings/(loss) per share related to continuing operations (in euro per share) 0.098 0.090
Net income (loss) related to continuing operations adjusted 123.4 113.3
Net income (loss) related to discontinued operations - (3.3)
Total net income (loss) 101.4 89.0
Net income attributable to owners of the Parent Company 97.6 90.4
(°) Start-up costs refer to contribution to EBITDA and EBIT (amounting to euro 11.4 millions (euro 9.9 millions in 1Q 2018) and euro
11.5 millions (euro 11.0 millions in 1Q 2018) respectively of the Cyber and Velo activities and costs sustained for the digital
transformation of the Group.
(°°) Adjustments refer to non recurring and restructuring expenses amounting to euro 5.1 millions (euro 2.4 millions in 1Q 2018)
and expenses relative to the retention plan approved by the Board of Directors on February 26, 2018 amounting to euro 2.3
millions (euro 3.3 millions in 1Q 2018)
(°°°) The item includes for 2019, the impacts deriving from the application for the new accounting standard IFRS 16 - Leases to the
amount of euro 25 million on EBITDA and euro -6.7 million on financial expenses

11
Pirelli – balance sheet data to 31.03.2019
Cashflow statement
(In millions of euro) 03/31/2019 12/31/2018 03/31/2018
Fixed assets related to continuing operations without IFRS 16 9,069.7 9,017.8 8,958.2
Right of use IFRS 16 472.4 n/a n/a
Fixed assets related to continuing operations 9,542.1 9,017.8 8,958.2
Inventories 1,165.5 1,128.5 940.2
Trade receivables 858.4 628.0 875.9
Trade payables (1,142.5) (1,604.7) (1,062.5)
Operating working capital related to continuing operations 881.4 151.8 753.6
% of net sales (*) 16.8% 2.9% 14.4%
Other receivables/other payables 133,3 34.3 89.9
Net working capital related to continuing operations 1,014.7 186.1 843.5
% of net sales (*) 19,3% 3.6% 16.1%
Net invested capital held for sale 0.8 10.7 51.3
Net invested capital 10,557.6 9,214.6 9,853.0
Equity 4,687.9 4,550.9 4,267.6
Provisions 1,482.4 1,483.6 1,646.5
Net financial (liquidity)/debt position without IFRS 16 3,913.0 3,180.1 3,938.9
Lease obligations IFRS 16 474,3 n/a n/a
Total Net financial (liquidity)/debt position 4387,3 3,180.1 3,938.9
Equity attributable to owners of the Parent Company 4,603.9 4,468.1 4,205.7
Investments in property, plant and equipment and intangible assets without IFRS16 78.0 463.4 85.3
Investments in property, plant and equipment and intangible assets IFRS16 3.2 n/a n/a
Research and development expenses 62.6 219.0 56.3
% of net sales 4.8% 4.2% 4.3%
Research and development expenses - High Value 57.3 202.9 51.3
% on sales High Value 6.4% 6.1% 6.2%
Employees (headcount at end of period) 31,697 31,489 31,267
Industrial sites (number) 19 19 19
(°) during interim periods net sales are annualised
2019 2018
EBIT adjusted 219.2 218.4
Amortisation and depreciation (excluding PPA amortisation) 96.5 69.7
Investments in property, plant and equipment and intangible assets without IFRS16 (78.0) (85.3)
Investments in property, plant and equipment IFRS16 (3.2) n.a.
Change in working capital/other (836.0) (928.8)
Operating net cash flow (601.5) (726.0)
Financial income/(expenses) (48.1) (55.2)
Taxes paid (30.1) (31.1)
Cash Out for non-recurring and restructuring expenses/other (16.0) (38.2)
Differences from foreign currency translation/other (4.3) (11.7)
Net cash flow before extraordinary operations and equity transactions (700.0) (862.2)
Industrial reorganization - 5.3
Disposals/(Acquisition) of equity transactions (17.2) 136.5
Net cash flow (*) (717.2) (720.4)
Net cash flow without IFRS 16 (732.9) -
(In millions of euro)1Q
* The item at March 31,2019 refers to the change in Net Financial Position calculated by including lease obligations both at 01.01.2019 and 03.31.2019 for leasing
recorded due to the application of the new standard IFRS 16 - Leases

12
ALTERNATIVE PERFORMANCE INDICATORS This document, in addition to the financial measures provided for by the International Financial Reporting Standards (IFRS),
also includes measures derived from the latter even though not provided for by the IFRS (Non-GAAP Measures). These
measures are presented in order to allow for a better assessment of the results of the Group's operations and should not be
considered as alternatives to those required by the IFRS.
In particular, the Non-GAAP Measures used were as follows:
- EBITDA: is equal to the EBIT, but which excludes the depreciation and amortisation of property, plant and equipment
and intangible assets. The EBITDA is used to measure the ability to generate earnings from operations, excluding the
impact of investments;
- EBITDA adjusted: is an alternative measure to the EBITDA which excludes non-recurring and restructuring expenses,
and expenses relative to the retention plan approved by the Board of Directors on February 26, 2018;
- EBITDA adjusted without start-up costs: is equal to the EBITDA adjusted but excludes the contribution to the EBITDA
(start-up costs) of the Cyber and Velo Activities and costs sustained for the digital transformation of the Group. The
EBITDA adjusted without start-up costs is an alternative measure to the EBITDA adjusted which excludes start-up costs;
- EBITDA adjusted without start-up costs without IFRS 16: is equal to the EBITDA adjusted without start-up costs but
excludes the impact deriving from the application of the new accounting standard IFRS – Leases;
- EBITDA margin: this is calculated by dividing the EBITDA by revenues from sales and services (net sales). This measure
is used to evaluate operational efficiency, excluding the impacts arising from investment activities;
- EBITDA margin adjusted: this is calculated by dividing the EBITDA adjusted by revenues from sales and services (net
sales). This measure is used to evaluate operational efficiency, excluding the impacts arising from investments, operating
costs attributable to non-recurring and restructuring expenses, and expenses relative to the retention plan approved by
the Board of Directors on February 26, 2018;
- EBITDA margin adjusted without start-up costs: this is calculated by dividing the EBITDA adjusted without start-up costs
by revenues from sales and services (net sales). This is an alternative measure to the EBITDA margin adjusted which
excludes start-up costs;
- EBIT: is an intermediate measure, which is derived from the net income (loss) which excludes the net income (loss) from
discontinued operations, taxes, financial income, financial expenses and net income (loss) from equity investments. The
EBIT is used to measure the ability to generate earnings from operations, including the impact arising from investments;
- EBIT adjusted: is an alternative measure to the EBIT which excludes the amortisation of intangible assets relative to
assets recognised as a consequence of Business Combinations, operational costs attributable to non-recurring and
restructuring expenses, and expenses relative to the retention plan approved by the Board of Directors on February 26,
2018;
- EBIT adjusted without start-up costs: is equal to the EBIT adjusted but excludes the contribution to the EBIT (start-up
costs) of the Cyber and Velo Activities and costs sustained for the digital transformation of the Group. The EBIT adjusted
without start-up costs is an alternative measure to the EBIT adjusted which excludes start-up costs;
- EBIT margin: this is calculated by dividing the EBIT by revenues from sales and services (net sales). This measure is
used to evaluate operational efficiency;
- EBIT margin adjusted: this is calculated by dividing the EBIT adjusted by revenues from sales and services (net sales).
This measure is used to evaluate operational efficiency, but excludes the amortisation of intangible assets relative to
assets recognised as a consequence of Business Combinations, operating costs attributable to non-recurring and
restructuring expenses, and expenses relative to the retention plan approved by the Board of Directors on February 26,
2018;
- EBIT margin adjusted without start-up costs: this is calculated by dividing the EBIT adjusted without start-up costs by
revenues from sales and services (net sales). This is an alternative measure to the EBIT margin adjusted which excludes
start-up costs;
- Net income (loss) related to continuing operations adjusted: this is calculated by excluding the following items from the
net income (loss) related to continuing operations;
o the amortisation of intangible assets relative to assets recognised as a consequence of Business
Combinations, operating costs attributable to non-recurring and restructuring expenses and expenses relative
to the retention plan approved by the Board of Directors on February 26, 2018;
o non-recurring income/costs recognised under financial income and expenses;
o non-recurring costs/income recognised as a tax item, as well as the tax impact relative to the adjustments
referred to in the previous points.
This is used to measure net profitability, excluding the impact of the items referred to in the previous points.
- Fixed assets related to continuing operations: this measure is constituted of the sum of the items, "Property, plant and equipment", "Intangible assets", "Investments in Associates and Joint Ventures" and "Other financial assets at fair value through other Comprehensive Income” and "Other financial assets at fair value through the Income Statement". Fixed
assets related to continuing operations represent non-current assets included in the net invested capital;
- Fixed assets related to continuing operations without IFRS 16: this measure is calculated by excluding the rights of use
detected in the application of the new standard IFRS 16 - Leases, from fixed assets related to continuing operations;
- Net operating working capital related to continuing operations: this measure is constituted by the sum of the items,
"Inventories", "Trade receivables" and "Trade payables". It is used to measure the financial stability of commercial
activities.
- Net working capital related to continuing operations: this measure consists of the operating working capital and of other
receivables and payables and derivative financial instruments not included in the net financial (liquidity)/debt position.

13
The measure represents short-term assets and liabilities included in the net invested capital, and is used to measure
short-term financial stability;
- Net invested capital assets held for sale: this measure is constituted by the difference between "Assets held for sale" and "Liabilities held for sale". Net invested capital assets held for sale is used to measure net assets relative to assets
held for sale;
- Net invested capital: this measure is constituted by the sum of (i) fixed assets related to continuing operations, (ii) net
working capital related to continuing operations, and (iii) net invested capital assets held for sale. Net invested capital is
used to represent the investment of financial resources;
- Average net invested capital: this measure consists of the average between the net invested capital at the beginning
and end of the period, excluding investments in Associated companies and Joint Ventures, “Other financial assets at fair value through other Comprehensive Income”, “Other non-current financial assets at fair value through the Income Statement” and the intangible assets relative to assets recognised as a consequence of Business Combinations. This
measure is used to calculate the ROI;
- Provisions: this measure is constituted by the sum of "Provisions for liabilities and charges (current and non-current)", "Employee benefit obligations (current and non-current)" and "Provisions for deferred taxes". The item provisions
represents the total amount of liabilities due to obligations of a probable but not certain nature;
- ROI: this is calculated as the ratio between the EBIT adjusted and the average net invested capital. The ROI is used as
to measure the profitability of invested capital;
- Net financial debt: this is calculated pursuant to the CONSOB Communication dated July 28, 2006, and in compliance
with Recommendations ESMA/2013/319. Net financial debt represents the borrowings from banks and other financial
institutions net of cash and cash equivalents, "Other financial assets at fair value through the Income Statement”,
“Current financial receivables” (included in the item “Other receivables”) and, current derivative financial instruments
included in the total net financial (liquidity)/debt position (included under current assets as “Derivative financial instruments”);
- Total net financial (liquidity)/debt position: this measure represents the net financial debt less “Non-current financial receivables” (included in the non-current assets item “Other receivables”) and non-current derivative financial
instruments included in the net financial position (included under non-current assets as “Derivative financial instruments”). Total net financial (liquidity)/debt position is an alternative measure to net financial debt which includes
non-current financial assets;
- Net financial (liquidity)/debt position without IFRS 16: this measure is calculated by excluding leasing obligations
detected during the application of the new standard IFRS 16 – Leases, from the total net financial (liquidity)/debt position;
- Net financial (liquidity)/debt position without IFRS 16 / EBITDA adjusted without start-up costs without IFRS 16: this is
calculated as the ratio between the total net financial (liquidity)/debt position without IFRS 16 and the EBITDA adjusted
without start-up costs without IFRS. This is used to measure the sustainability of debt;
- CapEx (Capital Expenditures) or Investments in property, plant & equipment and intangible assets without IFRS 16 and
Investments in property, plant & equipment IFRS 16: these are respectively calculated as the (i) sum of investments
(increases) in intangible assets and investments (increases) in property, plant and equipment, excluding the increases
relative to the rights of use and (ii) the increases relative to the rights of use detected during the application of the new
standard IFRS 16 – Leases. This measure represents the total amount of investments in property, plant and equipment
and intangible assets;
- Impact of depreciation on investments: is calculated by dividing the investments (increases) in property, plant and
equipment with the depreciation for the period. The ratio of investments to depreciation is used to measure the ability
to maintain or restore amounts for property, plant and equipment.