press conference on the financial results of cez … filej anu a ry 2 0 f 1 h 20 l 2 0 10 m 0 une 10...
TRANSCRIPT

Prague, 10 August 2010
PRESS CONFERENCE ON THE FINANCIAL RESULTS OFCEZ GROUP IN H1 2010
NON-AUDITED CONSOLIDATED RESULTS PREPARED IN ACCORDANCE WITH THE PRINCIPLES OF INTERNATIONAL ACCOUNTING STANDARDS (IFRS)

11
AGENDA
Financial highlights and key events in CEZ Group in the H1 2010 Martin Novák, CFO
Financial resultsMartin Novák, CFO
Trading position of CEZ GroupAlan Svoboda, Executive Director, Sales and Trading

2
General Meeting held on June 29, 2010 approved (among others):dividend of CZK 53 gross per share representing approximately 55% of net consolidated income for 2009.change in the Articles of Association strengthening the influence of the Supervisory Board on decisions concerning the completion of Temelín nuclear power plant.hiving off Chvaletice power plant from ČEZ, a.s. (planned at September 1, 2010)
July saw the start of an refueling of nuclear fuel in unit 1 of Temelín nuclear power plant (changing of supplier -Russian TVEL).
Earnings before Interest, Taxes, Depreciation and Amortization (EBITDA) decreased by 9% (by CZK 4.6 bn) to CZK 47.2 bn.
Net income decreased by 18.5% y-o-y (CZk 6.5 bn) to CZK 28.7 bn.
Share price at BCPP was CZK 879 at August 6, 2010.
CEZ guidance for 2010 is unchanged – expected EBITDA remains at CZK 88.7 bn, net income at CZK 46.7 bn.
KEY RESULTS IN H1 2010 AND GUIDANCE FOR 2010

3
88.788.7 91.1
0102030405060708090
100
2008 2009 E2010
66.7 68.2 63.1
01020304050607080
2008 2009 E2010
EXPECTED RESULTS IN 2010
47.4 51.9 46.7
0102030405060
2008 2009 E2010
EBITDA
EBIT
NET PROFIT
- 10.0%
- 2.6%
- 7.5%
CZK bn+ 2.7%
+ 2.2%
+ 9.5%
Key year on year factorsDecrease in electricity sales prices (partly offset by dripping).Moderate growth of electricity demand.
Key risk forecast for 2010Negative impact of generation from photovoltaic power plantsin the Czech Republic. Due to a dramatic growth of electricity generated from photovoltaic power plants, there is a risk of a negative impact on expected results amounting to CZK 1 – 2 bn. This impact will be compensatedin the permitted revenues in the years to come.Higher creation of adjustments to receivables. Regulatory and political risks in Southeastern Europe.

4
THE SHARE PRICE OF ČEZ, A. S. IS MAINTAINING ITS LEVEL WHILST THE UTILITIES SECTOR IS RECORDING LOSSES, SHARES CLOSED AT CZK 879 ON AUGUST 6, 2010
Increase by 1.7%
80%
85%
90%
95%
100%
105%
110%
115%
120%
Januar
y 201
0Feb
ruar
y 201
0
March 20
10
April 20
10
May 20
10
June 2
010
July
2010
August 20
10
Bloomberg European Utilities Index PX ČEZ, a. s.
January 1, 2010CZK 864.00
August 6, 2010CZK 879.00

5
CEZ GROUP IS SUPPORTING THE ECONOMY OF THE CZECH REPUBLIC BY INVESTING TENS OF BILLIONS OF CZK IN THE RENEWAL OF SOURCES
Complex renewal of Tušimice II power plant
New supercritical unit in LedviceProjects of the of CEZ Group´s portfolio renewal are helping the Czech economy both now as well as in the short and medium term and the environment in the long term.
Preparation for construction of a combined cycle gas power plant in Počerady
Stage 2 is proceeding according to planDismantling of the old technology has been completed, demolition of the stack has begun and the cladding of the building with manufacturing technologies is nearing its completion
Construction in accordance with works scheduleConstruction of the cooling tower is nearing its completion, main boiler support structures built up to 90 meters, transport of a new 300 tones weighinggenerator and of other technologies is being planned
Works on preparation of the site have startedRepairs of raw water feed pipes are at final stageWorks on service building is in progressConceptual project and the IPPC documentation have been completed
Preparation of the complex renewal of Prunéřov II power plantMinistry of the Environment has issued EIA opinion on 29 April 2010
CEZ has submitted the Ministry of the Environment draft compensatory measures

6
WE HAVE ABANDONED ACQUISITIONS IN RISKY MARKETS OF RUSSIA, UKRAINE AND SEVERAL BALKAN REGIONS INTIME AND WE ARE CONTINUING TO NARROW THE SCOPEOF OUR INTEREST
Countries of conditional interest
Subsidiaries
Energy assets
Trading activities
Participation on the following projects has been terminated:
PAK (POLAND)
STEAG (GERMANY)

7
Acquisition of a share in Pražská
teplárenská.
Acquisition of Trmiceheating plant in North
Bohemia (formerly DalkiaÚ/L).
Completion ofTemelín nuclear
power plant
Extension of nuclear power plant in
Dukovany
Preparation of a combined cycle gas
power plant in Mělník
Construction of a new unit
of Ledvice power plant
Construction of a combined
cycle gas powerplant in
Počerady
Complexrenewal of Prunéřov
power plant
Complexrenewal of Tušimice
power plant
WE ARE MORE FOCUSING ON PROJECTS IN THE CZECH REPUBLIC

8
Basic information on the Fântânele – CogealacprojectProjects of two wind farms in the Constanta district between the communities of Fântânele and Cogealac (north of Constanta, 17 km from the Black Sea coast).Installed capacity of each turbine is 2.5 MW –the total installed capacity of the wind park is 600 MW.
Phase 1 of the project (Fântânele) – 139 wind turbinesby June 30: 114 wind turbines erectedby June 30: 47 turbines connected to the networkby June 30: 3.5 GWh already produced
Phase 2 of the project (Cogealac) – 101 wind turbinesConstruction already begunCompletion planned for 2010/2011
COMMISSIONING OF THE LARGEST INLAND WIND PARK IN EUROPE – FÂNTÂNELE - COGEALAC

99
AGENDA
Financial highlights and key events in CEZ Group in H1 2010Martin Novák, CFO
Financial resultsMartin Novák, CFO
Trading position of CEZ GroupAlan Svoboda, Executive Director, Sales and Trading

10
YEAR ON YEAR NET INCOME FELL BY 6.5 BILLION CZK
Selected factors
Year on year fall of electricity selling prices.
Moderate increase in demand for electricity in all sectors.
Successful business strategy in the area of emissionallowances in the 1st
half of 2010.
Increases in other operating expenses due to the inclusion of new acquisitions.
Write-off of negative goodwillfrom the acquisition of MIBRAG of CZK 3.1 billionin 2009 income.
35.2
28.7
0.1
2.0
3.9
1.10.8
2.60.4
3.3
1.9
25
27
29
31
33
35
NET INCOME2009 H 1
Electricity sales,incl. derivates, net
Other revenuesfrom products
and services (incl.heat and coal)
CO2 allowances Fuel (only outsideCEZ Group)
Gross marginfrom generation,
trading,distribution and
sale, heat and coal(simplified)
Other operatingexpenses excl.
depreciation andamortization
Depreciation andamortization
Otherexpenses/income
Income tax NET INCOME2010 H 1
CZK bn
- 6,5 CZK bn- 18,5%

11
GROSS MARGIN FROM GENERATION, TRADING, SUPPLY AND DISTRIBUTION FELL BY 3% TO CZK 66 BN YEAR ON YEAR
Year on year fall in electricity sales is linked to the fall in wholesale prices of electricity, which was partly offset by the sale of electricity one year and more in advance at prices higher than those which could be obtained in the spot market in the 1st half of 2010. The margin on this forward trades was partially reflected in the commodity derivatives category (due to the optimization of production and due to the hedging of 2010 margins).Year on year heat sales increased in the Czech Rep., in particular through the inclusion of new companies (Trmice heating plant -formerly Dalkia Ústí nad Labem); in Poland as a result of the increase in the volume of produced heat (in the same period last year there were outages made by the network operators). The decline in fuel costs was due, in particular, to lower costs of fossil fuel (principally hard coal for Dětmarovice power plant).The positive influence of the growth of income from CO2 allowances was in particular, due to gain from successful business strategy in the area of CO2 derivatives.
I. QI. Q I. Q(in CZK millions) 1 - 6 /2009 1 - 6 /2010 Change
10-09Index10/09
Electricity sales and services 87,492 84,691Electricity, gas and coal derivative trading, netto 2,076 5,402 -3,943 94%Purchased power and related services -22,411 -26,879Heat sales and other revenues 7,493 8,590 1,097 115%Fuel -8,005 -7,943 62 99%CO2 allowances 1,239 2,013 773 162%
Gross margin (simplified) 67,884 65,874 -2,011 97%Operating revenues 97,061 98,683 1,622 102%Variable operating costs -29,177 -32,810 -3,633 112%

12
YEAR ON YEAR OPERATING COSTS IN CEZ GROUP GREW BY 16% IN PARTICULAR AS A RESULT OF NEW ACQUISITIONS
The total increase in selected operating costs of CZK 2.6 billion was influenced by the inclusion of new acquisitions (OSSh, Trmiceheating plant) which contributed CZK 1.9 billion, of which CZK 0.4 billion is attributable to increase of salaries and wages and the remaining CZK 1.5 billion in increase in Others. New acquisitions were also responsible for increase in depreciation of CZK 0.3 billion.
Movement within individual categories without taking acquisitions into account:
Growth of salaries and wages was caused mainly due to higher costs of ČEZ a.s (increase in the number of employees linked to new investments, construction and renewal of power plants).
Others item was negatively influenced by the creation of adjustments to overdue receivables, in particular by Romanian Railways.
Increase in deprecitaion was linked to the ongoing investment program.
(in CZK millions) 1 - 6 /2009 1 - 6 /2010 Change10-09
Index10/09
SUM of selected operating costs -16,059 -18,687 -2,629 116%Salaries and wages -7,748 -8,534 -786 110%Other selected operating costs -8,310 -10,153 -1,843 122%
Repairs and maintenance -2,211 -2,079 132 94%Material and supplies -2,173 -2,264 -91 104%Others -3,926 -5,810 -1,884 148%
EBITDA 51,826 47,186 -4,639 91%Depreciation and Amortization -10,982 -11,431 -449 104%

13
OTHER EXPENSES AND INCOME DETERIORATEDBY CZK 3.3 BN YEAR ON YEAR
Interest expense grew in line with greater financing needs.Gain/loss from associates and joint-ventures includes a share of net income of CEZ Group from the joint venture between CEZ and MOL, MIBRAG mines and the results of the Turkish acquisitions Sakarya Elektrik Dagitim and Akenerji. Gain from associates in 2009 was positively influenced by the one off write-off of the negative goodwill from the acquisition of MIBRAG (CZK 3.1 billion). The 2010 results are, on the other hand, adversely affected by the financing of the acquisition of MIBRAG and the financing of an acquisition in Turkey. The item “Others” is positively influenced by income from securities (dividend from Dalkia ČR) and by a reduction of financing costs thanks to the optimization of financing within CEZ Group.
I. Q I. Q(in CZK millions) 1 - 6 /2009 1 - 6 /2010 Change10-09
Index10/09
Other expenses and income 2,312 -1,001 -3,312 x Interest on debt, net of capitalized interest -1,536 -1,719 -183 112%Interest on nuclear and other provisions -1,046 -1,019 27 97%Interest income 1,080 1,102 23 102%FX profit / loss and financial derivates 239 195 -44 81%Gain (Loss) from associates and joint-ventures 3,241 -384 -3,625 x Others 340 825 485 243%
Profit before taxes 43,156 34,755 -8,401 81%Income tax -7,941 -6,046 1,896 76%
Net Income 35,215 28,709 -6,506 82%

14
DEVELOPMENT IN Q2 2010
All the foregoing items are influenced by the inclusion of newly consolidated companies to results in H1 2010.A moderate increase of operating revenues is due to gradually increasing consumption of electricity in the Czech Rep. driven by economic recovery and also due to successful entrance to the market of new commodities (natural gas) and to the strengthening market position(heat).The year on year fall of the gross margin is caused by lower electricity selling prices due to the economic crisis.Operating costs in Q2 of 2010 reflect the same influences as those in the whole first half of the year, differing only in terms of their absolute amount representing approximately one half of the half-yearly costs.Other (financial) expenses and income in 2009 reflect the one off write-off of the negative goodwill from the MIBRAG acquisition.
(in CZK millions) 4 - 6 / 2009 4 - 6 / 2010 Change10-09
Index10/09
Operating revenues 43,109 44,798 1,688 104%Variable operating costs -12,925 -15,187 -2,262 118%Gross margin (simplified) 30,185 29,610 -574 98%0SUM of selected operating costs -8,585 -9,755 -1,170 114%Salaries and wages -4,055 -4,468 -412 110%Other selected operating costs -4,530 -5,287 -758 117%Repairs and maintenance -1,394 -1,273 121 91%Material and supplies -1,128 -1,078 51 96%Others -2,007 -2,937 -929 146%
EBITDA 21,599 19,855 -1,744 92%Depreciation and Amortization -5,552 -5,791 -239 104%Other expenses and income 3,128 -773 -3,901 x Profit before taxes 19,176 13,292 -5,884 69%Income tax -3,345 -2,044 1,301 61%
Net Income 15,831 11,248 -4,583 71%

15
SEGMENTAL CONTRIBUTIONS TO EBITDA
* CE = Central Europe region (Czech republic, Slovakia, Poland, Hungary, Netherlands, Germany, Ireland)**SEE = South East Europe region (Turkey, Bulgaria, Romania, Kosovo, Serbia, Albania, Russia, Bosnia and Herzegovina, Ukraine)
91%113%140%85% 77% 104% 120%89%
Power Production and Trading CE* Segment EBITDA fell by CZK 6 billion (by 15%) principally due to the fall of electricity selling prices at ČEZ, a. s. This influence was partly offset by hedging of prices through derivative trades and by emission allowances trading.Distribution and Sale CE*: Segment EBITDA grew year on year by CZK 2.2 billion (by 40%). EBITDA growth was mainly influenced by higher distribution margins, mainly attributable to the growth of regulated tariffs, particularly in reserve capacity items. In the area of sales, the positive results of new commodity (natural gas) trading begin to manifest themselves. Mining CE*: Segment EBITDA fell year on year by CZK 0.6 billion as a result of lower revenues from coal by Severočeské doly (SD). This fall was due to a lower demand by ČEZ, a. s., for power plants burning coal from SD (primarily Prunéřov and also because of the greater efficiency of Tušimicepower plant following a complex renewal). Power Production and Trading SEE**: In the H1, Varna power plant generated 0.9 TWh of electricity, representing year on year fall of 27%. In financial terms the results are on the level of the same period of the preceding year thanks to a savings of a part of operating expenses. In Romania the construction and gradual commissioning of the wind park in Fântânele continues and production began there in June 2010. Distribution and Sale SEE**: In H1 of 2010, companies in Bulgaria, Romania and Albania distributed 10.2 TWh and sales to end-customers were8.4 TWh. Segment EBITDA is slightly higher than in the comparable period of the preceding year, which saw a year on year growth of the volumes of electricity sold from high voltage and low voltage levels by the Romanian supply company.
Contribution toEBITDA in H1 2010CZK bn
Index H1 2010 / H1 2009
Index Q2 2010 / Q2 2009 90% 86% 135% 63% 92%91%95% 74%
32.547.2
0.17.6 2.2 2.7 0.2 1.9
05
1015
202530
3540
4550
Power Production and Trading CE
Distribution andSale CE*
Mining CE* Others CE* Power Productionand Trading SEE**
Distribution andSale SEE**
Others SEE** CEZ Group

16
86.2 92.0
115.3129.5
328.8 339.5
050
100150200250300350400450500550600
As of 31/12/2009 As of 30/6/2010
Current asset
Other non-currentassets
Fixed tanginbleassets, nuclear fueland investments
ASSETSCZK bn
BALANCE SHEET OVERVIEW
140.0 160.8
131.1132.4
206.7 208.1
37.237.322.4
15.3
050
100150200250300350400450500550600
As of 31/12/2009 As of 30/6/2010
Short-term liabilities
Deferred tax liability
Accumulatedprovision for nucleardecomissioning andfuel storageLong-term liabilitiesexcluding provisions
Equity
LIABILITIESCZK bn
530.3 530.3561.0
Fixed assetsIncrease of long-term tangible assets in 2010 due to the commissioning of new investments.Other fixed assets grow as a result of the acquisition of a shareholding in Dalkia ČR.
Current assets:Temporary higher amount of cash, its equivalents
and liquid securities held for the purpose of the anticipated dividend distribution.Fall of short-term receivables, primarily trade
receivables
Long-term liabilities and equityNet income in the 1st half of 2010 increased equity by CZK 28.7 billion, whilst, on the contrary, declared dividends lowered equity by CZK 28.5 billion.New bonds were issued in 2010 (long-term liabilities).Deferred tax liability rose due to the inclusion of tax payable in the course of the year.
Short-term liabilitiesCreation of liability on declared dividends (from 2009 profits).Fall in short-term bank loans party offset by growth in issued
bonds due within one yearFall in other short-term liabilities (primarily trade payables).
561.0

17
CASH FLOW – SELECTED ITEMS
48.3
30.0
7.44.1
40.9
25.9
0
5
10
15
20
25
30
35
40
45
50CZK bn
Cash used ininvesting activities
Cash available afterpayment ofinvestments
Net cash flow fromoperating activities
H1 2009 H1 2010
Year 2010 is witnessing a fall of net cash flows from operating activities by CZK 18.3 billion due to a fall of profit before tax after adjustment for non-cash operations by CZK 4.5 billion and a negative change of working capital by CZK 15.0 billion (return of variation margin on forward trades on the exchange due to the rise of electricity forward prices in the 1st
half of 2010 in contrast with a significant collection of margin in the 1st half of 2009, in the presence of a fall of electricity forward prices; an increase of volume of short-term securities; a fall of trade receivables). Year on year, advance payment of income tax is lower by CZK 1.6 billion. Year on year cash flows from investing activities fell by CZK 15.0 billion, primarily because of the lower acquisitions of subsidiaries, associates and joint ventures, which were CZK 7.0 bn lower. Also due to loans made, which were CZK 9.8 bn lower and due to an increase of loan repayments of CZK 4.9 bn(primarily repayment of the loan for the acquisition of MIBRAG). By contrast, higher additions of fixed assets by CZK 5.1 bn and increase of cash on restricted accounts by CZK1.2 bn contributed to the growth the cash used in investing activities.Cash available after the payment of investments was 3.3 billion CZK lower as a result of the aforementioned influences.

1818
NO CHANGE IN EXPECTED 2010 RESULTS
2008Q1
2008Q2
2008Q3
2008Q4
2009Q1
2009Q2
2009Q3
2009Q4
2010Q2
2010Q1
0
5
10
15
20
25
30
35
CEZ Group EBITDA(billions CZK)
Share of H1in 2008 55% of annual EBITDA
in 2009 56.9% of annual EBITDA
in 2010 53.2% of expected annual EBITDA
Share in of H2in 2008 45% of annual EBITDA
in 2009 43.1% of annual EBITDA
in 2010 46.8% of expected annual EBITDA
Key specific factors influencing EBITDA which is lower in the H1 than in the H2 of 2010
Reversal of the provision for CO2 allowances in Q1 2010, expected creation of a new provision only at the end of 2010.
Time discrepancy between distribution revenues and expenditures related to compulsory purchase of electricity from renewable sources. In view of the substantial growth of electricity generation by photovoltaic power plants, there is a risk of a negative impact on expected results of CZK 1 -2 bn.
The maintenance of generation, distribution and mining installations is adversely affecting mainly Q2 and Q3.

1919
AGENDA
Financial highlights and key events in CEZ group in H1 2010Martin Novák, CFO
Financial resultsMartin Novák, CFO
Trading position of CEZ GroupAlan Svoboda, Executive Director, Sales and Trading

20
‐10%
‐5%
0%
5%
10%
I‐08II‐
08III‐
08IV
‐08V‐08VI
‐08VI
I‐08
VIII‐0
8IX‐
08X‐08XI‐
08XII
‐08I‐0
9II‐
09III‐
09IV
‐09V‐09VI
‐09VI
I‐09
VIII‐0
9IX‐
09X‐09XI‐
09XII
‐09I‐1
0II‐
10III‐
10IV
‐10V‐10VI
‐10
20
YEAR ON YEAR CONSUMPTION OF ELECTRCITY IN THE CZECH REPUBLIC IS GROWING AGAIN
Consumption in CZ(temperature adjusted)**
TWh
* 1-5 by ERO, 6 estimate of ČEZ, a. s. ** adjustment to normal temperature according to ČEZ, a. s. model *** ERO source for 1-5/2010
29.04 29.96*28.98 30.22*
Consumption in CZ
TWh
+3.2%
Development of consumption by different segments:***
+5.6% wholesale customers+1.8% households+3.2% entrepreneurs
Absolute monthly year on year indices of consumption in the Czech Republic (temperature and calendar adjusted)
H12009
H12010
H12009
H12010
Consumption of electricity in CZ was adversely affected by the economic crisis primarily last year.Data since January 2010 once again show a year on year growth.
+4.3%

2121
Generation from ČEZ a.s. own sources in TWh (gross)
YEAR ON YEAR GENERATION FROM CEZ A.S. OWN SOURCES IN H1 2010 GREW BY 3.8% AND GROWTH FOR THE WHOLE OF 2010 IS EXPECTED TO REACH 7.7 %
+0.6%
+18.7%
+6.9%
Coal-fired power plants
Nuclear power plants
Hydro power plants
+3.8% 31.530.3
Year on year growth of generation by nuclear power plants by 6.9%. H1 2009 was influenced by extended planned outages.Year on year growth of the generation of electricity from hydro plants by 18.7% was primarily due to low water levels in January and February 2009 and due to higher rainfall in Q2 2010.Only moderate growth of generation by coal-fired power plants is due to the greater volume of planned outages in the first half of 2010. Higher expected level in second half of the year is moreover attributable to last year’s higher breakdown rate.
2009 2010 E
+11.5%
-8.0%
+4.1%
+7.7% 64.559.9
source:ČEZ, a. s.
I. half2009
I. half2010
Optimisation will continue if prices move (year on year change is primarily driven by plants dispatched at higher prices).16.0 16.1
13.7 14.7
0.60.7
0
7
14
21
28
35
31.5 35.1
27.228.3
1.11.0
0
15
30
45
60
75
H1 H1

22
8.67.3
2.8
3.0
0
2
4
6
8
10
12
External customers
ČEZ, a. s.
2222
YEAR ON YEAR COAL PRODUCTION BY SEVEROČESKE DOLYHAS FALLEN, BUT WE EXPECT AN INCREASE IN 2010 AS A WHOLE
H12009
Mining of coal in millions of tonnes11.4 -10.2%
Despite the year on year fall in the sales of coal in the 1st half of 2010 (effect of lower demand by ČEZ, a. s.) Severočeské doly expect a year on year growth in 2010 as a whole.
Severočeské doly recorded a moderate improvement in sales to outside customers.
The share of Severočeské doly on the supply of brown coal to ČEZ, a. s. is stable.
2010 E2009
SD share of overallsupply of brown coal to
ČEZ, a. s.10.3
2010 E
source:ČEZ, a. s.
2009H12010
22.0 23.2
+6.2%
-15.6%
+5.2%
+1.6%
+6.4%
62% 62%
0%
10%
20%
30%
40%
50%
60%
70%
16.5 17.5
5.55.7
0
5
10
15
20
25

23
0%
25%
50%
75%
100%
2011 2012 2013
23
ČEZ, A. S., CONTINUES TO HEDGE SALES OF ELECTRICITY IN THE MID-TERM IN A STANDARD MANNER
Share of hedged supplies from ČEZ, a. s. sources(at July 31, 2010; 100% equals 55 - 60 TWh)
ČEZ, a. s., uses a standard concept of hedging its open positions stemming from the generation portfolio against price-related risks.In the context of this strategy, ČEZ, a. s. sells electricity on a forward basisfor years Y+1 to Y+3 and hedges the currency for Y+1 to Y+4.
~24%
~68%
~22%
~8%
Hedged volume at Apr 30, 2010Hedged volume from Apr 30, 2010 to July 31, 2010
~4%
source:ČEZ, a. s.
Transaction currency hedging (hedge accounting)
Natural currency hedging – costs, investment and other expenses, debts in EUR (hedge accounting)
~4%
Hedged in total(from generation) 90% 32% 8%

2424
RESULTS OF THE ACQUISITION CAMPAIGN FOR SUPPLIES OF NATURAL GAS TO HOUSEHOLDS CONFIRM THE GREAT INTEREST OF CUSTOMERS
In 10 weeks we gained over 23,000 customers among employees and general public.
66 %
11 %
13 %
10 %Call centre
Internal communication systems
CorrespondenceCustomer
centres
322 1,8274,481
7,4029,742
12,508 13,35216,251
19,74823,636
0
5,000
10,000
15,000
20,000
25,000
Week21
Week22
Week23
Week24
Week25
Week26
Week27
Week28
Week29
Week30
Period
Num
ber o
f con
trac
ts
Contracts by method of their conclusionTotal of new contracts resulting from marketing campaign for acquisition of new natural gas customers
From July 19 it is possible to conclude a new contract for the supply of gas even through
10 contractual partners.
25
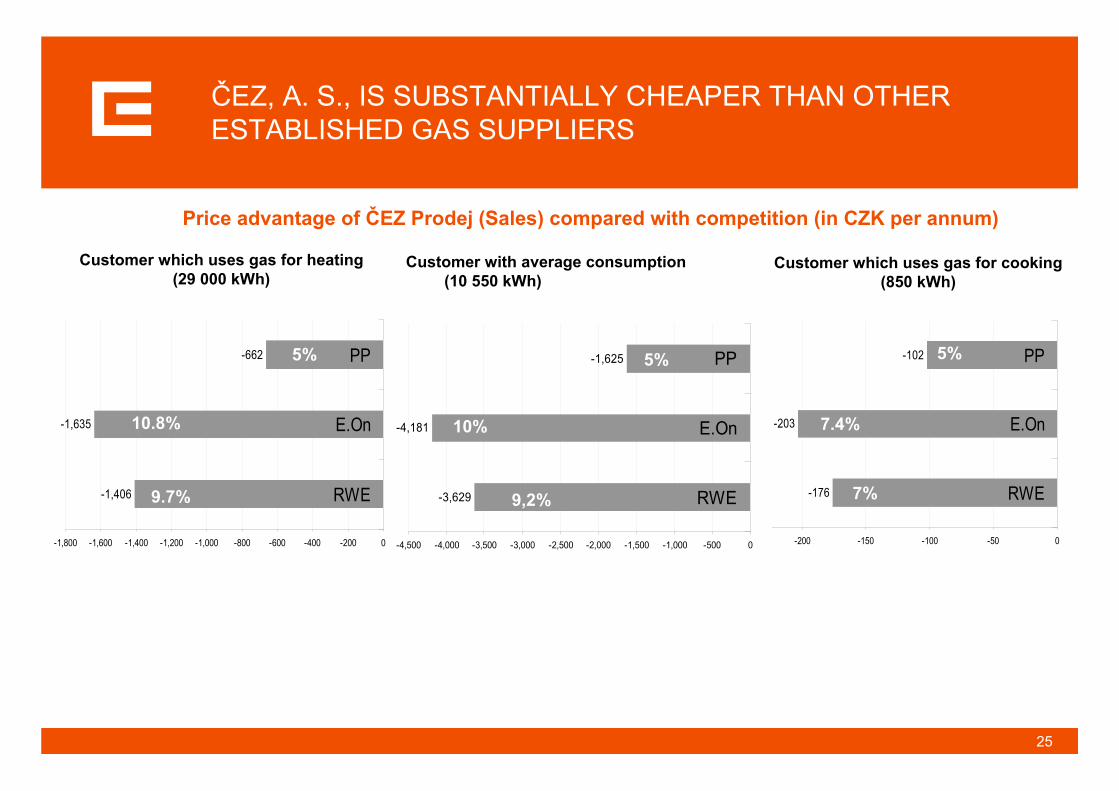
ČEZ, A. S., IS SUBSTANTIALLY CHEAPER THAN OTHER ESTABLISHED GAS SUPPLIERS
-1,406
-1,635
-662
-1,800 -1,600 -1,400 -1,200 -1,000 -800 -600 -400 -200 0
RWE
E.On
PP
-176
-203
-102
-250 -200 -150 -100 -50 0
RWE
E.On
PP
9.7%
10.8%
5% 5%
7.4%
7%
Price advantage of ČEZ Prodej (Sales) compared with competition (in CZK per annum)
Customer which uses gas for heating(29 000 kWh)
Customer which uses gas for cooking(850 kWh)
-3,629
-4,181
-1,625
-4,500 -4,000 -3,500 -3,000 -2,500 -2,000 -1,500 -1,000 -500 0
RWE
E.On
PP
10%
9,2%
Customer with average consumption(10 550 kWh)
5% 5% 5%

26
ČEZ, A. S., IS SUBSTANTIALLY CHEAPER EVEN FOR THE SUPPLY OF ELECTRICITY IN THE TERRITORY OF THE COMPETITORS
1,509
1,103
824
753
743
722
693
624
372
32
2,582
2,726ČEZ Basic
ČEZ Comfort
CENTROPOL ENERGY
BOHEMIA ENERGY Ostošest
RWE
BOHEMIA ENERGY ON-LINE
České Energ. Centrum
CENTROPOL BLIK
BOHEMIA ENERGY BASIC
BICORN
České Energ. Centrum Euro
E.ON
PRE distribution territory- annual saving compared with PRE
KOMFORT AKU 8 (in CZK per annum)
2,046
1,538
1,506
1,446
1,363
820
751
415
399
2,550
2,694
-32
ČEZ Basic
ČEZ Comfort
BOHEMIA ENERGY Ostošest
CENTROPOL ENERGY
BOHEMIA ENERGY ON-LINE
BOHEMIA ENERGY BASIC
BICORN
RWE
CENTROPOL BLIK
České Energ. Centrum Euro
České Energ. Centrum
PRE
E.ON distribution territory- annual saving compared with E.ON
Elektřina Aku (in CZK per annum)
NoteModel example– tariff D26d, circuit breaker value 3x25A – 3x32A inc., annual consumption 1.9 MWh in high tariff, 8.1 MWh in low tariff Prices are in CZK including VAT, but excluding activation charges.