presented by california department of forestry mark rosenberg
DESCRIPTION
Condition of Forests in San Diego County: Recent Conifer Tree Mortality and the Institutional Response. Presented by California Department of Forestry Mark Rosenberg. Visit our web site at: http://frap.cdf.ca.gov or http://www.fs.fed.us/r5/rsl/projects/mapping/zone-map.shtml. Tree Mortality. - PowerPoint PPT PresentationTRANSCRIPT
Condition of Forests in San Diego County: Recent Conifer Tree Mortality and the
Institutional Response
Presented byCalifornia Department of Forestry
Mark Rosenberg
Visit our web site at: http://frap.cdf.ca.gov or http://www.fs.fed.us/r5/rsl/projects/mapping/zone-map.shtml
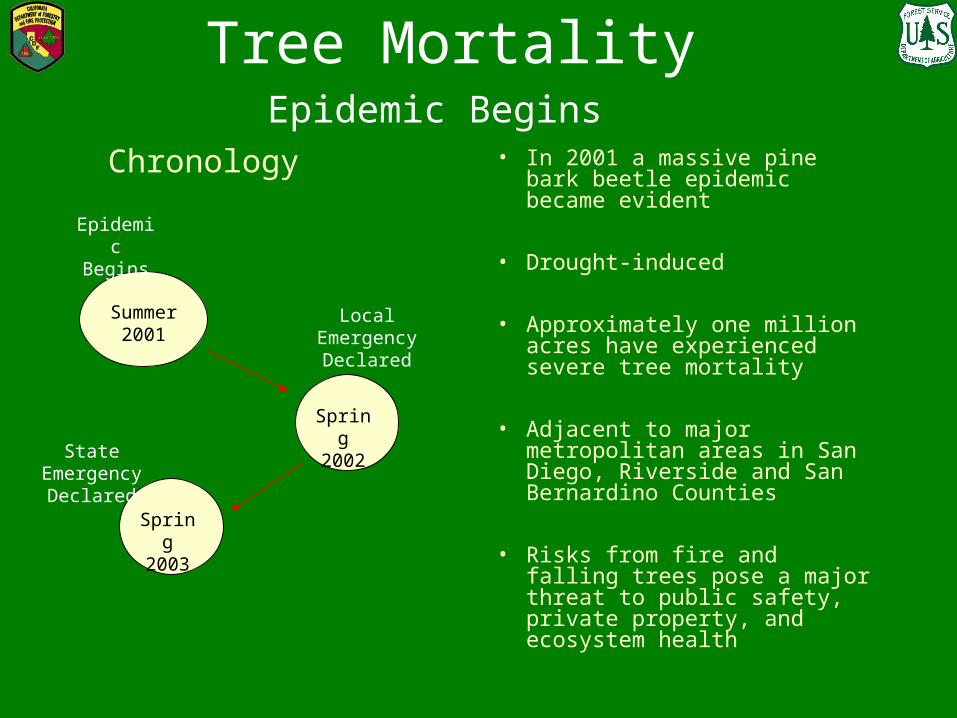
Epidemic Begins• In 2001 a massive pine bark
beetle epidemic became evident
• Drought-induced
• Approximately one million acres have experienced severe tree mortality
• Adjacent to major metropolitan areas in San Diego, Riverside and San Bernardino Counties
• Risks from fire and falling trees pose a major threat to public safety, private property, and ecosystem health
Summer 2001
Spring 2002
Spring 2003
Epidemic Begins
Local Emergency Declared
State Emergency Declared
Chronology
Tree Mortality

Examples of Tree Mortality as of April 2003
Tree Mortality
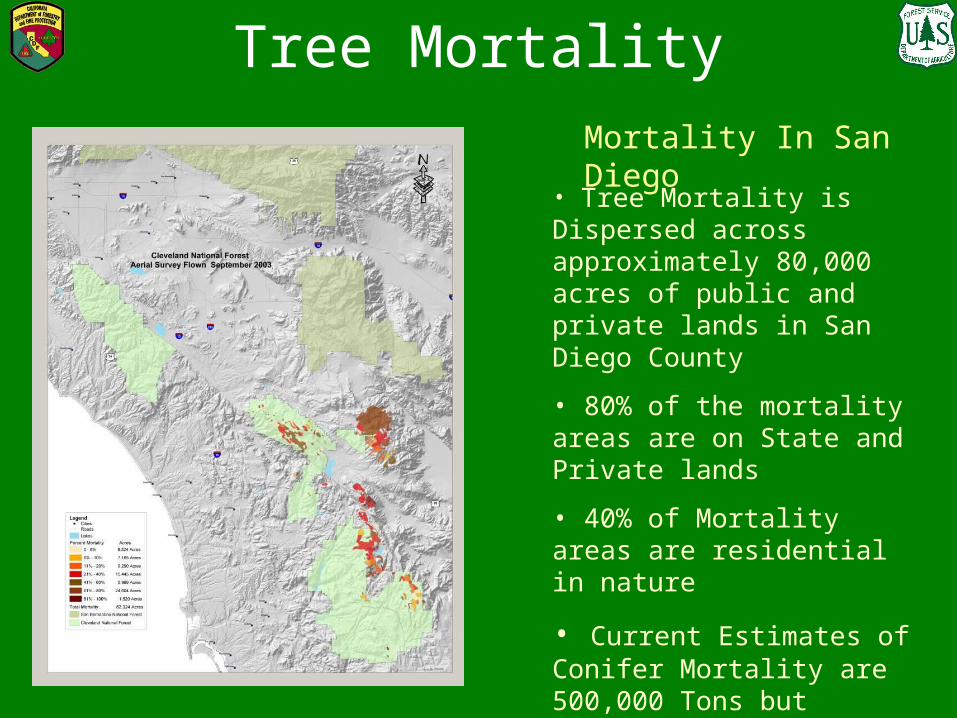
• Tree Mortality is Dispersed across approximately 80,000 acres of public and private lands in San Diego County
• 80% of the mortality areas are on State and Private lands
• 40% of Mortality areas are residential in nature
• Current Estimates of Conifer Mortality are 500,000 Tons but projections suggest mortality could reach as high as 2 Million BDT
Mortality In San Diego

Challenges
• Too Many Hazard Trees to remove all at once
• Rapidly evolving forest mortality
• Increasing risk from falling trees and extreme fire events
• Increased ignition sources from falling trees and increased fuel loading from dying vegetation
• Many diverse assets at risk
• Many different entities with responsibilities and liabilities

How are the Agencies addressing these Challenges?
Public Response
• Forest Area Safety Taskforce (FAST) coordinating overall public and private response
• Identify and Prioritize areas for Tree Removal
• Federal Funding for Tree Removal activities (FS, NRCS, and others)
• New County Programs for Hazard Tree Removal and Fire Safe Clearance
Land Ownership
BLM
7%NPS
0%
Other Public
29%
Private
53%
USFS
11%
Public Response
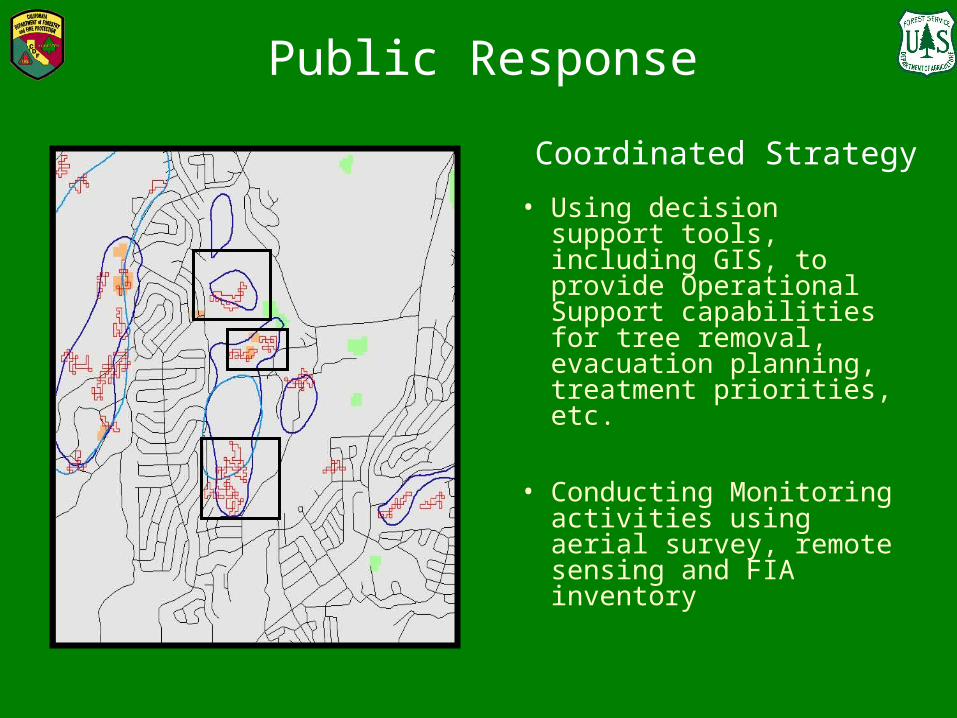
• Using decision support tools, including GIS, to provide Operational Support capabilities for tree removal, evacuation planning, treatment priorities, etc.
• Conducting Monitoring activities using aerial survey, remote sensing and FIA inventory
Coordinated Strategy
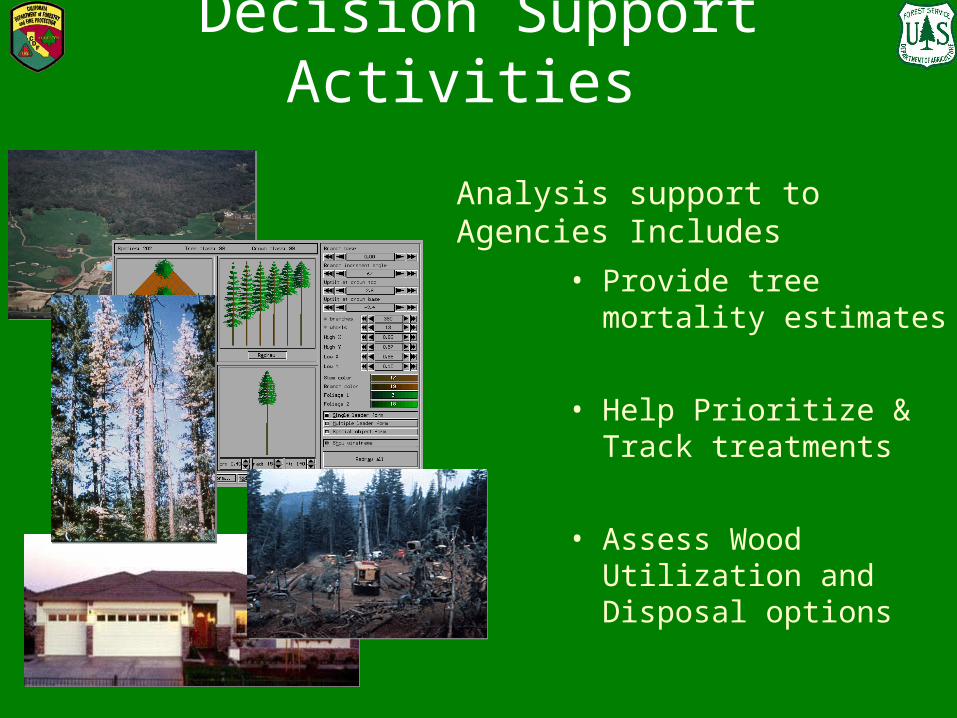
Decision Support Activities
• Provide tree mortality estimates
• Help Prioritize & Track treatments
• Assess Wood Utilization and Disposal options
Analysis support to Agencies Includes
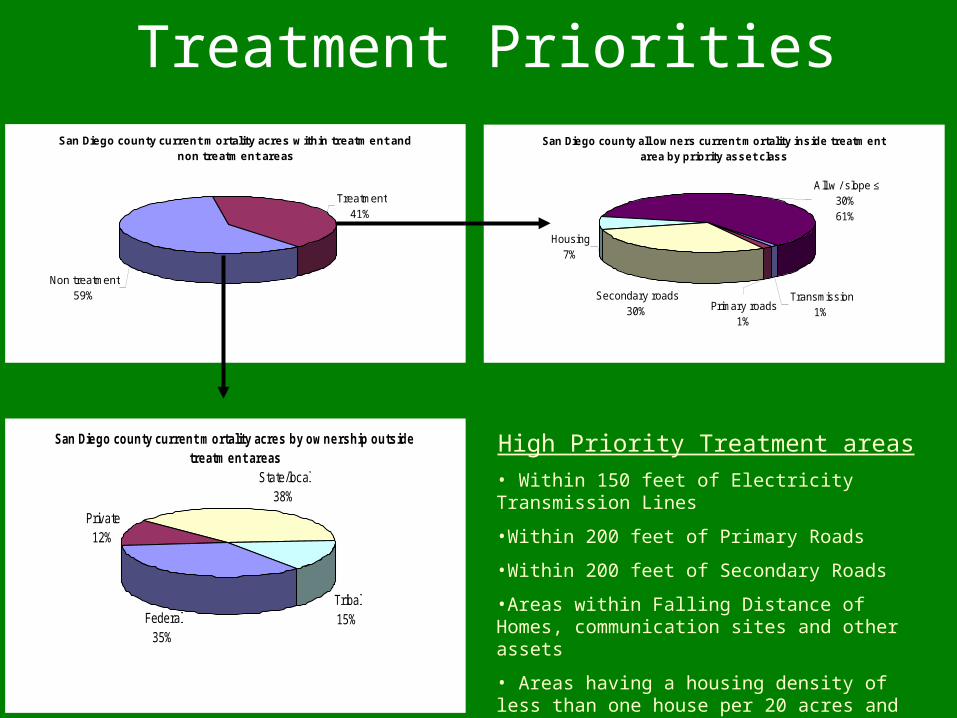
San Diego county all ow ners current m ortality ins ide treatm ent area by priority asset class
All w / slope ≤ 30%61%
Secondary roads30% Primary roads
1%
Housing7%
Transmission1%
San Diego county current m ortality acres w ithin treatm ent and non treatm ent areas
Treatment41%
Non treatment59%
Treatment Priorities
San Diego county current m ortality acres by ow nership outs ide treatm ent areas
Private12%
State/local38%
Tribal15%Federal
35%
High Priority Treatment areas
• Within 150 feet of Electricity Transmission Lines
•Within 200 feet of Primary Roads
•Within 200 feet of Secondary Roads
•Areas within Falling Distance of Homes, communication sites and other assets
• Areas having a housing density of less than one house per 20 acres and slopes less than or equal to 30%

Monitoring Forest Recovery
• Mapping Forest Mortality
• Assessing Impacts to Habitats
• Modeling Potential Fire Behavior
• Monitoring Forest Recovery Using Remote Sensing, GIS and Ground based inventories
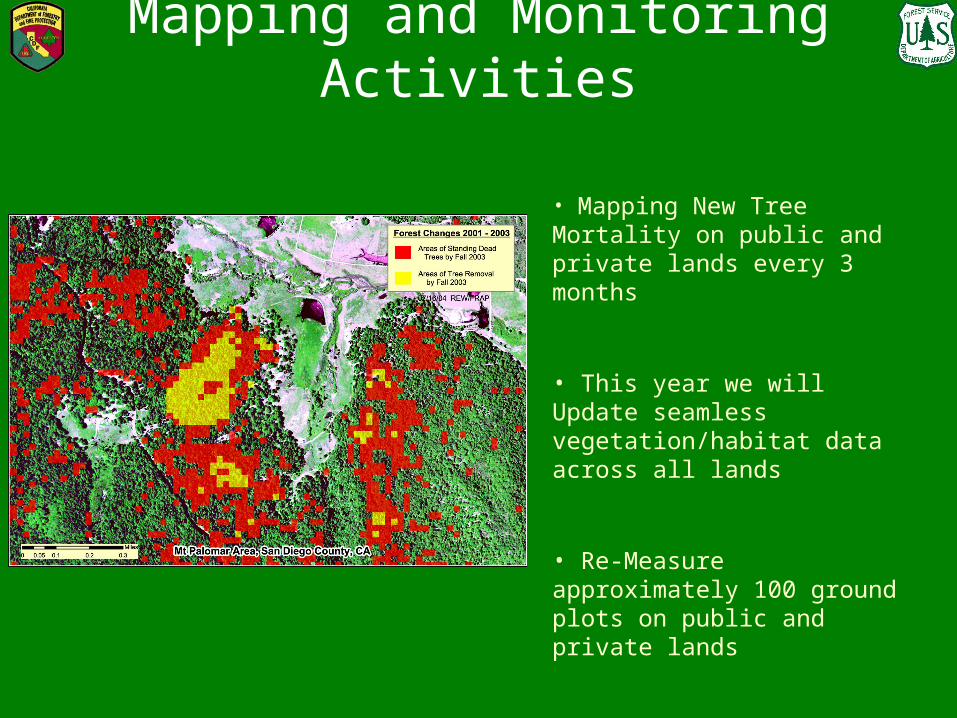
Mapping and Monitoring Activities
• Mapping New Tree Mortality on public and private lands every 3 months
• This year we will Update seamless vegetation/habitat data across all lands
• Re-Measure approximately 100 ground plots on public and private lands
• Assess impacts of mortality on key ecosystem Assets.
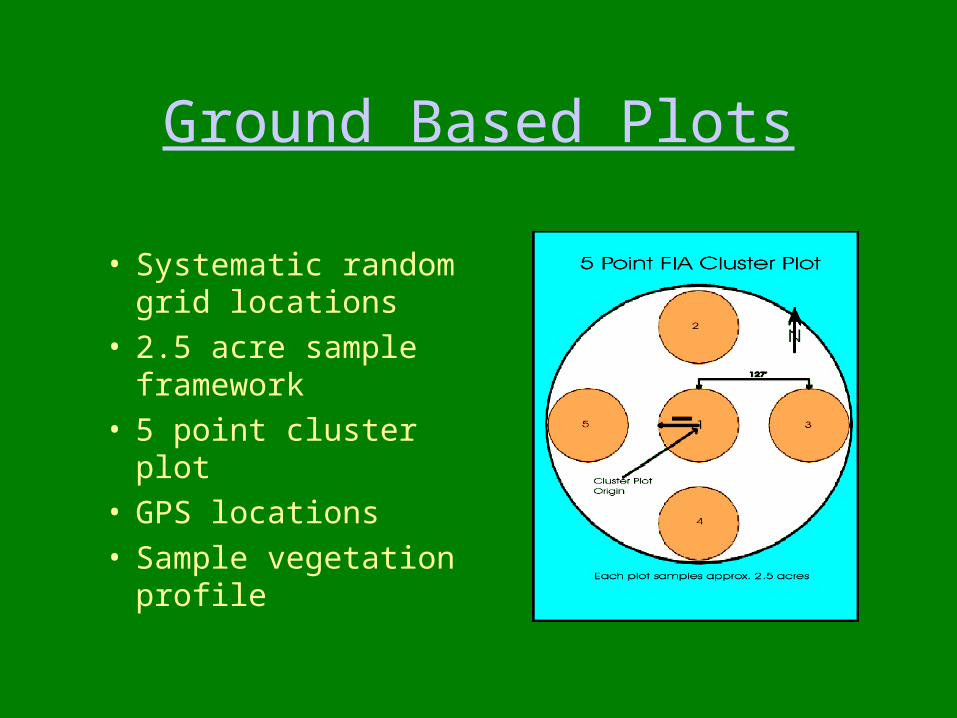
Ground Based Plots
• Systematic random grid locations
• 2.5 acre sample framework
• 5 point cluster plot• GPS locations• Sample vegetation
profile
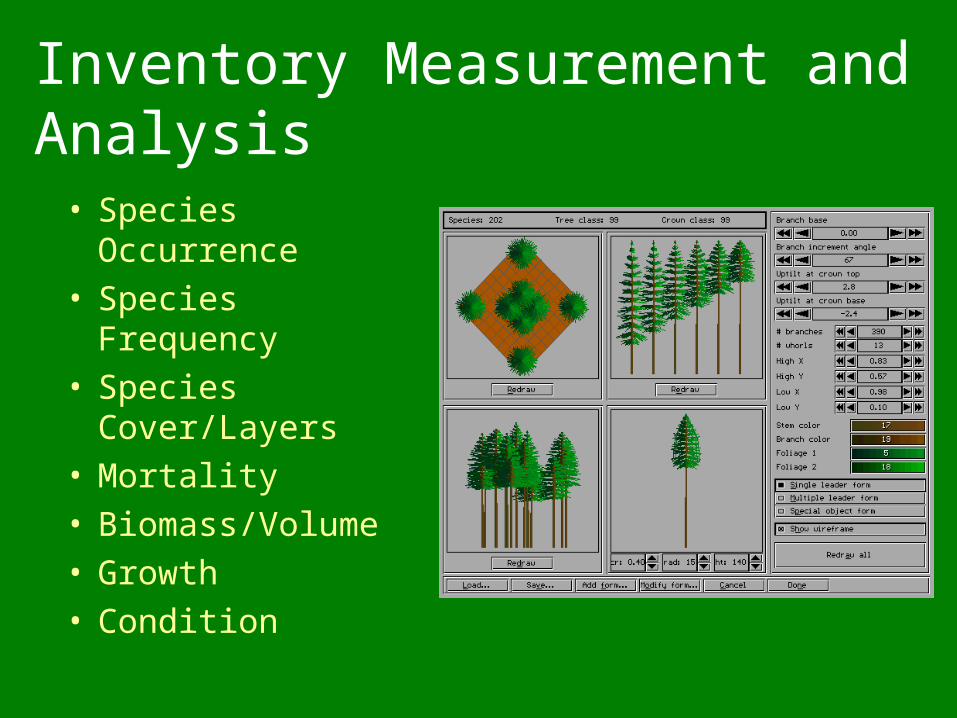
Inventory Measurement and Analysis
• Species Occurrence• Species Frequency• Species Cover/Layers• Mortality• Biomass/Volume• Growth• Condition

San Diego county habitat types
Grassland
6%
Desert Shrub
20%
Shrub
44%
Desert Woodland
0%Wetland
0%Agriculture
5%
Hardw ood
5%
Conifer
4%
Water
1%Urban
15% Barren
0%
Conifer 99,591
Hardwood 141,357
Shrub 1,154,758
Grassland 161,975
Desert Shrub 553,941
Desert Woodland 954
Wetland 7,831
Agriculture 146,783
Barren 6,904
Urban 416,363
Water 19,294
ALL 2,709,750
Habitat Total
Land Cover in San Diego County
San Diego county habitat types
Forest
9%
Shrub
44%
Grassland
6%
Urban/ other
22%
Desert
20%

Summary Remarks
• There is a critical need to treat ALL fire hazards in urban interface areas
• Forest Mortality, Shrub lands and Urban Areas are Intermingled with each other and therefore should be treated in an integrated fashion.
• Public will AND a Coordinated response is required
• Commitment to Long term Monitoring Needed
• Adaptive Management Practices Essential

Thank You
Contact Information
Visit our web sites at:
www.frap.cdf.ca.gov
www.fs.fed.us/r5/rsl/projects/mapping/zone-map.shtml
Mark Rosenberg
Email: [email protected]
Phone: (916)445-5366