presentation to ministry of transport 23 february 2016 ... · by airport •airfreight very ......
TRANSCRIPT

Airfreight Forecasting Presentation to Ministry of Transport
23 February 2016
By
Murray King and Richard Paling

Purpose of the Research
• Airfreight is component of freight transport task
• Although volumes are relatively small the values are high
• MoT therefore wishes to understand the sector. • Forecasts to complement those produced recently for air passenger forecasts
to provide complete picture

Nature of airfreight • Airfreight carried in a mixture of bellyhold capacity and dedicated
freighters • As belly hold capacity competing with passenger demands
• Passengers have priority and requirements may not be known much in advance
• Also climatic conditions may affect the capacity for freight • General uncertainty about capacity offered at any particular time • Differentiated pricing structure • Freighters supply more constant capacity but only part of market • But airfreight often used for demands arising in short term • Need to balance uncertain demands with uncertain capacity. • Impact of different plane types over longer term

Dedicated Freight Services
• Capacity on passenger services supplemented by dedicated freighter services • SIA as part of loop through Australia in both directions
• Qantas as loop mainly Sydney/Auckland/Christchurch /Sydney but with weekly route via Cairns to Hong Kong
• Tasman Air Cargo Auckland/Sydney (mainly for DHL but with space available for other cargoes)
• Because mainly operate in loops capacity available on any particular route segment again uncertain
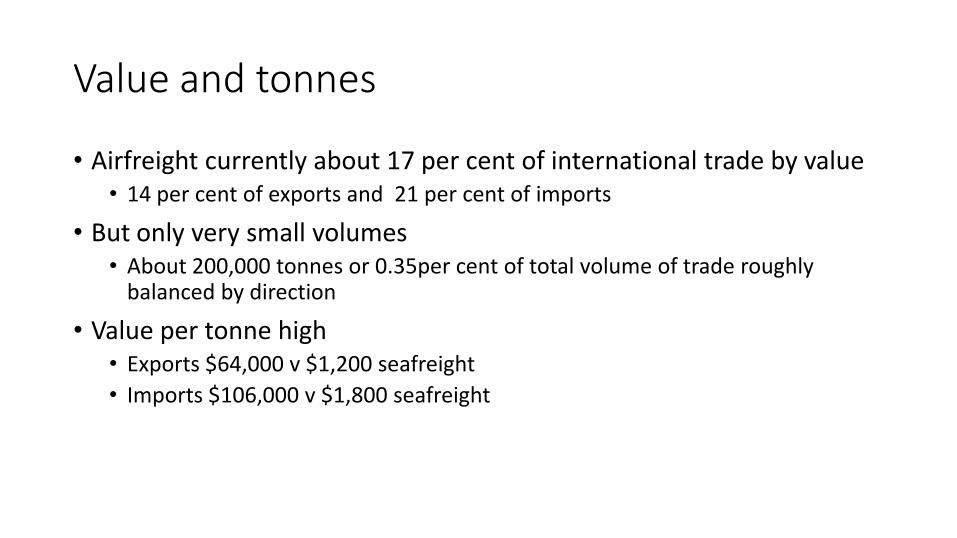
Value and tonnes
• Airfreight currently about 17 per cent of international trade by value • 14 per cent of exports and 21 per cent of imports
• But only very small volumes • About 200,000 tonnes or 0.35per cent of total volume of trade roughly
balanced by direction
• Value per tonne high • Exports $64,000 v $1,200 seafreight
• Imports $106,000 v $1,800 seafreight

Trends
0.00%
0.10%
0.20%
0.30%
0.40%
0.50%
0.60%
0.70%
0.80%
0.90%
Air
fre
igh
t as
sh
are
of
tota
l tra
de
by
we
igh
t
Total
Imports
Exports
• In tonnage terms volumes to or from NZ fairly flat from early 2000’s
• Declining proportion of total volumes although broadly fixed proportion of value
0
20,000
40,000
60,000
80,000
100,000
120,000
19
89
19
91
19
93
19
95
19
97
19
99
20
01
20
03
20
05
20
07
20
09
20
11
20
13
20
15
Ton
ne
s
Year to June
Imports
Exports

Comparison with international trends
0
0.5
1
1.5
2
2.5
3
Gro
wth
of
air
fre
igh
t 1
98
9 =
1
Air Freight Growth OECD Countries
Air Freight Growth NZ
• Growth in NZ similar to overall international position up to early 1990’s
• International traffic continued to increase
• NZ broadly static

Charges
• Airfreight competes with passengers for space
• But revenues per kg from passengers probably about 2.5 – 3.5 times higher than for airfreight
• Also competes with sea freight
• Although rates for both are very volatile, costs of airfreight may be 15-25 times higher than the costs for sea freight
• Differences define and constrain the market for airfreight

By airport
• Airfreight very much concentrated through Auckland • 94 per cent of imports • 79 per cent of exports
• Christchurch only other airport with significant volume
• Increasing concentration over time • reduction in freight flows through
other airports particularly Wellington
Auckland Airport 87.9%
Christchurch Airport 11.9%
Dunedin Airport
0.0%
Hamilton Airport
0.0%
not stated (air) 0.0%
Wellington Airport
0.3%

Commodity distribution - Exports
• Exports of airfreight dominated by basic commodities • Fish, meat and fruit and
vegetables
• Some are very specific in terms of markets and seasons • Pimentos to Japan
• Sour cherries to SE Asia
• Manufactured and other goods less than half the total
02 Meat 9%
03 Fish 19%
04 Dairy 6%
07 Vegetables
10% 08 Fruit
9%
84 Machinery
6%
All others 41%
Airfreight Exports by Commodity 2014

Commodity Distribution - Imports
• Imports display a wider spread of commodities
• High proportion of manufactured items
• Average value much higher than for exports
Airfreight Imports by commodity 2014 (tonnes)
5% 3%
3%
4%
2% 2%
6%
7%
3%
18% 12%
3%
3%
29%
07 Vegetables
08 Fruit
30 Pharmaceuticals
39 Plastics
42 Leather
48 Paper
49 Printed matter
61+62 Clothing
73 Iron/steel articles
84 Machinery
85 Electrical
87 Vehicles
90 Optical etc
All others

AKL exports -commodities, seasonality
• 84,722t (81% all NZ airfreight)
• Fish 16%, vegetables 12% fruit 9% dairy 7%, meat 7%
• 41% to Australia, 14% to China, 10% to Japan
• Focussed in the summer months; meat, fruit, fish sharply peaked
• Value: $5,140m (77% all NZ airfreight)
• Value per tonne: $60,661

Auckland: Export seasonality by destination
0
1000
2000
3000
4000
5000
6000
7000
8000
9000
10000
Jan Feb Mar Apr May Jun Jul Aug Sep Oct Nov Dec
Ton
ne
s p
er
mo
nth
Total Aus China Japan US SE Asia WE

CHC exports - commodities, seasonality
• 18,954t (18% of all NZ airfreight)
• Fish 32%, meat 20%, fruit 10%. dairy 6%, machinery 6%
• 37% to Australia, 11% to W Europe, 10% to China. N America, UK
• Summer peak; meat to UK , W Eur; Australia main market -flat
• Value: $1,541m (23% NZ airfreight)
• Value per tonne: $81,293 • Jet engines 34% of value

Christchurch: Export seasonality by destination
0
500
1000
1500
2000
2500
Jan Feb Mar Apr May Jun Jul Aug Sep Oct Nov Dec
Air
fre
igh
t ex
po
rts
pe
r m
on
th
(to
nn
es)
Total Aus WE China US UK SEA

Imports by airport and origin
0
5
10
15
20
25
Australia China Western Europe
North America
SE Asia United Kingdom
All others
Pe
r ce
nt
of
tota
l
Auckland Imports
Christchurch Imports

Imports: Commodities, seasonality: both airports.
• AKL dominates – 88,292 t (92% NZ airfreight). CHC 7,113t (7%) • Much lower volume than exports for CHC – not a constraint.
• Machinery/electrical main comm: AKL 30%, CHC 31% • Computers
• Clothing 7% AKL, 8% CHC
• Australia and China main origins (23% each) AKL
• Same CHC – 23% & 22%; Western Europe 21%
• Broadly even March-December, lower Jan -Feb
• Value: AKL $9186m CIF; CHC $595m
• Value per tonne: AKL $104,039; CHC $83,680

Understanding capacity • Need to understand whether lack of capacity is constraining demand
• Most freight is carried in bellyholds of passenger aircraft
• Passenger flight numbers only slight growth last ten years • Bigger aircraft though
• But not always have higher freight capacity
• Passenger numbers increased and load factor too.
• Freight availability depends on passenger demands (and operational issues)
• Analysis on monthly basis which may not reveal short-term issues

Explanation of capacity methodology • Two approaches: payload capacity and nominal capacity
• Payload: max payload less weight of pax and baggage (110kg), and then scaled by 75% to allow for low density products and difficulty of matching supply and demand for each flight. • Changes with pax load factor.
• Passenger numbers, seat capacity & aircraft type data from Sabre.
• Nominal: as per typical airline cargo allowance figures
• Some airlines use max payload as cargo capacity, others use the nominal allowance.
• Analysis of each AKL and CHC origin/dest by month and aircraft type.
• Nominal about two thirds of payload approach.
• Compared with actual export tonnages by month

Table 5.1 Freight capacity of aircraft serving New Zealand
Aircraft type Max Payload (t) Typical nominal freight capacity (t) Boeing:
B737 -700 17.0 1.5 B737-800 21.3 2 B747-400 63.9 14.1 B767-300 41.6 13 B777 -200 54.92 14 B777-300 64.0 23 B787 -800 43.3 14.3
Airbus: A320 16.6 2
A330-300 45.9 17 A340-300 30.8 9.2 A380-800 66.4 8
Sources: Max payload: Boeing “Airplane Characteristics for Airport Planning”, www.boeing.com; Airbus www.airbus.com, except A380. Nominal: airline websites

Table 5.6 Passenger load and freight capacity between Auckland and all airports served 2014
Month
From Auckland
Nominal capacity
To Auckland
Actual pax load
(t)
Payload capacity (t)
Capacity available for
freight.(t)
Exports to all destinations
(t)
Actual pax load (t)
Payload capacity (t)
Capacity available for
freight.(t)
Imports from all
origins (t)
Jan 41,295 74,439 24,858 8,106 17,641 42,268 74,314 30,565 6,089 Feb 34,936 62,602 20,750 7,785 14,782 35,737 62,441 25,910 5,773 Mar 36,765 66,309 22,158 8,352 15,493 33,997 66,309 29,964 7,110 Apr 36,655 64,925 21,203 6,668 14,816 33,070 64,925 29,935 6,734 May 33,388 62,922 22,151 6,235 14,753 31,818 62,922 28,803 7,396 Jun 32,451 63,250 23,099 5,890 14,734 31,834 63,250 28,914 7,467 Jul 36,244 69,734 25,118 6,235 16,530 36,871 69,734 30,246 7,850
Aug 34,801 67,134 24,250 5,680 15,869 34,550 67,134 29,711 7,679 Sep 34,885 64,885 22,500 5,737 15,415 35,328 64,885 27,706 8,022 Oct 36,272 67,919 23,735 6,935 16,350 39,547 67,919 28,041 8,385 Nov 35,995 63,654 20,744 8,618 15,529 37,296 63,654 26,463 8,137 Dec 41,339 75,274 25,452 8,480 18,252 43,283 75,274 31,290 7,651
Total 435,025 803,048 276,017 84,722 190,162 435,598 802,763 347,549 88,292
Source: Sabre and consultant analysis
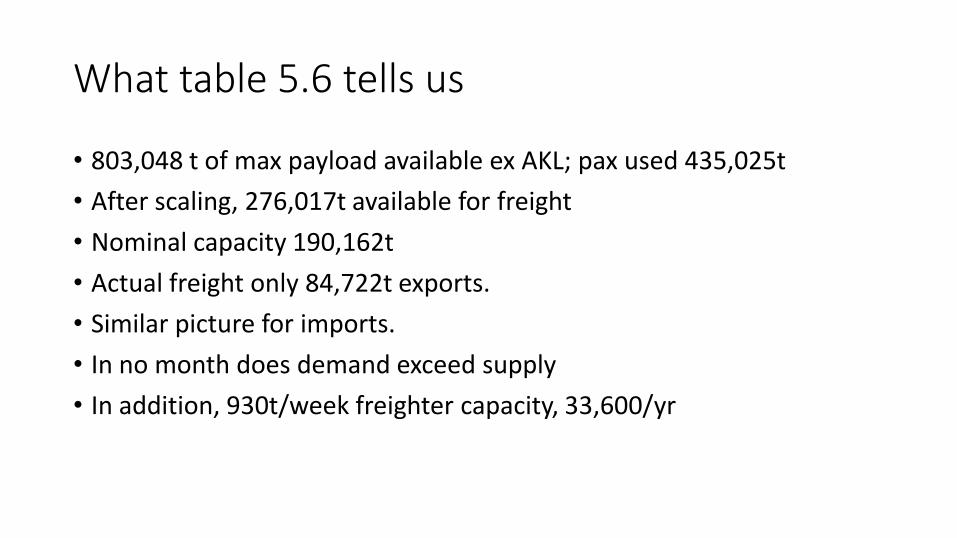
What table 5.6 tells us
• 803,048 t of max payload available ex AKL; pax used 435,025t
• After scaling, 276,017t available for freight
• Nominal capacity 190,162t
• Actual freight only 84,722t exports.
• Similar picture for imports.
• In no month does demand exceed supply
• In addition, 930t/week freighter capacity, 33,600/yr

Table 5.9 Passenger load and freight capacity between Christchurch and all airports served 2014
Month
From Christchurch
Nominal Capacity
To Christchurch Actual
pax load (t)
Payload capacity
(t)
Capacity available
for freight.(t)
Exports to all
destinations (t)
Actual pax
load (t)
Payload capacity
(t)
Capacity available
for freight.(t)
Imports from all origins
(t) Jan 6,580 10,651 3,053 2,249 2,137 6,480 10,651 3,128 542 Feb 4,904 8,424 2,640 1,640 1,749 4,924 8,424 2,625 464 Mar 5,579 9,446 2,900 1,662 1,950 5,242 9,446 3,153 586 Apr 5,613 9,184 2,678 1,648 1,888 5,237 9,184 2,960 556 May 4,821 8,421 2,700 1,569 1,691 4,604 8,421 2,863 637 Jun 4,530 8,076 2,660 1,273 1,630 4,477 8,076 2,699 563 Jul 5,370 9,035 2,749 1,582 1,765 5,462 9,035 2,680 603
Aug 5,081 8,815 2,801 1,302 1,739 5,172 8,815 2,732 597 Sep 4,913 8,617 2,778 1,207 1,694 5,165 8,617 2,589 672 Oct 5,575 9,164 2,692 1,282 1,785 5,681 9,164 2,612 650 Nov 5,752 9,171 2,565 1,670 1,746 5,731 9,171 2,580 633 Dec 7,459 11,929 3,353 1,868 2,441 7,432 11,929 3,373 610
Total 66,175 110,932 33,568 18,952 22,213 65,606 110,932 33,995 7,113 Source: Sabre and consultant analysis

What does table 5.9 tell us
• On annual basis, supply still exceeds demand
• In January supply is less than demand on nominal but not payload basis; • Summer peak for meat
• If ignore tourist destinations, available capacity reduces by 5%; November becomes tight
• But a freighter service provides about 170t a week capacity to Sydney • 8400t per year, additional to the bellyhold figures above
• But potential shortages on particular flights

Forecasting - General
• The nature of airfreight and the recent patterns of flows make forecasting very difficult • Volatility of market
• Competition from seafreight • Price
• Changes in technology
• Other changes in technology
• Volatility and lack of growth of particular commodity flows
• Forecasts tentative

Forecasting - Imports
• Flows dominated by manufactured goods
• Volumes have been flat over recent years
• Very little growth in imports
• Assumed this will continue in the future
0
10000
20000
30000
40000
50000
60000
70000
80000
2007 2009 2011 2013 To
nn
es
pe
r ye
ar
Livestock Meat Fish Milk and dairy Horticulture Manufactured and retail Other ag and fish Other Pharmaceuticals Textiles and apparel

Forecasting – Imports (2)
0
20000
40000
60000
80000
100000
120000
2005 2010 2015 2020 2025 2030
Ton
ne
s p
er
year
Livestock Meat Fish Milk and dairy Horticulture Manufactured and retail Other ag and fish Other Pharmaceuticals Textiles and apparel Total Imports
Actual and forecast growth of air freight imports 2007-2030

Forecasting Exports
• Similar procedure as for imports
• Look at recent patterns of flows
• Potential for growth in specific commodities
• Volatility of flows with limited overall growth • Forecasting again difficult
0
5000
10000
15000
20000
25000
30000
35000
40000
2007 2008 2009 2010 2011 2012 2013 2014
Ton
ne
s p
er
year
Livestock Meat Fish Milk and dairy Horticulture Manufactured and retail Other ag and fish Other Pharmaceuticals Textiles and apparel

Forecasting Exports 2
• Overall export forecasts therefore give growth of about 0.4 per cent per year
• Export flows in 2030 about 7 per cent higher than in 2014 0
50000
100000
150000
2005 2010 2015 2020 2025 2030
Ton
ne
s p
er
year
Livestock Meat
Fish Milk and dairy
Horticulture Manufactured and retail
Other ag and fish Other

Conclusion
• Airfreight important share of NZ trade by value
• However flows in volume terms very small
• Little overall growth in recent years but volatility from year to year in total and by commodity
• Under pressure from competition with passengers and with seafreight
• Growth in future therefore likely to be limited
• On basis of analysis assume • no growth in volume of imports • Only limited growth in volume of exports
• Difficulty of forecasting means these must be only tentative

Questions