presentation to investors dec 2010 - cge
TRANSCRIPT

Presentation to Investors
As of Dec. 2010

Grupo CGE One of the most important energy groups in Chile
• More than 105 years of history
• Development of long-term businesses, in key sectors
• Corporate Governance with a business view prevailing the strategic
development of its companies.
• Consolidated Group has grown strongly in the past 10 years
• Group aware of its environment and new challenges
1

Grupo CGE
• Annual Revenues for US$ 4.3 billion and Ebitda of US$ 619 million consolidated
• Main electricity distributor in Chile (2.4 million clients)
• Relevant player in Chile in liquefied and natural gas distribution
• Our electricity and gas services reach more than half of total homes in Chile
• Since June 2009, present in electricity generation in the SIC
• Presence in Argentina in the electricity and natural gas distribution
• Recently participating in the distribution of liquefied gas in Colombia
2
In process of adaptation to changes in the environment and size
One of the most important energy groups in Chile
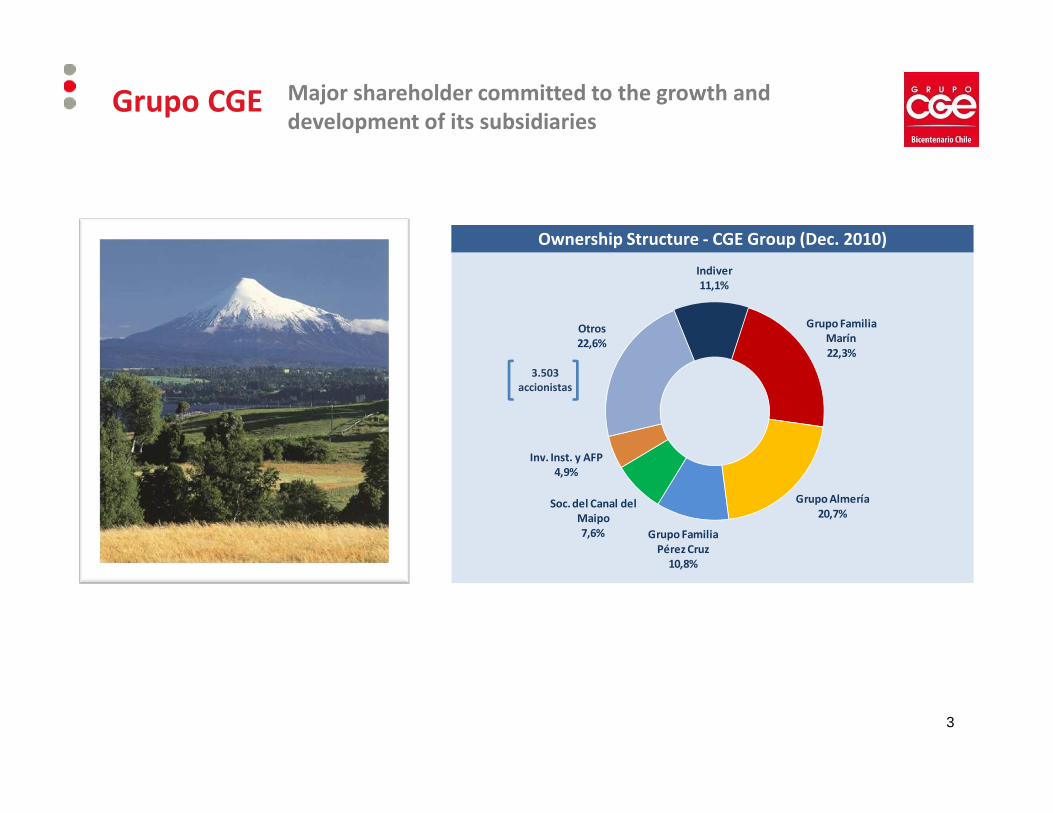
Grupo CGE Major shareholder committed to the growth and
development of its subsidiaries
3
3.503
accionistas
Indiver
11,1%
Grupo Familia
Marín
22,3%
Grupo Almería
20,7%
Grupo Familia
Pérez Cruz
10,8%
Soc. del Canal del
Maipo
7,6%
Inv. Inst. y AFP
4,9%
Otros
22,6%
Ownership Structure - CGE Group (Dec. 2010)

Electricity Distribution
in Chile
Electricity Transmission
Electricity Generation
ServicesLiquefied Gas
& Natural Gas
Electricity and Gas
Distribution in Argentina
Liquefied Gas Distribution in Colombia
Grupo CGE A Group with Focused and Strategic Business Units
4

0
500
1.000
1.500
2.000
2.500
3.000
3.500
4.000
1995
1996
1997
1998
1999
2000
2001
2002
2003
2004
2005
2006
2007
2008
2009
2010
Patrimonio Neto
Pasivos
Grupo CGE Taking opportunities for strategic growth
• More than US$ 3.6 billion invested during the past 10 years.
• CGE Groups invests around US$ 300 million a year for vegetative growth (capex).
• Ebitda has grown consistently.
Evolution of Consolidated Assets ($ billion)
5
Evolución of Consolidated Ebitda ($ billion)
0
50
100
150
200
250
300
1995
1996
1997
1998
1999
2000
2001
2002
2003
2004
2005
2006
2007
2008
2009
2010

Ebitda Consolidated Dec-10MM$ 289.671 (US$ 619 million)
Ebitda Electricity Sector Dec-10MM$ 159.882 (US$ 342 million)
Grupo CGE Ebitda (1) of Electricity Sector
(1) Operating Result + Depreciation + Amortization
(2) Figures for transmission only considers Transnet S.A.
6
43%
55%
2%
Electricity
Gas
Others
Distribution
63%
Transmission
29%
Generation
8%
(2)

• In terms of physical sales, CGE Group is the second player, distributing over 11,300 GWh per year in Chile.
• CGE Group is the leading player in terms of number of clients.
• In these same terms, CGE Group supplies to a significant portion of Chile’s population.
Grupo CGE
40,2%
Grupo CGE Electricity Distribution – Market position
7
Source: Empresas Eléctricas A.G.
Physical sales
CGE Distribución
23,1%
Otras Emp. Grupo
CGE
17,0%
Chilquinta
7,8%
Enersis
40,7%
Otros
2,2%
Saesa
9,1%
Grupo CGE
43,8%
CGE Distribución
24,4%
Otras Emp. Grupo
CGE
19,4%
Chilquinta
9,9%
Enersis
30,2%
Otros
3,2%
Saesa
12,9%
Number of Customers
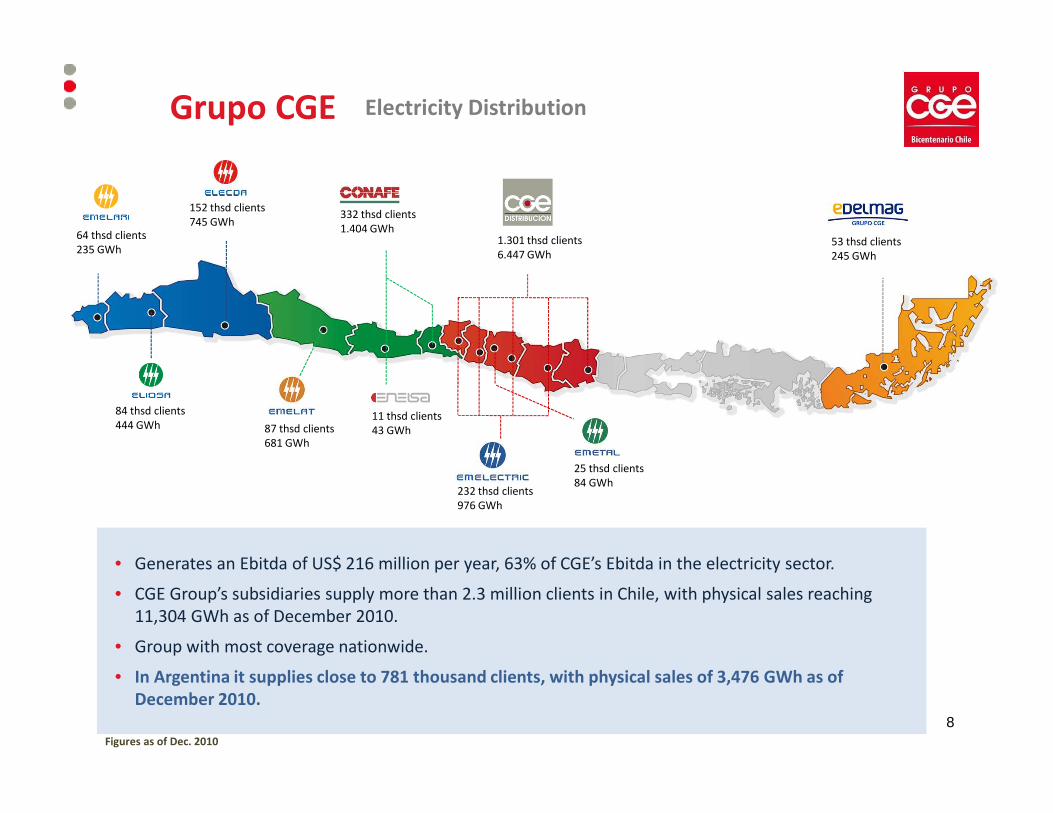
• Generates an Ebitda of US$ 216 million per year, 63% of CGE’s Ebitda in the electricity sector.
• CGE Group’s subsidiaries supply more than 2.3 million clients in Chile, with physical sales reaching 11,304 GWh as of December 2010.
• Group with most coverage nationwide.
• In Argentina it supplies close to 781 thousand clients, with physical sales of 3,476 GWh as of
December 2010.
Grupo CGE
332 thsd clients1.404 GWh
1.301 thsd clients6.447 GWh
53 thsd clients245 GWh
64 thsd clients235 GWh
84 thsd clients444 GWh
152 thsd clients745 GWh
87 thsd clients681 GWh
11 thsd clients43 GWh
232 thsd clients976 GWh
25 thsd clients84 GWh
8Figures as of Dec. 2010
Electricity Distribution

Grupo CGE Key figures of electricity distribution business in Chile
* Operating Result + Depreciation + Amortization
9
419478
711
1.175 1.1891.126
0
200
400
600
800
1.000
1.200
1.400
2005 2006 2007 2008 2009 2010
Grupo Emel
Edelmag
Conafe
CGE D
Evolution No. of Clients (thsd) Evolution of Physical Sales (GWh)
Operating Revenues ($ bn) Ebitda * ($ bn)
7.148 7.297
11.031 11.041 11.047 11.304
0
2.000
4.000
6.000
8.000
10.000
12.000
14.000
2005 2006 2007 2008 2009 2010
Grupo Emel
Edelmag
Conafe
CGE D
1.478 1.526
2.163 2.238 2.300 2.342
-
500
1.000
1.500
2.000
2.500
2005 2006 2007 2008 2009 2010
Grupo Emel
Edelmag
Conafe
CGE D
76 83
100
140
119
95
0
20
40
60
80
100
120
140
160
2005 2006 2007 2008 2009 2010
Grupo Emel
Edelmag
Conafe
CGE D
With the acquisition of Emel, CGE advanced its customer growth by 12 years.
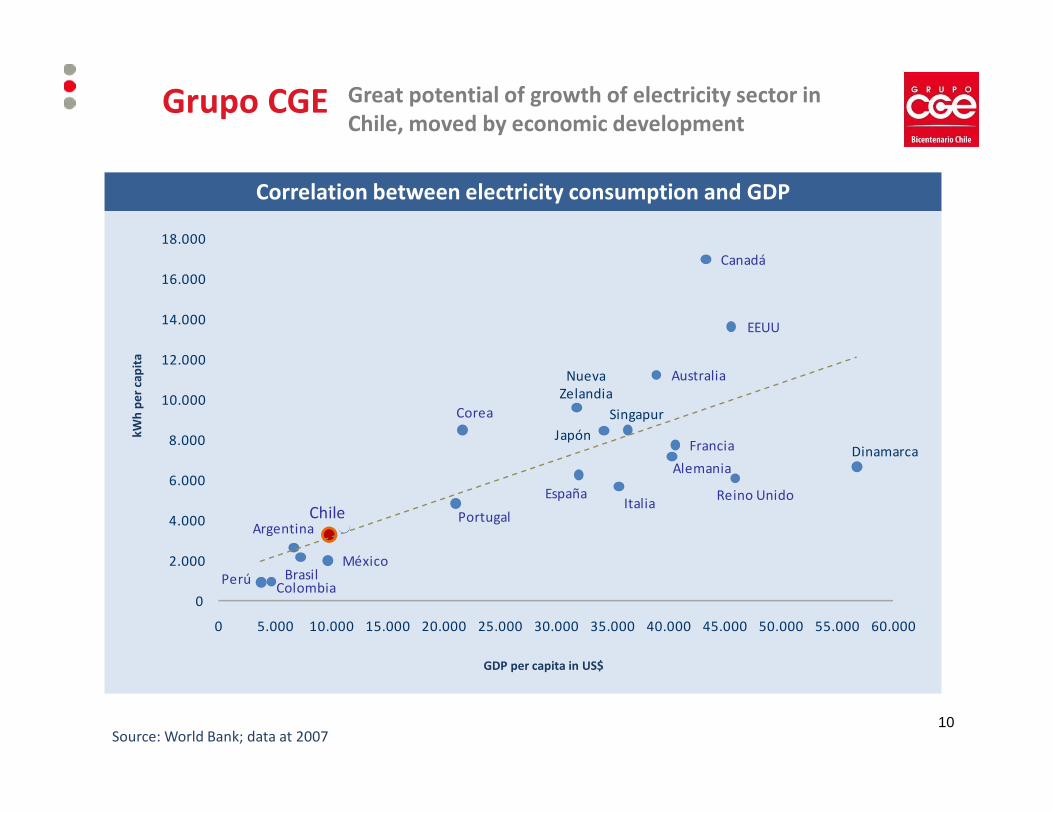
Source: World Bank; data at 2007
Grupo CGE Great potential of growth of electricity sector in
Chile, moved by economic developmentk
Wh
pe
r ca
pit
a
GDP per capita in US$
Correlation between electricity consumption and GDP
Argentina
Australia
Brasil
Canadá
Chile
Colombia
DinamarcaFrancia
Alemania
Italia
Japón
Corea
México
NuevaZelandia
Perú
Portugal
Singapur
España Reino Unido
EEUU
0
2.000
4.000
6.000
8.000
10.000
12.000
14.000
16.000
18.000
0 5.000 10.000 15.000 20.000 25.000 30.000 35.000 40.000 45.000 50.000 55.000 60.000
10

� We are recovering from stable growth of electricity demand
• 2008 – 2009 � economic crisis (-)
• 2010 � earthquake (-)
� 2009 effects of VAD tariff setting and of services non-related to electricity supply (-)
� 2010 effects of tariff setting for Related Services (-), earthquake (-), IT plataform
� 2011 we expect important growth of energy consumption
• GDP between 6% and 7% (+)
• Consumption growth (+)
• Low unemployment (+)
� Correlation between electricity consumption and GDP – We expect sustained growth of electricity consumption
� Our infrastructure is prepared to move along with future growth (+)
� Growth perspectives in Argentina with fixed tarifs for the coming five years (+)
� 1Q11 – Physical sales of electricity distribution in Chile +9,1% as a reference
Grupo CGE Electricity Distribution – Perspectives & Conclusions
11

• CGE Group is the 2nd player in Chile, with 3.485 kms of sub-transmission lines extended throughout great part of the country.
• This activity generates an Ebitda of US$ 120 million a year, becoming one of the most important businesses of the CGE Group.
• Main subsidiary in the sector Transnet, which total assets reach nearly US$ 890 million.
Grupo CGE Electricity Transmission ���� Strategic support for
electricity distribution
75 km lines
2.604 km lines8.749 GWh energy withdrawn (*)
4 km lines128 km lines
209 km lines
457 km lines
9 km lines
Empresas EMEL873 km lines
(*) Corresponds to energy withdrawn from the subtransmission system.
Figures as of Dec. 2010
12

Grupo CGE Transnet S.A. is the main subsidiary of CGE Group in
this activity
Energy Withdrawn (GWh)
(*) Operating Result + Depreciation + Amortization13
7.497
8.347 8.817 8.803 8.780 8.749
0
1.500
3.000
4.500
6.000
7.500
9.000
10.500
12.000
2005 2006 2007 2008 2009 2010
Operating Revenues ($ million)
34.086
40.149
46.984
55.316 59.805
62.516
0
10.000
20.000
30.000
40.000
50.000
60.000
70.000
80.000
2005 2006 2007 2008 2009 2010
Ebitda ($ million) *
24.857
29.286
34.332
40.428 43.565
46.769
0
10.000
20.000
30.000
40.000
50.000
60.000
2005 2006 2007 2008 2009 2010
Total Assets ($ million)
PCGA IFRS
153.993 179.685
201.042
234.456
359.796
415.923
0
50.000
100.000
150.000
200.000
250.000
300.000
350.000
400.000
450.000
2005 2006 2007 2008 2009 2010

� Stable business, highly specialized and strategic for CGE.
� Growth of this sector is correlated to the growth of the country.
� There is room to keep growing, beyond vegatative growth.
� Our infrastructured is prepared to face the future demand growth of electricity.
� 1Q11 – Withdrawal of energy + 20 %
Grupo CGE Electricity Transmission – Perspectives & Conclusions
14

Grupo CGE Electricity Generation
Potential growth through acquisitions and own
portfolio of proyects
• ENERPLUS (ex CGE GENERACIÓN) acquired from Iberdrola
100% of IBENER in June 2009.
• Total investment of US$ 294 million
• Two hydroelectric run-of-the-river power plants: Peuchén and
Mampil, with 84 MW and 49 MW of installed capacity.
• Repowering capacity to 140 MW
• Average generation of approximately 440 GWh/year.
• During 2010 Ebitda reached US$ 25 million.
IBENER
15

Grupo CGE Own projects of electricity generation
• CGE Group has 500 MW in own water rights.
� All projects are run-of-the-river power plants
• Most advanced project � Central Ñuble
� 136 MW of installed capacity
� Estimated average generation of 667 GWh/year
� Estimated investment of US$ 260 million.
� Construction to begin by late 2011
� Start-up: 2014
Projects
16

� One of the business units with most perspectives of growth for CGE Group
• Through own portfolio of projects � we have water rights (scarce resourse).
• A portfolio of projects is currently under studty.
• Sector growth algo through acquisitions.
• Chile needs more generation capacity, due to future demand growth and economic development.
Grupo CGE Electricity Generation – Perspectives & Conclusions
17

Consolidated Ebitda as of Dec-10MM$ 289.671 (US$ 619 million)
Ebitda Gas Sector as of Dec-10MM$ 124.223 (US$ 265 million)
Grupo CGE Ebitda (1) of Gas Sector
(1) Operating Result + Depreciation + Amortization
(2) Corresponds to the Ebitda of Gasmar
18
43%
55%
2%
Electricity
Gas
Others
Natural Gas
61%
Liquefied Gas
26%
Storage
Liquefied Gas
13%
(2)

• In this sector, CGE Group is one of the main players in Chile.
• Annual Ebitda generation in Chile of US$ 265 million, representing 43% of consolidated Ebitda.
• In Chile, we supply natural gas to more than 544 thousand customers.
• In Argentina, we distribute natural gas in the provinces of Salta, Jujuy, Tucumán and Santiago del Estero � 420 thousand customers.
• GASCO entered the Colombian market of liquefied gas distribution business through the brands VIDAGAS and UNIGAS.
Grupo CGE Distribution of natural and liquefied gas
19

Grupo CGE Key figures of our gas business
Number of clients NG Chile (thsd)
Physical sales LPG (thsd Tons) *
Physical sales NG Chile (Million m3)
Consolidated Ebitda Gasco ($ million) **
20
421 452
487 520 537 544
0
100
200
300
400
500
600
700
2005 2006 2007 2008 2009 2010
1.031 1.016
776
651
774
1.036
0
200
400
600
800
1.000
1.200
1.400
2005 2006 2007 2008 2009 2010
274 275
344 314
362 385
0
50
100
150
200
250
300
350
400
450
500
2005 2006 2007 2008 2009 2010
98.524 95.765 87.769
59.608
84.440
124.223
0
20.000
40.000
60.000
80.000
100.000
120.000
140.000
2005 2006 2007 2008 2009 2010
* Since 2010, we include physical sales in Colombia from Inversiones GLP, which reached 78,870 tons.
** Operating Result + Depreciation + Amortization

� Natural Gas
• Today we have certainty of supply � LNG terminal.
• Recovery of customers during the gas crisis � especially industrial customers.
• Electricity generators have consumed NG from the LNG Terminal in Quintero.
• We notice an important demand growth.
� Liquefied Gas
• Mature business with gradual growth expectations.
• Potential growth and expansion to other regions and countries.
• Important market share.
� Clean fuel
� GASCO promoting the use of gas as fuel for public and private transportation.
Grupo CGE Sector Gas – Perspectivas y Conclusiones
21

Grupo CGE Service activities
22(*) Operating Result + Depreciation + Amortization
ActivityEbitda *
$ million
(4.626)
7.464
3.437
2.618
1.428
1.716
Business focused on retail, call center
and satellite television
Company under development
Activities focused on IT and telecom
Supply and logistics services
Manufacturer of transformers and
electric equipment
Electricity services for distributors of
electricity
Management of CGE Group's real estate

65
75
94
107113
60
0
20
40
60
80
100
120
2005 2006 2007 2008 2009 2010
Grupo CGE Evolution of CGE Group’s Results
Ebitda ($ bn)*Operating Revenues ($ bn)
PCGA IFRS
Net Income ($ bn)
23
852 942
1.286
1.825 1.812
2.012
0
500
1.000
1.500
2.000
2.500
2005 2006 2007 2008 2009 2010
212 219 236
262 271
290
0
50
100
150
200
250
300
350
2005 2006 2007 2008 2009 2010
Total Assets ($ bn)
PCGA IFRS
1.702 1.802
2.578
3.014
3.411
3.762
0
500
1.000
1.500
2.000
2.500
3.000
3.500
4.000
2005 2006 2007 2008 2009 2010
(*) Operating Result + Depreciation + Amortization

Grupo CGE A Group with diversified businesses
24
Ebitda CGE Group (*) ($ bn)
• The diversification of our businesses has allowed us to maintain a sustained and increasing
trend of consolidated Ebitda throughout the years.
212 219236
262 271290
0
50
100
150
200
250
300
350
2005 2006 2007 2008 2009 2010
Ebitda otras invers. y Holding Ebitda Electricidad
Ebitda Gas Ebitda consolidado
(*) Operating Result + Depreciation + Amortization

Grupo CGE Financial Summary
25
CGE Consolidated Dec. Dec. Dec. 2009 Dec. 2010
($ billion) 2009 2010 MMUS$ MMUS$
Total Assets 3.411 3.762 6.726 8.038
Liabilities 2.092 2.299 4.125 4.913
Equity 1.319 1.463 2.601 3.125
Operating Revenues 1.812 2.012 3.573 4.298
Operating Result 186 197 367 421
Ebitda 271 290 535 619
Ebitda Margin 15,0% 14,4% 15,0% 14,4%
Net Income 113 60 223 128

Tenor
Debt by Currency Debt by Interest Rate
Grupo CGE Financial Debt Structure as of Dec. 2010 (*)
Debt by Type
26* Financial Debt as of December 2010 reached $ 1.763 billion (~ USD 3.8 billion)
Long-
term
80%
Short-
term
20%
UF/$
94%
Foreign
6%
Fixed
66%
Floating
34%
Banks
44%
Com.
Papers
4%
Bonds
52%

Grupo CGE Ratios financieros
27
Debt Coverage (1) Interest Coverage (2) Leverage (3)
(1) Financial Debt / Ebitda(2) Ebitda / Net Interest Expenses (3) Total Debt / Total Equity
5,765,46 5,35
4,334,60
0,00
1,00
2,00
3,00
4,00
5,00
6,00
7,00
2006 2007 2008 2009 2010
1,50
1,70
1,73
1,591,57
1,35
1,40
1,45
1,50
1,55
1,60
1,65
1,70
1,75
1,80
2006 2007 2008 2009 2010
3,7
5,2 5,5
5,7 6,0
0,0
1,0
2,0
3,0
4,0
5,0
6,0
7,0
2006 2007 2008 2009 2010

Main fundamentals:
Grupo CGE An Investment Grade Company
• Low risk and stable cash flows
• Geographic diversification of the Group’s businesses
• Main business operates under a consolidated regulatory framework
• Recovery and natural gas business due to the start-up of GNL Quintero
• Good access to the financial market
28
Local Rating Shares BondsCommercial
Papers
Feller-Rate Nivel 2 AA- AA-/Nivel 1+
Fitch Ratings Nivel 2 A+ A+/F1+
International RatingDebt
Local Currency
Debt
Foreign Currency
Standard & Poor's BBB- BBB-
Fitch Ratings BBB BBB
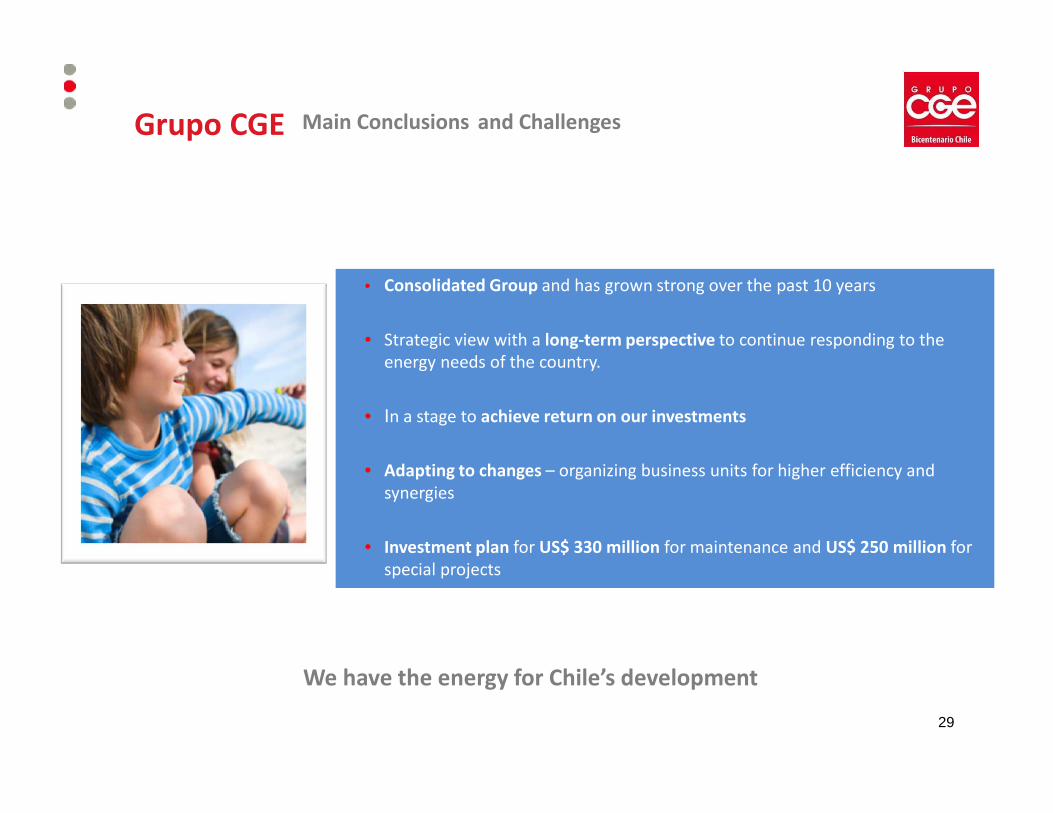
Grupo CGE Main Conclusions and Challenges
• Consolidated Group and has grown strong over the past 10 years
• Strategic view with a long-term perspective to continue responding to the energy needs of the country.
• In a stage to achieve return on our investments
• Adapting to changes – organizing business units for higher efficiency and synergies
• Investment plan for US$ 330 million for maintenance and US$ 250 million for special projects
29
We have the energy for Chile’s development