presentation to bondholders 17 april 2020
TRANSCRIPT

© Golar LNG Partners LP
Presentation to bondholders
17 April 2020
Updated version of the presentation to bondholders dated 1 April 2020

2
Disclaimer
© Golar LNG Partners LP
This presentation (the "Presentation") contains financial, operational, legal and other information concerning Golar LNG Partners LP ( “GMLP” or the “Company”), its subsidiaries and the combined
business of the group in which the Company is the parent (the “Group”). This Presentation (together with its enclosures and appendices) has been produced solely for use in the meeting of the holders of
the Company’s Senior Unsecured Bonds 2015/2020 (“GOLP02”) and the Company’s Senior Unsecured Bonds 2017/2021 (“GOLP03”) (collectively the “Bonds”) called for on 5 May 2020 (the
“Bondholder Meeting”). The Company has retained DNB Markets, a part of DNB Bank ASA, Nordea Bank Abp, filial i Norge, Danske Bank, Norwegian Branch and Skandinaviska Enskilda Banken AB
(publ) as advisors (collectively the “Advisors”) to assist in the process leading up to the Bondholder Meeting. The Presentation has been produced by the Company with assistance from the Advisors.
By attending the Bondholder Meeting where this Presentation will be presented or by reading the Presentation, you agree to be bound by the terms, conditions and limitations set forth in the following.
Any failure to comply with these may constitute a violation of applicable securities laws or may result in civil, administrative or criminal liabilities. This Presentation is for information purposes only and
does not constitute an offer or solicitation to acquire or invest in the Bonds in any jurisdiction or to any person nor is it intended to provide the basis for any credit or any other third party evaluation of the
Company, any securities previously issued by it, any securities which may be issued by it or any of its subsidiaries in the future or any related transactions. The Presentation should not be considered as
a recommendation to purchase or invest in the Bonds. The merits or suitability of investing in any securities previously issued or issued by the Company in the future must be independently determined.
Any such determination should involve, inter alia, an assessment of the legal, tax, accounting, regulatory, financial, credit, foreign exchange and other related aspects of the transaction in question for the
investor contemplating such an investment.
This Presentation has not been reviewed by or registered with any public authority or stock exchange. To the best of the knowledge of the Company and its board of directors, the information contained in
this Presentation is in all material respects in accordance with the facts as of the date hereof and contains no material omissions likely to affect its import. This Presentation contains information obtained
from third parties. As far as the Company is aware and able to ascertain from the information published by such third parties, such information has been accurately reproduced and no facts have been
omitted that would render the reproduced information inaccurate or misleading. However, neither the Company nor the Advisors make any representation or warranty of any sort as to the accuracy or
completeness of the information contained in this Presentation or in any other model or information made available in connection with the Bondholder Meeting or the reasonableness of the assumptions
on which any such information is based. No person shall have any right of action against the Company, the Advisors, any of their parent or subsidiary undertakings or any such person's directors,
officers, advisers or employees or any other person in relation to the accuracy or completeness of the information presented herein. The Advisors are acting for the Company and no one else in
connection with the Bondholder Meeting. The information contained in this Presentation is subject to amendments and/or completion without notice and such amendments may be material.
The Advisors have not independently verified the information contained in this Presentation through due diligence procedures or other external investigations. The Advisors shall have no liability,
contingent or otherwise, to a holder of the Bonds (a “Bondholder”) or any third parties, for the correctness, quality, accuracy, reliability, performance or completeness of the information provided herein,
and nothing contained herein shall be relied upon as a promise or representation whether as to past or future performance of the Company. This Presentation includes estimates and projections and
involve significant elements of subjective judgment and analysis. No representation or warranty (express or implied) are made as to, and no reliance should be placed on the accuracy of such estimates,
projections, targets and/or opinions contained herein or that all assumptions relating to such estimates or projections have been considered or stated or that such projections will be realized. In no event
will the Advisors or the Company or any of their parent or subsidiary undertakings or any such person's officers or employees be liable as to any errors, omissions or misstatements, for any special, direct
or indirect, incidental or consequential damages which may be incurred or experienced on account of a Bondholder using the information provided herein.
This Presentation is strictly confidential and is being provided to the Bondholders only and has not been prepared with a view to public disclosure under applicable securities laws or otherwise. It may not
be reproduced (in whole or in part), distributed or transmitted to any other person without the prior written consent of the Company or the Advisors. No Bondholder shall be treated as a client of any of the
Advisors or be entitled to the protections afforded to their clients, solely by virtue of having received this Presentation. This Presentation is not intended for release, distribution, general publication to, or
use by any person or entity in any jurisdiction or country where such distribution or use would be contrary to local law or regulation or which would require any registration or licensing within such
jurisdiction or into Canada, Australia, Hong Kong, Japan or the United States of America. Any failure to comply with these restrictions may constitute a violation of law.
3
Disclaimer (cont’d)
© Golar LNG Partners LP
This Presentation speaks as of 17 April 2020. The information contained herein is subject to change, completion, or amendment without notice. There may have been changes in matters which affect the
Company subsequent to the date of this Presentation. Neither the delivery of this Presentation nor any further discussions of the Company with any of the recipients shall, under any circumstances,
create any implication that there has been no change in the affairs of the Company since such date. In furnishing this Presentation, the Advisors and the Company undertake no obligation to provide the
recipients with access to any additional information.
This Presentation shall be governed by Norwegian law. Any dispute arising in respect of this Presentation is subject to the exclusive jurisdiction of the Norwegian courts with the Oslo District Court as
legal venue.
Forward Looking Statements
This Presentation contains forward-looking statements, and which reflect the Company’s current expectations, estimates and projections about its operations. All statements, other than statements of
historical facts, that address activities and events that should, could or may occur in the future are forward-looking statements. Words such as “may,” “could,” “should,” “would,” “expect,” “plan,”
“anticipate,” “intend,” “believe,” “estimate,” “propose,” “potential,” “continue,” or the negative of these terms and similar expressions are intended to identify such forward-looking statements. These
statements are not guarantees of future performance and are subject to certain risks, uncertainties and other factors, some of which are beyond our control and are difficult to predict. Therefore, actual
outcomes and results may differ materially from what is expressed or forecasted in such forward-looking statements. You should not place undue reliance on these forward-looking statements, which
speak only as of the date of this presentation. Unless legally required, the Company undertakes no obligation to update publicly any forward-looking statements whether as a result of new information,
future events or otherwise.
These forward-looking statements are based upon a number of assumptions and estimates that are inherently subject to significant uncertainties and contingencies, many of which are beyond our
control. Actual results may differ materially from those expressed or implied by such forward-looking statements. Accordingly, these forward-looking statements should be considered in light of various
important factors, including but not limited to those set forth in our Annual Report on Form 20-F for the year ended December 31, 2018 (our “2018 Annual Report”) under the caption “Item 3-Key
Information-D. Risk Factors” and herein under the caption "Risk Factors" as well as other factors listed from time to time in registration statements, reports or other materials that we have filed with or
furnished to the Securities and Exchange Commission, which could materially affect our business, financial condition or results of operations.

4
Summary of risk factors
© Golar LNG Partners LP
The Company’s ability to service its debt (the Bonds included), will depend upon, among other things, the Group’s future financial and operating performance, which will be affected by prevailing
economic conditions and financial business, regulatory and other factors such as the effect of the worldwide economic slowdown which can be expected as a consequence of the Covid-19 pandemic
and the turmoil in the global financial markets created thereby, fluctuations in currencies and interest rates and changes in commodity prices, the oil and natural gas prices in particular.
Please refer to slides 29-31(1) in this Presentation for a description of certain risk factors associated with the Company and the Group. These include but are not limited to the following important and
specific factors affecting the Company, the Group and the Bonds:
- The Group’s financing arrangements, most of which are secured by its vessels, contain operating and financial restrictions and other covenants that may restrict its business and financing
activities.
- The Group’s debt level may limit the Company’s flexibility in obtaining additional financing for the purpose of pursuing other business opportunities.
- The Group’s ability to obtain additional debt financing for future vessel acquisitions or to refinance its existing debt may depend on the creditworthiness of its charterers and the terms of its future
charters.
- One of the Group’s vessels is currently financed by a UK tax lease. In the event of any adverse tax changes or a successful challenge by the UK Revenue authorities with regard to the initial tax
basis of the lease transaction or in the event of an early termination of the lease, the Group may be required to make additional payments to the UK vessel lessor which could adversely affect its
earnings and financial position.
- The Group has only ten vessels in its fleet and a 50% interest in the “Hilli Episeyo”. Any limitation on the availability or operation of these vessels could have a material adverse effect on the
Group’s business, results of operations and financial condition.
- The length and severity of pandemics, including that caused by the recent Covid-19 virus, can have a significant negative impact across the Group’s business, including overall demand for our
services, our operations in China and the Far East and knock-on-impacts to our global operations and financing activities.
- The Group currently derives all of its revenue from a limited number of customers. The loss of any of these, following termination or expiration, would result in a significant loss of revenues and
cash flow, if for an extended period of time, the Group is not able to re-charter a vessel to another customer.
- The Company may obtain additional capital through a sale of asset(s). As disclosed in note 13 “Vessels and Equipment” in the 2018 Annual Report, some of the estimated market values of the
Group’s vessel at year-end 2018 were below their carrying values. This may result in impairment charges. If the Group sells a vessel at less than its carrying value it will incur a loss on sale.
(1) Separate Appendix to the presentation

Market overview
© Golar LNG Partners LP 5
3
4
5
6
The Golar Group
Risk factors
Appendix
Transaction overview1
2 Company update
6
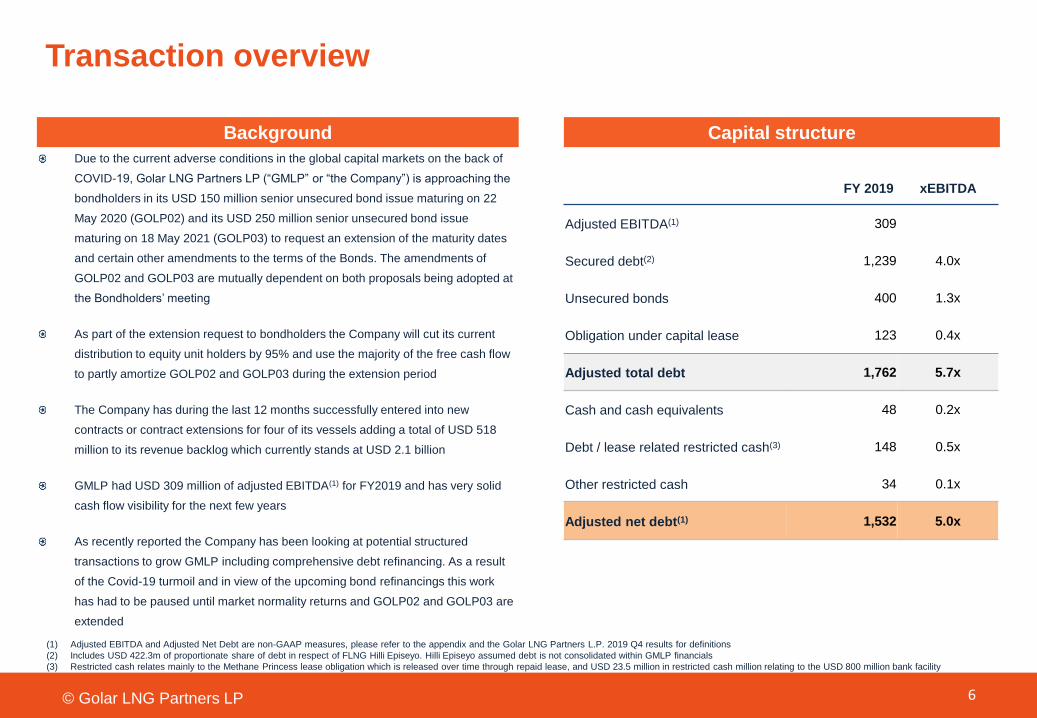
Transaction overview
Background
FY 2019 xEBITDA
Adjusted EBITDA(1) 309
Secured debt(2) 1,239 4.0x
Unsecured bonds 400 1.3x
Obligation under capital lease 123 0.4x
Adjusted total debt 1,762 5.7x
Cash and cash equivalents 48 0.2x
Debt / lease related restricted cash(3) 148 0.5x
Other restricted cash 34 0.1x
Adjusted net debt(1) 1,532 5.0x
(1) Adjusted EBITDA and Adjusted Net Debt are non-GAAP measures, please refer to the appendix and the Golar LNG Partners L.P. 2019 Q4 results for definitions
(2) Includes USD 422.3m of proportionate share of debt in respect of FLNG Hilli Episeyo. Hilli Episeyo assumed debt is not consolidated within GMLP financials
(3) Restricted cash relates mainly to the Methane Princess lease obligation which is released over time through repaid lease, and USD 23.5 million in restricted cash million relating to the USD 800 million bank facility
© Golar LNG Partners LP
Capital structure
Due to the current adverse conditions in the global capital markets on the back of
COVID-19, Golar LNG Partners LP (“GMLP” or “the Company”) is approaching the
bondholders in its USD 150 million senior unsecured bond issue maturing on 22
May 2020 (GOLP02) and its USD 250 million senior unsecured bond issue
maturing on 18 May 2021 (GOLP03) to request an extension of the maturity dates
and certain other amendments to the terms of the Bonds. The amendments of
GOLP02 and GOLP03 are mutually dependent on both proposals being adopted at
the Bondholders’ meeting
As part of the extension request to bondholders the Company will cut its current
distribution to equity unit holders by 95% and use the majority of the free cash flow
to partly amortize GOLP02 and GOLP03 during the extension period
The Company has during the last 12 months successfully entered into new
contracts or contract extensions for four of its vessels adding a total of USD 518
million to its revenue backlog which currently stands at USD 2.1 billion
GMLP had USD 309 million of adjusted EBITDA(1) for FY2019 and has very solid
cash flow visibility for the next few years
As recently reported the Company has been looking at potential structured
transactions to grow GMLP including comprehensive debt refinancing. As a result
of the Covid-19 turmoil and in view of the upcoming bond refinancings this work
has had to be paused until market normality returns and GOLP02 and GOLP03 are
extended

7
The proposed amendments will provide GMLP with time to get
a long-term refinancing in place
Strong cash flow coverage and visibility…
© Golar LNG Partners LP
…but capital markets currently closed
0
200
400
600
800
1,000
1,200
1,400
1,600
1,800
2,000
2,200
2,400
1,000
1,200
1,400
1,600
1,800
2,000
2,200
2,400
2,600
2,800
3,000
3,200
3,400
Feb-20Jan-20 Mar-20
S&P 500 BpsUS Energy HY spread index (RHS)S&P 500 (LHS)
(1) As at 31 December 2019, Revenue backlog represents revenue from our executed contracts and includes our proportionate share of Hilli LLC’s revenue backlog. The USD 2.1bn does not include any “options” as highlighted in
the above graph, assumes no exercise of customer termination rights and does not include any future growth opportunities. Any future contracts relating to these prospects will be incremental to the above number. Revenue
backlog is a non GAAP measure. Please refer to the appendix and the Golar LNG Partners L.P. 2019 Q4 results for definitions. (2) Revenue backlog as at 31 December 2019 divided by 2019 adjusted operating revenue. Adjusted
operating revenue includes total operating revenues plus amounts invoiced under sales type leases plus operating revenue attributable to the Partnerships investment in Hilli LLC. (3) GMLP currently has 50% interest in Hilli
Episeyo train 1 and train 2 (T1 & T2), which represents the current contracted capacity of the Hilli Episeyo, which has a total of 4 trains
Golar Spirit
Golar Freeze
Golar Winter
Nusantara Regas Satu
Golar Igloo
Golar Eskimo
Hilli Episeyo (3)
Methane Princess
Golar Mazo (60% owned)
Golar Grand
Golar Maria
USD 2.1bn(1) of revenue backlog with and average term of 5.0(2) years
2020 2021 2022 2023 2024 2025 2026
2033
2027
Cold layup Base contract duration Options Expected spot trading Yard

8
Proposed amendments to GOLP02 (ISIN NO 0010736481)
© Golar LNG Partners LP
Existing Bond Terms Proposed amendments
Maturity Date 22 May 2020 22 November 2021 (the “New Maturity Date”)
Coupon 3 months Libor + 440bps 3 months Libor + 625bps
Maturity price 100% 105%
Call options None
- 100% of par value from and including the Interest Payment Date in May 2020 to (but
excluding) the Interest Payment Date in May 2021
- 105% of par value from and including the Interest Payment Date in May 2021 to (but
excluding) the New Maturity Date
Amortization None
- Equal instalments of USD 5,000,000 (at 100% of the par value), the first time on 30
September 2020 and thereafter on each Interest Payment Date in the period up to and
including the Interest Payment Date in May 2021;
- Equal instalments of USD 3,750,000 (at 100% of the par value) from, but excluding the
Interest Payment Date in May 2021 and on each Interest Payment Date thereafter;
- Repayment of the remaining Bonds at a price of 105% of the par value on the New Maturity
Date
Distribution restrictions None
- No distribution to common unit holders, other than (i) up to USD 0.0808 per common unit per
annum during the remaining term of the Bonds (equivalent to a 95% cut from distribution paid
for Q4 2019), and (ii) an amount equivalent to the aggregate amount of cash equity raised
Restrictions on additional
indebtednessNone
- No additional financial indebtedness, without applying the proceeds from such additional
Financial Indebtedness for redemption between the GOLP02 Bonds and the GOLP03 Bonds
Bonds on a pro rata basis, other than certain permitted financial indebtedness incurred (i) to
repay existing financial indebtedness, (ii) by way of secured debt from financial institutions
relating to acquisitions or (iii) an amount up to USD 25,000,000 in aggregate, provided that
the proceeds in (i) to (iii) are not applied for redemption of any or all of the GOLP03 Bonds
prior to redemption of the GOLP02 Bonds in full
Amendment Fee - 50 bps on the nominal value of the Bonds
Please refer to the summons letter for detailed description of the proposed amendments

9
Proposed amendments to GOLP03 (ISIN NO 0010786056)
© Golar LNG Partners LP
Existing Bond Terms Proposed amendments
Maturity Date 15 November 2022 (the “New Maturity Date”)
Coupon 3 months Libor + 625bps 3 months Libor + 810bps
Maturity price 100% 105%
Call options None
- 100% of par value from and including the Interest Payment Date in May 2020 to (but excluding) the
Interest Payment Date in May 2021
- 105% of par value from and including the Interest Payment Date in May 2021 to (but excluding) the
New Maturity Date
Amortization None
- (i) Equal instalments of USD 5,000,000 (at 100% of the par value), the first time on 30 September
2020 and thereafter on each Interest Payment Date in the period up to and including the Interest
Payment Date in May 2021;
- (ii) Equal instalments of USD 6,250,000 (at 100% of the par value) from, but excluding the Interest
Payment Date in May 2021 and on each Interest Payment Date thereafter in the period up to and
including the Interest Payment Date in November 2021;
- (iii) Equal instalments of USD 10,000,000 (at 100% of the par value), replacing the instalments in
(i) and (ii) above, on each Interest Payment Date after the GOLP02 Bonds having been redeemed
in full;
- Repayment of the remaining Bonds at a price of 105% of the par value on the New Maturity Date
Distribution restrictions None
- No distribution to common unit holders, other than (i) up to USD 0.0808 per common unit per
annum during the remaining term of the Bonds (equivalent to a 95% cut from distribution paid for
Q4 2019), and (ii) an amount equivalent to the aggregate amount of cash equity raised
Restrictions on additional
indebtednessNone
- No additional financial indebtedness, without applying the proceeds from such additional Financial
Indebtedness for redemption between the GOLP02 Bonds and the GOLP03 Bonds on a pro rata
basis, other than certain permitted financial indebtedness incurred (i) to repay existing financial
indebtedness, (ii) by way of secured debt from financial institutions relating to acquisitions or (iii) an
amount up to USD 25,000,000 in aggregate, provided that the proceeds in (i) to (iii) are not applied
for redemption of any or all of the GOLP03 Bonds prior to redemption of the GOLP02 Bonds in full
Amendment Fee - 50 bps on the nominal value of the Bonds
Please refer to the summons letter for detailed description of the proposed amendments

Equity distribution cut of 95%, operating cash flow relocated for
bond amortization
© Golar LNG Partners LP 10
Capital re-allocation from equity distributions to bond amortization
Dividend reduction of 95% will retain
cash flow to address upcoming
maturities and allow for the proposed
total USD 86 million amortization of
GOLP02 and GOLP03, thereby reducing
refinancing risk
FY 2019 net cash flow pro-forma for
distribution cut of approximately USD 54
million, representative for 2020 and 2021
based on current backlog
GMLP will continue to focus on
deleveraging its balance sheet and
prepare for a long-term refinancing of the
GOLP02 bonds, the GOLP03 bonds and
the USD 800 million facility (USD 568
million outstanding per Q4 2019 and
$503 million at maturity in April 2021) as
soon as the banking and capital markets
allow for it
2019 operational performance grossed up for Hilli (USDm)
(1) Pro-forma figures adjusted for the dividend cut of 95%
(2) NCI = Non-controlling interests relating to Golar Mazo and Golar Eskimo lease finance subsidiaries
(3) Adjusted EBITDA is a non-GAAP measure. Please refer to the appendix and the Golar LNG Partners L.P. 2019 Q4 results for definitions
309
54
80
33
98
12 6
14 2
Adjusted
EBITDA3
Interest
expense
Drydocking Hilli
principal
Debt
Amort.
Pref.
dividends
Common
dividends1
Cash
taxes
NCI2 Pro-forma
net cash
flow1
10

Recent developments
11
USD ~520m of new
contract awards
and extensions
95% dividend cut
Progressing on
debt refinancing
Feb 20: Golar Grand charter extended for a further year from May 2020
Nov 19: Two-year charter for LNG carrier Golar Maria commencing November 2020
Oct 19: Two-year charter for FSRU Golar Igloo commencing March 2020
May 19: Golar Freeze commences new 15 year contract at an adjusted EBITDA of USD 18-22 million
p.a.
1 Apr 20: Announced a 95% cut in distributions to unit holders, to new level of USD 1.430 million per
quarter (0.0202 per unit per quarter) and USD 5.718 million per annum. Key element in retaining cash
flow and addressing upcoming debt maturities
© Golar LNG Partners LP
2 Apr 20: Launched proposal to GOLP02 and GOLP03 bondholders for the extension of both the USD
150 million May 2020 bond maturity and the USD 250 million May 2021 bond maturity, including several
structural enhancements benefitting bondholders and reducing the future refinancing risk
Q1 20: GMLP has had detailed discussions with banks for a refinancing of its April 2021 USD 800 million
facility (USD 568 million outstanding per Q4 2019). Lead banks in the facility have recently provided
indicative terms for a refinancing which is expected to commence on conclusion of the bond amendment

Market overview
© Golar LNG Partners LP 12
3
4
5
6
The Golar Group
Risk factors
Appendix
Transaction overview1
2 Company update
Owns and operates a fleet of 6 floating storage and regasification units (“ FSRUs”), 4 liquid natural gas carriers (“LNGCs”) and
50% interest in 1 floating liquefaction unit (“ FLNG”)(1)
45+ years LNG industry experience and long-term relationships with major energy companies
99% average utilization for scheduled operations over last 3 years
Generated adjusted EBITDA(2) of USD 309 million in 2019
USD 2.1bn of revenue backlog(3) as of December 31, 2019 with a strong and diversified customer base
Strong track record of redeploying assets, most recently with 15-year Jamaica FSRU contract award, two year contract awards
for the Golar Igloo and Golar Maria and the extension of the Golar Grand charter for a further year
LNG is a significantly cleaner source of energy than the majority of existing energy sources
Minimizing environmental impact using innovative and energy efficient solutions in its operations
Golar assets support the global energy transition by enabling LNG to replace oil and coal serving as back-up for renewable
energy
USD ~520 million of equity, preferred equity and bonds raised in last three years
High focus on the refinancing of the upcoming bond maturities as soon as the credit markets are open
Proposed dividend restriction will allow for further deleveraging and reduction of the refinancing risk
The USD 800m bank facility (USD 568 million outstanding per Q4 2019) is expected to be refinanced well ahead of maturity. The
facility is secured by 3 LNGCs and 4 FSRUs with an associated revenue backlog of USD 681 million at maturity in April 2021
Leading player
within LNG
infrastructure
Long-term
contracted cash
flows
Strong underlying
market dynamics
with drive towards
cleaner energy
Committed to
deliver on ESG
agenda
Focus on
strengthening
balance sheet
(1) GMLP currently has 50% interest in Hilli Episeyo train 1 and train 2 (T1 & T2), which represents the current contracted capacity of the Hilli Episeyo, which has a total of 4 trains
(2) Adjusted EBITDA is a non-GAAP measure, please refer to the appendix and the Golar LNG Partners L.P. 2019 Q4 results for definitions
(3) Represents revenue from our executed contracts and includes our proportionate share of Hilli LLC’s revenue backlog. The USD 2.1bn does not include any “options’, assumes no exercise of customer termination rights and does not include any future growth opportunities.
© Golar LNG Partners LP 13
LNG is set to be a high-growth commodity as governments implement policies to encourage a cleaner energy mix. 2019 – 2035
CAGR of 4% expected
Main drivers for growth include lower cost, lower emissions and high flexibility
Golar is well positioned to take part in this growth with a strong track record across the value chain
Key credit highlights
Golar LNG Partners a leading LNG infrastructure player
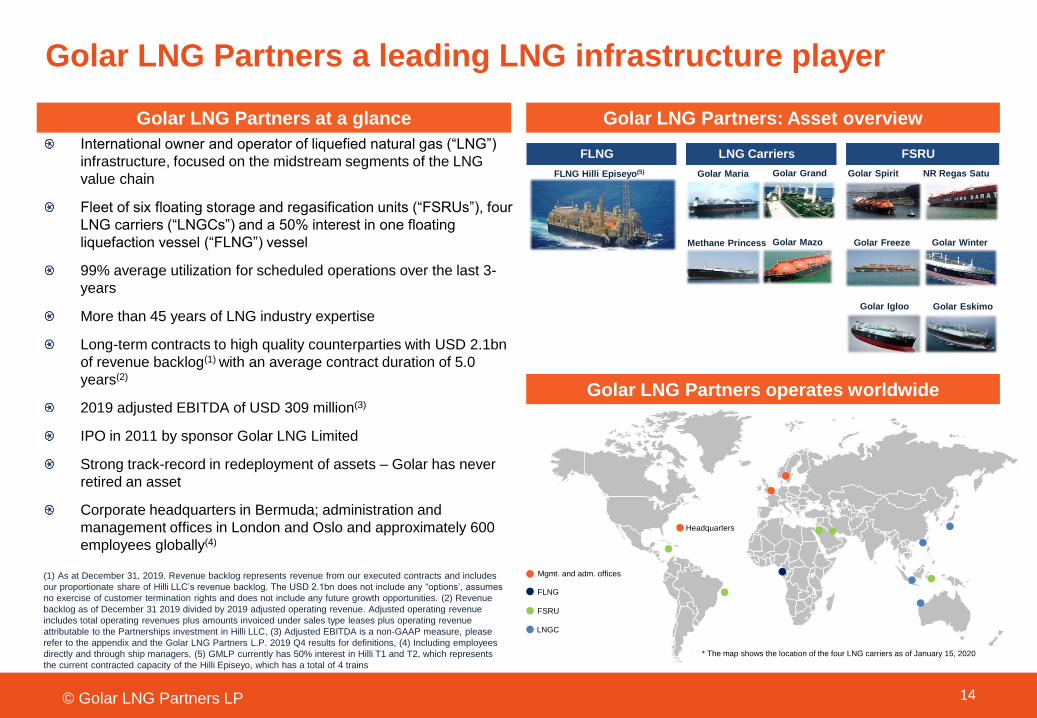
International owner and operator of liquefied natural gas (“LNG”)
infrastructure, focused on the midstream segments of the LNG
value chain
Fleet of six floating storage and regasification units (“FSRUs”), four
LNG carriers (“LNGCs”) and a 50% interest in one floating
liquefaction vessel (“FLNG”) vessel
99% average utilization for scheduled operations over the last 3-
years
More than 45 years of LNG industry expertise
Long-term contracts to high quality counterparties with USD 2.1bn
of revenue backlog(1) with an average contract duration of 5.0
years(2)
2019 adjusted EBITDA of USD 309 million(3)
IPO in 2011 by sponsor Golar LNG Limited
Strong track-record in redeployment of assets – Golar has never
retired an asset
Corporate headquarters in Bermuda; administration and
management offices in London and Oslo and approximately 600
employees globally(4)
Golar LNG Partners at a glance Golar LNG Partners: Asset overview
© Golar LNG Partners LP 14
(1) As at December 31, 2019. Revenue backlog represents revenue from our executed contracts and includes
our proportionate share of Hilli LLC’s revenue backlog. The USD 2.1bn does not include any “options’, assumes
no exercise of customer termination rights and does not include any future growth opportunities. (2) Revenue
backlog as of December 31 2019 divided by 2019 adjusted operating revenue. Adjusted operating revenue
includes total operating revenues plus amounts invoiced under sales type leases plus operating revenue
attributable to the Partnerships investment in Hilli LLC, (3) Adjusted EBITDA is a non-GAAP measure, please
refer to the appendix and the Golar LNG Partners L.P. 2019 Q4 results for definitions, (4) Including employees
directly and through ship managers, (5) GMLP currently has 50% interest in Hilli T1 and T2, which represents
the current contracted capacity of the Hilli Episeyo, which has a total of 4 trains
Headquarters
Mgmt. and adm. offices
FLNG
FSRU
Golar LNG Partners operates worldwide
* The map shows the location of the four LNG carriers as of January 15, 2020
LNGC
FLNG LNG Carriers FSRU
FLNG Hilli Episeyo(5) Golar Spirit NR Regas Satu
Golar Freeze Golar Winter
Golar EskimoGolar Igloo
Golar GrandGolar Maria
Methane Princess Golar Mazo
(1) As at December 31, 2019. Revenue backlog represents revenue from our executed contracts and includes our proportionate share of Hilli LLC’s revenue backlog. The USD 2.1bn does not include any “options”, assumes no exercise
of customer termination rights and does not include any future growth opportunities.
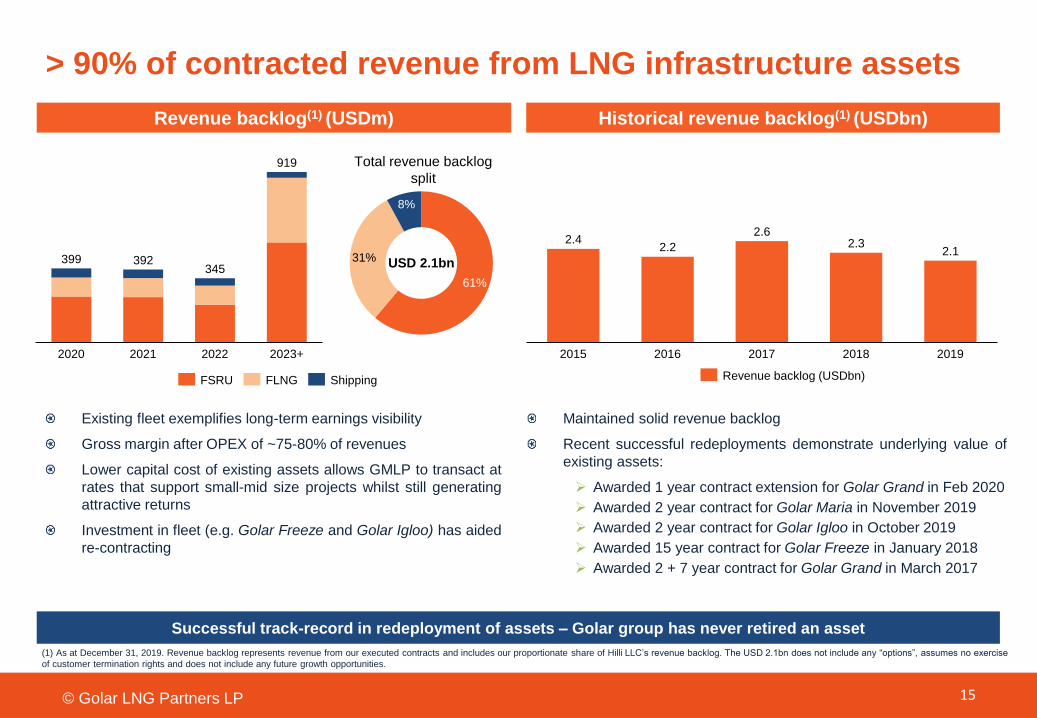
Maintained solid revenue backlog
Recent successful redeployments demonstrate underlying value of
existing assets:
➢ Awarded 1 year contract extension for Golar Grand in Feb 2020
➢ Awarded 2 year contract for Golar Maria in November 2019
➢ Awarded 2 year contract for Golar Igloo in October 2019
➢ Awarded 15 year contract for Golar Freeze in January 2018
➢ Awarded 2 + 7 year contract for Golar Grand in March 2017
Successful track-record in redeployment of assets – Golar group has never retired an asset
15© Golar LNG Partners LP
> 90% of contracted revenue from LNG infrastructure assets
Historical revenue backlog(1) (USDbn)Revenue backlog(1) (USDm)
Existing fleet exemplifies long-term earnings visibility
Gross margin after OPEX of ~75-80% of revenues
Lower capital cost of existing assets allows GMLP to transact at
rates that support small-mid size projects whilst still generating
attractive returns
Investment in fleet (e.g. Golar Freeze and Golar Igloo) has aided
re-contracting
2020 2023+20222021
399 392345
919
FSRU FLNG Shipping
Total revenue backlog
split
2.42.2
2.62.3
2.1
20162015 2017 2018 2019
Revenue backlog (USDbn)
61%
31%
8%
USD 2.1bn

(1) As at 31 December 2019, Revenue backlog represents revenue from our executed contracts and includes our proportionate share of Hilli LLC’s revenue backlog. The USD 2.1bn does not include any “options” as highlighted in
the above graph, assumes no exercise of customer termination rights and does not include any future growth opportunities. Any future contracts relating to these prospects will be incremental to the above number. Revenue
backlog is a non GAAP measure. Please refer to the appendix and the Golar LNG Partners L.P. 2019 Q4 results for definitions. (2) Revenue backlog as at 31 December 2019 divided by 2019 adjusted operating revenue. Adjusted
operating revenue includes total operating revenues plus amounts invoiced under sales type leases plus operating revenue attributable to the Partnerships investment in Hilli LLC.
16© Golar LNG Partners LP
USD 2.1bn of revenue backlog(1) with an average term of 5.0
years(2)
International oil major
Major LNG Exporter
Energy & Logistics Company
2020 2021 2022 2023 2024 2025 2026
FSRUGolar SpiritCold layup
FSRUGolar Freeze15 year Jamaica charter
FSRUGolar Winter10-year contract extended to 15 years
FSRUNusantara Regas Satu11-year contract
FSRUGolar Igloo2-year contract
FSRUGolar Eskimo10-year contract
FLNGHilli Episeyo (50% of common units)8-year contract
LNG carrierMethane Princess20-year contract
LNG carrierGolar Mazo (60% owned)Cold layup
LNG carrierGolar Grand2-year contract extended by 2 years
LNG carrierGolar Maria2-year contract from late 2020
2033
2027Go
lar
ML
P
Cold layup YardBase contract duration Options Expected spot trading
Government of the Hashemite
Kingdom of Jordan
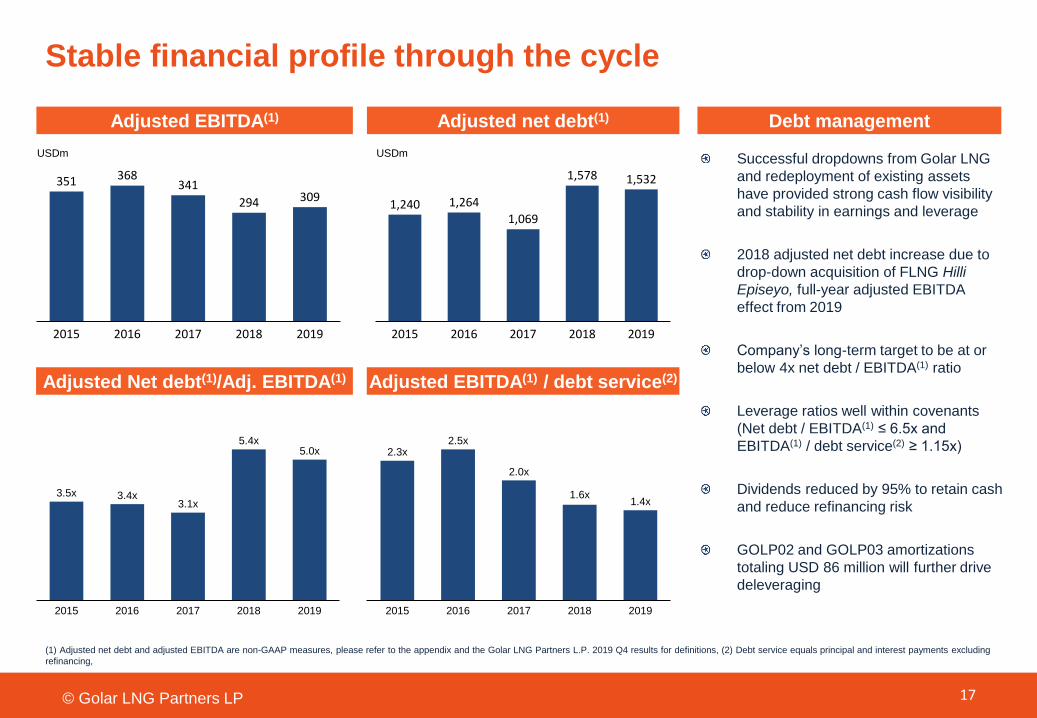
Stable financial profile through the cycle
© Golar LNG Partners LP 17
Adjusted net debt(1)Adjusted EBITDA(1)
Adjusted EBITDA(1) / debt service(2)Adjusted Net debt(1)/Adj. EBITDA(1)
351 368341
294 309
20162015 2017 2018 2019
1,240 1,264
1,069
1,578 1,532
2015 2019201820172016
Debt management
USDm USDm
3.5x 3.4x3.1x
5.4x5.0x
20192015 2016 2017 2018
2.3x2.5x
2.0x
1.6x1.4x
2015 2016 2017 20192018
Successful dropdowns from Golar LNG
and redeployment of existing assets
have provided strong cash flow visibility
and stability in earnings and leverage
2018 adjusted net debt increase due to
drop-down acquisition of FLNG Hilli
Episeyo, full-year adjusted EBITDA
effect from 2019
Company’s long-term target to be at or
below 4x net debt / EBITDA(1) ratio
Leverage ratios well within covenants
(Net debt / EBITDA(1) ≤ 6.5x and
EBITDA(1) / debt service(2) ≥ 1.15x)
Dividends reduced by 95% to retain cash
and reduce refinancing risk
GOLP02 and GOLP03 amortizations
totaling USD 86 million will further drive
deleveraging
(1) Adjusted net debt and adjusted EBITDA are non-GAAP measures, please refer to the appendix and the Golar LNG Partners L.P. 2019 Q4 results for definitions, (2) Debt service equals principal and interest payments excluding
refinancing,
GMLP intends to address the 2021 debt
maturities once the financial markets return
to normal
Dividend cut of 95% will retain cash flow to
support the upcoming maturities and reduce
refinancing risk
GMLP estimates that the cash balance in
May 2021 should be comfortable above the
minimum levels needed (after USD 40m of
GOLP02 and GOLP03 amortizations), and
will seek to release additional cash from a
refinancing of the USD 800 million bank
facility
GMLP will consider several options to
refinance the remainder of GOLP02 and
GOLP03 including (i) proceeds from new
bond issue (ii) proceeds from bank
refinancing (iii) ATM on Series A preferred
shares (iv) potential asset sales
The USD 503 million balloon payment on the
USD 800 million bank facility in April 2021 is
secured with 3 LNGCs and 4 FSRUs with an
associated revenue backlog of USD 681
million(5) at maturity. Lead banks in the
facility have recently provided indicative
terms for refinancing which is expected to
commence on conclusion of the bond
amendment
The Golar group has a strong and supportive
financing group consisting of ~20 banks
© Golar LNG Partners LP 18
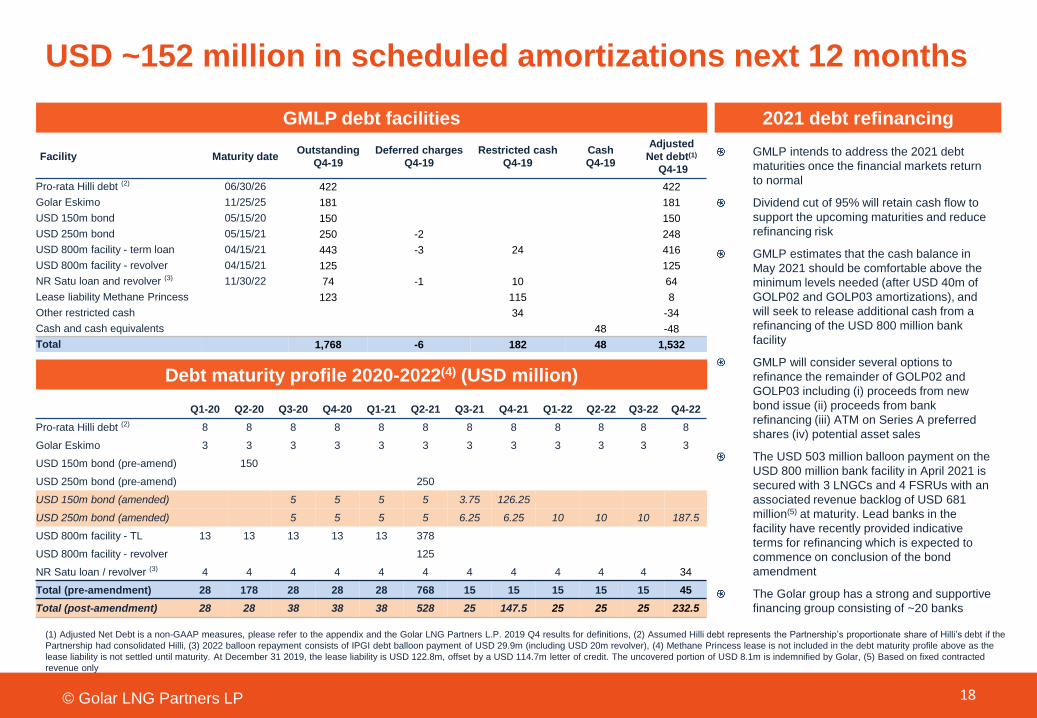
USD ~152 million in scheduled amortizations next 12 months
(1) Adjusted Net Debt is a non-GAAP measures, please refer to the appendix and the Golar LNG Partners L.P. 2019 Q4 results for definitions, (2) Assumed Hilli debt represents the Partnership’s proportionate share of Hilli’s debt if the
Partnership had consolidated Hilli, (3) 2022 balloon repayment consists of IPGI debt balloon payment of USD 29.9m (including USD 20m revolver), (4) Methane Princess lease is not included in the debt maturity profile above as the
lease liability is not settled until maturity. At December 31 2019, the lease liability is USD 122.8m, offset by a USD 114.7m letter of credit. The uncovered portion of USD 8.1m is indemnified by Golar, (5) Based on fixed contracted
revenue only
GMLP debt facilities 2021 debt refinancing
Q1-20 Q2-20 Q3-20 Q4-20 Q1-21 Q2-21 Q3-21 Q4-21 Q1-22 Q2-22 Q3-22 Q4-22
Pro-rata Hilli debt (2) 8 8 8 8 8 8 8 8 8 8 8 8
Golar Eskimo 3 3 3 3 3 3 3 3 3 3 3 3
USD 150m bond (pre-amend) 150
USD 250m bond (pre-amend) 250
USD 150m bond (amended) 5 5 5 5 3.75 126.25
USD 250m bond (amended) 5 5 5 5 6.25 6.25 10 10 10 187.5
USD 800m facility - TL 13 13 13 13 13 378
USD 800m facility - revolver 125
NR Satu loan / revolver (3) 4 4 4 4 4 4 4 4 4 4 4 34
Total (pre-amendment) 28 178 28 28 28 768 15 15 15 15 15 45
Total (post-amendment) 28 28 38 38 38 528 25 147.5 25 25 25 232.5
Debt maturity profile 2020-2022(4) (USD million)
Facility Maturity dateOutstanding
Q4-19
Deferred charges
Q4-19
Restricted cash
Q4-19
Cash
Q4-19
Adjusted
Net debt(1)
Q4-19
Pro-rata Hilli debt (2) 06/30/26 422 422
Golar Eskimo 11/25/25 181 181
USD 150m bond 05/15/20 150 150
USD 250m bond 05/15/21 250 -2 248
USD 800m facility - term loan 04/15/21 443 -3 24 416
USD 800m facility - revolver 04/15/21 125 125
NR Satu loan and revolver (3) 11/30/22 74 -1 10 64
Lease liability Methane Princess 123 115 8
Other restricted cash 34 -34
Cash and cash equivalents 48 -48
Total 1,768 -6 182 48 1,532

We believe that Natural Gas has a critical role to play in providing
cleaner energy for many years to come:
➢ Natural gas is a highly complimentary companion fuel to
renewables
➢ Provides significant emission savings compared to other fossil
fuels
➢ Most relevant in remote communities that currently have little
choice on how they create energy
➢ Our business provides people with cleaner energy at less cost
• We will focus our ESG reporting on what really matters to us
• We have identified five key focus areas (see right)
• We will formally report from 2020
• We believe that the Golar ESG story is an important one to explain
ESG: Developing our reporting & KPI’s
3. Energy efficiency and innovation
4. People and community
5. Governance & Business Ethics
2. Environmental impact
Five key areas which will be covered in our external reporting and will be a focus of our
efforts internally:
Making an impact – our focus areas
1 Health, safety and security
© Golar LNG Partners LP 19

Market overview
© Golar LNG Partners LP 20
3
4
5
6
The Golar Group
Risk factors
Appendix
Transaction overview1
2 Company update

0
50
100
150
200
250
300
350
400
450
0
5
10
15
20
25
2020
2020
2020
2021
2022
2022
2023
2023
2023
2023
2024
2024
2024
2024
2024
2024
2024
2025
2025
2025
2026
2026
2028
21
New LNG export projects up to end of 2028(2)
LNG volumes set to expand rapidly(1)
(1) BP energy outlook 2018
(2) Clarksons
Governments are encouraging a cleaner energy mix by
setting targets for gas share, taxing dirtier fossil fuels and
applying carbon pricing
LNG complements wind and solar power providing
required flexibility for power generation, mitigating
demand shocks and meeting seasonal needs
Record growth in new liquefaction now being delivered is
creating downward pressure on LNG prices, further
stimulating demand:
Around 38mtpa of liquefaction capacity scheduled
to start between 2020-2022, ~27mtpa is from the
US
A further 134mtpa of new LNG expected to deliver
between 2023 and 2027
FSRUs are a popular means of matching uncontracted
volumes with new markets attracted by cheap LNG
LNG supply LNG demand
New LNG coming on-stream
20212020 2022 2023 2024 2025 2026 2027+
New LNG production (MTPA) Cumulative LNG production (MTPA)
Cumulative LNG production
LNG liquefaction project in FEED process underway/agreements signed
LNG liquefaction project under construction
Substantial growth in LNG supply to meet demand growthWith LNG increasingly available it is rapidly integrated into the energy mix
© Golar LNG Partners LP

Growing number of LNG importing nations
22
Key Market Drivers
FSRU current world fleet and newbuild orders
© Golar LNG Partners LP
10
9
4
1 1
64
3 3
OtherHoegh LNG
4
Excelerate
8
Golar LNG BW LNG Newbuild
orders
4
FSRU Converted FSRU
Source: Clarkson Research Services
2
3
2 2
5
1
6
3
8
1
2
3
4
20162014201220112010 20182013 20172015 2019
3
6
5
Independent Owner Project Developer/End-User
FSRU contract awards by year
Increasing activity in the FSRU market with 5 FSRU
contract awards in 2019
No new FSRU orders since 2018
Existing asset base allows Golar LNG Partners to transact
at rates that support small-mid size projects whilst still
generating attractive returns
LNG downstream opportunities can be developed from
excess FSRU capacity
More than 60 projects globally, of which ~50% currently
have a start-up date
FSRU market: Strong pipeline of new projects
Source: Clarkson Research Services
2325 26
29 30
34
39 3942
2010 20142011 2012 2013 2015 20172016 2018
# of LNG importing nations
Tight LNGC markets positively impacting competitive situation for FSRUs
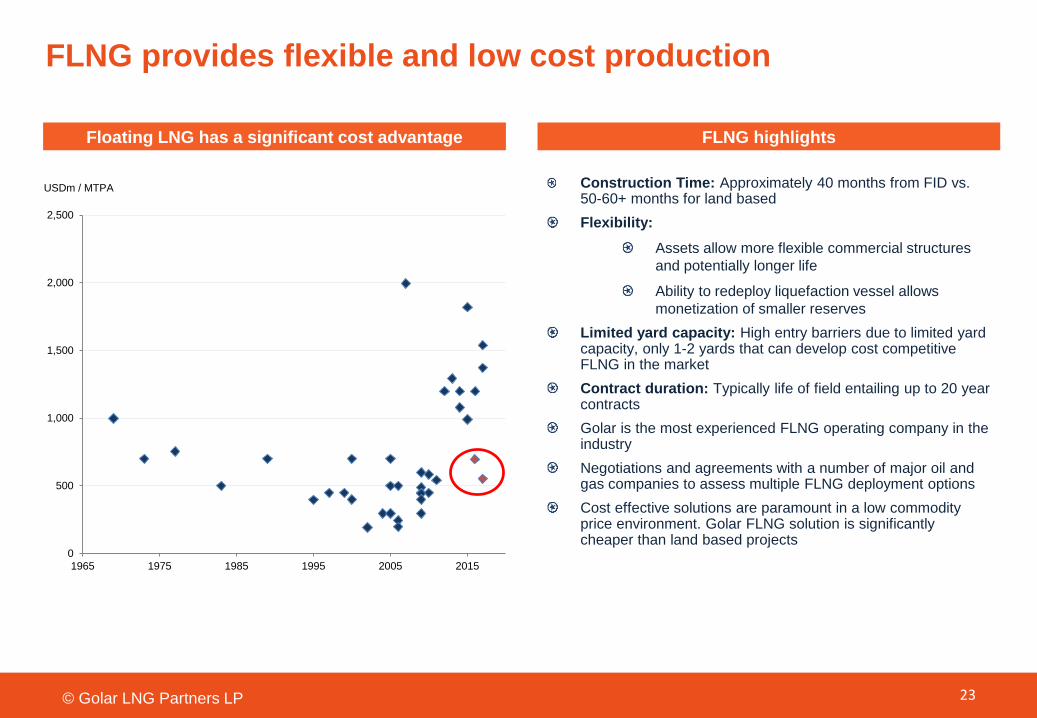
Construction Time: Approximately 40 months from FID vs. 50-60+ months for land based
Flexibility:
Assets allow more flexible commercial structures
and potentially longer life
Ability to redeploy liquefaction vessel allows
monetization of smaller reserves
Limited yard capacity: High entry barriers due to limited yard capacity, only 1-2 yards that can develop cost competitive FLNG in the market
Contract duration: Typically life of field entailing up to 20 year contracts
Golar is the most experienced FLNG operating company in the industry
Negotiations and agreements with a number of major oil and gas companies to assess multiple FLNG deployment options
Cost effective solutions are paramount in a low commodity price environment. Golar FLNG solution is significantly cheaper than land based projects
0
500
1,000
1,500
2,000
2,500
1965 1975 1985 1995 2005 2015
Floating LNG has a significant cost advantage FLNG highlights
USDm / MTPA
FLNG provides flexible and low cost production
23© Golar LNG Partners LP

Source: Fearnley LNG
24© Golar LNG Partners LP
2925
12
26
-11-7 -9
-37
-65-70
-60
-50
-40
-30
-20
-10
0
10
20
30
202220172015 2016 20192018 2020 2021 2023 2024
Declining newbuild orders; earliest delivery of
a vessel ordered today is 2H 2022
# of vessels
Increasing ton miles drive vessel demand
Estimated LNG carrier market balance
New liquefaction volumes have now absorbed virtually all
excess shipping capacity
Significant portion of new LNG coming from US which is
supportive of ton mile upside on the back of Asian LNG
demand and the phase 1 US-China trade agreement.
Pre Covid-19, Clarksons estimate that seaborne LNG as
% of global natural gas trade will account for 34.8% in
2020, up from 31.7% in 2012
Shipping balance expected to remain tight until 2022
Shipping: Tightening market balance
Source: Clarkson Research Services
Increased LNG supply tightens LNG shipping markets
0
200
400
600
800
1,000
1,200
1,400
1,600
1,800
2010 2011 2012 2013 2014 2015 2016 2017 2018 2019 2020 2021
World Seaborne LNG Trade (million tonnes) World Seaborne LNG Trade (billion tonne-miles)GAGR
+9%

Market overview
© Golar LNG Partners LP 25
3
4
5
6
The Golar Group
Risk factors
Appendix
Transaction overview1
2 Company update
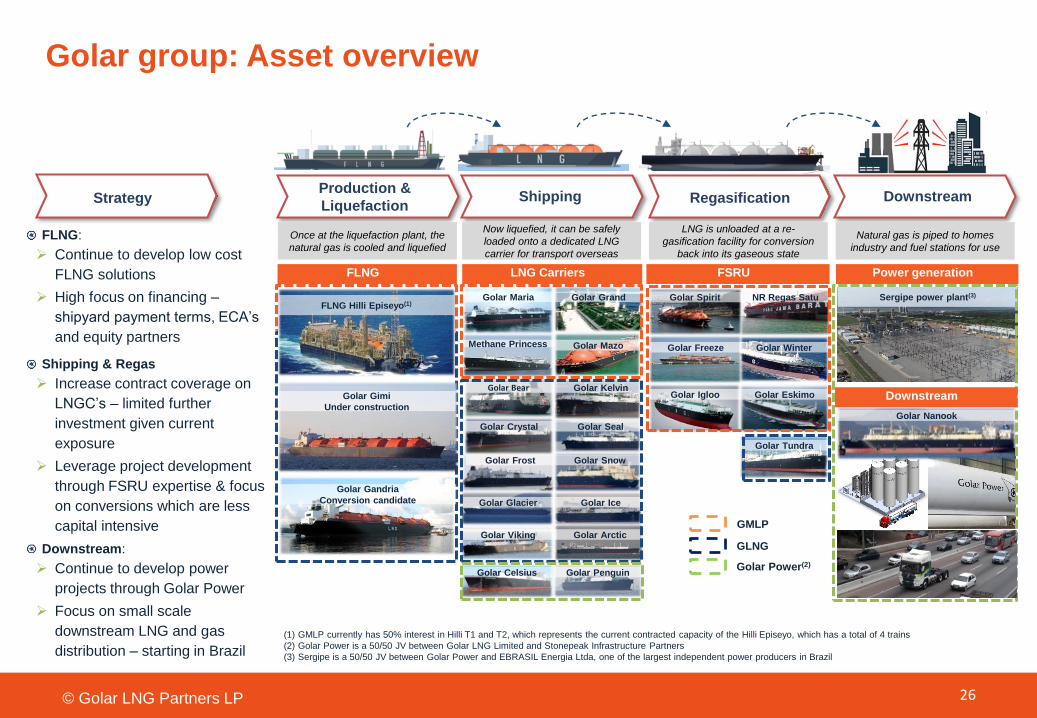
ShippingProduction &
LiquefactionRegasification
GMLP
FLNG LNG Carriers FSRU
GLNG
Golar GrandGolar Maria
Methane Princess Golar Mazo
Golar Bear Golar Kelvin
Golar Crystal Golar Seal
Golar Frost Golar Snow
Golar Glacier Golar Ice
Golar Viking Golar Arctic
Golar Spirit NR Regas Satu
Golar Freeze Golar Winter
Golar EskimoGolar Igloo
Golar Nanook
Golar Tundra
Sergipe power plant(3)
FLNG Hilli Episeyo(1)
Golar Celsius Golar Penguin
Golar Gandria
Conversion candidate
Golar Gimi
Under construction
Golar Power(2)
(1) GMLP currently has 50% interest in Hilli T1 and T2, which represents the current contracted capacity of the Hilli Episeyo, which has a total of 4 trains
(2) Golar Power is a 50/50 JV between Golar LNG Limited and Stonepeak Infrastructure Partners
(3) Sergipe is a 50/50 JV between Golar Power and EBRASIL Energia Ltda, one of the largest independent power producers in Brazil
Downstream
Downstream
Power generation
26
Once at the liquefaction plant, the
natural gas is cooled and liquefied
Now liquefied, it can be safely
loaded onto a dedicated LNG
carrier for transport overseas
LNG is unloaded at a re-
gasification facility for conversion
back into its gaseous state
Natural gas is piped to homes
industry and fuel stations for use
Golar group: Asset overview
© Golar LNG Partners LP
Strategy
FLNG:
➢ Continue to develop low cost
FLNG solutions
➢ High focus on financing –
shipyard payment terms, ECA’s
and equity partners
Shipping & Regas
➢ Increase contract coverage on
LNGC’s – limited further
investment given current
exposure
➢ Leverage project development
through FSRU expertise & focus
on conversions which are less
capital intensive
Downstream:
➢ Continue to develop power
projects through Golar Power
➢ Focus on small scale
downstream LNG and gas
distribution – starting in Brazil

27
… 20235,000
10,000
15,000
20,000
LN
G d
em
and in B
cf/
yr
Contract earnings Backlog Upside for Barcarena
Power and small scaleLNG volumes
Earn
ings b
acklo
g in $
mill
ions
750
1,742
4,116 3,649
6,618 6,558
0
1,000
2,000
3,000
4,000
5,000
6,000
7,000
8,000
2014 2015 2016 2017 2018 2019
✓Fully
Funded
Projects
FLNG Hilli Episeyo commenced operations in May 2018
100% commercial uptime with 36 cargoes exported to date
Start-up of the Sergipe power plant in March 2020
25-year off take agreements
Start-up of FSRU Nanook in March 2020
25-year contract to Sergipe power plant
Additional power plant with 25-year off take agreement
Due to commence operations in 2025
Tenant for another potential 2021 Golar Power FSRU
FLNG Gimi – 20-year lease and operate agreement with BP
Expected to commence operations in 2022
Brazilian small scale downstream distribution
Signing up customers, purchase and delivery of initial isotainers
and a commitment to charter in small-scale LNG shipping capacity
from Avenir LNG Limited
Formation of Partnership between Golar Power and Petrobras
Distribuidora S.A for the development of an LNG distribution
business in Brazil
Protocol of intention signed with State Government of Pernambuco
to develop an LNG import terminal in the Port of Suape, Brazil
Golar group: Leading the Global LNG fuel transitionFixed, fully financed Contract Earnings Backlog(1) of USD 6.6bn coming on line
Solid contract backlog of USD 6.6bn and growing Parent Golar LNG: Recent developments
Golar backlog growing with increasing LNG demand globally,
supported by reducing environmental footprint, benefitting the communities where we operate
(1) Contract earnings backlog in a Non-GAAP measure, please see appendix for definition

Market overview
© Golar LNG Partners LP 28
3
4
5
6
The Golar Group
Risk factors
Appendix
Transaction overview1
2 Company update
29
Risk factors
© Golar LNG Partners LP
RISK FACTORS
The risks and uncertainties described in the Presentation are risks of which the Company is aware and considers to be material to its business. The list of risk factors is not exhaustive and there may
be other risks relevant to the Company, the Group or the Bonds which are not stated herein. A Bondholder should carefully consider all the risks related to the Company and the Group when
considering the Proposed Amendments and should consult his or her own expert advisors as to whether or not to support these. An investment in the Bonds entails significant risks and is suitable only
for investors who understand the risk factors associated with this type of investment and who can afford a loss of all or part of the investment. Against this background, a Bondholder should make a
careful assessment of the Company and its prospects before deciding whether to support the Proposed Amendments or not. Below is a description of the material risks that are specific to the
Company and that may affect the Company’s ability to fulfil its obligations under the terms of the Bonds. In each category the most material risks are set out first. If any of the following risks were to
occur, the Company’s business, financial position, operating results or cash flows could be significantly and negatively affected, and the Company could be unable to pay interest, principal or other
amounts on or in connection with the Bonds. When the Company has made an assessment of the risk factors herein the guidelines as set out in the Regulation (EU) 2017/1129 of the European
Parliament and of the Council of 14 June 2017 have been taken into consideration.
For further detail of the risk factors mentioned below refer to the 2018 Annual Report.
Operational risks
• The Group’s financing arrangements, most of which, are secured by its vessels, contain operating and financial restrictions and other covenants that may restrict its business and financing
activities.
• The Group’s debt level may limit the Company’s flexibility in obtaining additional financing, pursuing other business opportunities.
• The Group’s ability to obtain additional debt financing for future vessel acquisitions or to refinance its existing debt may depend on the creditworthiness of its charterers and the terms of its future
charters.
• One of the Group’s vessels is currently financed by a UK tax lease. In the event of any adverse tax changes or a successful challenge by the UK Revenue authorities with regard to the initial tax
basis of the lease transaction or in the event of an early termination of a lease, the Group may be required to make additional payments to the UK vessel lessor, which could adversely affect its
earnings and financial position.
• The Group has only ten vessels in its fleet and a 50% interest in the “Hilli Episeyo”. Any limitation on the availability or operation of those vessels could have a material adverse effect on the
Group’s business, results of operations and financial condition.
• The Company may obtain additional capital through a sale of asset(s). As disclosed in note 13 “Vessels and Equipment” in the 2018 Annual Report, some of the estimated market values of the
Group’s vessels at year-end 2018 were below their carrying values. This may result in impairment charges and if the Group sells a vessel at less than its carrying value it will incur a loss on sale.
• The Group currently derives all of its revenue from a limited number of customers. The loss of any of these customers, following termination or expiration, would result in a significant loss of
revenues and cash flow, if for an extended period of time, the Group is not able to re-charter a vessel to another customer. Customer termination rights, include (i) with respect to the “Golar
Winter”, upon at least six months’ written notice at any time after tenth anniversary of the commencement of the related charter upon payment of a termination fee; and (ii) with respect to the “Golar
Eskimo”, having passed the fourth anniversary of the charter commencement date, upon at least 23 months written notice upon payment of a termination fee and (iii) with respect to the “Golar
Freeze”, upon twelve months written notice of a termination not before the third anniversary of the charter commencement date in order to substitute the FSRU for an alternative vessel but only if
certain throughput targets have not been achieved. In this event the Group has a matching right.
• The Group may have difficulty entering into long-term time charters in the future if an active spot, short- or medium-term LNG shipping market continues to develop.
• Hire rates for FSRUs and LNGCs may fluctuate substantially. If rates are lower when the Group is seeking a new charter, its earnings may decline.
• The length and severity of outbreaks of pandemics, including the recent Covid-19 virus outbreak and its impacts across our business on demand, operations in China and the Far East and knock-
on impacts to the Group’s global operations and financing activities, may impact on the Company’s ability to service its debt.
30
Risk factors (cont’d)
© Golar LNG Partners LP
• The Company depends on Golar LNG Limited’s subsidiaries, Golar Management Ltd. and Golar Management Norway AS, to manage the Group’s business. The Group’s ability to enter into new
charters and expand its customer relationships will depend largely on its ability to leverage its relationship with Golar LNG Limited and its affiliates and their reputation and relationships in the LNG
industry.
• The required drydocking of the Group’s vessels could become more expensive and time consuming than the Company anticipates, which, in turn, could adversely affect its cash available for
distribution.
• The Group’s vessels may call on ports located in countries that are subject to restrictions imposed by the U.S. or other governments. This may adversely affect the Group’s business. Although no
vessel operated by the Group has called on such ports located in countries subject to such sanctions and embargoes or ports in other countries identified by the U.S. government as state
sponsors of terrorism, such as Cuba, Iran, Sudan and Syria, the Group’s vessels may call on such ports in these countries from time to time on its charterers' instructions in the future.
• Compliance with safety and other vessel requirements imposed by classification societies may be very costly and may adversely affect the Group’s business.
• The operation of FSRUs and LNGCs is inherently risky, and an incident involving significant loss of life or environmental consequences affecting any of the Group’s vessels could harm its
reputation and business.
• The LNG liquefaction, transportation, storage and regasification industry is subject to substantial environmental and other regulations, compliance with which may significantly limit the Group’s
operations or increase its expenses. The Group has incurred and expect to continue to incur, substantial expenses in complying with these laws and regulations. Additional laws and regulations
may be adopted that could limit the Group’s ability to do business or further increase costs, which could harm the Group’s business.
• The future performance and growth of the Group depends on continued growth in the production and demand for LNG, LNGCs, FLNGs and FSRUs.
• An increase in operating expenses or drydocking costs for the Group’s vessels could materially and adversely affect its financial performance.
• The Group may not be able to redeploy its FSRUs on terms as favorable as its current FSRU charter arrangements or at all.
• The shareholders' agreement with Chinese Petroleum Corporation with respect to “Golar Mazo” contains provisions that may limit the Group’s ability to sell or transfer its interest in “Golar Mazo”,
which could have a material adverse effect on the Group’s cash flows.
• The charterers of a number of the Group’s vessels have the option to extend the charter at a rate lower than the existing hire rate. The exercise of these options could have a material adverse
effect on the Group’s cash flow.
• The Group may experience operational problems with its vessels that reduce revenue and increase costs.
• The Group may be unable to obtain, maintain, and/or renew permits necessary for its operations or experience delays in obtaining such permits, which could have a material effect on its
operations.
• Further technological advancements and other innovations affecting LNGCs could reduce the charter hire rates the Group is able to obtain when seeking new employment, and this could
adversely impact the value of its LNGCs.
• Maritime claimants could arrest the Group’s vessels, which could interrupt its cash flow.

31
Risk factors (cont’d)
© Golar LNG Partners LP
Organisational risks
• The Company is organized as a limited partnership under the laws of the Republic of the Marshall Islands, which does not have a well-developed body of partnership law.
• Because the Company is organized under the laws of the Republic of the Marshall Islands, it may be difficult to serve it with legal process or enforce judgements against it, its directors or its
management.
• As a Marshall Islands limited partnership with principal executive offices in Bermuda, and also having subsidiaries in the Marshall Islands and other offshore jurisdictions, the Company’s operations
are subject to economic substance requirements. Non-compliance with these could harm our business by triggering tax liability for these in other jurisdictions.
Tax risks
• U.S. tax authorities could treat the Company as a "passive foreign investment Partnership", which would have adverse U.S. federal income tax consequences to U.S. unitholders.
• The Company may have to pay tax on U.S. source income, which would reduce its cash flow.
Risk related to the Bonds
• The Bonds are senior unsecured obligations and are effectively subordinated to the Company’s secured debt. In the event of a bankruptcy, restructuring or similar proceeding involving the
Company, the assets that serve as collateral for other obligations will be available to satisfy the obligations thereunder before any payments are made on the Bonds, and Bondholders may thus
lose the value of their entire investment in the Bonds (including coupon and other interest thereon) or part of it, as the case may be.

Market overview
© Golar LNG Partners LP 32
3
4
5
6
The Golar Group
Risk factors
Appendix
Transaction overview1
2 Company update

Minimizing our environmental impact through fuel efficiency
LNG is the cleanest fuel available to vessels. We also utilise recycled cargo boil off, enabling us to utilise energy that would otherwise be wasted
LNG use can reduce emissions of nitrogen oxide by up to 90%, and particulate matter by up to 99%. Emissions of sulphur oxide can be eliminated almost altogether
Accordingly, Golar vessels run on LNG whenever possible. For Golar’s FSRUs and FLNGs, the fuel mix is over 97% LNG. For carriers, over 80% of the fuel used is LNG
LNG: The cleanest marine fuel
We have a history of initiatives to improve vessel operation and efficiency – for example:
LNGC Trim optimisation: Have commissioned studies to assess optimum trim at voyage speeds which helps the Masters make informed decisions on optimum fuel efficiency trim
Heat Recovery Steam Generators (HRSGs) on FLNG vessels: HRSGs recover heat energy from the liquification trains which has a significant impact on energy efficiency generating about 30% energy savings
Hydro energy recovery on FSRUs: We are testing an innovative hydro turbine inserted into seawater discharge pipes onboard Golar Igloo. Initial results are positive:
Generates up to 1.2 MW of clean energy which would otherwise be wasted
7% improvement in system efficiency
Will be rolled out on FSRU fleet incrementally
Developed by Golar.
Golar innovation – improving efficiency
33© Golar LNG Partners LP
LNG
Marine Distillate
Heavy Fuel Oil
PM10
PM1070% less
Source: IGU
NOx SOx
1.6
1.5
0.17
0.5
0.050
0.0930.034 0.009
Switching to LNG for marine fuel will deliver clean air at sea (g/MJ)
NOx80-90%
less SOx
NONE
Innovation drives fuel efficiency
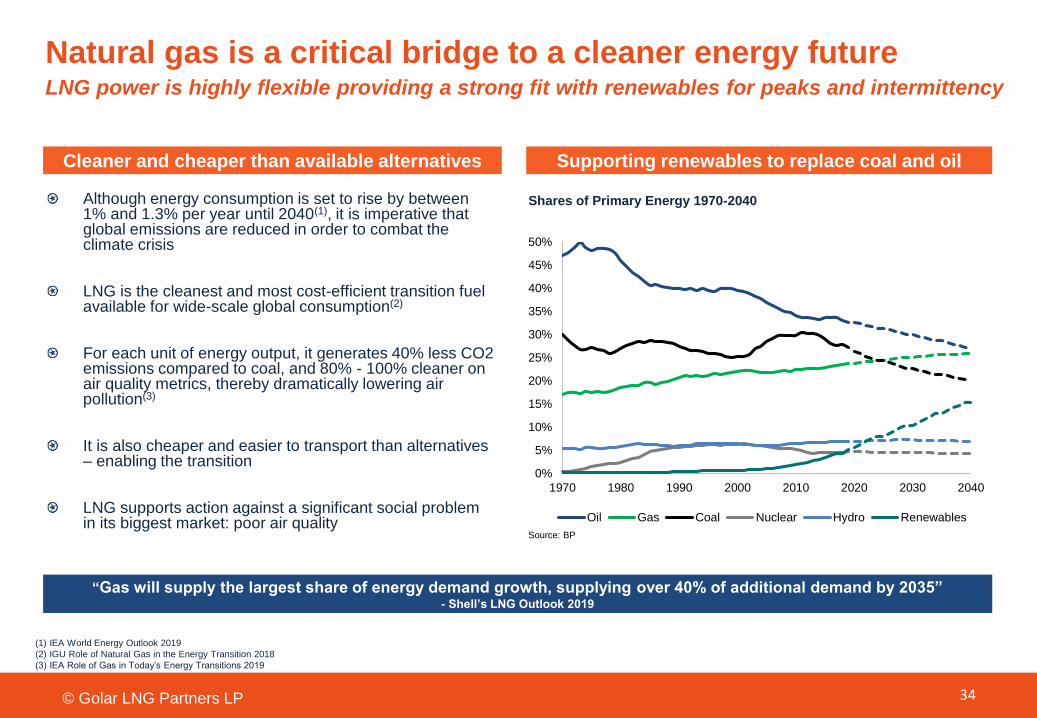
Natural gas is a critical bridge to a cleaner energy future
Although energy consumption is set to rise by between 1% and 1.3% per year until 2040(1), it is imperative that global emissions are reduced in order to combat the climate crisis
LNG is the cleanest and most cost-efficient transition fuel available for wide-scale global consumption(2)
For each unit of energy output, it generates 40% less CO2 emissions compared to coal, and 80% - 100% cleaner on air quality metrics, thereby dramatically lowering air pollution(3)
It is also cheaper and easier to transport than alternatives – enabling the transition
LNG supports action against a significant social problem in its biggest market: poor air quality
(1) IEA World Energy Outlook 2019
(2) IGU Role of Natural Gas in the Energy Transition 2018
(3) IEA Role of Gas in Today’s Energy Transitions 2019
Cleaner and cheaper than available alternatives Supporting renewables to replace coal and oil
“Gas will supply the largest share of energy demand growth, supplying over 40% of additional demand by 2035” - Shell’s LNG Outlook 2019
34© Golar LNG Partners LP
Shares of Primary Energy 1970-2040
0%
5%
10%
15%
20%
25%
30%
35%
40%
45%
50%
1970 1980 1990 2000 2010 2020 2030 2040
Oil Gas Coal Nuclear Hydro Renewables
Source: BP
LNG power is highly flexible providing a strong fit with renewables for peaks and intermittency

All holdings are 100% unless otherwise indicated
Corporate structure
35© Golar LNG Partners LP
Golar Winter Corporation
Golar Winter(Marshall Islands)
Golar Partners Operating LLC
(Marshall Islands)
Golar LNG 2215 Corporation
Methane Princess(Marshall Islands)
Golar Grand Corporation Golar Grand
(Marshall Islands)
Golar LNG 2234 LLC Golar Maria
(Republic of Liberia)
Golar LNG Partners LP(Marshall Islands)
Faraway Maritime Shipping Co Golar Mazo
(Republic of Liberia)
Golar Freeze Holding Co.
Golar Freeze(Marshall Islands)
Golar Spirit Corporation Golar Spirit
(Marshall Islands)
Other Vessel Owing
Subsidiaries
Golar Hull M2031 Corporation Golar Igloo
(Marshall Islands)
60%
PT Golar Indonesia Nusantara Regas Satu
(Indonesia)
49%Golar Eskimo Corporation
Golar Eskimo(Marshall Islands)
Golar Hilli LLC Hilli Episeyo FLNG
(Marshall Islands)
50% common units
$800 million ($568 million outstanding) senior secured amortizing term loan
and revolving credit facility maturing April 2021. One of the 7-vessels that
secures this facility (Methane Princess) also has a $123 million UK tax lease
outstanding with a corresponding lease security deposit of $115 million
Sale and leaseback with a subsidiary of CMBL ($181 million outstanding)
ending November 2025
$150 million senior unsecured bond maturing 22 May 2020
$250 million senior unsecured bond maturing 18 April 2021
Guarantees for 50% of a $960 million ($844 million outstanding) debt
financing
$74 million senior secured amortizing term loan and revolving credit facility
maturing November 2022
Unpledged

Distributable cash flow: Distributable cash flow represents Total Segment EBITDA adjusted for the cash components of interest, derivatives, tax and earnings from affiliates. We also include an
adjustment for maintenance and replacement capital expenditures (including expenditure on dry docking). This represents the Partnership's capital expenditures required to maintain the long-
term operating capacity of the Partnerships' capital assets. Distributable cash flow is a quantitative standard used by investors in publicly-traded partnerships to assist in evaluating a partnership's
ability to make quarterly cash distributions to common unitholders, general partners and incentive distribution rights ("IDRs"). Distributable cash flow is a non-GAAP liquidity measure and should
not be considered as an alternative to any other indicator of Golar Partners' performance calculated in accordance with U.S. GAAP. A reconciliation from Total Segment EBITDA to net income
before non-controlling interests, the most directly comparable U.S. GAAP measure is included in the Golar LNG Partners L.P. 2019 Q4 results.
Distribution coverage ratio: Distribution coverage ratio represents the ratio of distributable cash flow to total cash distributions paid. We believe that this measure allows investors and other
users of the financial statements to assess our liquidity based on our distributable cash flow. This presentation is consistent with management’s view of the business. Distribution coverage ratio is
a non-GAAP financial measure and should not be considered as an alternative to any other indicator of the Partnership’s performance calculated in accordance with US GAAP. A reconciliation of
the calculation is provided in the Golar LNG Partners L.P. 2019 Q4 results.
Non GAAP Measures impacted by management’s monitoring of the FLNG segment (i.e. our equity investment in Hilli LLC) on a proportionate basis: In Q42018 the Partnership
changed the way in which it measures the business and the operating segments of the Company. The two key changes were the introduction of “EBITDA” as the operating segment profit
measure and reporting our FLNG segment (our equity investment in Hilli LLC) on a proportionate basis. Although management monitors the operating segments based on EBITDA, a number of
our total metrics have also been impacted by our proportionate view of the FLNG segment. Specifically “Adjusted EBITDA”, “Annualized Adjusted EBITDA”, “Adjusted Net Debt” and “Revenue
Backlog”. These metrics are discussed below.
Adjusted EBITDA: Adjusted EBITDA is the EBITDA of our operating segments adjusted for amounts invoiced under finance leases. This is used as a supplemental financial measure by
management and investors to assess the Partnership’s total financial and operating performance. Management believes that it assists management and investors by increasing comparability of
its total performance from period to period and against the performance of other companies. Adjusted EBITDA is a non GAAP financial measure and should not be considered as an alternative to
net income or any other performance measure presented in accordance with US GAAP. Annualized Adjusted EBITDA is “Adjusted EBITDA” multiplied by 4. Management believe that this is a
useful performance measure as it includes a full year of FLNG EBITDA. Adjusted EBITDA is a non GAAP measure and should not be considered as an alternative to net income or any other
performance measure presented in accordance with GAAP. Please see the next slide for a reconciliation.
Adjusted Net Debt: Adjusted Net Debt includes short and long term third party borrowings (inclusive of our proportionate share of Hilli LLC’s debt) and our obligations under our capital leases
offset by cash, cash equivalents and restricted cash. Adjusted Net Debt is a non-GAAP financial measure used by investors to measure our performance and should not be considered as an
alternative to any other indicator of Golar Partners' performance calculated in accordance with U.S. GAAP. The Partnership believes that Adjusted Net Debt assists its management and investors
by increasing the comparability of its combined indebtedness and cash position against other companies in its industry. This increased comparability is achieved by providing a comparative
measure of debt levels irrespective of the levels of cash that a company maintains. We provide a ratio of Adjusted Net Debt to Annualized Total Segment EBITDA to enable our investors to
understand better our liquidity position and our ability to service our debt obligations. This presentation is consistent with management’s view of the business. Adjusted net debt is a non-GAAP
liquidity measure and should not be considered as an alternative to any other indicator of the Partnership’s performance calculated in accordance with US GAAP.
Revenue backlog: Revenue backlog is defined as the contracted daily charter rate for each vessel multiplied by the number of scheduled hire days for the remaining contract term. Revenue
backlog includes the Partnership’s pro-rata share of Hilli LLC’s contractual billings. This is consistent with management’s view of the business and our presentation in our segment note. Revenue
backlog is not intended to represent EBITDA or future cashflows that will be generated from these contracts. This measure should be seen as a supplement and not a substitute for our US GAAP
measures of performance.
Contract Earnings Backlog: Contract earnings backlog represents Golar Partner’s share of contracted fee income (including amounts invoiced under finance leases) for executed contracts less
forecasted operating expenses for these contracts. In calculating forecasted operating expenditure, management has assumed that where there is an Operating Services Agreement the amount
receivable under the services agreement will cover the associated operating costs. For contracts, which do not have a separate Operating Services Agreement management has made an
assumption about operating costs based on the current run rate. For Hilli Episeyo, which is not consolidated and where we do not own 100% of the share capital, management has only included
our proportionate 50% share of contract earnings.
36© Golar LNG Partners LP
Non-GAAP measures
Relevant to Golar LNG:
Contract earnings backlog: Contract earnings backlog represents Golar’s share of contracted fee income for executed contracts less forecasted operating expenses for these contracts. In
calculating forecasted operating expenditure, management has assumed that where there is an Operating Services Agreement the amount receivable under the services agreement will cover the
associated operating costs. For contracts, which do not have a separate Operating Services Agreement management has made an assumption about operating costs based on the current run
rate. The only material application of this methodology was to the Hilli Earnings backlog where we assumed operating costs of approximately $120kpd. For consolidated subsidiaries where Golar
does not own 100% of the share capital, management has only included Golar’s proportionate share of contract earnings. The material application of this assumption was to Gimi (70%
ownership) and Hilli (44.5% of the Common Unit entitlement). No contracted fee income is included for T3, T4 capacity or for the Hilli oil derivative. For equity accounted investments (the
Partnership and Golar Power) we have included its proportionate share of its contract earnings backlog under the same assumptions that we have applied to its consolidated subsidiaries.
37© Golar LNG Partners LP
Non-GAAP measures

THANK
YOU
© Golar LNG Partners LP 38