presentation on "the uk civil service people survey" made at the lead, engage, perform...
TRANSCRIPT

The UK Civil Service People Survey
Matt Kerlogue, Head of Employee Research OECD Expert Meeting on Public Sector Leadership for Improved Employee Engagement and Organisational Success, 21-22 January 2015

The UK context & background
2

3
NHS
Local authorities and other public sector bodies Education
Public corps A
rmed
For
ces
Police
Civil Service (407,000 FTE)
ND
PB
s

4
32
34
36
38
40
42
44
46
48
50
1948-‐49 1958-‐59 1968-‐69 1978-‐79 1988-‐89 1998-‐99 2008-‐09 2018-‐19
Per cen
t of G
DP
C urrent receipts
Total managed expenditure
Forecast
Source: O N S, O BR

5
5.6%
-0.3
%
-0.6
%
-1.2
%
-4.7
%
-5.2
%
-5.6
%
-7.4
%
-9.2
%
-12.
0%
-21.
0%
-24.
5%
-27.
6%
-32.
4%
-34.
4%
-36.
1%
-49.
0%
-56.
0%
-58.
6%
-62.
0%
-71.
7%
Inte
rnat
iona
l Dev
elopm
ent
Healt
h
Cabi
net O
ffice
Hom
e O
ffice
Educ
atio
n
Scot
land
North
ern
Irelan
d
Wale
s
Ener
gy a
nd C
limat
e Ch
ange
Defe
nce
Busin
ess,
Inno
vatio
n an
d Sk
ills
Small
and
Inde
pend
ent B
odies
Chan
cello
r's D
epar
tmen
ts
Cultu
re, M
edia
and
Spor
t
Just
ice
Law
Offic
ers'
Dep
artm
ents
Envir
onm
ent,
Food
and
Rur
al Af
fairs
Fore
ign
and
Com
mon
wea
lth O
ffice
Tran
spor
t
Wor
k an
d Pe
nsio
ns
Loca
l Gov
ernm
ent
Com
mun
ities
2009/10 to 2013/14 2009/10 to 2015/16
Change in resource budgets by government department!+4
3%

6
Civil Service FTE 2014 Q3, -80,000 (-16%)
UK public sector FTE 2014 Q3, -14%
2010
Q2
2010
Q3
2010
Q4
2011
Q1
2011
Q2
2011
Q3
2011
Q4
2012
Q1
2012
Q2
2012
Q3
2012
Q4
2013
Q1
2013
Q2
2013
Q3
2013
Q4
2014
Q1
2014
Q2
2014
Q3
Change in UK Civil Service and public sector employment since March 2010!

The Civil Service People Survey
7

The situation before 2009
8
§ Separate commissioning by departments and agencies – and not every organisation did a survey
§ Different question sets & scales
§ Different time points
§ Different cycles – bi-annual, annual, biennial, triennial, ad-hoc

2009: the Civil Service People Survey
9
§ Single survey contract let by Cabinet Office
§ Core questionnaire – but customisable
§ Annual survey each October
§ Standardised analytical approach
§ Standardised reporting
§ Now preparing for wave 6!

10
458,839!invited to participate!
274,080!responded!9,863!
unit results reports! 101!
organisations!
Civil Service People Survey 2014 in
numbers

11
January February March April May June
July August September October November December
Organisations submit local "questionnaire information
Organisations sign-off localised questionnaire
Supplier builds each organisation’s online
survey
Organisations sign-off online survey
Supplier does volumetric testing of
online survey
FIELDWORK
Organisations build first "draft of hierarchy
Organisations finalise reporting hierarchy
Data and reporting
Contractor management, account management of participating organisations
Briefing and analysis of CSPS 2015
Briefing and analysis of CSPS 2014 (cont.)
Supplier build draft localised questionnaires
Supplier builds draft localised questionnaires
Organisations build first draft of hierarchy
Supplier preparations

Organisation customisations Core questionnaire!§ 62 attitudinal questions § 19 demographic questions § 1 open comments question
Other languages*!§ Welsh language surveys § 35 foreign language versions
Alternative formats*!§ 10,991 paper surveys in 2012 § Braille surveys § Telephone surveys § Large print surveys
Variable terms!§ My organisation § my organisation § my organisation’s § Senior managers § senior managers § the executive team has § my organisation’s senior managers § your organisation
Access arrangements*!§ Generic or unique links
Logos & survey name!§ Not everyone calls their survey
the “People Survey” § Everyone has a different logo
Local options!§ The grade question has
localised responses to reflect local terms for different grades. This is then mapped behind the scenes.
§ The professions question allows additional local options.
Local questions*!§ Up to 10 attitudinal questions § Up to 2 demographic questions § 1 local comments question
Hierarchy!§ Over 9,000 units § Almost everyone has some
changes each year!
12

How we deliver the survey
Cabinet Office
central team!
Survey supplier!(ORC)!
Department / Agency!
Survey Set-Up Tool (SSUT) for main survey deliverables
For additional services or
complex issues
Survey specification & requests for
change (RFC)
Weekly round-up: up-coming deadlines, workshop dates,
providing guidance and support documents, highlighting relevant
news, cross-community communications
Monthly workshops during the survey build phase focussing
on upcoming deadlines
Technical survey infrastructure and
standardised reporting
13
Our engagement framework
14

15
Employee engagement!
Organisational performance!
Employee !wellbeing!
My work!
Organisational objectives and purpose
My manager!
My team
Learning and development
Inclusion and fair treatment
Resources and workload
Pay and benefits
Leadership and managing change!
By taking action to improve our people’s experiences of work...!
...we increase levels !of employee
engagement...!
...which raises performance and
enhances wellbeing.!

The engagement index - questions
16
Aspect! Question! Rationale!
Pride B50. I am proud when I tell others I am part of [my organisation]
An engaged employee feels proud to be associated with their organisation, by feeling part of it rather than just “working for” it.
Advocacy B51. I would recommend [my organisation] as a great place to work
An engaged employee will be an advocate of their organisation and the way it works.
Attachment B52. I feel a strong personal attachment to [my organisation]
An engaged employee has a strong, and emotional, sense of belonging to their organisation.
Inspiration B53. [My organisation] inspires me to do the best in my job
An engaged employee will contribute their best, and it is important that their organisation plays a role in inspiring this.
Motivation B54. [My organisation] motivates me to help it achieve its objectives
An engaged employee is committed to ensuring their organisation is successful in what it sets out to do.

Findings
17

18
Empl
oyee
en
gage
men
t ind
ex
Inclu
sion
and
fair
treat
men
t
My
wor
k
Org
anisa
tiona
l ob
jectiv
es a
nd
purp
ose
My
man
ager
My
team
Lear
ning
and
deve
lopm
ent
Reso
urce
s an
d w
orklo
ad
Pay
and
bene
fits
Lead
ersh
ip
and
man
aging
ch
ange
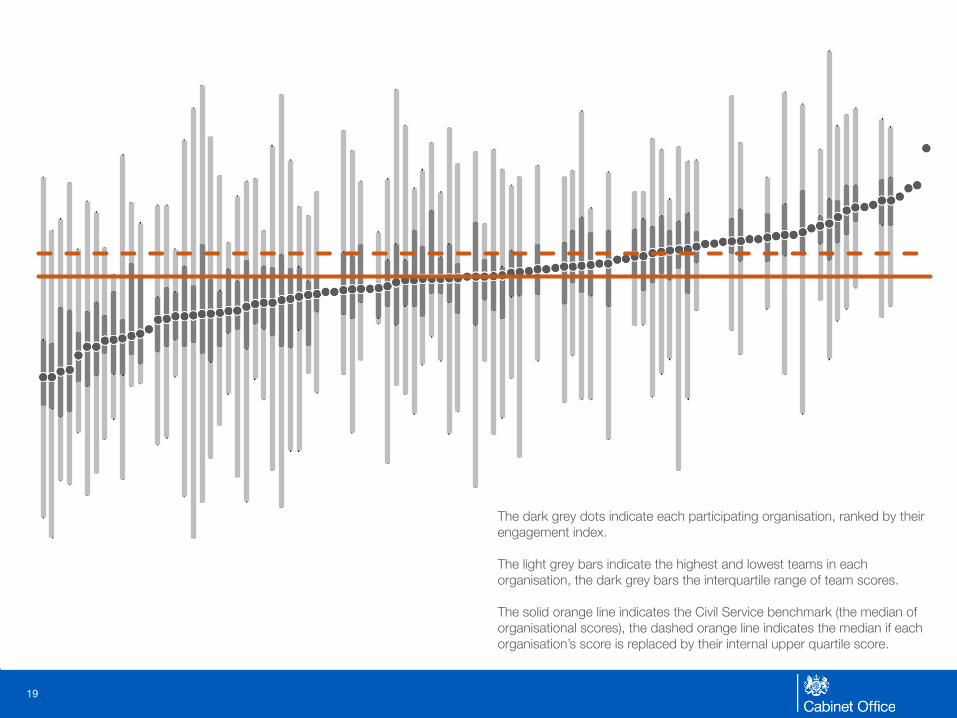
CSPS 2009-2014: Summary of organisational performance!
19
The dark grey dots indicate each participating organisation, ranked by their engagement index. The light grey bars indicate the highest and lowest teams in each organisation, the dark grey bars the interquartile range of team scores. The solid orange line indicates the Civil Service benchmark (the median of organisational scores), the dashed orange line indicates the median if each organisation’s score is replaced by their internal upper quartile score.
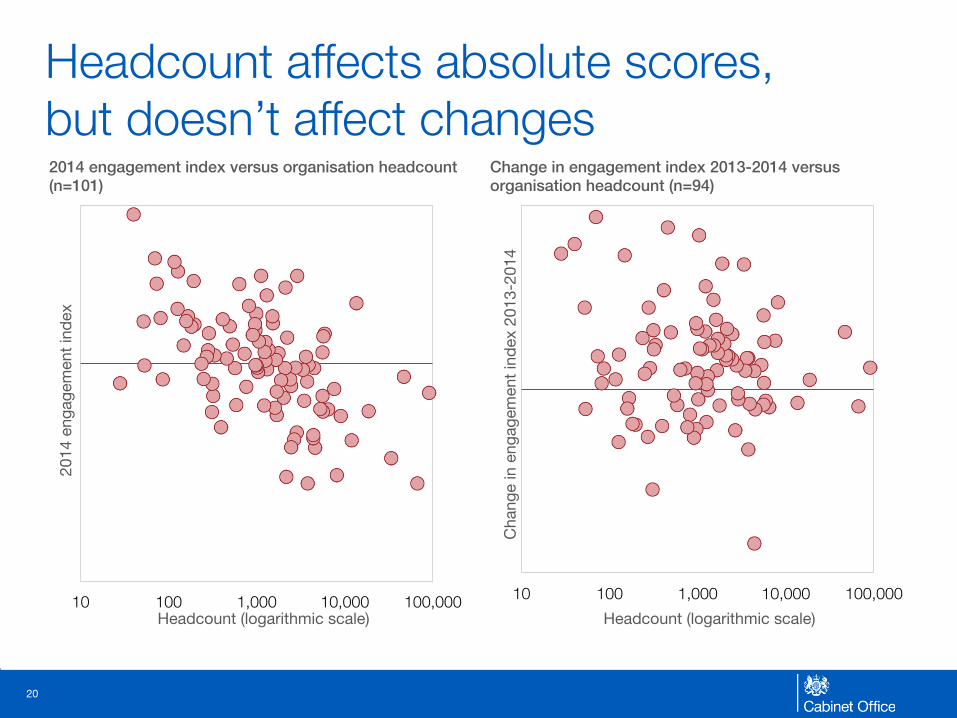
Headcount affects absolute scores, "but doesn’t affect changes
20
10 100 1,000 10,000 100,000
2014 engagement index versus organisation headcount (n=101)!
Headcount (logarithmic scale)
2014
eng
agem
ent i
ndex
10 100 1,000 10,000 100,000
Change in engagement index 2013-2014 versus organisation headcount (n=94)!
Headcount (logarithmic scale)
Cha
nge
in e
ngag
emen
t ind
ex 2
013-
2014

Engagement by grade & department
21
All
resp
onde
nts!
Policy departments and devolved administrations (excluding agencies) Operational departments A B C D E F G
H I J K L M
N O
P Q
R S
AO/AA 52%!
EO 52%!
SEO/HEO 55%!
G6/7 59%!
SCS 74%!
Colour shading indicates within each grade band (row) whether the department is in the 4th quartile (dark yellow), 3rd quartile (pale yellow), 2nd quartile (pale blue), or 4th quartile (dark blue). Where the grade group is the median group it is left white.

22
B50
B51
B52
B53
B54
B50
B51
B52
B53
B54
B50
B51
B52
B53
B54
Engaged – those who are proud advocates of their organisation, with a strong connection and alignment with the organisation.
Moderately engaged – those who are generally proud, attached advocates but not strongly so.
Uncertain – those who aren’t feeling proud, attached or aligned, but also aren’t negative towards those ideas.
B50
B51
B52
B53
B54
B50
B51
B52
B53
B54
B50
B51
B52
B53
B54
B50
B51
B52
B53
B54
Critics – those who aren’t proud, advocates or attached, but who aren’t negative towards alignment with the organisation.
Disconnected – those who don’t feel a sense of attachment or alignment, but who aren’t negative about pride or advocacy.
Disengaged – those who have a negative feelings about pride, advocacy, attachment and alignment, and often strongly so.
Disempowered – those who won’t advocate for us, don’t feel a sense of alignment, but who have a clear sense of attachment.

23
Scores by segment: Dark yellow: score 75% or higher Pale yellow: score 50%-74% Pale blue: score 25%-49% Dark blue: score 24% or below
Dise
ngag
ed
Disc
onne
cted
Critic
s
Dise
mpo
wer
ed
Unce
rtain
Mod
erat
ely
enga
ged
Enga
ged
Engagement index
My work
Organisational objectives "and purpose
My manager
My team
Learning and development
Inclusion and fair treatment
Resources and workload
Pay and benefit
Leadership and managing change

Case study of a participating organisation:�The Scottish Government
24

Scottish Government

The Sco(sh Approach
Scottish Government

People Strategy Evalua6on
Consul6ng & Planning
Ac6on and Support
Annual Report People Survey
Analysis
Dissemina6on
Ac#on Planning Cycle
Jan-‐ Feb
Jan -‐ Mar
Ongoing
Sept Oct
Nov
Dec
Analysis
Comms HR
• Leadership & Management
• Wellbeing &Resilience
• Building Capability

Engagement scores across Directorates
0%
10%
20%
30%
40%
50%
60%
70%
80%
Engagemen
t Score
Directorates
2012
2013
2014
2014 average
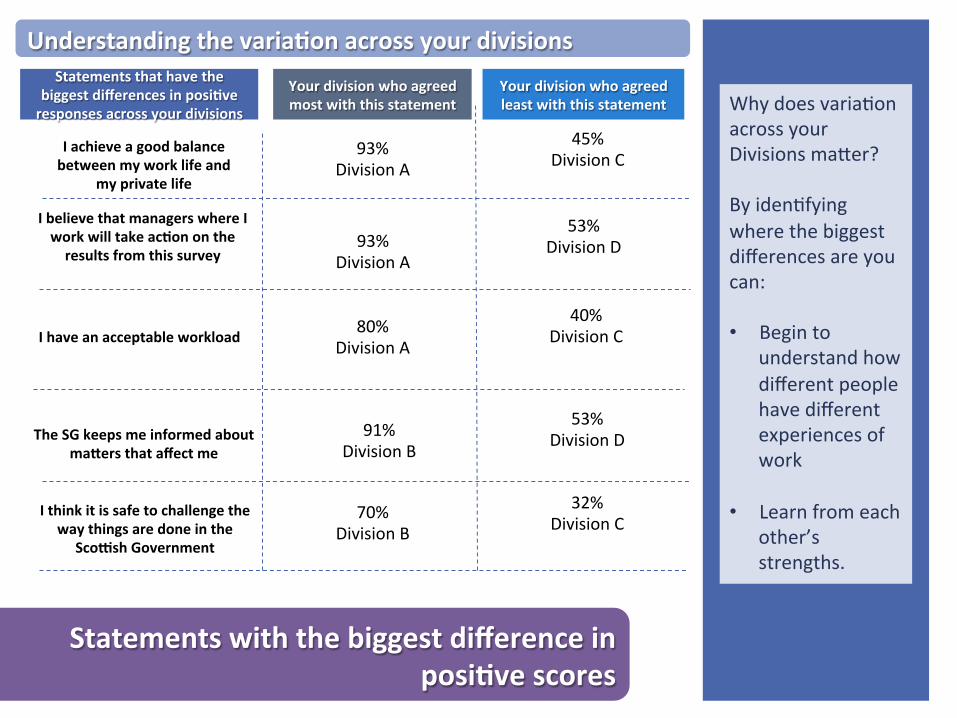
Statements with the biggest difference in posi#ve scores
Insert TEXT or figures
Insert TEXT or figures
Insert TEXT or figures
I achieve a good balance between my work life and
my private life
I have an acceptable workload
Statements that have the biggest differences in posi#ve responses across your divisions
Your division who agreed most with this statement
Your division who agreed least with this statement
53% Division D
93% Division A
Understanding the varia#on across your divisions
Why does varia6on across your Divisions maVer? By iden6fying where the biggest differences are you can: • Begin to
understand how different people have different experiences of work
• Learn from each other’s strengths.
I believe that managers where I work will take ac#on on the results from this survey
The SG keeps me informed about maGers that affect me
I think it is safe to challenge the way things are done in the
ScoHsh Government
80% Division A
91% Division B
70% Division B
93% Division A
40% Division C
45% Division C
53% Division D
32% Division C
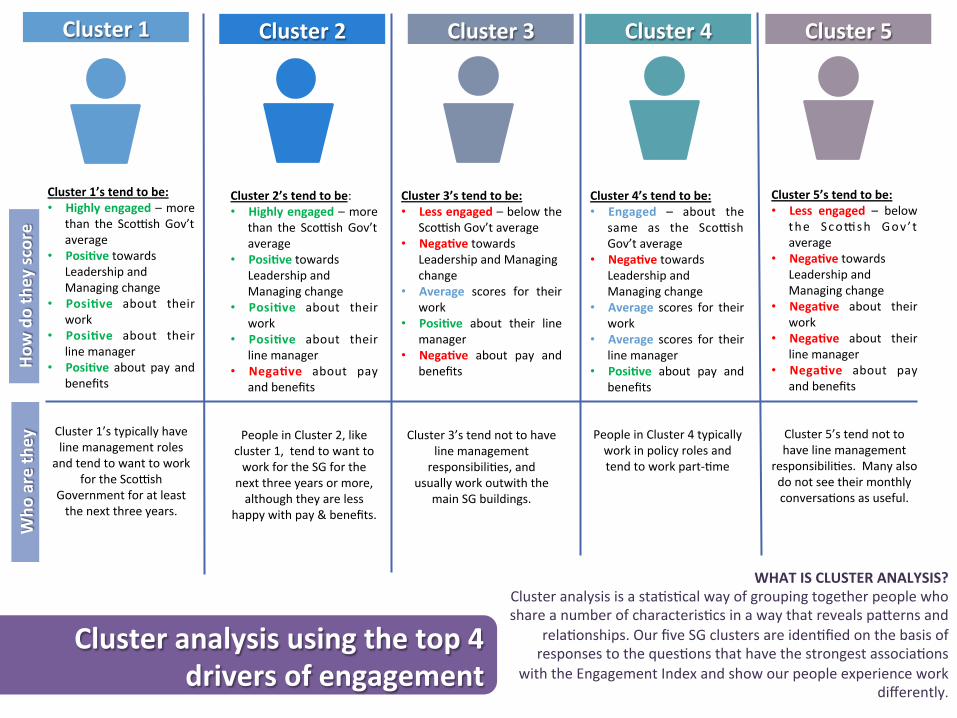
WHAT IS CLUSTER ANALYSIS? Cluster analysis is a sta6s6cal way of grouping together people who share a number of characteris6cs in a way that reveals paVerns and
rela6onships. Our five SG clusters are iden6fied on the basis of responses to the ques6ons that have the strongest associa6ons
with the Engagement Index and show our people experience work differently.
Cluster analysis using the top 4 drivers of engagement
Cluster 1 Cluster 2 Cluster 3 Cluster 4 Cluster 5
Cluster 4’s tend to be: • Engaged – about the
same as the Sco(sh Gov’t average
• Nega#ve towards Leadership and Managing change
• Average scores for their work
• Average scores for their line manager
• Posi#ve about pay and benefits
Cluster 3’s tend to be: • Less engaged – below the
Sco(sh Gov’t average • Nega#ve towards
Leadership and Managing change
• Average scores for their work
• Posi#ve about their line manager
• Nega#ve about pay and benefits
Cluster 3’s tend not to have line management responsibili6es, and
usually work outwith the main SG buildings.
Cluster 5’s tend to be: • Less engaged – below
the Sco(sh Gov ’ t average
• Nega#ve towards Leadership and Managing change
• Nega#ve about their work
• Nega#ve about their line manager
• Nega#ve about pay and benefits
Cluster 5’s tend not to have line management
responsibili6es. Many also do not see their monthly conversa6ons as useful.
Cluster 2’s tend to be: • Highly engaged – more
than the Sco(sh Gov’t average
• Posi#ve towards Leadership and Managing change
• Posi#ve about their work
• Posi#ve about their line manager
• Nega#ve about pay and benefits
People in Cluster 2, like cluster 1, tend to want to work for the SG for the
next three years or more, although they are less
happy with pay & benefits.
People in Cluster 4 typically work in policy roles and tend to work part-‐6me
How do they sc
ore
Who
are th
ey
Cluster 1’s tend to be: • Highly engaged – more
than the Sco(sh Gov’t average
• Posi#ve towards Leadership and Managing change
• Posi#ve about their work
• Posi#ve about their line manager
• Posi#ve about pay and benefits
Cluster 1’s typically have line management roles
and tend to want to work for the Sco(sh
Government for at least the next three years.

SA High short tern sickness absence
High Bullying & Harassment scores
Low Leading & Managing scores
Mul#ple Leadership & Management
Challenges
Capability review 2013– red status
Division
BH
BH
LM
BH
LM BH
LM
LM
LM
LM
SA
LM BH SA
31
LM BH
BH
BH
BH
LM
LM LM
BH
BH
LM SA
LM
LM BH
BH SA
BH SA
LM SA
LM SA
Impact
32

Impact
33
§ Cross-government analysis: support for professions, diversity groups, expert/shared services
§ Learning: common data creates a common currency and language to share experiences
§ Internal accountability: performance and talent management of senior officials
§ External accountability: National Audit Office, Parliamentary Committees, commentators

Contact
34
Matt Kerlogue, Head of Employee Research, Cabinet Office [email protected] Civil Service People Survey results & information: http://ow.ly/EAIgv Blog posts about the People Survey/Employee Engagement: http://ow.ly/HGuOZ Engage for Success (UK cross-economy employee engagement collaboration programme): http://www.engageforsuccess.org/