oecd economic outlook - christian kastrop, oecd
TRANSCRIPT

OECD ECONOMIC OUTLOOK
Senior Budget Officials Meeting
Stockholm, 9-10 June, 2016
Christian Kastrop Director, Economics Department

Key messages
The global economy is stuck in a “low-growth” trap •Growth in advanced economies is low and has declined in many EMEs •Weak trade and sluggish investment continue •Risks: Brexit, high credit growth and debt exposures in EMEs, volatile financial markets
Productivity growth has slowed and inequality has risen •Prolonged demand weakness is damaging long-term growth prospects •Productivity gains are not being widely shared •Wage growth is even lower than productivity growth
Comprehensive and collective action is needed to keep promises •Monetary policy alone cannot break out of low growth trap and may be overburdened • Fiscal space is eased with low interest rates; use public investment to support growth • Structural reform packages needed to boost productivity, wages and equality
2

Global GDP growth is low
Global GDP growth in 2016 projected to be about the same as 2015; 2017 only a little stronger
Growth is flat in advanced economies, slower in many EMEs
Projections Real GDP, Annual percentage changes
1. Moving nominal GDP weights using purchasing power parities. 2. Fiscal years starting in April. Source: OECD June 2016 Economic Outlook database.
GDP growth
2014 2015 2016 2017World1 3.3 3.0 3.0 3.3United States 2.4 2.4 1.8 2.2Euro area 1.0 1.6 1.6 1.7United Kingdom 2.9 2.3 1.7 2.0Japan 0.0 0.6 0.7 0.4China 7.3 6.9 6.5 6.2India2 7.2 7.4 7.4 7.5Brazil 0.1 -3.9 -4.3 -1.7
3

Global trade growth is weak, particularly in Asia
Note: SE Asia includes Chinese Taipei, Hong Kong, Malaysia, the Philippines, Singapore, Thailand and Vietnam. Euro area and SE Asia include intra-regional trade. Source: OECD June 2016 Economic Outlook database; OECD calculations.
Trade in goods and services Real annual growth
A return to pre-crisis trade growth would boost productivity by 1 per cent on average after 5 years
4

Rebalancing and on-shoring in China has contributed to weak trade growth
Note: Manufacturing (secondary) includes construction and utilities. Source: National Bureau of Statistics; General Administration of Customs.
Composition of growth in China The share of China’s processing trade is declining
5

Weak exports and investment are weighing on US growth
Contributions to quarterly US GDP growth
Source: OECD June 2016 Economic Outlook database. 6
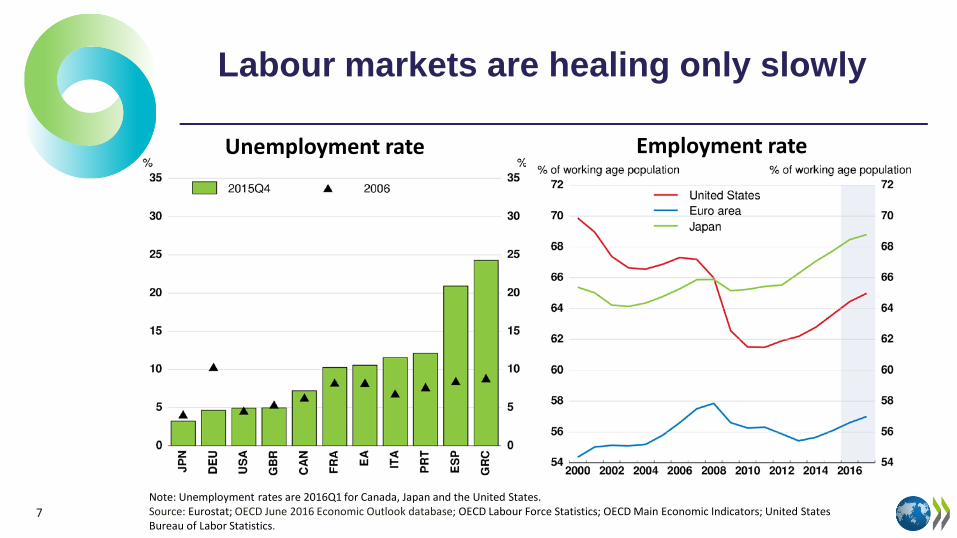
Labour markets are healing only slowly
Employment rate Unemployment rate
Note: Unemployment rates are 2016Q1 for Canada, Japan and the United States. Source: Eurostat; OECD June 2016 Economic Outlook database; OECD Labour Force Statistics; OECD Main Economic Indicators; United States Bureau of Labor Statistics.
7

Risks
8

Some EMEs are vulnerable to exchange rate shocks and high domestic debt
External liabilities Per cent of GDP, 2015 Q3 or latest available
Note: Credit to non-financial corporations. For South Africa, 2008 Q1 instead of 2007. Source: OECD June 2016 Economic Outlook database; BIS; IMF; and OECD calculations.
Credit to corporations has increased Per cent of GDP
9

Financial markets have been volatile
Source: Thomson Reuters.
Recovery only in US equity markets compared with summer 2015
Volatility in asset markets has increased Rolling 3-month standard deviations
10
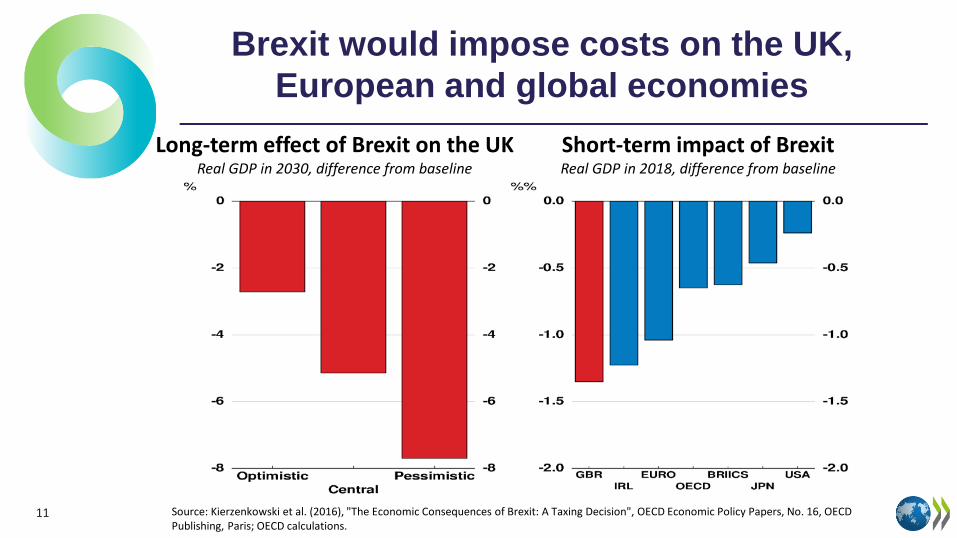
Brexit would impose costs on the UK, European and global economies
Source: Kierzenkowski et al. (2016), "The Economic Consequences of Brexit: A Taxing Decision", OECD Economic Policy Papers, No. 16, OECD Publishing, Paris; OECD calculations.
Long-term effect of Brexit on the UK Real GDP in 2030, difference from baseline
Short-term impact of Brexit Real GDP in 2018, difference from baseline
11

Slowing productivity growth and rising inequality
present significant challenges
12

Declining productivity growth is widespread in advanced economies and some EMEs
Note: Annualised rate. Output per hour worked for OECD economies. For non-OECD economies, measured as output per worker. Brazil is for 1991-2000. Source: OECD National Accounts database; OECD Productivity database.
Labour productivity growth
13
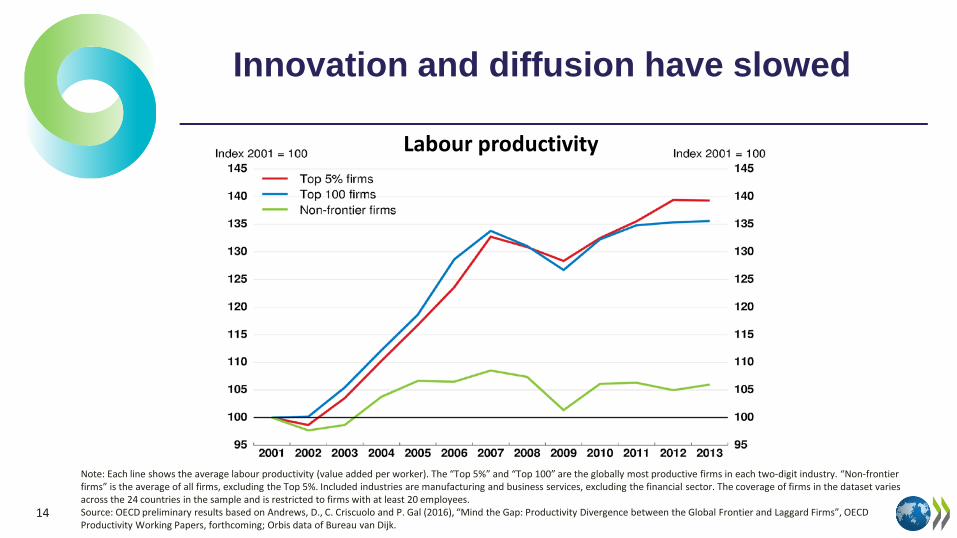
Innovation and diffusion have slowed
Labour productivity
Note: Each line shows the average labour productivity (value added per worker). The “Top 5%” and “Top 100” are the globally most productive firms in each two-digit industry. “Non-frontier firms” is the average of all firms, excluding the Top 5%. Included industries are manufacturing and business services, excluding the financial sector. The coverage of firms in the dataset varies across the 24 countries in the sample and is restricted to firms with at least 20 employees. Source: OECD preliminary results based on Andrews, D., C. Criscuolo and P. Gal (2016), “Mind the Gap: Productivity Divergence between the Global Frontier and Laggard Firms”, OECD Productivity Working Papers, forthcoming; Orbis data of Bureau van Dijk.
14

Incomes are rising very slowly for most workers, increasing inequality
Note: OECD is the unweighted average of the countries for which data are available. Source: OECD estimations based on Kappeler et al. (2016), “Decoupling of Productivity and Median Wage Growth: Macro-Level Evidence”, OECD Economics Department Working Papers, forthcoming; OECD National Accounts database; OECD Earnings database; OECD Income Distribution database; OECD calculations.
Wages growing less than productivity Annualised real growth rates, per hour worked,
1990-2013
15
Inequality in income is increasing Real household disposable income, total population

Productivity differences are correlated with wage inequality
Wage inequality and productivity dispersion across firms
Note: Data are for 2013. OECD is the unweighted average of the countries for which data are available. The P90/P50 ratio is labour income or labour productivity of the firm at the 90th percentile divided by the corresponding value of the firm at the median. Labour income is total compensation including taxes and the employer’s and employee’s social security contributions. Source: OECD estimations based on Saia and Schwellnus (2016), “Decoupling of Productivity and Median Wage Growth: Micro-Level Evidence”, OECD Economics Department Working Papers, forthcoming; Orbis.
Higher wage inequality
Greater productivity dispersion
16

Comprehensive and collective policy action is needed to deliver on promises
17

Failure to get out of the low-growth trap means broken promises to the youth
Note: For LHS, OECD is the unweighted average of 34 OECD countries. 2013 for Chile and the United States. Youth aged 15-24 for Japan. Source: OECD calculations based on national labour force surveys; OECD Short-Term Labour Market Statistics database.
Inactive and unemployed youth Share of all youth (15-29 years old)
Change in OECD employment rate From Q4 2007 to Q4 2015, % pts
Unemployment in the first 10 years of a worker’s career leads to large differences in life-time earnings
18

Keeping promises to older people is more difficult with low returns and low growth
Policy reforms become more urgent, including extending working lives
Falling retirement income for a given contribution
Note: The chart shows the impact of falling interest rates on real incomes in retirement for a defined contribution scheme. Annuity payments calculated for the same hypothetical individual contributing 10% of wages over a 40 year period. The assets are invested in a portfolio comprising 60% of variable income (fixed return of 4.5%) and 40% of fixed income (historical 10 year government bonds yields, kept to maturity) and used at retirement to buy an annuity with a life expectancy of 20 years at age 65 using actual government bond yields for calculating the annuity premium. Constant annual inflation of 2 per cent and productivity growth of 1.5 per cent are assumed. Source: OECD Business and Finance Outlook 2016 (forthcoming).
19
Year of retirement

Monetary policy is in unchartered waters
Negative central bank deposit rates in a number of economies
Source: Thomson Reuters.
Central bank balance sheets
20

Relying on monetary policy alone risks less effectiveness and harmful side effects
Some central banks are the dominant holders of government bonds
Share of total government debt securities
Falling bank share prices Per cent decline over the year to May 2016
Source: Central banks; Thomson Reuters; and OECD calculations.
21
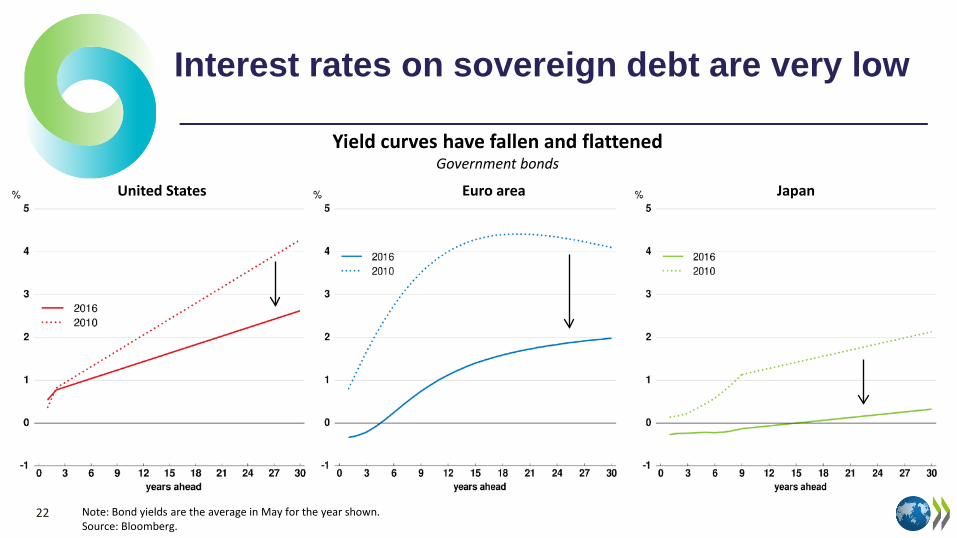
Interest rates on sovereign debt are very low
Yield curves have fallen and flattened Government bonds
Note: Bond yields are the average in May for the year shown. Source: Bloomberg.
22
United States Euro area Japan
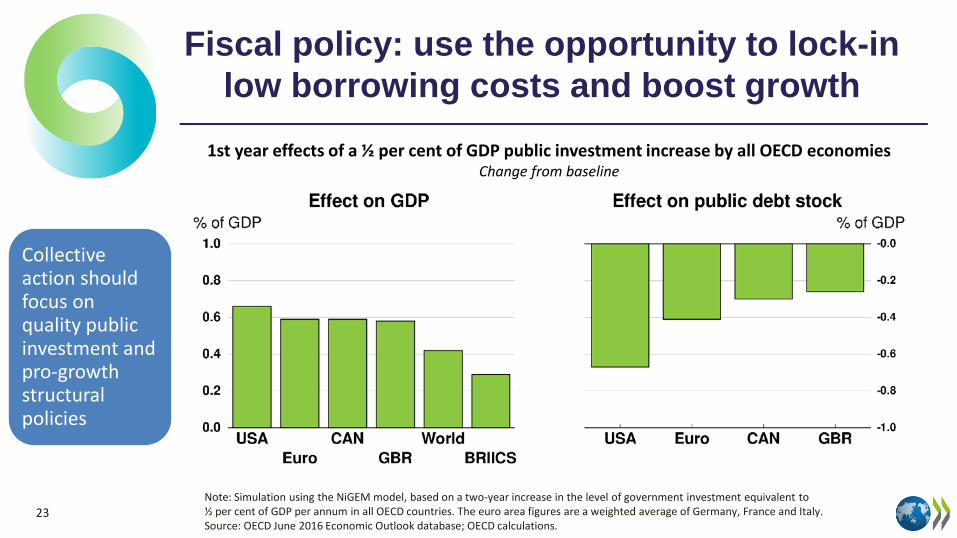
Fiscal policy: use the opportunity to lock-in low borrowing costs and boost growth
Note: Simulation using the NiGEM model, based on a two-year increase in the level of government investment equivalent to ½ per cent of GDP per annum in all OECD countries. The euro area figures are a weighted average of Germany, France and Italy. Source: OECD June 2016 Economic Outlook database; OECD calculations.
Collective action should focus on quality public investment and pro-growth structural policies
1st year effects of a ½ per cent of GDP public investment increase by all OECD economies Change from baseline
23

Structural policies to increase productivity can also boost demand and employment
Note: EMEs include Brazil, Chile, China, Colombia, India, Indonesia, Mexico, Russia, Turkey and South Africa; Mexico and Turkey only prior to 2011. Advanced includes the rest of the OECD. Source: OECD Going for Growth 2016.
Shift the composition of public spending to investment Encourage firm entry and investment in service sectors Reduce barriers to geographic and jobs mobility Package simultaneous labour and product market reforms Improve function of financial system and access to credit
The pace of structural reform has slowed Share of OECD Going for Growth recommendations implemented
Unique package for each country:
24

In the euro area, financial sector reforms are a key priority
Speed up resolution of non-performing loans: prudential tools and asset management companies can help
Complete banking union: set up a common backstop to the Single Resolution Fund and deposit insurance at the European level
25
0
5
10
15
20
25
2010 2011 2012 2013 2014 2015¹
France Germany Italy Spain Ireland Portugal
Non-performing loans (% of total)
1. Average of first three quarters. Source: European Central Bank.

Summary
Diagnosis: Low-growth trap • Subdued investment, trade, employment, wage, and productivity growth
Risks: Substantial downside •Brexit, EME financial vulnerabilities, increased financial market volatility
Consequences: Broken promises to young, old, investors • Slowing productivity, reduced long-term growth prospects, rising inequality
Recommendations: Comprehensive, coherent, collective action •Quality public investment, country-specific structural reforms, reduce
burden on monetary policy
Outcome: A high-growth path that keeps promises • Stronger investment, trade, employment, consumption, productivity, equity 26

Designing the public finances to promote growth and equity
27
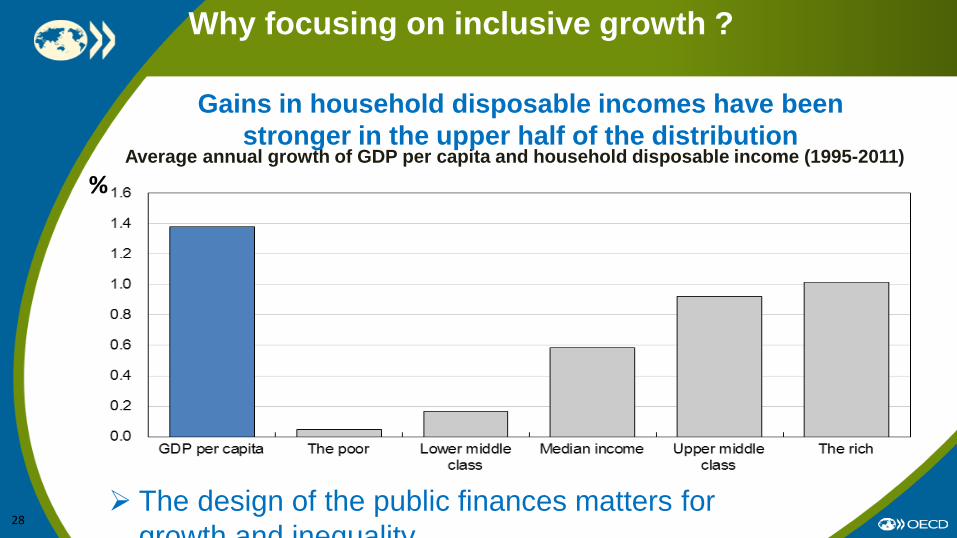
Average annual growth of GDP per capita and household disposable income (1995-2011)
Why focusing on inclusive growth ?
%
Gains in household disposable incomes have been stronger in the upper half of the distribution
The design of the public finances matters for growth and inequality
28

Redistribution mainly occurs via transfers
Reduction in the GINI coefficient due to taxes and transfers, %
Source: OECD Income distribution data base 29

The structure of spending has remained fairly stable
Average across OECD countries, % of potential GDP
Public investment Public investment Public investment
Education EducationEducation
Health HealthHealth
Old-age and survivor pensions
Old-age and survivor pensions
Old-age and survivor pensions
Sickness and disabilitySickness and disability Sickness and disabilityUnemployment benefitsUnemployment benefits Unemployment benefitsFamily and child
Family and child Family and child
Wages and intermediate consumption - other
purposes
Wages and intermediate consumption - other
purposes
Wages and intermediate consumption - other
purposes
SubsidiesSubsidies Subsidies
Other primary expenditureOther primary expenditure Other primary expenditure
0
5
10
15
20
25
30
35
40
45
2001 2007 2013
30

Design of public spending, growth and inequality
Key issue: Sustain long-term growth while addressing inequality. Design of public finance matter as the effect of type of spending
and tax on growth and inequality likely differ.
Empirical set-up: Growth: Neoclassical convergence model Inequality: Empirical framework estimates the impact of the mix of spending along the distribution of household income.
Insights:
• Effect of the size and the mix of public spending on growth and inequality
31

Main results of public spending reforms on growth and inequality
Policy Growth Equity Countries with the most room for growth gains
Decrease in the size of the government
Low to moderate government effectiveness + -
BEL, CZE, FRA, GRC, HUN, ITA, POL, PRT, SVN High government
effectiveness n.s. -
Increasing government effectiveness + + FRA, GRC, HUN, ITA, SVN
Increasing education outcomes + 0/+ CHL, GRC, MEX, PRT, TUR
Increasing public investment + n.s. BEL, DEU, GBR, IRL, ISR, ITA, MEX, TUR
Reducing pension spending + n.s. AUT, DEU, FIN, FRA, GRC, ITA, JPN, POL, PRT, SVN
Increasing family benefits n.s. + CHE, ESP, GRC, PRT
Decreasing public subsidies + - BEL, CHE
32
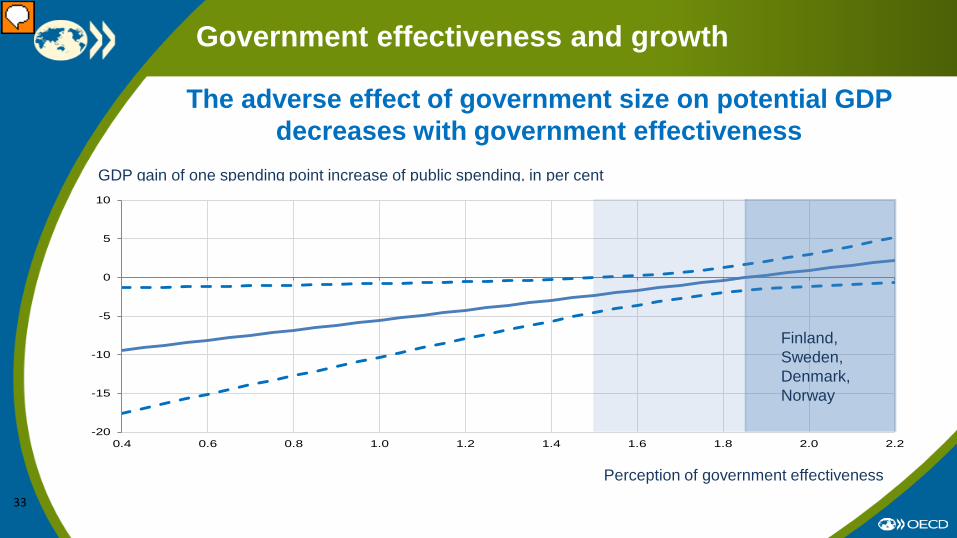
Government effectiveness and growth
The adverse effect of government size on potential GDP decreases with government effectiveness
GDP gain of one spending point increase of public spending, in per cent
Perception of government effectiveness
-20
-15
-10
-5
0
5
10
0.4 0.6 0.8 1.0 1.2 1.4 1.6 1.8 2.0 2.2
Finland, Sweden, Denmark, Norway
33
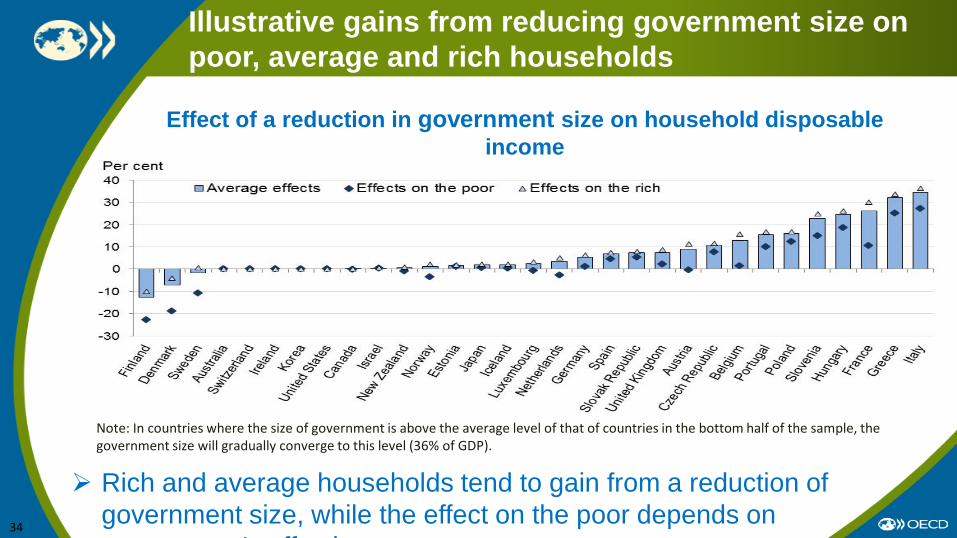
Illustrative gains from reducing government size on poor, average and rich households
Note: In countries where the size of government is above the average level of that of countries in the bottom half of the sample, the government size will gradually converge to this level (36% of GDP).
Rich and average households tend to gain from a reduction of government size, while the effect on the poor depends on
t’ ff ti
Effect of a reduction in government size on household disposable income
34

Decreasing returns to public investment?
The effect of public investment on potential GDP decreases with the level of capital stock
The analysis suggests that all OECD countries, except Japan, have room for additional public investment.
GDP gain of one spending point increase of public investment, in per cent
Public capital stock, per cent of potential GDP
-15
-10
-5
0
5
10
15
20 40 60 80 100 120
United States, Luxembourg, Iceland
Japan
35
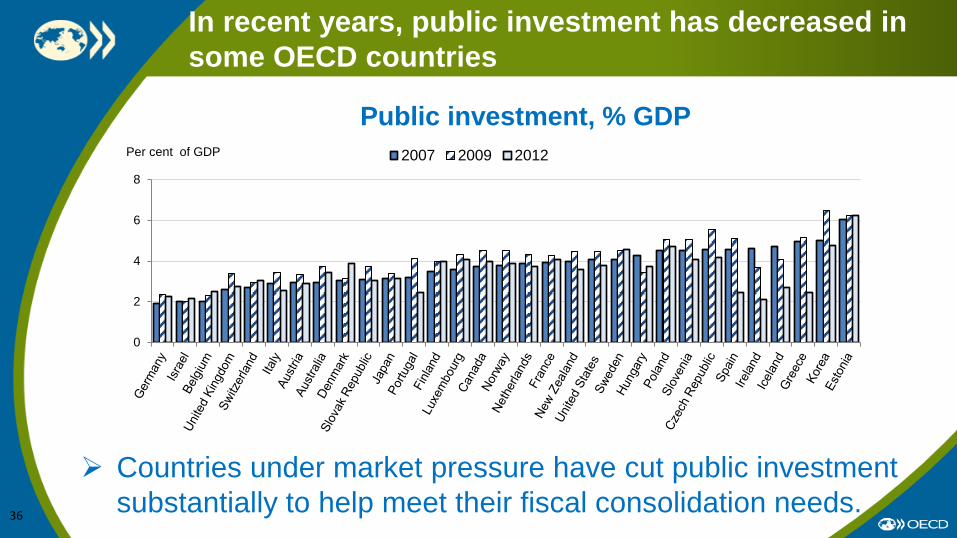
In recent years, public investment has decreased in some OECD countries
Public investment, % GDP
Countries under market pressure have cut public investment substantially to help meet their fiscal consolidation needs.
36
0
2
4
6
8
Per cent of GDP 2007 2009 2012

Thank you
www.oecd.org/economy/economicoutlook.htm
ECOSCOPE blog: oecdecoscope.wordpress.com/