presentation for the first quarter fiscal 2021
TRANSCRIPT

Presentation for IR Meeting
July 28, 2021
Q1 Fiscal 2021 - Apr 1, 2021 to Jun 30, 2021-

© 2021 Tokuyama Corporation. All rights reserved. 2
• Year-on-year increase in earnings in the April to June first quarter due to the solid sales of semiconductor-related products, recovery from the impact of COVID-19 and increased export price of VCM
• Continue to focus on efforts aimed at achieving the performance forecasts for fiscal 2021, announced on April 28, by taking the measures such as revision of sales prices to recover the increase of production costs caused by soaring prices of fuel and raw materials
• Steadily implement R&D and capital investment centered on growth businesses to achieve the “Medium-Term Management Plan 2025”
Key points of the first quarter of fiscal 2021

© 2021 Tokuyama Corporation. All rights reserved.
CONTENTS
1
2
3
Financial Results for Q1 FY2021
Performance Forecasts for FY2021
4 Supplementary Material
3
Topics

© 2021 Tokuyama Corporation. All rights reserved. © 2021 Tokuyama Corporation. All rights reserved. 4
Financial Results for Q1 FY2021 1. Financial Highlights
2. Net Sales / Operating Profit by Business Segment
3. Changes in Operating Profit
4. Changes in Net Sales / Operating Profit by Business Segment
1

© 2021 Tokuyama Corporation. All rights reserved.
1. Financial Highlights
5
1 Financial Results for Q1 FY2021
(Billions of yen)
Accounting Standard for Revenue Recognition:
Q1 FY2020 Q1 FY2021 Difference Main changing factors
Not applied Top :Applied Amount % Bottom:Not applied
Net sales 70.6 67.4 (3.1) (4) Higher overseas market prices for vinyl chloride-related products Solid sales of semiconductor-related products 78.9 +8.3 +12
Operating profit 6.6 7.4 +0.8 +13 Higher overseas market prices for vinyl chloride monomer (VCM) Solid sales of semiconductor-related products
Ordinary profit 6.6 7.9 +1.2 +18 Increase in operating profit
Profit attributable to owners of parent
5.2 4.9 (0.2) (5) Increase in Income taxes
Basic earnings per share (yen) 74.94 68.65 - - -
Exchange rate (yen/USD) 108 109 - - -
Domestic naphtha price (yen/kl) 25,500 47,900 - - -

© 2021 Tokuyama Corporation. All rights reserved.
(Billions of yen)
1. Financial Highlights
6
As of Mar 31,2021 As of Jun 30,2021 Difference Main changing factors
Total assets 386.7 393.8 +7.0 Increase in fixed assets due to capital investment
Shareholders’ equity 198.5 200.9 +2.4 Posting profit attributable to owners of parent
Shareholders’ equity ratio 51.3% 51.0% (0.3pts) -
Interest-bearing debt 98.4 95.9 (2.4) Decrease in long-term loans payable
D/E ratio 0.50 0.48 (0.02) -
Net D/E ratio* 0.07 0.05 (0.02) -
Net assets per share (yen) 2,758.37 2,791.89 - -
*Net D/E ratio: (Interest-bearing debt – Cash and deposits, Cash equivalents, Money in trust)/Shareholders’ equity
1 Financial Results for Q1 FY2021

© 2021 Tokuyama Corporation. All rights reserved.
2. Net Sales/Operating Profit by Business Segment
7
(Billions of yen) (Year-on-year change)
1
Accounting Standard for Revenue Recognition:
Q1 FY2020 Q1 FY2021 Difference Not applied Top :Applied Bottom:Not applied Net sales Operating profit Net sales Operating profit Net sales % Operating profit %
Chemicals 18.8 2.4 24.0 4.0 +5.1 +27 +1.6 +69 24.3 +5.4 +29
Cement 19.7 1.4 12.2 0.5 (7.5) (38) (0.8) (60) 22.8 +3.1 +16
Electronic Materials 13.4 1.5 16.5 2.1 +3.0 +23 +0.6 +42 16.6 +3.1 +23
Life Science 6.7 0.8 7.4 1.1 +0.7 +11 +0.2 +34 7.4 +0.7 +11
Eco Business 2.0 (0.1) 2.2 (0.1) +0.1 +9 (0.0) - 2.3 +0.3 +17
Others 19.0 1.4 7.8 0.8 (11.1) (59) (0.5) (37) 13.1 (5.8) (31)
Total 79.9 7.3 70.4 8.5 (9.5) (12) +1.1 +16 86.8 +6.9 +9 Inter-segment
eliminations and corporate-wide expenses
(9.3) (0.7) (2.9)
(1.0) +6.4
- (0.3) - (7.9) +1.4 Consolidated
Results 70.6 6.6 67.4
7.4 (3.1) (4)
+0.8 +13 78.9 +8.3 +12
Financial Results for Q1 FY2021
(Note) Sales and operating profit in each segment shown above include inter-segment transactions

© 2021 Tokuyama Corporation. All rights reserved. © 2021 Tokuyama Corporation. All rights reserved.
6.6 7.4
Q1 FY 2020 Raw material andfuel price
Sales volume Selling price Improvement ofoperation
Fixed costs andothers
Q1 FY 2021
8
+3.1 (3.8)
(2.5)
+0.4
• Increase in sales of semiconductor-related products (+) • Recovery from the impact of COVID-19 (+)
• Upturn in price of vinyl chloride related products (+)
+3.6 • Raw material and fuel price (-)
• Increase in depreciation (-) • Increase in R&D (-)
3. Changes in Operating Profit 1 Financial Results for Q1 FY2021
(Billions of yen) By Factor
(Year-on-year change)

© 2021 Tokuyama Corporation. All rights reserved.
4. Changes in Net Sales / Operating Profit by Business Segment
9
Financial Results for Q1 FY2021 1
Qualitative information (Caustic soda) • Earnings declined despite the recovery in sales volume, which
had decreased due to the spread of COVID-19. This downturn in earnings was due to manufacturing costs rising as a result of higher raw material and fuel costs
(Vinyl chloride monomer (VCM)) • Its earnings increased due to the upturn in export prices (Vinyl chloride resin) • Results were essentially in line with the corresponding period of
the previous fiscal year. While manufacturing costs rose as a result of higher raw material and fuel costs, unchanged earnings reflected progress made in revising selling prices
Chemicals (Billions of yen)
Higher earnings on higher sales
2021年3月期 … 2022年3月期 …
(Year-on-year change)
Q1 FY2020 Q1 FY2021
The impact of the application of the Accounting Standard for Revenue Recognition and other standards
Net Sales Operating Profit
18.8 17.7 21.3 23.3 24.0
2.4 2.6 3.8 4.6
4.0
20.1Q 20.2Q 20.3Q 20.4Q 21.1Q
18.8 24.0 24.3
2.4 4.0
Q1/ FY20
Q2/ FY20
Q3/ FY20
Q4/ FY20
Q1/ FY21

© 2021 Tokuyama Corporation. All rights reserved.
2021年3月期 … 2022年3月期 …
4. Changes in Net Sales / Operating Profit by Business Segment
10
1
Lower earnings on lower sales
Qualitative information (Cement) • Its earnings decreased, despite shipments being in line with the
corresponding period of the previous year. Lower earnings reflected manufacturing costs rising as a result of higher raw material costs
Cement
(Year-on-year change)
Financial Results for Q1 FY2021
Q1 FY2020 Q1 FY2021
(Billions of yen)
The impact of the application of the Accounting Standard for Revenue Recognition and other standards
Net Sales Operating Profit
19.7 22.3 25.2 22.2
12.2 1.4
0.8
1.4
0.6 0.5
20.1Q 20.2Q 20.3Q 20.4Q 21.1Q
19.7
12.2
22.8
1.4 0.5
Q1/ FY20
Q2/ FY20
Q3/ FY20
Q4/ FY20
Q1/ FY21

© 2021 Tokuyama Corporation. All rights reserved.
13.4 16.5
1.5 2.1
2021年3月期 … 2022年3月期 …
4. Changes in Net Sales / Operating Profit by Business Segment
13.4 14.4 16.1 17.7 16.5
1.5 1.5 1.9 2.1 2.1
20.1Q 20.2Q 20.3Q 20.4Q 21.1Q
11
1
Qualitative information (Semiconductor-grade Polycrystalline silicon) • Earnings increased owing to firm sales on the back of the
introduction of 5G and an increase in remote work (IC Chemicals) • Its earnings decreased despite sales volumes increasing mainly
overseas. This downturn largely reflected higher raw material costs
(Fumed Silica) • Earnings increased owing to higher sales volume centered on
applications for semiconductor abrasives (Thermal management materials) • Results were essentially in line with the corresponding period of
the previous fiscal year. Although sales volume was solid, this largely reflected higher R&D expenses at the Center for Commercialization of Advanced Technology
Higher earnings on higher sales
(Billions of yen)
(Year-on-year change)
Financial Results for Q1 FY2021
The impact of the application of the Accounting Standard for Revenue Recognition and other standards is not shown because it is minor
Net Sales Operating Profit
Q1 FY2020 Q1 FY2021
Electronic Materials
Q1/ FY20
Q2/ FY20
Q3/ FY20
Q4/ FY20
Q1/ FY21

© 2021 Tokuyama Corporation. All rights reserved.
6.7 6.0 6.7
9.0 7.4
0.8
0.1
0.8
1.5 1.1
20.1Q 20.2Q 20.3Q 20.4Q 21.1Q
6.7 7.4
0.8 1.1
2021年3月期 … 2022年3月期 …
4. Changes in Net Sales / Operating Profit by Business Segment
12
1
(Year-on-year change)
Qualitative information (Plastic lens-related materials) • Earnings increased owing to a recovery in shipments to Europe
and the United States of eyeglass lens photochromic materials, which had declined as a result of the spread of COVID-19
(Dental materials) • Its earnings grew thanks to a recovery in shipments to Europe
and the United States, which had declined as a result of the spread of COVID-19
(Medical diagnostic systems) • Its sales decreased. This largely reflected a decline in sales
volumes of laboratory information systems and laboratory automation systems
(Billions of yen)
Higher earnings on higher sales
Financial Results for Q1 FY2021
Q1 FY2020 Q1 FY2021
The impact of the application of the Accounting Standard for Revenue Recognition and other standards is not shown because it is minor
Net Sales Operating Profit
Life Science
Q1/ FY20
Q2/ FY20
Q3/ FY20
Q4/ FY20
Q1/ FY21

© 2021 Tokuyama Corporation. All rights reserved.
2.0 2.0 2.4
2.9 2.2
4. Changes in Net Sales / Operating Profit by Business Segment
13
1
(Year-on-year change)
Qualitative information (Ion exchange membranes) • Earnings were all in line with the corresponding period of the
previous year thanks to solid shipments mainly for overseas projects
(Plastic window sashes) • Earnings were all in line with the corresponding period of the
previous year owing to steady housing starts
(Billions of yen)
Loss on higher sales
Financial Results for Q1 FY2021
Eco Business
The impact of the application of the Accounting Standard for Revenue Recognition and other standards
Net Sales Operating Profit
(0.1) (0.1) (0.0) 0.0 (0.1)
2.0 2.2 2.3
(0.1) (0.1)
2021年3月期 … 2022年3月期 …
Q1/ FY20
Q2/ FY20
Q3/ FY20
Q4/ FY20
Q1/ FY21
Q1 FY2020 Q1 FY2021

© 2021 Tokuyama Corporation. All rights reserved. © 2021 Tokuyama Corporation. All rights reserved. 14
Performance Forecasts for FY2021
1. Performance Forecasts
2. Performance Forecasts by Business Segment
2

© 2021 Tokuyama Corporation. All rights reserved.
(Billions of yen)
1. Performance Forecasts
15
Accounting Standard for Revenue Recognition:
FY2020 Results FY2021 Forecasts Difference Main changing factors
Not applied Top:Applied Amount % Bottom:Not applied
Net sales 302.4 271.0 (31.4) (10) Improve in impact of COVID-19
Increased sales volume in semiconductor-related products Price increase of petroleum products 314.0 +11.6 +4
Operating profit 30.9 26.0 (4.9) (16) Increase investment for future growth Increase in fuel and raw material prices
Ordinary profit 30.7 26.0 (4.7) (16) Decrease in operating profit
Profit attributable to owners of parent
24.5 22.0 (2.5) (10) Decrease in ordinary profit
Basic earnings per share (yen) 351.11 305.62 - - -
Exchange rate (yen/USD) 106 1Q results:109 - - - 2-4Q forecast:110
Domestic naphtha price (yen/kl) 31,200 1Q results:47,900 - - - 2-4Q forecast:49,500
Performance Forecasts for FY2021 2 The forecast, announced on April 28, 2021, has not been revised

© 2021 Tokuyama Corporation. All rights reserved.
Accounting Standard for Revenue Recognition:
FY2020 Results FY2021 Forecasts Difference Not applied Top:Applied Bottom:Not applied
Net sales Operating profit Net sales Operating profit Net sales % Operating profit %
Chemicals 81.3 13.5 90.0 13.5 +8.6 +11 (0.0) (1) 91.3 +9.9 +12
Cement 89.5 4.3 53.0 3.0 (36.5) (41) (1.3) (32) 91.1 +1.5 +2
Electronic Materials 61.8 7.1 68.5 5.0 +6.6 +11 (2.1) (30) 68.8 +6.9 +11
Life Science 28.6 3.4 31.0 4.0 +2.3 +8 +0.5 +14 31.2 +2.6 +9
Eco Business 9.5 (0.3) 11.0 0.0 +1.4 +15 +0.3 - 11.4 +1.8 +19
Others 62.3 5.6 33.0 5.0 (29.3) (47) (0.6) (12) 51.6 (10.7) (17)
Total 333.4 33.9 286.5 30.5 (46.9) (14) (3.4) (10) 345.6 +12.1 +4 Inter-segment
eliminations and corporate-wide expenses
(31.0) (3.0) (15.5) (4.5) +15.5 - (1.4) -
(31.6) (0.6) Consolidated
Results 302.4 30.9 271.0 26.0 (31.4) (10) (4.9) (16) 314.0 +11.6 +4
(Billions of yen) 2. Performance Forecasts by Business Segment
16
Performance Forecasts for FY2021 2 The forecast, announced on April 28, 2021, has not been revised
(Note) Sales and operating profit in each segment shown above include inter-segment transactions

© 2021 Tokuyama Corporation. All rights reserved. © 2021 Tokuyama Corporation. All rights reserved. 17
1. Current status of semiconductor-related products
3 Topics

© 2021 Tokuyama Corporation. All rights reserved. © 2021 Tokuyama Corporation. All rights reserved.
1. Current status of semiconductor-related products
18
• After recovery from downturn trend of semiconductor market in 2019, semiconductor-related business keeps growing with the recent spread of remote work and the introduction of 5G
Q1/19 Q2 Q3 Q4 Q1/20 Q2 Q3 Q4 1Q/21
Domestic Export
Q1/19 Q2 Q3 Q4 Q1/20 Q2 Q3 Q4 1Q/21
Domestic Export
Q1/19 Q2 Q3 Q4 Q1/20 Q2 Q3 Q4 1Q/21
Domestic Export
Q1/19 Q2 Q3 Q4 Q1/20 Q2 Q3 Q4 1Q/21
Domestic Export
・Polycrystalline silicon ・Fumed Silica
・High-purity Aluminum Nitride Powder ・High purity chemicals for electronics manufacturing
3 Topics


© 2021 Tokuyama Corporation. All rights reserved. © 2021 Tokuyama Corporation. All rights reserved. 20
Supplementary Material 4
1. Consolidated Financial Statements
2. Performance Trend

© 2021 Tokuyama Corporation. All rights reserved.
Income Statements (Billions of yen)
1. Consolidated Financial Statements
21
Q1 FY2020 Q1 FY2021 Difference Accounting Standard for Revenue Recognition: Not applied Applied Amount %
Net sales 70.6 67.4 (3.1) (4) Cost of sales 48.3 43.2 +5.1 +11 Selling, general and administrative expenses 15.6 16.7 (1.1) (8)
Operating profit 6.6 7.4 +0.8 +13 Non-operating income/expenses 0.0 0.4 +0.3 -
Ordinary profit 6.6 7.9 +1.2 +18 Extraordinary income/expenses (0.3) (0.1) +0.1 -
Profit/loss before income taxes 6.3 7.7 +1.4 +22 Income taxes 0.8 2.7 (1.9) (231) Non-controlling interests 0.3 0.0 +0.2 +85
Profit attributable to owners of parent 5.2 4.9 (0.2) (5)
4 Supplementary Material
*Regarding changes, income or profit is shown as positive and expenses or losses are shown as negative amount.

© 2021 Tokuyama Corporation. All rights reserved.
Balance Sheets (Billions of yen)
1. Consolidated Financial Statements
22
3/31/2021 6/30/2021 Changes Amount %
Total assets 386.7 393.8 +7.0 +2 Current assets 199.7 201.1 +1.3 +1
Tangible fixed assets 124.0 129.5 +5.5 +4
Intangible fixed assets 1.8 1.8 (0.0) (1)
Investments and other assets 61.1 61.2 +0.1 +0
3/31/2021 6/30/2021 Changes Amount %
Total liabilities 181.5 184.6 +3.0 +2 Current liabilities 83.3 94.9 +11.6 +14
Long-term liabilities 98.2 89.6 (8.5) (9)
Total net assets 205.2 209.1 +3.9 +2
4 Supplementary Material

© 2021 Tokuyama Corporation. All rights reserved.
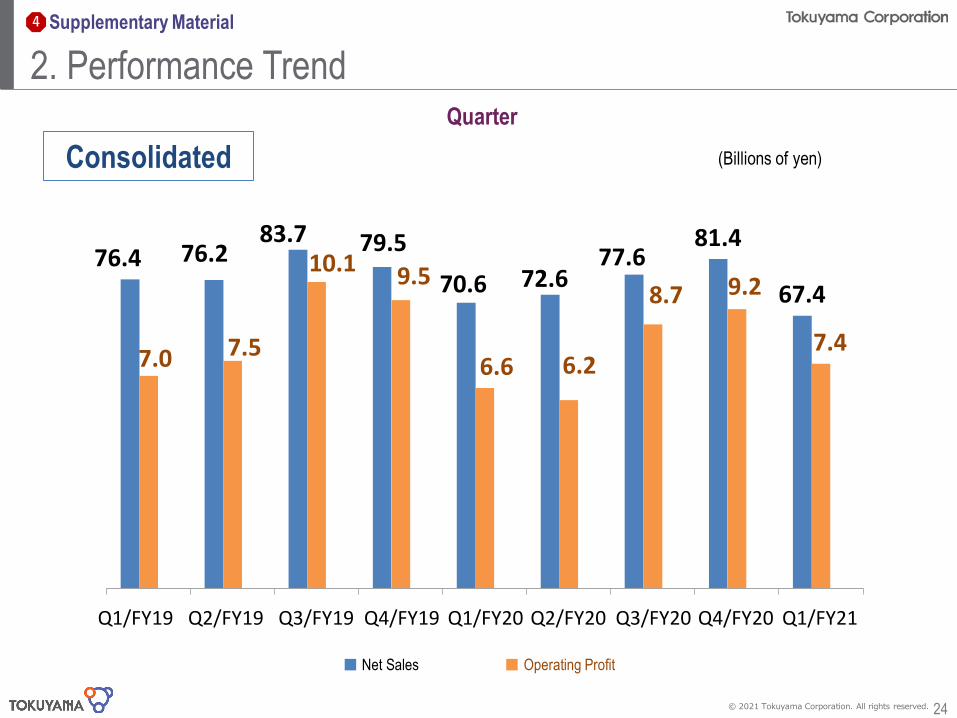
2. Performance Trend
23
282.3 258.6
287.3 302.0 307.1 299.1 308.0 324.6 316.0 302.4 271.0
13.7 6.7
20.2 19.5 23.0
38.5 41.2 35.2 34.2 30.9
26.0
0.0
10.0
20.0
30.0
40.0
50.0
60.0
70.0
0.0
50.0
100.0
150.0
200.0
250.0
300.0
350.0
FY11 12 13 14 15 16 17 18 19 20 21ForecastNet sales Operating Profit
9.3
(37.9)
10.2
(65.3)
(100.5)
52.1 19.6
34.2
19.9
24.5 22.0
(120.0)(90.0)(60.0)(30.0)
0.030.060.0
FY11 12 13 14 15 16 17 18 19 20 21Forecast
■ Profit attributable to owners of parents
(Billions of yen)
Annual Net sales (Billions of yen) Profit (Billions of yen)
4 Supplementary Material
© 2021 Tokuyama Corporation. All rights reserved.
2. Performance Trend
24
Consolidated (Billions of yen)
76.4 76.2 83.7 79.5
70.6 72.6 77.6
81.4
67.4
7.0 7.5
10.1 9.5
6.6 6.2
8.7 9.2
7.4
19.1Q 19.2Q 19.3Q 19.4Q 20.1Q 20.2Q 20.3Q 20.4Q 21.1Q売上高 2
Q1/FY19 Q2/FY19 Q3/FY19 Q4/FY19 Q1/FY20
■ Net Sales ■ Operating Profit
Q2/FY20 Q3/FY20
Supplementary Material
Quarter
4
Q4/FY20 Q1/FY21

Disclaimer
This material is supplied to provide information of Tokuyama and its Group companies, and is not intended as a solicitation for investment or other actions. This material has been prepared based on the information currently available and involves uncertainties. Tokuyama and its Group companies accept no liability in relation to the accuracy and completeness of the information contained in this material. Tokuyama and its Group companies assume no responsibility whatever for any losses or deficits resulting from investment decisions based entirely on projections, numerical targets and other information contained in this material. Accordingly, the information on this material may not be used, reproduced, altered, distributed, sold, reprinted or published without the prior approval of the Company.
25
