presentation for : narbo 4th training – srilanka, … / ciherang cijengkol ciasem cigadung...
TRANSCRIPT

ROLE OF JASA TIRTA II PUBLIC CORPORATION ON WATER MANAGEMENT AND WATER ALLOCATION
IN CITARUM RIVER BASIN
J A S A T I R T A II P U B L I C C O R P O R A T I O N
Presentation for :NARBO 4th Training – Srilanka, November 6 ~ 10, 2006
Prepared by:
Reni Mayasari

Western part of the world
Indonesian Archipelago
Java island
West Java Province
Description of Citarum River Basin • Basin Area : 12,000 km2
• Population (1999) : 8,595 million
• Average Rainfall : 4000 mm/year
• Water Potentials : 12.95 billion m3/year
• River Length : 300 km
• Land Use :- Irrigated 33 %
- Agricultural 258 %
- forest 19 %
- settlements 7 %
- Swamp & fish ponds 4 %
- others 9 %
Citarum River Basin
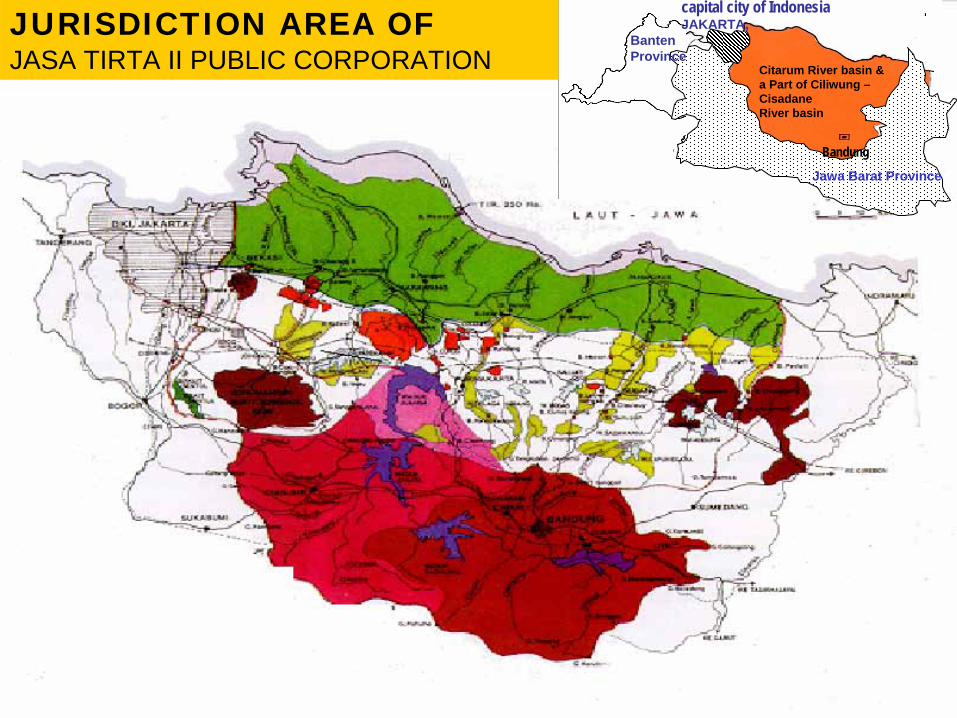
Bandung
Citarum River basin &a Part of Ciliwung –CisadaneRiver basin
Jawa Barat Province
capital city of IndonesiaJAKARTA,
BantenProvince
JURISDICTION AREA OFJASA TIRTA II PUBLIC CORPORATION
Bandung

HISTORY OF CITARUM WATERSHED MANAGEMENT
CONTRUCTION PERIOD
Jatiluhur Multipurpose Project (1956 ‐ 1967)
OPERATION AND MAINTENANCE PERIOD
Jatiluhur State Owned Company (1967 ‐1970)Government Regulation (GR) No. 8/1967, 24 Juli 1967
Jatiluhur Authority Public Corporation
• GR 20/1970, 23 Mei 1970
• GR 35/1980, 13 Oktober 1980
• GR 42/1990, 23 Agustus 1990
JASA TIRTA II PUBLIC CORPORATIONGR 94/1999, 13 October 1999

SCHEME OF CITARUM WATER SYSTEM
Ir. H. Djuanda Reservoir
( + 107.00 m )
Saguling DamVolume 0.9 M m3( + 643.00 m )
Cirata DamVolume 1,9 M m3
( + 220.00 m )
Citarum
Cilalanang
Ciherang
Cilamaya Ciasem
Cipunegara
Cikarang
CBL (Q max 800 m3/sec
Kedung Gede
Walahar W
B. Curug
JAVA SEA
WTCETC
Q maks300 m3/sec
Q maks678 m3/det
Q maks350 m3/det
Q maks1050 m3/sc
Q maks1600 m3/sec
Jengkol W
GadungW
Cijengkol
Cigadung
B. Lebiah
North TarumCanal Section
East
North TarumCanal West
Section
North TarumCanal
SALAMDARMAWEIR
Irrigation = 39.901 Ha
DMI = 420 l/sGADUNGWEIR
Irrigation = 8503 Ha
MACANWEIR
Irrigation = 13.519 Ha
BARUGBUGWEIR
Irrigation = 15.117 Ha
DMI = 2040 l/sJENGKOLWEIR
Irrigation = 3407 Ha
KARANG WEIRIrrigation = 20.286 Ha
DMI = 1780l/s
BEKASIWEIR
Irrigation = 7.380 Ha
DMI = 540 l/s
BEET WEIRIrrigation = 15.117 Ha
DMI = 680 l/s
JAKARTA
DMI = 16.200 l/s
CURUG WEIRIrrigation = 3.760 HaDMI = litre
WALAHAR WEIRIrrigation = 85.287 HaDMI = 610 l/s
Volume 2,5 M m3

Irrigation 87%
Domestic & Industry 2%
Municipal 0.3%
PAM JAYA (Domestic
Water supply) 6%
Wasted 5%
Regulated 7.65 Billion m3/yearEqual to 59.07%(From Citarum ± 6.00 Bm3/year and other river ± 1.65 Bm3/year)
Unregulated ± 5.30 Bm3/yearEqual to 40.93%.
WATER RESOURCES POTENTIAL IN CITARUM RIVER BASIN
Total ±12.95 Billion m3/yearCitarum : 6.00 Bm3/yearOther river : 6.95 Bm3/year

AVERAGE ANNUAL FLOW OF WATER IN THE BASIN
NO RIVERS AVERAGE ANNUAL FLOW IN 106 m3 MONITORING STATION
1.
2.
3.
4.
5.
6.
7.
8.
9.
10.
11.
12.
CIPAMINGKIS
CIBEET
CITARUM
CIKAO
CILAMAYA / CIHERANG
CIJENGKOL
CIASEM
CIGADUNG
CIPUNEGARA
CIPANCUH
BEKASI
CIKARANG
JUMLAH
280
1.180
5.770
480
660
250
570
180
1.900
150
1.030
500
12.950
PAMINGKIS WEIR
BEET WEIR
JUANDA Dam/Reservoir
CURUG WEIR
BARUGBUG WEIR
JENGKOL WEIR
MACAN WEIR
GADUNG WEIR
SALAMDARMA WEIR
PANCUH Dam/Reservoir
BEKASI WEIR
KARANG WEIR

WATER BALANCE IN CITARUM RIVER BASIN (From 1990 – 2005)
6,298.806,459.24202.69586.325,670.2312,758.047,008.885,749.162005
4,062.156,143.20207.50523.305,412.4010,205.355,462.304,743.052004
2,105.825,806.51193.70550.705,062.117,912.333,617.874,294.462003
4,914.786,507.41203.60522.205,781.6111,422.195,882.005,540.192002
6,602.416,984.81196.40471.206,317.2113,587.226,461.907,125.322001
3,866.936,603.65164.70428.206,010.7510,470.585,505.904,964.682000
4,412.226,047.16153.80422.905,470.4610,459.384,692.405,766.981999
6,964.657,148.96149.40448.106,551.4614,113.616,442.607,671.011998
1,137.365,783.78155.90395.305,232.586,921.143,236.203,684.941997
6,221.626,804.18137.90331.306,334.9813,025.806,062.806,963.001996
6,078.826,113.39147.40294.305,671.6912,192.215,841.206,351.011995
5,246.845,419.23126.80331.304,961.1310,666.075,167.405,498.671994
8,895.075,014.32110.60249.704,654.0213,909.396,660.407,248.991993
8,986.115,589.89117.50198.505,273.8914,576.006,407.008,169.001992
3,030.915,563.58108.20235.305,220.088,594.493,901.504,692.991991
2,832.795,702.7081.30204.605,416.808,535.493,857.504,677.991990
TotalIndustry Domestic IrrigationTotalOther riverCitarumBalance
UTILIZATION (million m3)INFLOW (million m3)Year

SUPPLY Dry S. Wet S.
Local sources 30% 70%
Reservoirs 70% 30%
Sub District Committee
District Committee
Basin Water Resources Committee
DEMAND• D M I• Irrigation
• Cropping Program• Water Supply Program• Cropping Pattern
Bi-weekly (Internal)Monthly (Coordination)
Monitoring
Citarum Water Resources ManagementOperation of Large‐scale Irrigation System
Note:Using schematic water resources infrastructures with water demand in specific location, water requirement from Jatiluhur reservoir is computed
CITARUM CASCADE RESERVOIRS OPERATION(Saguling, Cirata, and Jatiluhur Reservoirs)
Irrigation Water Demand

WATER RESOURCES MANAGEMENTOperation by Jasa Tirta II II Public Corporation
6. Water Resources Infrastructure Management
4. River Environment Management
JASA TIRTA II PUBLIC CORPORATION
Integrated Water Resources Management (IWRM)
1. Catchment Area Management
2. Water Quantity Management
5. Flood & Drought Management
3. Water Quality Management
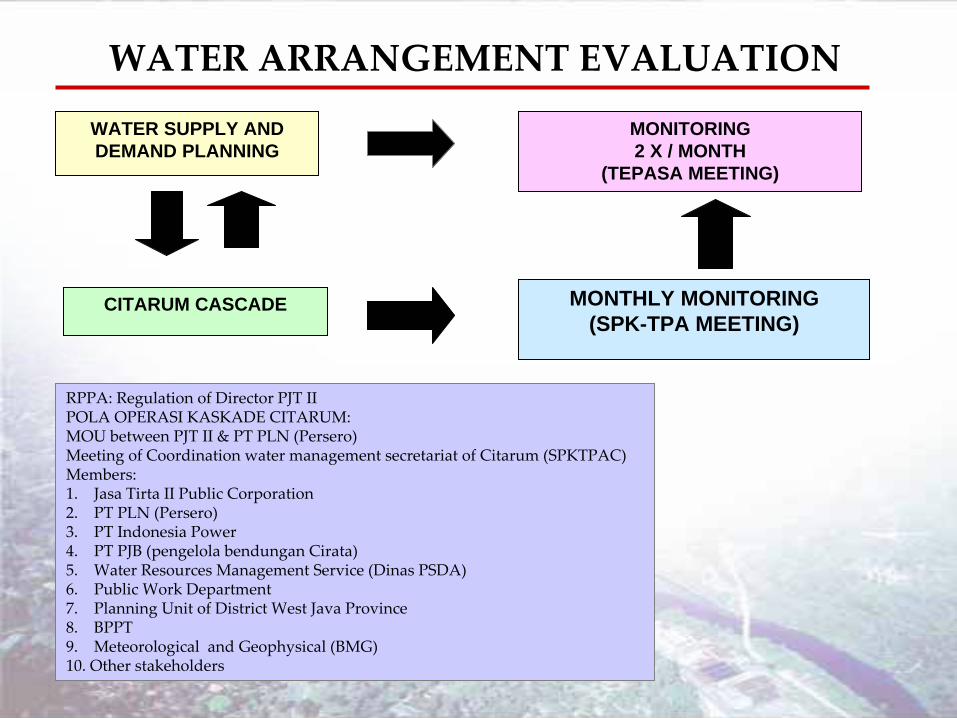
WATER ARRANGEMENT EVALUATION
CITARUM CASCADE
WATER SUPPLY AND DEMAND PLANNING
MONTHLY MONITORING(SPK-TPA MEETING)
MONITORING 2 X / MONTH
(TEPASA MEETING)
RPPA: Regulation of Director PJT IIPOLA OPERASI KASKADE CITARUM: MOU between PJT II & PT PLN (Persero)Meeting of Coordination water management secretariat of Citarum (SPKTPAC)Members:1. Jasa Tirta II Public Corporation2. PT PLN (Persero)3. PT Indonesia Power 4. PT PJB (pengelola bendungan Cirata)5. Water Resources Management Service (Dinas PSDA)6. Public Work Department7. Planning Unit of District West Java Province8. BPPT9. Meteorological and Geophysical (BMG)10. Other stakeholders

COORDINATION AMONG STAKEHOLDERS IN THE CITARUM RIVER BASIN
OutputProvince Level (PTPA)River Basin Level (PPTPA)
Public Work Institution
PTPA
Governor
reportPublic Works Unit
PTPA
Governor
Activities of Unit
PPTPA activities
PTPA Meeting
Tech. Rec. of surface Water Extraction and Liquid Waste Disposal
Tech. Rec. of Sand Mining
Routine Meeting
Specific Meeting
Touring Company Meeting
Presented
Sending
PROGRAM
PERMIT
POLICY REGULATION GUIDANCE
Feed Back

CENTRAL Ministry ofPublic Works
Ministry ofMining
Ministry ofHome Affairs
State Ministrypf Planning(Bappenas)
State Ministryfor the
Environment(Bapedal)
NationalEnvironmental
Planning
NationalSpatial
Planning
Groundwater
NationalWRM
PlanningDGWRD
PROVINCE Provincial WRMCommittee
(PTPA)
Water ResourcesProvincial Technical
office
GOVERNOR
ProvincialPlanningofficce
(Bappeda)
Provincial ofEnvironmnetal
Office(Bapedalda)
PJT IITechnical basin
management unitin CITARUM RIVER
BASIN
DISTRICT
Water users (PAM,agriculture,Industry)
DistrictIrrigation
Committee
Farmer WaterUser
Association
HEAD OFDISTRICT
District DinasPengairan
Other Basin
Command line
Guidance
Consultation & Coordination
INVOLVEMENT OF GOVERNMENT ADMINISTRATION LEVELS IN WATER RESOURCES MANAGEMENT OF CITARUM RIVER BASIN

Issues & Challengesin Citarum River Basin
Overall issues to be faced in water quantity management include :• Water should be treated as an economic good, including pricing of services provided by water management.
• The capacity for water management needs further development
• The institutional setting for water resources planning and management should be further harmonized
• No longer should be water management be oriented at simply satisfying all demands, but demand management should be incorporated in the management process.
The expected socio‐economic development of the region forms a considerable challenge for water management.

CONCLUSION• Water potency in the Citarum river basin approximately 12.95 billion m3 annually. Using the existing hydraulic infrastructures it’s only 7.65 billion m3 could be regulated and the rest is still wasted to the sea.
• Citarum River in the biggest one connected with 4 rivers to the west and 4 rivers to the east by manmade canals namely West Tarum canal (WTC) and East TarumCanal (ETC) formed a unit of hydrological boundary of Citarum intergratedbasin of 12,000 km2.
• Three big reservoirs, in the upstream, Saguling, Cirata and Djuanda Reservoir regulates river run off and releases stable water flows to the curug barrage and diverted to the west Tarum Canal and east tarum canal by gravitation to the north.
• The annual allocation of water in the main river and canals is subject to the results of coordination by River Basin Water management executive committee (PPTPA).
• The expected socio‐economic development of the region forms a considerable challenge for water management.
• From as assessment of the present situation in the basin and surrounding region and from projections of future water requirements, a more concrete set of issues can be identified that are critical if the water resources potential of the basin is to be fully utilized and in a sustainable way.

Thank You