presentation at nomura investment forum 2018 …...agenda progress of vision c&c megatrends...
TRANSCRIPT

Connecting Markets East & West
© Nomura December 4, 2018
Presentation at Nomura Investment Forum 2018
Koji Nagai Group CEO Nomura Holdings, Inc.

Agenda
Progress of Vision C&C
Megatrends shaping future financial services industry
2
3
Towards sustainable growth 4
Business environment 1
Initiatives to improve capital efficiency 5
1
0
5
10
15
20
25
30
35
40
Jan-16 Apr-16 Jul-16 Oct-16 Jan-17 Apr-17 Jul-17 Oct-17 Jan-18 Apr-18 Jul-18 Oct-18
VIX Index (CBOE SPX)
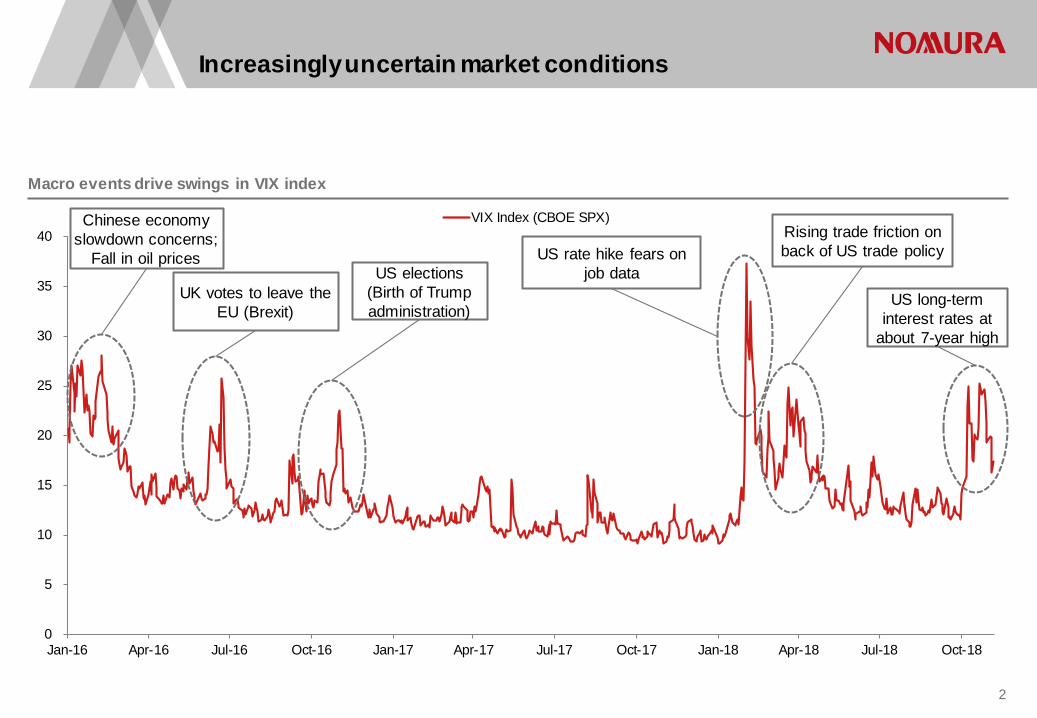
Macro events drive swings in VIX index
Increasingly uncertain market conditions
UK votes to leave the EU (Brexit)
US elections (Birth of Trump administration)
Rising trade friction on back of US trade policy
Chinese economy slowdown concerns;
Fall in oil prices US rate hike fears on job data
US long-term interest rates at
about 7-year high
2

0
1
2
3
4
5
6
Apr-07 Apr-10 Apr-13 Apr-16
米国政策金利
50%
100%
150%
200%
250%
300%
Wholesale got off to good start in October, but client activity dropped steeply in November for both individual investors and institutional investors; recent environment remains challenging
3.23%
米国債10年
Normalization of monetary policy impacting emerging markets
US monetary policy moves toward normalization Emerging market currencies decline
(%)
Emerging currencies (USD/currency)
Apr-18
US interest rates at about 7-year high
Fall in emerging currencies on rising US interest rates
Renminbi
Indian rupee
Turkish lira Argentine peso
Indonesian rupiah Brazilian real
10y US treasury US policy interest rate
3Q FY2018/19 (as of end Nov 2018)
Apr-17
Indexed, Apr 2017= 100
3
Agenda
Progress of Vision C&C
Megatrends shaping future financial services industry
2
3
Towards sustainable growth 4
Business environment 1
Initiatives to improve capital efficiency 5
4

150
72.0
122.8
0.0
20.0
40.0
60.0
80.0
100.0
120.0
140.0
160.0
Mar Sep Mar Sep Mar Sep Mar Sep Mar Sep Mar Sep Mar Sep
2012 2013 2014 2015 2016 2017 2018
Target Results
41.4
90.6
150
15%
31%
50%
-20%
-10%
0%
10%
20%
30%
40%
50%
0.0
20.0
40.0
60.0
80.0
100.0
120.0
140.0
160.0
180.0
1H 2H 1H 2H 1H 2H 1H 2H 1H 2H 1H 2H 1H
FY12/13
FY13/14
FY14/15
FY15/16
FY16/17
FY17/18
FY18/19
Recurring revenue(annualized)Recurring revenue cost coverage ratio (rhs)
(billions of yen)
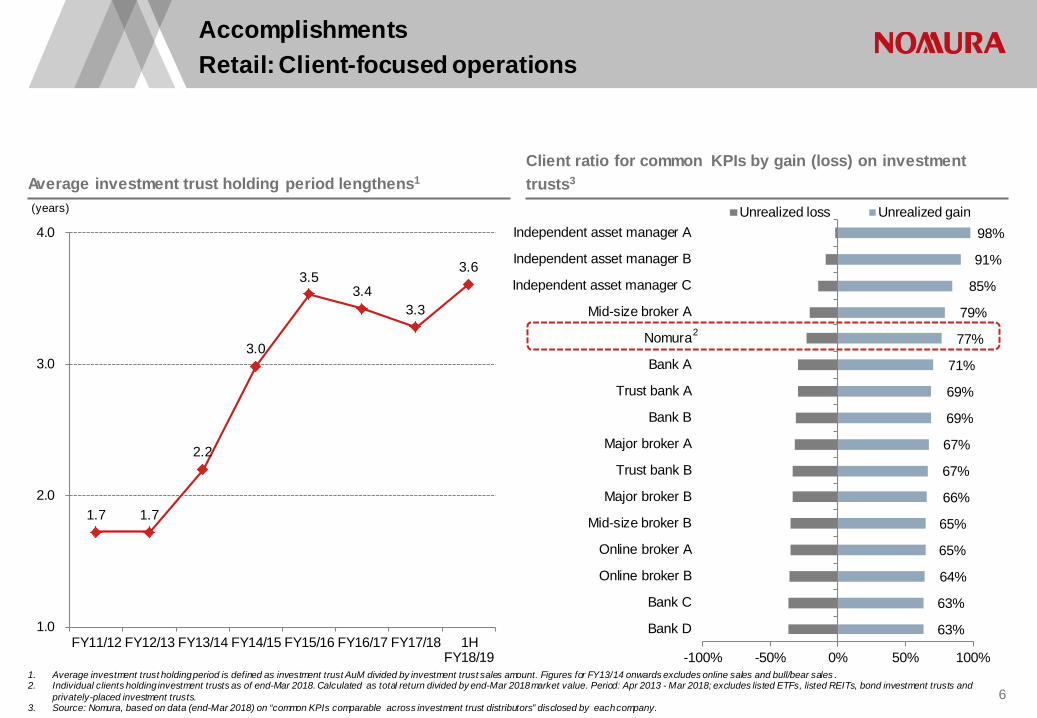
Accomplishments Retail: Steady growth in retail clients assets and recurring revenue
Retail clients assets at record high level Steady increase in recurring revenue and recurring revenue cost coverage ratio
(trillions of yen)
FY2019/20 KPI
FY2019/20 KPI
5
63%
63%
64%
65%
65%
66%
67%
67%
69%
69%
71%
77%
79%
85%
91%
98%
-100% -50% 0% 50% 100%
Bank D
Bank C
Online broker B
Online broker A
Mid-size broker B
Major broker B
Trust bank B
Major broker A
Bank B
Trust bank A
Bank A
Nomura
Mid-size broker A
Independent asset manager C
Independent asset manager B
Independent asset manager AUnrealized loss Unrealized gain
1.7 1.7
2.2
3.0
3.5 3.4
3.3
3.6
1.0
2.0
3.0
4.0
FY11/12 FY12/13 FY13/14 FY14/15 FY15/16 FY16/17 FY17/18 1HFY18/19
Accomplishments Retail: Client-focused operations
1. Average investment trust holding period is defined as investment trust AuM divided by investment trust sales amount. Figures for FY13/14 onwards excludes online sales and bull/bear sales . 2. Individual clients holding investment trusts as of end-Mar 2018. Calculated as total return divided by end-Mar 2018 market value. Period: Apr 2013 - Mar 2018; excludes listed ETFs, listed REITs, bond investment trusts and
privately-placed investment trusts. 3. Source: Nomura, based on data (end-Mar 2018) on “common KPIs comparable across investment trust distributors” disclosed by each company.
Average investment trust holding period lengthens1 Client ratio for common KPIs by gain (loss) on investment trusts3
(years)
2
6
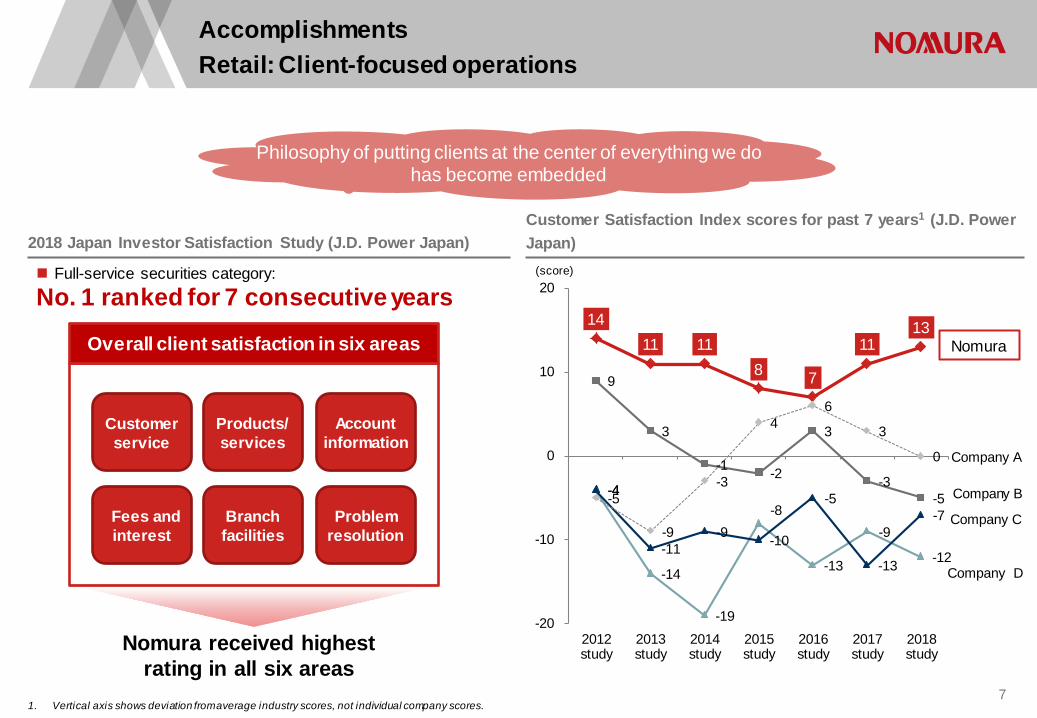
14 11 11
8 7
11 13
9
3
-1 -2
3
-3 -5 -4
-14
-19
-8
-13
-9
-12
-4
-11 -9 -10
-5
-13
-7 -5
-9
-3
4 6
3
0
-20
-10
0
10
20
2012study
2013study
2014study
2015study
2016study
2017study
2018study
Accomplishments Retail: Client-focused operations
1. Vertical axis shows deviation from average industry scores, not individual company scores.
2018 Japan Investor Satisfaction Study (J.D. Power Japan) Customer Satisfaction Index scores for past 7 years1 (J.D. Power Japan)
(score)
Nomura
Company A
Company B
Company C
Company D
Customer service
Products/ services
Account information
Fees and interest
Branch facilities
Problem resolution
Overall client satisfaction in six areas
Nomura received highest rating in all six areas
Full-service securities category:
No. 1 ranked for 7 consecutive years
「すべてはお客様のために」という基本感が定着 Philosophy of putting clients at the center of everything we do
has become embedded
7
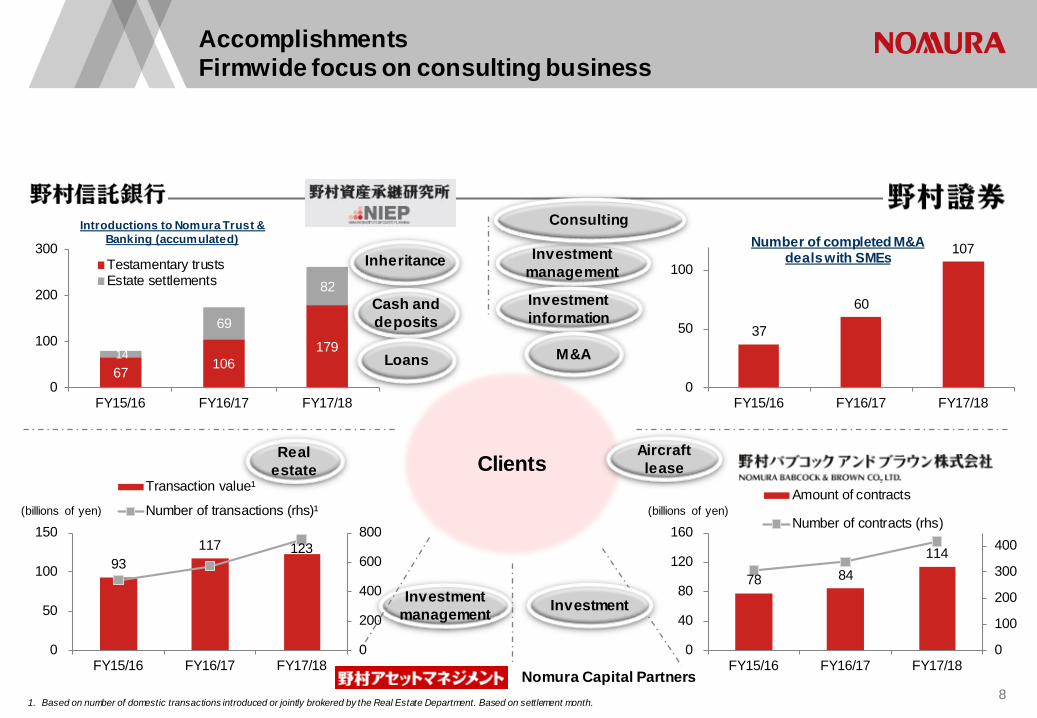
67 106 179 14
69
82
0
100
200
300
FY15/16 FY16/17 FY17/18
Testamentary trustsEstate settlements
37
60
107
0
50
100
FY15/16 FY16/17 FY17/18
Accomplishments Firmwide focus on consulting business
1. Based on number of domestic transactions introduced or jointly brokered by the Real Estate Department. Based on settlement month.
Clients
(billions of yen)
Cash and deposits
Loans
Real estate
Aircraft lease
Investment management
Consulting
Investment information
Introductions to Nomura Trust & Banking (accumulated)
(billions of yen)
Number of completed M&A deals with SMEs
M&A
Inheritance
78 84 114
0
100
200
300
400
0
40
80
120
160
FY15/16 FY16/17 FY17/18
Amount of contracts
Number of contracts (rhs)
Investment management Investment
Nomura Capital Partners 8
93 117 123
0
200
400
600
800
0
50
100
150
FY15/16 FY16/17 FY17/18
Transaction value¹
Number of transactions (rhs)¹

0
50
100
150
0
100
200
300(billions of yen)
Challenges: Retail performance slows as brokerage commission revenues decline
Growth in recurring revenue not enough to compensate for decline in brokerage commissions
Decline in overall profits partly due to rigid cost level
Brokerage (Incl. sales
credit)
FY13/14 FY14/15 FY15/16 FY16/17 FY17/18 FY18/19
27 27 29 34 39 37 36 38 41 45 45
231 177 172
193 175 131 116
141 141 143 112
286
226 225 252 246
189 170
205 203 209 179
(billions of yen)
Other
1H 2H 1H 2H 1H 2H 1H 2H 1H 2H 1H
Income before income taxes (rhs) Net revenue Non interest expenses
9
Recurring revenue
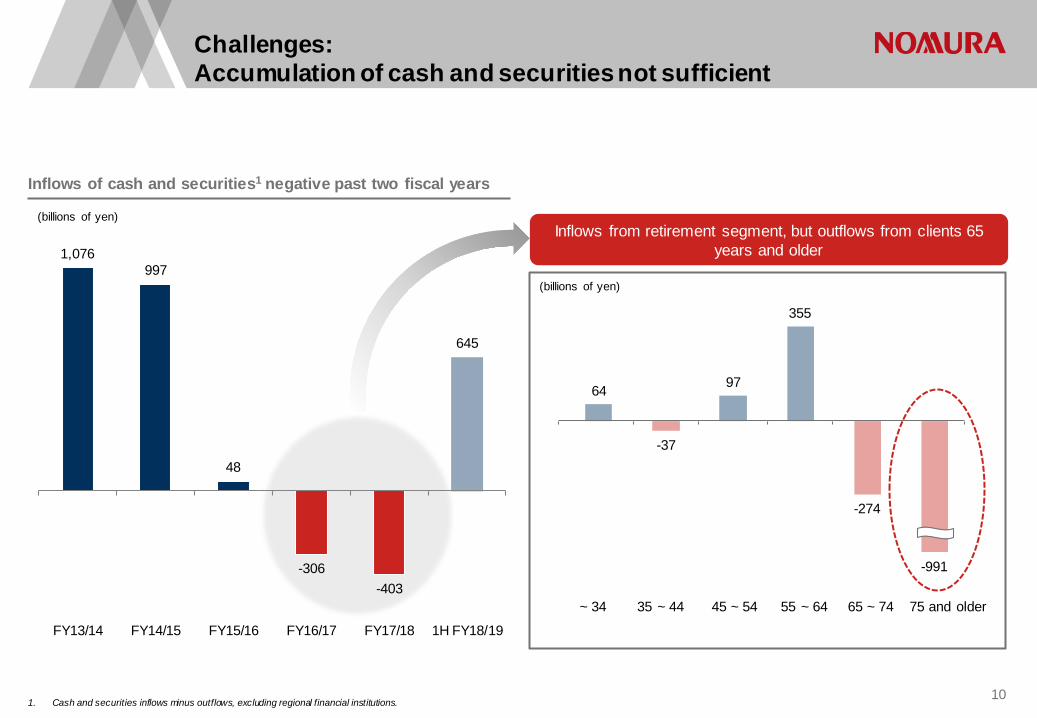
Inflows from retirement segment, but outflows from clients 65 years and older
Challenges: Accumulation of cash and securities not sufficient
Inflows of cash and securities1 negative past two fiscal years
1. Cash and securities inflows minus outflows, excluding regional financial institutions.
64
-37
97
355
-274
-991
~ 34 35 ~ 44 45 ~ 54 55 ~ 64 65 ~ 74 75 and older
(billions of yen)
(billions of yen)
10
1,076 997
48
-306 -403
645
FY13/14 FY14/15 FY15/16 FY16/17 FY17/18 1H FY18/19
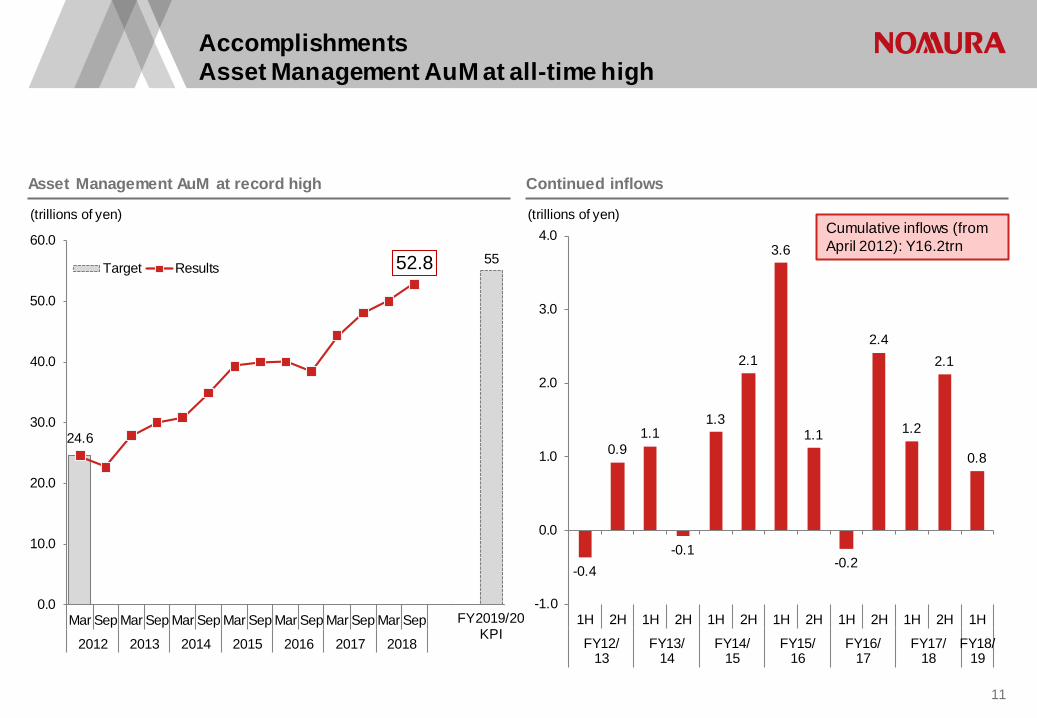
-0.4
0.9 1.1
-0.1
1.3
2.1
3.6
1.1
-0.2
2.4
1.2
2.1
0.8
-1.0
0.0
1.0
2.0
3.0
4.0
1H 2H 1H 2H 1H 2H 1H 2H 1H 2H 1H 2H 1H
FY12/13
FY13/14
FY14/15
FY15/16
FY16/17
FY17/18
FY18/19
55
24.6
52.8
0.0
10.0
20.0
30.0
40.0
50.0
60.0
Mar Sep Mar Sep Mar Sep Mar Sep Mar Sep Mar Sep Mar Sep
2012 2013 2014 2015 2016 2017 2018
Target Results
Accomplishments Asset Management AuM at all-time high
Asset Management AuM at record high Continued inflows
Cumulative inflows (from April 2012): Y16.2trn
(trillions of yen)
FY2019/20 KPI
(trillions of yen)
11

Accomplishment from Alliance with American Century Investments (ACI)
1. Nomura Corporate Research and Asset Management.
Leveraging respective strengths in products and in client relations
Investment advisory and international businesses Distribute ACI global equity and fixed income products to pension funds
and international clients
Investment trust business Distribute ACI funds to retail clients (Impact Investment, US stocks, Global REIT, etc.)
12
Provide high yield bond products managed by NCRAM1 Manage the high yield bond component of target date funds Products also distributed to US retail investors
Achievements from the collaboration
Approx. $4.4bn (Nov 2018)
AuM: Y165bn (Nov 2018)
U.S. Value Strategy Fund that invests in US company stocks
AuM: Approx.$3.2bn
AuM: Approx. $1.2bn
Nomura ACI Advanced Medical Impact Investment that invests in global medical
technology and biotechnology related stocks
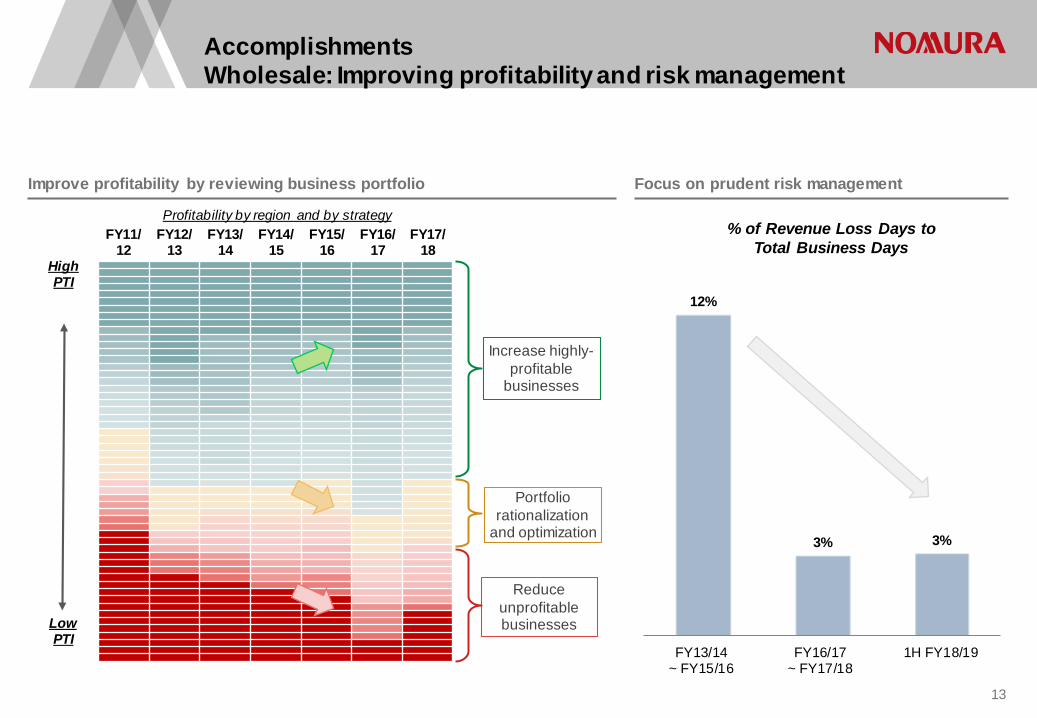
Accomplishments Wholesale: Improving profitability and risk management
Improve profitability by reviewing business portfolio Focus on prudent risk management
High PTI
Low PTI
FY11/ 12
FY12/ 13
FY13/ 14
FY14/ 15
FY15/ 16
FY16/ 17
FY17/ 18
Increase highly-profitable
businesses
Portfolio rationalization
and optimization
Reduce unprofitable businesses
% of Revenue Loss Days to Total Business Days
12%
3% 3%
FY13/14~ FY15/16
FY16/17~ FY17/18
1H FY18/19
Profitability by region and by strategy
13
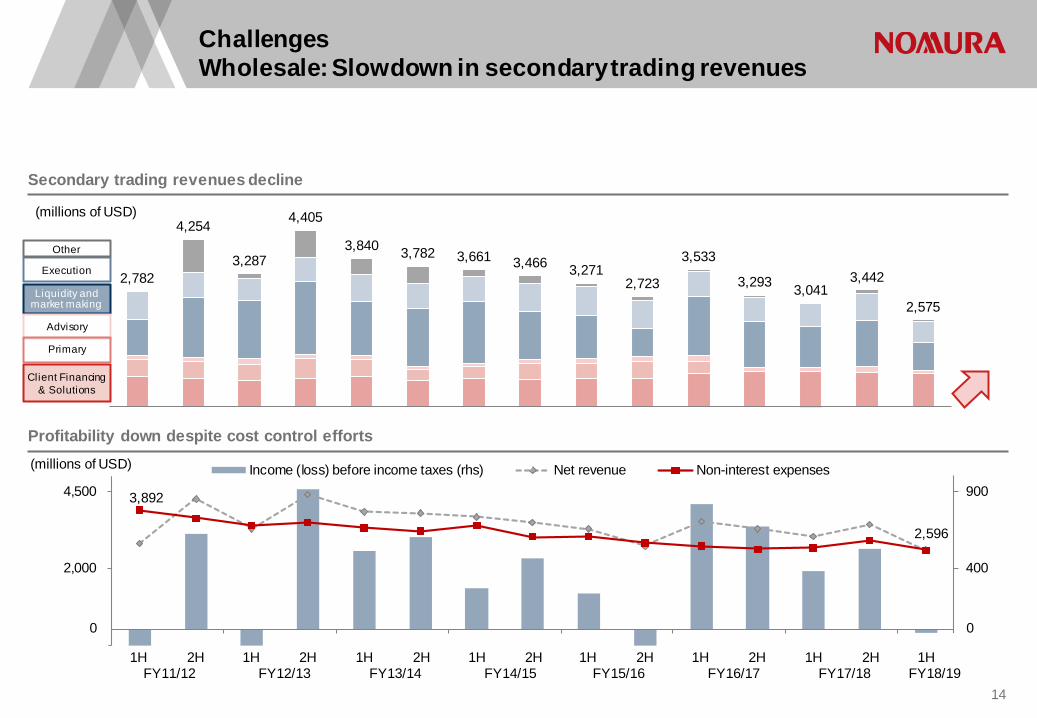
2,782
4,254
3,287
4,405
3,840 3,782 3,661 3,466 3,271 2,723
3,533
3,293 3,041 3,442
2,575
3,892
2,596
(100)
400
900
(500)
2,000
4,500Income (loss) before income taxes (rhs) Net revenue Non-interest expenses
Challenges Wholesale: Slowdown in secondary trading revenues
Secondary trading revenues decline
1H 2H 1H 2H FY11/12 FY12/13
(millions of USD)
0 0
Profitability down despite cost control efforts
(millions of USD)
1H 2H 1H 2H FY13/14 FY14/15
1H 2H 1H 2H FY15/16 FY16/17
1H 2H 1H FY17/18 FY18/19
Advisory
Liquidity and market making
Client Financing & Solutions
Primary
Execution
Other
14

Challenges: More work to do to improve international business profitability
1. Geographic information is based on U.S. GAAP. Nomura’s revenues and expenses are allocated based on the country of domicile of the legal entity providing the service. This information is not used for business management purposes.
2. One-off factors: FY14/15 provisions for legacy transactions (Y16.5bn), FY15/16 settlement with Banca Monte dei Paschi di Siena (approx. Y35bn), FY17/18 provisions for legacy transactions (approx. Y45bn), FY18/19 1H: settlement with U.S. Department of Justice for legacy transactions (Y19.8bn) and recognition of FX translation adjustment due to progress in winding up subsidiary in Middle East & North Africa ( -Y7bn).
International income (loss) before income taxes1
-79.4
-24.7 -16.4
-79.6
88.1
-0.7
-39.9
-100
-50
0
50
100
FY12/13 FY13/14 FY14/15 FY15/16 FY16/17 FY17/18 1H FY18/19
一時要因 一時要因除く
(billions of yen)
One-off factors 2
Excl. one-off factors
15

Focus on core businesses: Sale of share holdings, progress in winding up pre-financial crisis legacy assets
Sale of share holdings: Y363bn
Winding up legacy assets: Y176bn
Dec 2012 Sale of stake in UK Annington
Apr 2017 Sale of Takagi Securities
2012
2013
2014
2015
2016
2017
2018
Oct 2018 Settlement with U.S. DOJ over legacy transactions (Penalty of $480mn) Sep 2015
Settlement with Banca Monte dei Paschi di Siena SpA (approx. Y34bn)
Mar 2013 Partial offering of Nomura Real Estate Holdings shares
Mar 2018 Sale of Asahi Fire and Marine Insurance
Feb- Mar 2016 Sale of Chi-X Canada, Chi-X Australia, Chi-X Japan, Chi-X Global Technology (HK)
Mar 2014 Partial sale of stake in Daiko Securities (Y1.9bn)
Mar 2014 Partial sale of JAFCO stake (Y10.8bn)
Nov 2015 Sale of Mitsui Life
Jul 2017 Sale of entire JAFCO stake (Y38.7bn)
Feb 2014 Sale of stake in Fortress ($363.4mn)
Jun 2018 Judgement issued in FHFA litigation case against US subsidiaries (Payment of $806mn upon receipt of RMBS)
16

Agenda
Progress of Vision C&C
Megatrends shaping future financial services industry
2
3
Towards sustainable growth 4
Business environment 1
Initiatives to improve capital efficiency 5
17

Financial crisis beginning with
Subprime mortgage problems
Euro debt crisis
Financial crisis beginning with
Subprime mortgage problems
Euro debt crisis
(20)
(10)
0
10
20
30
40
-20
-10
0
10
20
30
40
2000 2002 2004 2006 2008 2010 2012 2014 20160%
20%
40%
2006 2008 2010 2012 2014 2016
Ratio of trading revenues to firmwide revenues:
Decline to approx. 20% from pre-financial crisis average of
mid-30%
Megatrend 1: Breakdown of balance sheet dependent business model
1. 9 competitors: Goldman Sachs, Morgan Stanley, Bank of America Merrill Lynch, Citibank, JP Morgan, Credit Suisse, Deutsche Bank, UBS, Barclays 2. Source: Nomura, based on disclosures by Goldman Sachs ,Morgan Stanley, JP Morgan, Bank of America Merrill Lynch, and Citibank; abnormal values such as minus values for total revenues excluded from calculations.
Global financial institutions1 leverage, ROE from 2000
ROE(lhs)
Leverage (rhs)
ROE(%)
Change in US bank earnings composition2
Wealth and investment management revenues increased
18

429
170
231
0
100
200
300
400
500
2010 2013 2016
BoJFedECB
Indexed, Dec 2010 = 100
0
100
200
300
400
2010 2012 2014 2016 201810
20
30
40
50
2010 2013 2016
Japan US
Megatrend 1: Depletion of global liquidity, increasing volatility
1. Source: Federal Reserve Bank, inventories of government bonds, agency bonds, corporate bonds, commercial paper, etc., held by primary dealers. 2. Source: Japan Securities Dealers Association, Ministry of Finance, Securities Industry and Financial Markets Association 3. Source: Volatility indices from Nikkei 225 and S&P 500.
Central bank balance sheets expand Japanese government bonds and US Treasury liquidity declines2
Dealer inventories decline1 VIX Index3
(billions of dollars)
0.0%
1.0%
2.0%
3.0%
4.0%
5.0%
6.0%
7.0%
2010 2013 2016
JGB Turnover Ratio UST Turnover Ratio
19

40%
75%
44% 45%
77%
53%
US Equities (US)
FX(Global Top
Tier)
UST(US)
2014 2017
10.0
15.0
20.0
25.0
Megatrend 1: Increase in electronic transactions and lower commissions
1. Source: Nomura based on Greenwich Associates data 2. Source: Greenwich for US, European and HK Commission Rates, Nomura Internal Data for Japanese Commission Rates
Increase in electronic trading1 Lower commissions for high-touch equity execution business2 Possible changes due to MiFID-II
Bps
Hong Kong
Europe
US
Japan
Electronic trading account for growing share of market volume
Transparency prior to executing
deals
Transparency after executing
deals
Best execution
Recordkeeping &
Reporting
Supervision of algorithmic
trading
Unbundling
20
2005 2009 2013 2017

UK
Access by bank channel1
US
Online banking at major banks2
Megatrend 2: Advances in digital innovation: Change in consumer behavior
1. British Bankers Association, based on volume of access. 2. Prepared using disclosure materials from three large financial groups: JP Morgan, Bank of America and Wells Fargo. 3. Source: Nomura, based on materials from each bank. 4. Source: Nomura, based on Nomura Research Institute survey (finance) of 10,000 people.
Change in financial service channels in UK and US
46%
7%
40%
7% 2010
34%
43%
20% 3%
2015
17%
73%
8% 2%
2020(estimate)
Internet Mobile phone Branch Telephone 2007-08 2017-18
Dramatic increase in use of mobile services over branch services
Situation in Japan
Digitization progressing in US where there is culture of using checks
30 - 40 percent decrease in client visits to branches of major banks in Japan over past 10
years3
Increase in online trading across all age groups (Ratio of clients with investing experience)4
(%) 0%
20%
40%
60%
80%
0
20
40
60
80
100
120
4Q11 4Q12 4Q13 4Q14 4Q15 4Q16 4Q17
(mill ions of people)
Total # digital clients # of digital clients using mobileRatio of mobile usage (rhs) 41
35
28
21
13
33
19
13
11
8
0 10 20 30 40 50
30's
40's
50's
60's
70's
(Age) 20102016
21

Changing consumer behavior (demand convenience and low cost)
Business efficiencies, cost reduction
Overhaul of business models
Not only consumer behavior, but also business model for financial institutions could change dramatically
Megatrend 2: Changes driven by digital innovation
Digital innovation
Entrants from other industries
Financial institutions
Consumers (clients) New value
Threat
Collaborate
Rise of Fintech
22

Megatrend 3: Change in Japanese demographics
Change in personal financial assets by age1 Impact of aging and inheritance on personal financial assets by region (2016-2030)2
Large concentration of personal financial assets expected in three major metropolitan areas and among those over 75
2015
75 and older 24%
2030
75 and older Up to 46%
75 and older
65~74 55~64
40~54
20~39
75 and older
65~74
55~64
40~54
20~39
1. Source: Nomura Institute of Capital Markets Research estimates, assumes asset transfer through secondary inheritance only 2. Source: Nomura Institute of Capital Markets Research estimates, calculated based on financial assets only
0% ~ under 10%
-10% ~ 0%
-20% ~ under -10%
% change in personal financial assets
23

Progress of Vision C&C
Megatrends shaping future financial services industry
2
3
Towards sustainable growth 4
Business environment 1
Initiatives to improve capital efficiency 5
24
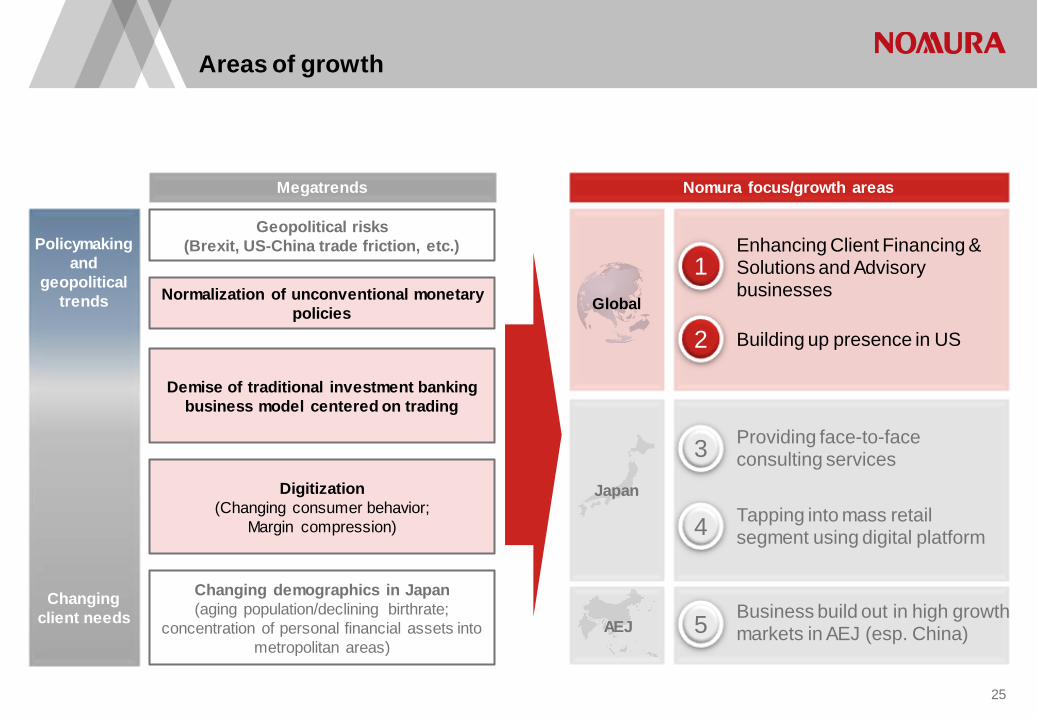
Demise of traditional investment banking business model centered on trading
Areas of growth
Nomura focus/growth areas
Providing face-to-face consulting services
Tapping into mass retail segment using digital platform
Building up presence in US
Megatrends
Changing demographics in Japan (aging population/declining birthrate;
concentration of personal financial assets into metropolitan areas)
Digitization (Changing consumer behavior;
Margin compression)
Geopolitical risks (Brexit, US-China trade friction, etc.)
Normalization of unconventional monetary policies
Enhancing Client Financing & Solutions and Advisory businesses
Business build out in high growth markets in AEJ (esp. China)
Global
Japan
1
2
5
3
4
AEJ
Policymaking and
geopolitical trends
Changing client needs
25

Selective expansion in areas and businesses with competitive advantage
Wholesale: Delivering consistent growth
Products FY2017/18 Net revenue
Medium term growth Strategic priorities
Advisory M&A
Execution Agency Execution
Primary ECM, DCM, ALF
Solutions Solutions, Client Financing
Liquidity and
market making
Flow Fixed Income
Macro (Rates, FX), Spread Products (Credit, Securitized Products)
Non-Cash Equities Equity Products
Business strategy
高 High
Market risk
Low Americas growth plan (anchored on Advisory and
Execution and CFS businesses)
Client diversification (leverage CFS for opportunities in
financing and solutions with corporates and financial institutions)
Digitization (use of AI in flow business; digital
custody, etc.)
1 2
26

Corporates 22% 19% 21%
4% 7% 11%
12% 18% 17%
24% 27% 23%
38% 29% 28%
'12.3 '15.3~'16.3Average
'17.3~'18.3Average
Expand FX business with corporates
Build out China-related IB platform Execute block trades in AEJ
Increase acquisition finance business in AEJ
Provide asset-backed financing and other balance sheet solutions
Diversification of client franchise: Aim to grow in focus sectors
Client diversification: Client Financing & Solutions (CFS) 1
Asset Managers
Banks / Insurers
Publics / SWF Hedge Funds
Product strategies
Solutions
ECM
ALF/DCM
Asset Finance
Resource allocation target
2.0x (vs. FY2017/18)
Client sectors targeted for franchise growth
Medium term revenue potential
+$250m (vs. FY2017/18)
27
Focus areas
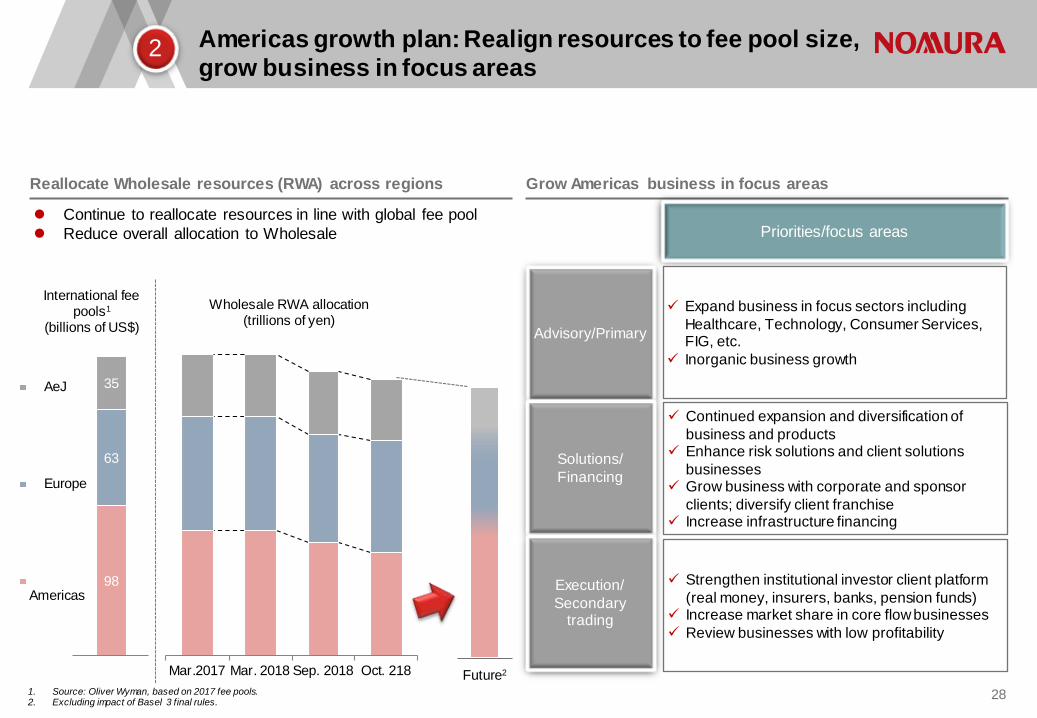
Americas growth plan: Realign resources to fee pool size, grow business in focus areas
1. Source: Oliver Wyman, based on 2017 fee pools. 2. Excluding impact of Basel 3 final rules.
Reallocate Wholesale resources (RWA) across regions
Continue to reallocate resources in line with global fee pool Reduce overall allocation to Wholesale
Grow Americas business in focus areas
Priorities/focus areas
Expand business in focus sectors including Healthcare, Technology, Consumer Services, FIG, etc.
Inorganic business growth
Advisory/Primary
Solutions/ Financing
Execution/ Secondary
trading
Continued expansion and diversification of business and products
Enhance risk solutions and client solutions businesses
Grow business with corporate and sponsor clients; diversify client franchise
Increase infrastructure financing
Strengthen institutional investor client platform (real money, insurers, banks, pension funds)
Increase market share in core flow businesses Review businesses with low profitability
2
International fee pools1
(billions of US$) Wholesale RWA allocation
(trillions of yen)
Future2
98
63
35 AeJ
Europe
Americas
Mar.2017 Mar. 2018 Sep. 2018 Oct. 218
28

Market data
Trading data
Leverage in existing businesses: Embed AI into flow businesses
B2B: Paving the way to create value added using digital technologies (1)
Client data
Big data AI / Deep
learning Flow desk
Pricing
Inquiry
Apr: Launched AI Lab
May-Oct: Proof of concept for Italian government bonds
Nov-Dec: Prepare for Full operation
Jan: EMEA Rates product roll out
Feb~: Phased roll out for US and AEJ flow products
2018 2019 2020
Enhance client revenues
• Use trading and real-time client data • Improve pricing and hedging
effectiveness
Lower execution costs
• Improve execution costs by ensuring dynamic and automated execution and hedging
Improve profitability
• Reduce workload for human resources (sales, traders)
29

B2B: Paving the way to create value added using digital technologies (2)
Streamline and monetize
existing platform
Client data
29,000 Consolidated client
data
Salesforce 2.0
1,300
Internal users
14,000+
Internal users
Symphony Fenergo
-50% Average reduction in new client onboarding
time
Ongoing management of client lifecycle
New business opportunities
Introduce third-party sales support tools to monetize digital assets by streamlining workflows and ensuring efficient marketing
Consolidate client data (names, supplemental info, updates) and use effectively
Started exploring provision of secure and regulatory-compliant digital asset custody services
Ledger Global Advisors Holdings
Digital asset security company Develop and market cryptocurrency
hardware wallets
Investment advisory firm started handling Bitcoin in 2014
Developed first Bitcoin investment strategy for institutional investors
Institutional investors
30
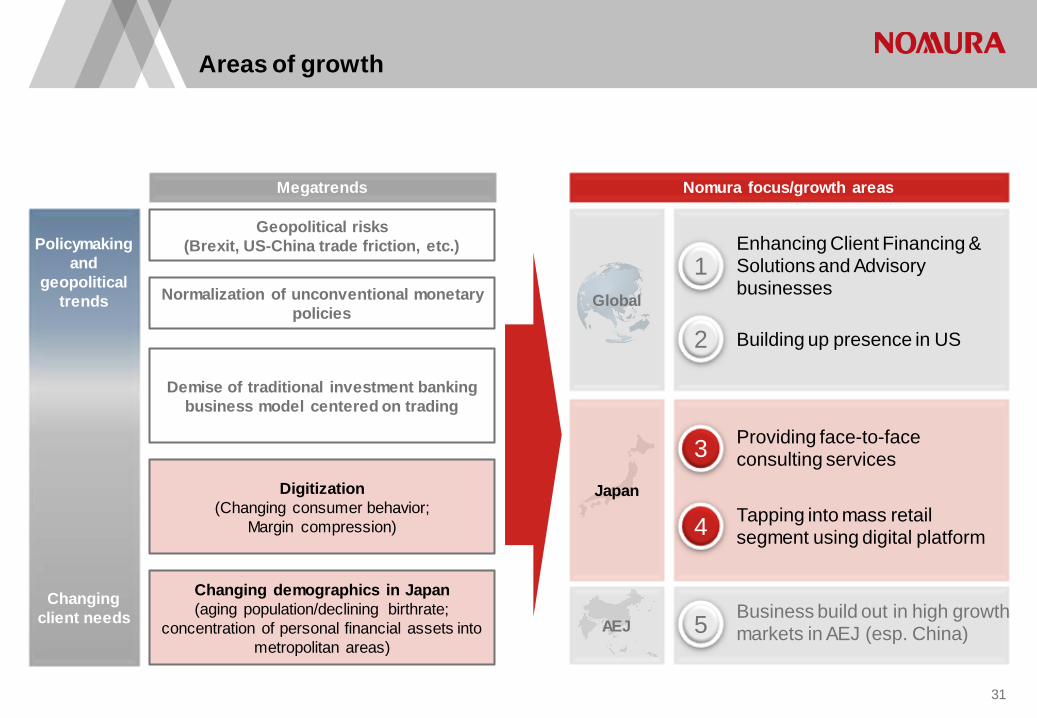
Demise of traditional investment banking business model centered on trading
Areas of growth
Nomura focus/growth areas
Providing face-to-face consulting services
Tapping into mass retail segment using digital platform
Building up presence in US
Megatrends
Changing demographics in Japan (aging population/declining birthrate;
concentration of personal financial assets into metropolitan areas)
Digitization (Changing consumer behavior;
Margin compression)
Geopolitical risks (Brexit, US-China trade friction, etc.)
Normalization of unconventional monetary policies
Enhancing Client Financing & Solutions and Advisory businesses
Business build out in high growth markets in AEJ (esp. China)
Global
Japan
1
2
5
3
4
AEJ
Policymaking and
geopolitical trends
Changing client needs
31
2018
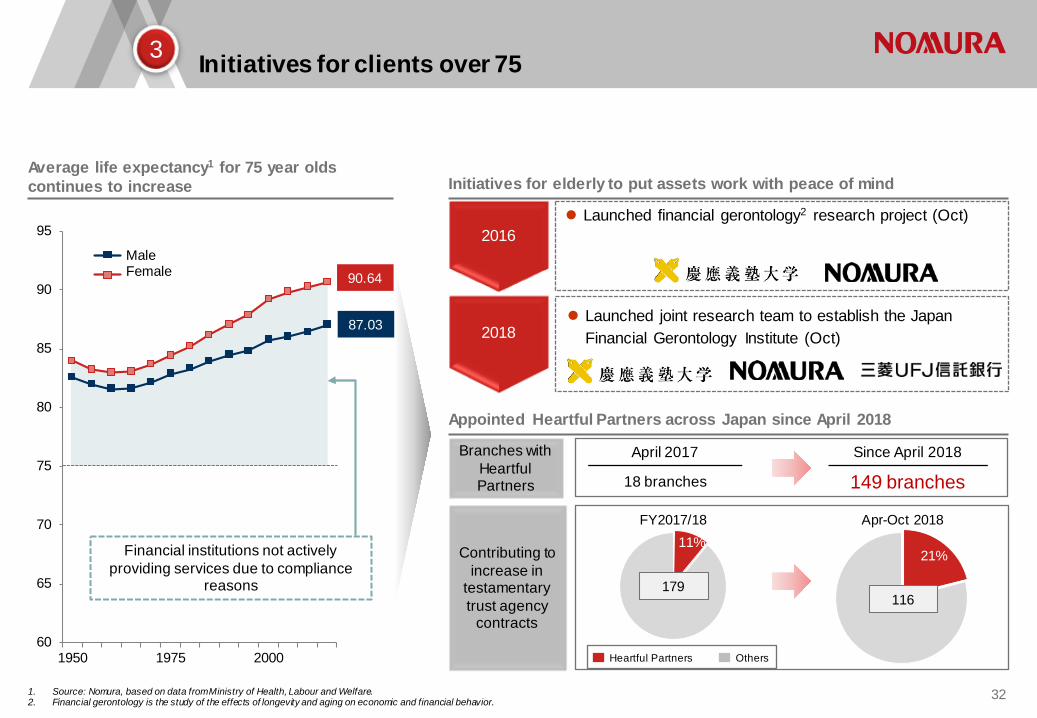
Initiatives for clients over 75
1. Source: Nomura, based on data from Ministry of Health, Labour and Welfare. 2. Financial gerontology is the study of the effects of longevity and aging on economic and financial behavior.
Average life expectancy1 for 75 year olds continues to increase Initiatives for elderly to put assets work with peace of mind
Launched joint research team to establish the Japan Financial Gerontology Institute (Oct)
3
Appointed Heartful Partners across Japan since April 2018
2016 Launched financial gerontology2 research project (Oct)
Branches with Heartful Partners
Contributing to increase in
testamentary trust agency
contracts
11% 21%
179
FY2017/18 Apr-Oct 2018
Heartful Partners Others
116
April 2017 Since April 2018
18 branches 149 branches
60
65
70
75
80
85
90
95
1950 1975 2000
男性 女性 90.64
87.03
Financial institutions not actively providing services due to compliance
reasons
Male Female
32
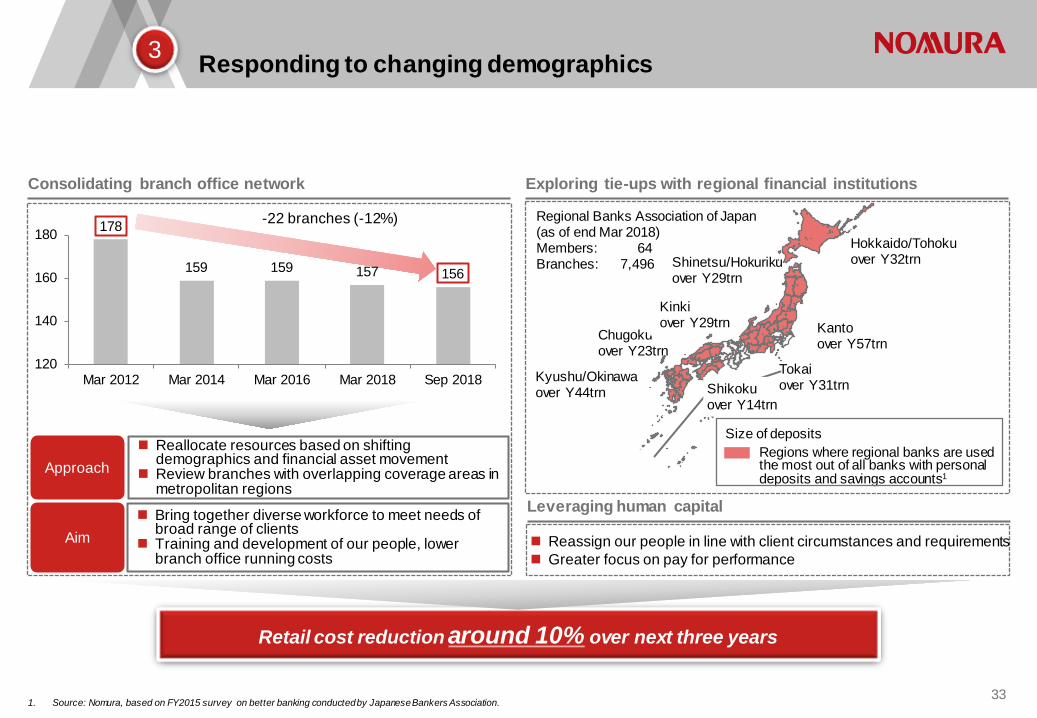
178
159 159 157 156
120
140
160
180
Mar 2012 Mar 2014 Mar 2016 Mar 2018 Sep 2018
Responding to changing demographics
1. Source: Nomura, based on FY2015 survey on better banking conducted by Japanese Bankers Association.
Consolidating branch office network
3
Reallocate resources based on shifting demographics and financial asset movement
Review branches with overlapping coverage areas in metropolitan regions
-22 branches (-12%)
Approach
Aim Bring together diverse workforce to meet needs of
broad range of clients Training and development of our people, lower
branch office running costs
Exploring tie-ups with regional financial institutions
Hokkaido/Tohoku over Y32trn
Kanto over Y57trn
Shinetsu/Hokuriku over Y29trn
Kyushu/Okinawa over Y44trn
Chugoku over Y23trn
Kinki over Y29trn
Regional Banks Association of Japan
(as of end Mar 2018) Members: 64 Branches: 7,496
Size of deposits Regions where regional banks are used the most out of all banks with personal deposits and savings accounts1
Leveraging human capital
Reassign our people in line with client circumstances and requirements Greater focus on pay for performance
Shikoku over Y14trn
Tokai over Y31trn
Retail cost reduction around 10% over next three years
33
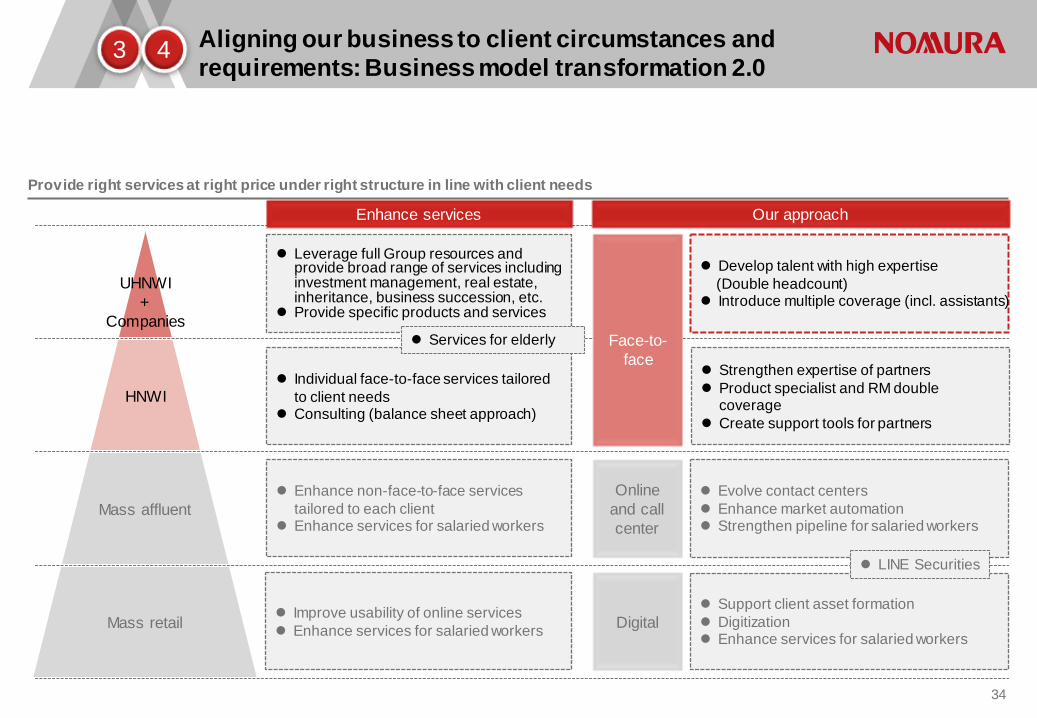
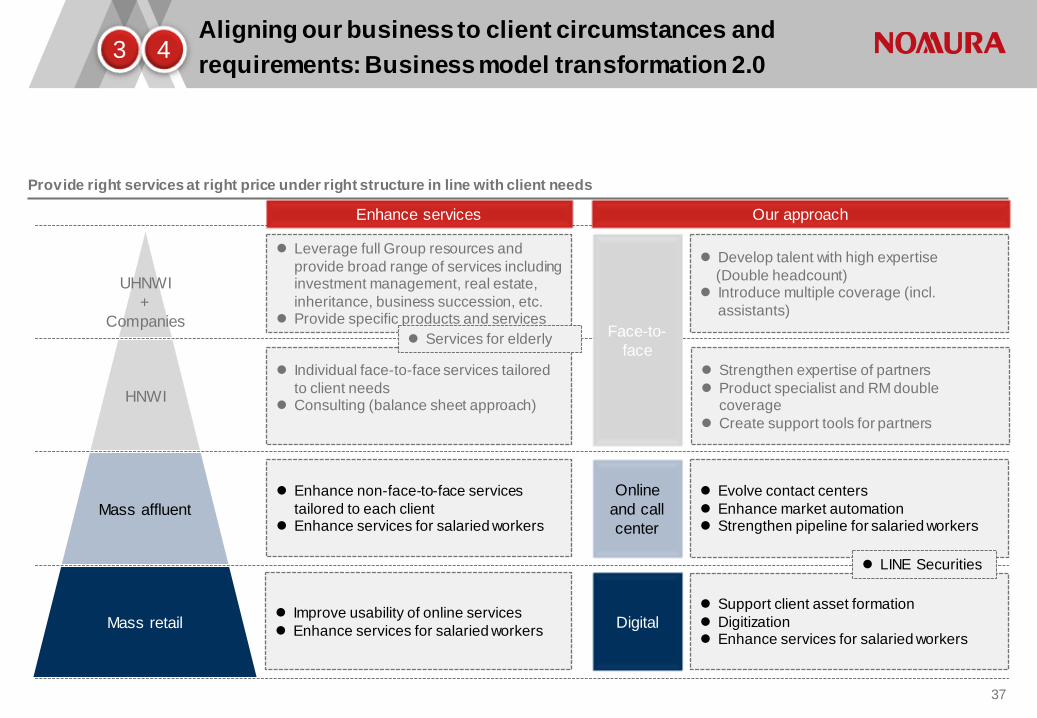
Strengthen expertise of partners Product specialist and RM double
coverage Create support tools for partners
Support client asset formation Digitization Enhance services for salaried workers
Evolve contact centers Enhance market automation Strengthen pipeline for salaried workers
Leverage full Group resources and provide broad range of services including investment management, real estate, inheritance, business succession, etc.
Provide specific products and services
Individual face-to-face services tailored to client needs
Consulting (balance sheet approach)
Enhance non-face-to-face services tailored to each client
Enhance services for salaried workers
Improve usability of online services Enhance services for salaried workers
Provide right services at right price under right structure in line with client needs
Aligning our business to client circumstances and requirements: Business model transformation 2.0
Mass retail
Mass affluent
HNWI
UHNWI +
Companies
3 4
Develop talent with high expertise (Double headcount) Introduce multiple coverage (incl. assistants)
Our approach Enhance services
Services for elderly Face-to-face
Digital
Online and call center
LINE Securities
34
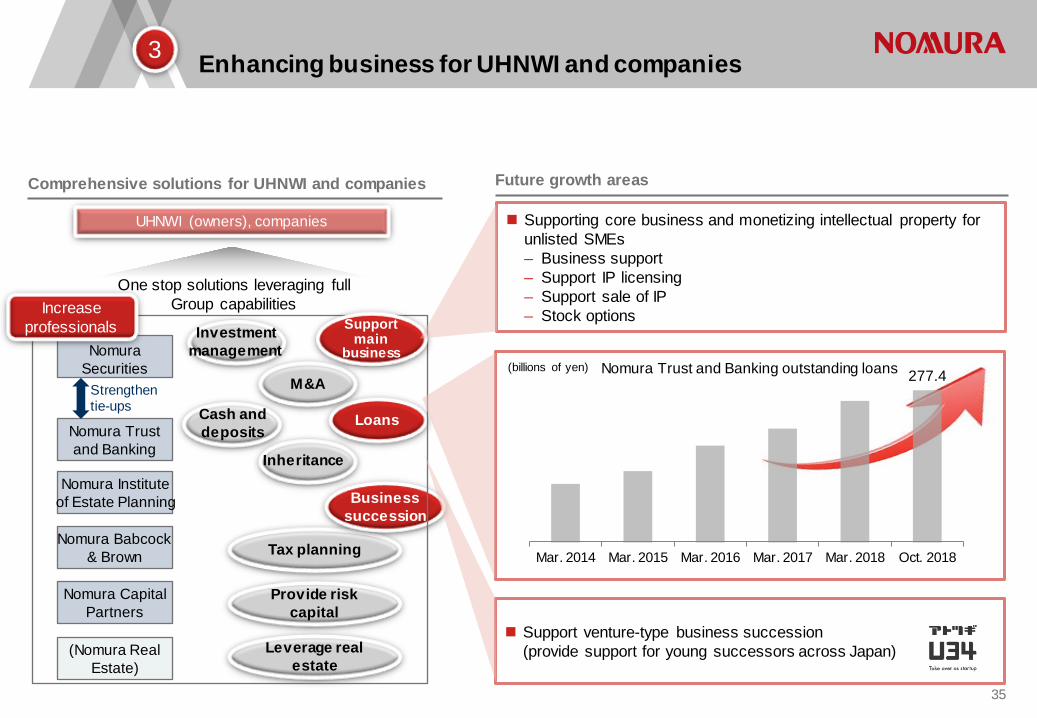
Nomura Babcock & Brown
Nomura Trust and Banking
(Nomura Real Estate)
Enhancing business for UHNWI and companies
Comprehensive solutions for UHNWI and companies
Nomura Securities
Nomura Institute of Estate Planning
UHNWI (owners), companies
Loans
Leverage real estate
Tax planning
M&A
Provide risk capital
Nomura Capital Partners
Business succession
One stop solutions leveraging full Group capabilities
Strengthen tie-ups
Increase professionals
3
277.4
Mar. 2014 Mar. 2015 Mar. 2016 Mar. 2017 Mar. 2018 Oct. 2018
Nomura Trust and Banking outstanding loans
Support main
business
Support venture-type business succession (provide support for young successors across Japan)
Supporting core business and monetizing intellectual property for unlisted SMEs – Business support – Support IP licensing – Support sale of IP – Stock options
Future growth areas
Investment management
Cash and deposits
Inheritance
(billions of yen)
35

Strengthening business for companies: Creating shareholder community
1. Source: Nomura Institute of Capital markets Research.
Japan unlisted market remains unorganized
3
New shareholder management service for unlisted companies which account for over 99% of all Japanese
companies
Unlisted company
Investor (individual/company)
Shareholder community members
5. Trade unlisted shares
3. Participate
1. Propose/Screen
Operator (broker)
US Japan Stock exchanges
(3,620 companies) TSE 1st and 2nd
(2,605 companies)
Mothers/JASDAQ (987 companies)
TOKYO PRO Market (28 companies)
Shareholder community (20 companies)
Stock exchanges
(4,331 companies)
OTC market (15,437
companies)
SharesPost and other private market trading platforms
(Unknown)
Listed
Unlisted
Unlisted restricted securities
Share trading systems in Japan and US (Sep 2018)1
Unlisted company
needs
Respond to requests to buy from shareholders outside family
Reduce burden of shareholder management Strengthen governance
1. Design shareholder community
2. Organize/run shareholder community
4. Disclose information
Shareholders
36
Develop talent with high expertise (Double headcount) Introduce multiple coverage (incl.
assistants)
Strengthen expertise of partners Product specialist and RM double
coverage Create support tools for partners
Support client asset formation Digitization Enhance services for salaried workers
Evolve contact centers Enhance market automation Strengthen pipeline for salaried workers
Leverage full Group resources and provide broad range of services including investment management, real estate, inheritance, business succession, etc.
Provide specific products and services
Individual face-to-face services tailored to client needs
Consulting (balance sheet approach)
Enhance non-face-to-face services tailored to each client
Enhance services for salaried workers
Improve usability of online services Enhance services for salaried workers
Provide right services at right price under right structure in line with client needs
Aligning our business to client circumstances and requirements: Business model transformation 2.0
Mass retail
Mass affluent
HNWI
UHNWI +
Companies
3 4
Our approach Enhance services
Services for elderly Face-to-face
Digital
Online and call center
LINE Securities
37
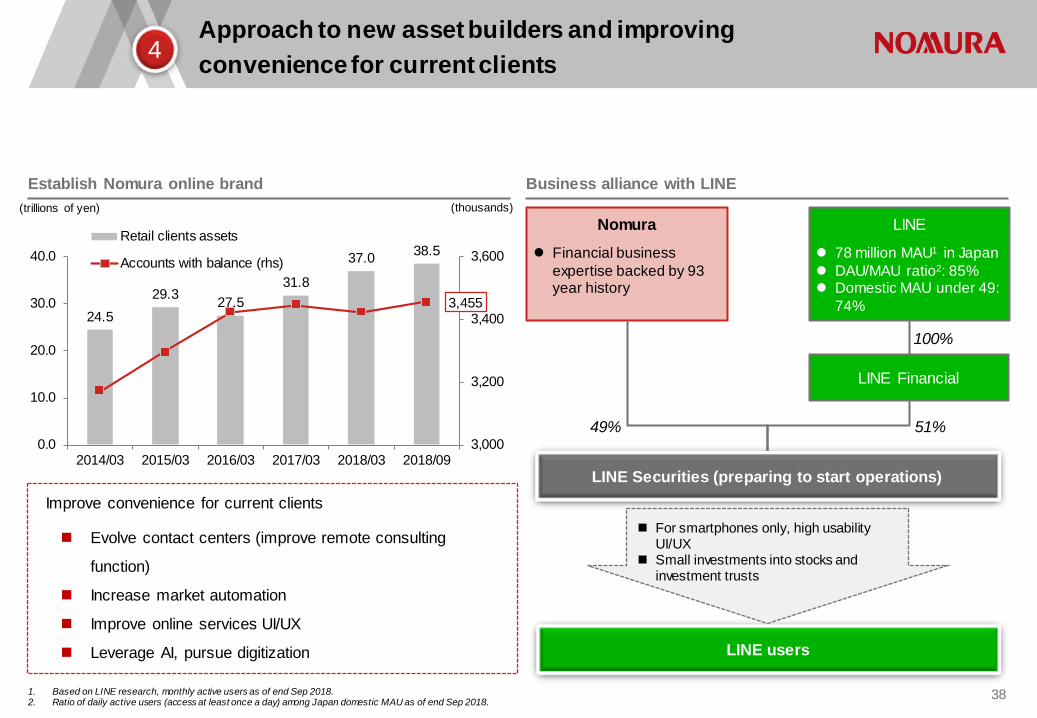
24.5 29.3 27.5
31.8
37.0 38.5
3,455
3,000
3,200
3,400
3,600
0.0
10.0
20.0
30.0
40.0
2014/03 2015/03 2016/03 2017/03 2018/03 2018/09
Retail clients assets
Accounts with balance (rhs)
Approach to new asset builders and improving convenience for current clients
1. Based on LINE research, monthly active users as of end Sep 2018. 2. Ratio of daily active users (access at least once a day) among Japan domestic MAU as of end Sep 2018.
Establish Nomura online brand
4
Nomura LINE
Financial business expertise backed by 93 year history
78 million MAU1 in Japan
DAU/MAU ratio2: 85% Domestic MAU under 49:
74%
49% 51%
LINE Securities (preparing to start operations)
100%
LINE Financial
LINE users
For smartphones only, high usability UI/UX
Small investments into stocks and investment trusts
Business alliance with LINE
Evolve contact centers (improve remote consulting
function)
Increase market automation
Improve online services UI/UX
Leverage AI, pursue digitization
Improve convenience for current clients
(trillions of yen) (thousands)
38

Approach to new asset builders
Taking our own initiative to the next level
4
Further drive digital transformation in businesses at Group level
Explore possibility of providing new services that harness digital technologies to global
mass retail market
Established Fintech Committee
Reorganized into Group Fintech Committee
Established Financial Innovation Office
Fintech committees in international regions
Established San Francisco Innovation Office
Established Innovation Laboratory in Asset Management
2018
Established Wholesale Digital Office
Established new business development team in Retail Strategy dept.
2017
2016
2015
39

Demise of traditional investment banking business model centered on trading
Areas of growth
Nomura focus/growth areas
Providing face-to-face consulting services
Tapping into mass retail segment using digital platform
Building up presence in US
Megatrends
Changing demographics in Japan (aging population/declining birthrate;
concentration of personal financial assets into metropolitan areas)
Digitization (Changing consumer behavior;
Margin compression)
Geopolitical risks (Brexit, US-China trade friction)
Normalization of unconventional monetary policies
Enhancing Client Financing & Solutions and Advisory businesses
Business build out in high growth markets in AEJ (esp. China)
Global
Japan
1
2
5
3
4
AEJ
Policymaking and
geopolitical trends
Changing client needs
40

Business in high-growth AEJ: Full-scale entry into China
Preparing to build out onshore platform in China MoU on strategic alliance to set up Japan-China Industrial Cooperation Fund
5
Deepen trade and investment cooperation between Japan and China by investing in companies
Use our experience and insights in high-net-worth business to launch a business for rising HNWI in China then roll out into other businesses including Wholesale
Aim for full scope securities firm as reform and opening up progresses
Strategy
Nomura X Co.
51% 49%
Nomura Orient International Securities
On May 8, 2018, we applied to China Securities Regulatory Commission(CSRC) to establish a joint venture securities firm
Signed MoU on Oct 26, 2018, with CIC and Japanese financial institutions on strategic alliance to set up Japan-China Industrial Cooperation Fund
Nomura Japanese financial
institutions
China Investment
Corporation(CIC)
Expected fund size: Y100bn - Y200bn
Investment targets: Japanese companies looking to enter China, Chinese companies, third-party country companies
Y Co.
Japan-China Industrial Cooperation Fund
41

Agenda
Progress of Vision C&C
Megatrends shaping future financial services industry
2
3
Towards sustainable growth 4
Business environment 1
Initiatives to improve capital efficiency 5
42

Reduce capital of London intermediate holding company, which has been global booking hub, to size required for just EMEA business1(-$2bn)
Further enhance transparency of each region and aim to create structure capable of initially delivering pretax ROE of over 5% in each international region – Reduce less profitable businesses – Optimal allocation of human capital – Recover capital retained in EMEA and reallocate to growth areas1
Nomura Securities International
(NSI)
Nomura Global Financial Products
Inc. (NGFP)
Nomura International plc
(NIplc)
Optimal resource allocation across regions
Booking entity strategy: More efficient capital allocation, clarify revenue accountability of each region
1. After receiving required regulatory approvals.
EEA clients
Nomura Financial Products Europe
(NFPE)
Japan clients
Major broker dealers UK clients Global funds, pension plans
Nomura Singapore Limited (NSL)
Client facing entity Clients
Market risk entity Changes
Nomura Securities (NSC)
Nomura Financial Products &
Services, Inc. (NFPS)
AEJ-related business
Americas business
Japan-related business
Americas clients
Future
$3bn (c. Y330bn)
EMEA business
Americas business
EMEA business Approx. 50%
Current
$5bn (c. Y550bn)
Japan business
AEJ business
London intermediate holding company capital
breakdown
AEJ clients
Buffer
Buffer
43

Revise business processes and office locations to reduce costs centered on Corporate functions
Revising our corporate operating model
High cost locations
70%
Offshore locations High cost
locations 40%
Nearshore locations
Offshore locations
Current Future
Centralized management of procurement
Digitization, outsourcing, etc.
Global real estate strategy
30% reduction
6-7% reduction
Reduce routine work by revising business processes (RPA, AI, etc.), promote outsourcing
Procurement reforms to reduce marketing costs, third party professional fees, and costs for other items
Revise procurement of IT equipment
Make use of offshoring and nearshoring
Firm-wide fixed costs
Reduce by Y60bn over four years
(vs. FY2016/17)
30%
60%
in targeted processes
in targeted costs
44

Invest in growth areas if above cost of capital
Maintain robust financial position
Enhance shareholder returns, etc.
4.5%
2.5%
Common Equity Tier 1 ratio
Maintain robust capital base to meet future regulatory requirements
Minimum capital requirements
(expected, 2019)
Target
> 11%
~ 8%
17%
Sep 2018 Applying final Basel 3 rules to balance sheet at
end Sep 2018 (Pro-forma)
13 ~ 14%
FRTB*
Buffer
Other Basel 3
final rules*
Common Equity Tier 1
Other Capital
preservation buffer
Improvement by review ing unprofitable businesses
2 ~ 3%
Minimum requirement vs. Nomura’s target
Applying final Basel 3 rules to current balance sheet (Pro-forma)
*Estimate based on final rules as currently envisaged applied to end Sep 2018 balance sheet. Impact on CET 1 ratio could change due to movement in balance sheet, finalization of rules by Basel Committee, clarification of Internal Model, etc.
Other retained earnings
Future image
Increased risk taking related to improved market conditions
45
Around 1%
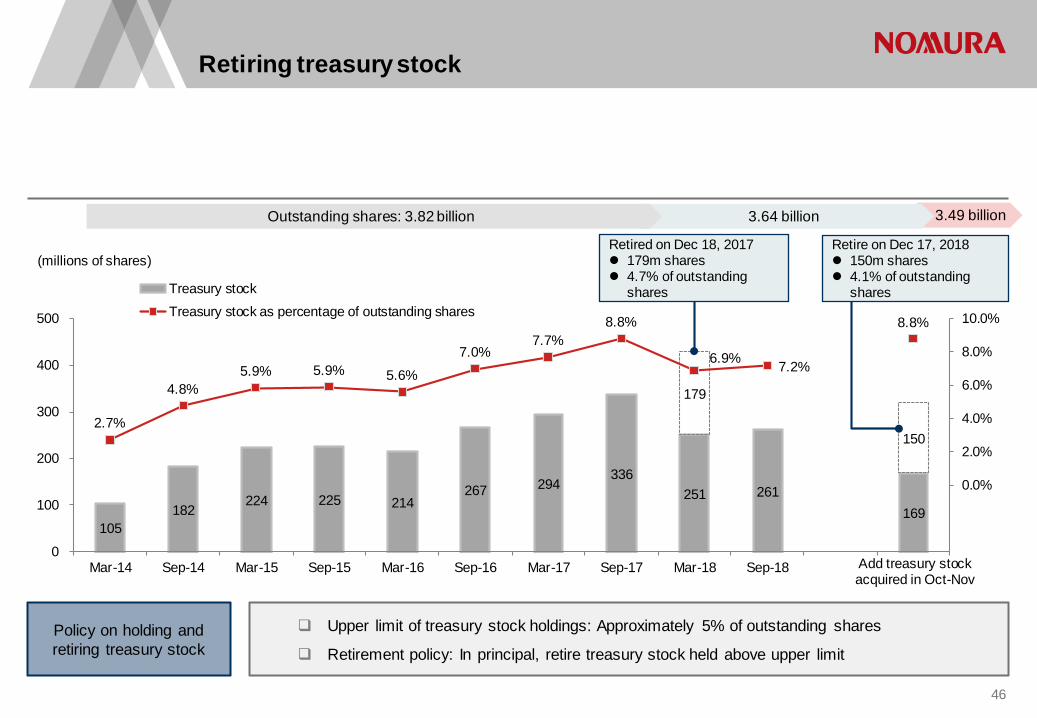
105 182
224 225 214 267 294
336 251 261
169
179
150 2.7%
4.8% 5.9% 5.9% 5.6%
7.0% 7.7%
8.8%
6.9% 7.2%
8.8%
-4.0%
-2.0%
0.0%
2.0%
4.0%
6.0%
8.0%
10.0%
0
100
200
300
400
500
Mar-14 Sep-14 Mar-15 Sep-15 Mar-16 Sep-16 Mar-17 Sep-17 Mar-18 Sep-18
Treasury stockTreasury stock as percentage of outstanding shares
Retiring treasury stock
Policy on holding and retiring treasury stock
Upper limit of treasury stock holdings: Approximately 5% of outstanding shares
Retirement policy: In principal, retire treasury stock held above upper limit
Add treasury stock acquired in Oct-Nov
Retired on Dec 18, 2017 179m shares 4.7% of outstanding
shares
Retire on Dec 17, 2018 150m shares 4.1% of outstanding
shares
3.49 billion 3.64 billion Outstanding shares: 3.82 billion
(millions of shares)
46

Disclaimer
This document is produced by Nomura Holdings, Inc. (“Nomura”). Nothing in this document shall be considered as an offer to sell or solicitation of an offer to buy any security, commodity or other
instrument, including securities issued by Nomura or any affiliate thereof. Offers to sell, sales, solicitations to buy, or purchases of any securities issued by Nomura or any affiliate thereof may only be made or entered into pursuant to appropriate offering materials or a prospectus prepared and distributed according to the laws, regulations, rules and market practices of the jurisdictions in which such offers or sales may be made.
The information and opinions contained in this document have been obtained from sources believed to be reliable, but no representations or warranty, express or implied, are made that such information is accurate or complete and no responsibility or liability can be accepted by Nomura for errors or omissions or for any losses arising from the use of this information.
All rights regarding this document are reserved by Nomura unless otherwise indicated. No part of this document shall be reproduced, stored in a retrieval system or transmitted in any form or by any means, electronic, mechanical, photocopying, recording or otherwise, without the prior written permission of Nomura.
This document contains statements that may constitute, and from time to time our management may make “forward-looking statements” within the meaning of the safe harbor provisions of The Private Securities Litigation Reform Act of 1995. Any such statements must be read in the context of the offering materials pursuant to which any securities may be offered or sold in the United States. These forward-looking statements are not historical facts but instead represent only our belief regarding future events, many of which, by their nature, are inherently uncertain and outside our control. Actual results and financial condition may differ, possibly materially, from what is indicated in those forward-looking statements. You should not place undue reliance on any forward-looking statement and should consider all of the following uncertainties and risk factors, as well as those more fully discussed under Nomura’s most recent Annual Report on Form 20-F and other reports filed with the U.S. Securities and Exchange Commission (“SEC”) that are available on Nomura’s website (https://www.nomura.com) and on the SEC‘s website (http://www.sec.gov); Important risk factors that could cause actual results to differ from those in specific forward-looking statements include, without limitation, economic and market conditions, political events and investor sentiments, liquidity of secondary markets, level and volatility of interest rates, currency exchange rates, security valuations, competitive conditions and size, and the number and timing of transactions.
Forward-looking statements speak only as of the date they are made, and Nomura undertakes no obligation to update any forward-looking statement to reflect the impact of circumstances or events that arise after the date the forward-looking statement was made.
The consolidated financial information in this document is unaudited.

Nomura Holdings, Inc. www.nomura.com