presentation: an overview of the future production and ... · an overview of the future production...
TRANSCRIPT

An overview of the future production and demand of
ferronickel
Robert Cartman – Hatch

2
�Hatch
�Overview of FeNi market
�Demand analysis
�Supply analysis
�Conclusions
Contents
INFORMA MINING & METALS 2ND EURO NICKEL CONFERENCE, 18-19TH MARCH 2010

SERVICES
SECTORS
HATCH
Hatch services and sectors
© Hatch Associates Limited, 2009

HATCH
Global reach and resources
Canada• Calgary, Alberta• Hamilton, Ontario• Montreal, Quebec• Sorel-Tracy, Quebec• Sudbury, Ontario• Mississauga, Ontario• Niagara Falls, Ontario• Vancouver, British ColumbiaUSA
• Boston, Massachusetts• Buffalo, New York• Millburn, New Jersey• Monroeville, Pennsylvania• New York, New York• Pittsburgh, Pennsylvania• Pleasanton, California• San Francisco, California• Seattle, Washington
3400
South America• Antofagasta, Chile• Santiago, Chile• Lima, Peru• São Paulo, Brazil• Belo Horizonte, Brazil• Vitoria, Brazil
700
Europe• London, England• Moscow, Russia
170
South Africa• Johannesburg• Richards Bay
600
India• Delhi
China• Beijing• Shanghai
120
Australia• Brisbane• Gladstone• Mackay• Melbourne• Newcastle
• Perth• Sydney• Townsville• Whyalla• Wollongong
2300(Yellow indicates regional hub)
8000 people
© Hatch Associates Limited, 2009

5
Hatch counts many of the world’s major mining and steelmaking companies
and financial institutions among its core client base
Mining
Alcan
Alcoa
Anglo American
Assmang
BHP Billiton
De Beers
ENRC
Falconbridge
Impala Platinum
Lonmin
Newmont Mining
Norilsk
Placer Dome
QIT
Rio Tinto
SUAL
Vale Inco
Xstrata
Steel
ArcelorMittal
BlueScope Steel
Celsa
CMC
Tata/Corus Group
Evraz Group
Gerdau Group
Mechel
Metalloinvest
Metinvest
Nucor
POSCO
Ruukki
Severstal
Shougang
TMK
U.S. Steel
voestalpine
Financial institutions
ADB
Bank of America
Bear Stearns
CIBC
Citibank
Commonwealth Bank
Credit Lyonnais
CSFB
Deutsche Bank
EBRD
HSBC
IFC
JP Morgan Chase
Mellon Bank
NM Rothschild & Sons
RBS
UBS Warburg
World Bank
INFORMA MINING & METALS 2ND EURO NICKEL CONFERENCE, 18-19TH MARCH 2010

6
�Hatch
�Overview of FeNi market
�Demand analysis
�Supply analysis
�Conclusions
Contents
INFORMA MINING & METALS 2ND EURO NICKEL CONFERENCE, 18-19TH MARCH 2010

7
Annual FeNi production is typically ~250kt, with BHP and Eramet the
largest producers in 2009
Source: ISSF, Hatch
Global FeNi production by producer
INFORMA MINING & METALS 2ND EURO NICKEL CONFERENCE, 18-19TH MARCH 2010
0
200
400
600
800
1,000
1,200
1,400
1,600
2006 2007 2008 2009
FeNi Other
Global primary Ni production by type
kt
5.9%
2.7%
-0.4%
-13%
-3.5%
-7%
0
200
400
600
800
1,000
1,200
1,400
1,600
2006 2007 2008 2009
FeNi Other
Global primary Ni production by type
kt
5.9%
2.7%
-0.4%
-13%
-3.5%
-7%
Others
19%
Antam
5%
BHP
21%
Eramet
17%
Pamco
13%
SMM
8%
Anglo
American
8%
Posco
9%
2009
240kt
Others
19%
Antam
5%
BHP
21%
Eramet
17%
Pamco
13%
SMM
8%
Anglo
American
8%
Posco
9%
2009
240kt

8
Alloy steel
2%
Stainless steel
98%
Ni demand is dominated by stainless steel production, particularly in the
case of FeNi. Stainless steel production has fallen since 2006
Source: ISSF, Hatch
Ni demand by end-use
FeNi demand by end-use
Stainless steel
57%
Alloy steel
8%
Non-ferrous
14%
Other
6%
Foundry
3%
Plating
12%
Global stainless steel productionby series (2004-09)
INFORMA MINING & METALS 2ND EURO NICKEL CONFERENCE, 18-19TH MARCH 2010
2.31 2.38 2.67 3.23 2.95 2.60
16.09 15.35
18.5816.23
15.3914.47
6.03 6.44
6.958.18
7.28
6.60
0
5
10
15
20
25
30
2004 2005 2006 2007 2008 2009
200 300 400 Other

9
�Hatch
�Overview of FeNi market
�Demand analysis
�Supply analysis
�Conclusions
Contents
INFORMA MINING & METALS 2ND EURO NICKEL CONFERENCE, 18-19TH MARCH 2010

10
0
5
10
15
20
25
30
2001 2002 2003 2004 2005 2006 2007 2008 2009
300 400 200 Other
0
5,000
10,000
15,000
20,000
25,000
30,000
1965
1969
1973
1977
1981
1985
1989
1993
1997
2001
2005
2009
Long-term stainless steel production has risen at a CAGR of 4.5% since
1965
Source: Vale, ISSF, Hatch
Stainless steel production Stainless steel productionby series, 2001-09kt Mt
INFORMA MINING & METALS 2ND EURO NICKEL CONFERENCE, 18-19TH MARCH 2010

11
0
10
20
30
40
50
0 10 20 30 40 50 60
Stainless steel production is forecast to continue rising in order to meet
the expected growth in consumption by the developing world
Source: Vale, IMF, Hatch
Per capita consumption of stainless steel vsincome per capita for selected countries, 1997-2008
China Malaysia
SouthKorea
Taiwan
Japan
$’000 per capita, 2008 (PPP)
Kg
pe
r ca
pit
a
INFORMA MINING & METALS 2ND EURO NICKEL CONFERENCE, 18-19TH MARCH 2010

12
40%
60%
80%
2001 2003 2005 2007 2009
% 300-series
0
5,000
10,000
15,000
20,000
25,000
30,000
35,000
40,000
2001
2002
2003
2004
2005
2006
2007
2008
2009
2010
2011
2012
2020
Long-term stainless steel production will move toward 40Mt by 2020.
Further substitution is possible but most of this has already taken place
Source: ISSF, Hatch
Stainless steel production
5-10%
1-5%
10-15%
5-10%
0-1%
2020
300-series ratio
Percentage point shift from 300-serieskt
-40
-20
0
Appliances
& Catering
Industrial
applications ABC Tubemaking Transport
Change 2001 - 2008 Potential future change
INFORMA MINING & METALS 2ND EURO NICKEL CONFERENCE, 18-19TH MARCH 2010
?

13
FeNi faces substitution threats from other refined nickel products and
secondary sources of nickel i.e. scrap
Source: ISSF, Hatch
Breakdown of nickel consumptionby stainless steel mills
Breakdown of scrap ratiosby regions
INFORMA MINING & METALS 2ND EURO NICKEL CONFERENCE, 18-19TH MARCH 2010
0%
10%
20%
30%
40%
50%
60%
70%
80%
90%
100%
Nickel units by source Primary nickel units by
source
Primary
Scrap
NickelMetal
FeNi
NPI
0%
10%
20%
30%
40%
50%
60%
70%
80%
90%
100%
Nickel units by source Primary nickel units by
source
Primary
Scrap
NickelMetal
FeNi
NPI
0%
10%
20%
30%
40%
50%
60%
70%
80%
2001 2002 2003 2004 2005 2006 2007
Global USA Europe China

14
�Hatch
�Overview of FeNi market
�Demand analysis
�Supply analysis
�Conclusions
Contents
INFORMA MINING & METALS 2ND EURO NICKEL CONFERENCE, 18-19TH MARCH 2010
15
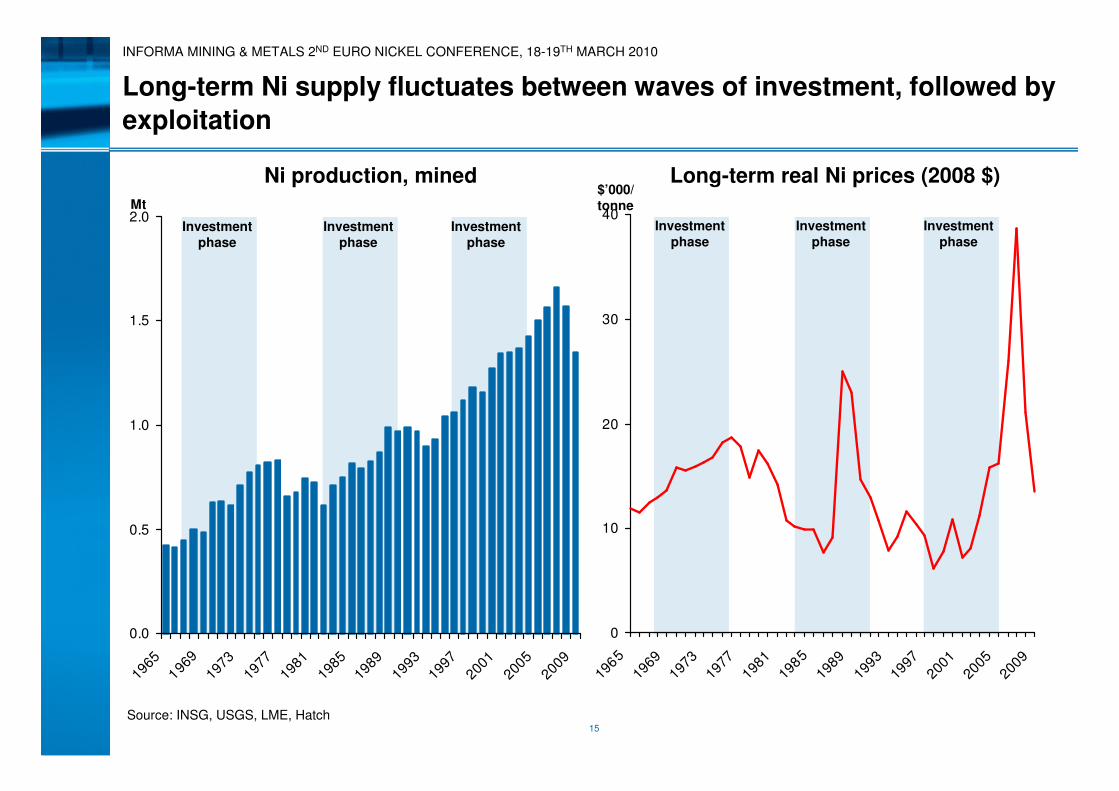
Long-term Ni supply fluctuates between waves of investment, followed by
exploitation
Source: INSG, USGS, LME, Hatch
Ni production, mined
Investmentphase
Investmentphase
Investmentphase
Investmentphase
Investmentphase
Investmentphase
Long-term real Ni prices (2008 $)$’000/tonneMt
0
10
20
30
40
1965
1969
1973
1977
1981
1985
1989
1993
1997
2001
2005
2009
INFORMA MINING & METALS 2ND EURO NICKEL CONFERENCE, 18-19TH MARCH 2010
0.0
0.5
1.0
1.5
2.0
1965
1969
1973
1977
1981
1985
1989
1993
1997
2001
2005
2009

16
The next wave of investment could add another ~500kt of capacity
Source: Company reports, Hatch
63ktLaterite – HPALGladstone (?)
46ktLaterite – HPALVermelho (?)
22kt
23kt
Laterite – Heap
Laterite – RKEF
Shevchenko
Tagaung Taung
31ktLaterite – HPALRamu
10kt (?)SulphideEagle (?)
Laterite – HPAL
Laterite – RKEF
Sulphide
Laterite - HPAL
Laterite – RKEF
Laterite – HPAL
Laterite – RKEF
Laterite – RKEF
Laterite – HPAL
Ore type and process
60kt
52kt
12kt
40kt (?)
60kt
60kt
23kt
36kt
60kt
Capacity
Koniambo
Ambatovy
Barro Alto
Fenix (?)
Goro
Nonoc (?)
Nunavik
Onca Puma
Weda Bay (?)
2013+201220112010
INFORMA MINING & METALS 2ND EURO NICKEL CONFERENCE, 18-19TH MARCH 2010

17
0%
20%
40%
60%
80%
100%
1992
1993
1994
1995
1996
1997
1998
1999
2000
2001
2002
2003
2004
2005
2006200
7200
820
09
Sulphides Laterites
Nickel is increasingly being extracted from lateritic ores
Source: Hatch
Nickel production by ore type Nickel resources by ore type
Sulphides
27%
Laterites
73%
Sulphides Lateri tes
INFORMA MINING & METALS 2ND EURO NICKEL CONFERENCE, 18-19TH MARCH 2010

18
Laterite resources are mainly found in countries that require large
spending on infrastructure
Source: BGS, Hatch
INFORMA MINING & METALS 2ND EURO NICKEL CONFERENCE, 18-19TH MARCH 2010

19
Lateritic ores need to be subdivided into limonites or saprolites in order
to understand the respective mining and processing costs
Source: Mick Elias, Hatch
5.5m
10m
Depth
% content
35 – 4550.010.3Bedrock
15 – 3510 – 250.02 – 0.11.8 – 3Saprolite
5 – 1525 – 400.02 – 0.11.5 – 4Transition
zone
0.5 – 540 – 500.1 – 0.20.8 – 1.5Limonite
MgOFeCoNi
Oxides
High Fe, low MgO, low SiO2
Processing – Dependent onpresence of clay minerals.Typically hydrometallurgy
(HPAL, Heap, Caron)
Silicates
Low Fe, high MgO, high SiO2
Processing – Pyrometallurgy.End product (FeNi, matte)dependent on mineralogy
INFORMA MINING & METALS 2ND EURO NICKEL CONFERENCE, 18-19TH MARCH 2010
20
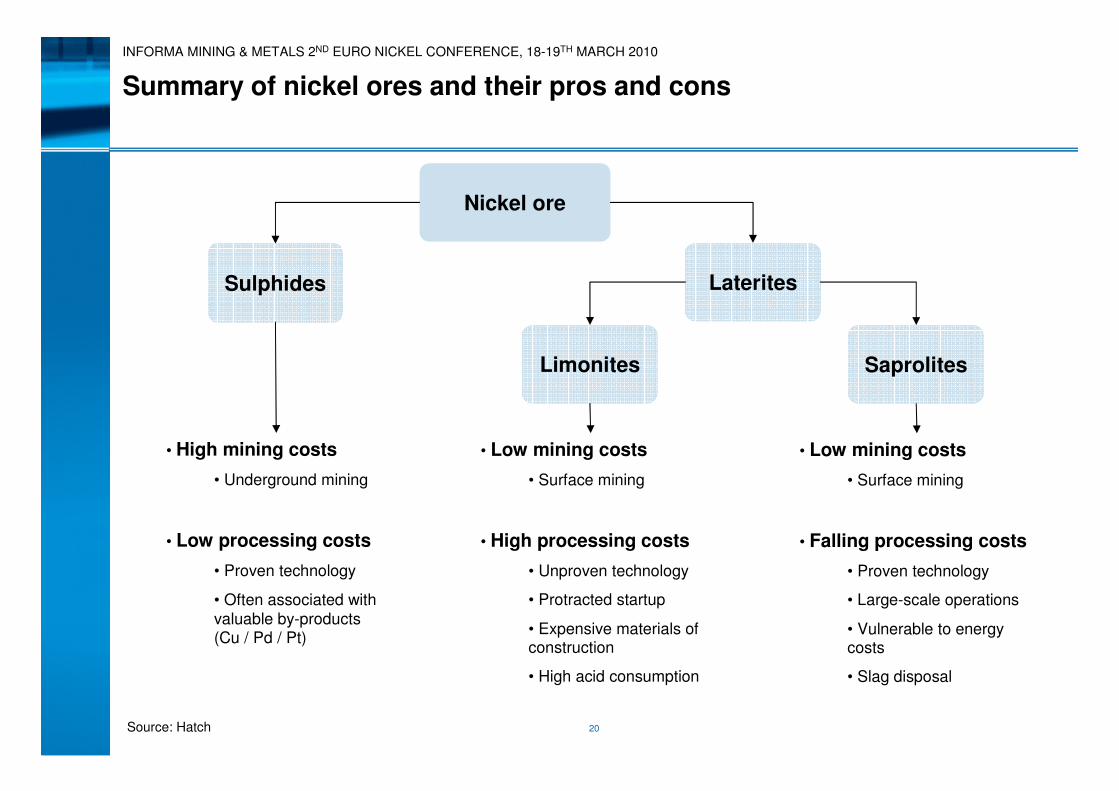
Summary of nickel ores and their pros and cons
Source: Hatch
Nickel ore
LateritesSulphides
• High mining costs
• Underground mining
• Low processing costs
• Proven technology
• Often associated with valuable by-products (Cu / Pd / Pt)
Limonites Saprolites
• Low mining costs
• Surface mining
• High processing costs
• Unproven technology
• Protracted startup
• Expensive materials of construction
• High acid consumption
• Low mining costs
• Surface mining
• Falling processing costs
• Proven technology
• Large-scale operations
• Vulnerable to energy costs
• Slag disposal
INFORMA MINING & METALS 2ND EURO NICKEL CONFERENCE, 18-19TH MARCH 2010

21
Mining and processing costs will depend on a variety of factors. It is
too simplistic to categorise as laterites vs. sulphides
Source: Hatch
Resource
Higher grade = better
>1.5% ≈ saprolite
Saprolite = provenprocessing technology
Larger size = better
Lower capex per tonne
Ore mineralogy
Content of clay mineralsLower = better
Magnesium contentLower = less acid consumption
in hydrometallurgy
SiO2 / MgO ratioImpacts on choice of end-product
Inputs
Merchant vs. captive
Hydroelectricity vs. fossil fuels
Hydrocarbons
Labour availability / skills
Infrastructure
Power / Acid / Lime plants
TransportationRoad / Sea / Air
Conveyors / Pipelines
Difficulty of terrain / climate
Accommodation
Permits / Compensation
Project management
Project phasing
Project team continuity
New technologies
INFORMA MINING & METALS 2ND EURO NICKEL CONFERENCE, 18-19TH MARCH 2010

22
�Hatch
�Overview of FeNi market
�Demand analysis
�Supply analysis
�Conclusions
Contents
INFORMA MINING & METALS 2ND EURO NICKEL CONFERENCE, 18-19TH MARCH 2010

23
Conclusions
INFORMA MINING & METALS 2ND EURO NICKEL CONFERENCE, 18-19TH MARCH 2010
Demand
• Stainless steel production to increase
• Approaching 40Mt by 2020
• Production increase will offset effects of substitution
• China/India + other EMs to drive consumption growth
• Beneficial for local laterite-based suppliers
• FeNi likely to supersede NPI
• Increase in scrap ratio a key threat
• Development of collection networks in EMs
Supply
• New supplies to arrive from lateritic ores
• Not just FeNi though
• FeNi to account for 20-25% of refined Ni production
• Compared with 15-20% at present
• Other things being equal, production costs will rise
• Increased spend on infrastructure
• Unproven technologies
• Technological advance likely to minimise LT real price rises

24
Hatch London office
Hatch is a member of the HATCH GROUP of companies
�
+44 7813808240Mobile
+44 20 7963 0972Fax
+44 20 7906 5119�
Consultant
Robert Cartman
+44 20 7906 5100 (switchboard)�
9 Floor, Portland House, Bressenden Place, London SW1E 5BH�
Your contacts for further information
INFORMA MINING & METALS 2ND EURO NICKEL CONFERENCE, 18-19TH MARCH 2010