presentation 4q14 - ccr
TRANSCRIPT
Earnings Results 4Q14 and the year of 2014March, 2015
2
Disclaimer
This presentation may contain certain forward-looking projections and trends that neither
represent realized financial results nor historical information.
These forward-looking projections and trends are subject to risk and uncertainty, and
future results may differ materially from the projections. Many of these risks and
uncertainties are related to factors that are beyond CCR’s ability to control or to estimate,
such as market conditions, currency swings, the behavior of other market participants, the
actions of regulatory agencies, the ability of the company to continue to obtain financing,
changes in the political and social context in which CCR operates or economic trends or
conditions, including changes in the rate of inflation and changes in consumer confidence
on a global, national or regional scale.
Readers are advised not to fully trust these projections and trends. CCR is not obliged to
publish any revision of these projections and trends that should reflect new events or
circumstances after the realization of this presentation.
3
Agenda
Highlights
Results Analysis
Perspectives
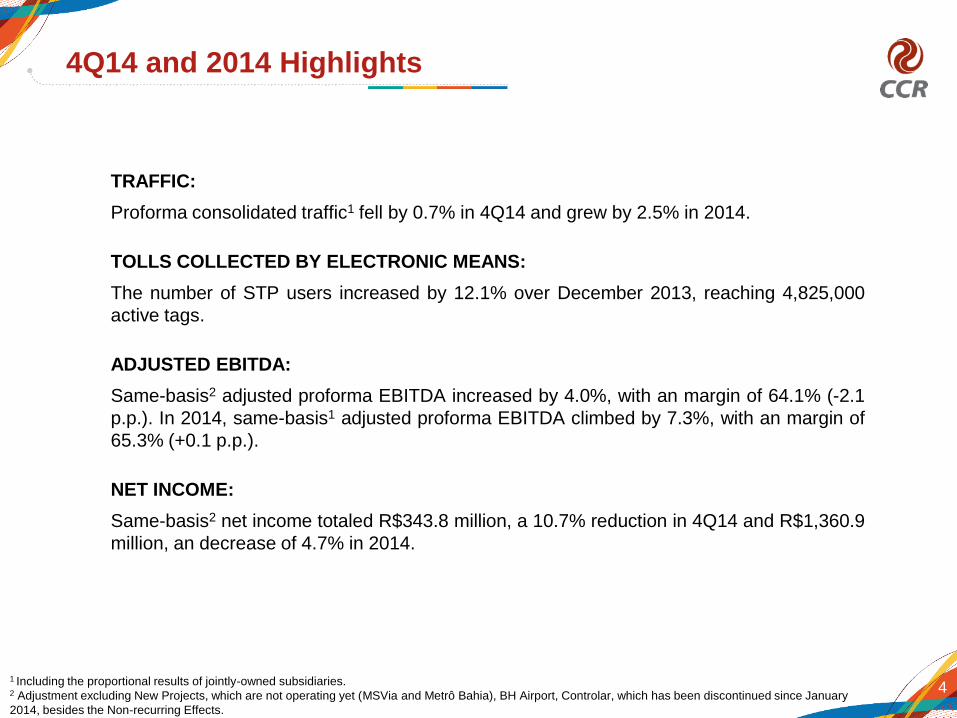
TRAFFIC:
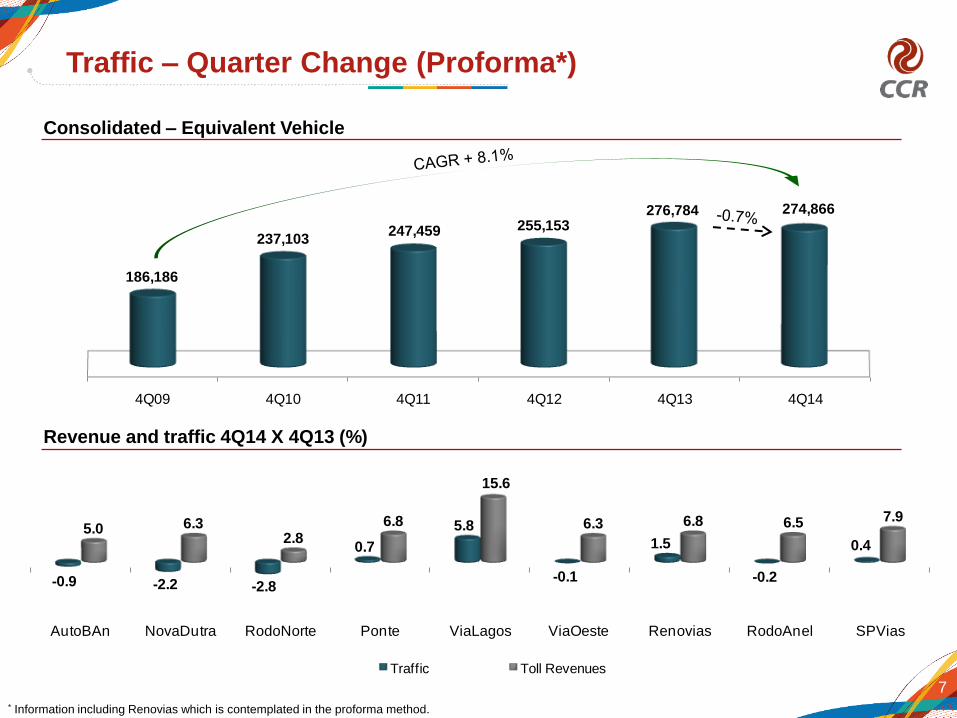
Proforma consolidated traffic1 fell by 0.7% in 4Q14 and grew by 2.5% in 2014.
TOLLS COLLECTED BY ELECTRONIC MEANS:
The number of STP users increased by 12.1% over December 2013, reaching 4,825,000
active tags.
ADJUSTED EBITDA:
Same-basis2 adjusted proforma EBITDA increased by 4.0%, with an margin of 64.1% (-2.1
p.p.). In 2014, same-basis1 adjusted proforma EBITDA climbed by 7.3%, with an margin of
65.3% (+0.1 p.p.).
NET INCOME:
Same-basis2 net income totaled R$343.8 million, a 10.7% reduction in 4Q14 and R$1,360.9
million, an decrease of 4.7% in 2014.
4
4Q14 and 2014 Highlights
1 Including the proportional results of jointly-owned subsidiaries.2 Adjustment excluding New Projects, which are not operating yet (MSVia and Metrô Bahia), BH Airport, Controlar, which has been discontinued since January
2014, besides the Non-recurring Effects.
5
Subsequent Events
DIVIDENDS:
CCR’s Management proposed the distribution of additional dividends of R$100.8 million,
representing R$0.0570773 per share, to be submitted for approval by the 2015 Annual
Shareholders’ Meeting, scheduled for April 2015. As a result, the payout will be 103% in
2014.
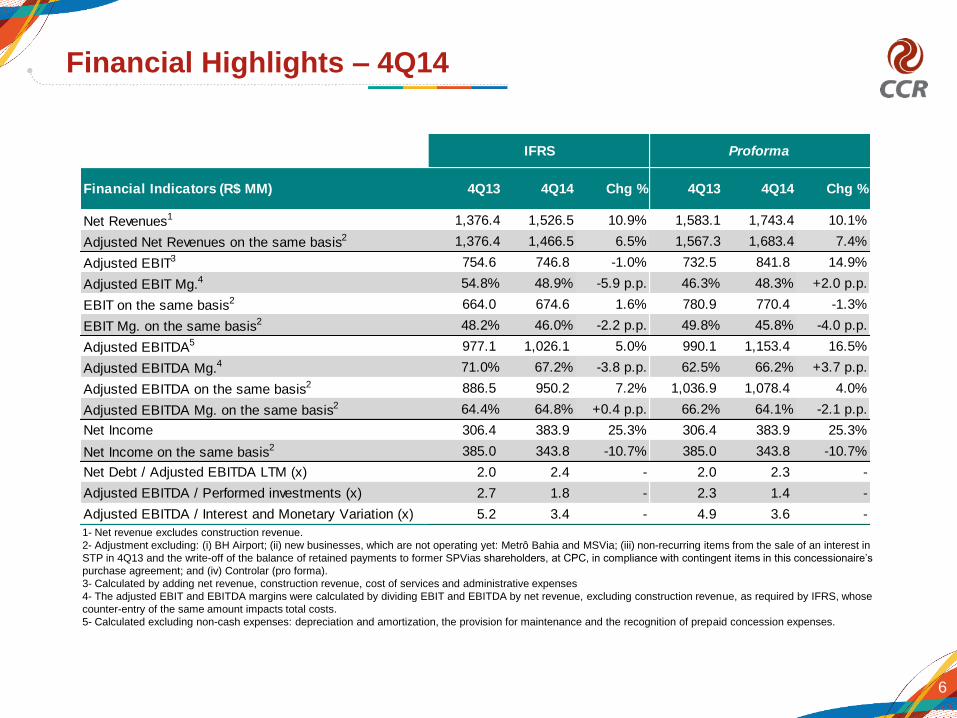
1- Net revenue excludes construction revenue.
2- Adjustment excluding: (i) BH Airport; (ii) new businesses, which are not operating yet: Metrô Bahia and MSVia; (iii) non-recurring items from the sale of an interest in
STP in 4Q13 and the write-off of the balance of retained payments to former SPVias shareholders, at CPC, in compliance with contingent items in this concessionaire’s
purchase agreement; and (iv) Controlar (pro forma).
3- Calculated by adding net revenue, construction revenue, cost of services and administrative expenses
4- The adjusted EBIT and EBITDA margins were calculated by dividing EBIT and EBITDA by net revenue, excluding construction revenue, as required by IFRS, whose
counter-entry of the same amount impacts total costs.
5- Calculated excluding non-cash expenses: depreciation and amortization, the provision for maintenance and the recognition of prepaid concession expenses.
6
Financial Highlights – 4Q14
Net Revenues1 1,376.4 1,526.5 10.9% 1,583.1 1,743.4 10.1%
Adjusted Net Revenues on the same basis2 1,376.4 1,466.5 6.5% 1,567.3 1,683.4 7.4%
Adjusted EBIT3 754.6 746.8 -1.0% 732.5 841.8 14.9%
Adjusted EBIT Mg.4 54.8% 48.9% -5.9 p.p. 46.3% 48.3% +2.0 p.p.
EBIT on the same basis2 664.0 674.6 1.6% 780.9 770.4 -1.3%
EBIT Mg. on the same basis2 48.2% 46.0% -2.2 p.p. 49.8% 45.8% -4.0 p.p.
Adjusted EBITDA5 977.1 1,026.1 5.0% 990.1 1,153.4 16.5%
Adjusted EBITDA Mg.4 71.0% 67.2% -3.8 p.p. 62.5% 66.2% +3.7 p.p.
Adjusted EBITDA on the same basis2 886.5 950.2 7.2% 1,036.9 1,078.4 4.0%
Adjusted EBITDA Mg. on the same basis2 64.4% 64.8% +0.4 p.p. 66.2% 64.1% -2.1 p.p.
Net Income 306.4 383.9 25.3% 306.4 383.9 25.3%
Net Income on the same basis2 385.0 343.8 -10.7% 385.0 343.8 -10.7%
Net Debt / Adjusted EBITDA LTM (x) 2.0 2.4 - 2.0 2.3 -
Adjusted EBITDA / Performed investments (x) 2.7 1.8 - 2.3 1.4 -
Adjusted EBITDA / Interest and Monetary Variation (x) 5.2 3.4 - 4.9 3.6 -
IFRS Proforma
Financial Indicators (R$ MM) 4Q13 4Q14 Chg % 4Q13 4Q14 Chg %
7
Traffic – Quarter Change (Proforma*)
Consolidated – Equivalent Vehicle
Revenue and traffic 4Q14 X 4Q13 (%)
* Information including Renovias which is contemplated in the proforma method.
4Q09 4Q10 4Q11 4Q12 4Q13 4Q14
186,186
237,103 247,459 255,153
276,784 274,866
AutoBAn NovaDutra RodoNorte Ponte ViaLagos ViaOeste Renovias RodoAnel SPVias
-0.9 -2.2 -2.8
0.7
5.8
-0.1
1.5
-0.2
0.4 5.0 6.3
2.8 6.8
15.6
6.3 6.8 6.5 7.9
Traffic Toll Revenues

4Q11 4Q12 4Q13 4Q14
65% 67% 69% 69%
35% 33% 31% 31%
Electronic Cash
AutoBAn26.9%
NovaDutra16.5%
ViaOeste12.9%
RodoNorte8.5%
SPVias7.9%Airports
7.4%
STP3.8%
ViaQuatro3.0%
RodoAnel3.0%
Ponte2.3%
Renovias2.2%
Barcas2.1%
ViaLagos1.5%
Others2.0%
8
Revenue Analysis (Proforma*)
Payment Means
Gross Operating Revenues Gross Revenue Breakdown
* Including the proportional results of jointly-owned subsidiaries.
4Q11 4Q12 4Q13 4Q14
92% 87% 85% 80%
8% 13% 15% 20%
Toll Others
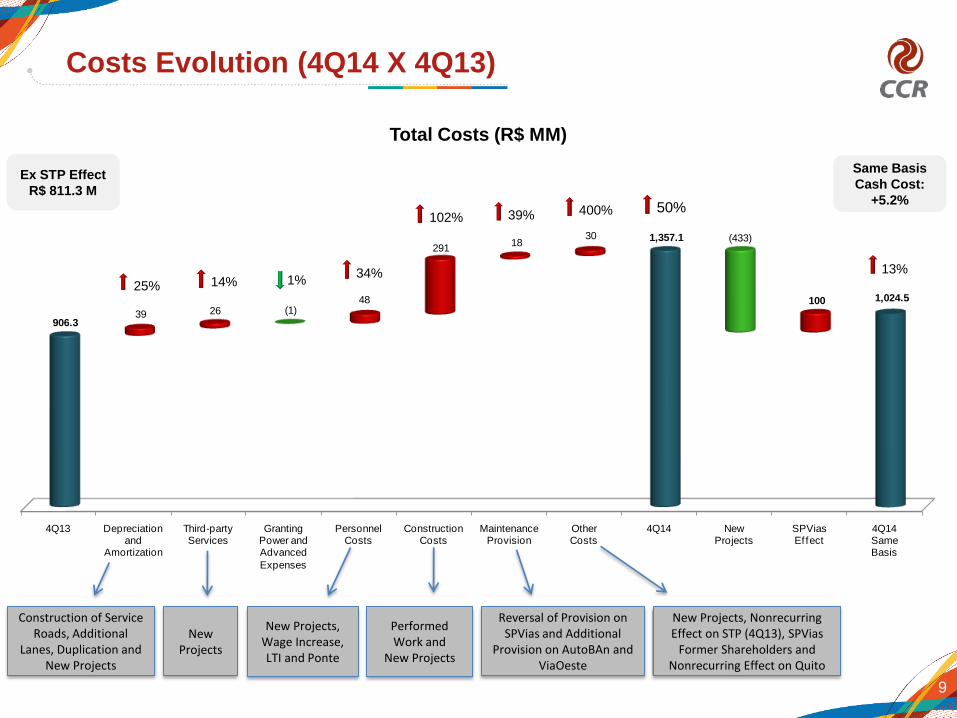
4Q13 Depreciationand
Amortization
Third-partyServices
GrantingPower andAdvanced
Expenses
PersonnelCosts
ConstructionCosts
MaintenanceProvision
OtherCosts
4Q14 NewProjects
SPViasEffect
4Q14SameBasis
906.3
1,357.1
1,024.5
39 26 (1)48
29118
30 (433)
100
9
Costs Evolution (4Q14 X 4Q13)
14%
Total Costs (R$ MM)
Construction of ServiceRoads, Additional
Lanes, Duplication andNew Projects
34%
102%50%
25%
NewProjects
New Projects, Wage Increase, LTI and Ponte
PerformedWork and
New Projects
Same Basis
Cash Cost:
+5.2%
13%
39%
Reversal of Provision onSPVias and Additional
Provision on AutoBAn andViaOeste
1%
400%
New Projects, NonrecurringEffect on STP (4Q13), SPVias
Former Shareholders andNonrecurring Effect on Quito
Ex STP Effect
R$ 811.3 M

4Q13Proforma
EBITDA
4Q14Proforma
EBITDA
NewProjects
SPViasEffect
4Q14Proforma
EBITDASameBasis
990.1
1,153.4 1001,078.4
25
10
Proforma EBITDA
62,5%
of Mg.
66,2%
of Mg.64,1%
of Mg.
Even with five new business in ramp up or implementation ...
... the company reinforces the discipline in costs, prevailing its operational efficiency.
* Adjustment excluding: (i) BH Airport; (ii) new businesses, which are not operating yet: Metrô Bahia and MSVia; (iii) non-recurring items from the sale of an interest
in STP in 4Q13 and the write-off of the balance of retained payments to former SPVias shareholders, at CPC, in compliance with contingent items in this
concessionaire’s purchase agreement at 4Q14; and (iv) Controlar (pro forma).
*
R$ MM
11
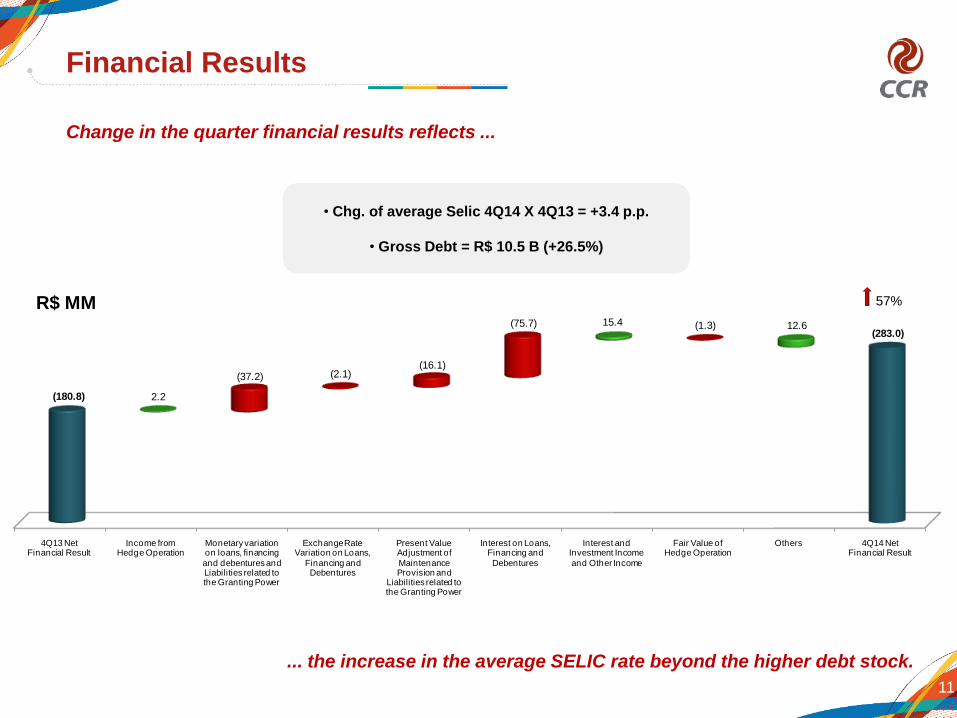
Financial Results
Change in the quarter financial results reflects ...
... the increase in the average SELIC rate beyond the higher debt stock.
57%
• Chg. of average Selic 4Q14 X 4Q13 = +3.4 p.p.
• Gross Debt = R$ 10.5 B (+26.5%)
R$ MM
4Q13 NetFinancial Result
Income fromHedge Operation
Monetary variation on loans, financing
and debentures and Liabilities related to the Granting Power
Exchange Rate Variation on Loans,
Financing and Debentures
Present Value Adjustment of
Maintenance Provision and
Liabilities related to the Granting Power
Interest on Loans, Financing and
Debentures
Interest and Investment Income
and Other Income
Fair Value ofHedge Operation
Others 4Q14 NetFinancial Result
(180.8)
(283.0)
2.2
(37.2) (2.1)(16.1)
(75.7) 15.4 (1.3) 12.6
12
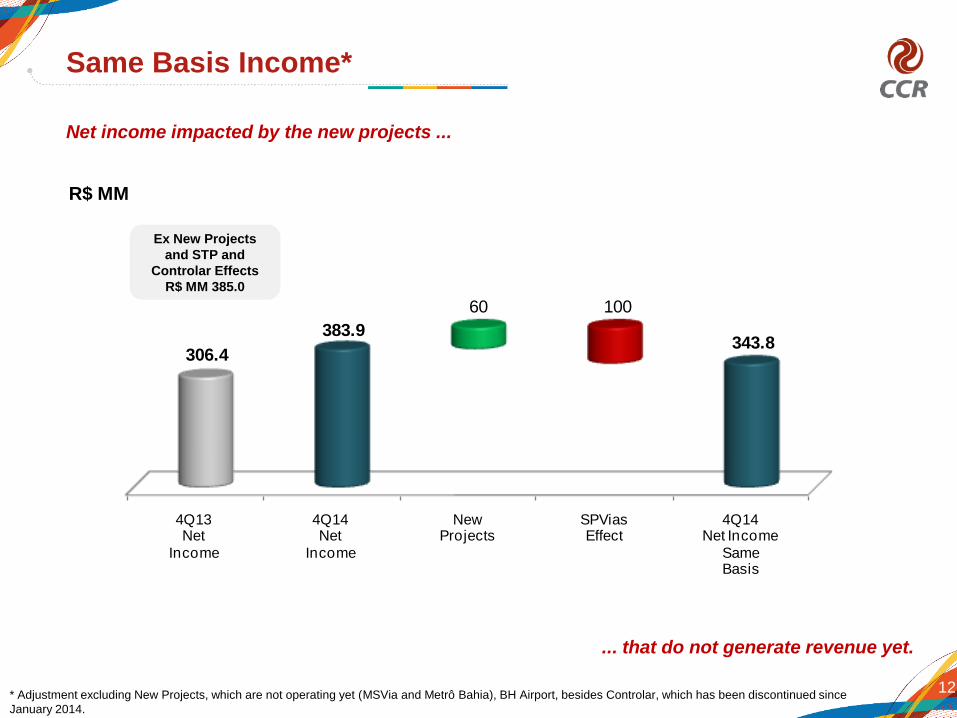
Same Basis Income*
R$ MM
* Adjustment excluding New Projects, which are not operating yet (MSVia and Metrô Bahia), BH Airport, besides Controlar, which has been discontinued since
January 2014.
Net income impacted by the new projects ...
... that do not generate revenue yet.
Ex New Projects
and STP and
Controlar Effects
R$ MM 385.0
4Q13Net
Income
4Q14Net
Income
NewProjects
SPViasEffect
4Q14Net Income
SameBasis
306.4
383.9
60 100
343.8

CDI79.0%
IPCA14.1%
TJLP4.9%
USD2.0%
13
Debt in December 31, 2014
Gross debt by indexer
Amortization Schedule (R$ M)
• Total Gross Debt: R$ 10.5 B
(R$12.3 B proforma)
• Net Debt / EBITDA: 2.4x
2015 2016 2017 2018 From2019
3,133 3,412
1,767
11
178 10
11
CDI USD Others
836529
1,974
3,7723,410
5,8936,330 6,344
7,212 7,018 6,944 6,600
7,609 7,620 7,859 8,081
9,562
7,341
8.824
1.9 2.0 1.92.2 2.1 2.0
1.82.0 1.9 2.0 2.0
2.32.0
2.4
-2,5
-1,5
-0,5
0,5
1,5
2,5
2.000
4.000
6.000
8.000
10.000
12.000
14.000
1Q12 2Q12 3Q12 4Q12 1Q13 2Q13 3Q13 4Q13 1Q14 2Q14 3Q14 4Q14 3Q14 4Q14
Net Debt (R$ MM) Net Debt/EBITDA (x)
14
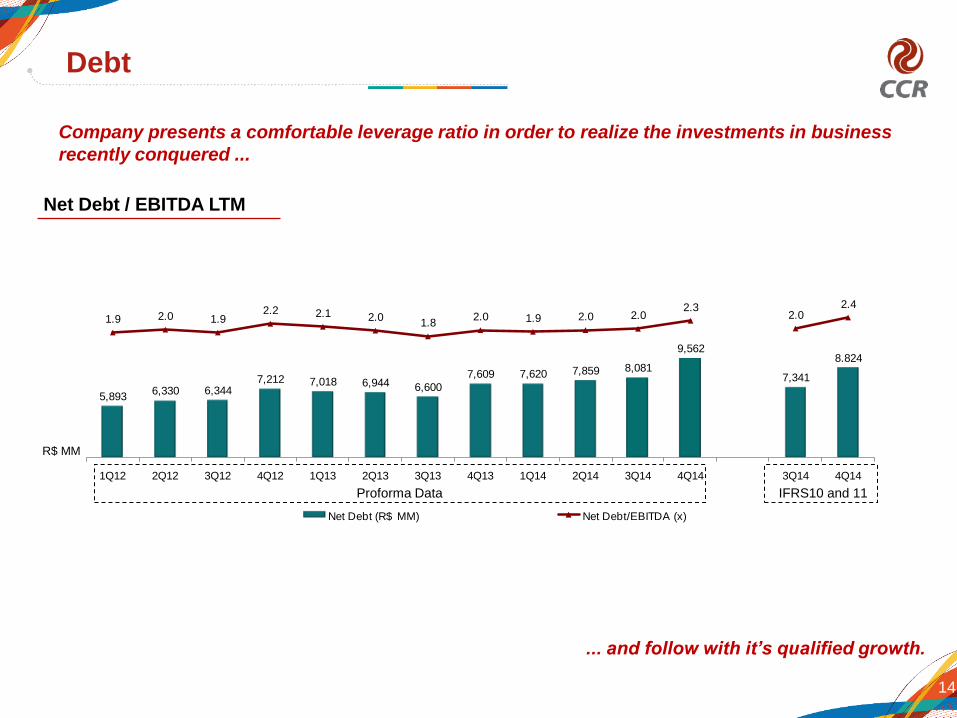
Debt
Company presents a comfortable leverage ratio in order to realize the investments in business
recently conquered ...
... and follow with it’s qualified growth.
Net Debt / EBITDA LTM
IFRS10 and 11Proforma Data
R$ MM

15
Realized Investments and Maintenance
4Q14 2014 4Q14 2014 4Q14 2014 4Q14 2014
AutoBAn 25.2 201.7 7.4 20.2 32.6 222.0 2.3 3.2 0.0 0.0
NovaDutra 63.1 212.9 6.7 16.9 69.7 229.8 6.3 55.3 0.0 0.0
ViaOeste 21.0 67.2 4.9 15.4 25.9 82.6 2.7 26.2 0.0 0.0
RodoNorte (100%) 24.0 93.8 3.6 7.6 27.6 101.4 19.2 59.8 0.0 0.0
Ponte 0.0 0.0 0.2 0.5 0.2 0.5 0.5 2.8 0.0 0.0
ViaLagos 28.8 100.6 0.5 1.5 29.3 102.0 0.5 3.4 0.0 0.0
SPVias 32.5 201.5 3.7 11.1 36.3 212.7 25.9 71.8 0.0 0.0
ViaQuatro (58%) 10.2 59.0 1.8 4.2 12.0 63.2 0.0 0.0 -7.8 21.8
Renovias (40%) 0.5 2.2 1.3 3.1 1.8 5.3 0.1 3.1 0.0 0.0
RodoAnel (100%) 7.6 19.3 3.3 5.7 10.9 25.0 0.0 0.0 0.0 0.0
Controlar (49,01%) 0.0 1.1 0.3 0.3 0.3 1.4 0.0 0.0 0.0 0.0
SAMM 15.9 20.5 7.8 29.7 23.8 50.2 0.0 0.0 0.0 0.0
ViaRio (33.33%) 93.2 155.1 0.0 0.2 93.2 155.3 0.0 0.0 0.0 0.0
Quito 12.5 30.1 5.1 6.5 17.6 36.6 0.0 0.0 0.0 0.0
San José 10.6 18.6 0.2 0.3 10.8 18.9 0.0 0.0 0.0 0.0
Curaçao 5.0 16.9 0.0 0.0 5.0 16.9 0.0 0.0 0.0 0.0
Barcas 4.3 11.6 0.9 9.4 5.2 21.0 0.0 0.0 0.0 0.0
VLT (24.88%)2 48.0 48.3 0.0 0.5 48.0 48.8 0.0 0.0 2.3 95.4
Metrô Bahia 172.4 423.8 2.6 14.1 175.0 437.9 0.0 0.0 85.6 338.3
BH Airport 6.9 6.9 1.6 4.0 8.5 11.0 0.0 0.0 0.0 0.0
MSVia 105.6 164.4 19.5 53.9 125.1 218.3 0.0 0.0 0.0 0.0
STP (34.24%) 6.2 13.3 25.9 65.7 32.1 78.9 0.0 0.0 0.0 0.0
Other3 -2.1 -1.5 9.1 29.2 7.0 27.7 0.0 0.0 0.0 0.0
Consolidated 691.4 1,867.5 106.5 300.0 797.9 2,167.5 57.6 225.5 80.1 455.5
1 - Includes CCR andCPC
2 - The amounts consider reclassif ication in the quarter and accumulated for the f inancial asset
3 - Includes CCR, MTH, CPC, SPCP and Eliminations
Proforma Financial
Asset1
4Q14 2014R$ MM
Performed InvestmentsPerformed
maintenance
Improvements Equipments and Others Total Maintenance Cost

16
2015 Estimated Investments
1- Values are not deducted from contributions from granting authorities.
2- Includes CCR, CPC, SPCP and Eliminations.
Estimated
Maintenance
Metrô Bahia1 1,340.2 478.1 1,818.2 0.0
MSVia 573.2 127.7 700.8 0.0
BH Airport (100%) 437.5 39.8 477.3 0.0
ViaRio (33.33%)1 99.8 363.9 463.7 0.0
VLT (24.88%)1 205.4 0.0 205.4 0.0
NovaDutra 158.4 26.3 184.7 59.0
AutoBAn 158.4 25.3 183.6 29.8
RodoNorte (100%) 147.2 9.5 156.7 11.8
ViaQuatro (58%) 96.2 6.5 102.6 0.0
ViaOeste 83.7 18.9 102.6 3.5
SPVias 58.6 11.9 70.5 48.4
ViaLagos 45.6 6.1 51.7 4.0
STP (34.24%) 0.0 49.2 49.2 0.0
RodoAnel Oeste (100%) 41.1 4.6 45.7 0.2
SAMM 18.1 26.8 44.9 0.0
Aeroporto de Quito (45.49%) 16.4 20.4 36.8 0.0
Aeroporto de San José (48.75%) 33.6 1.5 35.1 0.0
Aeroporto de Curaçao (100%) 28.0 0.0 28.0 0.0
Barcas (100%) 20.5 3.5 23.9 0.0
Renovias (40%) 3.4 2.2 5.7 9.9
Ponte 0.4 1.7 2.1 0.7
Others2 (6.8) 26.1 19.3 0.0
Total 3,558.9 1,249.7 4,808.6 167.2
Maintenance
Costs
Estimated Investments
2015 (E) - R$ MM ImprovementsEquipments
and OthersTotal
2,2%
4.2%
4.8%
3.8% 3.9%
5.0%4.6% 4.7%
3.9%3.7%
3.9%
4.6%16%
58% 61% 65%
92%85% 85%
127%
90% 90%96%
103%
-70%
-20%
30%
80%
130%
2,0%
3,0%
4,0%
5,0%
6,0%
7,0%
1 2 3 4 5 6 7 8 9 10 11 12
Div. Yield Payout
2003 2004 2005 2006 2007 2008 2009 2010 2011 2012 2013 2014
183263
500547
580
714 709 672
899
1,177
1,351 1,361
Net Income
2,2%
4,2%
4,8%
3,8% 3,9%
5,0%4,6% 4,7%
3,9%3,7%
16%
58% 61% 65%
92%85% 85%
127%
90% 90%
-70%
-20%
30%
80%
130%
2,0%
3,0%
4,0%
5,0%
6,0%
7,0%
1 2 3 4 5 6 7 8 9 10
Div. Yield Payout
17
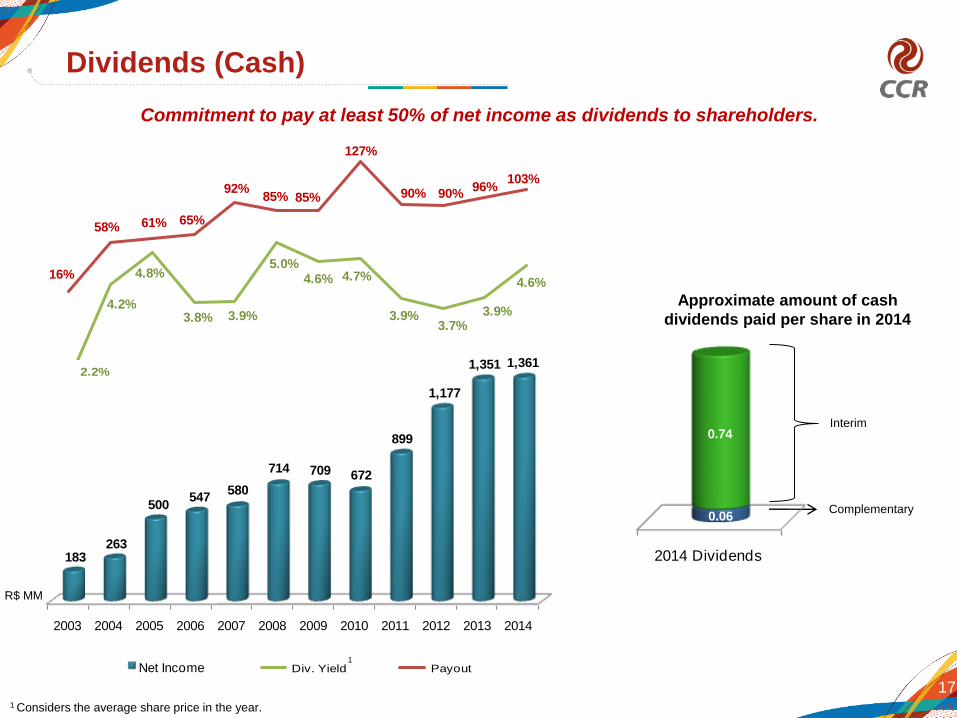
Dividends (Cash)
2%
4%
5%
4% 4%
5%5% 5%
4%
16%
58% 61% 65%
92%85% 85%
127%
90%
-70%
-20%
30%
80%
130%
2%
3%
4%
5%
6%
7%
1 2 3 4 5 6 7 8 9
Div. Yield Payout
Commitment to pay at least 50% of net income as dividends to shareholders.
1
Interim
Complementary
Approximate amount of cash
dividends paid per share in 2014
R$ MM
1 Considers the average share price in the year.
2014 Dividends
0.06
0.74